REPORT
Funded by U.S. DOE CBEI REPORT
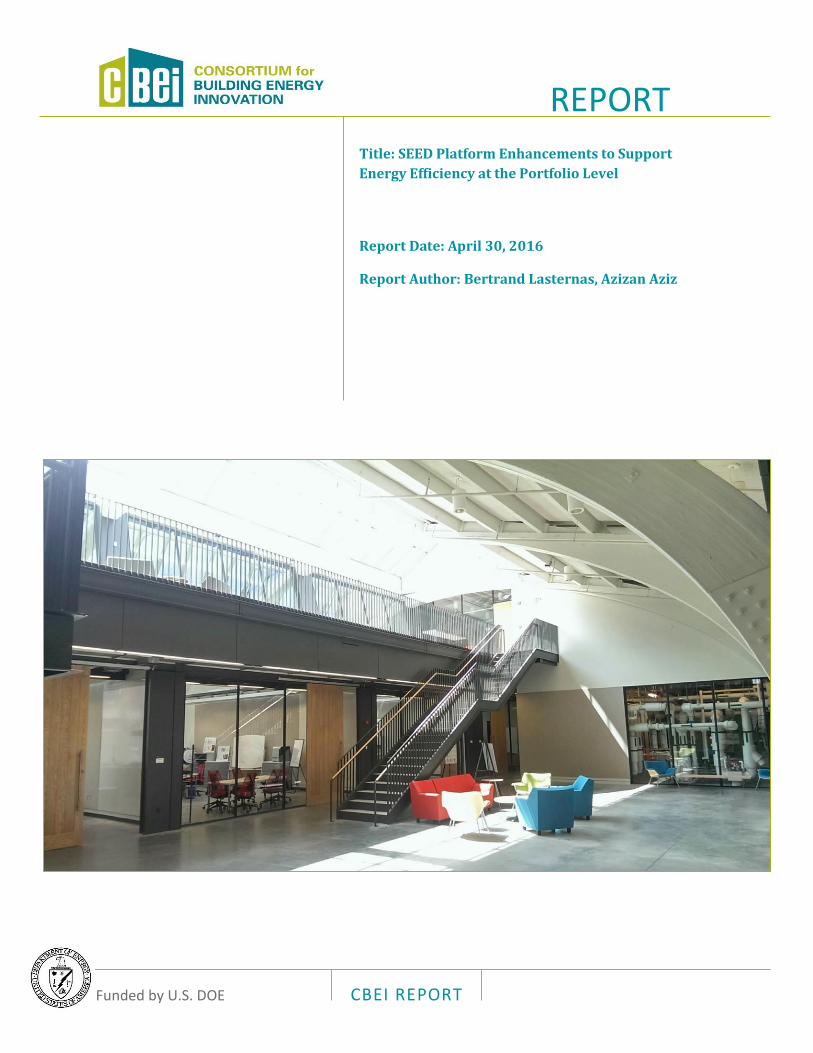
Title: SEED Platform Enhancements to Support Energy Efficiency at the Portfolio Level
Report Date: April 30, 2016
Report Author: Bertrand Lasternas, Azizan Aziz
REPORT
Funded by U.S. DOE CBEI REPORT 1 | P a g e
Report Abstract This report describes a building portfolio-level data analytics platform for operational optimization,
business investment and policy assessment using 15-minute to monthly intervals utility data. The utility
data analytics is developed on top of the U.S Department of Energy’s (DOE) Standard Energy Efficiency
Data (SEED) platform, an open source software application that manages energy performance data of
large groups of buildings. To support the significantly increased number of granular interval data, we
integrated a parallel time-series database to the existing relational database. The implementation of
the time-series database improves on the current utility data input, focusing on real-time data
collection, storage, analytics and data quality control. The fully integrated data platform supports APIs
for utility apps development by third party software developers.
This illustrates the enhanced SEED platform systems architecture and provide examples of the apps
developed using monthly utility data and 15-minute Green Button interval data.
Contact Information for lead researcher Name: Bertrand Lasternas
Institution: Carnegie Mellon University
Email address: [email protected]
Phone number: 4129250094
Contributors Azizan Aziz, Co-PI, Carnegie Mellon University
Haopeng Wang, Carnegie Mellon University
Chenlu Zhang, Carnegie Mellon University
Shilpi Sharma, Carnegie Mellon University
Amit Nambiar, Carnegie Mellon University
Leah Mo, Carnegie Mellon University
Funded by U.S. DOE CBEI REPORT 2 | P a g e
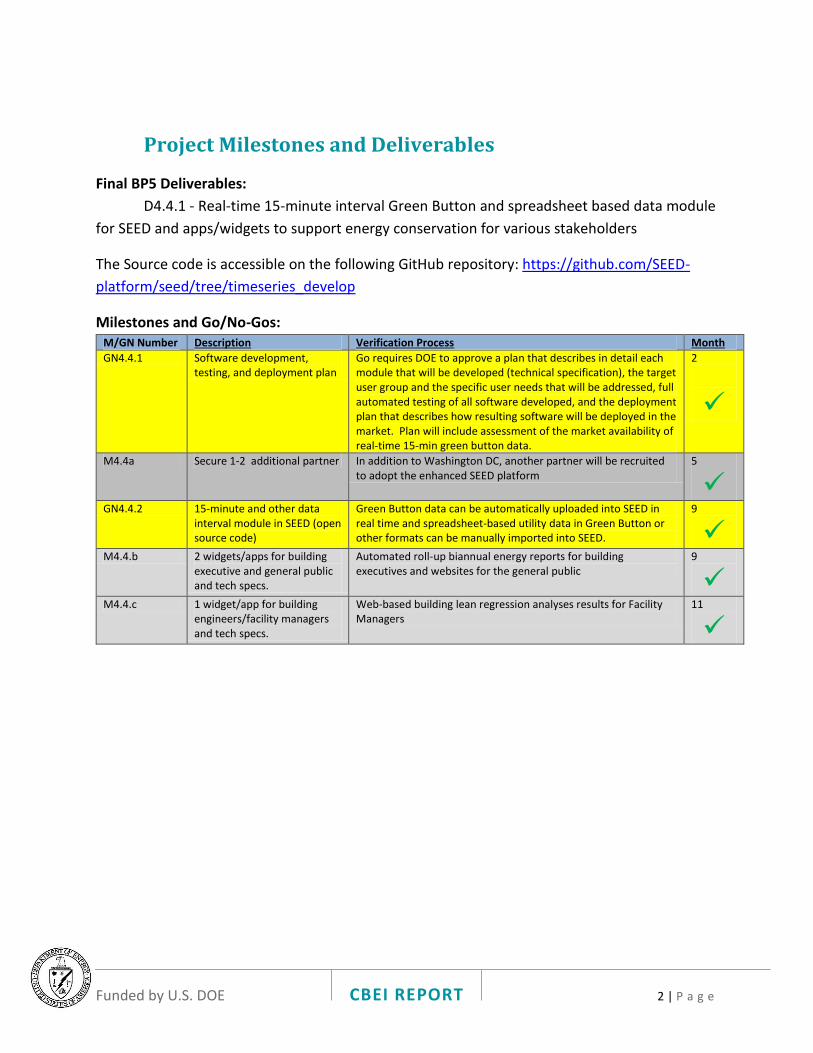
Project Milestones and Deliverables
Final BP5 Deliverables:
D4.4.1 - Real-time 15-minute interval Green Button and spreadsheet based data module
for SEED and apps/widgets to support energy conservation for various stakeholders
The Source code is accessible on the following GitHub repository: https://github.com/SEED-
platform/seed/tree/timeseries_develop
Milestones and Go/No-Gos: M/GN Number Description Verification Process Month
GN4.4.1 Software development, testing, and deployment plan
Go requires DOE to approve a plan that describes in detail each module that will be developed (technical specification), the target user group and the specific user needs that will be addressed, full automated testing of all software developed, and the deployment plan that describes how resulting software will be deployed in the market. Plan will include assessment of the market availability of real-time 15-min green button data.
2
M4.4a Secure 1-2 additional partner In addition to Washington DC, another partner will be recruited to adopt the enhanced SEED platform
5
GN4.4.2 15-minute and other data interval module in SEED (open source code)
Green Button data can be automatically uploaded into SEED in real time and spreadsheet-based utility data in Green Button or other formats can be manually imported into SEED.
9
M4.4.b 2 widgets/apps for building executive and general public and tech specs.
Automated roll-up biannual energy reports for building executives and websites for the general public
9
M4.4.c 1 widget/app for building engineers/facility managers and tech specs.
Web-based building lean regression analyses results for Facility Managers
11

Funded by U.S. DOE CBEI REPORT 3 | P a g e
1. Introduction
The American Recovery and Reinvestment Act (ARRA) stimulus funding of 2009 for smart grid projects
resulted in more than 60 million smart meters being deployed in the U.S. In 2012, the White House
introduced the Green Button initiative to give utility customers secure access to their real-time energy
usage and consumption. The availability of granulated energy consumption data provides an enormous
potential for energy data analytics. However, the sheer volume of time-series utility data from a large
number of buildings poses challenges in data collection, storage quality control, and database
management. The management of large datasets from various sources is time consuming, potentially
costly and often challenging for rigorous and meaningful analyses for energy conservation and improved
building occupant comfort.
The U.S. Department of Energy developed the Standard Energy Efficiency Data (SEED) Platform, an open
source software application to support “data-driven energy efficiency program design and
implementation.” The software application provides a “flexible and cost-effective method to improve
the quality and availability of data to help demonstrate the economic and environmental benefits of
energy efficiency, track program activities and target investments.” The SEED platform is part of a suite
of projects that the U.S Federal Government is developing to help “standardize, systematize and link
data so that building owners, contractors, researchers, financiers, and other experts can aggregate and
share information about building energy performance.” These public tools, and a growing number of
private tools, utilize a common set of data definitions, called the Building Energy Data Exchange
Specification (BEDES).
2. Data Collection and Storage
2.1 Existing SEED Platform
The main features within the current platform include data upload from tax assessor data and Energy
Star Portfolio Manager (PM) data. Users import tax assessor data into the platform, map the terms into
BEDES format and define relationships between buildings and tax lots. If the upload contains new utility
data, SEED automatically updates the records without having to repeat the manual matching process. To
reconcile different data sources (e.g tax assessor and PM), SEED simplifies and automates the data
matching process by displaying likely matches to the user. With user approvals, SEED stores this
information for future data matching. SEED also supports the manual upload of XML, .csv and .xls utility
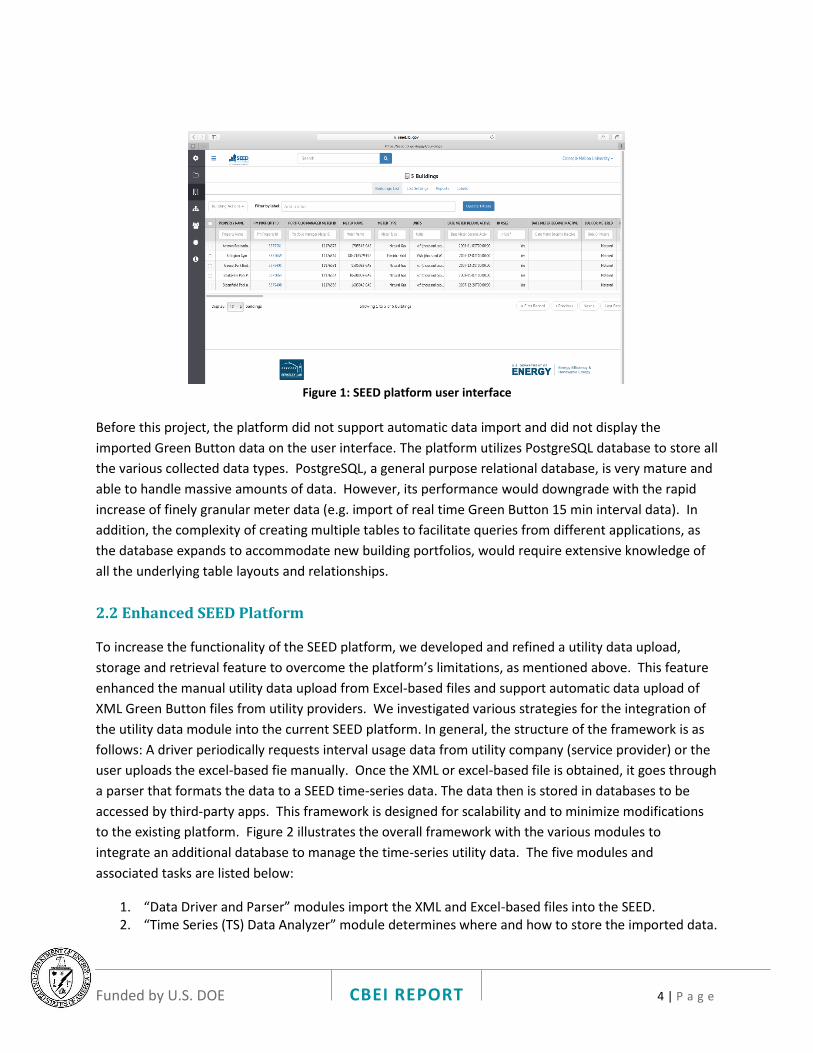
data files. Figure 1 below illustrates the SEED user interface.
Funded by U.S. DOE CBEI REPORT 4 | P a g e
Figure 1: SEED platform user interface
Before this project, the platform did not support automatic data import and did not display the
imported Green Button data on the user interface. The platform utilizes PostgreSQL database to store all
the various collected data types. PostgreSQL, a general purpose relational database, is very mature and
able to handle massive amounts of data. However, its performance would downgrade with the rapid
increase of finely granular meter data (e.g. import of real time Green Button 15 min interval data). In
addition, the complexity of creating multiple tables to facilitate queries from different applications, as
the database expands to accommodate new building portfolios, would require extensive knowledge of
all the underlying table layouts and relationships.
2.2 Enhanced SEED Platform
To increase the functionality of the SEED platform, we developed and refined a utility data upload,
storage and retrieval feature to overcome the platform’s limitations, as mentioned above. This feature
enhanced the manual utility data upload from Excel-based files and support automatic data upload of
XML Green Button files from utility providers. We investigated various strategies for the integration of
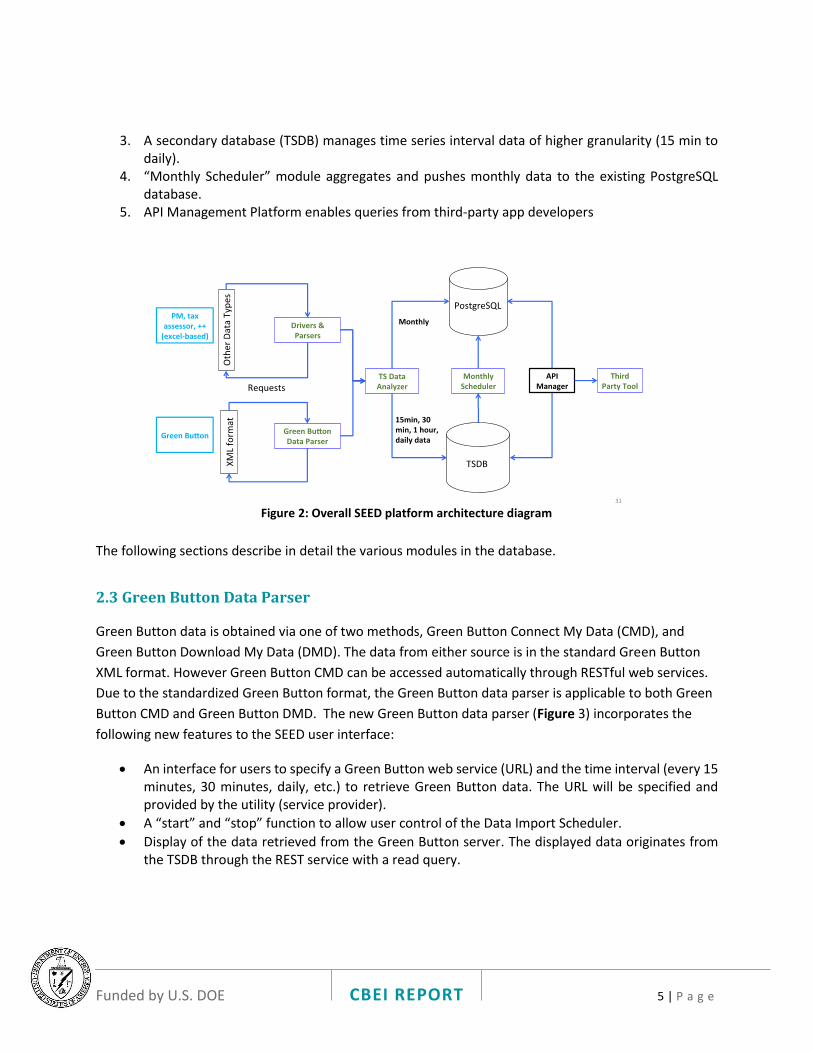
the utility data module into the current SEED platform. In general, the structure of the framework is as
follows: A driver periodically requests interval usage data from utility company (service provider) or the
user uploads the excel-based fie manually. Once the XML or excel-based file is obtained, it goes through
a parser that formats the data to a SEED time-series data. The data then is stored in databases to be
accessed by third-party apps. This framework is designed for scalability and to minimize modifications
to the existing platform. Figure 2 illustrates the overall framework with the various modules to
integrate an additional database to manage the time-series utility data. The five modules and
associated tasks are listed below:
1. “Data Driver and Parser” modules import the XML and Excel-based files into the SEED. 2. “Time Series (TS) Data Analyzer” module determines where and how to store the imported data.
Funded by U.S. DOE CBEI REPORT 5 | P a g e
3. A secondary database (TSDB) manages time series interval data of higher granularity (15 min to daily).
4. “Monthly Scheduler” module aggregates and pushes monthly data to the existing PostgreSQL database.
5. API Management Platform enables queries from third-party app developers
Figure 2: Overall SEED platform architecture diagram
The following sections describe in detail the various modules in the database.
2.3 Green Button Data Parser
Green Button data is obtained via one of two methods, Green Button Connect My Data (CMD), and
Green Button Download My Data (DMD). The data from either source is in the standard Green Button
XML format. However Green Button CMD can be accessed automatically through RESTful web services.
Due to the standardized Green Button format, the Green Button data parser is applicable to both Green
Button CMD and Green Button DMD. The new Green Button data parser (Figure 3) incorporates the
following new features to the SEED user interface:
An interface for users to specify a Green Button web service (URL) and the time interval (every 15 minutes, 30 minutes, daily, etc.) to retrieve Green Button data. The URL will be specified and provided by the utility (service provider).
A “start” and “stop” function to allow user control of the Data Import Scheduler.
Display of the data retrieved from the Green Button server. The displayed data originates from the TSDB through the REST service with a read query.

Funded by U.S. DOE CBEI REPORT 6 | P a g e
Figure 3: Green Button data parser diagram
2.4 Time Series (TS) Data Analyzer
The TS Data Analyzer detects the data time interval and utility type (electricity, gas, water, etc.),
provides the meter_ID and other pertinent information (unit, utility type, etc.) from the PostgreSQL
database, and inserts the utility data into the a time-series database TSDB or PostgreSQL based on their
time interval. The TS Data Analyzer module directly push utility data from buildings with monthly
interval into the existing PostgreSQL. For other time intervals (15min, 30min, hourly and daily), the TS
Data Analyzer directs the data to the TSDB (Figure 4).
Figure 4: Schema for the TS Data Analyzer
2.5 Monthly Scheduler
The Monthly Scheduler module retrieves and aggregates data from the TSDB and saves the monthly
aggregated data into the existing PostgreSQL. The Scheduler runs on the first day of every month,
GreenBu onServer
TSDB
DataimportModule
Request
{Timestamp,reading,tags={energy_type,canonical_id,Custom_meter_id,interva}
RESTservicewithinsertandreadquery
RespondXML
Request
TSDataAnalyzer
GreenBu onDataParser“Energy”pagewhereusersinputURLparameters
BackfillingRealTimeScheduler
SEED.TimeSeries-idbegin_ me-end_ me-reading-meter
PostgreSQL
TSDB
TSDataAnalyzer
15min,30min,Hourly,Daily
{ mestamp,reading,tags={energy_type,canonical_id,custom_meter_id,interval}
RESTfulservicewithinsertquery
TimeSeriesDataAnalyzer
JSONinputfilefromParsers
SEED.TimeSeries-id-begin_ me-end_ me-reading-meter
Monthly
PostgreSQL
ConvertJSONfiletoPythondic onary
type

Funded by U.S. DOE CBEI REPORT 7 | P a g e
queries data from the TSDB through RESTful web services (provided by the TSDB), aggregates the
interval data into one month, and pushes the aggregated data into the time series table in PostgreSQL.
2.6 Time Series Database
Due to the limitations of the PostgreSQL relational database described earlier, we implemented the use
of a secondary time-series database. The TSDB is a specialized database optimized for time-series data
storage and processing. The native support is highly optimized for time range query and aggregation
calculation. The TSDB is the centerpiece of the whole system, hosting billions of data points per day. For
this reason, performance, scalability, aggregation functions and community support are crucial aspects
when choosing a TSDB. We opted the use of the open source KairosDB TSDB based on the aspects
mentioned above, in addition to supporting RESTful API, which makes it compatible with our system
design. Due to the modularity of the systems design, the platform should also be able to accommodate
other time series databases.
2.7 Application Programming Interface (API)
In addition to a set of APIs for internal use to enable the multiple modules to interact, the enhanced
platform have an API program manager to enable interaction with third-party systems and applications
outside of the SEED platform.

Funded by U.S. DOE CBEI REPORT 8 | P a g e
3. Data Analytics
The following section describes the development and types of user interfaces to support actionable
intelligence towards better investment decisions, policy evaluations and optimum building operations
and maintenance. The user interfaces were developed based on findings from a usability study with
participants from stakeholders of large portfolio owners ranging from city officials (City of Pittsburgh
and Washington DC), private sector building portfolio executives and the facility management
executives from a university campus.
3.1 Building Portfolio Overview (Public facing App)
As a general overview, the graphs in this section describe the total utility cost, usage and greenhouse
gas emissions of the entire portfolio over a period of time (Figure 5). The user can sort the data by utility
type or building type to help identify the highest consumers. Consumption trends may also show the
results of retrofits and operational changes or areas of improvement for future consideration. With this
knowledge, the user can evaluate the effectiveness of their decisions on the overall portfolio
Figure 5: This consumption data graphic provides an overview of the building portfolio utility usage,
cost and yearly consumption profile.
3.3 Heat Map (FMS Facing App)
The “heat map” graphic (Figure 6) utilizes interval data (15min, 30min or hourly) to represent energy
usage intensities, color coded, by the hour (x-axis) for every day (y-axis). This data graphic assists the
users to understand building operation schedule and identify unnecessary usage during unoccupied
hours (weekends and nights). For a building portfolio, users can compare buildings that are operated
well and ones that are not optimized. Users can use this information to lower energy usage by changing

Funded by U.S. DOE CBEI REPORT 9 | P a g e
operation schedules, adding more building controls, and developing strategies to engage building
occupants to reduce energy consumption.
Figure 6: Heat Map data graphic
4. Conclusion
The SEED platform’s new features of importing, storing, and managing data from multiple sources
enables large building portfolio owners to conduct comparative analyses of their portfolios against other
portfolio owners, facilitating sharing and collaboration in addition to enabling executive and operational
level analyses for actionable intelligence. The enhanced platform can easily support energy
benchmarking and disclosure laws initiatives, and can significantly increase public awareness of energy
consumption and resource conservation. The next step of enhancement is to expand this open source
platform the integration of building automation systems (BAS) and indoor/outdoor environmental
quality (IEQ) data. These datasets will be necessary to correlate the impact of energy consumption on
indoor environmental quality and occupant comfort and satisfaction. This expanded platform will also
support the engagement of other building stakeholders such as building occupants and researchers, in
addition to building owners/policy makers, facility managers and the general public towards energy
conservation.
Recommended