İ Z AKYURT
Siyaset Ekonomi ve Youmlnetim Araştırmaları Dergisi2016 Yıl 4 Cilt 4 Sayı 2 69
Reorder Point and Replenishment Point of Dynamic Inventory Model
under Shortages
Yrd Doccedil Dr İbrahim Zeki AKYURT İstanbul Uumlniversitesi İşletme Fakuumlltesi
İşletme Boumlluumlmuuml
zekiakyurtgmailcom
Abstract
In this study single item dynamic inventory control model is analyzed In this model
the decision maker counts the inventory periodically calculates the reorder point
and the replenishment point and decides to replenish the stock according to the
inventory position This calculation is difficult and requires complex mathematical
transactions when the demand and lead time are stochastic For this reason in this
study the simulation method and genetic algorithms method are used to calculate
the reorder point and replenishment point by using total cost function per period In
this function the ordering cost the holding cost and the penalty cost are taken into
account The results of these two methods are compared with classic method based
on real data where the demand distribution is normal and the lead time distribution
is uniform Thereafter three cost calculations and their effects on reorder point and
replenishment point are analyzed at two different levels
Keywords Replenishment Point Reorder Point Inventory Control Simulation
Genetic Algorithms Stochastic Demand
JEL Classification Codes M1 L6 C6
1 Introduction
Inventory management is one of the key process in operation management
A manufacturer company deals with purchasing raw-materials from various
suppliers holding these goods till they are inserted to the line according to
the production plan and at last holding the finished goods for a certain period
of time When the manufacturerrsquos functions in the chain is considered the
importance of the inventory management should be taken in to account
From the manufacturerrsquos point of view inventory can be considered as a
raw-material for production a partially finished item on the line a finished
good to be delivered and even a tool or a spare part for machines for
maintenance (William 2009) The key variable in the problem is the
outcome of the various directions of demand and supply for each product As
a result of different names given and different characteristics in each step it
is a must for the decision maker to consider the inventory control separately
in each of the production steps and develop policies The decision maker
focuses on to keep the minimum inventory on hand during the developing
phase of these policies while dealing with any different inventory type
Consequently keeping the minimum inventory on hand is the primary goal
Beside this it is aimed to keep the inventory purchase and holding costs as
Reorder Point and Replenishment Point of Dynamic Inventory Model Under hellip
70 Research Journal of Politics Economics and Management 2016 Year4 Volume4 Issue2
low as possible It is not enough to realize just these two condition to design
a good inventory policy The number of items produced or purchased at the
beginning of each period should meet the demand of that period Briefly a
good inventory management policy should focus on reducing the inventory
related costs while redounding the customer service level Also low unit
costs and high inventory turnover rates are sub-targets
There are some factors effecting on the decision makers judge These factors
can be collected under four basic groups These are demand replenishment
lead time and cost factors Many inventory control models had been
developed on the basis of the fundamental goals of inventory management
using these factors When diversification is made with a demand oriented
view deterministic and stochastic inventory control models had been came
out according to structure of the demand While the policies are determined
a mathematical model is structured according to the factors mentioned By
adopting all the costs to the model an inventory control model with the
minimum cost is achieved The outcome of this model is the answers of
ldquowhen to replenishrdquo and ldquohow many to purchaseproducerdquo In order to
determine these cost values various mathematical methods can be used
The (sS) inventory model put forward by Arrov et al (1951) is used by
many firms and found a wide application area However in cases where
inventory records cannot be reviewed continuously the model transforms to
periodic review (RsS) inventory model In the literature both models are
called optional replenishment policy or model (Rabta amp Aissani 2005 Yin
Liu amp Johnson 2002 Buchan amp Koenigsberg 1966 Nielsen amp Larsen
2005) The optional replenishment model used in this study is based on
periodic review These models are preferred by many companies as
inventory policy in order to avoid from high levels of inventory in low
demand periods and from stock-out in high demand periods This model
reacts very quickly to demand changes However the success of the model
stems from the quality of data analysis and of determination of reorder point
(s) and replenishment point (S) The most problematic part of this model is
the difficulty to compute s and S parameters There are a lot of methods
which enables the computation of these two parameters But these methods
are complex and difficult to solve (Silver Pyke amp Peterson 1998 336)
The basis of (R s S) model depends on Arrow (1951) and Karlin et al
(1958) But the optimization issue for finite periods is studied by Scarf
(1960) under specific assumptions Scrafrsquos model is studied by Iglehart
(1963) for infinite periods under fixed demand and cost structure Veniott
(1966) and Porteus (1971) had researches on this field Federguen and Zheng
determined the calculation of the parameters with average cost per period for
infinite periods in case of discrete demand distribution for each period
Beside this there are some other heuristic methods Robert (1962) Sivazlian
İ Z AKYURT
Siyaset Ekonomi ve Youmlnetim Araştırmaları Dergisi2016 Yıl 4 Cilt 4 Sayı 2 71
(1971) Nador (1975) Wagner (1975) and Schneider (1978) studied on the
reorder point in certain service levels Ehrhardt (1979-1984) Freeland and
Porteus (1980) Tijims amp Groenevelt (1984) Zheng amp Federgruen (1991)
developed an algorithm to find these parameters under discrete demand
distribution Bollapragad amp Morton (1999) Larson et al (2001) analyzed
such a policy with stochastic demand
Sezen amp Erdoğmuş (2005) determined the inventory policy with the help of
simulation method Koumlchel amp Nielander (2005) offered a simulation based
optimization method for multi echelon inventory systems Yeamp You (2016)
developed a simulation based optimization method for reducing the cost with
a constant service level Escuiacuten amp Cipreacutes (2016) deal with a multi-product
dynamic lot-sizing problem under stochastic demand and compare make o
order strategy and vendor managed strategy by simulation DeYong amp
Cattani (2015) analyzed the deterministic and stochastic problems as
dynamic programs by simulation The other simulation method is used in
inventory management can be seen in the literatuumlre (Whiteamp Censlive 2015
do Rego amp de Mesquita 2015 Agrawal amp Sharda 2012 Kouki amp Jouini
2015 Duan amp Liao 2013 Thiel et al 2010)
Zhou et al (2013) solved a multi-echelon inventory control problem by
genetic algorithms Maiti amp Maiti (2006) deal with a multi-item inventory
model with two-storage facilities by a fuzzy simulation-based singlemulti-
objective genetic algorithms The other genetic algorithms methods used in
inventory management problem can be found (Diabat amp Deskoores 2015
Garciacutea et al 2015 Nia et al 2014 Rezaei amp Davoodi 2011 Hwang et al
2005)
Taleizadeh et al (2013) assumed that the time between two replenishments
is an independent random variable They demonstrated that the model of this
problem is a kind of integer-nonlinear-programming A hybrid method of
fuzzy simulation (FS) and genetic algorithm (GA) were proposed to solve
this problem Genetic algorithms and simulation methods is widely used in
inventory management (Lin et al 2010 Jana et al 2014)
In this study real data is taken from a manufacturing company which uses
refined steel as raw material Demand values and lead time are random
variables Where the demand distribution is normal the lead time is uniform
Additionally holding cost penalty cost (stock-out cost) and ordering cost
are used Reorder point and replenishment point are determined using
simulation method and genetic algorithms method and the cost results of
these methods are compared The effect of cost variation on the inventory
model is analyzed by genetic algorithms method Two levels of analysis are
developed for these three cost calculations and an experimental design is
Reorder Point and Replenishment Point of Dynamic Inventory Model Under hellip
72 Research Journal of Politics Economics and Management 2016 Year4 Volume4 Issue2
formulated accordingly The new reorder and replenishment points are
compared
2 Dynamic Inventory Model
In single item inventory systems from the economical aspect of
replenishment order and stock out case this method can be managed to be
favorable in comparison to other models under certain assumptions
Consequently many studies had been achieved in the last century and many
are in progress In stochastic (R s S) inventory policy inventory position is
reviewed every R periods But the decision to order is given according to a
certain order point of inventory position determined previously If the
inventory position is equal to or lower than the reorder point (s) an order is
given to fill the inventory up to the replenishment point (S) If not no order
is given At the beginning of the period on hand inventory is displayed as nx
and transit inventory as 0Q The sum of these two values is called inventory
position The order quantity (Q) at the beginning of the period is calculated
as follows
0
0 0
0 n
n n
Q x Q s
Q S x Q x Q s
The total cost is calculated as in following equations
119879119862 = (119888119876) + (119862119904 + 119896 lowast 119876) + ((119909119899 + 119876
2) lowast (119888 lowast 119888ℎ)
119900119903
119879119862 = (119888119876) + (119862119904 + 119896 lowast 119876) + (119909119899 + 119876
2) lowast 119862ℎ + 119862119901 119863119899 gt 119909119899 + 119876
Where the
c Unit cost
119862ℎ Holding Cost percentage
119862119901 Penalty (stock out) Cost
119862119904 Ordering Cost (fixed)
k Variable ordering cost
TC Total cost
Dn Demand of n period
The classical method for solving the reorder point the replenishment point
and the review period is as follows
119877 = radic2119862119904
119863 lowast 119888 lowast 119862ℎ
İ Z AKYURT
Siyaset Ekonomi ve Youmlnetim Araştırmaları Dergisi2016 Yıl 4 Cilt 4 Sayı 2 73
119904 = 119863(119871 + 119877) + 119911radic(119871 + 119877)1205901198632 + 1198632120590119871
2
119878 = 119904 + 119876
119876 = radic2119862119904119863
119888 lowast 119862ℎ
Another model which is developed by Ehrhardt (1979) is called power
approximation method The model contains the ordering cost the holding
cost and the penalty (backorder) cost The review period and the lead time
are constant The average cost per period in infinite-horizon is analyzed
This method is an algorithm which helps to find approximate optimum
values of inventory model parameters by using mean demand micro and variance2 The parameters are calculated as follows
006910364 0498 2
0416 2 0603
(1463) ( ) ( 1)
( 1) ( 1) ( ) 0220 1142 2866
p s h
p
Q C C L
s L L z z
2( 1) ( 1)os L v L
22 exp( 2)
v
p p hx dx C C C
120583119871 = (119871 + 1)120583 119886119899119889 120590119871 = 120590radic119871 + 1
119876119901 = (1463)1205830364(119862119904
119862ℎ)0498120590119871
0138
119904119901 = 120583119871 + 1205901198710832(
1205902
120583)0817 [
0220
119911+ 1142 minus 2866119911]
(1 )
p
p h L
Qz
C C
If 15pQ p
p p
s s
S s Q
If not
min
min
p o
p p o
s s s
S s Q s
Reorder Point and Replenishment Point of Dynamic Inventory Model Under hellip
74 Research Journal of Politics Economics and Management 2016 Year4 Volume4 Issue2
3 Numerical Example
In this study real data is analyzed taken from a company which operates in
windows amp door industry in Turkey The company produces espagnolettes
and supplies them to the companies in the PVC window industry It is a
make to order supplier The main raw material used to produce espagnolettes
is 152mm225mm hot-rolled steel (refined steel) It is an A type inventory
item The company counts its inventory position at the beginning of any
week in tons and order is given or not based on the reorder point Therefore
it uses (RsS) inventory policy The refined steel is purchased as steel coils
of one ton counted and stored Every week it is forwarded to production
according to job order In the production process the steel wires are
straightened before getting cut and covered The covered steel is assembled
and becomes a final product of espagnolette In this study the real data
concerning the demand for raw material in 52-weeks-period is analyzed
using EasyFit 56 Professional The weekly demand distribution is normal
with a mean of 99401 and a standard deviation of 88272 The fitting results
of demand are as follows
Table 1 Goodness of Fit ndash Summary
Distribution Kolmogorov
Smirnov
Anderson
Darling
Chi-Squared
Statistic Rank Statistic Rank Statistic Rank
1 Beta 011383 3 083336 2 48798 2
2 Normal 00695 1 028604 1 2172 1
3 Power Function 015086 4 26105 3 15789 3
4 Uniform 008854 2 80964 4 NA
Table 2 Descriptive Statistic Report
Statistic Value
Sample Size 52
Range 38
Mean 99401
Variance 7792
Std Deviation 88272
Coef of Variation 00888
Std Error 12241
Skewness 010317
Excess Kurtosis -037069
İ Z AKYURT
Siyaset Ekonomi ve Youmlnetim Araştırmaları Dergisi2016 Yıl 4 Cilt 4 Sayı 2 75
Figure 1 Demand Distribution Graph
Steel is supplied from France because of its high quality The company
imports steel by seaway If an order is placed it arrives after one two three
or four weeks with uniform distribution The fixed cost for placing an order
is euro100 and the variable cost for placing a unit is euro1 The unit cost per ton is
euro750 the holding cost for one ton is 15 of unit cost per year If weekly
demand canrsquot be satisfied from on hand inventory an emergency order is
placed by highway This order arrives instantaneously with a cost of euro300
per order Otherwise the production would stop So the total cost function is
given as in
119879119862 = 750119876 + 100 + 119876 +119909119899 + 119876
2lowast 2
119900119903
119879119862 = 750119876 + 100 + 119876 +119909119899 + 119876
2lowast 2 + 300 119863119899 gt 119909119899 + 119876
Unit cost is omitted since there is no discount in the model
The first method is genetic algorithms to calculate the reorder point and
replenishment point Genetic algorithms (GAs) is a population based
optimization technique developed by Holland (Reeves 1995 Goldberg
1989) Chromosome is a vector that represents the solution variables This
representation can not only be done with binary coding but with real values
as well With randomly selected values from the pre-determined value range
an initial solution is generated This group of solutions produced with the
number of chromosomes (population size) is called initial population Than
evaluates the quality of each solution candidates according to the problem-
specific fitness function Fitness function in our model is considered as
minimization of the total cost including holding cost penalty cost and
ordering cost New solution candidates are created by selecting relatively fit
members of the population and recombining them through various operators
Probability Density Function
Histogram Normal
x
12011611210810410096928884
f(x)
03
028
026
024
022
02
018
016
014
012
01
008
006
004
002
0
Reorder Point and Replenishment Point of Dynamic Inventory Model Under hellip
76 Research Journal of Politics Economics and Management 2016 Year4 Volume4 Issue2
selection crossover mutation (Allen amp Karjalainen 1999) The purpose of
parent selection in GAs is to offer additional reproductive chances to those
population members that are the fittest One commonly used technique the
roulette-wheel-selection is used for this proposed GAs The crossover is the
operator for solution space search It is procedure of creating new
chromosomes There are various versions of crossover In this paper one-
point crossover is used Mutation plays decidedly secondary role in the
operation of GAs ldquoIn artificial genetic systems the mutation operator
protects against such an irrecoverable lossrdquo (Goldberg 1989) In this study
real-value coding is used The steps of GAs are as follows
Step 1 Generation of initial population
Step 2 Evaluation of each individual
Step 3 Selection
Step 4 Crossover
Step 5 Mutation
Step 6 If stopping criteria is not met return to Step 2
Step 7 Select the best individual as a final solution (Kiremitci amp
Akyurt 2012)
GAs parameters used in calculation inventory model is given Table 3 GAs
was run for 100 times and the averages of the results are represented in
Table 4 The codes were generated MATLAB 85 (R2015a) and the
algorithm was run with an Intel(R) Core(TM) i73517U CPU 190 GHz
40 GB Ram configured PC In Table 4 it can be seen that better results are
reached when mutation rate is 02 and population size is 100 It is observed
that 1000 iterations are enough for the solution The reorder point is
approximately as 9 and the replenishment point is 109 Average inventory
cost is euro327 per week
Table 3 GAs Parameters for the Inventory Model
GAs Parameter Values
Iteration 5000
Population size 20 50 100
Crossover rate 100
Mutation Rate 1 10 20
İ Z AKYURT
Siyaset Ekonomi ve Youmlnetim Araştırmaları Dergisi2016 Yıl 4 Cilt 4 Sayı 2 77
Table 4 GAs Results for Different Population Sizes (ps)
Reorder
Point
Replenishment
Point
Average
TC(week)
GAs (ps20) 1423 11346 339
GAs (ps50) 1057 11049 332
GAs (ps100) 887 10913 327
The other method for determining reorder point and replenishment point is
simulation method which is applied using Microsoft Excel spreadsheet by
taking the mentioned cost function into account As seen in the Table 5 a
10x10 trial matrix is formulated The model searches the reorder point and
the replenishment point which result in minimum cost for predetermined
values In each iteration 52 weeks are simulated according to demand and
lead time structure This model runs for 1000 iterations In Table 5 the
repetition number of the minimum total cost is shown The reorder point is
calculated as 10 and the replenishment point is 110 and it is repeated for 188
times However 1000 iterations take 17 minutes with the same PC and it
takes longer compared to the genetic algorithms method In Table 6 average
weekly inventory cost can be seen for different values of reorder point and
replenishment point Itrsquos calculated through a 52-weeks simulation
Reorder Point and Replenishment Point of Dynamic Inventory Model Under hellip
78 Research Journal of Politics Economics and Management 2016 Year4 Volume4 Issue2
Table 5 Simulation Results
Replenishment Point (S)
110 115 120 125 130 135 140 145 150 155 Total
Re
ord
er P
oin
t (s)
10 188 140 24 4 6 2 0 0 0 0 364
15 148 80 18 2 4 0 0 0 0 0 252
20 80 52 12 4 4 4 0 0 0 0 156
25 32 14 0 4 2 0 0 0 0 0 52
30 58 6 2 0 0 0 0 0 0 0 66
35 26 8 0 0 0 0 0 0 0 0 34
40 28 6 0 0 0 0 0 0 0 0 34
45 20 4 0 0 0 0 0 0 0 0 24
50 4 0 0 0 0 0 0 0 0 0 4
55 12 2 0 0 0 0 0 0 0 0 14
Total 596 312 56 14 16 6 0 0 0 0 1000
İ Z AKYURT
Siyaset Ekonomi ve Youmlnetim Araştırmaları Dergisi2016 Yıl 4 Cilt 4 Sayı 2 79
Table 6 Average Weekly Costs for Different Values of Inventory Parameters
Reo
rder
Po
int (s)
Replenishment Point (S)
110 115 120 125 130 135 140 145 150 155
10 3329 3344 3401 3431 3450 3466 3497 3525 3564 3590
15 3346 3356 3403 3432 3457 3476 3503 3532 3563 3597
20 3361 3373 3424 3438 3469 3484 3508 3532 3573 3596
25 3377 3383 3443 3457 3477 3487 3505 3535 3569 3594
30 3375 3405 3458 3478 3502 3498 3518 3540 3577 3603
35 3395 3417 3477 3506 3528 3529 3538 3555 3591 3618
40 3408 3414 3485 3513 3535 3542 3555 3570 3589 3612
45 3412 3432 3495 3524 3549 3557 3574 3589 3601 3625
50 3411 3440 3496 3529 3552 3577 3596 3615 3631 3629
55 3422 3443 3510 3532 3560 3580 3610 3625 3649 3658
Reorder Point and Replenishment Point of Dynamic Inventory Model Under hellip
80 Research Journal of Politics Economics and Management 2016 Year4 Volume4 Issue2
Table 7 compares results of classic simulation and genetic algorithms
methods When the classic method is used average cost increases
dramatically because of that the reorder point in the formulation is high
Results of two other methods are close the result generated by genetic
algorithm is faster and has a lower cost The simulation formulates results
according presupposed intervals and therefore cannot generate solution
values directly
Table 7 Comparison of Results
Reor
der
Point
Replenish
ment
Point
Average
Cost(weekly)
Classic Method
420 527 785
GAs (ps100) 887 10913 327
Simulatio
n
10 110 333
Two-level genetic algorithmsrsquo results determined for each cost are given in
Table 8 As seen in the table when only holding cost increases model
parameters stay stable Similarly when only ordering cost increases
parameters stay again stable When both holding cost and ordering cost
increase parameters stay again stable but only total cost increases slightly
As penalty cost increases the reorder point increases dramatically and the
model converges to the base stock model (RS)
Table 8 Experimental Results for Different Costs (GAs)
Experiment
Number
Holding
Cost
Penalty
Cost
Ordering
Cost
Reorder
Point
s
Replenishment
Point S
Av
Weekly
Total
Cost euro
1 2 300 100 9 109 327
2 2 300 250 7 110 393
3 2 750 100 65 163 581
4 2 750 250 67 165 639
5 5 300 100 8 104 422
6 5 300 250 7 108 736
7 5 750 100 51 110 691
8 5 750 250 8 113 763
İ Z AKYURT
Siyaset Ekonomi ve Youmlnetim Araştırmaları Dergisi2016 Yıl 4 Cilt 4 Sayı 2 81
4 Results and Suggestions
In this study optional replenishment model is analyzed as an inventory
model Although this policy results in optimum values in practice it is hard
to determine parameters of reorder point (s) and replenishment point (S) In
order to determine these two points the demand structure is analyzed and a
cost function is formulated This function is compared with GAs codes
developed in MATLAB with the simulation developed in Microsoft Excel
Weekly average costs are calculated for different reorder and replenishment
points In the chosen case the demand for raw material is normal and its
lead time shows uniform distribution When the results are evaluated it is
seen that GAs constitutes a better alternative in terms of both time and cost
However the cost difference stems from increases of 10 units in the
simulation model When the classic method is used average cost increases
dramatically because of that the reorder point in the formulation is high
In addition in order to analyze the influence of cost change on reorder point
and replenishment point two levels are determined for holding cost penalty
cost and ordering cost The model is operated at these levels again by GAs
and the results reached are examined The examination shows that the main
cost effecting the model is the penalty cost As the penalty cost increases the
reorder point also increases Therefore the policy becomes the base stock
policy
With the help of some modifications in the structure of parameters of GAs
the solution time can be shortened Determining R as a variable the search
for a solution can be continued in a wider area Moreover the same model
can be used for various demand distributions and lead time distributions
References
Agrawal P M amp Sharda R (2012) Impact of frequency of alignment of
physical and information system inventories on out of stocks A
simulation study International Journal of Production
Economics 136(1) 45-55
Allen F amp Karjalainen R (1999) Using genetic algorithms to find
technical trading rules Journal of financial Economics 51(2) 245-
271
Arrow K J Harris T amp Marschak J (1951) Optimal inventory policy
Econometrica Journal of the Econometric Society 250-272
Bollapragada S amp Morton T E (1999) A simple heuristic for computing
nonstationary (s S) policies Operations Research 47(4) 576-584
Buchan J A amp Koenıgsberg E A (1966) Scientific inventory
management Prentice Hall
DeYong G D amp Cattani K D (2015) Fenced in Stochastic and
deterministic planning models in a time-fenced rolling-horizon
scheduling system European Journal of Operational Research
Reorder Point and Replenishment Point of Dynamic Inventory Model Under hellip
82 Research Journal of Politics Economics and Management 2016 Year4 Volume4 Issue2
Diabat A amp Deskoores R (2015) A hybrid genetic algorithm based
heuristic for an integrated supply chain problem Journal of
Manufacturing Systems
do Rego J R amp de Mesquita M A (2015) Demand forecasting and
inventory control A simulation study on automotive spare
parts International Journal of Production Economics 161 1-16
Duan Q amp Liao T W (2013) A new age-based replenishment policy for
supply chain inventory optimization of highly perishable products
International Journal of Production Economics 145(2) 658-671
Ehrhardt R (1979) The power approximation for computing (s S)
inventory policies Management Science 25(8) 777-786
Ehrhardt R (1984) (s S) policies for a dynamic inventory model with
stochastic lead times Operations Research 32(1) 121-132
Ehrhardt R amp Mosier C (1984) A revision of the power approximation
for computing (s S) policies Management Science 30(5) 618-622
Escuiacuten D Polo L amp Cipreacutes D (2016) On the comparison of inventory
replenishment policies with time-varying stochastic demand for the
paper industry Journal of Computational and Applied Mathematics
Freeland J R amp Porteus E L (1980) Evaluating the effectiveness of a
new method for computing approximately optimal (s S) inventory
policies Operations Research 28(2) 353-364
Garciacutea-Alvarado M S Paquet M amp Chaabane A (2015) On inventory
control of product recovery systems subject to environmental
mechanisms International Journal of Production Economics 165
132-144
Glover F amp Laguna M (1993) Modern heuristic techniques for
combinatorial problems Blackwell London
Goldberg D E (1989) Genetic algorithms in search and machine learning
Reading Addison Wesley
Hillier F S (1995) Introduction to operations research Tata McGraw-Hill
Education
Hwang H Choi B amp Lee M J (2005) A model for shelf space
allocation and inventory control considering location and inventory
level effects on demand International Journal of Production
Economics 97(2) 185-195
Iglehart D L (1963) Optimality of (s S) policies in the infinite horizon
dynamic inventory problem Management science 9(2) 259-267
Jana D K Das B amp Maiti M (2014) Multi-item partial backlogging
inventory models over random planning horizon in random fuzzy
environment Applied Soft Computing 21 12-27
İ Z AKYURT
Siyaset Ekonomi ve Youmlnetim Araştırmaları Dergisi2016 Yıl 4 Cilt 4 Sayı 2 83
Karlin S (1958) The Application of Renewal Theory to the Study of
Inventory Policies Chap 15 in Arrow KJ S Karlin and H
Scarf Studies in the Mathematical Theory of Inventory and
Production
Kouki C amp Jouini O (2015) On the effect of lifetime variability on the
performance of inventory systems International Journal of
Production Economics 167 23-34
Koumlchel Peter amp Nielaumlnder U (2005) Simulation-based optimization of
multi-echelon inventory systems International journal of production
economics 93 505-513
Larson C E Olson L J amp Sharma S (2001) Optimal inventory policies
when the demand distribution is not known Journal of economic
Theory 101(1) 281-300
Lin K P Chang P T Hung K C amp Pai P F (2010) A simulation of
vendor managed inventory dynamics using fuzzy arithmetic
operations with genetic algorithms Expert Systems with
Applications 37(3) 2571-2579
Maiti M K amp Maiti M (2006) Fuzzy inventory model with two
warehouses under possibility constraints Fuzzy Sets and
Systems 157(1) 52-73
Naddor E (1975) Optimal and heuristic decisions in single-and multi-item
inventory systems Management Science 21(11) 1234-1249
Nia A R Far M H amp Niaki S T A (2014) A fuzzy vendor managed
inventory of multi-item economic order quantity model under
shortage An ant colony optimization algorithm International
Journal of Production Economics 155 259-271
Nielsen C amp Larsen C (2005) An analytical study of the Q (s S) policy
applied to the joint replenishment problem European Journal of
Operational Research 163(3) 721-732
Porteus E L (1971) On the optimality of generalized (s S) policies
Management Science 17(7) 411-426
Rabta B amp Aiumlssani D (2005) Strong stability in an (R s S) inventory
model International Journal of Production Economics 97(2) 159-
171
Rezaei J amp Davoodi M (2011) Multi-objective models for lot-sizing with
supplier selection International Journal of Production
Economics 130(1) 77-86
Roberts D M (1962) Approximations to optimal policies in a dynamic
inventory model Studies in applied probability and management
science (7) 207
Reorder Point and Replenishment Point of Dynamic Inventory Model Under hellip
84 Research Journal of Politics Economics and Management 2016 Year4 Volume4 Issue2
Scarf H (1960) The Optimality of (s S) Policies in Dynamic Inventory
Problems K Arrow S Karlin P Suppes eds Mathematical
Models in the Social Sciences
Schneider H (1978) Methods for determining the re-order point of an (s S)
ordering policy when a service level is specified Journal of the
Operational Research Society 1181-1193
Sezen H K amp Erdoğmuş Ş (2005) Envanter Politikası Belirlemede
Benzetim Uygulaması 7 Ulusal Ekonometri ve İstatistik
Sempozyumu
Silver E A Pyke D F amp Peterson R (1998) Inventory management and
production planning and scheduling (Vol 3 p 30) New York
Wiley
Sivazlian B D (1971) Dimensional and computational analysis in
stationary (s S) inventory problems with gamma distributed
demand Management Science 17(6) B-307
Stevenson W J amp Sum C C (2009) Operations management (Vol 8)
Boston MA McGraw-HillIrwin
Taleizadeh A A Niaki S T A Aryanezhad M B amp Shafii N (2013)
A hybrid method of fuzzy simulation and genetic algorithm to
optimize constrained inventory control systems with stochastic
replenishments and fuzzy demand Information Sciences 220 425-
441
Thiel D Hovelaque V amp Le Hoa V T (2010) Impact of inventory
inaccuracy on service-level quality in (Q R) continuous-review lost-
sales inventory models International Journal of Production
Economics 123(2) 301-311
Tijms H C amp Groenevelt H (1984) Simple approximations for the
reorder point in periodic and continuous review (s S) inventory
systems with service level constraints European journal of
operational research 17(2) 175-190
Veinott Jr A F (1966) On the Optimality of (sS) Inventory Policies New
Conditions and a New Proof SIAM Journal on Applied
Mathematics 14(5) 1067-1083
Wagner H M (1975) Principle of Operations Research Englewood Cliff
White A S amp Censlive M (2015) Control system analysis of labor supply
flows in production systems Journal of Manufacturing Systems 37
316-327
Ye W amp You F (2016) A computationally efficient simulation-based
optimization method with region-wise surrogate modeling for
stochastic inventory management of supply chains with general
İ Z AKYURT
Siyaset Ekonomi ve Youmlnetim Araştırmaları Dergisi2016 Yıl 4 Cilt 4 Sayı 2 85
network structures Computers amp Chemical Engineering 87 164-
179
Yin K K Liu H amp Johnson N E (2002) Markovian inventory policy
with application to the paper industry Computers amp chemical
engineering 26(10) 1399-1413
Zheng Y S amp Federgruen A (1991) Finding optimal (s S) policies is
about as simple as evaluating a single policy Operations
research 39(4) 654-665
Zhou W Q Chen L amp Ge H M (2013) A multi-product multi-echelon
inventory control model with joint replenishment strategy Applied
Mathematical Modelling 37(4) 2039-2050
Reorder Point and Replenishment Point of Dynamic Inventory Model Under hellip
70 Research Journal of Politics Economics and Management 2016 Year4 Volume4 Issue2
low as possible It is not enough to realize just these two condition to design
a good inventory policy The number of items produced or purchased at the
beginning of each period should meet the demand of that period Briefly a
good inventory management policy should focus on reducing the inventory
related costs while redounding the customer service level Also low unit
costs and high inventory turnover rates are sub-targets
There are some factors effecting on the decision makers judge These factors
can be collected under four basic groups These are demand replenishment
lead time and cost factors Many inventory control models had been
developed on the basis of the fundamental goals of inventory management
using these factors When diversification is made with a demand oriented
view deterministic and stochastic inventory control models had been came
out according to structure of the demand While the policies are determined
a mathematical model is structured according to the factors mentioned By
adopting all the costs to the model an inventory control model with the
minimum cost is achieved The outcome of this model is the answers of
ldquowhen to replenishrdquo and ldquohow many to purchaseproducerdquo In order to
determine these cost values various mathematical methods can be used
The (sS) inventory model put forward by Arrov et al (1951) is used by
many firms and found a wide application area However in cases where
inventory records cannot be reviewed continuously the model transforms to
periodic review (RsS) inventory model In the literature both models are
called optional replenishment policy or model (Rabta amp Aissani 2005 Yin
Liu amp Johnson 2002 Buchan amp Koenigsberg 1966 Nielsen amp Larsen
2005) The optional replenishment model used in this study is based on
periodic review These models are preferred by many companies as
inventory policy in order to avoid from high levels of inventory in low
demand periods and from stock-out in high demand periods This model
reacts very quickly to demand changes However the success of the model
stems from the quality of data analysis and of determination of reorder point
(s) and replenishment point (S) The most problematic part of this model is
the difficulty to compute s and S parameters There are a lot of methods
which enables the computation of these two parameters But these methods
are complex and difficult to solve (Silver Pyke amp Peterson 1998 336)
The basis of (R s S) model depends on Arrow (1951) and Karlin et al
(1958) But the optimization issue for finite periods is studied by Scarf
(1960) under specific assumptions Scrafrsquos model is studied by Iglehart
(1963) for infinite periods under fixed demand and cost structure Veniott
(1966) and Porteus (1971) had researches on this field Federguen and Zheng
determined the calculation of the parameters with average cost per period for
infinite periods in case of discrete demand distribution for each period
Beside this there are some other heuristic methods Robert (1962) Sivazlian
İ Z AKYURT
Siyaset Ekonomi ve Youmlnetim Araştırmaları Dergisi2016 Yıl 4 Cilt 4 Sayı 2 71
(1971) Nador (1975) Wagner (1975) and Schneider (1978) studied on the
reorder point in certain service levels Ehrhardt (1979-1984) Freeland and
Porteus (1980) Tijims amp Groenevelt (1984) Zheng amp Federgruen (1991)
developed an algorithm to find these parameters under discrete demand
distribution Bollapragad amp Morton (1999) Larson et al (2001) analyzed
such a policy with stochastic demand
Sezen amp Erdoğmuş (2005) determined the inventory policy with the help of
simulation method Koumlchel amp Nielander (2005) offered a simulation based
optimization method for multi echelon inventory systems Yeamp You (2016)
developed a simulation based optimization method for reducing the cost with
a constant service level Escuiacuten amp Cipreacutes (2016) deal with a multi-product
dynamic lot-sizing problem under stochastic demand and compare make o
order strategy and vendor managed strategy by simulation DeYong amp
Cattani (2015) analyzed the deterministic and stochastic problems as
dynamic programs by simulation The other simulation method is used in
inventory management can be seen in the literatuumlre (Whiteamp Censlive 2015
do Rego amp de Mesquita 2015 Agrawal amp Sharda 2012 Kouki amp Jouini
2015 Duan amp Liao 2013 Thiel et al 2010)
Zhou et al (2013) solved a multi-echelon inventory control problem by
genetic algorithms Maiti amp Maiti (2006) deal with a multi-item inventory
model with two-storage facilities by a fuzzy simulation-based singlemulti-
objective genetic algorithms The other genetic algorithms methods used in
inventory management problem can be found (Diabat amp Deskoores 2015
Garciacutea et al 2015 Nia et al 2014 Rezaei amp Davoodi 2011 Hwang et al
2005)
Taleizadeh et al (2013) assumed that the time between two replenishments
is an independent random variable They demonstrated that the model of this
problem is a kind of integer-nonlinear-programming A hybrid method of
fuzzy simulation (FS) and genetic algorithm (GA) were proposed to solve
this problem Genetic algorithms and simulation methods is widely used in
inventory management (Lin et al 2010 Jana et al 2014)
In this study real data is taken from a manufacturing company which uses
refined steel as raw material Demand values and lead time are random
variables Where the demand distribution is normal the lead time is uniform
Additionally holding cost penalty cost (stock-out cost) and ordering cost
are used Reorder point and replenishment point are determined using
simulation method and genetic algorithms method and the cost results of
these methods are compared The effect of cost variation on the inventory
model is analyzed by genetic algorithms method Two levels of analysis are
developed for these three cost calculations and an experimental design is
Reorder Point and Replenishment Point of Dynamic Inventory Model Under hellip
72 Research Journal of Politics Economics and Management 2016 Year4 Volume4 Issue2
formulated accordingly The new reorder and replenishment points are
compared
2 Dynamic Inventory Model
In single item inventory systems from the economical aspect of
replenishment order and stock out case this method can be managed to be
favorable in comparison to other models under certain assumptions
Consequently many studies had been achieved in the last century and many
are in progress In stochastic (R s S) inventory policy inventory position is
reviewed every R periods But the decision to order is given according to a
certain order point of inventory position determined previously If the
inventory position is equal to or lower than the reorder point (s) an order is
given to fill the inventory up to the replenishment point (S) If not no order
is given At the beginning of the period on hand inventory is displayed as nx
and transit inventory as 0Q The sum of these two values is called inventory
position The order quantity (Q) at the beginning of the period is calculated
as follows
0
0 0
0 n
n n
Q x Q s
Q S x Q x Q s
The total cost is calculated as in following equations
119879119862 = (119888119876) + (119862119904 + 119896 lowast 119876) + ((119909119899 + 119876
2) lowast (119888 lowast 119888ℎ)
119900119903
119879119862 = (119888119876) + (119862119904 + 119896 lowast 119876) + (119909119899 + 119876
2) lowast 119862ℎ + 119862119901 119863119899 gt 119909119899 + 119876
Where the
c Unit cost
119862ℎ Holding Cost percentage
119862119901 Penalty (stock out) Cost
119862119904 Ordering Cost (fixed)
k Variable ordering cost
TC Total cost
Dn Demand of n period
The classical method for solving the reorder point the replenishment point
and the review period is as follows
119877 = radic2119862119904
119863 lowast 119888 lowast 119862ℎ
İ Z AKYURT
Siyaset Ekonomi ve Youmlnetim Araştırmaları Dergisi2016 Yıl 4 Cilt 4 Sayı 2 73
119904 = 119863(119871 + 119877) + 119911radic(119871 + 119877)1205901198632 + 1198632120590119871
2
119878 = 119904 + 119876
119876 = radic2119862119904119863
119888 lowast 119862ℎ
Another model which is developed by Ehrhardt (1979) is called power
approximation method The model contains the ordering cost the holding
cost and the penalty (backorder) cost The review period and the lead time
are constant The average cost per period in infinite-horizon is analyzed
This method is an algorithm which helps to find approximate optimum
values of inventory model parameters by using mean demand micro and variance2 The parameters are calculated as follows
006910364 0498 2
0416 2 0603
(1463) ( ) ( 1)
( 1) ( 1) ( ) 0220 1142 2866
p s h
p
Q C C L
s L L z z
2( 1) ( 1)os L v L
22 exp( 2)
v
p p hx dx C C C
120583119871 = (119871 + 1)120583 119886119899119889 120590119871 = 120590radic119871 + 1
119876119901 = (1463)1205830364(119862119904
119862ℎ)0498120590119871
0138
119904119901 = 120583119871 + 1205901198710832(
1205902
120583)0817 [
0220
119911+ 1142 minus 2866119911]
(1 )
p
p h L
Qz
C C
If 15pQ p
p p
s s
S s Q
If not
min
min
p o
p p o
s s s
S s Q s
Reorder Point and Replenishment Point of Dynamic Inventory Model Under hellip
74 Research Journal of Politics Economics and Management 2016 Year4 Volume4 Issue2
3 Numerical Example
In this study real data is analyzed taken from a company which operates in
windows amp door industry in Turkey The company produces espagnolettes
and supplies them to the companies in the PVC window industry It is a
make to order supplier The main raw material used to produce espagnolettes
is 152mm225mm hot-rolled steel (refined steel) It is an A type inventory
item The company counts its inventory position at the beginning of any
week in tons and order is given or not based on the reorder point Therefore
it uses (RsS) inventory policy The refined steel is purchased as steel coils
of one ton counted and stored Every week it is forwarded to production
according to job order In the production process the steel wires are
straightened before getting cut and covered The covered steel is assembled
and becomes a final product of espagnolette In this study the real data
concerning the demand for raw material in 52-weeks-period is analyzed
using EasyFit 56 Professional The weekly demand distribution is normal
with a mean of 99401 and a standard deviation of 88272 The fitting results
of demand are as follows
Table 1 Goodness of Fit ndash Summary
Distribution Kolmogorov
Smirnov
Anderson
Darling
Chi-Squared
Statistic Rank Statistic Rank Statistic Rank
1 Beta 011383 3 083336 2 48798 2
2 Normal 00695 1 028604 1 2172 1
3 Power Function 015086 4 26105 3 15789 3
4 Uniform 008854 2 80964 4 NA
Table 2 Descriptive Statistic Report
Statistic Value
Sample Size 52
Range 38
Mean 99401
Variance 7792
Std Deviation 88272
Coef of Variation 00888
Std Error 12241
Skewness 010317
Excess Kurtosis -037069
İ Z AKYURT
Siyaset Ekonomi ve Youmlnetim Araştırmaları Dergisi2016 Yıl 4 Cilt 4 Sayı 2 75
Figure 1 Demand Distribution Graph
Steel is supplied from France because of its high quality The company
imports steel by seaway If an order is placed it arrives after one two three
or four weeks with uniform distribution The fixed cost for placing an order
is euro100 and the variable cost for placing a unit is euro1 The unit cost per ton is
euro750 the holding cost for one ton is 15 of unit cost per year If weekly
demand canrsquot be satisfied from on hand inventory an emergency order is
placed by highway This order arrives instantaneously with a cost of euro300
per order Otherwise the production would stop So the total cost function is
given as in
119879119862 = 750119876 + 100 + 119876 +119909119899 + 119876
2lowast 2
119900119903
119879119862 = 750119876 + 100 + 119876 +119909119899 + 119876
2lowast 2 + 300 119863119899 gt 119909119899 + 119876
Unit cost is omitted since there is no discount in the model
The first method is genetic algorithms to calculate the reorder point and
replenishment point Genetic algorithms (GAs) is a population based
optimization technique developed by Holland (Reeves 1995 Goldberg
1989) Chromosome is a vector that represents the solution variables This
representation can not only be done with binary coding but with real values
as well With randomly selected values from the pre-determined value range
an initial solution is generated This group of solutions produced with the
number of chromosomes (population size) is called initial population Than
evaluates the quality of each solution candidates according to the problem-
specific fitness function Fitness function in our model is considered as
minimization of the total cost including holding cost penalty cost and
ordering cost New solution candidates are created by selecting relatively fit
members of the population and recombining them through various operators
Probability Density Function
Histogram Normal
x
12011611210810410096928884
f(x)
03
028
026
024
022
02
018
016
014
012
01
008
006
004
002
0
Reorder Point and Replenishment Point of Dynamic Inventory Model Under hellip
76 Research Journal of Politics Economics and Management 2016 Year4 Volume4 Issue2
selection crossover mutation (Allen amp Karjalainen 1999) The purpose of
parent selection in GAs is to offer additional reproductive chances to those
population members that are the fittest One commonly used technique the
roulette-wheel-selection is used for this proposed GAs The crossover is the
operator for solution space search It is procedure of creating new
chromosomes There are various versions of crossover In this paper one-
point crossover is used Mutation plays decidedly secondary role in the
operation of GAs ldquoIn artificial genetic systems the mutation operator
protects against such an irrecoverable lossrdquo (Goldberg 1989) In this study
real-value coding is used The steps of GAs are as follows
Step 1 Generation of initial population
Step 2 Evaluation of each individual
Step 3 Selection
Step 4 Crossover
Step 5 Mutation
Step 6 If stopping criteria is not met return to Step 2
Step 7 Select the best individual as a final solution (Kiremitci amp
Akyurt 2012)
GAs parameters used in calculation inventory model is given Table 3 GAs
was run for 100 times and the averages of the results are represented in
Table 4 The codes were generated MATLAB 85 (R2015a) and the
algorithm was run with an Intel(R) Core(TM) i73517U CPU 190 GHz
40 GB Ram configured PC In Table 4 it can be seen that better results are
reached when mutation rate is 02 and population size is 100 It is observed
that 1000 iterations are enough for the solution The reorder point is
approximately as 9 and the replenishment point is 109 Average inventory
cost is euro327 per week
Table 3 GAs Parameters for the Inventory Model
GAs Parameter Values
Iteration 5000
Population size 20 50 100
Crossover rate 100
Mutation Rate 1 10 20
İ Z AKYURT
Siyaset Ekonomi ve Youmlnetim Araştırmaları Dergisi2016 Yıl 4 Cilt 4 Sayı 2 77
Table 4 GAs Results for Different Population Sizes (ps)
Reorder
Point
Replenishment
Point
Average
TC(week)
GAs (ps20) 1423 11346 339
GAs (ps50) 1057 11049 332
GAs (ps100) 887 10913 327
The other method for determining reorder point and replenishment point is
simulation method which is applied using Microsoft Excel spreadsheet by
taking the mentioned cost function into account As seen in the Table 5 a
10x10 trial matrix is formulated The model searches the reorder point and
the replenishment point which result in minimum cost for predetermined
values In each iteration 52 weeks are simulated according to demand and
lead time structure This model runs for 1000 iterations In Table 5 the
repetition number of the minimum total cost is shown The reorder point is
calculated as 10 and the replenishment point is 110 and it is repeated for 188
times However 1000 iterations take 17 minutes with the same PC and it
takes longer compared to the genetic algorithms method In Table 6 average
weekly inventory cost can be seen for different values of reorder point and
replenishment point Itrsquos calculated through a 52-weeks simulation
Reorder Point and Replenishment Point of Dynamic Inventory Model Under hellip
78 Research Journal of Politics Economics and Management 2016 Year4 Volume4 Issue2
Table 5 Simulation Results
Replenishment Point (S)
110 115 120 125 130 135 140 145 150 155 Total
Re
ord
er P
oin
t (s)
10 188 140 24 4 6 2 0 0 0 0 364
15 148 80 18 2 4 0 0 0 0 0 252
20 80 52 12 4 4 4 0 0 0 0 156
25 32 14 0 4 2 0 0 0 0 0 52
30 58 6 2 0 0 0 0 0 0 0 66
35 26 8 0 0 0 0 0 0 0 0 34
40 28 6 0 0 0 0 0 0 0 0 34
45 20 4 0 0 0 0 0 0 0 0 24
50 4 0 0 0 0 0 0 0 0 0 4
55 12 2 0 0 0 0 0 0 0 0 14
Total 596 312 56 14 16 6 0 0 0 0 1000
İ Z AKYURT
Siyaset Ekonomi ve Youmlnetim Araştırmaları Dergisi2016 Yıl 4 Cilt 4 Sayı 2 79
Table 6 Average Weekly Costs for Different Values of Inventory Parameters
Reo
rder
Po
int (s)
Replenishment Point (S)
110 115 120 125 130 135 140 145 150 155
10 3329 3344 3401 3431 3450 3466 3497 3525 3564 3590
15 3346 3356 3403 3432 3457 3476 3503 3532 3563 3597
20 3361 3373 3424 3438 3469 3484 3508 3532 3573 3596
25 3377 3383 3443 3457 3477 3487 3505 3535 3569 3594
30 3375 3405 3458 3478 3502 3498 3518 3540 3577 3603
35 3395 3417 3477 3506 3528 3529 3538 3555 3591 3618
40 3408 3414 3485 3513 3535 3542 3555 3570 3589 3612
45 3412 3432 3495 3524 3549 3557 3574 3589 3601 3625
50 3411 3440 3496 3529 3552 3577 3596 3615 3631 3629
55 3422 3443 3510 3532 3560 3580 3610 3625 3649 3658
Reorder Point and Replenishment Point of Dynamic Inventory Model Under hellip
80 Research Journal of Politics Economics and Management 2016 Year4 Volume4 Issue2
Table 7 compares results of classic simulation and genetic algorithms
methods When the classic method is used average cost increases
dramatically because of that the reorder point in the formulation is high
Results of two other methods are close the result generated by genetic
algorithm is faster and has a lower cost The simulation formulates results
according presupposed intervals and therefore cannot generate solution
values directly
Table 7 Comparison of Results
Reor
der
Point
Replenish
ment
Point
Average
Cost(weekly)
Classic Method
420 527 785
GAs (ps100) 887 10913 327
Simulatio
n
10 110 333
Two-level genetic algorithmsrsquo results determined for each cost are given in
Table 8 As seen in the table when only holding cost increases model
parameters stay stable Similarly when only ordering cost increases
parameters stay again stable When both holding cost and ordering cost
increase parameters stay again stable but only total cost increases slightly
As penalty cost increases the reorder point increases dramatically and the
model converges to the base stock model (RS)
Table 8 Experimental Results for Different Costs (GAs)
Experiment
Number
Holding
Cost
Penalty
Cost
Ordering
Cost
Reorder
Point
s
Replenishment
Point S
Av
Weekly
Total
Cost euro
1 2 300 100 9 109 327
2 2 300 250 7 110 393
3 2 750 100 65 163 581
4 2 750 250 67 165 639
5 5 300 100 8 104 422
6 5 300 250 7 108 736
7 5 750 100 51 110 691
8 5 750 250 8 113 763
İ Z AKYURT
Siyaset Ekonomi ve Youmlnetim Araştırmaları Dergisi2016 Yıl 4 Cilt 4 Sayı 2 81
4 Results and Suggestions
In this study optional replenishment model is analyzed as an inventory
model Although this policy results in optimum values in practice it is hard
to determine parameters of reorder point (s) and replenishment point (S) In
order to determine these two points the demand structure is analyzed and a
cost function is formulated This function is compared with GAs codes
developed in MATLAB with the simulation developed in Microsoft Excel
Weekly average costs are calculated for different reorder and replenishment
points In the chosen case the demand for raw material is normal and its
lead time shows uniform distribution When the results are evaluated it is
seen that GAs constitutes a better alternative in terms of both time and cost
However the cost difference stems from increases of 10 units in the
simulation model When the classic method is used average cost increases
dramatically because of that the reorder point in the formulation is high
In addition in order to analyze the influence of cost change on reorder point
and replenishment point two levels are determined for holding cost penalty
cost and ordering cost The model is operated at these levels again by GAs
and the results reached are examined The examination shows that the main
cost effecting the model is the penalty cost As the penalty cost increases the
reorder point also increases Therefore the policy becomes the base stock
policy
With the help of some modifications in the structure of parameters of GAs
the solution time can be shortened Determining R as a variable the search
for a solution can be continued in a wider area Moreover the same model
can be used for various demand distributions and lead time distributions
References
Agrawal P M amp Sharda R (2012) Impact of frequency of alignment of
physical and information system inventories on out of stocks A
simulation study International Journal of Production
Economics 136(1) 45-55
Allen F amp Karjalainen R (1999) Using genetic algorithms to find
technical trading rules Journal of financial Economics 51(2) 245-
271
Arrow K J Harris T amp Marschak J (1951) Optimal inventory policy
Econometrica Journal of the Econometric Society 250-272
Bollapragada S amp Morton T E (1999) A simple heuristic for computing
nonstationary (s S) policies Operations Research 47(4) 576-584
Buchan J A amp Koenıgsberg E A (1966) Scientific inventory
management Prentice Hall
DeYong G D amp Cattani K D (2015) Fenced in Stochastic and
deterministic planning models in a time-fenced rolling-horizon
scheduling system European Journal of Operational Research
Reorder Point and Replenishment Point of Dynamic Inventory Model Under hellip
82 Research Journal of Politics Economics and Management 2016 Year4 Volume4 Issue2
Diabat A amp Deskoores R (2015) A hybrid genetic algorithm based
heuristic for an integrated supply chain problem Journal of
Manufacturing Systems
do Rego J R amp de Mesquita M A (2015) Demand forecasting and
inventory control A simulation study on automotive spare
parts International Journal of Production Economics 161 1-16
Duan Q amp Liao T W (2013) A new age-based replenishment policy for
supply chain inventory optimization of highly perishable products
International Journal of Production Economics 145(2) 658-671
Ehrhardt R (1979) The power approximation for computing (s S)
inventory policies Management Science 25(8) 777-786
Ehrhardt R (1984) (s S) policies for a dynamic inventory model with
stochastic lead times Operations Research 32(1) 121-132
Ehrhardt R amp Mosier C (1984) A revision of the power approximation
for computing (s S) policies Management Science 30(5) 618-622
Escuiacuten D Polo L amp Cipreacutes D (2016) On the comparison of inventory
replenishment policies with time-varying stochastic demand for the
paper industry Journal of Computational and Applied Mathematics
Freeland J R amp Porteus E L (1980) Evaluating the effectiveness of a
new method for computing approximately optimal (s S) inventory
policies Operations Research 28(2) 353-364
Garciacutea-Alvarado M S Paquet M amp Chaabane A (2015) On inventory
control of product recovery systems subject to environmental
mechanisms International Journal of Production Economics 165
132-144
Glover F amp Laguna M (1993) Modern heuristic techniques for
combinatorial problems Blackwell London
Goldberg D E (1989) Genetic algorithms in search and machine learning
Reading Addison Wesley
Hillier F S (1995) Introduction to operations research Tata McGraw-Hill
Education
Hwang H Choi B amp Lee M J (2005) A model for shelf space
allocation and inventory control considering location and inventory
level effects on demand International Journal of Production
Economics 97(2) 185-195
Iglehart D L (1963) Optimality of (s S) policies in the infinite horizon
dynamic inventory problem Management science 9(2) 259-267
Jana D K Das B amp Maiti M (2014) Multi-item partial backlogging
inventory models over random planning horizon in random fuzzy
environment Applied Soft Computing 21 12-27
İ Z AKYURT
Siyaset Ekonomi ve Youmlnetim Araştırmaları Dergisi2016 Yıl 4 Cilt 4 Sayı 2 83
Karlin S (1958) The Application of Renewal Theory to the Study of
Inventory Policies Chap 15 in Arrow KJ S Karlin and H
Scarf Studies in the Mathematical Theory of Inventory and
Production
Kouki C amp Jouini O (2015) On the effect of lifetime variability on the
performance of inventory systems International Journal of
Production Economics 167 23-34
Koumlchel Peter amp Nielaumlnder U (2005) Simulation-based optimization of
multi-echelon inventory systems International journal of production
economics 93 505-513
Larson C E Olson L J amp Sharma S (2001) Optimal inventory policies
when the demand distribution is not known Journal of economic
Theory 101(1) 281-300
Lin K P Chang P T Hung K C amp Pai P F (2010) A simulation of
vendor managed inventory dynamics using fuzzy arithmetic
operations with genetic algorithms Expert Systems with
Applications 37(3) 2571-2579
Maiti M K amp Maiti M (2006) Fuzzy inventory model with two
warehouses under possibility constraints Fuzzy Sets and
Systems 157(1) 52-73
Naddor E (1975) Optimal and heuristic decisions in single-and multi-item
inventory systems Management Science 21(11) 1234-1249
Nia A R Far M H amp Niaki S T A (2014) A fuzzy vendor managed
inventory of multi-item economic order quantity model under
shortage An ant colony optimization algorithm International
Journal of Production Economics 155 259-271
Nielsen C amp Larsen C (2005) An analytical study of the Q (s S) policy
applied to the joint replenishment problem European Journal of
Operational Research 163(3) 721-732
Porteus E L (1971) On the optimality of generalized (s S) policies
Management Science 17(7) 411-426
Rabta B amp Aiumlssani D (2005) Strong stability in an (R s S) inventory
model International Journal of Production Economics 97(2) 159-
171
Rezaei J amp Davoodi M (2011) Multi-objective models for lot-sizing with
supplier selection International Journal of Production
Economics 130(1) 77-86
Roberts D M (1962) Approximations to optimal policies in a dynamic
inventory model Studies in applied probability and management
science (7) 207
Reorder Point and Replenishment Point of Dynamic Inventory Model Under hellip
84 Research Journal of Politics Economics and Management 2016 Year4 Volume4 Issue2
Scarf H (1960) The Optimality of (s S) Policies in Dynamic Inventory
Problems K Arrow S Karlin P Suppes eds Mathematical
Models in the Social Sciences
Schneider H (1978) Methods for determining the re-order point of an (s S)
ordering policy when a service level is specified Journal of the
Operational Research Society 1181-1193
Sezen H K amp Erdoğmuş Ş (2005) Envanter Politikası Belirlemede
Benzetim Uygulaması 7 Ulusal Ekonometri ve İstatistik
Sempozyumu
Silver E A Pyke D F amp Peterson R (1998) Inventory management and
production planning and scheduling (Vol 3 p 30) New York
Wiley
Sivazlian B D (1971) Dimensional and computational analysis in
stationary (s S) inventory problems with gamma distributed
demand Management Science 17(6) B-307
Stevenson W J amp Sum C C (2009) Operations management (Vol 8)
Boston MA McGraw-HillIrwin
Taleizadeh A A Niaki S T A Aryanezhad M B amp Shafii N (2013)
A hybrid method of fuzzy simulation and genetic algorithm to
optimize constrained inventory control systems with stochastic
replenishments and fuzzy demand Information Sciences 220 425-
441
Thiel D Hovelaque V amp Le Hoa V T (2010) Impact of inventory
inaccuracy on service-level quality in (Q R) continuous-review lost-
sales inventory models International Journal of Production
Economics 123(2) 301-311
Tijms H C amp Groenevelt H (1984) Simple approximations for the
reorder point in periodic and continuous review (s S) inventory
systems with service level constraints European journal of
operational research 17(2) 175-190
Veinott Jr A F (1966) On the Optimality of (sS) Inventory Policies New
Conditions and a New Proof SIAM Journal on Applied
Mathematics 14(5) 1067-1083
Wagner H M (1975) Principle of Operations Research Englewood Cliff
White A S amp Censlive M (2015) Control system analysis of labor supply
flows in production systems Journal of Manufacturing Systems 37
316-327
Ye W amp You F (2016) A computationally efficient simulation-based
optimization method with region-wise surrogate modeling for
stochastic inventory management of supply chains with general
İ Z AKYURT
Siyaset Ekonomi ve Youmlnetim Araştırmaları Dergisi2016 Yıl 4 Cilt 4 Sayı 2 85
network structures Computers amp Chemical Engineering 87 164-
179
Yin K K Liu H amp Johnson N E (2002) Markovian inventory policy
with application to the paper industry Computers amp chemical
engineering 26(10) 1399-1413
Zheng Y S amp Federgruen A (1991) Finding optimal (s S) policies is
about as simple as evaluating a single policy Operations
research 39(4) 654-665
Zhou W Q Chen L amp Ge H M (2013) A multi-product multi-echelon
inventory control model with joint replenishment strategy Applied
Mathematical Modelling 37(4) 2039-2050
İ Z AKYURT
Siyaset Ekonomi ve Youmlnetim Araştırmaları Dergisi2016 Yıl 4 Cilt 4 Sayı 2 71
(1971) Nador (1975) Wagner (1975) and Schneider (1978) studied on the
reorder point in certain service levels Ehrhardt (1979-1984) Freeland and
Porteus (1980) Tijims amp Groenevelt (1984) Zheng amp Federgruen (1991)
developed an algorithm to find these parameters under discrete demand
distribution Bollapragad amp Morton (1999) Larson et al (2001) analyzed
such a policy with stochastic demand
Sezen amp Erdoğmuş (2005) determined the inventory policy with the help of
simulation method Koumlchel amp Nielander (2005) offered a simulation based
optimization method for multi echelon inventory systems Yeamp You (2016)
developed a simulation based optimization method for reducing the cost with
a constant service level Escuiacuten amp Cipreacutes (2016) deal with a multi-product
dynamic lot-sizing problem under stochastic demand and compare make o
order strategy and vendor managed strategy by simulation DeYong amp
Cattani (2015) analyzed the deterministic and stochastic problems as
dynamic programs by simulation The other simulation method is used in
inventory management can be seen in the literatuumlre (Whiteamp Censlive 2015
do Rego amp de Mesquita 2015 Agrawal amp Sharda 2012 Kouki amp Jouini
2015 Duan amp Liao 2013 Thiel et al 2010)
Zhou et al (2013) solved a multi-echelon inventory control problem by
genetic algorithms Maiti amp Maiti (2006) deal with a multi-item inventory
model with two-storage facilities by a fuzzy simulation-based singlemulti-
objective genetic algorithms The other genetic algorithms methods used in
inventory management problem can be found (Diabat amp Deskoores 2015
Garciacutea et al 2015 Nia et al 2014 Rezaei amp Davoodi 2011 Hwang et al
2005)
Taleizadeh et al (2013) assumed that the time between two replenishments
is an independent random variable They demonstrated that the model of this
problem is a kind of integer-nonlinear-programming A hybrid method of
fuzzy simulation (FS) and genetic algorithm (GA) were proposed to solve
this problem Genetic algorithms and simulation methods is widely used in
inventory management (Lin et al 2010 Jana et al 2014)
In this study real data is taken from a manufacturing company which uses
refined steel as raw material Demand values and lead time are random
variables Where the demand distribution is normal the lead time is uniform
Additionally holding cost penalty cost (stock-out cost) and ordering cost
are used Reorder point and replenishment point are determined using
simulation method and genetic algorithms method and the cost results of
these methods are compared The effect of cost variation on the inventory
model is analyzed by genetic algorithms method Two levels of analysis are
developed for these three cost calculations and an experimental design is
Reorder Point and Replenishment Point of Dynamic Inventory Model Under hellip
72 Research Journal of Politics Economics and Management 2016 Year4 Volume4 Issue2
formulated accordingly The new reorder and replenishment points are
compared
2 Dynamic Inventory Model
In single item inventory systems from the economical aspect of
replenishment order and stock out case this method can be managed to be
favorable in comparison to other models under certain assumptions
Consequently many studies had been achieved in the last century and many
are in progress In stochastic (R s S) inventory policy inventory position is
reviewed every R periods But the decision to order is given according to a
certain order point of inventory position determined previously If the
inventory position is equal to or lower than the reorder point (s) an order is
given to fill the inventory up to the replenishment point (S) If not no order
is given At the beginning of the period on hand inventory is displayed as nx
and transit inventory as 0Q The sum of these two values is called inventory
position The order quantity (Q) at the beginning of the period is calculated
as follows
0
0 0
0 n
n n
Q x Q s
Q S x Q x Q s
The total cost is calculated as in following equations
119879119862 = (119888119876) + (119862119904 + 119896 lowast 119876) + ((119909119899 + 119876
2) lowast (119888 lowast 119888ℎ)
119900119903
119879119862 = (119888119876) + (119862119904 + 119896 lowast 119876) + (119909119899 + 119876
2) lowast 119862ℎ + 119862119901 119863119899 gt 119909119899 + 119876
Where the
c Unit cost
119862ℎ Holding Cost percentage
119862119901 Penalty (stock out) Cost
119862119904 Ordering Cost (fixed)
k Variable ordering cost
TC Total cost
Dn Demand of n period
The classical method for solving the reorder point the replenishment point
and the review period is as follows
119877 = radic2119862119904
119863 lowast 119888 lowast 119862ℎ
İ Z AKYURT
Siyaset Ekonomi ve Youmlnetim Araştırmaları Dergisi2016 Yıl 4 Cilt 4 Sayı 2 73
119904 = 119863(119871 + 119877) + 119911radic(119871 + 119877)1205901198632 + 1198632120590119871
2
119878 = 119904 + 119876
119876 = radic2119862119904119863
119888 lowast 119862ℎ
Another model which is developed by Ehrhardt (1979) is called power
approximation method The model contains the ordering cost the holding
cost and the penalty (backorder) cost The review period and the lead time
are constant The average cost per period in infinite-horizon is analyzed
This method is an algorithm which helps to find approximate optimum
values of inventory model parameters by using mean demand micro and variance2 The parameters are calculated as follows
006910364 0498 2
0416 2 0603
(1463) ( ) ( 1)
( 1) ( 1) ( ) 0220 1142 2866
p s h
p
Q C C L
s L L z z
2( 1) ( 1)os L v L
22 exp( 2)
v
p p hx dx C C C
120583119871 = (119871 + 1)120583 119886119899119889 120590119871 = 120590radic119871 + 1
119876119901 = (1463)1205830364(119862119904
119862ℎ)0498120590119871
0138
119904119901 = 120583119871 + 1205901198710832(
1205902
120583)0817 [
0220
119911+ 1142 minus 2866119911]
(1 )
p
p h L
Qz
C C
If 15pQ p
p p
s s
S s Q
If not
min
min
p o
p p o
s s s
S s Q s
Reorder Point and Replenishment Point of Dynamic Inventory Model Under hellip
74 Research Journal of Politics Economics and Management 2016 Year4 Volume4 Issue2
3 Numerical Example
In this study real data is analyzed taken from a company which operates in
windows amp door industry in Turkey The company produces espagnolettes
and supplies them to the companies in the PVC window industry It is a
make to order supplier The main raw material used to produce espagnolettes
is 152mm225mm hot-rolled steel (refined steel) It is an A type inventory
item The company counts its inventory position at the beginning of any
week in tons and order is given or not based on the reorder point Therefore
it uses (RsS) inventory policy The refined steel is purchased as steel coils
of one ton counted and stored Every week it is forwarded to production
according to job order In the production process the steel wires are
straightened before getting cut and covered The covered steel is assembled
and becomes a final product of espagnolette In this study the real data
concerning the demand for raw material in 52-weeks-period is analyzed
using EasyFit 56 Professional The weekly demand distribution is normal
with a mean of 99401 and a standard deviation of 88272 The fitting results
of demand are as follows
Table 1 Goodness of Fit ndash Summary
Distribution Kolmogorov
Smirnov
Anderson
Darling
Chi-Squared
Statistic Rank Statistic Rank Statistic Rank
1 Beta 011383 3 083336 2 48798 2
2 Normal 00695 1 028604 1 2172 1
3 Power Function 015086 4 26105 3 15789 3
4 Uniform 008854 2 80964 4 NA
Table 2 Descriptive Statistic Report
Statistic Value
Sample Size 52
Range 38
Mean 99401
Variance 7792
Std Deviation 88272
Coef of Variation 00888
Std Error 12241
Skewness 010317
Excess Kurtosis -037069
İ Z AKYURT
Siyaset Ekonomi ve Youmlnetim Araştırmaları Dergisi2016 Yıl 4 Cilt 4 Sayı 2 75
Figure 1 Demand Distribution Graph
Steel is supplied from France because of its high quality The company
imports steel by seaway If an order is placed it arrives after one two three
or four weeks with uniform distribution The fixed cost for placing an order
is euro100 and the variable cost for placing a unit is euro1 The unit cost per ton is
euro750 the holding cost for one ton is 15 of unit cost per year If weekly
demand canrsquot be satisfied from on hand inventory an emergency order is
placed by highway This order arrives instantaneously with a cost of euro300
per order Otherwise the production would stop So the total cost function is
given as in
119879119862 = 750119876 + 100 + 119876 +119909119899 + 119876
2lowast 2
119900119903
119879119862 = 750119876 + 100 + 119876 +119909119899 + 119876
2lowast 2 + 300 119863119899 gt 119909119899 + 119876
Unit cost is omitted since there is no discount in the model
The first method is genetic algorithms to calculate the reorder point and
replenishment point Genetic algorithms (GAs) is a population based
optimization technique developed by Holland (Reeves 1995 Goldberg
1989) Chromosome is a vector that represents the solution variables This
representation can not only be done with binary coding but with real values
as well With randomly selected values from the pre-determined value range
an initial solution is generated This group of solutions produced with the
number of chromosomes (population size) is called initial population Than
evaluates the quality of each solution candidates according to the problem-
specific fitness function Fitness function in our model is considered as
minimization of the total cost including holding cost penalty cost and
ordering cost New solution candidates are created by selecting relatively fit
members of the population and recombining them through various operators
Probability Density Function
Histogram Normal
x
12011611210810410096928884
f(x)
03
028
026
024
022
02
018
016
014
012
01
008
006
004
002
0
Reorder Point and Replenishment Point of Dynamic Inventory Model Under hellip
76 Research Journal of Politics Economics and Management 2016 Year4 Volume4 Issue2
selection crossover mutation (Allen amp Karjalainen 1999) The purpose of
parent selection in GAs is to offer additional reproductive chances to those
population members that are the fittest One commonly used technique the
roulette-wheel-selection is used for this proposed GAs The crossover is the
operator for solution space search It is procedure of creating new
chromosomes There are various versions of crossover In this paper one-
point crossover is used Mutation plays decidedly secondary role in the
operation of GAs ldquoIn artificial genetic systems the mutation operator
protects against such an irrecoverable lossrdquo (Goldberg 1989) In this study
real-value coding is used The steps of GAs are as follows
Step 1 Generation of initial population
Step 2 Evaluation of each individual
Step 3 Selection
Step 4 Crossover
Step 5 Mutation
Step 6 If stopping criteria is not met return to Step 2
Step 7 Select the best individual as a final solution (Kiremitci amp
Akyurt 2012)
GAs parameters used in calculation inventory model is given Table 3 GAs
was run for 100 times and the averages of the results are represented in
Table 4 The codes were generated MATLAB 85 (R2015a) and the
algorithm was run with an Intel(R) Core(TM) i73517U CPU 190 GHz
40 GB Ram configured PC In Table 4 it can be seen that better results are
reached when mutation rate is 02 and population size is 100 It is observed
that 1000 iterations are enough for the solution The reorder point is
approximately as 9 and the replenishment point is 109 Average inventory
cost is euro327 per week
Table 3 GAs Parameters for the Inventory Model
GAs Parameter Values
Iteration 5000
Population size 20 50 100
Crossover rate 100
Mutation Rate 1 10 20
İ Z AKYURT
Siyaset Ekonomi ve Youmlnetim Araştırmaları Dergisi2016 Yıl 4 Cilt 4 Sayı 2 77
Table 4 GAs Results for Different Population Sizes (ps)
Reorder
Point
Replenishment
Point
Average
TC(week)
GAs (ps20) 1423 11346 339
GAs (ps50) 1057 11049 332
GAs (ps100) 887 10913 327
The other method for determining reorder point and replenishment point is
simulation method which is applied using Microsoft Excel spreadsheet by
taking the mentioned cost function into account As seen in the Table 5 a
10x10 trial matrix is formulated The model searches the reorder point and
the replenishment point which result in minimum cost for predetermined
values In each iteration 52 weeks are simulated according to demand and
lead time structure This model runs for 1000 iterations In Table 5 the
repetition number of the minimum total cost is shown The reorder point is
calculated as 10 and the replenishment point is 110 and it is repeated for 188
times However 1000 iterations take 17 minutes with the same PC and it
takes longer compared to the genetic algorithms method In Table 6 average
weekly inventory cost can be seen for different values of reorder point and
replenishment point Itrsquos calculated through a 52-weeks simulation
Reorder Point and Replenishment Point of Dynamic Inventory Model Under hellip
78 Research Journal of Politics Economics and Management 2016 Year4 Volume4 Issue2
Table 5 Simulation Results
Replenishment Point (S)
110 115 120 125 130 135 140 145 150 155 Total
Re
ord
er P
oin
t (s)
10 188 140 24 4 6 2 0 0 0 0 364
15 148 80 18 2 4 0 0 0 0 0 252
20 80 52 12 4 4 4 0 0 0 0 156
25 32 14 0 4 2 0 0 0 0 0 52
30 58 6 2 0 0 0 0 0 0 0 66
35 26 8 0 0 0 0 0 0 0 0 34
40 28 6 0 0 0 0 0 0 0 0 34
45 20 4 0 0 0 0 0 0 0 0 24
50 4 0 0 0 0 0 0 0 0 0 4
55 12 2 0 0 0 0 0 0 0 0 14
Total 596 312 56 14 16 6 0 0 0 0 1000
İ Z AKYURT
Siyaset Ekonomi ve Youmlnetim Araştırmaları Dergisi2016 Yıl 4 Cilt 4 Sayı 2 79
Table 6 Average Weekly Costs for Different Values of Inventory Parameters
Reo
rder
Po
int (s)
Replenishment Point (S)
110 115 120 125 130 135 140 145 150 155
10 3329 3344 3401 3431 3450 3466 3497 3525 3564 3590
15 3346 3356 3403 3432 3457 3476 3503 3532 3563 3597
20 3361 3373 3424 3438 3469 3484 3508 3532 3573 3596
25 3377 3383 3443 3457 3477 3487 3505 3535 3569 3594
30 3375 3405 3458 3478 3502 3498 3518 3540 3577 3603
35 3395 3417 3477 3506 3528 3529 3538 3555 3591 3618
40 3408 3414 3485 3513 3535 3542 3555 3570 3589 3612
45 3412 3432 3495 3524 3549 3557 3574 3589 3601 3625
50 3411 3440 3496 3529 3552 3577 3596 3615 3631 3629
55 3422 3443 3510 3532 3560 3580 3610 3625 3649 3658
Reorder Point and Replenishment Point of Dynamic Inventory Model Under hellip
80 Research Journal of Politics Economics and Management 2016 Year4 Volume4 Issue2
Table 7 compares results of classic simulation and genetic algorithms
methods When the classic method is used average cost increases
dramatically because of that the reorder point in the formulation is high
Results of two other methods are close the result generated by genetic
algorithm is faster and has a lower cost The simulation formulates results
according presupposed intervals and therefore cannot generate solution
values directly
Table 7 Comparison of Results
Reor
der
Point
Replenish
ment
Point
Average
Cost(weekly)
Classic Method
420 527 785
GAs (ps100) 887 10913 327
Simulatio
n
10 110 333
Two-level genetic algorithmsrsquo results determined for each cost are given in
Table 8 As seen in the table when only holding cost increases model
parameters stay stable Similarly when only ordering cost increases
parameters stay again stable When both holding cost and ordering cost
increase parameters stay again stable but only total cost increases slightly
As penalty cost increases the reorder point increases dramatically and the
model converges to the base stock model (RS)
Table 8 Experimental Results for Different Costs (GAs)
Experiment
Number
Holding
Cost
Penalty
Cost
Ordering
Cost
Reorder
Point
s
Replenishment
Point S
Av
Weekly
Total
Cost euro
1 2 300 100 9 109 327
2 2 300 250 7 110 393
3 2 750 100 65 163 581
4 2 750 250 67 165 639
5 5 300 100 8 104 422
6 5 300 250 7 108 736
7 5 750 100 51 110 691
8 5 750 250 8 113 763
İ Z AKYURT
Siyaset Ekonomi ve Youmlnetim Araştırmaları Dergisi2016 Yıl 4 Cilt 4 Sayı 2 81
4 Results and Suggestions
In this study optional replenishment model is analyzed as an inventory
model Although this policy results in optimum values in practice it is hard
to determine parameters of reorder point (s) and replenishment point (S) In
order to determine these two points the demand structure is analyzed and a
cost function is formulated This function is compared with GAs codes
developed in MATLAB with the simulation developed in Microsoft Excel
Weekly average costs are calculated for different reorder and replenishment
points In the chosen case the demand for raw material is normal and its
lead time shows uniform distribution When the results are evaluated it is
seen that GAs constitutes a better alternative in terms of both time and cost
However the cost difference stems from increases of 10 units in the
simulation model When the classic method is used average cost increases
dramatically because of that the reorder point in the formulation is high
In addition in order to analyze the influence of cost change on reorder point
and replenishment point two levels are determined for holding cost penalty
cost and ordering cost The model is operated at these levels again by GAs
and the results reached are examined The examination shows that the main
cost effecting the model is the penalty cost As the penalty cost increases the
reorder point also increases Therefore the policy becomes the base stock
policy
With the help of some modifications in the structure of parameters of GAs
the solution time can be shortened Determining R as a variable the search
for a solution can be continued in a wider area Moreover the same model
can be used for various demand distributions and lead time distributions
References
Agrawal P M amp Sharda R (2012) Impact of frequency of alignment of
physical and information system inventories on out of stocks A
simulation study International Journal of Production
Economics 136(1) 45-55
Allen F amp Karjalainen R (1999) Using genetic algorithms to find
technical trading rules Journal of financial Economics 51(2) 245-
271
Arrow K J Harris T amp Marschak J (1951) Optimal inventory policy
Econometrica Journal of the Econometric Society 250-272
Bollapragada S amp Morton T E (1999) A simple heuristic for computing
nonstationary (s S) policies Operations Research 47(4) 576-584
Buchan J A amp Koenıgsberg E A (1966) Scientific inventory
management Prentice Hall
DeYong G D amp Cattani K D (2015) Fenced in Stochastic and
deterministic planning models in a time-fenced rolling-horizon
scheduling system European Journal of Operational Research
Reorder Point and Replenishment Point of Dynamic Inventory Model Under hellip
82 Research Journal of Politics Economics and Management 2016 Year4 Volume4 Issue2
Diabat A amp Deskoores R (2015) A hybrid genetic algorithm based
heuristic for an integrated supply chain problem Journal of
Manufacturing Systems
do Rego J R amp de Mesquita M A (2015) Demand forecasting and
inventory control A simulation study on automotive spare
parts International Journal of Production Economics 161 1-16
Duan Q amp Liao T W (2013) A new age-based replenishment policy for
supply chain inventory optimization of highly perishable products
International Journal of Production Economics 145(2) 658-671
Ehrhardt R (1979) The power approximation for computing (s S)
inventory policies Management Science 25(8) 777-786
Ehrhardt R (1984) (s S) policies for a dynamic inventory model with
stochastic lead times Operations Research 32(1) 121-132
Ehrhardt R amp Mosier C (1984) A revision of the power approximation
for computing (s S) policies Management Science 30(5) 618-622
Escuiacuten D Polo L amp Cipreacutes D (2016) On the comparison of inventory
replenishment policies with time-varying stochastic demand for the
paper industry Journal of Computational and Applied Mathematics
Freeland J R amp Porteus E L (1980) Evaluating the effectiveness of a
new method for computing approximately optimal (s S) inventory
policies Operations Research 28(2) 353-364
Garciacutea-Alvarado M S Paquet M amp Chaabane A (2015) On inventory
control of product recovery systems subject to environmental
mechanisms International Journal of Production Economics 165
132-144
Glover F amp Laguna M (1993) Modern heuristic techniques for
combinatorial problems Blackwell London
Goldberg D E (1989) Genetic algorithms in search and machine learning
Reading Addison Wesley
Hillier F S (1995) Introduction to operations research Tata McGraw-Hill
Education
Hwang H Choi B amp Lee M J (2005) A model for shelf space
allocation and inventory control considering location and inventory
level effects on demand International Journal of Production
Economics 97(2) 185-195
Iglehart D L (1963) Optimality of (s S) policies in the infinite horizon
dynamic inventory problem Management science 9(2) 259-267
Jana D K Das B amp Maiti M (2014) Multi-item partial backlogging
inventory models over random planning horizon in random fuzzy
environment Applied Soft Computing 21 12-27
İ Z AKYURT
Siyaset Ekonomi ve Youmlnetim Araştırmaları Dergisi2016 Yıl 4 Cilt 4 Sayı 2 83
Karlin S (1958) The Application of Renewal Theory to the Study of
Inventory Policies Chap 15 in Arrow KJ S Karlin and H
Scarf Studies in the Mathematical Theory of Inventory and
Production
Kouki C amp Jouini O (2015) On the effect of lifetime variability on the
performance of inventory systems International Journal of
Production Economics 167 23-34
Koumlchel Peter amp Nielaumlnder U (2005) Simulation-based optimization of
multi-echelon inventory systems International journal of production
economics 93 505-513
Larson C E Olson L J amp Sharma S (2001) Optimal inventory policies
when the demand distribution is not known Journal of economic
Theory 101(1) 281-300
Lin K P Chang P T Hung K C amp Pai P F (2010) A simulation of
vendor managed inventory dynamics using fuzzy arithmetic
operations with genetic algorithms Expert Systems with
Applications 37(3) 2571-2579
Maiti M K amp Maiti M (2006) Fuzzy inventory model with two
warehouses under possibility constraints Fuzzy Sets and
Systems 157(1) 52-73
Naddor E (1975) Optimal and heuristic decisions in single-and multi-item
inventory systems Management Science 21(11) 1234-1249
Nia A R Far M H amp Niaki S T A (2014) A fuzzy vendor managed
inventory of multi-item economic order quantity model under
shortage An ant colony optimization algorithm International
Journal of Production Economics 155 259-271
Nielsen C amp Larsen C (2005) An analytical study of the Q (s S) policy
applied to the joint replenishment problem European Journal of
Operational Research 163(3) 721-732
Porteus E L (1971) On the optimality of generalized (s S) policies
Management Science 17(7) 411-426
Rabta B amp Aiumlssani D (2005) Strong stability in an (R s S) inventory
model International Journal of Production Economics 97(2) 159-
171
Rezaei J amp Davoodi M (2011) Multi-objective models for lot-sizing with
supplier selection International Journal of Production
Economics 130(1) 77-86
Roberts D M (1962) Approximations to optimal policies in a dynamic
inventory model Studies in applied probability and management
science (7) 207
Reorder Point and Replenishment Point of Dynamic Inventory Model Under hellip
84 Research Journal of Politics Economics and Management 2016 Year4 Volume4 Issue2
Scarf H (1960) The Optimality of (s S) Policies in Dynamic Inventory
Problems K Arrow S Karlin P Suppes eds Mathematical
Models in the Social Sciences
Schneider H (1978) Methods for determining the re-order point of an (s S)
ordering policy when a service level is specified Journal of the
Operational Research Society 1181-1193
Sezen H K amp Erdoğmuş Ş (2005) Envanter Politikası Belirlemede
Benzetim Uygulaması 7 Ulusal Ekonometri ve İstatistik
Sempozyumu
Silver E A Pyke D F amp Peterson R (1998) Inventory management and
production planning and scheduling (Vol 3 p 30) New York
Wiley
Sivazlian B D (1971) Dimensional and computational analysis in
stationary (s S) inventory problems with gamma distributed
demand Management Science 17(6) B-307
Stevenson W J amp Sum C C (2009) Operations management (Vol 8)
Boston MA McGraw-HillIrwin
Taleizadeh A A Niaki S T A Aryanezhad M B amp Shafii N (2013)
A hybrid method of fuzzy simulation and genetic algorithm to
optimize constrained inventory control systems with stochastic
replenishments and fuzzy demand Information Sciences 220 425-
441
Thiel D Hovelaque V amp Le Hoa V T (2010) Impact of inventory
inaccuracy on service-level quality in (Q R) continuous-review lost-
sales inventory models International Journal of Production
Economics 123(2) 301-311
Tijms H C amp Groenevelt H (1984) Simple approximations for the
reorder point in periodic and continuous review (s S) inventory
systems with service level constraints European journal of
operational research 17(2) 175-190
Veinott Jr A F (1966) On the Optimality of (sS) Inventory Policies New
Conditions and a New Proof SIAM Journal on Applied
Mathematics 14(5) 1067-1083
Wagner H M (1975) Principle of Operations Research Englewood Cliff
White A S amp Censlive M (2015) Control system analysis of labor supply
flows in production systems Journal of Manufacturing Systems 37
316-327
Ye W amp You F (2016) A computationally efficient simulation-based
optimization method with region-wise surrogate modeling for
stochastic inventory management of supply chains with general
İ Z AKYURT
Siyaset Ekonomi ve Youmlnetim Araştırmaları Dergisi2016 Yıl 4 Cilt 4 Sayı 2 85
network structures Computers amp Chemical Engineering 87 164-
179
Yin K K Liu H amp Johnson N E (2002) Markovian inventory policy
with application to the paper industry Computers amp chemical
engineering 26(10) 1399-1413
Zheng Y S amp Federgruen A (1991) Finding optimal (s S) policies is
about as simple as evaluating a single policy Operations
research 39(4) 654-665
Zhou W Q Chen L amp Ge H M (2013) A multi-product multi-echelon
inventory control model with joint replenishment strategy Applied
Mathematical Modelling 37(4) 2039-2050
Reorder Point and Replenishment Point of Dynamic Inventory Model Under hellip
72 Research Journal of Politics Economics and Management 2016 Year4 Volume4 Issue2
formulated accordingly The new reorder and replenishment points are
compared
2 Dynamic Inventory Model
In single item inventory systems from the economical aspect of
replenishment order and stock out case this method can be managed to be
favorable in comparison to other models under certain assumptions
Consequently many studies had been achieved in the last century and many
are in progress In stochastic (R s S) inventory policy inventory position is
reviewed every R periods But the decision to order is given according to a
certain order point of inventory position determined previously If the
inventory position is equal to or lower than the reorder point (s) an order is
given to fill the inventory up to the replenishment point (S) If not no order
is given At the beginning of the period on hand inventory is displayed as nx
and transit inventory as 0Q The sum of these two values is called inventory
position The order quantity (Q) at the beginning of the period is calculated
as follows
0
0 0
0 n
n n
Q x Q s
Q S x Q x Q s
The total cost is calculated as in following equations
119879119862 = (119888119876) + (119862119904 + 119896 lowast 119876) + ((119909119899 + 119876
2) lowast (119888 lowast 119888ℎ)
119900119903
119879119862 = (119888119876) + (119862119904 + 119896 lowast 119876) + (119909119899 + 119876
2) lowast 119862ℎ + 119862119901 119863119899 gt 119909119899 + 119876
Where the
c Unit cost
119862ℎ Holding Cost percentage
119862119901 Penalty (stock out) Cost
119862119904 Ordering Cost (fixed)
k Variable ordering cost
TC Total cost
Dn Demand of n period
The classical method for solving the reorder point the replenishment point
and the review period is as follows
119877 = radic2119862119904
119863 lowast 119888 lowast 119862ℎ
İ Z AKYURT
Siyaset Ekonomi ve Youmlnetim Araştırmaları Dergisi2016 Yıl 4 Cilt 4 Sayı 2 73
119904 = 119863(119871 + 119877) + 119911radic(119871 + 119877)1205901198632 + 1198632120590119871
2
119878 = 119904 + 119876
119876 = radic2119862119904119863
119888 lowast 119862ℎ
Another model which is developed by Ehrhardt (1979) is called power
approximation method The model contains the ordering cost the holding
cost and the penalty (backorder) cost The review period and the lead time
are constant The average cost per period in infinite-horizon is analyzed
This method is an algorithm which helps to find approximate optimum
values of inventory model parameters by using mean demand micro and variance2 The parameters are calculated as follows
006910364 0498 2
0416 2 0603
(1463) ( ) ( 1)
( 1) ( 1) ( ) 0220 1142 2866
p s h
p
Q C C L
s L L z z
2( 1) ( 1)os L v L
22 exp( 2)
v
p p hx dx C C C
120583119871 = (119871 + 1)120583 119886119899119889 120590119871 = 120590radic119871 + 1
119876119901 = (1463)1205830364(119862119904
119862ℎ)0498120590119871
0138
119904119901 = 120583119871 + 1205901198710832(
1205902
120583)0817 [
0220
119911+ 1142 minus 2866119911]
(1 )
p
p h L
Qz
C C
If 15pQ p
p p
s s
S s Q
If not
min
min
p o
p p o
s s s
S s Q s
Reorder Point and Replenishment Point of Dynamic Inventory Model Under hellip
74 Research Journal of Politics Economics and Management 2016 Year4 Volume4 Issue2
3 Numerical Example
In this study real data is analyzed taken from a company which operates in
windows amp door industry in Turkey The company produces espagnolettes
and supplies them to the companies in the PVC window industry It is a
make to order supplier The main raw material used to produce espagnolettes
is 152mm225mm hot-rolled steel (refined steel) It is an A type inventory
item The company counts its inventory position at the beginning of any
week in tons and order is given or not based on the reorder point Therefore
it uses (RsS) inventory policy The refined steel is purchased as steel coils
of one ton counted and stored Every week it is forwarded to production
according to job order In the production process the steel wires are
straightened before getting cut and covered The covered steel is assembled
and becomes a final product of espagnolette In this study the real data
concerning the demand for raw material in 52-weeks-period is analyzed
using EasyFit 56 Professional The weekly demand distribution is normal
with a mean of 99401 and a standard deviation of 88272 The fitting results
of demand are as follows
Table 1 Goodness of Fit ndash Summary
Distribution Kolmogorov
Smirnov
Anderson
Darling
Chi-Squared
Statistic Rank Statistic Rank Statistic Rank
1 Beta 011383 3 083336 2 48798 2
2 Normal 00695 1 028604 1 2172 1
3 Power Function 015086 4 26105 3 15789 3
4 Uniform 008854 2 80964 4 NA
Table 2 Descriptive Statistic Report
Statistic Value
Sample Size 52
Range 38
Mean 99401
Variance 7792
Std Deviation 88272
Coef of Variation 00888
Std Error 12241
Skewness 010317
Excess Kurtosis -037069
İ Z AKYURT
Siyaset Ekonomi ve Youmlnetim Araştırmaları Dergisi2016 Yıl 4 Cilt 4 Sayı 2 75
Figure 1 Demand Distribution Graph
Steel is supplied from France because of its high quality The company
imports steel by seaway If an order is placed it arrives after one two three
or four weeks with uniform distribution The fixed cost for placing an order
is euro100 and the variable cost for placing a unit is euro1 The unit cost per ton is
euro750 the holding cost for one ton is 15 of unit cost per year If weekly
demand canrsquot be satisfied from on hand inventory an emergency order is
placed by highway This order arrives instantaneously with a cost of euro300
per order Otherwise the production would stop So the total cost function is
given as in
119879119862 = 750119876 + 100 + 119876 +119909119899 + 119876
2lowast 2
119900119903
119879119862 = 750119876 + 100 + 119876 +119909119899 + 119876
2lowast 2 + 300 119863119899 gt 119909119899 + 119876
Unit cost is omitted since there is no discount in the model
The first method is genetic algorithms to calculate the reorder point and
replenishment point Genetic algorithms (GAs) is a population based
optimization technique developed by Holland (Reeves 1995 Goldberg
1989) Chromosome is a vector that represents the solution variables This
representation can not only be done with binary coding but with real values
as well With randomly selected values from the pre-determined value range
an initial solution is generated This group of solutions produced with the
number of chromosomes (population size) is called initial population Than
evaluates the quality of each solution candidates according to the problem-
specific fitness function Fitness function in our model is considered as
minimization of the total cost including holding cost penalty cost and
ordering cost New solution candidates are created by selecting relatively fit
members of the population and recombining them through various operators
Probability Density Function
Histogram Normal
x
12011611210810410096928884
f(x)
03
028
026
024
022
02
018
016
014
012
01
008
006
004
002
0
Reorder Point and Replenishment Point of Dynamic Inventory Model Under hellip
76 Research Journal of Politics Economics and Management 2016 Year4 Volume4 Issue2
selection crossover mutation (Allen amp Karjalainen 1999) The purpose of
parent selection in GAs is to offer additional reproductive chances to those
population members that are the fittest One commonly used technique the
roulette-wheel-selection is used for this proposed GAs The crossover is the
operator for solution space search It is procedure of creating new
chromosomes There are various versions of crossover In this paper one-
point crossover is used Mutation plays decidedly secondary role in the
operation of GAs ldquoIn artificial genetic systems the mutation operator
protects against such an irrecoverable lossrdquo (Goldberg 1989) In this study
real-value coding is used The steps of GAs are as follows
Step 1 Generation of initial population
Step 2 Evaluation of each individual
Step 3 Selection
Step 4 Crossover
Step 5 Mutation
Step 6 If stopping criteria is not met return to Step 2
Step 7 Select the best individual as a final solution (Kiremitci amp
Akyurt 2012)
GAs parameters used in calculation inventory model is given Table 3 GAs
was run for 100 times and the averages of the results are represented in
Table 4 The codes were generated MATLAB 85 (R2015a) and the
algorithm was run with an Intel(R) Core(TM) i73517U CPU 190 GHz
40 GB Ram configured PC In Table 4 it can be seen that better results are
reached when mutation rate is 02 and population size is 100 It is observed
that 1000 iterations are enough for the solution The reorder point is
approximately as 9 and the replenishment point is 109 Average inventory
cost is euro327 per week
Table 3 GAs Parameters for the Inventory Model
GAs Parameter Values
Iteration 5000
Population size 20 50 100
Crossover rate 100
Mutation Rate 1 10 20
İ Z AKYURT
Siyaset Ekonomi ve Youmlnetim Araştırmaları Dergisi2016 Yıl 4 Cilt 4 Sayı 2 77
Table 4 GAs Results for Different Population Sizes (ps)
Reorder
Point
Replenishment
Point
Average
TC(week)
GAs (ps20) 1423 11346 339
GAs (ps50) 1057 11049 332
GAs (ps100) 887 10913 327
The other method for determining reorder point and replenishment point is
simulation method which is applied using Microsoft Excel spreadsheet by
taking the mentioned cost function into account As seen in the Table 5 a
10x10 trial matrix is formulated The model searches the reorder point and
the replenishment point which result in minimum cost for predetermined
values In each iteration 52 weeks are simulated according to demand and
lead time structure This model runs for 1000 iterations In Table 5 the
repetition number of the minimum total cost is shown The reorder point is
calculated as 10 and the replenishment point is 110 and it is repeated for 188
times However 1000 iterations take 17 minutes with the same PC and it
takes longer compared to the genetic algorithms method In Table 6 average
weekly inventory cost can be seen for different values of reorder point and
replenishment point Itrsquos calculated through a 52-weeks simulation
Reorder Point and Replenishment Point of Dynamic Inventory Model Under hellip
78 Research Journal of Politics Economics and Management 2016 Year4 Volume4 Issue2
Table 5 Simulation Results
Replenishment Point (S)
110 115 120 125 130 135 140 145 150 155 Total
Re
ord
er P
oin
t (s)
10 188 140 24 4 6 2 0 0 0 0 364
15 148 80 18 2 4 0 0 0 0 0 252
20 80 52 12 4 4 4 0 0 0 0 156
25 32 14 0 4 2 0 0 0 0 0 52
30 58 6 2 0 0 0 0 0 0 0 66
35 26 8 0 0 0 0 0 0 0 0 34
40 28 6 0 0 0 0 0 0 0 0 34
45 20 4 0 0 0 0 0 0 0 0 24
50 4 0 0 0 0 0 0 0 0 0 4
55 12 2 0 0 0 0 0 0 0 0 14
Total 596 312 56 14 16 6 0 0 0 0 1000
İ Z AKYURT
Siyaset Ekonomi ve Youmlnetim Araştırmaları Dergisi2016 Yıl 4 Cilt 4 Sayı 2 79
Table 6 Average Weekly Costs for Different Values of Inventory Parameters
Reo
rder
Po
int (s)
Replenishment Point (S)
110 115 120 125 130 135 140 145 150 155
10 3329 3344 3401 3431 3450 3466 3497 3525 3564 3590
15 3346 3356 3403 3432 3457 3476 3503 3532 3563 3597
20 3361 3373 3424 3438 3469 3484 3508 3532 3573 3596
25 3377 3383 3443 3457 3477 3487 3505 3535 3569 3594
30 3375 3405 3458 3478 3502 3498 3518 3540 3577 3603
35 3395 3417 3477 3506 3528 3529 3538 3555 3591 3618
40 3408 3414 3485 3513 3535 3542 3555 3570 3589 3612
45 3412 3432 3495 3524 3549 3557 3574 3589 3601 3625
50 3411 3440 3496 3529 3552 3577 3596 3615 3631 3629
55 3422 3443 3510 3532 3560 3580 3610 3625 3649 3658
Reorder Point and Replenishment Point of Dynamic Inventory Model Under hellip
80 Research Journal of Politics Economics and Management 2016 Year4 Volume4 Issue2
Table 7 compares results of classic simulation and genetic algorithms
methods When the classic method is used average cost increases
dramatically because of that the reorder point in the formulation is high
Results of two other methods are close the result generated by genetic
algorithm is faster and has a lower cost The simulation formulates results
according presupposed intervals and therefore cannot generate solution
values directly
Table 7 Comparison of Results
Reor
der
Point
Replenish
ment
Point
Average
Cost(weekly)
Classic Method
420 527 785
GAs (ps100) 887 10913 327
Simulatio
n
10 110 333
Two-level genetic algorithmsrsquo results determined for each cost are given in
Table 8 As seen in the table when only holding cost increases model
parameters stay stable Similarly when only ordering cost increases
parameters stay again stable When both holding cost and ordering cost
increase parameters stay again stable but only total cost increases slightly
As penalty cost increases the reorder point increases dramatically and the
model converges to the base stock model (RS)
Table 8 Experimental Results for Different Costs (GAs)
Experiment
Number
Holding
Cost
Penalty
Cost
Ordering
Cost
Reorder
Point
s
Replenishment
Point S
Av
Weekly
Total
Cost euro
1 2 300 100 9 109 327
2 2 300 250 7 110 393
3 2 750 100 65 163 581
4 2 750 250 67 165 639
5 5 300 100 8 104 422
6 5 300 250 7 108 736
7 5 750 100 51 110 691
8 5 750 250 8 113 763
İ Z AKYURT
Siyaset Ekonomi ve Youmlnetim Araştırmaları Dergisi2016 Yıl 4 Cilt 4 Sayı 2 81
4 Results and Suggestions
In this study optional replenishment model is analyzed as an inventory
model Although this policy results in optimum values in practice it is hard
to determine parameters of reorder point (s) and replenishment point (S) In
order to determine these two points the demand structure is analyzed and a
cost function is formulated This function is compared with GAs codes
developed in MATLAB with the simulation developed in Microsoft Excel
Weekly average costs are calculated for different reorder and replenishment
points In the chosen case the demand for raw material is normal and its
lead time shows uniform distribution When the results are evaluated it is
seen that GAs constitutes a better alternative in terms of both time and cost
However the cost difference stems from increases of 10 units in the
simulation model When the classic method is used average cost increases
dramatically because of that the reorder point in the formulation is high
In addition in order to analyze the influence of cost change on reorder point
and replenishment point two levels are determined for holding cost penalty
cost and ordering cost The model is operated at these levels again by GAs
and the results reached are examined The examination shows that the main
cost effecting the model is the penalty cost As the penalty cost increases the
reorder point also increases Therefore the policy becomes the base stock
policy
With the help of some modifications in the structure of parameters of GAs
the solution time can be shortened Determining R as a variable the search
for a solution can be continued in a wider area Moreover the same model
can be used for various demand distributions and lead time distributions
References
Agrawal P M amp Sharda R (2012) Impact of frequency of alignment of
physical and information system inventories on out of stocks A
simulation study International Journal of Production
Economics 136(1) 45-55
Allen F amp Karjalainen R (1999) Using genetic algorithms to find
technical trading rules Journal of financial Economics 51(2) 245-
271
Arrow K J Harris T amp Marschak J (1951) Optimal inventory policy
Econometrica Journal of the Econometric Society 250-272
Bollapragada S amp Morton T E (1999) A simple heuristic for computing
nonstationary (s S) policies Operations Research 47(4) 576-584
Buchan J A amp Koenıgsberg E A (1966) Scientific inventory
management Prentice Hall
DeYong G D amp Cattani K D (2015) Fenced in Stochastic and
deterministic planning models in a time-fenced rolling-horizon
scheduling system European Journal of Operational Research
Reorder Point and Replenishment Point of Dynamic Inventory Model Under hellip
82 Research Journal of Politics Economics and Management 2016 Year4 Volume4 Issue2
Diabat A amp Deskoores R (2015) A hybrid genetic algorithm based
heuristic for an integrated supply chain problem Journal of
Manufacturing Systems
do Rego J R amp de Mesquita M A (2015) Demand forecasting and
inventory control A simulation study on automotive spare
parts International Journal of Production Economics 161 1-16
Duan Q amp Liao T W (2013) A new age-based replenishment policy for
supply chain inventory optimization of highly perishable products
International Journal of Production Economics 145(2) 658-671
Ehrhardt R (1979) The power approximation for computing (s S)
inventory policies Management Science 25(8) 777-786
Ehrhardt R (1984) (s S) policies for a dynamic inventory model with
stochastic lead times Operations Research 32(1) 121-132
Ehrhardt R amp Mosier C (1984) A revision of the power approximation
for computing (s S) policies Management Science 30(5) 618-622
Escuiacuten D Polo L amp Cipreacutes D (2016) On the comparison of inventory
replenishment policies with time-varying stochastic demand for the
paper industry Journal of Computational and Applied Mathematics
Freeland J R amp Porteus E L (1980) Evaluating the effectiveness of a
new method for computing approximately optimal (s S) inventory
policies Operations Research 28(2) 353-364
Garciacutea-Alvarado M S Paquet M amp Chaabane A (2015) On inventory
control of product recovery systems subject to environmental
mechanisms International Journal of Production Economics 165
132-144
Glover F amp Laguna M (1993) Modern heuristic techniques for
combinatorial problems Blackwell London
Goldberg D E (1989) Genetic algorithms in search and machine learning
Reading Addison Wesley
Hillier F S (1995) Introduction to operations research Tata McGraw-Hill
Education
Hwang H Choi B amp Lee M J (2005) A model for shelf space
allocation and inventory control considering location and inventory
level effects on demand International Journal of Production
Economics 97(2) 185-195
Iglehart D L (1963) Optimality of (s S) policies in the infinite horizon
dynamic inventory problem Management science 9(2) 259-267
Jana D K Das B amp Maiti M (2014) Multi-item partial backlogging
inventory models over random planning horizon in random fuzzy
environment Applied Soft Computing 21 12-27
İ Z AKYURT
Siyaset Ekonomi ve Youmlnetim Araştırmaları Dergisi2016 Yıl 4 Cilt 4 Sayı 2 83
Karlin S (1958) The Application of Renewal Theory to the Study of
Inventory Policies Chap 15 in Arrow KJ S Karlin and H
Scarf Studies in the Mathematical Theory of Inventory and
Production
Kouki C amp Jouini O (2015) On the effect of lifetime variability on the
performance of inventory systems International Journal of
Production Economics 167 23-34
Koumlchel Peter amp Nielaumlnder U (2005) Simulation-based optimization of
multi-echelon inventory systems International journal of production
economics 93 505-513
Larson C E Olson L J amp Sharma S (2001) Optimal inventory policies
when the demand distribution is not known Journal of economic
Theory 101(1) 281-300
Lin K P Chang P T Hung K C amp Pai P F (2010) A simulation of
vendor managed inventory dynamics using fuzzy arithmetic
operations with genetic algorithms Expert Systems with
Applications 37(3) 2571-2579
Maiti M K amp Maiti M (2006) Fuzzy inventory model with two
warehouses under possibility constraints Fuzzy Sets and
Systems 157(1) 52-73
Naddor E (1975) Optimal and heuristic decisions in single-and multi-item
inventory systems Management Science 21(11) 1234-1249
Nia A R Far M H amp Niaki S T A (2014) A fuzzy vendor managed
inventory of multi-item economic order quantity model under
shortage An ant colony optimization algorithm International
Journal of Production Economics 155 259-271
Nielsen C amp Larsen C (2005) An analytical study of the Q (s S) policy
applied to the joint replenishment problem European Journal of
Operational Research 163(3) 721-732
Porteus E L (1971) On the optimality of generalized (s S) policies
Management Science 17(7) 411-426
Rabta B amp Aiumlssani D (2005) Strong stability in an (R s S) inventory
model International Journal of Production Economics 97(2) 159-
171
Rezaei J amp Davoodi M (2011) Multi-objective models for lot-sizing with
supplier selection International Journal of Production
Economics 130(1) 77-86
Roberts D M (1962) Approximations to optimal policies in a dynamic
inventory model Studies in applied probability and management
science (7) 207
Reorder Point and Replenishment Point of Dynamic Inventory Model Under hellip
84 Research Journal of Politics Economics and Management 2016 Year4 Volume4 Issue2
Scarf H (1960) The Optimality of (s S) Policies in Dynamic Inventory
Problems K Arrow S Karlin P Suppes eds Mathematical
Models in the Social Sciences
Schneider H (1978) Methods for determining the re-order point of an (s S)
ordering policy when a service level is specified Journal of the
Operational Research Society 1181-1193
Sezen H K amp Erdoğmuş Ş (2005) Envanter Politikası Belirlemede
Benzetim Uygulaması 7 Ulusal Ekonometri ve İstatistik
Sempozyumu
Silver E A Pyke D F amp Peterson R (1998) Inventory management and
production planning and scheduling (Vol 3 p 30) New York
Wiley
Sivazlian B D (1971) Dimensional and computational analysis in
stationary (s S) inventory problems with gamma distributed
demand Management Science 17(6) B-307
Stevenson W J amp Sum C C (2009) Operations management (Vol 8)
Boston MA McGraw-HillIrwin
Taleizadeh A A Niaki S T A Aryanezhad M B amp Shafii N (2013)
A hybrid method of fuzzy simulation and genetic algorithm to
optimize constrained inventory control systems with stochastic
replenishments and fuzzy demand Information Sciences 220 425-
441
Thiel D Hovelaque V amp Le Hoa V T (2010) Impact of inventory
inaccuracy on service-level quality in (Q R) continuous-review lost-
sales inventory models International Journal of Production
Economics 123(2) 301-311
Tijms H C amp Groenevelt H (1984) Simple approximations for the
reorder point in periodic and continuous review (s S) inventory
systems with service level constraints European journal of
operational research 17(2) 175-190
Veinott Jr A F (1966) On the Optimality of (sS) Inventory Policies New
Conditions and a New Proof SIAM Journal on Applied
Mathematics 14(5) 1067-1083
Wagner H M (1975) Principle of Operations Research Englewood Cliff
White A S amp Censlive M (2015) Control system analysis of labor supply
flows in production systems Journal of Manufacturing Systems 37
316-327
Ye W amp You F (2016) A computationally efficient simulation-based
optimization method with region-wise surrogate modeling for
stochastic inventory management of supply chains with general
İ Z AKYURT
Siyaset Ekonomi ve Youmlnetim Araştırmaları Dergisi2016 Yıl 4 Cilt 4 Sayı 2 85
network structures Computers amp Chemical Engineering 87 164-
179
Yin K K Liu H amp Johnson N E (2002) Markovian inventory policy
with application to the paper industry Computers amp chemical
engineering 26(10) 1399-1413
Zheng Y S amp Federgruen A (1991) Finding optimal (s S) policies is
about as simple as evaluating a single policy Operations
research 39(4) 654-665
Zhou W Q Chen L amp Ge H M (2013) A multi-product multi-echelon
inventory control model with joint replenishment strategy Applied
Mathematical Modelling 37(4) 2039-2050
İ Z AKYURT
Siyaset Ekonomi ve Youmlnetim Araştırmaları Dergisi2016 Yıl 4 Cilt 4 Sayı 2 73
119904 = 119863(119871 + 119877) + 119911radic(119871 + 119877)1205901198632 + 1198632120590119871
2
119878 = 119904 + 119876
119876 = radic2119862119904119863
119888 lowast 119862ℎ
Another model which is developed by Ehrhardt (1979) is called power
approximation method The model contains the ordering cost the holding
cost and the penalty (backorder) cost The review period and the lead time
are constant The average cost per period in infinite-horizon is analyzed
This method is an algorithm which helps to find approximate optimum
values of inventory model parameters by using mean demand micro and variance2 The parameters are calculated as follows
006910364 0498 2
0416 2 0603
(1463) ( ) ( 1)
( 1) ( 1) ( ) 0220 1142 2866
p s h
p
Q C C L
s L L z z
2( 1) ( 1)os L v L
22 exp( 2)
v
p p hx dx C C C
120583119871 = (119871 + 1)120583 119886119899119889 120590119871 = 120590radic119871 + 1
119876119901 = (1463)1205830364(119862119904
119862ℎ)0498120590119871
0138
119904119901 = 120583119871 + 1205901198710832(
1205902
120583)0817 [
0220
119911+ 1142 minus 2866119911]
(1 )
p
p h L
Qz
C C
If 15pQ p
p p
s s
S s Q
If not
min
min
p o
p p o
s s s
S s Q s
Reorder Point and Replenishment Point of Dynamic Inventory Model Under hellip
74 Research Journal of Politics Economics and Management 2016 Year4 Volume4 Issue2
3 Numerical Example
In this study real data is analyzed taken from a company which operates in
windows amp door industry in Turkey The company produces espagnolettes
and supplies them to the companies in the PVC window industry It is a
make to order supplier The main raw material used to produce espagnolettes
is 152mm225mm hot-rolled steel (refined steel) It is an A type inventory
item The company counts its inventory position at the beginning of any
week in tons and order is given or not based on the reorder point Therefore
it uses (RsS) inventory policy The refined steel is purchased as steel coils
of one ton counted and stored Every week it is forwarded to production
according to job order In the production process the steel wires are
straightened before getting cut and covered The covered steel is assembled
and becomes a final product of espagnolette In this study the real data
concerning the demand for raw material in 52-weeks-period is analyzed
using EasyFit 56 Professional The weekly demand distribution is normal
with a mean of 99401 and a standard deviation of 88272 The fitting results
of demand are as follows
Table 1 Goodness of Fit ndash Summary
Distribution Kolmogorov
Smirnov
Anderson
Darling
Chi-Squared
Statistic Rank Statistic Rank Statistic Rank
1 Beta 011383 3 083336 2 48798 2
2 Normal 00695 1 028604 1 2172 1
3 Power Function 015086 4 26105 3 15789 3
4 Uniform 008854 2 80964 4 NA
Table 2 Descriptive Statistic Report
Statistic Value
Sample Size 52
Range 38
Mean 99401
Variance 7792
Std Deviation 88272
Coef of Variation 00888
Std Error 12241
Skewness 010317
Excess Kurtosis -037069
İ Z AKYURT
Siyaset Ekonomi ve Youmlnetim Araştırmaları Dergisi2016 Yıl 4 Cilt 4 Sayı 2 75
Figure 1 Demand Distribution Graph
Steel is supplied from France because of its high quality The company
imports steel by seaway If an order is placed it arrives after one two three
or four weeks with uniform distribution The fixed cost for placing an order
is euro100 and the variable cost for placing a unit is euro1 The unit cost per ton is
euro750 the holding cost for one ton is 15 of unit cost per year If weekly
demand canrsquot be satisfied from on hand inventory an emergency order is
placed by highway This order arrives instantaneously with a cost of euro300
per order Otherwise the production would stop So the total cost function is
given as in
119879119862 = 750119876 + 100 + 119876 +119909119899 + 119876
2lowast 2
119900119903
119879119862 = 750119876 + 100 + 119876 +119909119899 + 119876
2lowast 2 + 300 119863119899 gt 119909119899 + 119876
Unit cost is omitted since there is no discount in the model
The first method is genetic algorithms to calculate the reorder point and
replenishment point Genetic algorithms (GAs) is a population based
optimization technique developed by Holland (Reeves 1995 Goldberg
1989) Chromosome is a vector that represents the solution variables This
representation can not only be done with binary coding but with real values
as well With randomly selected values from the pre-determined value range
an initial solution is generated This group of solutions produced with the
number of chromosomes (population size) is called initial population Than
evaluates the quality of each solution candidates according to the problem-
specific fitness function Fitness function in our model is considered as
minimization of the total cost including holding cost penalty cost and
ordering cost New solution candidates are created by selecting relatively fit
members of the population and recombining them through various operators
Probability Density Function
Histogram Normal
x
12011611210810410096928884
f(x)
03
028
026
024
022
02
018
016
014
012
01
008
006
004
002
0
Reorder Point and Replenishment Point of Dynamic Inventory Model Under hellip
76 Research Journal of Politics Economics and Management 2016 Year4 Volume4 Issue2
selection crossover mutation (Allen amp Karjalainen 1999) The purpose of
parent selection in GAs is to offer additional reproductive chances to those
population members that are the fittest One commonly used technique the
roulette-wheel-selection is used for this proposed GAs The crossover is the
operator for solution space search It is procedure of creating new
chromosomes There are various versions of crossover In this paper one-
point crossover is used Mutation plays decidedly secondary role in the
operation of GAs ldquoIn artificial genetic systems the mutation operator
protects against such an irrecoverable lossrdquo (Goldberg 1989) In this study
real-value coding is used The steps of GAs are as follows
Step 1 Generation of initial population
Step 2 Evaluation of each individual
Step 3 Selection
Step 4 Crossover
Step 5 Mutation
Step 6 If stopping criteria is not met return to Step 2
Step 7 Select the best individual as a final solution (Kiremitci amp
Akyurt 2012)
GAs parameters used in calculation inventory model is given Table 3 GAs
was run for 100 times and the averages of the results are represented in
Table 4 The codes were generated MATLAB 85 (R2015a) and the
algorithm was run with an Intel(R) Core(TM) i73517U CPU 190 GHz
40 GB Ram configured PC In Table 4 it can be seen that better results are
reached when mutation rate is 02 and population size is 100 It is observed
that 1000 iterations are enough for the solution The reorder point is
approximately as 9 and the replenishment point is 109 Average inventory
cost is euro327 per week
Table 3 GAs Parameters for the Inventory Model
GAs Parameter Values
Iteration 5000
Population size 20 50 100
Crossover rate 100
Mutation Rate 1 10 20
İ Z AKYURT
Siyaset Ekonomi ve Youmlnetim Araştırmaları Dergisi2016 Yıl 4 Cilt 4 Sayı 2 77
Table 4 GAs Results for Different Population Sizes (ps)
Reorder
Point
Replenishment
Point
Average
TC(week)
GAs (ps20) 1423 11346 339
GAs (ps50) 1057 11049 332
GAs (ps100) 887 10913 327
The other method for determining reorder point and replenishment point is
simulation method which is applied using Microsoft Excel spreadsheet by
taking the mentioned cost function into account As seen in the Table 5 a
10x10 trial matrix is formulated The model searches the reorder point and
the replenishment point which result in minimum cost for predetermined
values In each iteration 52 weeks are simulated according to demand and
lead time structure This model runs for 1000 iterations In Table 5 the
repetition number of the minimum total cost is shown The reorder point is
calculated as 10 and the replenishment point is 110 and it is repeated for 188
times However 1000 iterations take 17 minutes with the same PC and it
takes longer compared to the genetic algorithms method In Table 6 average
weekly inventory cost can be seen for different values of reorder point and
replenishment point Itrsquos calculated through a 52-weeks simulation
Reorder Point and Replenishment Point of Dynamic Inventory Model Under hellip
78 Research Journal of Politics Economics and Management 2016 Year4 Volume4 Issue2
Table 5 Simulation Results
Replenishment Point (S)
110 115 120 125 130 135 140 145 150 155 Total
Re
ord
er P
oin
t (s)
10 188 140 24 4 6 2 0 0 0 0 364
15 148 80 18 2 4 0 0 0 0 0 252
20 80 52 12 4 4 4 0 0 0 0 156
25 32 14 0 4 2 0 0 0 0 0 52
30 58 6 2 0 0 0 0 0 0 0 66
35 26 8 0 0 0 0 0 0 0 0 34
40 28 6 0 0 0 0 0 0 0 0 34
45 20 4 0 0 0 0 0 0 0 0 24
50 4 0 0 0 0 0 0 0 0 0 4
55 12 2 0 0 0 0 0 0 0 0 14
Total 596 312 56 14 16 6 0 0 0 0 1000
İ Z AKYURT
Siyaset Ekonomi ve Youmlnetim Araştırmaları Dergisi2016 Yıl 4 Cilt 4 Sayı 2 79
Table 6 Average Weekly Costs for Different Values of Inventory Parameters
Reo
rder
Po
int (s)
Replenishment Point (S)
110 115 120 125 130 135 140 145 150 155
10 3329 3344 3401 3431 3450 3466 3497 3525 3564 3590
15 3346 3356 3403 3432 3457 3476 3503 3532 3563 3597
20 3361 3373 3424 3438 3469 3484 3508 3532 3573 3596
25 3377 3383 3443 3457 3477 3487 3505 3535 3569 3594
30 3375 3405 3458 3478 3502 3498 3518 3540 3577 3603
35 3395 3417 3477 3506 3528 3529 3538 3555 3591 3618
40 3408 3414 3485 3513 3535 3542 3555 3570 3589 3612
45 3412 3432 3495 3524 3549 3557 3574 3589 3601 3625
50 3411 3440 3496 3529 3552 3577 3596 3615 3631 3629
55 3422 3443 3510 3532 3560 3580 3610 3625 3649 3658
Reorder Point and Replenishment Point of Dynamic Inventory Model Under hellip
80 Research Journal of Politics Economics and Management 2016 Year4 Volume4 Issue2
Table 7 compares results of classic simulation and genetic algorithms
methods When the classic method is used average cost increases
dramatically because of that the reorder point in the formulation is high
Results of two other methods are close the result generated by genetic
algorithm is faster and has a lower cost The simulation formulates results
according presupposed intervals and therefore cannot generate solution
values directly
Table 7 Comparison of Results
Reor
der
Point
Replenish
ment
Point
Average
Cost(weekly)
Classic Method
420 527 785
GAs (ps100) 887 10913 327
Simulatio
n
10 110 333
Two-level genetic algorithmsrsquo results determined for each cost are given in
Table 8 As seen in the table when only holding cost increases model
parameters stay stable Similarly when only ordering cost increases
parameters stay again stable When both holding cost and ordering cost
increase parameters stay again stable but only total cost increases slightly
As penalty cost increases the reorder point increases dramatically and the
model converges to the base stock model (RS)
Table 8 Experimental Results for Different Costs (GAs)
Experiment
Number
Holding
Cost
Penalty
Cost
Ordering
Cost
Reorder
Point
s
Replenishment
Point S
Av
Weekly
Total
Cost euro
1 2 300 100 9 109 327
2 2 300 250 7 110 393
3 2 750 100 65 163 581
4 2 750 250 67 165 639
5 5 300 100 8 104 422
6 5 300 250 7 108 736
7 5 750 100 51 110 691
8 5 750 250 8 113 763
İ Z AKYURT
Siyaset Ekonomi ve Youmlnetim Araştırmaları Dergisi2016 Yıl 4 Cilt 4 Sayı 2 81
4 Results and Suggestions
In this study optional replenishment model is analyzed as an inventory
model Although this policy results in optimum values in practice it is hard
to determine parameters of reorder point (s) and replenishment point (S) In
order to determine these two points the demand structure is analyzed and a
cost function is formulated This function is compared with GAs codes
developed in MATLAB with the simulation developed in Microsoft Excel
Weekly average costs are calculated for different reorder and replenishment
points In the chosen case the demand for raw material is normal and its
lead time shows uniform distribution When the results are evaluated it is
seen that GAs constitutes a better alternative in terms of both time and cost
However the cost difference stems from increases of 10 units in the
simulation model When the classic method is used average cost increases
dramatically because of that the reorder point in the formulation is high
In addition in order to analyze the influence of cost change on reorder point
and replenishment point two levels are determined for holding cost penalty
cost and ordering cost The model is operated at these levels again by GAs
and the results reached are examined The examination shows that the main
cost effecting the model is the penalty cost As the penalty cost increases the
reorder point also increases Therefore the policy becomes the base stock
policy
With the help of some modifications in the structure of parameters of GAs
the solution time can be shortened Determining R as a variable the search
for a solution can be continued in a wider area Moreover the same model
can be used for various demand distributions and lead time distributions
References
Agrawal P M amp Sharda R (2012) Impact of frequency of alignment of
physical and information system inventories on out of stocks A
simulation study International Journal of Production
Economics 136(1) 45-55
Allen F amp Karjalainen R (1999) Using genetic algorithms to find
technical trading rules Journal of financial Economics 51(2) 245-
271
Arrow K J Harris T amp Marschak J (1951) Optimal inventory policy
Econometrica Journal of the Econometric Society 250-272
Bollapragada S amp Morton T E (1999) A simple heuristic for computing
nonstationary (s S) policies Operations Research 47(4) 576-584
Buchan J A amp Koenıgsberg E A (1966) Scientific inventory
management Prentice Hall
DeYong G D amp Cattani K D (2015) Fenced in Stochastic and
deterministic planning models in a time-fenced rolling-horizon
scheduling system European Journal of Operational Research
Reorder Point and Replenishment Point of Dynamic Inventory Model Under hellip
82 Research Journal of Politics Economics and Management 2016 Year4 Volume4 Issue2
Diabat A amp Deskoores R (2015) A hybrid genetic algorithm based
heuristic for an integrated supply chain problem Journal of
Manufacturing Systems
do Rego J R amp de Mesquita M A (2015) Demand forecasting and
inventory control A simulation study on automotive spare
parts International Journal of Production Economics 161 1-16
Duan Q amp Liao T W (2013) A new age-based replenishment policy for
supply chain inventory optimization of highly perishable products
International Journal of Production Economics 145(2) 658-671
Ehrhardt R (1979) The power approximation for computing (s S)
inventory policies Management Science 25(8) 777-786
Ehrhardt R (1984) (s S) policies for a dynamic inventory model with
stochastic lead times Operations Research 32(1) 121-132
Ehrhardt R amp Mosier C (1984) A revision of the power approximation
for computing (s S) policies Management Science 30(5) 618-622
Escuiacuten D Polo L amp Cipreacutes D (2016) On the comparison of inventory
replenishment policies with time-varying stochastic demand for the
paper industry Journal of Computational and Applied Mathematics
Freeland J R amp Porteus E L (1980) Evaluating the effectiveness of a
new method for computing approximately optimal (s S) inventory
policies Operations Research 28(2) 353-364
Garciacutea-Alvarado M S Paquet M amp Chaabane A (2015) On inventory
control of product recovery systems subject to environmental
mechanisms International Journal of Production Economics 165
132-144
Glover F amp Laguna M (1993) Modern heuristic techniques for
combinatorial problems Blackwell London
Goldberg D E (1989) Genetic algorithms in search and machine learning
Reading Addison Wesley
Hillier F S (1995) Introduction to operations research Tata McGraw-Hill
Education
Hwang H Choi B amp Lee M J (2005) A model for shelf space
allocation and inventory control considering location and inventory
level effects on demand International Journal of Production
Economics 97(2) 185-195
Iglehart D L (1963) Optimality of (s S) policies in the infinite horizon
dynamic inventory problem Management science 9(2) 259-267
Jana D K Das B amp Maiti M (2014) Multi-item partial backlogging
inventory models over random planning horizon in random fuzzy
environment Applied Soft Computing 21 12-27
İ Z AKYURT
Siyaset Ekonomi ve Youmlnetim Araştırmaları Dergisi2016 Yıl 4 Cilt 4 Sayı 2 83
Karlin S (1958) The Application of Renewal Theory to the Study of
Inventory Policies Chap 15 in Arrow KJ S Karlin and H
Scarf Studies in the Mathematical Theory of Inventory and
Production
Kouki C amp Jouini O (2015) On the effect of lifetime variability on the
performance of inventory systems International Journal of
Production Economics 167 23-34
Koumlchel Peter amp Nielaumlnder U (2005) Simulation-based optimization of
multi-echelon inventory systems International journal of production
economics 93 505-513
Larson C E Olson L J amp Sharma S (2001) Optimal inventory policies
when the demand distribution is not known Journal of economic
Theory 101(1) 281-300
Lin K P Chang P T Hung K C amp Pai P F (2010) A simulation of
vendor managed inventory dynamics using fuzzy arithmetic
operations with genetic algorithms Expert Systems with
Applications 37(3) 2571-2579
Maiti M K amp Maiti M (2006) Fuzzy inventory model with two
warehouses under possibility constraints Fuzzy Sets and
Systems 157(1) 52-73
Naddor E (1975) Optimal and heuristic decisions in single-and multi-item
inventory systems Management Science 21(11) 1234-1249
Nia A R Far M H amp Niaki S T A (2014) A fuzzy vendor managed
inventory of multi-item economic order quantity model under
shortage An ant colony optimization algorithm International
Journal of Production Economics 155 259-271
Nielsen C amp Larsen C (2005) An analytical study of the Q (s S) policy
applied to the joint replenishment problem European Journal of
Operational Research 163(3) 721-732
Porteus E L (1971) On the optimality of generalized (s S) policies
Management Science 17(7) 411-426
Rabta B amp Aiumlssani D (2005) Strong stability in an (R s S) inventory
model International Journal of Production Economics 97(2) 159-
171
Rezaei J amp Davoodi M (2011) Multi-objective models for lot-sizing with
supplier selection International Journal of Production
Economics 130(1) 77-86
Roberts D M (1962) Approximations to optimal policies in a dynamic
inventory model Studies in applied probability and management
science (7) 207
Reorder Point and Replenishment Point of Dynamic Inventory Model Under hellip
84 Research Journal of Politics Economics and Management 2016 Year4 Volume4 Issue2
Scarf H (1960) The Optimality of (s S) Policies in Dynamic Inventory
Problems K Arrow S Karlin P Suppes eds Mathematical
Models in the Social Sciences
Schneider H (1978) Methods for determining the re-order point of an (s S)
ordering policy when a service level is specified Journal of the
Operational Research Society 1181-1193
Sezen H K amp Erdoğmuş Ş (2005) Envanter Politikası Belirlemede
Benzetim Uygulaması 7 Ulusal Ekonometri ve İstatistik
Sempozyumu
Silver E A Pyke D F amp Peterson R (1998) Inventory management and
production planning and scheduling (Vol 3 p 30) New York
Wiley
Sivazlian B D (1971) Dimensional and computational analysis in
stationary (s S) inventory problems with gamma distributed
demand Management Science 17(6) B-307
Stevenson W J amp Sum C C (2009) Operations management (Vol 8)
Boston MA McGraw-HillIrwin
Taleizadeh A A Niaki S T A Aryanezhad M B amp Shafii N (2013)
A hybrid method of fuzzy simulation and genetic algorithm to
optimize constrained inventory control systems with stochastic
replenishments and fuzzy demand Information Sciences 220 425-
441
Thiel D Hovelaque V amp Le Hoa V T (2010) Impact of inventory
inaccuracy on service-level quality in (Q R) continuous-review lost-
sales inventory models International Journal of Production
Economics 123(2) 301-311
Tijms H C amp Groenevelt H (1984) Simple approximations for the
reorder point in periodic and continuous review (s S) inventory
systems with service level constraints European journal of
operational research 17(2) 175-190
Veinott Jr A F (1966) On the Optimality of (sS) Inventory Policies New
Conditions and a New Proof SIAM Journal on Applied
Mathematics 14(5) 1067-1083
Wagner H M (1975) Principle of Operations Research Englewood Cliff
White A S amp Censlive M (2015) Control system analysis of labor supply
flows in production systems Journal of Manufacturing Systems 37
316-327
Ye W amp You F (2016) A computationally efficient simulation-based
optimization method with region-wise surrogate modeling for
stochastic inventory management of supply chains with general
İ Z AKYURT
Siyaset Ekonomi ve Youmlnetim Araştırmaları Dergisi2016 Yıl 4 Cilt 4 Sayı 2 85
network structures Computers amp Chemical Engineering 87 164-
179
Yin K K Liu H amp Johnson N E (2002) Markovian inventory policy
with application to the paper industry Computers amp chemical
engineering 26(10) 1399-1413
Zheng Y S amp Federgruen A (1991) Finding optimal (s S) policies is
about as simple as evaluating a single policy Operations
research 39(4) 654-665
Zhou W Q Chen L amp Ge H M (2013) A multi-product multi-echelon
inventory control model with joint replenishment strategy Applied
Mathematical Modelling 37(4) 2039-2050
Reorder Point and Replenishment Point of Dynamic Inventory Model Under hellip
74 Research Journal of Politics Economics and Management 2016 Year4 Volume4 Issue2
3 Numerical Example
In this study real data is analyzed taken from a company which operates in
windows amp door industry in Turkey The company produces espagnolettes
and supplies them to the companies in the PVC window industry It is a
make to order supplier The main raw material used to produce espagnolettes
is 152mm225mm hot-rolled steel (refined steel) It is an A type inventory
item The company counts its inventory position at the beginning of any
week in tons and order is given or not based on the reorder point Therefore
it uses (RsS) inventory policy The refined steel is purchased as steel coils
of one ton counted and stored Every week it is forwarded to production
according to job order In the production process the steel wires are
straightened before getting cut and covered The covered steel is assembled
and becomes a final product of espagnolette In this study the real data
concerning the demand for raw material in 52-weeks-period is analyzed
using EasyFit 56 Professional The weekly demand distribution is normal
with a mean of 99401 and a standard deviation of 88272 The fitting results
of demand are as follows
Table 1 Goodness of Fit ndash Summary
Distribution Kolmogorov
Smirnov
Anderson
Darling
Chi-Squared
Statistic Rank Statistic Rank Statistic Rank
1 Beta 011383 3 083336 2 48798 2
2 Normal 00695 1 028604 1 2172 1
3 Power Function 015086 4 26105 3 15789 3
4 Uniform 008854 2 80964 4 NA
Table 2 Descriptive Statistic Report
Statistic Value
Sample Size 52
Range 38
Mean 99401
Variance 7792
Std Deviation 88272
Coef of Variation 00888
Std Error 12241
Skewness 010317
Excess Kurtosis -037069
İ Z AKYURT
Siyaset Ekonomi ve Youmlnetim Araştırmaları Dergisi2016 Yıl 4 Cilt 4 Sayı 2 75
Figure 1 Demand Distribution Graph
Steel is supplied from France because of its high quality The company
imports steel by seaway If an order is placed it arrives after one two three
or four weeks with uniform distribution The fixed cost for placing an order
is euro100 and the variable cost for placing a unit is euro1 The unit cost per ton is
euro750 the holding cost for one ton is 15 of unit cost per year If weekly
demand canrsquot be satisfied from on hand inventory an emergency order is
placed by highway This order arrives instantaneously with a cost of euro300
per order Otherwise the production would stop So the total cost function is
given as in
119879119862 = 750119876 + 100 + 119876 +119909119899 + 119876
2lowast 2
119900119903
119879119862 = 750119876 + 100 + 119876 +119909119899 + 119876
2lowast 2 + 300 119863119899 gt 119909119899 + 119876
Unit cost is omitted since there is no discount in the model
The first method is genetic algorithms to calculate the reorder point and
replenishment point Genetic algorithms (GAs) is a population based
optimization technique developed by Holland (Reeves 1995 Goldberg
1989) Chromosome is a vector that represents the solution variables This
representation can not only be done with binary coding but with real values
as well With randomly selected values from the pre-determined value range
an initial solution is generated This group of solutions produced with the
number of chromosomes (population size) is called initial population Than
evaluates the quality of each solution candidates according to the problem-
specific fitness function Fitness function in our model is considered as
minimization of the total cost including holding cost penalty cost and
ordering cost New solution candidates are created by selecting relatively fit
members of the population and recombining them through various operators
Probability Density Function
Histogram Normal
x
12011611210810410096928884
f(x)
03
028
026
024
022
02
018
016
014
012
01
008
006
004
002
0
Reorder Point and Replenishment Point of Dynamic Inventory Model Under hellip
76 Research Journal of Politics Economics and Management 2016 Year4 Volume4 Issue2
selection crossover mutation (Allen amp Karjalainen 1999) The purpose of
parent selection in GAs is to offer additional reproductive chances to those
population members that are the fittest One commonly used technique the
roulette-wheel-selection is used for this proposed GAs The crossover is the
operator for solution space search It is procedure of creating new
chromosomes There are various versions of crossover In this paper one-
point crossover is used Mutation plays decidedly secondary role in the
operation of GAs ldquoIn artificial genetic systems the mutation operator
protects against such an irrecoverable lossrdquo (Goldberg 1989) In this study
real-value coding is used The steps of GAs are as follows
Step 1 Generation of initial population
Step 2 Evaluation of each individual
Step 3 Selection
Step 4 Crossover
Step 5 Mutation
Step 6 If stopping criteria is not met return to Step 2
Step 7 Select the best individual as a final solution (Kiremitci amp
Akyurt 2012)
GAs parameters used in calculation inventory model is given Table 3 GAs
was run for 100 times and the averages of the results are represented in
Table 4 The codes were generated MATLAB 85 (R2015a) and the
algorithm was run with an Intel(R) Core(TM) i73517U CPU 190 GHz
40 GB Ram configured PC In Table 4 it can be seen that better results are
reached when mutation rate is 02 and population size is 100 It is observed
that 1000 iterations are enough for the solution The reorder point is
approximately as 9 and the replenishment point is 109 Average inventory
cost is euro327 per week
Table 3 GAs Parameters for the Inventory Model
GAs Parameter Values
Iteration 5000
Population size 20 50 100
Crossover rate 100
Mutation Rate 1 10 20
İ Z AKYURT
Siyaset Ekonomi ve Youmlnetim Araştırmaları Dergisi2016 Yıl 4 Cilt 4 Sayı 2 77
Table 4 GAs Results for Different Population Sizes (ps)
Reorder
Point
Replenishment
Point
Average
TC(week)
GAs (ps20) 1423 11346 339
GAs (ps50) 1057 11049 332
GAs (ps100) 887 10913 327
The other method for determining reorder point and replenishment point is
simulation method which is applied using Microsoft Excel spreadsheet by
taking the mentioned cost function into account As seen in the Table 5 a
10x10 trial matrix is formulated The model searches the reorder point and
the replenishment point which result in minimum cost for predetermined
values In each iteration 52 weeks are simulated according to demand and
lead time structure This model runs for 1000 iterations In Table 5 the
repetition number of the minimum total cost is shown The reorder point is
calculated as 10 and the replenishment point is 110 and it is repeated for 188
times However 1000 iterations take 17 minutes with the same PC and it
takes longer compared to the genetic algorithms method In Table 6 average
weekly inventory cost can be seen for different values of reorder point and
replenishment point Itrsquos calculated through a 52-weeks simulation
Reorder Point and Replenishment Point of Dynamic Inventory Model Under hellip
78 Research Journal of Politics Economics and Management 2016 Year4 Volume4 Issue2
Table 5 Simulation Results
Replenishment Point (S)
110 115 120 125 130 135 140 145 150 155 Total
Re
ord
er P
oin
t (s)
10 188 140 24 4 6 2 0 0 0 0 364
15 148 80 18 2 4 0 0 0 0 0 252
20 80 52 12 4 4 4 0 0 0 0 156
25 32 14 0 4 2 0 0 0 0 0 52
30 58 6 2 0 0 0 0 0 0 0 66
35 26 8 0 0 0 0 0 0 0 0 34
40 28 6 0 0 0 0 0 0 0 0 34
45 20 4 0 0 0 0 0 0 0 0 24
50 4 0 0 0 0 0 0 0 0 0 4
55 12 2 0 0 0 0 0 0 0 0 14
Total 596 312 56 14 16 6 0 0 0 0 1000
İ Z AKYURT
Siyaset Ekonomi ve Youmlnetim Araştırmaları Dergisi2016 Yıl 4 Cilt 4 Sayı 2 79
Table 6 Average Weekly Costs for Different Values of Inventory Parameters
Reo
rder
Po
int (s)
Replenishment Point (S)
110 115 120 125 130 135 140 145 150 155
10 3329 3344 3401 3431 3450 3466 3497 3525 3564 3590
15 3346 3356 3403 3432 3457 3476 3503 3532 3563 3597
20 3361 3373 3424 3438 3469 3484 3508 3532 3573 3596
25 3377 3383 3443 3457 3477 3487 3505 3535 3569 3594
30 3375 3405 3458 3478 3502 3498 3518 3540 3577 3603
35 3395 3417 3477 3506 3528 3529 3538 3555 3591 3618
40 3408 3414 3485 3513 3535 3542 3555 3570 3589 3612
45 3412 3432 3495 3524 3549 3557 3574 3589 3601 3625
50 3411 3440 3496 3529 3552 3577 3596 3615 3631 3629
55 3422 3443 3510 3532 3560 3580 3610 3625 3649 3658
Reorder Point and Replenishment Point of Dynamic Inventory Model Under hellip
80 Research Journal of Politics Economics and Management 2016 Year4 Volume4 Issue2
Table 7 compares results of classic simulation and genetic algorithms
methods When the classic method is used average cost increases
dramatically because of that the reorder point in the formulation is high
Results of two other methods are close the result generated by genetic
algorithm is faster and has a lower cost The simulation formulates results
according presupposed intervals and therefore cannot generate solution
values directly
Table 7 Comparison of Results
Reor
der
Point
Replenish
ment
Point
Average
Cost(weekly)
Classic Method
420 527 785
GAs (ps100) 887 10913 327
Simulatio
n
10 110 333
Two-level genetic algorithmsrsquo results determined for each cost are given in
Table 8 As seen in the table when only holding cost increases model
parameters stay stable Similarly when only ordering cost increases
parameters stay again stable When both holding cost and ordering cost
increase parameters stay again stable but only total cost increases slightly
As penalty cost increases the reorder point increases dramatically and the
model converges to the base stock model (RS)
Table 8 Experimental Results for Different Costs (GAs)
Experiment
Number
Holding
Cost
Penalty
Cost
Ordering
Cost
Reorder
Point
s
Replenishment
Point S
Av
Weekly
Total
Cost euro
1 2 300 100 9 109 327
2 2 300 250 7 110 393
3 2 750 100 65 163 581
4 2 750 250 67 165 639
5 5 300 100 8 104 422
6 5 300 250 7 108 736
7 5 750 100 51 110 691
8 5 750 250 8 113 763
İ Z AKYURT
Siyaset Ekonomi ve Youmlnetim Araştırmaları Dergisi2016 Yıl 4 Cilt 4 Sayı 2 81
4 Results and Suggestions
In this study optional replenishment model is analyzed as an inventory
model Although this policy results in optimum values in practice it is hard
to determine parameters of reorder point (s) and replenishment point (S) In
order to determine these two points the demand structure is analyzed and a
cost function is formulated This function is compared with GAs codes
developed in MATLAB with the simulation developed in Microsoft Excel
Weekly average costs are calculated for different reorder and replenishment
points In the chosen case the demand for raw material is normal and its
lead time shows uniform distribution When the results are evaluated it is
seen that GAs constitutes a better alternative in terms of both time and cost
However the cost difference stems from increases of 10 units in the
simulation model When the classic method is used average cost increases
dramatically because of that the reorder point in the formulation is high
In addition in order to analyze the influence of cost change on reorder point
and replenishment point two levels are determined for holding cost penalty
cost and ordering cost The model is operated at these levels again by GAs
and the results reached are examined The examination shows that the main
cost effecting the model is the penalty cost As the penalty cost increases the
reorder point also increases Therefore the policy becomes the base stock
policy
With the help of some modifications in the structure of parameters of GAs
the solution time can be shortened Determining R as a variable the search
for a solution can be continued in a wider area Moreover the same model
can be used for various demand distributions and lead time distributions
References
Agrawal P M amp Sharda R (2012) Impact of frequency of alignment of
physical and information system inventories on out of stocks A
simulation study International Journal of Production
Economics 136(1) 45-55
Allen F amp Karjalainen R (1999) Using genetic algorithms to find
technical trading rules Journal of financial Economics 51(2) 245-
271
Arrow K J Harris T amp Marschak J (1951) Optimal inventory policy
Econometrica Journal of the Econometric Society 250-272
Bollapragada S amp Morton T E (1999) A simple heuristic for computing
nonstationary (s S) policies Operations Research 47(4) 576-584
Buchan J A amp Koenıgsberg E A (1966) Scientific inventory
management Prentice Hall
DeYong G D amp Cattani K D (2015) Fenced in Stochastic and
deterministic planning models in a time-fenced rolling-horizon
scheduling system European Journal of Operational Research
Reorder Point and Replenishment Point of Dynamic Inventory Model Under hellip
82 Research Journal of Politics Economics and Management 2016 Year4 Volume4 Issue2
Diabat A amp Deskoores R (2015) A hybrid genetic algorithm based
heuristic for an integrated supply chain problem Journal of
Manufacturing Systems
do Rego J R amp de Mesquita M A (2015) Demand forecasting and
inventory control A simulation study on automotive spare
parts International Journal of Production Economics 161 1-16
Duan Q amp Liao T W (2013) A new age-based replenishment policy for
supply chain inventory optimization of highly perishable products
International Journal of Production Economics 145(2) 658-671
Ehrhardt R (1979) The power approximation for computing (s S)
inventory policies Management Science 25(8) 777-786
Ehrhardt R (1984) (s S) policies for a dynamic inventory model with
stochastic lead times Operations Research 32(1) 121-132
Ehrhardt R amp Mosier C (1984) A revision of the power approximation
for computing (s S) policies Management Science 30(5) 618-622
Escuiacuten D Polo L amp Cipreacutes D (2016) On the comparison of inventory
replenishment policies with time-varying stochastic demand for the
paper industry Journal of Computational and Applied Mathematics
Freeland J R amp Porteus E L (1980) Evaluating the effectiveness of a
new method for computing approximately optimal (s S) inventory
policies Operations Research 28(2) 353-364
Garciacutea-Alvarado M S Paquet M amp Chaabane A (2015) On inventory
control of product recovery systems subject to environmental
mechanisms International Journal of Production Economics 165
132-144
Glover F amp Laguna M (1993) Modern heuristic techniques for
combinatorial problems Blackwell London
Goldberg D E (1989) Genetic algorithms in search and machine learning
Reading Addison Wesley
Hillier F S (1995) Introduction to operations research Tata McGraw-Hill
Education
Hwang H Choi B amp Lee M J (2005) A model for shelf space
allocation and inventory control considering location and inventory
level effects on demand International Journal of Production
Economics 97(2) 185-195
Iglehart D L (1963) Optimality of (s S) policies in the infinite horizon
dynamic inventory problem Management science 9(2) 259-267
Jana D K Das B amp Maiti M (2014) Multi-item partial backlogging
inventory models over random planning horizon in random fuzzy
environment Applied Soft Computing 21 12-27
İ Z AKYURT
Siyaset Ekonomi ve Youmlnetim Araştırmaları Dergisi2016 Yıl 4 Cilt 4 Sayı 2 83
Karlin S (1958) The Application of Renewal Theory to the Study of
Inventory Policies Chap 15 in Arrow KJ S Karlin and H
Scarf Studies in the Mathematical Theory of Inventory and
Production
Kouki C amp Jouini O (2015) On the effect of lifetime variability on the
performance of inventory systems International Journal of
Production Economics 167 23-34
Koumlchel Peter amp Nielaumlnder U (2005) Simulation-based optimization of
multi-echelon inventory systems International journal of production
economics 93 505-513
Larson C E Olson L J amp Sharma S (2001) Optimal inventory policies
when the demand distribution is not known Journal of economic
Theory 101(1) 281-300
Lin K P Chang P T Hung K C amp Pai P F (2010) A simulation of
vendor managed inventory dynamics using fuzzy arithmetic
operations with genetic algorithms Expert Systems with
Applications 37(3) 2571-2579
Maiti M K amp Maiti M (2006) Fuzzy inventory model with two
warehouses under possibility constraints Fuzzy Sets and
Systems 157(1) 52-73
Naddor E (1975) Optimal and heuristic decisions in single-and multi-item
inventory systems Management Science 21(11) 1234-1249
Nia A R Far M H amp Niaki S T A (2014) A fuzzy vendor managed
inventory of multi-item economic order quantity model under
shortage An ant colony optimization algorithm International
Journal of Production Economics 155 259-271
Nielsen C amp Larsen C (2005) An analytical study of the Q (s S) policy
applied to the joint replenishment problem European Journal of
Operational Research 163(3) 721-732
Porteus E L (1971) On the optimality of generalized (s S) policies
Management Science 17(7) 411-426
Rabta B amp Aiumlssani D (2005) Strong stability in an (R s S) inventory
model International Journal of Production Economics 97(2) 159-
171
Rezaei J amp Davoodi M (2011) Multi-objective models for lot-sizing with
supplier selection International Journal of Production
Economics 130(1) 77-86
Roberts D M (1962) Approximations to optimal policies in a dynamic
inventory model Studies in applied probability and management
science (7) 207
Reorder Point and Replenishment Point of Dynamic Inventory Model Under hellip
84 Research Journal of Politics Economics and Management 2016 Year4 Volume4 Issue2
Scarf H (1960) The Optimality of (s S) Policies in Dynamic Inventory
Problems K Arrow S Karlin P Suppes eds Mathematical
Models in the Social Sciences
Schneider H (1978) Methods for determining the re-order point of an (s S)
ordering policy when a service level is specified Journal of the
Operational Research Society 1181-1193
Sezen H K amp Erdoğmuş Ş (2005) Envanter Politikası Belirlemede
Benzetim Uygulaması 7 Ulusal Ekonometri ve İstatistik
Sempozyumu
Silver E A Pyke D F amp Peterson R (1998) Inventory management and
production planning and scheduling (Vol 3 p 30) New York
Wiley
Sivazlian B D (1971) Dimensional and computational analysis in
stationary (s S) inventory problems with gamma distributed
demand Management Science 17(6) B-307
Stevenson W J amp Sum C C (2009) Operations management (Vol 8)
Boston MA McGraw-HillIrwin
Taleizadeh A A Niaki S T A Aryanezhad M B amp Shafii N (2013)
A hybrid method of fuzzy simulation and genetic algorithm to
optimize constrained inventory control systems with stochastic
replenishments and fuzzy demand Information Sciences 220 425-
441
Thiel D Hovelaque V amp Le Hoa V T (2010) Impact of inventory
inaccuracy on service-level quality in (Q R) continuous-review lost-
sales inventory models International Journal of Production
Economics 123(2) 301-311
Tijms H C amp Groenevelt H (1984) Simple approximations for the
reorder point in periodic and continuous review (s S) inventory
systems with service level constraints European journal of
operational research 17(2) 175-190
Veinott Jr A F (1966) On the Optimality of (sS) Inventory Policies New
Conditions and a New Proof SIAM Journal on Applied
Mathematics 14(5) 1067-1083
Wagner H M (1975) Principle of Operations Research Englewood Cliff
White A S amp Censlive M (2015) Control system analysis of labor supply
flows in production systems Journal of Manufacturing Systems 37
316-327
Ye W amp You F (2016) A computationally efficient simulation-based
optimization method with region-wise surrogate modeling for
stochastic inventory management of supply chains with general
İ Z AKYURT
Siyaset Ekonomi ve Youmlnetim Araştırmaları Dergisi2016 Yıl 4 Cilt 4 Sayı 2 85
network structures Computers amp Chemical Engineering 87 164-
179
Yin K K Liu H amp Johnson N E (2002) Markovian inventory policy
with application to the paper industry Computers amp chemical
engineering 26(10) 1399-1413
Zheng Y S amp Federgruen A (1991) Finding optimal (s S) policies is
about as simple as evaluating a single policy Operations
research 39(4) 654-665
Zhou W Q Chen L amp Ge H M (2013) A multi-product multi-echelon
inventory control model with joint replenishment strategy Applied
Mathematical Modelling 37(4) 2039-2050
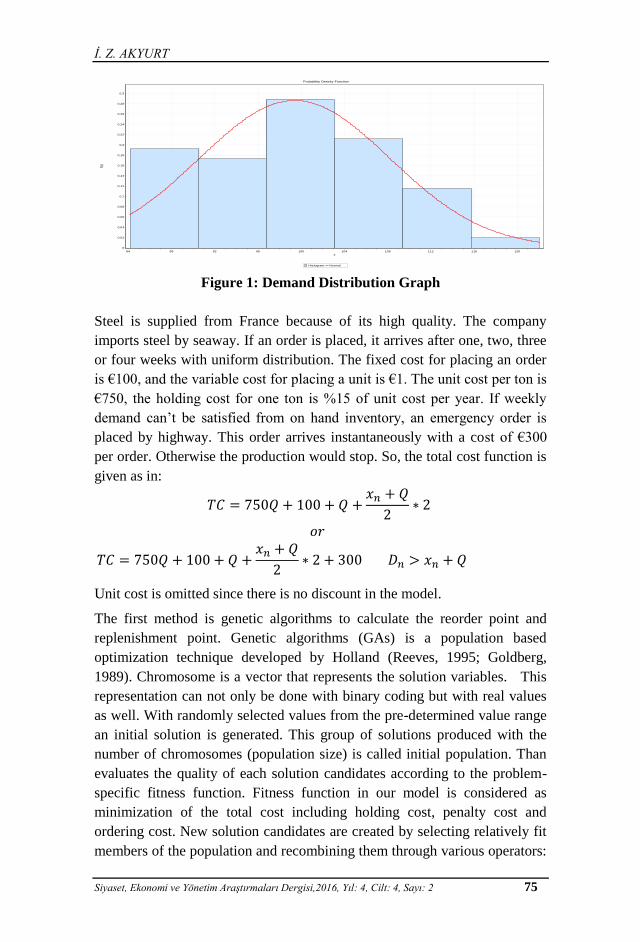
İ Z AKYURT
Siyaset Ekonomi ve Youmlnetim Araştırmaları Dergisi2016 Yıl 4 Cilt 4 Sayı 2 75
Figure 1 Demand Distribution Graph
Steel is supplied from France because of its high quality The company
imports steel by seaway If an order is placed it arrives after one two three
or four weeks with uniform distribution The fixed cost for placing an order
is euro100 and the variable cost for placing a unit is euro1 The unit cost per ton is
euro750 the holding cost for one ton is 15 of unit cost per year If weekly
demand canrsquot be satisfied from on hand inventory an emergency order is
placed by highway This order arrives instantaneously with a cost of euro300
per order Otherwise the production would stop So the total cost function is
given as in
119879119862 = 750119876 + 100 + 119876 +119909119899 + 119876
2lowast 2
119900119903
119879119862 = 750119876 + 100 + 119876 +119909119899 + 119876
2lowast 2 + 300 119863119899 gt 119909119899 + 119876
Unit cost is omitted since there is no discount in the model
The first method is genetic algorithms to calculate the reorder point and
replenishment point Genetic algorithms (GAs) is a population based
optimization technique developed by Holland (Reeves 1995 Goldberg
1989) Chromosome is a vector that represents the solution variables This
representation can not only be done with binary coding but with real values
as well With randomly selected values from the pre-determined value range
an initial solution is generated This group of solutions produced with the
number of chromosomes (population size) is called initial population Than
evaluates the quality of each solution candidates according to the problem-
specific fitness function Fitness function in our model is considered as
minimization of the total cost including holding cost penalty cost and
ordering cost New solution candidates are created by selecting relatively fit
members of the population and recombining them through various operators
Probability Density Function
Histogram Normal
x
12011611210810410096928884
f(x)
03
028
026
024
022
02
018
016
014
012
01
008
006
004
002
0
Reorder Point and Replenishment Point of Dynamic Inventory Model Under hellip
76 Research Journal of Politics Economics and Management 2016 Year4 Volume4 Issue2
selection crossover mutation (Allen amp Karjalainen 1999) The purpose of
parent selection in GAs is to offer additional reproductive chances to those
population members that are the fittest One commonly used technique the
roulette-wheel-selection is used for this proposed GAs The crossover is the
operator for solution space search It is procedure of creating new
chromosomes There are various versions of crossover In this paper one-
point crossover is used Mutation plays decidedly secondary role in the
operation of GAs ldquoIn artificial genetic systems the mutation operator
protects against such an irrecoverable lossrdquo (Goldberg 1989) In this study
real-value coding is used The steps of GAs are as follows
Step 1 Generation of initial population
Step 2 Evaluation of each individual
Step 3 Selection
Step 4 Crossover
Step 5 Mutation
Step 6 If stopping criteria is not met return to Step 2
Step 7 Select the best individual as a final solution (Kiremitci amp
Akyurt 2012)
GAs parameters used in calculation inventory model is given Table 3 GAs
was run for 100 times and the averages of the results are represented in
Table 4 The codes were generated MATLAB 85 (R2015a) and the
algorithm was run with an Intel(R) Core(TM) i73517U CPU 190 GHz
40 GB Ram configured PC In Table 4 it can be seen that better results are
reached when mutation rate is 02 and population size is 100 It is observed
that 1000 iterations are enough for the solution The reorder point is
approximately as 9 and the replenishment point is 109 Average inventory
cost is euro327 per week
Table 3 GAs Parameters for the Inventory Model
GAs Parameter Values
Iteration 5000
Population size 20 50 100
Crossover rate 100
Mutation Rate 1 10 20
İ Z AKYURT
Siyaset Ekonomi ve Youmlnetim Araştırmaları Dergisi2016 Yıl 4 Cilt 4 Sayı 2 77
Table 4 GAs Results for Different Population Sizes (ps)
Reorder
Point
Replenishment
Point
Average
TC(week)
GAs (ps20) 1423 11346 339
GAs (ps50) 1057 11049 332
GAs (ps100) 887 10913 327
The other method for determining reorder point and replenishment point is
simulation method which is applied using Microsoft Excel spreadsheet by
taking the mentioned cost function into account As seen in the Table 5 a
10x10 trial matrix is formulated The model searches the reorder point and
the replenishment point which result in minimum cost for predetermined
values In each iteration 52 weeks are simulated according to demand and
lead time structure This model runs for 1000 iterations In Table 5 the
repetition number of the minimum total cost is shown The reorder point is
calculated as 10 and the replenishment point is 110 and it is repeated for 188
times However 1000 iterations take 17 minutes with the same PC and it
takes longer compared to the genetic algorithms method In Table 6 average
weekly inventory cost can be seen for different values of reorder point and
replenishment point Itrsquos calculated through a 52-weeks simulation
Reorder Point and Replenishment Point of Dynamic Inventory Model Under hellip
78 Research Journal of Politics Economics and Management 2016 Year4 Volume4 Issue2
Table 5 Simulation Results
Replenishment Point (S)
110 115 120 125 130 135 140 145 150 155 Total
Re
ord
er P
oin
t (s)
10 188 140 24 4 6 2 0 0 0 0 364
15 148 80 18 2 4 0 0 0 0 0 252
20 80 52 12 4 4 4 0 0 0 0 156
25 32 14 0 4 2 0 0 0 0 0 52
30 58 6 2 0 0 0 0 0 0 0 66
35 26 8 0 0 0 0 0 0 0 0 34
40 28 6 0 0 0 0 0 0 0 0 34
45 20 4 0 0 0 0 0 0 0 0 24
50 4 0 0 0 0 0 0 0 0 0 4
55 12 2 0 0 0 0 0 0 0 0 14
Total 596 312 56 14 16 6 0 0 0 0 1000
İ Z AKYURT
Siyaset Ekonomi ve Youmlnetim Araştırmaları Dergisi2016 Yıl 4 Cilt 4 Sayı 2 79
Table 6 Average Weekly Costs for Different Values of Inventory Parameters
Reo
rder
Po
int (s)
Replenishment Point (S)
110 115 120 125 130 135 140 145 150 155
10 3329 3344 3401 3431 3450 3466 3497 3525 3564 3590
15 3346 3356 3403 3432 3457 3476 3503 3532 3563 3597
20 3361 3373 3424 3438 3469 3484 3508 3532 3573 3596
25 3377 3383 3443 3457 3477 3487 3505 3535 3569 3594
30 3375 3405 3458 3478 3502 3498 3518 3540 3577 3603
35 3395 3417 3477 3506 3528 3529 3538 3555 3591 3618
40 3408 3414 3485 3513 3535 3542 3555 3570 3589 3612
45 3412 3432 3495 3524 3549 3557 3574 3589 3601 3625
50 3411 3440 3496 3529 3552 3577 3596 3615 3631 3629
55 3422 3443 3510 3532 3560 3580 3610 3625 3649 3658
Reorder Point and Replenishment Point of Dynamic Inventory Model Under hellip
80 Research Journal of Politics Economics and Management 2016 Year4 Volume4 Issue2
Table 7 compares results of classic simulation and genetic algorithms
methods When the classic method is used average cost increases
dramatically because of that the reorder point in the formulation is high
Results of two other methods are close the result generated by genetic
algorithm is faster and has a lower cost The simulation formulates results
according presupposed intervals and therefore cannot generate solution
values directly
Table 7 Comparison of Results
Reor
der
Point
Replenish
ment
Point
Average
Cost(weekly)
Classic Method
420 527 785
GAs (ps100) 887 10913 327
Simulatio
n
10 110 333
Two-level genetic algorithmsrsquo results determined for each cost are given in
Table 8 As seen in the table when only holding cost increases model
parameters stay stable Similarly when only ordering cost increases
parameters stay again stable When both holding cost and ordering cost
increase parameters stay again stable but only total cost increases slightly
As penalty cost increases the reorder point increases dramatically and the
model converges to the base stock model (RS)
Table 8 Experimental Results for Different Costs (GAs)
Experiment
Number
Holding
Cost
Penalty
Cost
Ordering
Cost
Reorder
Point
s
Replenishment
Point S
Av
Weekly
Total
Cost euro
1 2 300 100 9 109 327
2 2 300 250 7 110 393
3 2 750 100 65 163 581
4 2 750 250 67 165 639
5 5 300 100 8 104 422
6 5 300 250 7 108 736
7 5 750 100 51 110 691
8 5 750 250 8 113 763
İ Z AKYURT
Siyaset Ekonomi ve Youmlnetim Araştırmaları Dergisi2016 Yıl 4 Cilt 4 Sayı 2 81
4 Results and Suggestions
In this study optional replenishment model is analyzed as an inventory
model Although this policy results in optimum values in practice it is hard
to determine parameters of reorder point (s) and replenishment point (S) In
order to determine these two points the demand structure is analyzed and a
cost function is formulated This function is compared with GAs codes
developed in MATLAB with the simulation developed in Microsoft Excel
Weekly average costs are calculated for different reorder and replenishment
points In the chosen case the demand for raw material is normal and its
lead time shows uniform distribution When the results are evaluated it is
seen that GAs constitutes a better alternative in terms of both time and cost
However the cost difference stems from increases of 10 units in the
simulation model When the classic method is used average cost increases
dramatically because of that the reorder point in the formulation is high
In addition in order to analyze the influence of cost change on reorder point
and replenishment point two levels are determined for holding cost penalty
cost and ordering cost The model is operated at these levels again by GAs
and the results reached are examined The examination shows that the main
cost effecting the model is the penalty cost As the penalty cost increases the
reorder point also increases Therefore the policy becomes the base stock
policy
With the help of some modifications in the structure of parameters of GAs
the solution time can be shortened Determining R as a variable the search
for a solution can be continued in a wider area Moreover the same model
can be used for various demand distributions and lead time distributions
References
Agrawal P M amp Sharda R (2012) Impact of frequency of alignment of
physical and information system inventories on out of stocks A
simulation study International Journal of Production
Economics 136(1) 45-55
Allen F amp Karjalainen R (1999) Using genetic algorithms to find
technical trading rules Journal of financial Economics 51(2) 245-
271
Arrow K J Harris T amp Marschak J (1951) Optimal inventory policy
Econometrica Journal of the Econometric Society 250-272
Bollapragada S amp Morton T E (1999) A simple heuristic for computing
nonstationary (s S) policies Operations Research 47(4) 576-584
Buchan J A amp Koenıgsberg E A (1966) Scientific inventory
management Prentice Hall
DeYong G D amp Cattani K D (2015) Fenced in Stochastic and
deterministic planning models in a time-fenced rolling-horizon
scheduling system European Journal of Operational Research
Reorder Point and Replenishment Point of Dynamic Inventory Model Under hellip
82 Research Journal of Politics Economics and Management 2016 Year4 Volume4 Issue2
Diabat A amp Deskoores R (2015) A hybrid genetic algorithm based
heuristic for an integrated supply chain problem Journal of
Manufacturing Systems
do Rego J R amp de Mesquita M A (2015) Demand forecasting and
inventory control A simulation study on automotive spare
parts International Journal of Production Economics 161 1-16
Duan Q amp Liao T W (2013) A new age-based replenishment policy for
supply chain inventory optimization of highly perishable products
International Journal of Production Economics 145(2) 658-671
Ehrhardt R (1979) The power approximation for computing (s S)
inventory policies Management Science 25(8) 777-786
Ehrhardt R (1984) (s S) policies for a dynamic inventory model with
stochastic lead times Operations Research 32(1) 121-132
Ehrhardt R amp Mosier C (1984) A revision of the power approximation
for computing (s S) policies Management Science 30(5) 618-622
Escuiacuten D Polo L amp Cipreacutes D (2016) On the comparison of inventory
replenishment policies with time-varying stochastic demand for the
paper industry Journal of Computational and Applied Mathematics
Freeland J R amp Porteus E L (1980) Evaluating the effectiveness of a
new method for computing approximately optimal (s S) inventory
policies Operations Research 28(2) 353-364
Garciacutea-Alvarado M S Paquet M amp Chaabane A (2015) On inventory
control of product recovery systems subject to environmental
mechanisms International Journal of Production Economics 165
132-144
Glover F amp Laguna M (1993) Modern heuristic techniques for
combinatorial problems Blackwell London
Goldberg D E (1989) Genetic algorithms in search and machine learning
Reading Addison Wesley
Hillier F S (1995) Introduction to operations research Tata McGraw-Hill
Education
Hwang H Choi B amp Lee M J (2005) A model for shelf space
allocation and inventory control considering location and inventory
level effects on demand International Journal of Production
Economics 97(2) 185-195
Iglehart D L (1963) Optimality of (s S) policies in the infinite horizon
dynamic inventory problem Management science 9(2) 259-267
Jana D K Das B amp Maiti M (2014) Multi-item partial backlogging
inventory models over random planning horizon in random fuzzy
environment Applied Soft Computing 21 12-27
İ Z AKYURT
Siyaset Ekonomi ve Youmlnetim Araştırmaları Dergisi2016 Yıl 4 Cilt 4 Sayı 2 83
Karlin S (1958) The Application of Renewal Theory to the Study of
Inventory Policies Chap 15 in Arrow KJ S Karlin and H
Scarf Studies in the Mathematical Theory of Inventory and
Production
Kouki C amp Jouini O (2015) On the effect of lifetime variability on the
performance of inventory systems International Journal of
Production Economics 167 23-34
Koumlchel Peter amp Nielaumlnder U (2005) Simulation-based optimization of
multi-echelon inventory systems International journal of production
economics 93 505-513
Larson C E Olson L J amp Sharma S (2001) Optimal inventory policies
when the demand distribution is not known Journal of economic
Theory 101(1) 281-300
Lin K P Chang P T Hung K C amp Pai P F (2010) A simulation of
vendor managed inventory dynamics using fuzzy arithmetic
operations with genetic algorithms Expert Systems with
Applications 37(3) 2571-2579
Maiti M K amp Maiti M (2006) Fuzzy inventory model with two
warehouses under possibility constraints Fuzzy Sets and
Systems 157(1) 52-73
Naddor E (1975) Optimal and heuristic decisions in single-and multi-item
inventory systems Management Science 21(11) 1234-1249
Nia A R Far M H amp Niaki S T A (2014) A fuzzy vendor managed
inventory of multi-item economic order quantity model under
shortage An ant colony optimization algorithm International
Journal of Production Economics 155 259-271
Nielsen C amp Larsen C (2005) An analytical study of the Q (s S) policy
applied to the joint replenishment problem European Journal of
Operational Research 163(3) 721-732
Porteus E L (1971) On the optimality of generalized (s S) policies
Management Science 17(7) 411-426
Rabta B amp Aiumlssani D (2005) Strong stability in an (R s S) inventory
model International Journal of Production Economics 97(2) 159-
171
Rezaei J amp Davoodi M (2011) Multi-objective models for lot-sizing with
supplier selection International Journal of Production
Economics 130(1) 77-86
Roberts D M (1962) Approximations to optimal policies in a dynamic
inventory model Studies in applied probability and management
science (7) 207
Reorder Point and Replenishment Point of Dynamic Inventory Model Under hellip
84 Research Journal of Politics Economics and Management 2016 Year4 Volume4 Issue2
Scarf H (1960) The Optimality of (s S) Policies in Dynamic Inventory
Problems K Arrow S Karlin P Suppes eds Mathematical
Models in the Social Sciences
Schneider H (1978) Methods for determining the re-order point of an (s S)
ordering policy when a service level is specified Journal of the
Operational Research Society 1181-1193
Sezen H K amp Erdoğmuş Ş (2005) Envanter Politikası Belirlemede
Benzetim Uygulaması 7 Ulusal Ekonometri ve İstatistik
Sempozyumu
Silver E A Pyke D F amp Peterson R (1998) Inventory management and
production planning and scheduling (Vol 3 p 30) New York
Wiley
Sivazlian B D (1971) Dimensional and computational analysis in
stationary (s S) inventory problems with gamma distributed
demand Management Science 17(6) B-307
Stevenson W J amp Sum C C (2009) Operations management (Vol 8)
Boston MA McGraw-HillIrwin
Taleizadeh A A Niaki S T A Aryanezhad M B amp Shafii N (2013)
A hybrid method of fuzzy simulation and genetic algorithm to
optimize constrained inventory control systems with stochastic
replenishments and fuzzy demand Information Sciences 220 425-
441
Thiel D Hovelaque V amp Le Hoa V T (2010) Impact of inventory
inaccuracy on service-level quality in (Q R) continuous-review lost-
sales inventory models International Journal of Production
Economics 123(2) 301-311
Tijms H C amp Groenevelt H (1984) Simple approximations for the
reorder point in periodic and continuous review (s S) inventory
systems with service level constraints European journal of
operational research 17(2) 175-190
Veinott Jr A F (1966) On the Optimality of (sS) Inventory Policies New
Conditions and a New Proof SIAM Journal on Applied
Mathematics 14(5) 1067-1083
Wagner H M (1975) Principle of Operations Research Englewood Cliff
White A S amp Censlive M (2015) Control system analysis of labor supply
flows in production systems Journal of Manufacturing Systems 37
316-327
Ye W amp You F (2016) A computationally efficient simulation-based
optimization method with region-wise surrogate modeling for
stochastic inventory management of supply chains with general
İ Z AKYURT
Siyaset Ekonomi ve Youmlnetim Araştırmaları Dergisi2016 Yıl 4 Cilt 4 Sayı 2 85
network structures Computers amp Chemical Engineering 87 164-
179
Yin K K Liu H amp Johnson N E (2002) Markovian inventory policy
with application to the paper industry Computers amp chemical
engineering 26(10) 1399-1413
Zheng Y S amp Federgruen A (1991) Finding optimal (s S) policies is
about as simple as evaluating a single policy Operations
research 39(4) 654-665
Zhou W Q Chen L amp Ge H M (2013) A multi-product multi-echelon
inventory control model with joint replenishment strategy Applied
Mathematical Modelling 37(4) 2039-2050
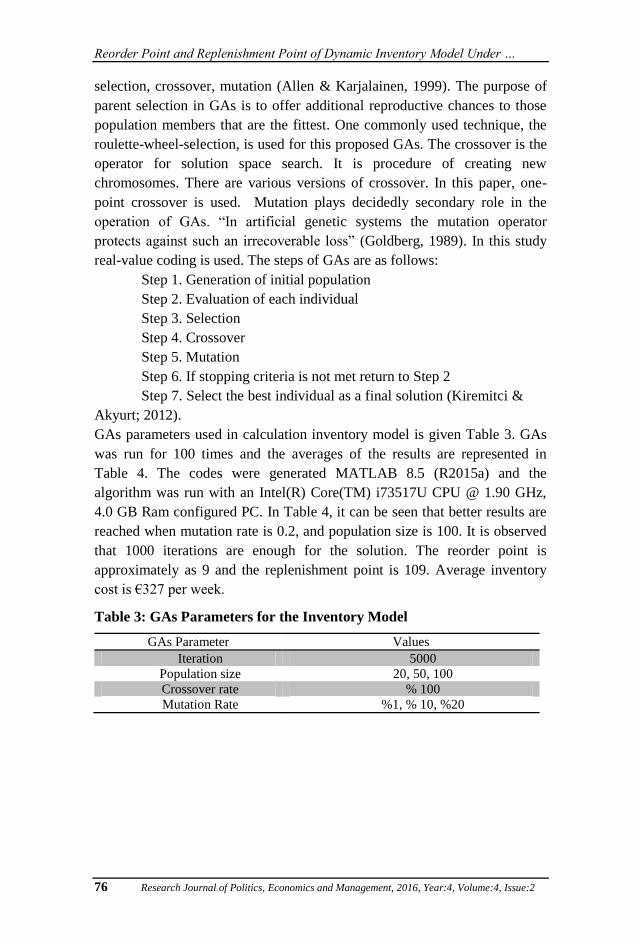
Reorder Point and Replenishment Point of Dynamic Inventory Model Under hellip
76 Research Journal of Politics Economics and Management 2016 Year4 Volume4 Issue2
selection crossover mutation (Allen amp Karjalainen 1999) The purpose of
parent selection in GAs is to offer additional reproductive chances to those
population members that are the fittest One commonly used technique the
roulette-wheel-selection is used for this proposed GAs The crossover is the
operator for solution space search It is procedure of creating new
chromosomes There are various versions of crossover In this paper one-
point crossover is used Mutation plays decidedly secondary role in the
operation of GAs ldquoIn artificial genetic systems the mutation operator
protects against such an irrecoverable lossrdquo (Goldberg 1989) In this study
real-value coding is used The steps of GAs are as follows
Step 1 Generation of initial population
Step 2 Evaluation of each individual
Step 3 Selection
Step 4 Crossover
Step 5 Mutation
Step 6 If stopping criteria is not met return to Step 2
Step 7 Select the best individual as a final solution (Kiremitci amp
Akyurt 2012)
GAs parameters used in calculation inventory model is given Table 3 GAs
was run for 100 times and the averages of the results are represented in
Table 4 The codes were generated MATLAB 85 (R2015a) and the
algorithm was run with an Intel(R) Core(TM) i73517U CPU 190 GHz
40 GB Ram configured PC In Table 4 it can be seen that better results are
reached when mutation rate is 02 and population size is 100 It is observed
that 1000 iterations are enough for the solution The reorder point is
approximately as 9 and the replenishment point is 109 Average inventory
cost is euro327 per week
Table 3 GAs Parameters for the Inventory Model
GAs Parameter Values
Iteration 5000
Population size 20 50 100
Crossover rate 100
Mutation Rate 1 10 20
İ Z AKYURT
Siyaset Ekonomi ve Youmlnetim Araştırmaları Dergisi2016 Yıl 4 Cilt 4 Sayı 2 77
Table 4 GAs Results for Different Population Sizes (ps)
Reorder
Point
Replenishment
Point
Average
TC(week)
GAs (ps20) 1423 11346 339
GAs (ps50) 1057 11049 332
GAs (ps100) 887 10913 327
The other method for determining reorder point and replenishment point is
simulation method which is applied using Microsoft Excel spreadsheet by
taking the mentioned cost function into account As seen in the Table 5 a
10x10 trial matrix is formulated The model searches the reorder point and
the replenishment point which result in minimum cost for predetermined
values In each iteration 52 weeks are simulated according to demand and
lead time structure This model runs for 1000 iterations In Table 5 the
repetition number of the minimum total cost is shown The reorder point is
calculated as 10 and the replenishment point is 110 and it is repeated for 188
times However 1000 iterations take 17 minutes with the same PC and it
takes longer compared to the genetic algorithms method In Table 6 average
weekly inventory cost can be seen for different values of reorder point and
replenishment point Itrsquos calculated through a 52-weeks simulation
Reorder Point and Replenishment Point of Dynamic Inventory Model Under hellip
78 Research Journal of Politics Economics and Management 2016 Year4 Volume4 Issue2
Table 5 Simulation Results
Replenishment Point (S)
110 115 120 125 130 135 140 145 150 155 Total
Re
ord
er P
oin
t (s)
10 188 140 24 4 6 2 0 0 0 0 364
15 148 80 18 2 4 0 0 0 0 0 252
20 80 52 12 4 4 4 0 0 0 0 156
25 32 14 0 4 2 0 0 0 0 0 52
30 58 6 2 0 0 0 0 0 0 0 66
35 26 8 0 0 0 0 0 0 0 0 34
40 28 6 0 0 0 0 0 0 0 0 34
45 20 4 0 0 0 0 0 0 0 0 24
50 4 0 0 0 0 0 0 0 0 0 4
55 12 2 0 0 0 0 0 0 0 0 14
Total 596 312 56 14 16 6 0 0 0 0 1000
İ Z AKYURT
Siyaset Ekonomi ve Youmlnetim Araştırmaları Dergisi2016 Yıl 4 Cilt 4 Sayı 2 79
Table 6 Average Weekly Costs for Different Values of Inventory Parameters
Reo
rder
Po
int (s)
Replenishment Point (S)
110 115 120 125 130 135 140 145 150 155
10 3329 3344 3401 3431 3450 3466 3497 3525 3564 3590
15 3346 3356 3403 3432 3457 3476 3503 3532 3563 3597
20 3361 3373 3424 3438 3469 3484 3508 3532 3573 3596
25 3377 3383 3443 3457 3477 3487 3505 3535 3569 3594
30 3375 3405 3458 3478 3502 3498 3518 3540 3577 3603
35 3395 3417 3477 3506 3528 3529 3538 3555 3591 3618
40 3408 3414 3485 3513 3535 3542 3555 3570 3589 3612
45 3412 3432 3495 3524 3549 3557 3574 3589 3601 3625
50 3411 3440 3496 3529 3552 3577 3596 3615 3631 3629
55 3422 3443 3510 3532 3560 3580 3610 3625 3649 3658
Reorder Point and Replenishment Point of Dynamic Inventory Model Under hellip
80 Research Journal of Politics Economics and Management 2016 Year4 Volume4 Issue2
Table 7 compares results of classic simulation and genetic algorithms
methods When the classic method is used average cost increases
dramatically because of that the reorder point in the formulation is high
Results of two other methods are close the result generated by genetic
algorithm is faster and has a lower cost The simulation formulates results
according presupposed intervals and therefore cannot generate solution
values directly
Table 7 Comparison of Results
Reor
der
Point
Replenish
ment
Point
Average
Cost(weekly)
Classic Method
420 527 785
GAs (ps100) 887 10913 327
Simulatio
n
10 110 333
Two-level genetic algorithmsrsquo results determined for each cost are given in
Table 8 As seen in the table when only holding cost increases model
parameters stay stable Similarly when only ordering cost increases
parameters stay again stable When both holding cost and ordering cost
increase parameters stay again stable but only total cost increases slightly
As penalty cost increases the reorder point increases dramatically and the
model converges to the base stock model (RS)
Table 8 Experimental Results for Different Costs (GAs)
Experiment
Number
Holding
Cost
Penalty
Cost
Ordering
Cost
Reorder
Point
s
Replenishment
Point S
Av
Weekly
Total
Cost euro
1 2 300 100 9 109 327
2 2 300 250 7 110 393
3 2 750 100 65 163 581
4 2 750 250 67 165 639
5 5 300 100 8 104 422
6 5 300 250 7 108 736
7 5 750 100 51 110 691
8 5 750 250 8 113 763
İ Z AKYURT
Siyaset Ekonomi ve Youmlnetim Araştırmaları Dergisi2016 Yıl 4 Cilt 4 Sayı 2 81
4 Results and Suggestions
In this study optional replenishment model is analyzed as an inventory
model Although this policy results in optimum values in practice it is hard
to determine parameters of reorder point (s) and replenishment point (S) In
order to determine these two points the demand structure is analyzed and a
cost function is formulated This function is compared with GAs codes
developed in MATLAB with the simulation developed in Microsoft Excel
Weekly average costs are calculated for different reorder and replenishment
points In the chosen case the demand for raw material is normal and its
lead time shows uniform distribution When the results are evaluated it is
seen that GAs constitutes a better alternative in terms of both time and cost
However the cost difference stems from increases of 10 units in the
simulation model When the classic method is used average cost increases
dramatically because of that the reorder point in the formulation is high
In addition in order to analyze the influence of cost change on reorder point
and replenishment point two levels are determined for holding cost penalty
cost and ordering cost The model is operated at these levels again by GAs
and the results reached are examined The examination shows that the main
cost effecting the model is the penalty cost As the penalty cost increases the
reorder point also increases Therefore the policy becomes the base stock
policy
With the help of some modifications in the structure of parameters of GAs
the solution time can be shortened Determining R as a variable the search
for a solution can be continued in a wider area Moreover the same model
can be used for various demand distributions and lead time distributions
References
Agrawal P M amp Sharda R (2012) Impact of frequency of alignment of
physical and information system inventories on out of stocks A
simulation study International Journal of Production
Economics 136(1) 45-55
Allen F amp Karjalainen R (1999) Using genetic algorithms to find
technical trading rules Journal of financial Economics 51(2) 245-
271
Arrow K J Harris T amp Marschak J (1951) Optimal inventory policy
Econometrica Journal of the Econometric Society 250-272
Bollapragada S amp Morton T E (1999) A simple heuristic for computing
nonstationary (s S) policies Operations Research 47(4) 576-584
Buchan J A amp Koenıgsberg E A (1966) Scientific inventory
management Prentice Hall
DeYong G D amp Cattani K D (2015) Fenced in Stochastic and
deterministic planning models in a time-fenced rolling-horizon
scheduling system European Journal of Operational Research
Reorder Point and Replenishment Point of Dynamic Inventory Model Under hellip
82 Research Journal of Politics Economics and Management 2016 Year4 Volume4 Issue2
Diabat A amp Deskoores R (2015) A hybrid genetic algorithm based
heuristic for an integrated supply chain problem Journal of
Manufacturing Systems
do Rego J R amp de Mesquita M A (2015) Demand forecasting and
inventory control A simulation study on automotive spare
parts International Journal of Production Economics 161 1-16
Duan Q amp Liao T W (2013) A new age-based replenishment policy for
supply chain inventory optimization of highly perishable products
International Journal of Production Economics 145(2) 658-671
Ehrhardt R (1979) The power approximation for computing (s S)
inventory policies Management Science 25(8) 777-786
Ehrhardt R (1984) (s S) policies for a dynamic inventory model with
stochastic lead times Operations Research 32(1) 121-132
Ehrhardt R amp Mosier C (1984) A revision of the power approximation
for computing (s S) policies Management Science 30(5) 618-622
Escuiacuten D Polo L amp Cipreacutes D (2016) On the comparison of inventory
replenishment policies with time-varying stochastic demand for the
paper industry Journal of Computational and Applied Mathematics
Freeland J R amp Porteus E L (1980) Evaluating the effectiveness of a
new method for computing approximately optimal (s S) inventory
policies Operations Research 28(2) 353-364
Garciacutea-Alvarado M S Paquet M amp Chaabane A (2015) On inventory
control of product recovery systems subject to environmental
mechanisms International Journal of Production Economics 165
132-144
Glover F amp Laguna M (1993) Modern heuristic techniques for
combinatorial problems Blackwell London
Goldberg D E (1989) Genetic algorithms in search and machine learning
Reading Addison Wesley
Hillier F S (1995) Introduction to operations research Tata McGraw-Hill
Education
Hwang H Choi B amp Lee M J (2005) A model for shelf space
allocation and inventory control considering location and inventory
level effects on demand International Journal of Production
Economics 97(2) 185-195
Iglehart D L (1963) Optimality of (s S) policies in the infinite horizon
dynamic inventory problem Management science 9(2) 259-267
Jana D K Das B amp Maiti M (2014) Multi-item partial backlogging
inventory models over random planning horizon in random fuzzy
environment Applied Soft Computing 21 12-27
İ Z AKYURT
Siyaset Ekonomi ve Youmlnetim Araştırmaları Dergisi2016 Yıl 4 Cilt 4 Sayı 2 83
Karlin S (1958) The Application of Renewal Theory to the Study of
Inventory Policies Chap 15 in Arrow KJ S Karlin and H
Scarf Studies in the Mathematical Theory of Inventory and
Production
Kouki C amp Jouini O (2015) On the effect of lifetime variability on the
performance of inventory systems International Journal of
Production Economics 167 23-34
Koumlchel Peter amp Nielaumlnder U (2005) Simulation-based optimization of
multi-echelon inventory systems International journal of production
economics 93 505-513
Larson C E Olson L J amp Sharma S (2001) Optimal inventory policies
when the demand distribution is not known Journal of economic
Theory 101(1) 281-300
Lin K P Chang P T Hung K C amp Pai P F (2010) A simulation of
vendor managed inventory dynamics using fuzzy arithmetic
operations with genetic algorithms Expert Systems with
Applications 37(3) 2571-2579
Maiti M K amp Maiti M (2006) Fuzzy inventory model with two
warehouses under possibility constraints Fuzzy Sets and
Systems 157(1) 52-73
Naddor E (1975) Optimal and heuristic decisions in single-and multi-item
inventory systems Management Science 21(11) 1234-1249
Nia A R Far M H amp Niaki S T A (2014) A fuzzy vendor managed
inventory of multi-item economic order quantity model under
shortage An ant colony optimization algorithm International
Journal of Production Economics 155 259-271
Nielsen C amp Larsen C (2005) An analytical study of the Q (s S) policy
applied to the joint replenishment problem European Journal of
Operational Research 163(3) 721-732
Porteus E L (1971) On the optimality of generalized (s S) policies
Management Science 17(7) 411-426
Rabta B amp Aiumlssani D (2005) Strong stability in an (R s S) inventory
model International Journal of Production Economics 97(2) 159-
171
Rezaei J amp Davoodi M (2011) Multi-objective models for lot-sizing with
supplier selection International Journal of Production
Economics 130(1) 77-86
Roberts D M (1962) Approximations to optimal policies in a dynamic
inventory model Studies in applied probability and management
science (7) 207
Reorder Point and Replenishment Point of Dynamic Inventory Model Under hellip
84 Research Journal of Politics Economics and Management 2016 Year4 Volume4 Issue2
Scarf H (1960) The Optimality of (s S) Policies in Dynamic Inventory
Problems K Arrow S Karlin P Suppes eds Mathematical
Models in the Social Sciences
Schneider H (1978) Methods for determining the re-order point of an (s S)
ordering policy when a service level is specified Journal of the
Operational Research Society 1181-1193
Sezen H K amp Erdoğmuş Ş (2005) Envanter Politikası Belirlemede
Benzetim Uygulaması 7 Ulusal Ekonometri ve İstatistik
Sempozyumu
Silver E A Pyke D F amp Peterson R (1998) Inventory management and
production planning and scheduling (Vol 3 p 30) New York
Wiley
Sivazlian B D (1971) Dimensional and computational analysis in
stationary (s S) inventory problems with gamma distributed
demand Management Science 17(6) B-307
Stevenson W J amp Sum C C (2009) Operations management (Vol 8)
Boston MA McGraw-HillIrwin
Taleizadeh A A Niaki S T A Aryanezhad M B amp Shafii N (2013)
A hybrid method of fuzzy simulation and genetic algorithm to
optimize constrained inventory control systems with stochastic
replenishments and fuzzy demand Information Sciences 220 425-
441
Thiel D Hovelaque V amp Le Hoa V T (2010) Impact of inventory
inaccuracy on service-level quality in (Q R) continuous-review lost-
sales inventory models International Journal of Production
Economics 123(2) 301-311
Tijms H C amp Groenevelt H (1984) Simple approximations for the
reorder point in periodic and continuous review (s S) inventory
systems with service level constraints European journal of
operational research 17(2) 175-190
Veinott Jr A F (1966) On the Optimality of (sS) Inventory Policies New
Conditions and a New Proof SIAM Journal on Applied
Mathematics 14(5) 1067-1083
Wagner H M (1975) Principle of Operations Research Englewood Cliff
White A S amp Censlive M (2015) Control system analysis of labor supply
flows in production systems Journal of Manufacturing Systems 37
316-327
Ye W amp You F (2016) A computationally efficient simulation-based
optimization method with region-wise surrogate modeling for
stochastic inventory management of supply chains with general
İ Z AKYURT
Siyaset Ekonomi ve Youmlnetim Araştırmaları Dergisi2016 Yıl 4 Cilt 4 Sayı 2 85
network structures Computers amp Chemical Engineering 87 164-
179
Yin K K Liu H amp Johnson N E (2002) Markovian inventory policy
with application to the paper industry Computers amp chemical
engineering 26(10) 1399-1413
Zheng Y S amp Federgruen A (1991) Finding optimal (s S) policies is
about as simple as evaluating a single policy Operations
research 39(4) 654-665
Zhou W Q Chen L amp Ge H M (2013) A multi-product multi-echelon
inventory control model with joint replenishment strategy Applied
Mathematical Modelling 37(4) 2039-2050
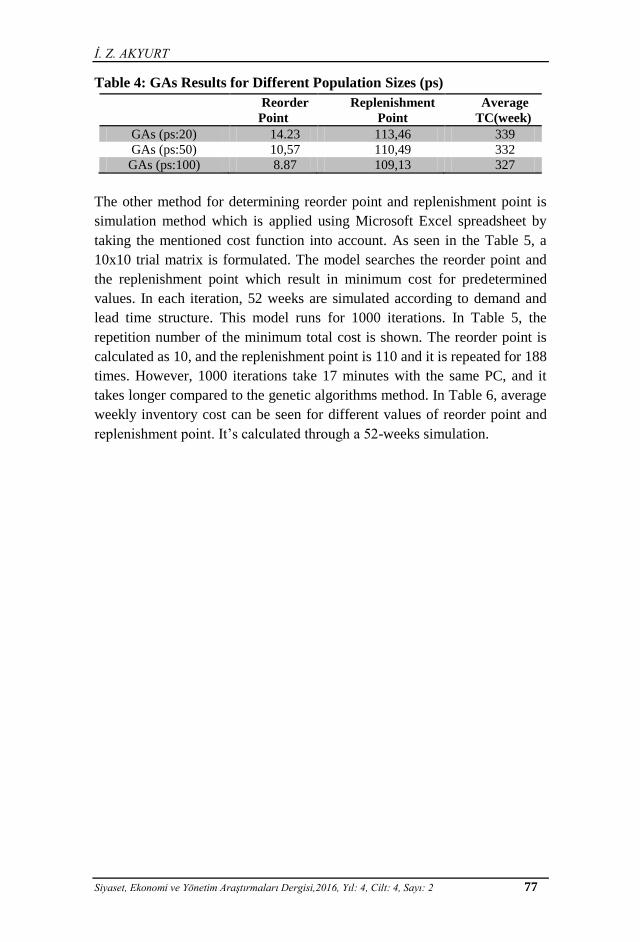
İ Z AKYURT
Siyaset Ekonomi ve Youmlnetim Araştırmaları Dergisi2016 Yıl 4 Cilt 4 Sayı 2 77
Table 4 GAs Results for Different Population Sizes (ps)
Reorder
Point
Replenishment
Point
Average
TC(week)
GAs (ps20) 1423 11346 339
GAs (ps50) 1057 11049 332
GAs (ps100) 887 10913 327
The other method for determining reorder point and replenishment point is
simulation method which is applied using Microsoft Excel spreadsheet by
taking the mentioned cost function into account As seen in the Table 5 a
10x10 trial matrix is formulated The model searches the reorder point and
the replenishment point which result in minimum cost for predetermined
values In each iteration 52 weeks are simulated according to demand and
lead time structure This model runs for 1000 iterations In Table 5 the
repetition number of the minimum total cost is shown The reorder point is
calculated as 10 and the replenishment point is 110 and it is repeated for 188
times However 1000 iterations take 17 minutes with the same PC and it
takes longer compared to the genetic algorithms method In Table 6 average
weekly inventory cost can be seen for different values of reorder point and
replenishment point Itrsquos calculated through a 52-weeks simulation
Reorder Point and Replenishment Point of Dynamic Inventory Model Under hellip
78 Research Journal of Politics Economics and Management 2016 Year4 Volume4 Issue2
Table 5 Simulation Results
Replenishment Point (S)
110 115 120 125 130 135 140 145 150 155 Total
Re
ord
er P
oin
t (s)
10 188 140 24 4 6 2 0 0 0 0 364
15 148 80 18 2 4 0 0 0 0 0 252
20 80 52 12 4 4 4 0 0 0 0 156
25 32 14 0 4 2 0 0 0 0 0 52
30 58 6 2 0 0 0 0 0 0 0 66
35 26 8 0 0 0 0 0 0 0 0 34
40 28 6 0 0 0 0 0 0 0 0 34
45 20 4 0 0 0 0 0 0 0 0 24
50 4 0 0 0 0 0 0 0 0 0 4
55 12 2 0 0 0 0 0 0 0 0 14
Total 596 312 56 14 16 6 0 0 0 0 1000
İ Z AKYURT
Siyaset Ekonomi ve Youmlnetim Araştırmaları Dergisi2016 Yıl 4 Cilt 4 Sayı 2 79
Table 6 Average Weekly Costs for Different Values of Inventory Parameters
Reo
rder
Po
int (s)
Replenishment Point (S)
110 115 120 125 130 135 140 145 150 155
10 3329 3344 3401 3431 3450 3466 3497 3525 3564 3590
15 3346 3356 3403 3432 3457 3476 3503 3532 3563 3597
20 3361 3373 3424 3438 3469 3484 3508 3532 3573 3596
25 3377 3383 3443 3457 3477 3487 3505 3535 3569 3594
30 3375 3405 3458 3478 3502 3498 3518 3540 3577 3603
35 3395 3417 3477 3506 3528 3529 3538 3555 3591 3618
40 3408 3414 3485 3513 3535 3542 3555 3570 3589 3612
45 3412 3432 3495 3524 3549 3557 3574 3589 3601 3625
50 3411 3440 3496 3529 3552 3577 3596 3615 3631 3629
55 3422 3443 3510 3532 3560 3580 3610 3625 3649 3658
Reorder Point and Replenishment Point of Dynamic Inventory Model Under hellip
80 Research Journal of Politics Economics and Management 2016 Year4 Volume4 Issue2
Table 7 compares results of classic simulation and genetic algorithms
methods When the classic method is used average cost increases
dramatically because of that the reorder point in the formulation is high
Results of two other methods are close the result generated by genetic
algorithm is faster and has a lower cost The simulation formulates results
according presupposed intervals and therefore cannot generate solution
values directly
Table 7 Comparison of Results
Reor
der
Point
Replenish
ment
Point
Average
Cost(weekly)
Classic Method
420 527 785
GAs (ps100) 887 10913 327
Simulatio
n
10 110 333
Two-level genetic algorithmsrsquo results determined for each cost are given in
Table 8 As seen in the table when only holding cost increases model
parameters stay stable Similarly when only ordering cost increases
parameters stay again stable When both holding cost and ordering cost
increase parameters stay again stable but only total cost increases slightly
As penalty cost increases the reorder point increases dramatically and the
model converges to the base stock model (RS)
Table 8 Experimental Results for Different Costs (GAs)
Experiment
Number
Holding
Cost
Penalty
Cost
Ordering
Cost
Reorder
Point
s
Replenishment
Point S
Av
Weekly
Total
Cost euro
1 2 300 100 9 109 327
2 2 300 250 7 110 393
3 2 750 100 65 163 581
4 2 750 250 67 165 639
5 5 300 100 8 104 422
6 5 300 250 7 108 736
7 5 750 100 51 110 691
8 5 750 250 8 113 763
İ Z AKYURT
Siyaset Ekonomi ve Youmlnetim Araştırmaları Dergisi2016 Yıl 4 Cilt 4 Sayı 2 81
4 Results and Suggestions
In this study optional replenishment model is analyzed as an inventory
model Although this policy results in optimum values in practice it is hard
to determine parameters of reorder point (s) and replenishment point (S) In
order to determine these two points the demand structure is analyzed and a
cost function is formulated This function is compared with GAs codes
developed in MATLAB with the simulation developed in Microsoft Excel
Weekly average costs are calculated for different reorder and replenishment
points In the chosen case the demand for raw material is normal and its
lead time shows uniform distribution When the results are evaluated it is
seen that GAs constitutes a better alternative in terms of both time and cost
However the cost difference stems from increases of 10 units in the
simulation model When the classic method is used average cost increases
dramatically because of that the reorder point in the formulation is high
In addition in order to analyze the influence of cost change on reorder point
and replenishment point two levels are determined for holding cost penalty
cost and ordering cost The model is operated at these levels again by GAs
and the results reached are examined The examination shows that the main
cost effecting the model is the penalty cost As the penalty cost increases the
reorder point also increases Therefore the policy becomes the base stock
policy
With the help of some modifications in the structure of parameters of GAs
the solution time can be shortened Determining R as a variable the search
for a solution can be continued in a wider area Moreover the same model
can be used for various demand distributions and lead time distributions
References
Agrawal P M amp Sharda R (2012) Impact of frequency of alignment of
physical and information system inventories on out of stocks A
simulation study International Journal of Production
Economics 136(1) 45-55
Allen F amp Karjalainen R (1999) Using genetic algorithms to find
technical trading rules Journal of financial Economics 51(2) 245-
271
Arrow K J Harris T amp Marschak J (1951) Optimal inventory policy
Econometrica Journal of the Econometric Society 250-272
Bollapragada S amp Morton T E (1999) A simple heuristic for computing
nonstationary (s S) policies Operations Research 47(4) 576-584
Buchan J A amp Koenıgsberg E A (1966) Scientific inventory
management Prentice Hall
DeYong G D amp Cattani K D (2015) Fenced in Stochastic and
deterministic planning models in a time-fenced rolling-horizon
scheduling system European Journal of Operational Research
Reorder Point and Replenishment Point of Dynamic Inventory Model Under hellip
82 Research Journal of Politics Economics and Management 2016 Year4 Volume4 Issue2
Diabat A amp Deskoores R (2015) A hybrid genetic algorithm based
heuristic for an integrated supply chain problem Journal of
Manufacturing Systems
do Rego J R amp de Mesquita M A (2015) Demand forecasting and
inventory control A simulation study on automotive spare
parts International Journal of Production Economics 161 1-16
Duan Q amp Liao T W (2013) A new age-based replenishment policy for
supply chain inventory optimization of highly perishable products
International Journal of Production Economics 145(2) 658-671
Ehrhardt R (1979) The power approximation for computing (s S)
inventory policies Management Science 25(8) 777-786
Ehrhardt R (1984) (s S) policies for a dynamic inventory model with
stochastic lead times Operations Research 32(1) 121-132
Ehrhardt R amp Mosier C (1984) A revision of the power approximation
for computing (s S) policies Management Science 30(5) 618-622
Escuiacuten D Polo L amp Cipreacutes D (2016) On the comparison of inventory
replenishment policies with time-varying stochastic demand for the
paper industry Journal of Computational and Applied Mathematics
Freeland J R amp Porteus E L (1980) Evaluating the effectiveness of a
new method for computing approximately optimal (s S) inventory
policies Operations Research 28(2) 353-364
Garciacutea-Alvarado M S Paquet M amp Chaabane A (2015) On inventory
control of product recovery systems subject to environmental
mechanisms International Journal of Production Economics 165
132-144
Glover F amp Laguna M (1993) Modern heuristic techniques for
combinatorial problems Blackwell London
Goldberg D E (1989) Genetic algorithms in search and machine learning
Reading Addison Wesley
Hillier F S (1995) Introduction to operations research Tata McGraw-Hill
Education
Hwang H Choi B amp Lee M J (2005) A model for shelf space
allocation and inventory control considering location and inventory
level effects on demand International Journal of Production
Economics 97(2) 185-195
Iglehart D L (1963) Optimality of (s S) policies in the infinite horizon
dynamic inventory problem Management science 9(2) 259-267
Jana D K Das B amp Maiti M (2014) Multi-item partial backlogging
inventory models over random planning horizon in random fuzzy
environment Applied Soft Computing 21 12-27
İ Z AKYURT
Siyaset Ekonomi ve Youmlnetim Araştırmaları Dergisi2016 Yıl 4 Cilt 4 Sayı 2 83
Karlin S (1958) The Application of Renewal Theory to the Study of
Inventory Policies Chap 15 in Arrow KJ S Karlin and H
Scarf Studies in the Mathematical Theory of Inventory and
Production
Kouki C amp Jouini O (2015) On the effect of lifetime variability on the
performance of inventory systems International Journal of
Production Economics 167 23-34
Koumlchel Peter amp Nielaumlnder U (2005) Simulation-based optimization of
multi-echelon inventory systems International journal of production
economics 93 505-513
Larson C E Olson L J amp Sharma S (2001) Optimal inventory policies
when the demand distribution is not known Journal of economic
Theory 101(1) 281-300
Lin K P Chang P T Hung K C amp Pai P F (2010) A simulation of
vendor managed inventory dynamics using fuzzy arithmetic
operations with genetic algorithms Expert Systems with
Applications 37(3) 2571-2579
Maiti M K amp Maiti M (2006) Fuzzy inventory model with two
warehouses under possibility constraints Fuzzy Sets and
Systems 157(1) 52-73
Naddor E (1975) Optimal and heuristic decisions in single-and multi-item
inventory systems Management Science 21(11) 1234-1249
Nia A R Far M H amp Niaki S T A (2014) A fuzzy vendor managed
inventory of multi-item economic order quantity model under
shortage An ant colony optimization algorithm International
Journal of Production Economics 155 259-271
Nielsen C amp Larsen C (2005) An analytical study of the Q (s S) policy
applied to the joint replenishment problem European Journal of
Operational Research 163(3) 721-732
Porteus E L (1971) On the optimality of generalized (s S) policies
Management Science 17(7) 411-426
Rabta B amp Aiumlssani D (2005) Strong stability in an (R s S) inventory
model International Journal of Production Economics 97(2) 159-
171
Rezaei J amp Davoodi M (2011) Multi-objective models for lot-sizing with
supplier selection International Journal of Production
Economics 130(1) 77-86
Roberts D M (1962) Approximations to optimal policies in a dynamic
inventory model Studies in applied probability and management
science (7) 207
Reorder Point and Replenishment Point of Dynamic Inventory Model Under hellip
84 Research Journal of Politics Economics and Management 2016 Year4 Volume4 Issue2
Scarf H (1960) The Optimality of (s S) Policies in Dynamic Inventory
Problems K Arrow S Karlin P Suppes eds Mathematical
Models in the Social Sciences
Schneider H (1978) Methods for determining the re-order point of an (s S)
ordering policy when a service level is specified Journal of the
Operational Research Society 1181-1193
Sezen H K amp Erdoğmuş Ş (2005) Envanter Politikası Belirlemede
Benzetim Uygulaması 7 Ulusal Ekonometri ve İstatistik
Sempozyumu
Silver E A Pyke D F amp Peterson R (1998) Inventory management and
production planning and scheduling (Vol 3 p 30) New York
Wiley
Sivazlian B D (1971) Dimensional and computational analysis in
stationary (s S) inventory problems with gamma distributed
demand Management Science 17(6) B-307
Stevenson W J amp Sum C C (2009) Operations management (Vol 8)
Boston MA McGraw-HillIrwin
Taleizadeh A A Niaki S T A Aryanezhad M B amp Shafii N (2013)
A hybrid method of fuzzy simulation and genetic algorithm to
optimize constrained inventory control systems with stochastic
replenishments and fuzzy demand Information Sciences 220 425-
441
Thiel D Hovelaque V amp Le Hoa V T (2010) Impact of inventory
inaccuracy on service-level quality in (Q R) continuous-review lost-
sales inventory models International Journal of Production
Economics 123(2) 301-311
Tijms H C amp Groenevelt H (1984) Simple approximations for the
reorder point in periodic and continuous review (s S) inventory
systems with service level constraints European journal of
operational research 17(2) 175-190
Veinott Jr A F (1966) On the Optimality of (sS) Inventory Policies New
Conditions and a New Proof SIAM Journal on Applied
Mathematics 14(5) 1067-1083
Wagner H M (1975) Principle of Operations Research Englewood Cliff
White A S amp Censlive M (2015) Control system analysis of labor supply
flows in production systems Journal of Manufacturing Systems 37
316-327
Ye W amp You F (2016) A computationally efficient simulation-based
optimization method with region-wise surrogate modeling for
stochastic inventory management of supply chains with general
İ Z AKYURT
Siyaset Ekonomi ve Youmlnetim Araştırmaları Dergisi2016 Yıl 4 Cilt 4 Sayı 2 85
network structures Computers amp Chemical Engineering 87 164-
179
Yin K K Liu H amp Johnson N E (2002) Markovian inventory policy
with application to the paper industry Computers amp chemical
engineering 26(10) 1399-1413
Zheng Y S amp Federgruen A (1991) Finding optimal (s S) policies is
about as simple as evaluating a single policy Operations
research 39(4) 654-665
Zhou W Q Chen L amp Ge H M (2013) A multi-product multi-echelon
inventory control model with joint replenishment strategy Applied
Mathematical Modelling 37(4) 2039-2050
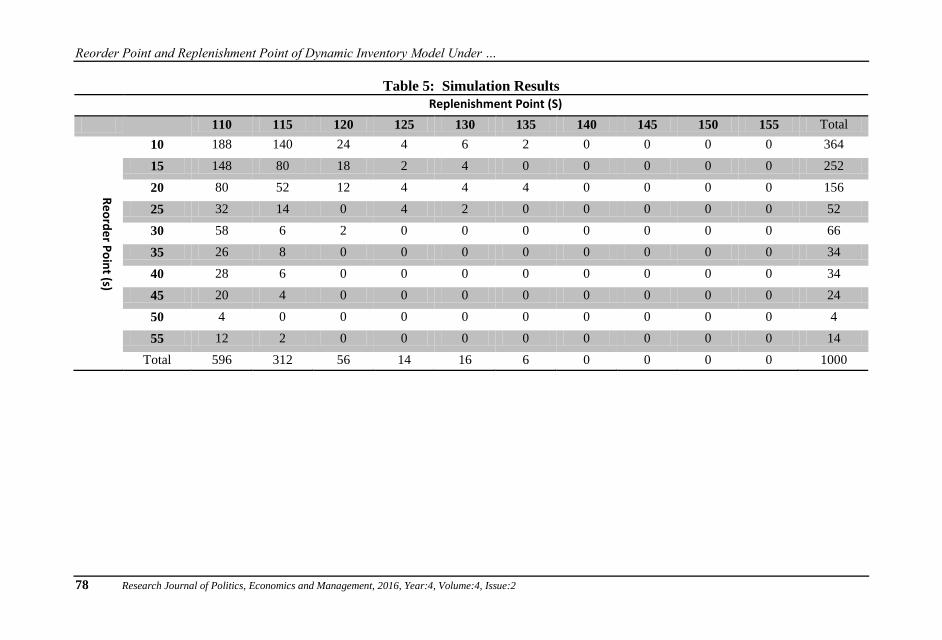
Reorder Point and Replenishment Point of Dynamic Inventory Model Under hellip
78 Research Journal of Politics Economics and Management 2016 Year4 Volume4 Issue2
Table 5 Simulation Results
Replenishment Point (S)
110 115 120 125 130 135 140 145 150 155 Total
Re
ord
er P
oin
t (s)
10 188 140 24 4 6 2 0 0 0 0 364
15 148 80 18 2 4 0 0 0 0 0 252
20 80 52 12 4 4 4 0 0 0 0 156
25 32 14 0 4 2 0 0 0 0 0 52
30 58 6 2 0 0 0 0 0 0 0 66
35 26 8 0 0 0 0 0 0 0 0 34
40 28 6 0 0 0 0 0 0 0 0 34
45 20 4 0 0 0 0 0 0 0 0 24
50 4 0 0 0 0 0 0 0 0 0 4
55 12 2 0 0 0 0 0 0 0 0 14
Total 596 312 56 14 16 6 0 0 0 0 1000
İ Z AKYURT
Siyaset Ekonomi ve Youmlnetim Araştırmaları Dergisi2016 Yıl 4 Cilt 4 Sayı 2 79
Table 6 Average Weekly Costs for Different Values of Inventory Parameters
Reo
rder
Po
int (s)
Replenishment Point (S)
110 115 120 125 130 135 140 145 150 155
10 3329 3344 3401 3431 3450 3466 3497 3525 3564 3590
15 3346 3356 3403 3432 3457 3476 3503 3532 3563 3597
20 3361 3373 3424 3438 3469 3484 3508 3532 3573 3596
25 3377 3383 3443 3457 3477 3487 3505 3535 3569 3594
30 3375 3405 3458 3478 3502 3498 3518 3540 3577 3603
35 3395 3417 3477 3506 3528 3529 3538 3555 3591 3618
40 3408 3414 3485 3513 3535 3542 3555 3570 3589 3612
45 3412 3432 3495 3524 3549 3557 3574 3589 3601 3625
50 3411 3440 3496 3529 3552 3577 3596 3615 3631 3629
55 3422 3443 3510 3532 3560 3580 3610 3625 3649 3658
Reorder Point and Replenishment Point of Dynamic Inventory Model Under hellip
80 Research Journal of Politics Economics and Management 2016 Year4 Volume4 Issue2
Table 7 compares results of classic simulation and genetic algorithms
methods When the classic method is used average cost increases
dramatically because of that the reorder point in the formulation is high
Results of two other methods are close the result generated by genetic
algorithm is faster and has a lower cost The simulation formulates results
according presupposed intervals and therefore cannot generate solution
values directly
Table 7 Comparison of Results
Reor
der
Point
Replenish
ment
Point
Average
Cost(weekly)
Classic Method
420 527 785
GAs (ps100) 887 10913 327
Simulatio
n
10 110 333
Two-level genetic algorithmsrsquo results determined for each cost are given in
Table 8 As seen in the table when only holding cost increases model
parameters stay stable Similarly when only ordering cost increases
parameters stay again stable When both holding cost and ordering cost
increase parameters stay again stable but only total cost increases slightly
As penalty cost increases the reorder point increases dramatically and the
model converges to the base stock model (RS)
Table 8 Experimental Results for Different Costs (GAs)
Experiment
Number
Holding
Cost
Penalty
Cost
Ordering
Cost
Reorder
Point
s
Replenishment
Point S
Av
Weekly
Total
Cost euro
1 2 300 100 9 109 327
2 2 300 250 7 110 393
3 2 750 100 65 163 581
4 2 750 250 67 165 639
5 5 300 100 8 104 422
6 5 300 250 7 108 736
7 5 750 100 51 110 691
8 5 750 250 8 113 763
İ Z AKYURT
Siyaset Ekonomi ve Youmlnetim Araştırmaları Dergisi2016 Yıl 4 Cilt 4 Sayı 2 81
4 Results and Suggestions
In this study optional replenishment model is analyzed as an inventory
model Although this policy results in optimum values in practice it is hard
to determine parameters of reorder point (s) and replenishment point (S) In
order to determine these two points the demand structure is analyzed and a
cost function is formulated This function is compared with GAs codes
developed in MATLAB with the simulation developed in Microsoft Excel
Weekly average costs are calculated for different reorder and replenishment
points In the chosen case the demand for raw material is normal and its
lead time shows uniform distribution When the results are evaluated it is
seen that GAs constitutes a better alternative in terms of both time and cost
However the cost difference stems from increases of 10 units in the
simulation model When the classic method is used average cost increases
dramatically because of that the reorder point in the formulation is high
In addition in order to analyze the influence of cost change on reorder point
and replenishment point two levels are determined for holding cost penalty
cost and ordering cost The model is operated at these levels again by GAs
and the results reached are examined The examination shows that the main
cost effecting the model is the penalty cost As the penalty cost increases the
reorder point also increases Therefore the policy becomes the base stock
policy
With the help of some modifications in the structure of parameters of GAs
the solution time can be shortened Determining R as a variable the search
for a solution can be continued in a wider area Moreover the same model
can be used for various demand distributions and lead time distributions
References
Agrawal P M amp Sharda R (2012) Impact of frequency of alignment of
physical and information system inventories on out of stocks A
simulation study International Journal of Production
Economics 136(1) 45-55
Allen F amp Karjalainen R (1999) Using genetic algorithms to find
technical trading rules Journal of financial Economics 51(2) 245-
271
Arrow K J Harris T amp Marschak J (1951) Optimal inventory policy
Econometrica Journal of the Econometric Society 250-272
Bollapragada S amp Morton T E (1999) A simple heuristic for computing
nonstationary (s S) policies Operations Research 47(4) 576-584
Buchan J A amp Koenıgsberg E A (1966) Scientific inventory
management Prentice Hall
DeYong G D amp Cattani K D (2015) Fenced in Stochastic and
deterministic planning models in a time-fenced rolling-horizon
scheduling system European Journal of Operational Research
Reorder Point and Replenishment Point of Dynamic Inventory Model Under hellip
82 Research Journal of Politics Economics and Management 2016 Year4 Volume4 Issue2
Diabat A amp Deskoores R (2015) A hybrid genetic algorithm based
heuristic for an integrated supply chain problem Journal of
Manufacturing Systems
do Rego J R amp de Mesquita M A (2015) Demand forecasting and
inventory control A simulation study on automotive spare
parts International Journal of Production Economics 161 1-16
Duan Q amp Liao T W (2013) A new age-based replenishment policy for
supply chain inventory optimization of highly perishable products
International Journal of Production Economics 145(2) 658-671
Ehrhardt R (1979) The power approximation for computing (s S)
inventory policies Management Science 25(8) 777-786
Ehrhardt R (1984) (s S) policies for a dynamic inventory model with
stochastic lead times Operations Research 32(1) 121-132
Ehrhardt R amp Mosier C (1984) A revision of the power approximation
for computing (s S) policies Management Science 30(5) 618-622
Escuiacuten D Polo L amp Cipreacutes D (2016) On the comparison of inventory
replenishment policies with time-varying stochastic demand for the
paper industry Journal of Computational and Applied Mathematics
Freeland J R amp Porteus E L (1980) Evaluating the effectiveness of a
new method for computing approximately optimal (s S) inventory
policies Operations Research 28(2) 353-364
Garciacutea-Alvarado M S Paquet M amp Chaabane A (2015) On inventory
control of product recovery systems subject to environmental
mechanisms International Journal of Production Economics 165
132-144
Glover F amp Laguna M (1993) Modern heuristic techniques for
combinatorial problems Blackwell London
Goldberg D E (1989) Genetic algorithms in search and machine learning
Reading Addison Wesley
Hillier F S (1995) Introduction to operations research Tata McGraw-Hill
Education
Hwang H Choi B amp Lee M J (2005) A model for shelf space
allocation and inventory control considering location and inventory
level effects on demand International Journal of Production
Economics 97(2) 185-195
Iglehart D L (1963) Optimality of (s S) policies in the infinite horizon
dynamic inventory problem Management science 9(2) 259-267
Jana D K Das B amp Maiti M (2014) Multi-item partial backlogging
inventory models over random planning horizon in random fuzzy
environment Applied Soft Computing 21 12-27
İ Z AKYURT
Siyaset Ekonomi ve Youmlnetim Araştırmaları Dergisi2016 Yıl 4 Cilt 4 Sayı 2 83
Karlin S (1958) The Application of Renewal Theory to the Study of
Inventory Policies Chap 15 in Arrow KJ S Karlin and H
Scarf Studies in the Mathematical Theory of Inventory and
Production
Kouki C amp Jouini O (2015) On the effect of lifetime variability on the
performance of inventory systems International Journal of
Production Economics 167 23-34
Koumlchel Peter amp Nielaumlnder U (2005) Simulation-based optimization of
multi-echelon inventory systems International journal of production
economics 93 505-513
Larson C E Olson L J amp Sharma S (2001) Optimal inventory policies
when the demand distribution is not known Journal of economic
Theory 101(1) 281-300
Lin K P Chang P T Hung K C amp Pai P F (2010) A simulation of
vendor managed inventory dynamics using fuzzy arithmetic
operations with genetic algorithms Expert Systems with
Applications 37(3) 2571-2579
Maiti M K amp Maiti M (2006) Fuzzy inventory model with two
warehouses under possibility constraints Fuzzy Sets and
Systems 157(1) 52-73
Naddor E (1975) Optimal and heuristic decisions in single-and multi-item
inventory systems Management Science 21(11) 1234-1249
Nia A R Far M H amp Niaki S T A (2014) A fuzzy vendor managed
inventory of multi-item economic order quantity model under
shortage An ant colony optimization algorithm International
Journal of Production Economics 155 259-271
Nielsen C amp Larsen C (2005) An analytical study of the Q (s S) policy
applied to the joint replenishment problem European Journal of
Operational Research 163(3) 721-732
Porteus E L (1971) On the optimality of generalized (s S) policies
Management Science 17(7) 411-426
Rabta B amp Aiumlssani D (2005) Strong stability in an (R s S) inventory
model International Journal of Production Economics 97(2) 159-
171
Rezaei J amp Davoodi M (2011) Multi-objective models for lot-sizing with
supplier selection International Journal of Production
Economics 130(1) 77-86
Roberts D M (1962) Approximations to optimal policies in a dynamic
inventory model Studies in applied probability and management
science (7) 207
Reorder Point and Replenishment Point of Dynamic Inventory Model Under hellip
84 Research Journal of Politics Economics and Management 2016 Year4 Volume4 Issue2
Scarf H (1960) The Optimality of (s S) Policies in Dynamic Inventory
Problems K Arrow S Karlin P Suppes eds Mathematical
Models in the Social Sciences
Schneider H (1978) Methods for determining the re-order point of an (s S)
ordering policy when a service level is specified Journal of the
Operational Research Society 1181-1193
Sezen H K amp Erdoğmuş Ş (2005) Envanter Politikası Belirlemede
Benzetim Uygulaması 7 Ulusal Ekonometri ve İstatistik
Sempozyumu
Silver E A Pyke D F amp Peterson R (1998) Inventory management and
production planning and scheduling (Vol 3 p 30) New York
Wiley
Sivazlian B D (1971) Dimensional and computational analysis in
stationary (s S) inventory problems with gamma distributed
demand Management Science 17(6) B-307
Stevenson W J amp Sum C C (2009) Operations management (Vol 8)
Boston MA McGraw-HillIrwin
Taleizadeh A A Niaki S T A Aryanezhad M B amp Shafii N (2013)
A hybrid method of fuzzy simulation and genetic algorithm to
optimize constrained inventory control systems with stochastic
replenishments and fuzzy demand Information Sciences 220 425-
441
Thiel D Hovelaque V amp Le Hoa V T (2010) Impact of inventory
inaccuracy on service-level quality in (Q R) continuous-review lost-
sales inventory models International Journal of Production
Economics 123(2) 301-311
Tijms H C amp Groenevelt H (1984) Simple approximations for the
reorder point in periodic and continuous review (s S) inventory
systems with service level constraints European journal of
operational research 17(2) 175-190
Veinott Jr A F (1966) On the Optimality of (sS) Inventory Policies New
Conditions and a New Proof SIAM Journal on Applied
Mathematics 14(5) 1067-1083
Wagner H M (1975) Principle of Operations Research Englewood Cliff
White A S amp Censlive M (2015) Control system analysis of labor supply
flows in production systems Journal of Manufacturing Systems 37
316-327
Ye W amp You F (2016) A computationally efficient simulation-based
optimization method with region-wise surrogate modeling for
stochastic inventory management of supply chains with general
İ Z AKYURT
Siyaset Ekonomi ve Youmlnetim Araştırmaları Dergisi2016 Yıl 4 Cilt 4 Sayı 2 85
network structures Computers amp Chemical Engineering 87 164-
179
Yin K K Liu H amp Johnson N E (2002) Markovian inventory policy
with application to the paper industry Computers amp chemical
engineering 26(10) 1399-1413
Zheng Y S amp Federgruen A (1991) Finding optimal (s S) policies is
about as simple as evaluating a single policy Operations
research 39(4) 654-665
Zhou W Q Chen L amp Ge H M (2013) A multi-product multi-echelon
inventory control model with joint replenishment strategy Applied
Mathematical Modelling 37(4) 2039-2050
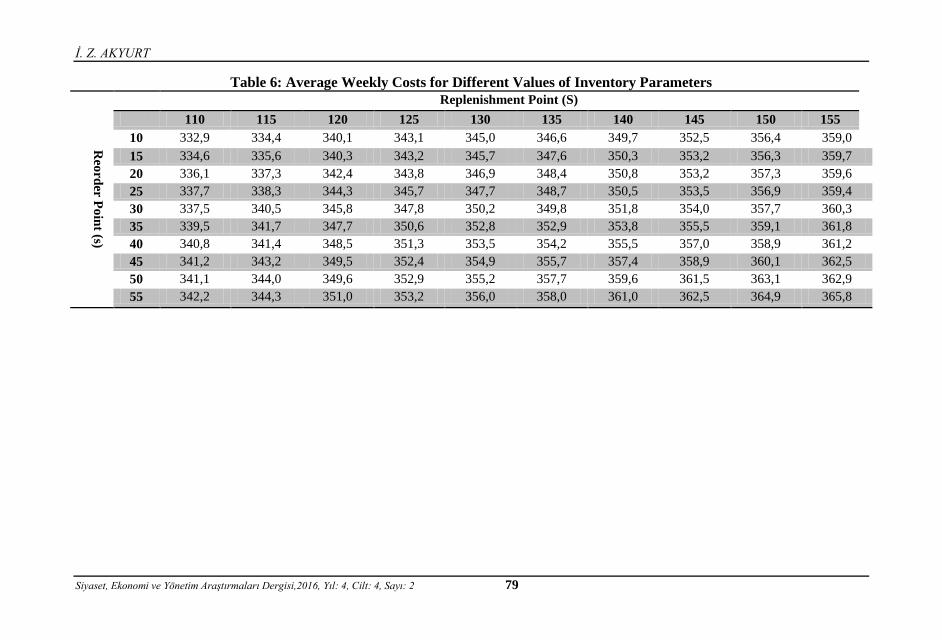
İ Z AKYURT
Siyaset Ekonomi ve Youmlnetim Araştırmaları Dergisi2016 Yıl 4 Cilt 4 Sayı 2 79
Table 6 Average Weekly Costs for Different Values of Inventory Parameters
Reo
rder
Po
int (s)
Replenishment Point (S)
110 115 120 125 130 135 140 145 150 155
10 3329 3344 3401 3431 3450 3466 3497 3525 3564 3590
15 3346 3356 3403 3432 3457 3476 3503 3532 3563 3597
20 3361 3373 3424 3438 3469 3484 3508 3532 3573 3596
25 3377 3383 3443 3457 3477 3487 3505 3535 3569 3594
30 3375 3405 3458 3478 3502 3498 3518 3540 3577 3603
35 3395 3417 3477 3506 3528 3529 3538 3555 3591 3618
40 3408 3414 3485 3513 3535 3542 3555 3570 3589 3612
45 3412 3432 3495 3524 3549 3557 3574 3589 3601 3625
50 3411 3440 3496 3529 3552 3577 3596 3615 3631 3629
55 3422 3443 3510 3532 3560 3580 3610 3625 3649 3658
Reorder Point and Replenishment Point of Dynamic Inventory Model Under hellip
80 Research Journal of Politics Economics and Management 2016 Year4 Volume4 Issue2
Table 7 compares results of classic simulation and genetic algorithms
methods When the classic method is used average cost increases
dramatically because of that the reorder point in the formulation is high
Results of two other methods are close the result generated by genetic
algorithm is faster and has a lower cost The simulation formulates results
according presupposed intervals and therefore cannot generate solution
values directly
Table 7 Comparison of Results
Reor
der
Point
Replenish
ment
Point
Average
Cost(weekly)
Classic Method
420 527 785
GAs (ps100) 887 10913 327
Simulatio
n
10 110 333
Two-level genetic algorithmsrsquo results determined for each cost are given in
Table 8 As seen in the table when only holding cost increases model
parameters stay stable Similarly when only ordering cost increases
parameters stay again stable When both holding cost and ordering cost
increase parameters stay again stable but only total cost increases slightly
As penalty cost increases the reorder point increases dramatically and the
model converges to the base stock model (RS)
Table 8 Experimental Results for Different Costs (GAs)
Experiment
Number
Holding
Cost
Penalty
Cost
Ordering
Cost
Reorder
Point
s
Replenishment
Point S
Av
Weekly
Total
Cost euro
1 2 300 100 9 109 327
2 2 300 250 7 110 393
3 2 750 100 65 163 581
4 2 750 250 67 165 639
5 5 300 100 8 104 422
6 5 300 250 7 108 736
7 5 750 100 51 110 691
8 5 750 250 8 113 763
İ Z AKYURT
Siyaset Ekonomi ve Youmlnetim Araştırmaları Dergisi2016 Yıl 4 Cilt 4 Sayı 2 81
4 Results and Suggestions
In this study optional replenishment model is analyzed as an inventory
model Although this policy results in optimum values in practice it is hard
to determine parameters of reorder point (s) and replenishment point (S) In
order to determine these two points the demand structure is analyzed and a
cost function is formulated This function is compared with GAs codes
developed in MATLAB with the simulation developed in Microsoft Excel
Weekly average costs are calculated for different reorder and replenishment
points In the chosen case the demand for raw material is normal and its
lead time shows uniform distribution When the results are evaluated it is
seen that GAs constitutes a better alternative in terms of both time and cost
However the cost difference stems from increases of 10 units in the
simulation model When the classic method is used average cost increases
dramatically because of that the reorder point in the formulation is high
In addition in order to analyze the influence of cost change on reorder point
and replenishment point two levels are determined for holding cost penalty
cost and ordering cost The model is operated at these levels again by GAs
and the results reached are examined The examination shows that the main
cost effecting the model is the penalty cost As the penalty cost increases the
reorder point also increases Therefore the policy becomes the base stock
policy
With the help of some modifications in the structure of parameters of GAs
the solution time can be shortened Determining R as a variable the search
for a solution can be continued in a wider area Moreover the same model
can be used for various demand distributions and lead time distributions
References
Agrawal P M amp Sharda R (2012) Impact of frequency of alignment of
physical and information system inventories on out of stocks A
simulation study International Journal of Production
Economics 136(1) 45-55
Allen F amp Karjalainen R (1999) Using genetic algorithms to find
technical trading rules Journal of financial Economics 51(2) 245-
271
Arrow K J Harris T amp Marschak J (1951) Optimal inventory policy
Econometrica Journal of the Econometric Society 250-272
Bollapragada S amp Morton T E (1999) A simple heuristic for computing
nonstationary (s S) policies Operations Research 47(4) 576-584
Buchan J A amp Koenıgsberg E A (1966) Scientific inventory
management Prentice Hall
DeYong G D amp Cattani K D (2015) Fenced in Stochastic and
deterministic planning models in a time-fenced rolling-horizon
scheduling system European Journal of Operational Research
Reorder Point and Replenishment Point of Dynamic Inventory Model Under hellip
82 Research Journal of Politics Economics and Management 2016 Year4 Volume4 Issue2
Diabat A amp Deskoores R (2015) A hybrid genetic algorithm based
heuristic for an integrated supply chain problem Journal of
Manufacturing Systems
do Rego J R amp de Mesquita M A (2015) Demand forecasting and
inventory control A simulation study on automotive spare
parts International Journal of Production Economics 161 1-16
Duan Q amp Liao T W (2013) A new age-based replenishment policy for
supply chain inventory optimization of highly perishable products
International Journal of Production Economics 145(2) 658-671
Ehrhardt R (1979) The power approximation for computing (s S)
inventory policies Management Science 25(8) 777-786
Ehrhardt R (1984) (s S) policies for a dynamic inventory model with
stochastic lead times Operations Research 32(1) 121-132
Ehrhardt R amp Mosier C (1984) A revision of the power approximation
for computing (s S) policies Management Science 30(5) 618-622
Escuiacuten D Polo L amp Cipreacutes D (2016) On the comparison of inventory
replenishment policies with time-varying stochastic demand for the
paper industry Journal of Computational and Applied Mathematics
Freeland J R amp Porteus E L (1980) Evaluating the effectiveness of a
new method for computing approximately optimal (s S) inventory
policies Operations Research 28(2) 353-364
Garciacutea-Alvarado M S Paquet M amp Chaabane A (2015) On inventory
control of product recovery systems subject to environmental
mechanisms International Journal of Production Economics 165
132-144
Glover F amp Laguna M (1993) Modern heuristic techniques for
combinatorial problems Blackwell London
Goldberg D E (1989) Genetic algorithms in search and machine learning
Reading Addison Wesley
Hillier F S (1995) Introduction to operations research Tata McGraw-Hill
Education
Hwang H Choi B amp Lee M J (2005) A model for shelf space
allocation and inventory control considering location and inventory
level effects on demand International Journal of Production
Economics 97(2) 185-195
Iglehart D L (1963) Optimality of (s S) policies in the infinite horizon
dynamic inventory problem Management science 9(2) 259-267
Jana D K Das B amp Maiti M (2014) Multi-item partial backlogging
inventory models over random planning horizon in random fuzzy
environment Applied Soft Computing 21 12-27
İ Z AKYURT
Siyaset Ekonomi ve Youmlnetim Araştırmaları Dergisi2016 Yıl 4 Cilt 4 Sayı 2 83
Karlin S (1958) The Application of Renewal Theory to the Study of
Inventory Policies Chap 15 in Arrow KJ S Karlin and H
Scarf Studies in the Mathematical Theory of Inventory and
Production
Kouki C amp Jouini O (2015) On the effect of lifetime variability on the
performance of inventory systems International Journal of
Production Economics 167 23-34
Koumlchel Peter amp Nielaumlnder U (2005) Simulation-based optimization of
multi-echelon inventory systems International journal of production
economics 93 505-513
Larson C E Olson L J amp Sharma S (2001) Optimal inventory policies
when the demand distribution is not known Journal of economic
Theory 101(1) 281-300
Lin K P Chang P T Hung K C amp Pai P F (2010) A simulation of
vendor managed inventory dynamics using fuzzy arithmetic
operations with genetic algorithms Expert Systems with
Applications 37(3) 2571-2579
Maiti M K amp Maiti M (2006) Fuzzy inventory model with two
warehouses under possibility constraints Fuzzy Sets and
Systems 157(1) 52-73
Naddor E (1975) Optimal and heuristic decisions in single-and multi-item
inventory systems Management Science 21(11) 1234-1249
Nia A R Far M H amp Niaki S T A (2014) A fuzzy vendor managed
inventory of multi-item economic order quantity model under
shortage An ant colony optimization algorithm International
Journal of Production Economics 155 259-271
Nielsen C amp Larsen C (2005) An analytical study of the Q (s S) policy
applied to the joint replenishment problem European Journal of
Operational Research 163(3) 721-732
Porteus E L (1971) On the optimality of generalized (s S) policies
Management Science 17(7) 411-426
Rabta B amp Aiumlssani D (2005) Strong stability in an (R s S) inventory
model International Journal of Production Economics 97(2) 159-
171
Rezaei J amp Davoodi M (2011) Multi-objective models for lot-sizing with
supplier selection International Journal of Production
Economics 130(1) 77-86
Roberts D M (1962) Approximations to optimal policies in a dynamic
inventory model Studies in applied probability and management
science (7) 207
Reorder Point and Replenishment Point of Dynamic Inventory Model Under hellip
84 Research Journal of Politics Economics and Management 2016 Year4 Volume4 Issue2
Scarf H (1960) The Optimality of (s S) Policies in Dynamic Inventory
Problems K Arrow S Karlin P Suppes eds Mathematical
Models in the Social Sciences
Schneider H (1978) Methods for determining the re-order point of an (s S)
ordering policy when a service level is specified Journal of the
Operational Research Society 1181-1193
Sezen H K amp Erdoğmuş Ş (2005) Envanter Politikası Belirlemede
Benzetim Uygulaması 7 Ulusal Ekonometri ve İstatistik
Sempozyumu
Silver E A Pyke D F amp Peterson R (1998) Inventory management and
production planning and scheduling (Vol 3 p 30) New York
Wiley
Sivazlian B D (1971) Dimensional and computational analysis in
stationary (s S) inventory problems with gamma distributed
demand Management Science 17(6) B-307
Stevenson W J amp Sum C C (2009) Operations management (Vol 8)
Boston MA McGraw-HillIrwin
Taleizadeh A A Niaki S T A Aryanezhad M B amp Shafii N (2013)
A hybrid method of fuzzy simulation and genetic algorithm to
optimize constrained inventory control systems with stochastic
replenishments and fuzzy demand Information Sciences 220 425-
441
Thiel D Hovelaque V amp Le Hoa V T (2010) Impact of inventory
inaccuracy on service-level quality in (Q R) continuous-review lost-
sales inventory models International Journal of Production
Economics 123(2) 301-311
Tijms H C amp Groenevelt H (1984) Simple approximations for the
reorder point in periodic and continuous review (s S) inventory
systems with service level constraints European journal of
operational research 17(2) 175-190
Veinott Jr A F (1966) On the Optimality of (sS) Inventory Policies New
Conditions and a New Proof SIAM Journal on Applied
Mathematics 14(5) 1067-1083
Wagner H M (1975) Principle of Operations Research Englewood Cliff
White A S amp Censlive M (2015) Control system analysis of labor supply
flows in production systems Journal of Manufacturing Systems 37
316-327
Ye W amp You F (2016) A computationally efficient simulation-based
optimization method with region-wise surrogate modeling for
stochastic inventory management of supply chains with general
İ Z AKYURT
Siyaset Ekonomi ve Youmlnetim Araştırmaları Dergisi2016 Yıl 4 Cilt 4 Sayı 2 85
network structures Computers amp Chemical Engineering 87 164-
179
Yin K K Liu H amp Johnson N E (2002) Markovian inventory policy
with application to the paper industry Computers amp chemical
engineering 26(10) 1399-1413
Zheng Y S amp Federgruen A (1991) Finding optimal (s S) policies is
about as simple as evaluating a single policy Operations
research 39(4) 654-665
Zhou W Q Chen L amp Ge H M (2013) A multi-product multi-echelon
inventory control model with joint replenishment strategy Applied
Mathematical Modelling 37(4) 2039-2050

Reorder Point and Replenishment Point of Dynamic Inventory Model Under hellip
80 Research Journal of Politics Economics and Management 2016 Year4 Volume4 Issue2
Table 7 compares results of classic simulation and genetic algorithms
methods When the classic method is used average cost increases
dramatically because of that the reorder point in the formulation is high
Results of two other methods are close the result generated by genetic
algorithm is faster and has a lower cost The simulation formulates results
according presupposed intervals and therefore cannot generate solution
values directly
Table 7 Comparison of Results
Reor
der
Point
Replenish
ment
Point
Average
Cost(weekly)
Classic Method
420 527 785
GAs (ps100) 887 10913 327
Simulatio
n
10 110 333
Two-level genetic algorithmsrsquo results determined for each cost are given in
Table 8 As seen in the table when only holding cost increases model
parameters stay stable Similarly when only ordering cost increases
parameters stay again stable When both holding cost and ordering cost
increase parameters stay again stable but only total cost increases slightly
As penalty cost increases the reorder point increases dramatically and the
model converges to the base stock model (RS)
Table 8 Experimental Results for Different Costs (GAs)
Experiment
Number
Holding
Cost
Penalty
Cost
Ordering
Cost
Reorder
Point
s
Replenishment
Point S
Av
Weekly
Total
Cost euro
1 2 300 100 9 109 327
2 2 300 250 7 110 393
3 2 750 100 65 163 581
4 2 750 250 67 165 639
5 5 300 100 8 104 422
6 5 300 250 7 108 736
7 5 750 100 51 110 691
8 5 750 250 8 113 763
İ Z AKYURT
Siyaset Ekonomi ve Youmlnetim Araştırmaları Dergisi2016 Yıl 4 Cilt 4 Sayı 2 81
4 Results and Suggestions
In this study optional replenishment model is analyzed as an inventory
model Although this policy results in optimum values in practice it is hard
to determine parameters of reorder point (s) and replenishment point (S) In
order to determine these two points the demand structure is analyzed and a
cost function is formulated This function is compared with GAs codes
developed in MATLAB with the simulation developed in Microsoft Excel
Weekly average costs are calculated for different reorder and replenishment
points In the chosen case the demand for raw material is normal and its
lead time shows uniform distribution When the results are evaluated it is
seen that GAs constitutes a better alternative in terms of both time and cost
However the cost difference stems from increases of 10 units in the
simulation model When the classic method is used average cost increases
dramatically because of that the reorder point in the formulation is high
In addition in order to analyze the influence of cost change on reorder point
and replenishment point two levels are determined for holding cost penalty
cost and ordering cost The model is operated at these levels again by GAs
and the results reached are examined The examination shows that the main
cost effecting the model is the penalty cost As the penalty cost increases the
reorder point also increases Therefore the policy becomes the base stock
policy
With the help of some modifications in the structure of parameters of GAs
the solution time can be shortened Determining R as a variable the search
for a solution can be continued in a wider area Moreover the same model
can be used for various demand distributions and lead time distributions
References
Agrawal P M amp Sharda R (2012) Impact of frequency of alignment of
physical and information system inventories on out of stocks A
simulation study International Journal of Production
Economics 136(1) 45-55
Allen F amp Karjalainen R (1999) Using genetic algorithms to find
technical trading rules Journal of financial Economics 51(2) 245-
271
Arrow K J Harris T amp Marschak J (1951) Optimal inventory policy
Econometrica Journal of the Econometric Society 250-272
Bollapragada S amp Morton T E (1999) A simple heuristic for computing
nonstationary (s S) policies Operations Research 47(4) 576-584
Buchan J A amp Koenıgsberg E A (1966) Scientific inventory
management Prentice Hall
DeYong G D amp Cattani K D (2015) Fenced in Stochastic and
deterministic planning models in a time-fenced rolling-horizon
scheduling system European Journal of Operational Research
Reorder Point and Replenishment Point of Dynamic Inventory Model Under hellip
82 Research Journal of Politics Economics and Management 2016 Year4 Volume4 Issue2
Diabat A amp Deskoores R (2015) A hybrid genetic algorithm based
heuristic for an integrated supply chain problem Journal of
Manufacturing Systems
do Rego J R amp de Mesquita M A (2015) Demand forecasting and
inventory control A simulation study on automotive spare
parts International Journal of Production Economics 161 1-16
Duan Q amp Liao T W (2013) A new age-based replenishment policy for
supply chain inventory optimization of highly perishable products
International Journal of Production Economics 145(2) 658-671
Ehrhardt R (1979) The power approximation for computing (s S)
inventory policies Management Science 25(8) 777-786
Ehrhardt R (1984) (s S) policies for a dynamic inventory model with
stochastic lead times Operations Research 32(1) 121-132
Ehrhardt R amp Mosier C (1984) A revision of the power approximation
for computing (s S) policies Management Science 30(5) 618-622
Escuiacuten D Polo L amp Cipreacutes D (2016) On the comparison of inventory
replenishment policies with time-varying stochastic demand for the
paper industry Journal of Computational and Applied Mathematics
Freeland J R amp Porteus E L (1980) Evaluating the effectiveness of a
new method for computing approximately optimal (s S) inventory
policies Operations Research 28(2) 353-364
Garciacutea-Alvarado M S Paquet M amp Chaabane A (2015) On inventory
control of product recovery systems subject to environmental
mechanisms International Journal of Production Economics 165
132-144
Glover F amp Laguna M (1993) Modern heuristic techniques for
combinatorial problems Blackwell London
Goldberg D E (1989) Genetic algorithms in search and machine learning
Reading Addison Wesley
Hillier F S (1995) Introduction to operations research Tata McGraw-Hill
Education
Hwang H Choi B amp Lee M J (2005) A model for shelf space
allocation and inventory control considering location and inventory
level effects on demand International Journal of Production
Economics 97(2) 185-195
Iglehart D L (1963) Optimality of (s S) policies in the infinite horizon
dynamic inventory problem Management science 9(2) 259-267
Jana D K Das B amp Maiti M (2014) Multi-item partial backlogging
inventory models over random planning horizon in random fuzzy
environment Applied Soft Computing 21 12-27
İ Z AKYURT
Siyaset Ekonomi ve Youmlnetim Araştırmaları Dergisi2016 Yıl 4 Cilt 4 Sayı 2 83
Karlin S (1958) The Application of Renewal Theory to the Study of
Inventory Policies Chap 15 in Arrow KJ S Karlin and H
Scarf Studies in the Mathematical Theory of Inventory and
Production
Kouki C amp Jouini O (2015) On the effect of lifetime variability on the
performance of inventory systems International Journal of
Production Economics 167 23-34
Koumlchel Peter amp Nielaumlnder U (2005) Simulation-based optimization of
multi-echelon inventory systems International journal of production
economics 93 505-513
Larson C E Olson L J amp Sharma S (2001) Optimal inventory policies
when the demand distribution is not known Journal of economic
Theory 101(1) 281-300
Lin K P Chang P T Hung K C amp Pai P F (2010) A simulation of
vendor managed inventory dynamics using fuzzy arithmetic
operations with genetic algorithms Expert Systems with
Applications 37(3) 2571-2579
Maiti M K amp Maiti M (2006) Fuzzy inventory model with two
warehouses under possibility constraints Fuzzy Sets and
Systems 157(1) 52-73
Naddor E (1975) Optimal and heuristic decisions in single-and multi-item
inventory systems Management Science 21(11) 1234-1249
Nia A R Far M H amp Niaki S T A (2014) A fuzzy vendor managed
inventory of multi-item economic order quantity model under
shortage An ant colony optimization algorithm International
Journal of Production Economics 155 259-271
Nielsen C amp Larsen C (2005) An analytical study of the Q (s S) policy
applied to the joint replenishment problem European Journal of
Operational Research 163(3) 721-732
Porteus E L (1971) On the optimality of generalized (s S) policies
Management Science 17(7) 411-426
Rabta B amp Aiumlssani D (2005) Strong stability in an (R s S) inventory
model International Journal of Production Economics 97(2) 159-
171
Rezaei J amp Davoodi M (2011) Multi-objective models for lot-sizing with
supplier selection International Journal of Production
Economics 130(1) 77-86
Roberts D M (1962) Approximations to optimal policies in a dynamic
inventory model Studies in applied probability and management
science (7) 207
Reorder Point and Replenishment Point of Dynamic Inventory Model Under hellip
84 Research Journal of Politics Economics and Management 2016 Year4 Volume4 Issue2
Scarf H (1960) The Optimality of (s S) Policies in Dynamic Inventory
Problems K Arrow S Karlin P Suppes eds Mathematical
Models in the Social Sciences
Schneider H (1978) Methods for determining the re-order point of an (s S)
ordering policy when a service level is specified Journal of the
Operational Research Society 1181-1193
Sezen H K amp Erdoğmuş Ş (2005) Envanter Politikası Belirlemede
Benzetim Uygulaması 7 Ulusal Ekonometri ve İstatistik
Sempozyumu
Silver E A Pyke D F amp Peterson R (1998) Inventory management and
production planning and scheduling (Vol 3 p 30) New York
Wiley
Sivazlian B D (1971) Dimensional and computational analysis in
stationary (s S) inventory problems with gamma distributed
demand Management Science 17(6) B-307
Stevenson W J amp Sum C C (2009) Operations management (Vol 8)
Boston MA McGraw-HillIrwin
Taleizadeh A A Niaki S T A Aryanezhad M B amp Shafii N (2013)
A hybrid method of fuzzy simulation and genetic algorithm to
optimize constrained inventory control systems with stochastic
replenishments and fuzzy demand Information Sciences 220 425-
441
Thiel D Hovelaque V amp Le Hoa V T (2010) Impact of inventory
inaccuracy on service-level quality in (Q R) continuous-review lost-
sales inventory models International Journal of Production
Economics 123(2) 301-311
Tijms H C amp Groenevelt H (1984) Simple approximations for the
reorder point in periodic and continuous review (s S) inventory
systems with service level constraints European journal of
operational research 17(2) 175-190
Veinott Jr A F (1966) On the Optimality of (sS) Inventory Policies New
Conditions and a New Proof SIAM Journal on Applied
Mathematics 14(5) 1067-1083
Wagner H M (1975) Principle of Operations Research Englewood Cliff
White A S amp Censlive M (2015) Control system analysis of labor supply
flows in production systems Journal of Manufacturing Systems 37
316-327
Ye W amp You F (2016) A computationally efficient simulation-based
optimization method with region-wise surrogate modeling for
stochastic inventory management of supply chains with general
İ Z AKYURT
Siyaset Ekonomi ve Youmlnetim Araştırmaları Dergisi2016 Yıl 4 Cilt 4 Sayı 2 85
network structures Computers amp Chemical Engineering 87 164-
179
Yin K K Liu H amp Johnson N E (2002) Markovian inventory policy
with application to the paper industry Computers amp chemical
engineering 26(10) 1399-1413
Zheng Y S amp Federgruen A (1991) Finding optimal (s S) policies is
about as simple as evaluating a single policy Operations
research 39(4) 654-665
Zhou W Q Chen L amp Ge H M (2013) A multi-product multi-echelon
inventory control model with joint replenishment strategy Applied
Mathematical Modelling 37(4) 2039-2050
İ Z AKYURT
Siyaset Ekonomi ve Youmlnetim Araştırmaları Dergisi2016 Yıl 4 Cilt 4 Sayı 2 81
4 Results and Suggestions
In this study optional replenishment model is analyzed as an inventory
model Although this policy results in optimum values in practice it is hard
to determine parameters of reorder point (s) and replenishment point (S) In
order to determine these two points the demand structure is analyzed and a
cost function is formulated This function is compared with GAs codes
developed in MATLAB with the simulation developed in Microsoft Excel
Weekly average costs are calculated for different reorder and replenishment
points In the chosen case the demand for raw material is normal and its
lead time shows uniform distribution When the results are evaluated it is
seen that GAs constitutes a better alternative in terms of both time and cost
However the cost difference stems from increases of 10 units in the
simulation model When the classic method is used average cost increases
dramatically because of that the reorder point in the formulation is high
In addition in order to analyze the influence of cost change on reorder point
and replenishment point two levels are determined for holding cost penalty
cost and ordering cost The model is operated at these levels again by GAs
and the results reached are examined The examination shows that the main
cost effecting the model is the penalty cost As the penalty cost increases the
reorder point also increases Therefore the policy becomes the base stock
policy
With the help of some modifications in the structure of parameters of GAs
the solution time can be shortened Determining R as a variable the search
for a solution can be continued in a wider area Moreover the same model
can be used for various demand distributions and lead time distributions
References
Agrawal P M amp Sharda R (2012) Impact of frequency of alignment of
physical and information system inventories on out of stocks A
simulation study International Journal of Production
Economics 136(1) 45-55
Allen F amp Karjalainen R (1999) Using genetic algorithms to find
technical trading rules Journal of financial Economics 51(2) 245-
271
Arrow K J Harris T amp Marschak J (1951) Optimal inventory policy
Econometrica Journal of the Econometric Society 250-272
Bollapragada S amp Morton T E (1999) A simple heuristic for computing
nonstationary (s S) policies Operations Research 47(4) 576-584
Buchan J A amp Koenıgsberg E A (1966) Scientific inventory
management Prentice Hall
DeYong G D amp Cattani K D (2015) Fenced in Stochastic and
deterministic planning models in a time-fenced rolling-horizon
scheduling system European Journal of Operational Research
Reorder Point and Replenishment Point of Dynamic Inventory Model Under hellip
82 Research Journal of Politics Economics and Management 2016 Year4 Volume4 Issue2
Diabat A amp Deskoores R (2015) A hybrid genetic algorithm based
heuristic for an integrated supply chain problem Journal of
Manufacturing Systems
do Rego J R amp de Mesquita M A (2015) Demand forecasting and
inventory control A simulation study on automotive spare
parts International Journal of Production Economics 161 1-16
Duan Q amp Liao T W (2013) A new age-based replenishment policy for
supply chain inventory optimization of highly perishable products
International Journal of Production Economics 145(2) 658-671
Ehrhardt R (1979) The power approximation for computing (s S)
inventory policies Management Science 25(8) 777-786
Ehrhardt R (1984) (s S) policies for a dynamic inventory model with
stochastic lead times Operations Research 32(1) 121-132
Ehrhardt R amp Mosier C (1984) A revision of the power approximation
for computing (s S) policies Management Science 30(5) 618-622
Escuiacuten D Polo L amp Cipreacutes D (2016) On the comparison of inventory
replenishment policies with time-varying stochastic demand for the
paper industry Journal of Computational and Applied Mathematics
Freeland J R amp Porteus E L (1980) Evaluating the effectiveness of a
new method for computing approximately optimal (s S) inventory
policies Operations Research 28(2) 353-364
Garciacutea-Alvarado M S Paquet M amp Chaabane A (2015) On inventory
control of product recovery systems subject to environmental
mechanisms International Journal of Production Economics 165
132-144
Glover F amp Laguna M (1993) Modern heuristic techniques for
combinatorial problems Blackwell London
Goldberg D E (1989) Genetic algorithms in search and machine learning
Reading Addison Wesley
Hillier F S (1995) Introduction to operations research Tata McGraw-Hill
Education
Hwang H Choi B amp Lee M J (2005) A model for shelf space
allocation and inventory control considering location and inventory
level effects on demand International Journal of Production
Economics 97(2) 185-195
Iglehart D L (1963) Optimality of (s S) policies in the infinite horizon
dynamic inventory problem Management science 9(2) 259-267
Jana D K Das B amp Maiti M (2014) Multi-item partial backlogging
inventory models over random planning horizon in random fuzzy
environment Applied Soft Computing 21 12-27
İ Z AKYURT
Siyaset Ekonomi ve Youmlnetim Araştırmaları Dergisi2016 Yıl 4 Cilt 4 Sayı 2 83
Karlin S (1958) The Application of Renewal Theory to the Study of
Inventory Policies Chap 15 in Arrow KJ S Karlin and H
Scarf Studies in the Mathematical Theory of Inventory and
Production
Kouki C amp Jouini O (2015) On the effect of lifetime variability on the
performance of inventory systems International Journal of
Production Economics 167 23-34
Koumlchel Peter amp Nielaumlnder U (2005) Simulation-based optimization of
multi-echelon inventory systems International journal of production
economics 93 505-513
Larson C E Olson L J amp Sharma S (2001) Optimal inventory policies
when the demand distribution is not known Journal of economic
Theory 101(1) 281-300
Lin K P Chang P T Hung K C amp Pai P F (2010) A simulation of
vendor managed inventory dynamics using fuzzy arithmetic
operations with genetic algorithms Expert Systems with
Applications 37(3) 2571-2579
Maiti M K amp Maiti M (2006) Fuzzy inventory model with two
warehouses under possibility constraints Fuzzy Sets and
Systems 157(1) 52-73
Naddor E (1975) Optimal and heuristic decisions in single-and multi-item
inventory systems Management Science 21(11) 1234-1249
Nia A R Far M H amp Niaki S T A (2014) A fuzzy vendor managed
inventory of multi-item economic order quantity model under
shortage An ant colony optimization algorithm International
Journal of Production Economics 155 259-271
Nielsen C amp Larsen C (2005) An analytical study of the Q (s S) policy
applied to the joint replenishment problem European Journal of
Operational Research 163(3) 721-732
Porteus E L (1971) On the optimality of generalized (s S) policies
Management Science 17(7) 411-426
Rabta B amp Aiumlssani D (2005) Strong stability in an (R s S) inventory
model International Journal of Production Economics 97(2) 159-
171
Rezaei J amp Davoodi M (2011) Multi-objective models for lot-sizing with
supplier selection International Journal of Production
Economics 130(1) 77-86
Roberts D M (1962) Approximations to optimal policies in a dynamic
inventory model Studies in applied probability and management
science (7) 207
Reorder Point and Replenishment Point of Dynamic Inventory Model Under hellip
84 Research Journal of Politics Economics and Management 2016 Year4 Volume4 Issue2
Scarf H (1960) The Optimality of (s S) Policies in Dynamic Inventory
Problems K Arrow S Karlin P Suppes eds Mathematical
Models in the Social Sciences
Schneider H (1978) Methods for determining the re-order point of an (s S)
ordering policy when a service level is specified Journal of the
Operational Research Society 1181-1193
Sezen H K amp Erdoğmuş Ş (2005) Envanter Politikası Belirlemede
Benzetim Uygulaması 7 Ulusal Ekonometri ve İstatistik
Sempozyumu
Silver E A Pyke D F amp Peterson R (1998) Inventory management and
production planning and scheduling (Vol 3 p 30) New York
Wiley
Sivazlian B D (1971) Dimensional and computational analysis in
stationary (s S) inventory problems with gamma distributed
demand Management Science 17(6) B-307
Stevenson W J amp Sum C C (2009) Operations management (Vol 8)
Boston MA McGraw-HillIrwin
Taleizadeh A A Niaki S T A Aryanezhad M B amp Shafii N (2013)
A hybrid method of fuzzy simulation and genetic algorithm to
optimize constrained inventory control systems with stochastic
replenishments and fuzzy demand Information Sciences 220 425-
441
Thiel D Hovelaque V amp Le Hoa V T (2010) Impact of inventory
inaccuracy on service-level quality in (Q R) continuous-review lost-
sales inventory models International Journal of Production
Economics 123(2) 301-311
Tijms H C amp Groenevelt H (1984) Simple approximations for the
reorder point in periodic and continuous review (s S) inventory
systems with service level constraints European journal of
operational research 17(2) 175-190
Veinott Jr A F (1966) On the Optimality of (sS) Inventory Policies New
Conditions and a New Proof SIAM Journal on Applied
Mathematics 14(5) 1067-1083
Wagner H M (1975) Principle of Operations Research Englewood Cliff
White A S amp Censlive M (2015) Control system analysis of labor supply
flows in production systems Journal of Manufacturing Systems 37
316-327
Ye W amp You F (2016) A computationally efficient simulation-based
optimization method with region-wise surrogate modeling for
stochastic inventory management of supply chains with general
İ Z AKYURT
Siyaset Ekonomi ve Youmlnetim Araştırmaları Dergisi2016 Yıl 4 Cilt 4 Sayı 2 85
network structures Computers amp Chemical Engineering 87 164-
179
Yin K K Liu H amp Johnson N E (2002) Markovian inventory policy
with application to the paper industry Computers amp chemical
engineering 26(10) 1399-1413
Zheng Y S amp Federgruen A (1991) Finding optimal (s S) policies is
about as simple as evaluating a single policy Operations
research 39(4) 654-665
Zhou W Q Chen L amp Ge H M (2013) A multi-product multi-echelon
inventory control model with joint replenishment strategy Applied
Mathematical Modelling 37(4) 2039-2050
Reorder Point and Replenishment Point of Dynamic Inventory Model Under hellip
82 Research Journal of Politics Economics and Management 2016 Year4 Volume4 Issue2
Diabat A amp Deskoores R (2015) A hybrid genetic algorithm based
heuristic for an integrated supply chain problem Journal of
Manufacturing Systems
do Rego J R amp de Mesquita M A (2015) Demand forecasting and
inventory control A simulation study on automotive spare
parts International Journal of Production Economics 161 1-16
Duan Q amp Liao T W (2013) A new age-based replenishment policy for
supply chain inventory optimization of highly perishable products
International Journal of Production Economics 145(2) 658-671
Ehrhardt R (1979) The power approximation for computing (s S)
inventory policies Management Science 25(8) 777-786
Ehrhardt R (1984) (s S) policies for a dynamic inventory model with
stochastic lead times Operations Research 32(1) 121-132
Ehrhardt R amp Mosier C (1984) A revision of the power approximation
for computing (s S) policies Management Science 30(5) 618-622
Escuiacuten D Polo L amp Cipreacutes D (2016) On the comparison of inventory
replenishment policies with time-varying stochastic demand for the
paper industry Journal of Computational and Applied Mathematics
Freeland J R amp Porteus E L (1980) Evaluating the effectiveness of a
new method for computing approximately optimal (s S) inventory
policies Operations Research 28(2) 353-364
Garciacutea-Alvarado M S Paquet M amp Chaabane A (2015) On inventory
control of product recovery systems subject to environmental
mechanisms International Journal of Production Economics 165
132-144
Glover F amp Laguna M (1993) Modern heuristic techniques for
combinatorial problems Blackwell London
Goldberg D E (1989) Genetic algorithms in search and machine learning
Reading Addison Wesley
Hillier F S (1995) Introduction to operations research Tata McGraw-Hill
Education
Hwang H Choi B amp Lee M J (2005) A model for shelf space
allocation and inventory control considering location and inventory
level effects on demand International Journal of Production
Economics 97(2) 185-195
Iglehart D L (1963) Optimality of (s S) policies in the infinite horizon
dynamic inventory problem Management science 9(2) 259-267
Jana D K Das B amp Maiti M (2014) Multi-item partial backlogging
inventory models over random planning horizon in random fuzzy
environment Applied Soft Computing 21 12-27
İ Z AKYURT
Siyaset Ekonomi ve Youmlnetim Araştırmaları Dergisi2016 Yıl 4 Cilt 4 Sayı 2 83
Karlin S (1958) The Application of Renewal Theory to the Study of
Inventory Policies Chap 15 in Arrow KJ S Karlin and H
Scarf Studies in the Mathematical Theory of Inventory and
Production
Kouki C amp Jouini O (2015) On the effect of lifetime variability on the
performance of inventory systems International Journal of
Production Economics 167 23-34
Koumlchel Peter amp Nielaumlnder U (2005) Simulation-based optimization of
multi-echelon inventory systems International journal of production
economics 93 505-513
Larson C E Olson L J amp Sharma S (2001) Optimal inventory policies
when the demand distribution is not known Journal of economic
Theory 101(1) 281-300
Lin K P Chang P T Hung K C amp Pai P F (2010) A simulation of
vendor managed inventory dynamics using fuzzy arithmetic
operations with genetic algorithms Expert Systems with
Applications 37(3) 2571-2579
Maiti M K amp Maiti M (2006) Fuzzy inventory model with two
warehouses under possibility constraints Fuzzy Sets and
Systems 157(1) 52-73
Naddor E (1975) Optimal and heuristic decisions in single-and multi-item
inventory systems Management Science 21(11) 1234-1249
Nia A R Far M H amp Niaki S T A (2014) A fuzzy vendor managed
inventory of multi-item economic order quantity model under
shortage An ant colony optimization algorithm International
Journal of Production Economics 155 259-271
Nielsen C amp Larsen C (2005) An analytical study of the Q (s S) policy
applied to the joint replenishment problem European Journal of
Operational Research 163(3) 721-732
Porteus E L (1971) On the optimality of generalized (s S) policies
Management Science 17(7) 411-426
Rabta B amp Aiumlssani D (2005) Strong stability in an (R s S) inventory
model International Journal of Production Economics 97(2) 159-
171
Rezaei J amp Davoodi M (2011) Multi-objective models for lot-sizing with
supplier selection International Journal of Production
Economics 130(1) 77-86
Roberts D M (1962) Approximations to optimal policies in a dynamic
inventory model Studies in applied probability and management
science (7) 207
Reorder Point and Replenishment Point of Dynamic Inventory Model Under hellip
84 Research Journal of Politics Economics and Management 2016 Year4 Volume4 Issue2
Scarf H (1960) The Optimality of (s S) Policies in Dynamic Inventory
Problems K Arrow S Karlin P Suppes eds Mathematical
Models in the Social Sciences
Schneider H (1978) Methods for determining the re-order point of an (s S)
ordering policy when a service level is specified Journal of the
Operational Research Society 1181-1193
Sezen H K amp Erdoğmuş Ş (2005) Envanter Politikası Belirlemede
Benzetim Uygulaması 7 Ulusal Ekonometri ve İstatistik
Sempozyumu
Silver E A Pyke D F amp Peterson R (1998) Inventory management and
production planning and scheduling (Vol 3 p 30) New York
Wiley
Sivazlian B D (1971) Dimensional and computational analysis in
stationary (s S) inventory problems with gamma distributed
demand Management Science 17(6) B-307
Stevenson W J amp Sum C C (2009) Operations management (Vol 8)
Boston MA McGraw-HillIrwin
Taleizadeh A A Niaki S T A Aryanezhad M B amp Shafii N (2013)
A hybrid method of fuzzy simulation and genetic algorithm to
optimize constrained inventory control systems with stochastic
replenishments and fuzzy demand Information Sciences 220 425-
441
Thiel D Hovelaque V amp Le Hoa V T (2010) Impact of inventory
inaccuracy on service-level quality in (Q R) continuous-review lost-
sales inventory models International Journal of Production
Economics 123(2) 301-311
Tijms H C amp Groenevelt H (1984) Simple approximations for the
reorder point in periodic and continuous review (s S) inventory
systems with service level constraints European journal of
operational research 17(2) 175-190
Veinott Jr A F (1966) On the Optimality of (sS) Inventory Policies New
Conditions and a New Proof SIAM Journal on Applied
Mathematics 14(5) 1067-1083
Wagner H M (1975) Principle of Operations Research Englewood Cliff
White A S amp Censlive M (2015) Control system analysis of labor supply
flows in production systems Journal of Manufacturing Systems 37
316-327
Ye W amp You F (2016) A computationally efficient simulation-based
optimization method with region-wise surrogate modeling for
stochastic inventory management of supply chains with general
İ Z AKYURT
Siyaset Ekonomi ve Youmlnetim Araştırmaları Dergisi2016 Yıl 4 Cilt 4 Sayı 2 85
network structures Computers amp Chemical Engineering 87 164-
179
Yin K K Liu H amp Johnson N E (2002) Markovian inventory policy
with application to the paper industry Computers amp chemical
engineering 26(10) 1399-1413
Zheng Y S amp Federgruen A (1991) Finding optimal (s S) policies is
about as simple as evaluating a single policy Operations
research 39(4) 654-665
Zhou W Q Chen L amp Ge H M (2013) A multi-product multi-echelon
inventory control model with joint replenishment strategy Applied
Mathematical Modelling 37(4) 2039-2050
İ Z AKYURT
Siyaset Ekonomi ve Youmlnetim Araştırmaları Dergisi2016 Yıl 4 Cilt 4 Sayı 2 83
Karlin S (1958) The Application of Renewal Theory to the Study of
Inventory Policies Chap 15 in Arrow KJ S Karlin and H
Scarf Studies in the Mathematical Theory of Inventory and
Production
Kouki C amp Jouini O (2015) On the effect of lifetime variability on the
performance of inventory systems International Journal of
Production Economics 167 23-34
Koumlchel Peter amp Nielaumlnder U (2005) Simulation-based optimization of
multi-echelon inventory systems International journal of production
economics 93 505-513
Larson C E Olson L J amp Sharma S (2001) Optimal inventory policies
when the demand distribution is not known Journal of economic
Theory 101(1) 281-300
Lin K P Chang P T Hung K C amp Pai P F (2010) A simulation of
vendor managed inventory dynamics using fuzzy arithmetic
operations with genetic algorithms Expert Systems with
Applications 37(3) 2571-2579
Maiti M K amp Maiti M (2006) Fuzzy inventory model with two
warehouses under possibility constraints Fuzzy Sets and
Systems 157(1) 52-73
Naddor E (1975) Optimal and heuristic decisions in single-and multi-item
inventory systems Management Science 21(11) 1234-1249
Nia A R Far M H amp Niaki S T A (2014) A fuzzy vendor managed
inventory of multi-item economic order quantity model under
shortage An ant colony optimization algorithm International
Journal of Production Economics 155 259-271
Nielsen C amp Larsen C (2005) An analytical study of the Q (s S) policy
applied to the joint replenishment problem European Journal of
Operational Research 163(3) 721-732
Porteus E L (1971) On the optimality of generalized (s S) policies
Management Science 17(7) 411-426
Rabta B amp Aiumlssani D (2005) Strong stability in an (R s S) inventory
model International Journal of Production Economics 97(2) 159-
171
Rezaei J amp Davoodi M (2011) Multi-objective models for lot-sizing with
supplier selection International Journal of Production
Economics 130(1) 77-86
Roberts D M (1962) Approximations to optimal policies in a dynamic
inventory model Studies in applied probability and management
science (7) 207
Reorder Point and Replenishment Point of Dynamic Inventory Model Under hellip
84 Research Journal of Politics Economics and Management 2016 Year4 Volume4 Issue2
Scarf H (1960) The Optimality of (s S) Policies in Dynamic Inventory
Problems K Arrow S Karlin P Suppes eds Mathematical
Models in the Social Sciences
Schneider H (1978) Methods for determining the re-order point of an (s S)
ordering policy when a service level is specified Journal of the
Operational Research Society 1181-1193
Sezen H K amp Erdoğmuş Ş (2005) Envanter Politikası Belirlemede
Benzetim Uygulaması 7 Ulusal Ekonometri ve İstatistik
Sempozyumu
Silver E A Pyke D F amp Peterson R (1998) Inventory management and
production planning and scheduling (Vol 3 p 30) New York
Wiley
Sivazlian B D (1971) Dimensional and computational analysis in
stationary (s S) inventory problems with gamma distributed
demand Management Science 17(6) B-307
Stevenson W J amp Sum C C (2009) Operations management (Vol 8)
Boston MA McGraw-HillIrwin
Taleizadeh A A Niaki S T A Aryanezhad M B amp Shafii N (2013)
A hybrid method of fuzzy simulation and genetic algorithm to
optimize constrained inventory control systems with stochastic
replenishments and fuzzy demand Information Sciences 220 425-
441
Thiel D Hovelaque V amp Le Hoa V T (2010) Impact of inventory
inaccuracy on service-level quality in (Q R) continuous-review lost-
sales inventory models International Journal of Production
Economics 123(2) 301-311
Tijms H C amp Groenevelt H (1984) Simple approximations for the
reorder point in periodic and continuous review (s S) inventory
systems with service level constraints European journal of
operational research 17(2) 175-190
Veinott Jr A F (1966) On the Optimality of (sS) Inventory Policies New
Conditions and a New Proof SIAM Journal on Applied
Mathematics 14(5) 1067-1083
Wagner H M (1975) Principle of Operations Research Englewood Cliff
White A S amp Censlive M (2015) Control system analysis of labor supply
flows in production systems Journal of Manufacturing Systems 37
316-327
Ye W amp You F (2016) A computationally efficient simulation-based
optimization method with region-wise surrogate modeling for
stochastic inventory management of supply chains with general
İ Z AKYURT
Siyaset Ekonomi ve Youmlnetim Araştırmaları Dergisi2016 Yıl 4 Cilt 4 Sayı 2 85
network structures Computers amp Chemical Engineering 87 164-
179
Yin K K Liu H amp Johnson N E (2002) Markovian inventory policy
with application to the paper industry Computers amp chemical
engineering 26(10) 1399-1413
Zheng Y S amp Federgruen A (1991) Finding optimal (s S) policies is
about as simple as evaluating a single policy Operations
research 39(4) 654-665
Zhou W Q Chen L amp Ge H M (2013) A multi-product multi-echelon
inventory control model with joint replenishment strategy Applied
Mathematical Modelling 37(4) 2039-2050
Recommended


![[SCM] Analysis of an Economic Order Quantity and Reorder Point Inventor.pdf](https://img.pdfslide.us/doc/110x75/577cd7081a28ab9e789de109/scm-analysis-of-an-economic-order-quantity-and-reorder-point-inventorpdf.jpg)