!(!(
!(!(!(
!(
!(
!(
!(
!(
!(!(!(
!(
!(
!(
!(!(
!(
DowntownHudson's Bay Reserve
UniversityWestCentral
Jasper PlaceWest Jasper Place
South West
East Central
Millwoods
North Central
North EastCastledowns
St. Albert
Fort Saskatchewan
Leduc
Stony Plain
Strathcona CountySpruce Grove
Other Outlying Areas
Vacancy Rate Vacancy RateVacancy Rate Vacancy Rate
*CMHC collects data on the primary and secondary rental market annually, in the fall. These data refer to the primary rental market, which only includes rental units in privately-initiated apartment structures containing at least three rental units. The secondary rental market covers rental dwellings that were not originally purpose-built for the rental market, including rental condominiums. The primary vacancy rate and rent level is based on all surveyed structures, while the rent increase is based only on structures common to the survey sample in both the current and previous year.
One bedroomBachelor Two bedroom Three or more bedrooms
Avg.Rent
PRIMARY RENTAL MARKET (by bedroom type)
Avg.Rent
Avg.Rent
Avg.Rent
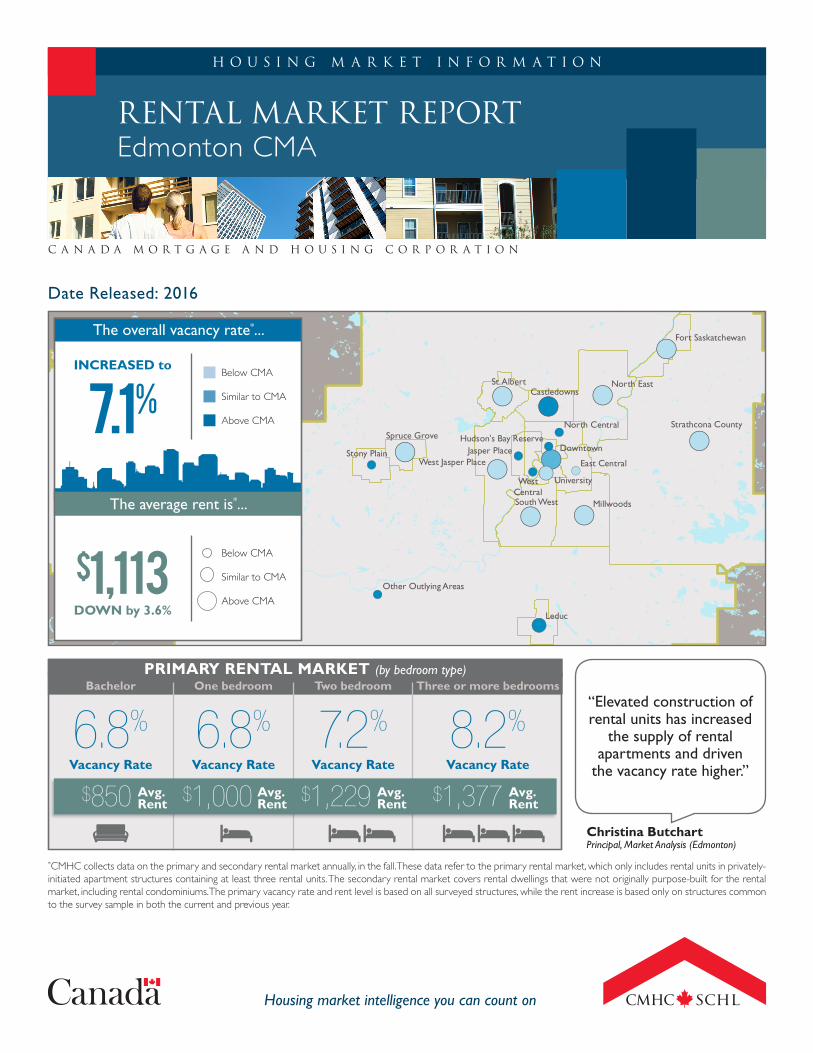
The overall vacancy rate*...
The average rent is*...
Below CMA
Similar to CMA
Above CMA
Below CMA
Similar to CMA
Above CMA
Date Released:
C a n a d a M o r t g a g e a n d H o u s i n g C o r p o r a t i o n
Housing market intelligence you can count on
H o u s i n g M a r k e t I n f o r m a t i o n
RENTAL MARKET REPORT
2016
Edmonton CMA
“Elevated construction of rental units has increased
the supply of rental apartments and driven
the vacancy rate higher.”
Christina ButchartPrincipal, Market Analysis (Edmonton)
6.8% 6.8% 7.2% 8.2%$1,229 $1,377$1,000$850
INCREASED to
7.1%
$1,113DOWN by 3.6%
Rental Market Report - Edmonton CMA - Date Released - 2016
Canada Mortgage and Housing Corporation
2
Highlights�� The apartment vacancy rate in
the Edmonton CMA increased to 7.1 per cent in October 2016.
�� The average rent for a two-bedroom apartment in new and existing structures was $1,229 per month in October 2016.
�� Same-sample rents decreased for the first time since 2009
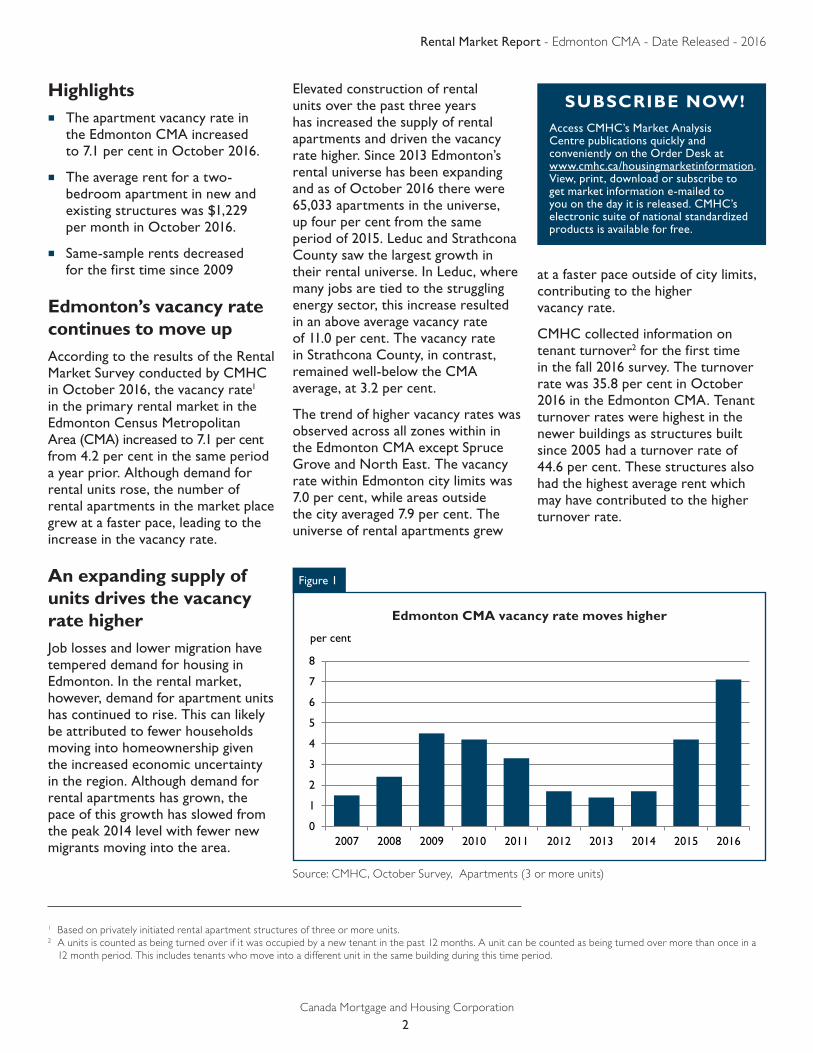
Edmonton’s vacancy rate continues to move upAccording to the results of the Rental Market Survey conducted by CMHC in October 2016, the vacancy rate1 in the primary rental market in the Edmonton Census Metropolitan Area (CMA) increased to 7.1 per cent from 4.2 per cent in the same period a year prior. Although demand for rental units rose, the number of rental apartments in the market place grew at a faster pace, leading to the increase in the vacancy rate.
An expanding supply of units drives the vacancy rate higherJob losses and lower migration have tempered demand for housing in Edmonton. In the rental market, however, demand for apartment units has continued to rise. This can likely be attributed to fewer households moving into homeownership given the increased economic uncertainty in the region. Although demand for rental apartments has grown, the pace of this growth has slowed from the peak 2014 level with fewer new migrants moving into the area.
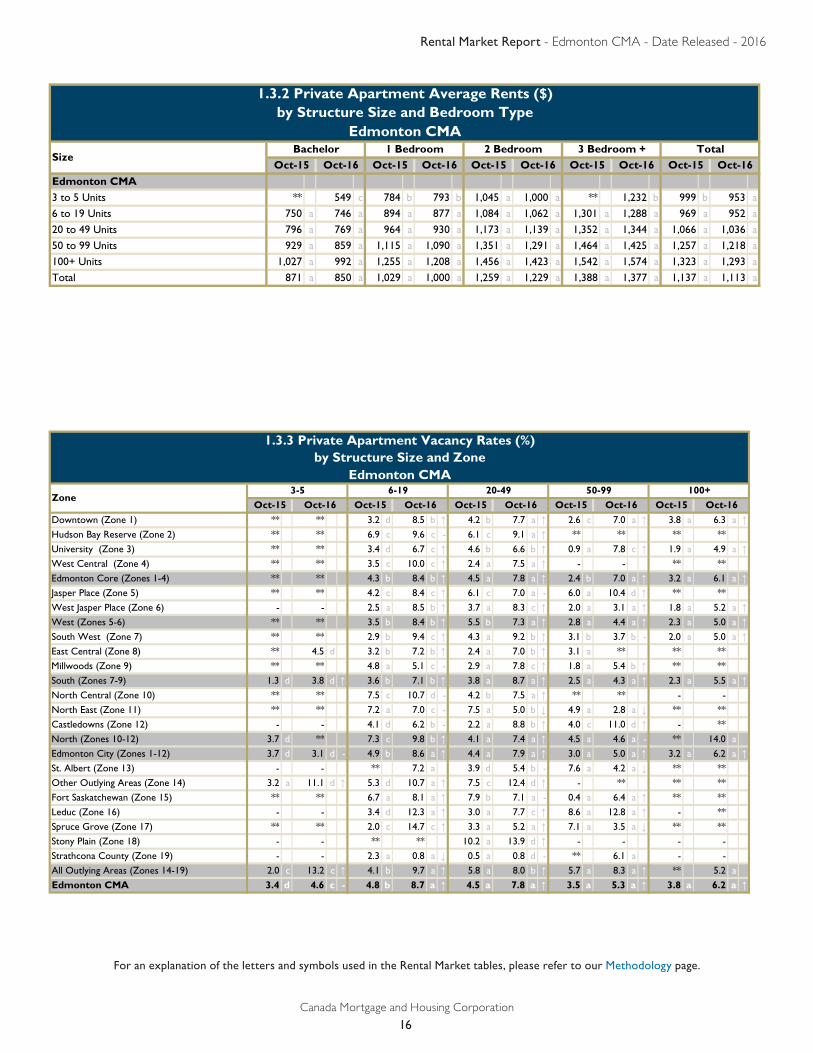
Elevated construction of rental units over the past three years has increased the supply of rental apartments and driven the vacancy rate higher. Since 2013 Edmonton’s rental universe has been expanding and as of October 2016 there were 65,033 apartments in the universe, up four per cent from the same period of 2015. Leduc and Strathcona County saw the largest growth in their rental universe. In Leduc, where many jobs are tied to the struggling energy sector, this increase resulted in an above average vacancy rate of 11.0 per cent. The vacancy rate in Strathcona County, in contrast, remained well-below the CMA average, at 3.2 per cent.
The trend of higher vacancy rates was observed across all zones within in the Edmonton CMA except Spruce Grove and North East. The vacancy rate within Edmonton city limits was 7.0 per cent, while areas outside the city averaged 7.9 per cent. The universe of rental apartments grew
at a faster pace outside of city limits, contributing to the higher vacancy rate.
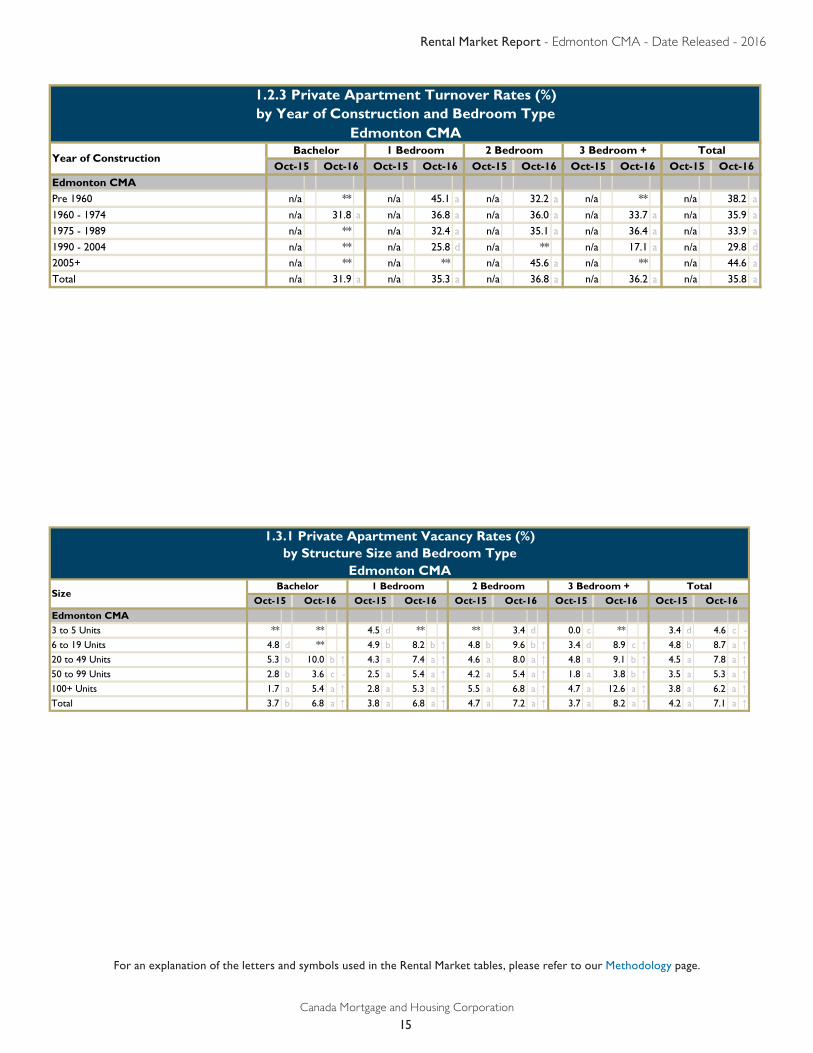
CMHC collected information on tenant turnover2 for the first time in the fall 2016 survey. The turnover rate was 35.8 per cent in October 2016 in the Edmonton CMA. Tenant turnover rates were highest in the newer buildings as structures built since 2005 had a turnover rate of 44.6 per cent. These structures also had the highest average rent which may have contributed to the higher turnover rate.
1 Based on privately initiated rental apartment structures of three or more units.2 A units is counted as being turned over if it was occupied by a new tenant in the past 12 months. A unit can be counted as being turned over more than once in a
12 month period. This includes tenants who move into a different unit in the same building during this time period.
SUBSCRIBE NOW!Access CMHC’s Market Analysis Centre publications quickly and conveniently on the Order Desk at www.cmhc.ca/housingmarketinformation. View, print, download or subscribe to get market information e-mailed to you on the day it is released. CMHC’s electronic suite of national standardized products is available for free.
0
1
2
3
4
5
6
7
8
2007 2008 2009 2010 2011 2012 2013 2014 2015 2016
Source: CMHC, October Survey, Apartments (3 or more units)
Figure 1
Edmonton CMA vacancy rate moves higher
per cent
Rental Market Report - Edmonton CMA - Date Released - 2016
Canada Mortgage and Housing Corporation
3
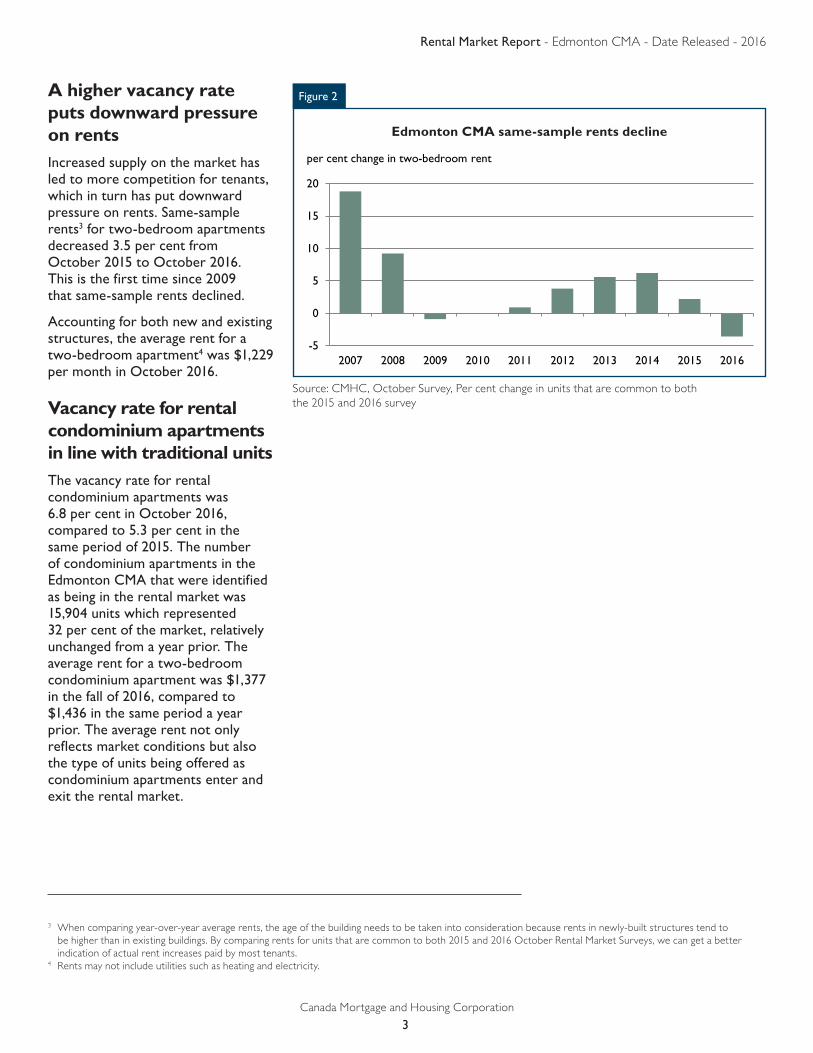
A higher vacancy rate puts downward pressure on rentsIncreased supply on the market has led to more competition for tenants, which in turn has put downward pressure on rents. Same-sample rents3 for two-bedroom apartments decreased 3.5 per cent from October 2015 to October 2016. This is the first time since 2009 that same-sample rents declined.
Accounting for both new and existing structures, the average rent for a two-bedroom apartment4 was $1,229 per month in October 2016.
Vacancy rate for rental condominium apartments in line with traditional unitsThe vacancy rate for rental condominium apartments was 6.8 per cent in October 2016, compared to 5.3 per cent in the same period of 2015. The number of condominium apartments in the Edmonton CMA that were identified as being in the rental market was 15,904 units which represented 32 per cent of the market, relatively unchanged from a year prior. The average rent for a two-bedroom condominium apartment was $1,377 in the fall of 2016, compared to $1,436 in the same period a year prior. The average rent not only reflects market conditions but also the type of units being offered as condominium apartments enter and exit the rental market.
-5
0
5
10
15
20
2007 2008 2009 2010 2011 2012 2013 2014 2015 2016
Source: CMHC, October Survey, Per cent change in units that are common to both the 2015 and 2016 survey
Figure 2
Edmonton CMA same-sample rents decline
3 When comparing year-over-year average rents, the age of the building needs to be taken into consideration because rents in newly-built structures tend to be higher than in existing buildings. By comparing rents for units that are common to both 2015 and 2016 October Rental Market Surveys, we can get a better indication of actual rent increases paid by most tenants.
4 Rents may not include utilities such as heating and electricity.
per cent change in two-bedroom rent
Rental Market Report - Edmonton CMA - Date Released - 2016
Canada Mortgage and Housing Corporation
4
ClearwaterCounty
CamroseCountyHay
Lakes
BeaverCounty
Lamont County Bruderheim Improvement District No. 13 Elk Island
WetaskiwinCounty No. 10
Millet
LeducCounty
Beaumont
Leduc
Devon
Calmar
SundanceBeach
Thorsby GoldenDays
Warburg
Breton
DraytonValley
BrazeauCounty
ParklandCounty
SebaBeach
BetulaBeach
LakeviewWabamun
SpringLake
StonyPlain
SpruceGrove
StrathconaCountyFort
Saskatchewan
SturgeonCounty
Edmonton
St.Albert
Gibbons
Redwater
BonAccord
Morinville
Legal
Lac Ste.Anne County
NakamunPark
ValQuentin
WestCove
RossHaven
CastleIsland
SilverSands
BirchCove
Onoway
SunriseBeach
BarrheadCounty No. 11
WestlockCounty
ThorhildCounty No. 7
YellowheadCounty
0102 03
0405
06
07
0809
10
11
12
13
15
16
18
19
17
14
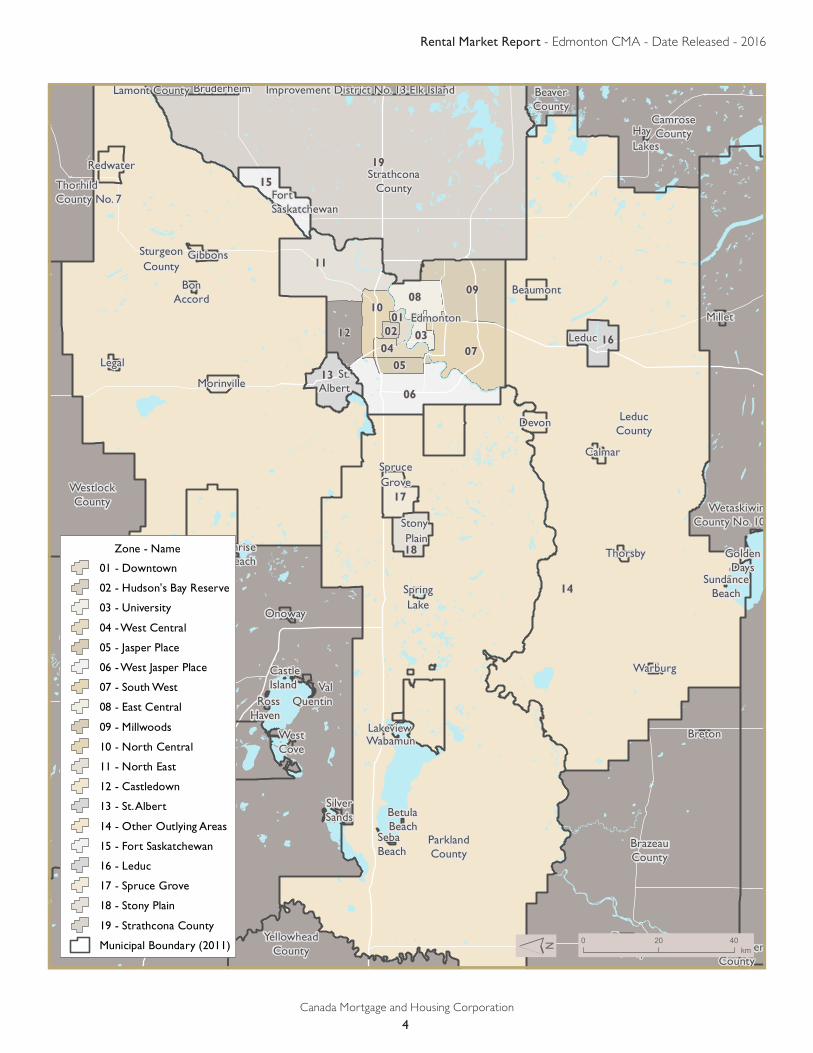
Zone - Name
01 - Downtown
02 - Hudson's Bay Reserve
03 - University
04 - West Central
05 - Jasper Place
06 - West Jasper Place
07 - South West
08 - East Central
09 - Millwoods
10 - North Central
11 - North East
12 - Castledown
13 - St. Albert
14 - Other Outlying Areas
15 - Fort Saskatchewan
16 - Leduc
17 - Spruce Grove
18 - Stony Plain
19 - Strathcona County
Municipal Boundary (2011) 0 20 40km´
Rental Market Report - Edmonton CMA - Date Released - 2016
Canada Mortgage and Housing Corporation
5
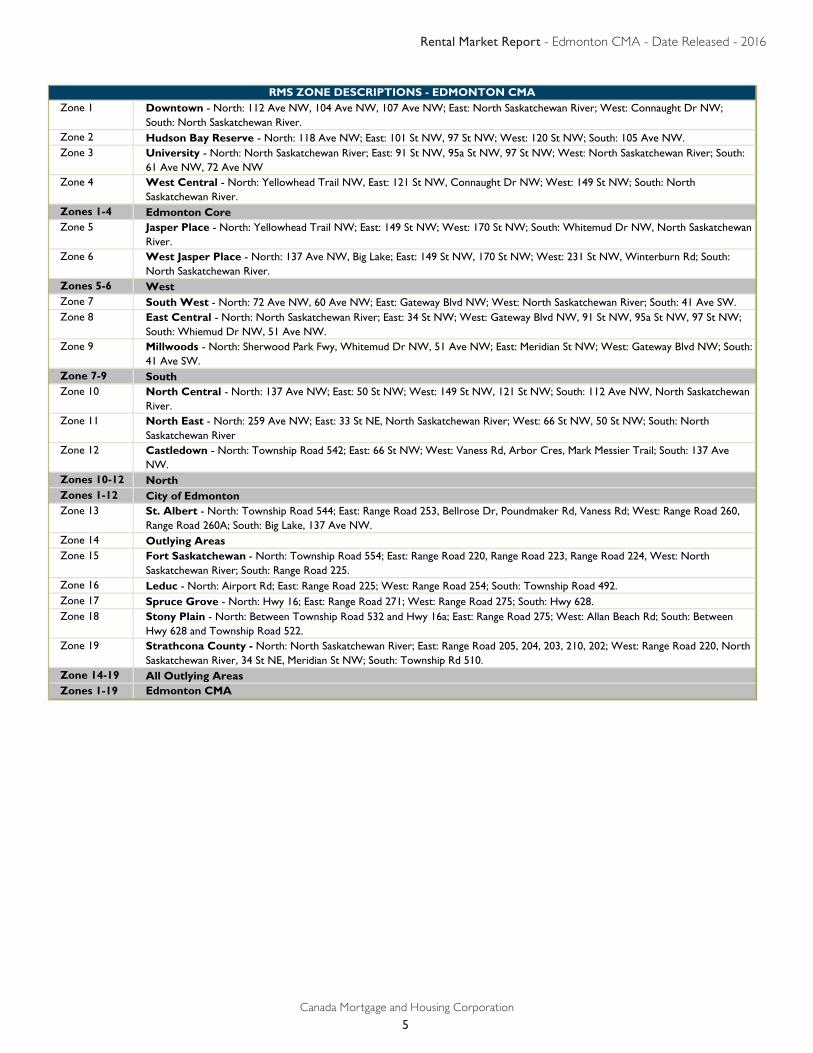
Zone 1 Downtown - North: 112 Ave NW, 104 Ave NW, 107 Ave NW; East: North Saskatchewan River; West: Connaught Dr NW; South: North Saskatchewan River.
Zone 2 Hudson Bay Reserve - North: 118 Ave NW; East: 101 St NW, 97 St NW; West: 120 St NW; South: 105 Ave NW.Zone 3 University - North: North Saskatchewan River; East: 91 St NW, 95a St NW, 97 St NW; West: North Saskatchewan River; South:
61 Ave NW, 72 Ave NWZone 4 West Central - North: Yellowhead Trail NW, East: 121 St NW, Connaught Dr NW; West: 149 St NW; South: North
Saskatchewan River.Zones 1-4 Edmonton CoreZone 5 Jasper Place - North: Yellowhead Trail NW; East: 149 St NW; West: 170 St NW; South: Whitemud Dr NW, North Saskatchewan
River.Zone 6 West Jasper Place - North: 137 Ave NW, Big Lake; East: 149 St NW, 170 St NW; West: 231 St NW, Winterburn Rd; South:
North Saskatchewan River.Zones 5-6 WestZone 7 South West - North: 72 Ave NW, 60 Ave NW; East: Gateway Blvd NW; West: North Saskatchewan River; South: 41 Ave SW.Zone 8 East Central - North: North Saskatchewan River; East: 34 St NW; West: Gateway Blvd NW, 91 St NW, 95a St NW, 97 St NW;
South: Whiemud Dr NW, 51 Ave NW.Zone 9 Millwoods - North: Sherwood Park Fwy, Whitemud Dr NW, 51 Ave NW; East: Meridian St NW; West: Gateway Blvd NW; South:
41 Ave SW.Zone 7-9 SouthZone 10 North Central - North: 137 Ave NW; East: 50 St NW; West: 149 St NW, 121 St NW; South: 112 Ave NW, North Saskatchewan
River.Zone 11 North East - North: 259 Ave NW; East: 33 St NE, North Saskatchewan River; West: 66 St NW, 50 St NW; South: North
Saskatchewan RiverZone 12 Castledown - North: Township Road 542; East: 66 St NW; West: Vaness Rd, Arbor Cres, Mark Messier Trail; South: 137 Ave
NW.Zones 10-12 NorthZones 1-12 City of EdmontonZone 13 St. Albert - North: Township Road 544; East: Range Road 253, Bellrose Dr, Poundmaker Rd, Vaness Rd; West: Range Road 260,
Range Road 260A; South: Big Lake, 137 Ave NW.Zone 14 Outlying AreasZone 15 Fort Saskatchewan - North: Township Road 554; East: Range Road 220, Range Road 223, Range Road 224, West: North
Saskatchewan River; South: Range Road 225.Zone 16 Leduc - North: Airport Rd; East: Range Road 225; West: Range Road 254; South: Township Road 492.Zone 17 Spruce Grove - North: Hwy 16; East: Range Road 271; West: Range Road 275; South: Hwy 628.Zone 18 Stony Plain - North: Between Township Road 532 and Hwy 16a; East: Range Road 275; West: Allan Beach Rd; South: Between
Hwy 628 and Township Road 522.Zone 19 Strathcona County - North: North Saskatchewan River; East: Range Road 205, 204, 203, 210, 202; West: Range Road 220, North
Saskatchewan River, 34 St NE, Meridian St NW; South: Township Rd 510.Zone 14-19 All Outlying AreasZones 1-19 Edmonton CMA
RMS ZONE DESCRIPTIONS - EDMONTON CMA
Rental Market Report - Edmonton CMA - Date Released - 2016
Canada Mortgage and Housing Corporation
6
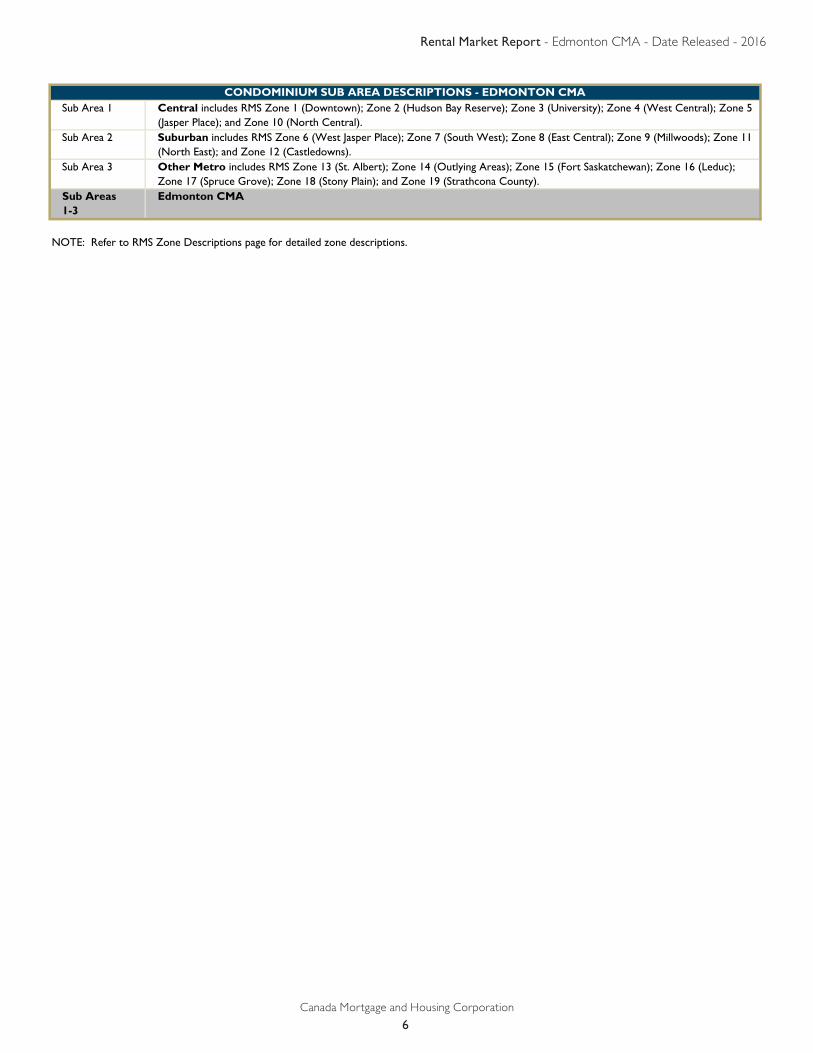
Sub Area 1 Central includes RMS Zone 1 (Downtown); Zone 2 (Hudson Bay Reserve); Zone 3 (University); Zone 4 (West Central); Zone 5 (Jasper Place); and Zone 10 (North Central).
Sub Area 2 Suburban includes RMS Zone 6 (West Jasper Place); Zone 7 (South West); Zone 8 (East Central); Zone 9 (Millwoods); Zone 11 (North East); and Zone 12 (Castledowns).
Sub Area 3 Other Metro includes RMS Zone 13 (St. Albert); Zone 14 (Outlying Areas); Zone 15 (Fort Saskatchewan); Zone 16 (Leduc); Zone 17 (Spruce Grove); Zone 18 (Stony Plain); and Zone 19 (Strathcona County).
Sub Areas 1-3
Edmonton CMA
NOTE: Refer to RMS Zone Descriptions page for detailed zone descriptions.
CONDOMINIUM SUB AREA DESCRIPTIONS - EDMONTON CMA
Rental Market Report - Edmonton CMA - Date Released - 2016
Canada Mortgage and Housing Corporation
7
RENTAL MARKET REPORT TABLES Available in ALL Rental Market Reports Private Apartment Data: 1.1.1 Vacancy Rates (%) by Zone and Bedroom Type
1.1.2 Average Rents ($) by Zone and Bedroom Type 1.1.3 Number of Units in the Universe by Zone and Bedroom Type
1.1.4 Availability Rates (%) by Zone and Bedroom Type
1.1.5 Estimate of Percentage Change (%) of Average Rent by Zone and Bedroom Type 1.1.6 Turnover Rates (%) by Zone and Bedroom Type
1.2.1 Vacancy Rates (%) by Year of Construction and Bedroom Type
1.2.2 Average Rents ($) by Year of Construction and Bedroom Type 1.2.3 Turnover Rates (%) by Year of Construction and Bedroom Type
1.3.1 Vacancy Rates (%) by Structure Size and Bedroom Type
1.3.2 Average Rents ($) by Structure Size and Bedroom Type 1.3.3 Vacancy Rates (%) by Structure Size and Zone
1.3.4 Turnover Rates (%) by Structure Size and Bedroom Type
1.4 Vacancy Rates (%) by Rent Range and Bedroom Type
Available in SELECTED Rental Market Reports Private Row (Townhouse) Data: 2.1.1 Vacancy Rates (%) by Zone and Bedroom Type
2.1.2 Average Rents ($) by Zone and Bedroom Type
2.1.3 Number of Units in the Universe by Zone and Bedroom Type 2.1.4 Availability Rates (%) by Zone and Bedroom Type
2.1.5 Estimate of Percentage Change (%) of Average Rent by Zone and Bedroom Type
2.1.6 Turnover Rates (%) by Zone and Bedroom Type
Private Apartment and Row (Townhouse) Data: 3.1.1 Vacancy Rates (%) by Zone and Bedroom Type 3.1.2 Average Rents ($) by Zone and Bedroom Type
3.1.3 Number of Units in the Universe by Zone and Bedroom Type 3.1.4 Availability Rates (%) by Zone and Bedroom Type
3.1.5 Estimate of Percentage Change (%) of Average Rent by Zone and Bedroom Type
3.1.6 Turnover Rates (%) by Zone and Bedroom Type
Available in the Halifax, Quebec, Montreal, Gatineau, Ottawa, Toronto, Hamilton, Kitchener-Cambridge-Waterloo, London, Winnipeg, Regina, Saskatoon, Edmonton, Calgary, Kelowna, Vancouver and Victoria Reports Rental Condominium Apartment Data 4.1.1 Rental Condominium Apartments and Private Apartments in the RMS - Vacancy Rates (%)
4.1.2 Rental Condominium Apartments and Private Apartments in the RMS - Average Rents ($) by Bedroom Type 4.1.3 Rental Condominium Apartments - Average Rents ($) by Bedroom Type
4.2.1 Rental Condominium Apartments and Private Apartments in the RMS - Vacancy Rates (%) by Building Size
4.3.1 Condominium Universe, Rental Units, Percentage of Units in Rental and Vacancy Rate 4.3.2 Condominium Universe, Rental Units, Percentage of Units in Rental and Vacancy Rate by Project Size
Available in the St. John’s, Halifax, Quebec, Montreal, Ottawa, Barrie, Toronto, Hamilton, St. Catharines-Niagara, Windsor, Winnipeg, Regina, Saskatoon, Calgary, Edmonton, Kelowna, Abbotsford-Mission, Vancouver and Victoria Reports Secondary Rented Unit Data 5.1 Secondary Rented Unit Average Rents ($) by Dwelling Type
5.2 Estimated Number of Households in Other Secondary Rented Units by Dwelling Type
Rental Market Report - Edmonton CMA - Date Released - 2016
Canada Mortgage and Housing Corporation
8
For an explanation of the letters and symbols used in the Rental Market tables, please refer to our Methodology page.
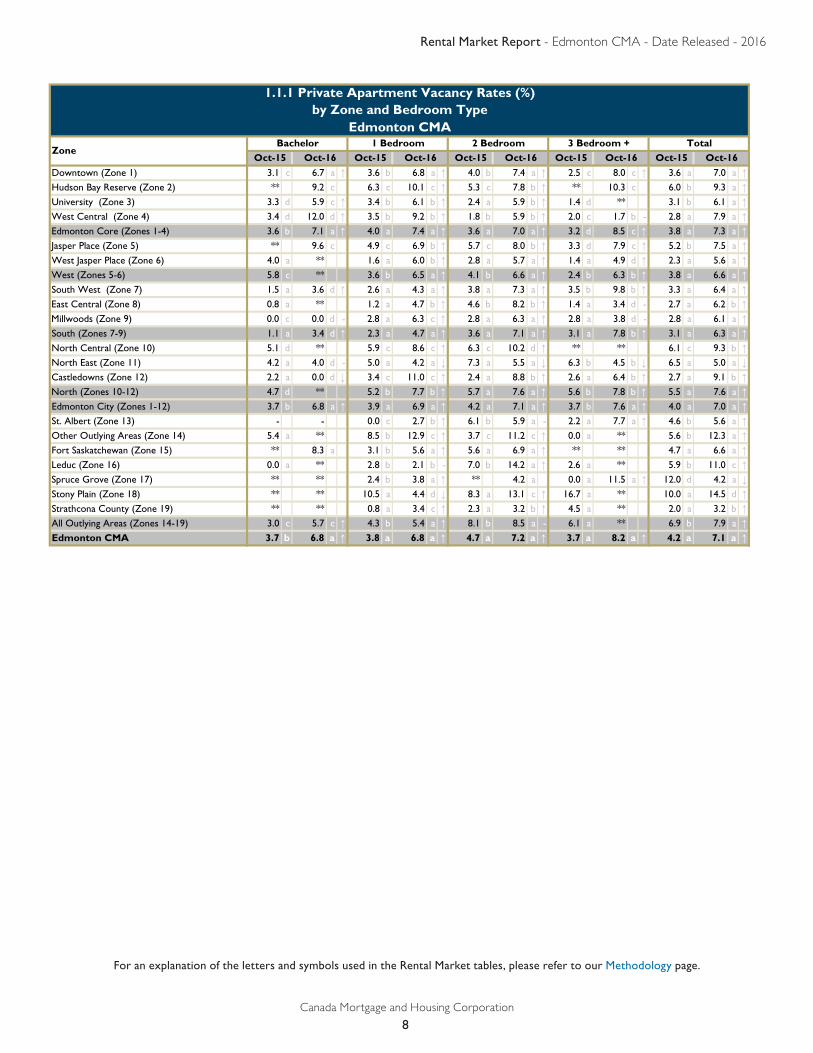
Downtown (Zone 1) 3.1 c 6.7 a ↑ 3.6 b 6.8 a ↑ 4.0 b 7.4 a ↑ 2.5 c 8.0 c ↑ 3.6 a 7.0 a ↑Hudson Bay Reserve (Zone 2) ** 9.2 c 6.3 c 10.1 c ↑ 5.3 c 7.8 b ↑ ** 10.3 c 6.0 b 9.3 a ↑University (Zone 3) 3.3 d 5.9 c ↑ 3.4 b 6.1 b ↑ 2.4 a 5.9 b ↑ 1.4 d ** 3.1 b 6.1 a ↑West Central (Zone 4) 3.4 d 12.0 d ↑ 3.5 b 9.2 b ↑ 1.8 b 5.9 b ↑ 2.0 c 1.7 b - 2.8 a 7.9 a ↑Edmonton Core (Zones 1-4) 3.6 b 7.1 a ↑ 4.0 a 7.4 a ↑ 3.6 a 7.0 a ↑ 3.2 d 8.5 c ↑ 3.8 a 7.3 a ↑Jasper Place (Zone 5) ** 9.6 c 4.9 c 6.9 b ↑ 5.7 c 8.0 b ↑ 3.3 d 7.9 c ↑ 5.2 b 7.5 a ↑West Jasper Place (Zone 6) 4.0 a ** 1.6 a 6.0 b ↑ 2.8 a 5.7 a ↑ 1.4 a 4.9 d ↑ 2.3 a 5.6 a ↑West (Zones 5-6) 5.8 c ** 3.6 b 6.5 a ↑ 4.1 b 6.6 a ↑ 2.4 b 6.3 b ↑ 3.8 a 6.6 a ↑South West (Zone 7) 1.5 a 3.6 d ↑ 2.6 a 4.3 a ↑ 3.8 a 7.3 a ↑ 3.5 b 9.8 b ↑ 3.3 a 6.4 a ↑East Central (Zone 8) 0.8 a ** 1.2 a 4.7 b ↑ 4.6 b 8.2 b ↑ 1.4 a 3.4 d - 2.7 a 6.2 b ↑Millwoods (Zone 9) 0.0 c 0.0 d - 2.8 a 6.3 c ↑ 2.8 a 6.3 a ↑ 2.8 a 3.8 d - 2.8 a 6.1 a ↑South (Zones 7-9) 1.1 a 3.4 d ↑ 2.3 a 4.7 a ↑ 3.6 a 7.1 a ↑ 3.1 a 7.8 b ↑ 3.1 a 6.3 a ↑North Central (Zone 10) 5.1 d ** 5.9 c 8.6 c ↑ 6.3 c 10.2 d ↑ ** ** 6.1 c 9.3 b ↑North East (Zone 11) 4.2 a 4.0 d - 5.0 a 4.2 a ↓ 7.3 a 5.5 a ↓ 6.3 b 4.5 b ↓ 6.5 a 5.0 a ↓Castledowns (Zone 12) 2.2 a 0.0 d ↓ 3.4 c 11.0 c ↑ 2.4 a 8.8 b ↑ 2.6 a 6.4 b ↑ 2.7 a 9.1 b ↑North (Zones 10-12) 4.7 d ** 5.2 b 7.7 b ↑ 5.7 a 7.6 a ↑ 5.6 b 7.8 b ↑ 5.5 a 7.6 a ↑Edmonton City (Zones 1-12) 3.7 b 6.8 a ↑ 3.9 a 6.9 a ↑ 4.2 a 7.1 a ↑ 3.7 b 7.6 a ↑ 4.0 a 7.0 a ↑St. Albert (Zone 13) - - 0.0 c 2.7 b ↑ 6.1 b 5.9 a - 2.2 a 7.7 a ↑ 4.6 b 5.6 a ↑Other Outlying Areas (Zone 14) 5.4 a ** 8.5 b 12.9 c ↑ 3.7 c 11.2 c ↑ 0.0 a ** 5.6 b 12.3 a ↑Fort Saskatchewan (Zone 15) ** 8.3 a 3.1 b 5.6 a ↑ 5.6 a 6.9 a ↑ ** ** 4.7 a 6.6 a ↑Leduc (Zone 16) 0.0 a ** 2.8 b 2.1 b - 7.0 b 14.2 a ↑ 2.6 a ** 5.9 b 11.0 c ↑Spruce Grove (Zone 17) ** ** 2.4 b 3.8 a ↑ ** 4.2 a 0.0 a 11.5 a ↑ 12.0 d 4.2 a ↓Stony Plain (Zone 18) ** ** 10.5 a 4.4 d ↓ 8.3 a 13.1 c ↑ 16.7 a ** 10.0 a 14.5 d ↑Strathcona County (Zone 19) ** ** 0.8 a 3.4 c ↑ 2.3 a 3.2 b ↑ 4.5 a ** 2.0 a 3.2 b ↑All Outlying Areas (Zones 14-19) 3.0 c 5.7 c ↑ 4.3 b 5.4 a ↑ 8.1 b 8.5 a - 6.1 a ** 6.9 b 7.9 a ↑Edmonton CMA 3.7 b 6.8 a ↑ 3.8 a 6.8 a ↑ 4.7 a 7.2 a ↑ 3.7 a 8.2 a ↑ 4.2 a 7.1 a ↑
1.1.1 Private Apartment Vacancy Rates (%)by Zone and Bedroom Type
Edmonton CMA3 Bedroom + Total
ZoneBachelor 1 Bedroom 2 Bedroom
Oct-15 Oct-16Oct-16 Oct-15 Oct-16 Oct-15Oct-16 Oct-15 Oct-16 Oct-15
Rental Market Report - Edmonton CMA - Date Released - 2016
Canada Mortgage and Housing Corporation
9
For an explanation of the letters and symbols used in the Rental Market tables, please refer to our Methodology page.
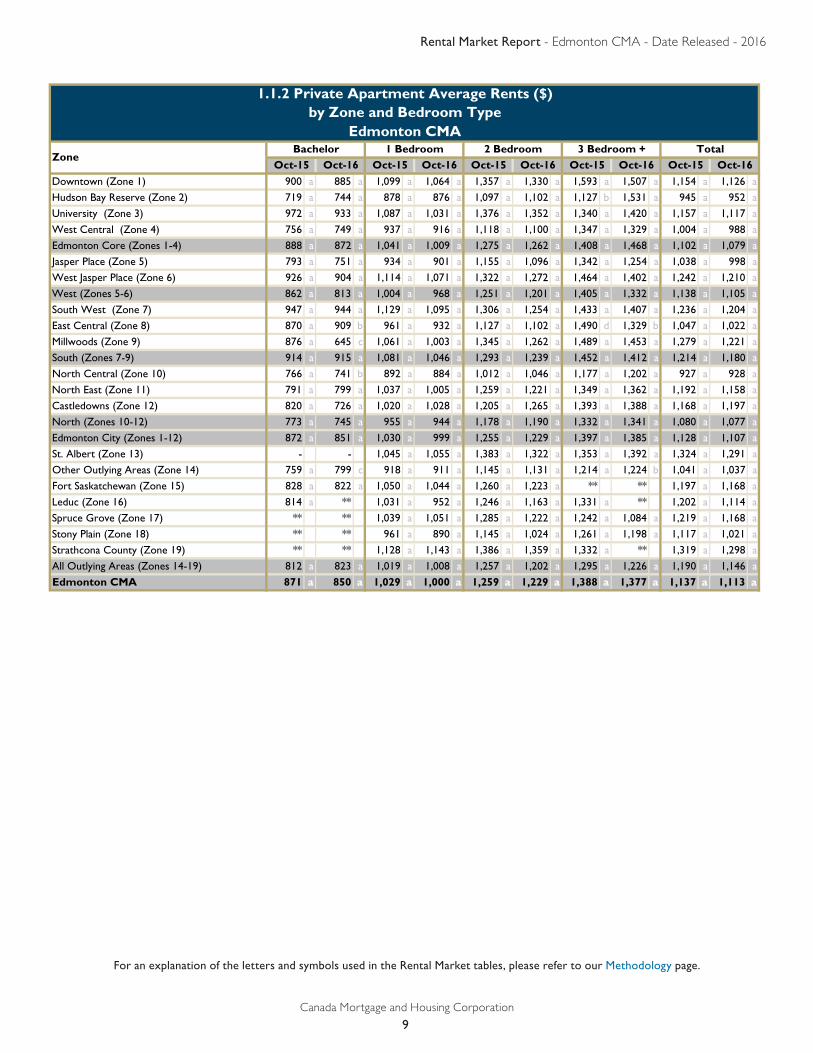
Downtown (Zone 1) 900 a 885 a 1,099 a 1,064 a 1,357 a 1,330 a 1,593 a 1,507 a 1,154 a 1,126 a
Hudson Bay Reserve (Zone 2) 719 a 744 a 878 a 876 a 1,097 a 1,102 a 1,127 b 1,531 a 945 a 952 a
University (Zone 3) 972 a 933 a 1,087 a 1,031 a 1,376 a 1,352 a 1,340 a 1,420 a 1,157 a 1,117 a
West Central (Zone 4) 756 a 749 a 937 a 916 a 1,118 a 1,100 a 1,347 a 1,329 a 1,004 a 988 a
Edmonton Core (Zones 1-4) 888 a 872 a 1,041 a 1,009 a 1,275 a 1,262 a 1,408 a 1,468 a 1,102 a 1,079 a
Jasper Place (Zone 5) 793 a 751 a 934 a 901 a 1,155 a 1,096 a 1,342 a 1,254 a 1,038 a 998 a
West Jasper Place (Zone 6) 926 a 904 a 1,114 a 1,071 a 1,322 a 1,272 a 1,464 a 1,402 a 1,242 a 1,210 a
West (Zones 5-6) 862 a 813 a 1,004 a 968 a 1,251 a 1,201 a 1,405 a 1,332 a 1,138 a 1,105 a
South West (Zone 7) 947 a 944 a 1,129 a 1,095 a 1,306 a 1,254 a 1,433 a 1,407 a 1,236 a 1,204 a
East Central (Zone 8) 870 a 909 b 961 a 932 a 1,127 a 1,102 a 1,490 d 1,329 b 1,047 a 1,022 a
Millwoods (Zone 9) 876 a 645 c 1,061 a 1,003 a 1,345 a 1,262 a 1,489 a 1,453 a 1,279 a 1,221 a
South (Zones 7-9) 914 a 915 a 1,081 a 1,046 a 1,293 a 1,239 a 1,452 a 1,412 a 1,214 a 1,180 a
North Central (Zone 10) 766 a 741 b 892 a 884 a 1,012 a 1,046 a 1,177 a 1,202 a 927 a 928 a
North East (Zone 11) 791 a 799 a 1,037 a 1,005 a 1,259 a 1,221 a 1,349 a 1,362 a 1,192 a 1,158 a
Castledowns (Zone 12) 820 a 726 a 1,020 a 1,028 a 1,205 a 1,265 a 1,393 a 1,388 a 1,168 a 1,197 a
North (Zones 10-12) 773 a 745 a 955 a 944 a 1,178 a 1,190 a 1,332 a 1,341 a 1,080 a 1,077 a
Edmonton City (Zones 1-12) 872 a 851 a 1,030 a 999 a 1,255 a 1,229 a 1,397 a 1,385 a 1,128 a 1,107 a
St. Albert (Zone 13) - - 1,045 a 1,055 a 1,383 a 1,322 a 1,353 a 1,392 a 1,324 a 1,291 a
Other Outlying Areas (Zone 14) 759 a 799 c 918 a 911 a 1,145 a 1,131 a 1,214 a 1,224 b 1,041 a 1,037 a
Fort Saskatchewan (Zone 15) 828 a 822 a 1,050 a 1,044 a 1,260 a 1,223 a ** ** 1,197 a 1,168 a
Leduc (Zone 16) 814 a ** 1,031 a 952 a 1,246 a 1,163 a 1,331 a ** 1,202 a 1,114 a
Spruce Grove (Zone 17) ** ** 1,039 a 1,051 a 1,285 a 1,222 a 1,242 a 1,084 a 1,219 a 1,168 a
Stony Plain (Zone 18) ** ** 961 a 890 a 1,145 a 1,024 a 1,261 a 1,198 a 1,117 a 1,021 a
Strathcona County (Zone 19) ** ** 1,128 a 1,143 a 1,386 a 1,359 a 1,332 a ** 1,319 a 1,298 a
All Outlying Areas (Zones 14-19) 812 a 823 a 1,019 a 1,008 a 1,257 a 1,202 a 1,295 a 1,226 a 1,190 a 1,146 a
Edmonton CMA 871 a 850 a 1,029 a 1,000 a 1,259 a 1,229 a 1,388 a 1,377 a 1,137 a 1,113 a
1.1.2 Private Apartment Average Rents ($)by Zone and Bedroom Type
Edmonton CMA
ZoneBachelor 1 Bedroom 2 Bedroom 3 Bedroom + Total
Oct-15 Oct-16Oct-16 Oct-15 Oct-16 Oct-15Oct-16 Oct-15 Oct-16 Oct-15
Rental Market Report - Edmonton CMA - Date Released - 2016
Canada Mortgage and Housing Corporation
10
For an explanation of the letters and symbols used in the Rental Market tables, please refer to our Methodology page.
by Zone and Bedroom TypeEdmonton CMA
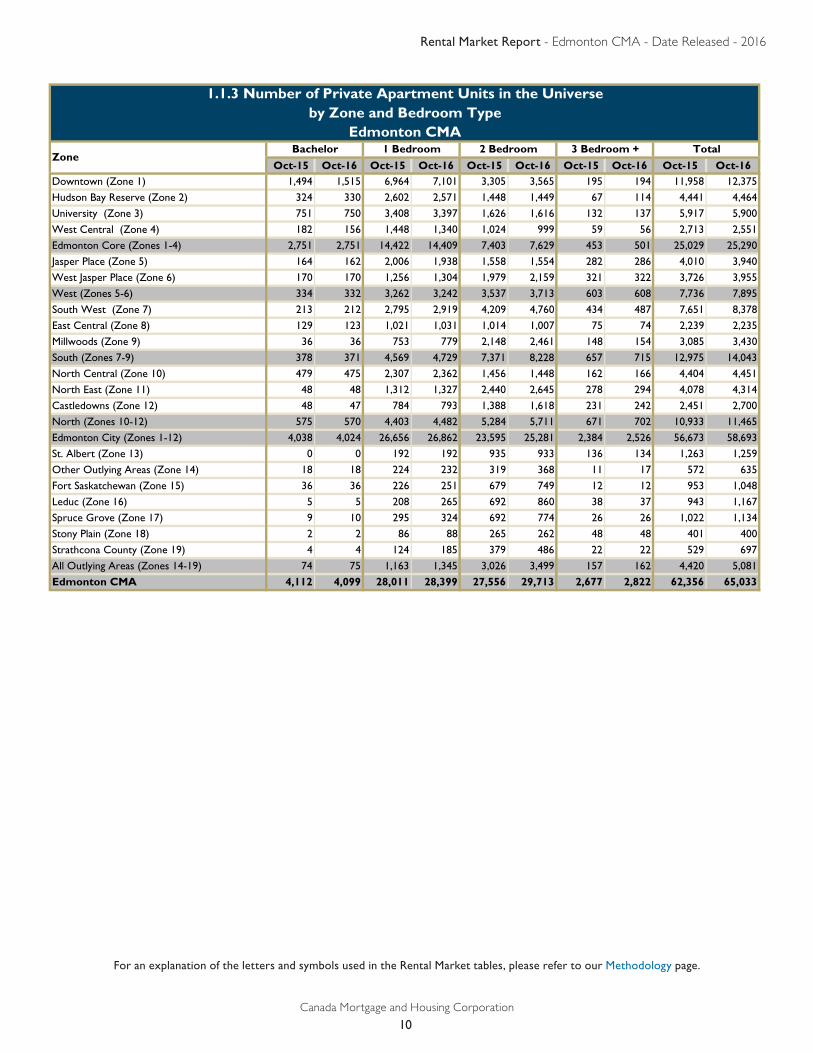
Oct-15 Oct-16 Oct-15 Oct-16 Oct-15 Oct-16 Oct-15 Oct-16 Oct-15 Oct-16Downtown (Zone 1) 1,494 1,515 6,964 7,101 3,305 3,565 195 194 11,958 12,375
Hudson Bay Reserve (Zone 2) 324 330 2,602 2,571 1,448 1,449 67 114 4,441 4,464
University (Zone 3) 751 750 3,408 3,397 1,626 1,616 132 137 5,917 5,900
West Central (Zone 4) 182 156 1,448 1,340 1,024 999 59 56 2,713 2,551
Edmonton Core (Zones 1-4) 2,751 2,751 14,422 14,409 7,403 7,629 453 501 25,029 25,290
Jasper Place (Zone 5) 164 162 2,006 1,938 1,558 1,554 282 286 4,010 3,940
West Jasper Place (Zone 6) 170 170 1,256 1,304 1,979 2,159 321 322 3,726 3,955
West (Zones 5-6) 334 332 3,262 3,242 3,537 3,713 603 608 7,736 7,895
South West (Zone 7) 213 212 2,795 2,919 4,209 4,760 434 487 7,651 8,378
East Central (Zone 8) 129 123 1,021 1,031 1,014 1,007 75 74 2,239 2,235
Millwoods (Zone 9) 36 36 753 779 2,148 2,461 148 154 3,085 3,430
South (Zones 7-9) 378 371 4,569 4,729 7,371 8,228 657 715 12,975 14,043
North Central (Zone 10) 479 475 2,307 2,362 1,456 1,448 162 166 4,404 4,451
North East (Zone 11) 48 48 1,312 1,327 2,440 2,645 278 294 4,078 4,314
Castledowns (Zone 12) 48 47 784 793 1,388 1,618 231 242 2,451 2,700
North (Zones 10-12) 575 570 4,403 4,482 5,284 5,711 671 702 10,933 11,465
Edmonton City (Zones 1-12) 4,038 4,024 26,656 26,862 23,595 25,281 2,384 2,526 56,673 58,693
St. Albert (Zone 13) 0 0 192 192 935 933 136 134 1,263 1,259
Other Outlying Areas (Zone 14) 18 18 224 232 319 368 11 17 572 635
Fort Saskatchewan (Zone 15) 36 36 226 251 679 749 12 12 953 1,048
Leduc (Zone 16) 5 5 208 265 692 860 38 37 943 1,167
Spruce Grove (Zone 17) 9 10 295 324 692 774 26 26 1,022 1,134
Stony Plain (Zone 18) 2 2 86 88 265 262 48 48 401 400
Strathcona County (Zone 19) 4 4 124 185 379 486 22 22 529 697
All Outlying Areas (Zones 14-19) 74 75 1,163 1,345 3,026 3,499 157 162 4,420 5,081
Edmonton CMA 4,112 4,099 28,011 28,399 27,556 29,713 2,677 2,822 62,356 65,033
Total
1.1.3 Number of Private Apartment Units in the Universe
ZoneBachelor 1 Bedroom 2 Bedroom 3 Bedroom +
Rental Market Report - Edmonton CMA - Date Released - 2016
Canada Mortgage and Housing Corporation
11
For an explanation of the letters and symbols used in the Rental Market tables, please refer to our Methodology page.
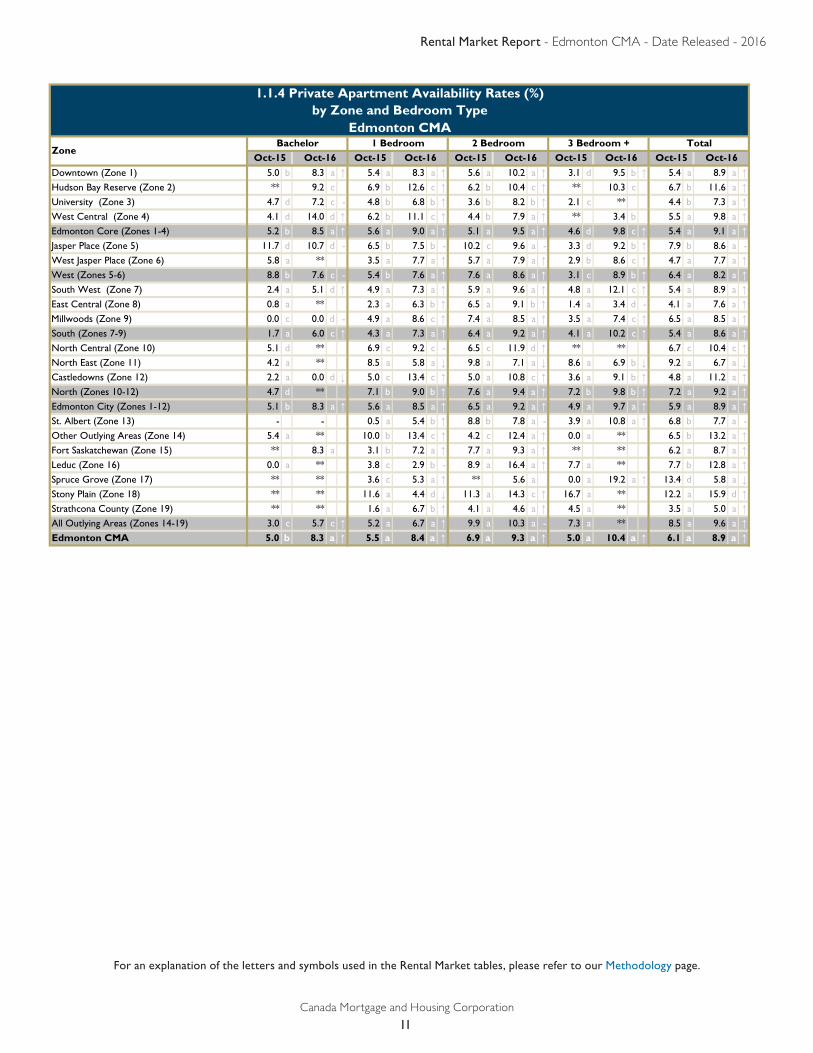
1.1.4 Private Apartment Availability Rates (%)by Zone and Bedroom Type
Edmonton CMA
Downtown (Zone 1) 5.0 b 8.3 a ↑ 5.4 a 8.3 a ↑ 5.6 a 10.2 a ↑ 3.1 d 9.5 b ↑ 5.4 a 8.9 a ↑Hudson Bay Reserve (Zone 2) ** 9.2 c 6.9 b 12.6 c ↑ 6.2 b 10.4 c ↑ ** 10.3 c 6.7 b 11.6 a ↑University (Zone 3) 4.7 d 7.2 c - 4.8 b 6.8 b ↑ 3.6 b 8.2 b ↑ 2.1 c ** 4.4 b 7.3 a ↑West Central (Zone 4) 4.1 d 14.0 d ↑ 6.2 b 11.1 c ↑ 4.4 b 7.9 a ↑ ** 3.4 b 5.5 a 9.8 a ↑Edmonton Core (Zones 1-4) 5.2 b 8.5 a ↑ 5.6 a 9.0 a ↑ 5.1 a 9.5 a ↑ 4.6 d 9.8 c ↑ 5.4 a 9.1 a ↑Jasper Place (Zone 5) 11.7 d 10.7 d - 6.5 b 7.5 b - 10.2 c 9.6 a - 3.3 d 9.2 b ↑ 7.9 b 8.6 a -
West Jasper Place (Zone 6) 5.8 a ** 3.5 a 7.7 a ↑ 5.7 a 7.9 a ↑ 2.9 b 8.6 c ↑ 4.7 a 7.7 a ↑West (Zones 5-6) 8.8 b 7.6 c - 5.4 b 7.6 a ↑ 7.6 a 8.6 a ↑ 3.1 c 8.9 b ↑ 6.4 a 8.2 a ↑South West (Zone 7) 2.4 a 5.1 d ↑ 4.9 a 7.3 a ↑ 5.9 a 9.6 a ↑ 4.8 a 12.1 c ↑ 5.4 a 8.9 a ↑East Central (Zone 8) 0.8 a ** 2.3 a 6.3 b ↑ 6.5 a 9.1 b ↑ 1.4 a 3.4 d - 4.1 a 7.6 a ↑Millwoods (Zone 9) 0.0 c 0.0 d - 4.9 a 8.6 c ↑ 7.4 a 8.5 a ↑ 3.5 a 7.4 c ↑ 6.5 a 8.5 a ↑South (Zones 7-9) 1.7 a 6.0 c ↑ 4.3 a 7.3 a ↑ 6.4 a 9.2 a ↑ 4.1 a 10.2 c ↑ 5.4 a 8.6 a ↑North Central (Zone 10) 5.1 d ** 6.9 c 9.2 c - 6.5 c 11.9 d ↑ ** ** 6.7 c 10.4 c ↑North East (Zone 11) 4.2 a ** 8.5 a 5.8 a ↓ 9.8 a 7.1 a ↓ 8.6 a 6.9 b ↓ 9.2 a 6.7 a ↓Castledowns (Zone 12) 2.2 a 0.0 d ↓ 5.0 c 13.4 c ↑ 5.0 a 10.8 c ↑ 3.6 a 9.1 b ↑ 4.8 a 11.2 a ↑North (Zones 10-12) 4.7 d ** 7.1 b 9.0 b ↑ 7.6 a 9.4 a ↑ 7.2 b 9.8 b ↑ 7.2 a 9.2 a ↑Edmonton City (Zones 1-12) 5.1 b 8.3 a ↑ 5.6 a 8.5 a ↑ 6.5 a 9.2 a ↑ 4.9 a 9.7 a ↑ 5.9 a 8.9 a ↑St. Albert (Zone 13) - - 0.5 a 5.4 b ↑ 8.8 b 7.8 a - 3.9 a 10.8 a ↑ 6.8 b 7.7 a -
Other Outlying Areas (Zone 14) 5.4 a ** 10.0 b 13.4 c ↑ 4.2 c 12.4 a ↑ 0.0 a ** 6.5 b 13.2 a ↑Fort Saskatchewan (Zone 15) ** 8.3 a 3.1 b 7.2 a ↑ 7.7 a 9.3 a ↑ ** ** 6.2 a 8.7 a ↑Leduc (Zone 16) 0.0 a ** 3.8 c 2.9 b - 8.9 a 16.4 a ↑ 7.7 a ** 7.7 b 12.8 a ↑Spruce Grove (Zone 17) ** ** 3.6 c 5.3 a ↑ ** 5.6 a 0.0 a 19.2 a ↑ 13.4 d 5.8 a ↓Stony Plain (Zone 18) ** ** 11.6 a 4.4 d ↓ 11.3 a 14.3 c ↑ 16.7 a ** 12.2 a 15.9 d ↑Strathcona County (Zone 19) ** ** 1.6 a 6.7 b ↑ 4.1 a 4.6 a ↑ 4.5 a ** 3.5 a 5.0 a ↑All Outlying Areas (Zones 14-19) 3.0 c 5.7 c ↑ 5.2 a 6.7 a ↑ 9.9 a 10.3 a - 7.3 a ** 8.5 a 9.6 a ↑Edmonton CMA 5.0 b 8.3 a ↑ 5.5 a 8.4 a ↑ 6.9 a 9.3 a ↑ 5.0 a 10.4 a ↑ 6.1 a 8.9 a ↑
3 Bedroom + TotalZone
Bachelor 1 Bedroom 2 BedroomOct-15 Oct-16 Oct-15 Oct-16 Oct-15 Oct-16Oct-15 Oct-16 Oct-15 Oct-16
Rental Market Report - Edmonton CMA - Date Released - 2016
Canada Mortgage and Housing Corporation
12
For an explanation of the letters and symbols used in the Rental Market tables, please refer to our Methodology page.
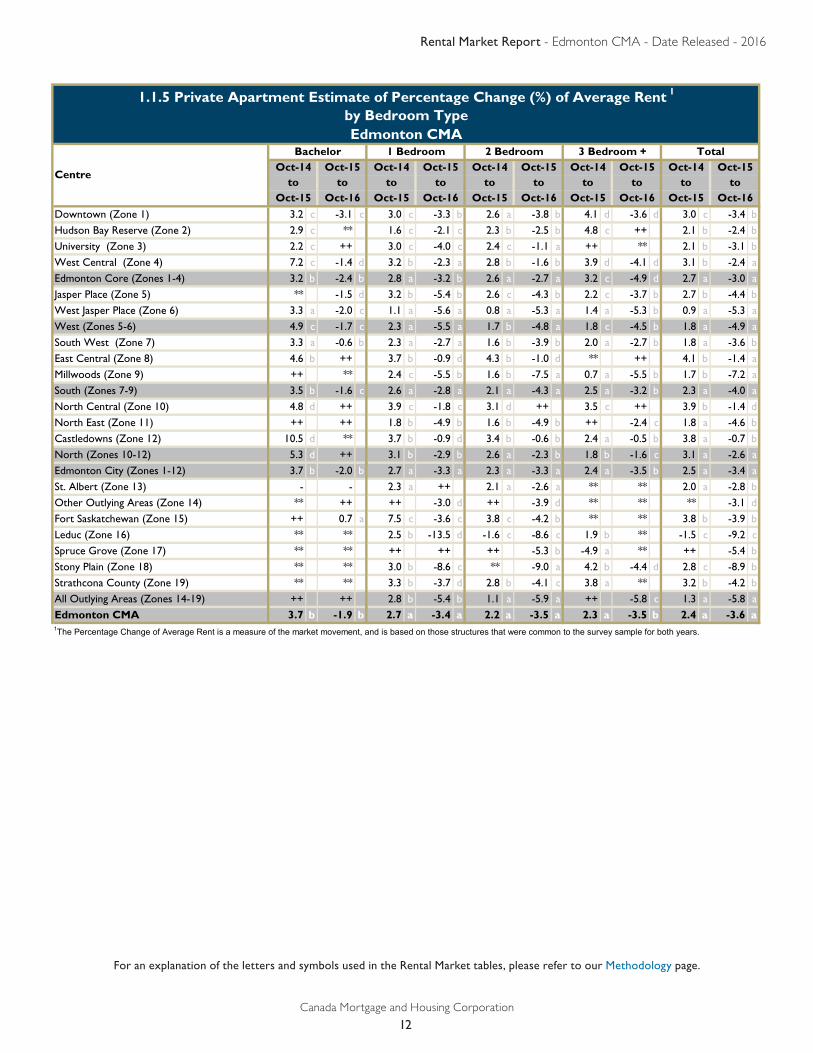
1.1.5 Private Apartment Estimate of Percentage Change (%) of Average Rent 1
by Bedroom TypeEdmonton CMA
Downtown (Zone 1) 3.2 c -3.1 c 3.0 c -3.3 b 2.6 a -3.8 b 4.1 d -3.6 d 3.0 c -3.4 bHudson Bay Reserve (Zone 2) 2.9 c ** 1.6 c -2.1 c 2.3 b -2.5 b 4.8 c ++ 2.1 b -2.4 bUniversity (Zone 3) 2.2 c ++ 3.0 c -4.0 c 2.4 c -1.1 a ++ ** 2.1 b -3.1 bWest Central (Zone 4) 7.2 c -1.4 d 3.2 b -2.3 a 2.8 b -1.6 b 3.9 d -4.1 d 3.1 b -2.4 aEdmonton Core (Zones 1-4) 3.2 b -2.4 b 2.8 a -3.2 b 2.6 a -2.7 a 3.2 c -4.9 d 2.7 a -3.0 aJasper Place (Zone 5) ** -1.5 d 3.2 b -5.4 b 2.6 c -4.3 b 2.2 c -3.7 b 2.7 b -4.4 bWest Jasper Place (Zone 6) 3.3 a -2.0 c 1.1 a -5.6 a 0.8 a -5.3 a 1.4 a -5.3 b 0.9 a -5.3 aWest (Zones 5-6) 4.9 c -1.7 c 2.3 a -5.5 a 1.7 b -4.8 a 1.8 c -4.5 b 1.8 a -4.9 aSouth West (Zone 7) 3.3 a -0.6 b 2.3 a -2.7 a 1.6 b -3.9 b 2.0 a -2.7 b 1.8 a -3.6 bEast Central (Zone 8) 4.6 b ++ 3.7 b -0.9 d 4.3 b -1.0 d ** ++ 4.1 b -1.4 aMillwoods (Zone 9) ++ ** 2.4 c -5.5 b 1.6 b -7.5 a 0.7 a -5.5 b 1.7 b -7.2 aSouth (Zones 7-9) 3.5 b -1.6 c 2.6 a -2.8 a 2.1 a -4.3 a 2.5 a -3.2 b 2.3 a -4.0 aNorth Central (Zone 10) 4.8 d ++ 3.9 c -1.8 c 3.1 d ++ 3.5 c ++ 3.9 b -1.4 dNorth East (Zone 11) ++ ++ 1.8 b -4.9 b 1.6 b -4.9 b ++ -2.4 c 1.8 a -4.6 bCastledowns (Zone 12) 10.5 d ** 3.7 b -0.9 d 3.4 b -0.6 b 2.4 a -0.5 b 3.8 a -0.7 bNorth (Zones 10-12) 5.3 d ++ 3.1 b -2.9 b 2.6 a -2.3 b 1.8 b -1.6 c 3.1 a -2.6 aEdmonton City (Zones 1-12) 3.7 b -2.0 b 2.7 a -3.3 a 2.3 a -3.3 a 2.4 a -3.5 b 2.5 a -3.4 aSt. Albert (Zone 13) - - 2.3 a ++ 2.1 a -2.6 a ** ** 2.0 a -2.8 bOther Outlying Areas (Zone 14) ** ++ ++ -3.0 d ++ -3.9 d ** ** ** -3.1 dFort Saskatchewan (Zone 15) ++ 0.7 a 7.5 c -3.6 c 3.8 c -4.2 b ** ** 3.8 b -3.9 bLeduc (Zone 16) ** ** 2.5 b -13.5 d -1.6 c -8.6 c 1.9 b ** -1.5 c -9.2 cSpruce Grove (Zone 17) ** ** ++ ++ ++ -5.3 b -4.9 a ** ++ -5.4 bStony Plain (Zone 18) ** ** 3.0 b -8.6 c ** -9.0 a 4.2 b -4.4 d 2.8 c -8.9 bStrathcona County (Zone 19) ** ** 3.3 b -3.7 d 2.8 b -4.1 c 3.8 a ** 3.2 b -4.2 bAll Outlying Areas (Zones 14-19) ++ ++ 2.8 b -5.4 b 1.1 a -5.9 a ++ -5.8 c 1.3 a -5.8 aEdmonton CMA 3.7 b -1.9 b 2.7 a -3.4 a 2.2 a -3.5 a 2.3 a -3.5 b 2.4 a -3.6 a
Oct-15 Oct-16to to
Oct-15 Oct-16to to
Oct-14 Oct-15 Oct-143 Bedroom + Total
Oct-14 Oct-15 Oct-14 Oct-15to to
2 Bedroom
Centre
Bachelor 1 Bedroom
to to to to
1The Percentage Change of Average Rent is a measure of the market movement, and is based on those structures that were common to the survey sample for both years.
Oct-15 Oct-16
Oct-15
Oct-15 Oct-16 Oct-15
Oct-14
Oct-16
Oct-15
Rental Market Report - Edmonton CMA - Date Released - 2016
Canada Mortgage and Housing Corporation
13
For an explanation of the letters and symbols used in the Rental Market tables, please refer to our Methodology page.
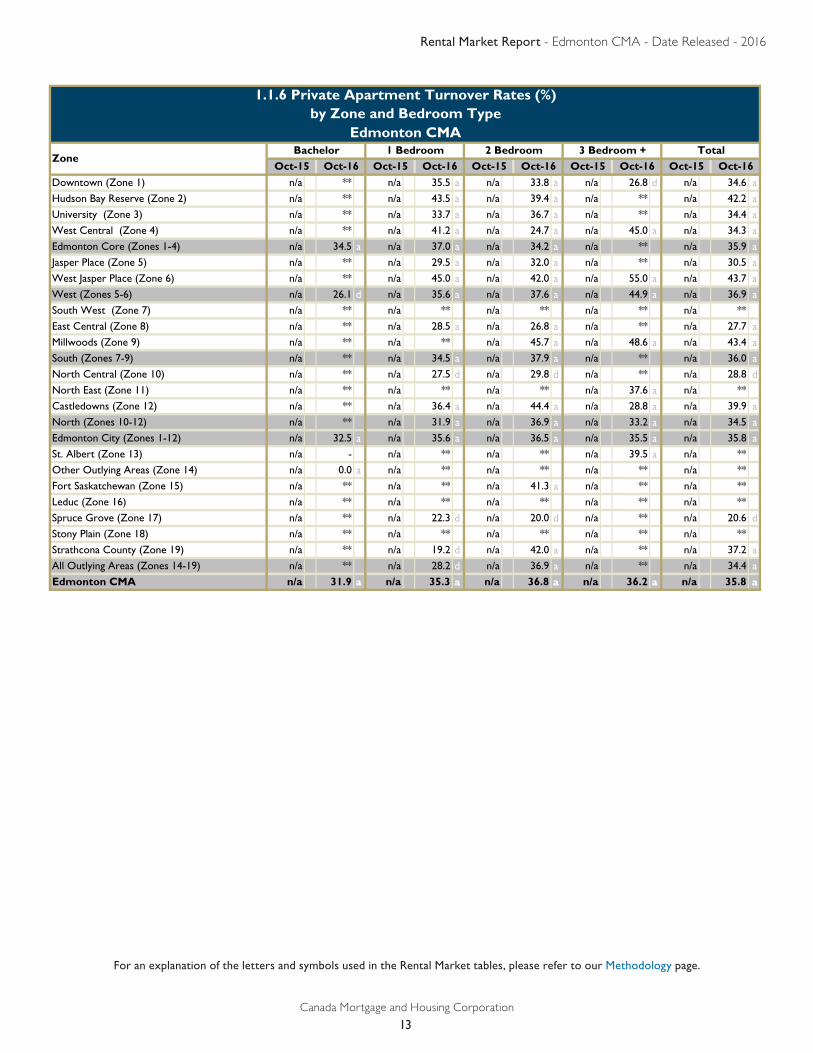
Downtown (Zone 1) n/a ** n/a 35.5 a n/a 33.8 a n/a 26.8 d n/a 34.6 aHudson Bay Reserve (Zone 2) n/a ** n/a 43.5 a n/a 39.4 a n/a ** n/a 42.2 aUniversity (Zone 3) n/a ** n/a 33.7 a n/a 36.7 a n/a ** n/a 34.4 aWest Central (Zone 4) n/a ** n/a 41.2 a n/a 24.7 a n/a 45.0 a n/a 34.3 aEdmonton Core (Zones 1-4) n/a 34.5 a n/a 37.0 a n/a 34.2 a n/a ** n/a 35.9 aJasper Place (Zone 5) n/a ** n/a 29.5 a n/a 32.0 a n/a ** n/a 30.5 aWest Jasper Place (Zone 6) n/a ** n/a 45.0 a n/a 42.0 a n/a 55.0 a n/a 43.7 aWest (Zones 5-6) n/a 26.1 d n/a 35.6 a n/a 37.6 a n/a 44.9 a n/a 36.9 aSouth West (Zone 7) n/a ** n/a ** n/a ** n/a ** n/a ** East Central (Zone 8) n/a ** n/a 28.5 a n/a 26.8 a n/a ** n/a 27.7 aMillwoods (Zone 9) n/a ** n/a ** n/a 45.7 a n/a 48.6 a n/a 43.4 aSouth (Zones 7-9) n/a ** n/a 34.5 a n/a 37.9 a n/a ** n/a 36.0 aNorth Central (Zone 10) n/a ** n/a 27.5 d n/a 29.8 d n/a ** n/a 28.8 dNorth East (Zone 11) n/a ** n/a ** n/a ** n/a 37.6 a n/a ** Castledowns (Zone 12) n/a ** n/a 36.4 a n/a 44.4 a n/a 28.8 a n/a 39.9 aNorth (Zones 10-12) n/a ** n/a 31.9 a n/a 36.9 a n/a 33.2 a n/a 34.5 aEdmonton City (Zones 1-12) n/a 32.5 a n/a 35.6 a n/a 36.5 a n/a 35.5 a n/a 35.8 aSt. Albert (Zone 13) n/a - n/a ** n/a ** n/a 39.5 a n/a ** Other Outlying Areas (Zone 14) n/a 0.0 a n/a ** n/a ** n/a ** n/a ** Fort Saskatchewan (Zone 15) n/a ** n/a ** n/a 41.3 a n/a ** n/a ** Leduc (Zone 16) n/a ** n/a ** n/a ** n/a ** n/a ** Spruce Grove (Zone 17) n/a ** n/a 22.3 d n/a 20.0 d n/a ** n/a 20.6 dStony Plain (Zone 18) n/a ** n/a ** n/a ** n/a ** n/a ** Strathcona County (Zone 19) n/a ** n/a 19.2 d n/a 42.0 a n/a ** n/a 37.2 aAll Outlying Areas (Zones 14-19) n/a ** n/a 28.2 d n/a 36.9 a n/a ** n/a 34.4 aEdmonton CMA n/a 31.9 a n/a 35.3 a n/a 36.8 a n/a 36.2 a n/a 35.8 a
1.1.6 Private Apartment Turnover Rates (%)by Zone and Bedroom Type
Edmonton CMA
ZoneBachelor 1 Bedroom
Oct-16 Oct-15 Oct-16
Oct-16 Oct-15 Oct-16 Oct-15
Oct-16 Oct-152 Bedroom 3 Bedroom + Total
Oct-15
Rental Market Report - Edmonton CMA - Date Released - 2016
Canada Mortgage and Housing Corporation
14
For an explanation of the letters and symbols used in the Rental Market tables, please refer to our Methodology page.
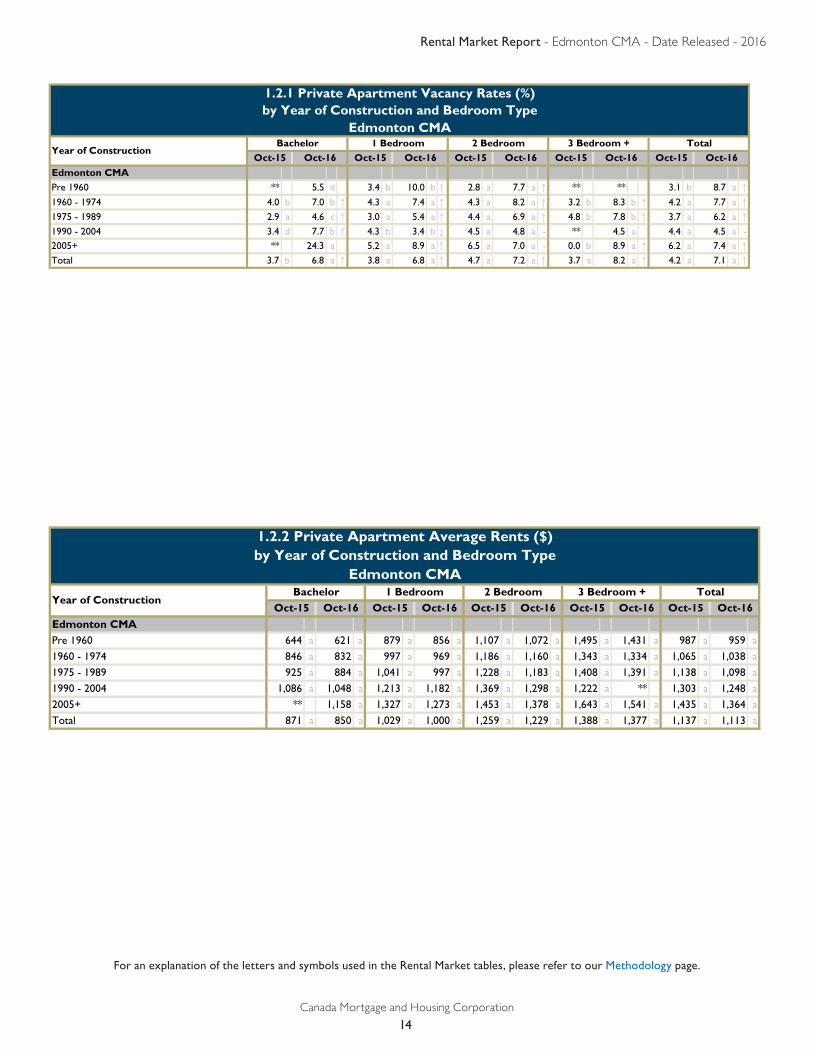
1.2.1 Private Apartment Vacancy Rates (%)by Year of Construction and Bedroom Type
Edmonton CMA
Edmonton CMAPre 1960 ** 5.5 d 3.4 b 10.0 b ↑ 2.8 a 7.7 a ↑ ** ** 3.1 b 8.7 a ↑1960 - 1974 4.0 b 7.0 b ↑ 4.3 a 7.4 a ↑ 4.3 a 8.2 a ↑ 3.2 b 8.3 b ↑ 4.2 a 7.7 a ↑1975 - 1989 2.9 a 4.6 c ↑ 3.0 a 5.4 a ↑ 4.4 a 6.9 a ↑ 4.8 b 7.8 b ↑ 3.7 a 6.2 a ↑1990 - 2004 3.4 d 7.7 b ↑ 4.3 b 3.4 b ↓ 4.5 a 4.8 a - ** 4.5 a 4.4 a 4.5 a -2005+ ** 24.3 a 5.2 a 8.9 a ↑ 6.5 a 7.0 a - 0.0 b 8.9 a ↑ 6.2 a 7.4 a ↑Total 3.7 b 6.8 a ↑ 3.8 a 6.8 a ↑ 4.7 a 7.2 a ↑ 3.7 a 8.2 a ↑ 4.2 a 7.1 a ↑
3 Bedroom + TotalYear of Construction
Bachelor 1 Bedroom 2 BedroomOct-15 Oct-16 Oct-15 Oct-16 Oct-15 Oct-16Oct-15 Oct-16 Oct-15 Oct-16
Edmonton CMAPre 1960 644 a 621 a 879 a 856 a 1,107 a 1,072 a 1,495 a 1,431 a 987 a 959 a
1960 - 1974 846 a 832 a 997 a 969 a 1,186 a 1,160 a 1,343 a 1,334 a 1,065 a 1,038 a
1975 - 1989 925 a 884 a 1,041 a 997 a 1,228 a 1,183 a 1,408 a 1,391 a 1,138 a 1,098 a
1990 - 2004 1,086 a 1,048 a 1,213 a 1,182 a 1,369 a 1,298 a 1,222 a ** 1,303 a 1,248 a
2005+ ** 1,158 a 1,327 a 1,273 a 1,453 a 1,378 a 1,643 a 1,541 a 1,435 a 1,364 a
Total 871 a 850 a 1,029 a 1,000 a 1,259 a 1,229 a 1,388 a 1,377 a 1,137 a 1,113 a
1.2.2 Private Apartment Average Rents ($)by Year of Construction and Bedroom Type
Edmonton CMA
Year of ConstructionBachelor 1 Bedroom 2 Bedroom 3 Bedroom + Total
Oct-15 Oct-16Oct-16 Oct-15 Oct-16 Oct-15Oct-16 Oct-15 Oct-16 Oct-15
Rental Market Report - Edmonton CMA - Date Released - 2016
Canada Mortgage and Housing Corporation
15
For an explanation of the letters and symbols used in the Rental Market tables, please refer to our Methodology page.
1.2.3 Private Apartment Turnover Rates (%)by Year of Construction and Bedroom Type
Edmonton CMA
Edmonton CMA Pre 1960 n/a ** n/a 45.1 a n/a 32.2 a n/a ** n/a 38.2 a
1960 - 1974 n/a 31.8 a n/a 36.8 a n/a 36.0 a n/a 33.7 a n/a 35.9 a
1975 - 1989 n/a ** n/a 32.4 a n/a 35.1 a n/a 36.4 a n/a 33.9 a
1990 - 2004 n/a ** n/a 25.8 d n/a ** n/a 17.1 a n/a 29.8 d2005+ n/a ** n/a ** n/a 45.6 a n/a ** n/a 44.6 aTotal n/a 31.9 a n/a 35.3 a n/a 36.8 a n/a 36.2 a n/a 35.8 a
1 BedroomOct-15
2 Bedroom 3 Bedroom + TotalOct-16 Oct-16Oct-15 Oct-15 Oct-16 Oct-15 Oct-16
Year of ConstructionBachelor
Oct-15 Oct-16
1.3.1 Private Apartment Vacancy Rates (%)by Structure Size and Bedroom Type
Edmonton CMA
Edmonton CMA3 to 5 Units ** ** 4.5 d ** ** 3.4 d 0.0 c ** 3.4 d 4.6 c -
6 to 19 Units 4.8 d ** 4.9 b 8.2 b ↑ 4.8 b 9.6 b ↑ 3.4 d 8.9 c ↑ 4.8 b 8.7 a ↑20 to 49 Units 5.3 b 10.0 b ↑ 4.3 a 7.4 a ↑ 4.6 a 8.0 a ↑ 4.8 a 9.1 b ↑ 4.5 a 7.8 a ↑50 to 99 Units 2.8 b 3.6 c - 2.5 a 5.4 a ↑ 4.2 a 5.4 a ↑ 1.8 a 3.8 b ↑ 3.5 a 5.3 a ↑100+ Units 1.7 a 5.4 a ↑ 2.8 a 5.3 a ↑ 5.5 a 6.8 a ↑ 4.7 a 12.6 a ↑ 3.8 a 6.2 a ↑Total 3.7 b 6.8 a ↑ 3.8 a 6.8 a ↑ 4.7 a 7.2 a ↑ 3.7 a 8.2 a ↑ 4.2 a 7.1 a ↑
3 Bedroom + TotalSize
Bachelor 1 Bedroom 2 BedroomOct-15 Oct-16 Oct-15 Oct-16 Oct-15 Oct-16Oct-15 Oct-16 Oct-15 Oct-16
Rental Market Report - Edmonton CMA - Date Released - 2016
Canada Mortgage and Housing Corporation
16
For an explanation of the letters and symbols used in the Rental Market tables, please refer to our Methodology page.
Edmonton CMA3 to 5 Units ** 549 c 784 b 793 b 1,045 a 1,000 a ** 1,232 b 999 b 953 a
6 to 19 Units 750 a 746 a 894 a 877 a 1,084 a 1,062 a 1,301 a 1,288 a 969 a 952 a
20 to 49 Units 796 a 769 a 964 a 930 a 1,173 a 1,139 a 1,352 a 1,344 a 1,066 a 1,036 a
50 to 99 Units 929 a 859 a 1,115 a 1,090 a 1,351 a 1,291 a 1,464 a 1,425 a 1,257 a 1,218 a
100+ Units 1,027 a 992 a 1,255 a 1,208 a 1,456 a 1,423 a 1,542 a 1,574 a 1,323 a 1,293 a
Total 871 a 850 a 1,029 a 1,000 a 1,259 a 1,229 a 1,388 a 1,377 a 1,137 a 1,113 a
1.3.2 Private Apartment Average Rents ($)by Structure Size and Bedroom Type
Edmonton CMA
SizeBachelor 1 Bedroom 2 Bedroom 3 Bedroom + Total
Oct-15 Oct-16Oct-16 Oct-15 Oct-16 Oct-15Oct-16 Oct-15 Oct-16 Oct-15
1.3.3 Private Apartment Vacancy Rates (%)by Structure Size and Zone
Edmonton CMA
Downtown (Zone 1) ** ** 3.2 d 8.5 b ↑ 4.2 b 7.7 a ↑ 2.6 c 7.0 a ↑ 3.8 a 6.3 a ↑Hudson Bay Reserve (Zone 2) ** ** 6.9 c 9.6 c - 6.1 c 9.1 a ↑ ** ** ** **
University (Zone 3) ** ** 3.4 d 6.7 c ↑ 4.6 b 6.6 b ↑ 0.9 a 7.8 c ↑ 1.9 a 4.9 a ↑West Central (Zone 4) ** ** 3.5 c 10.0 c ↑ 2.4 a 7.5 a ↑ - - ** **
Edmonton Core (Zones 1-4) ** ** 4.3 b 8.4 b ↑ 4.5 a 7.8 a ↑ 2.4 b 7.0 a ↑ 3.2 a 6.1 a ↑Jasper Place (Zone 5) ** ** 4.2 c 8.4 c ↑ 6.1 c 7.0 a - 6.0 a 10.4 d ↑ ** **
West Jasper Place (Zone 6) - - 2.5 a 8.5 b ↑ 3.7 a 8.3 c ↑ 2.0 a 3.1 a ↑ 1.8 a 5.2 a ↑West (Zones 5-6) ** ** 3.5 b 8.4 b ↑ 5.5 b 7.3 a ↑ 2.8 a 4.4 a ↑ 2.3 a 5.0 a ↑South West (Zone 7) ** ** 2.9 b 9.4 c ↑ 4.3 a 9.2 b ↑ 3.1 b 3.7 b - 2.0 a 5.0 a ↑East Central (Zone 8) ** 4.5 d 3.2 b 7.2 b ↑ 2.4 a 7.0 b ↑ 3.1 a ** ** **
Millwoods (Zone 9) ** ** 4.8 a 5.1 c - 2.9 a 7.8 c ↑ 1.8 a 5.4 b ↑ ** **
South (Zones 7-9) 1.3 d 3.8 d ↑ 3.6 b 7.1 b ↑ 3.8 a 8.7 a ↑ 2.5 a 4.3 a ↑ 2.3 a 5.5 a ↑North Central (Zone 10) ** ** 7.5 c 10.7 d - 4.2 b 7.5 a ↑ ** ** - -
North East (Zone 11) ** ** 7.2 a 7.0 c - 7.5 a 5.0 b ↓ 4.9 a 2.8 a ↓ ** **
Castledowns (Zone 12) - - 4.1 d 6.2 b - 2.2 a 8.8 b ↑ 4.0 c 11.0 d ↑ - **
North (Zones 10-12) 3.7 d ** 7.3 c 9.8 b ↑ 4.1 a 7.4 a ↑ 4.5 a 4.6 a - ** 14.0 a
Edmonton City (Zones 1-12) 3.7 d 3.1 d - 4.9 b 8.6 a ↑ 4.4 a 7.9 a ↑ 3.0 a 5.0 a ↑ 3.2 a 6.2 a ↑St. Albert (Zone 13) - - ** 7.2 a 3.9 d 5.4 b - 7.6 a 4.2 a ↓ ** **
Other Outlying Areas (Zone 14) 3.2 a 11.1 d ↑ 5.3 d 10.7 a ↑ 7.5 c 12.4 d ↑ - ** ** **
Fort Saskatchewan (Zone 15) ** ** 6.7 a 8.1 a ↑ 7.9 b 7.1 a - 0.4 a 6.4 a ↑ ** **
Leduc (Zone 16) - - 3.4 d 12.3 a ↑ 3.0 a 7.7 c ↑ 8.6 a 12.8 a ↑ - **
Spruce Grove (Zone 17) ** ** 2.0 c 14.7 c ↑ 3.3 a 5.2 a ↑ 7.1 a 3.5 a ↓ ** **
Stony Plain (Zone 18) - - ** ** 10.2 a 13.9 d ↑ - - - -
Strathcona County (Zone 19) - - 2.3 a 0.8 a ↓ 0.5 a 0.8 d - ** 6.1 a - -
All Outlying Areas (Zones 14-19) 2.0 c 13.2 c ↑ 4.1 b 9.7 a ↑ 5.8 a 8.0 b ↑ 5.7 a 8.3 a ↑ ** 5.2 a
Edmonton CMA 3.4 d 4.6 c - 4.8 b 8.7 a ↑ 4.5 a 7.8 a ↑ 3.5 a 5.3 a ↑ 3.8 a 6.2 a ↑
Oct-15 Oct-16 Oct-15 Oct-1650-99 100+
Oct-15 Oct-16Oct-15 Oct-16Zone
3-5 6-19 20-49Oct-15 Oct-16
Rental Market Report - Edmonton CMA - Date Released - 2016
Canada Mortgage and Housing Corporation
17
For an explanation of the letters and symbols used in the Rental Market tables, please refer to our Methodology page.
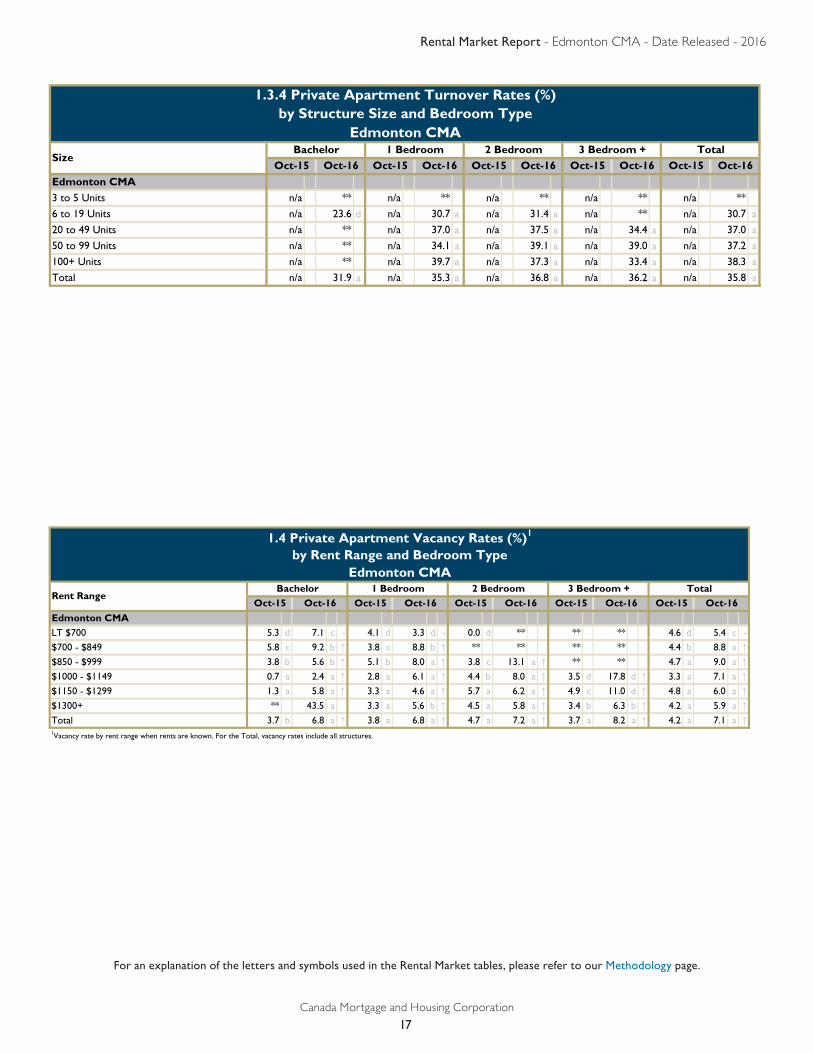
1.3.4 Private Apartment Turnover Rates (%)by Structure Size and Bedroom Type
Edmonton CMA
Edmonton CMA 3 to 5 Units n/a ** n/a ** n/a ** n/a ** n/a ** 6 to 19 Units n/a 23.6 d n/a 30.7 a n/a 31.4 a n/a ** n/a 30.7 a20 to 49 Units n/a ** n/a 37.0 a n/a 37.5 a n/a 34.4 a n/a 37.0 a50 to 99 Units n/a ** n/a 34.1 a n/a 39.1 a n/a 39.0 a n/a 37.2 a100+ Units n/a ** n/a 39.7 a n/a 37.3 a n/a 33.4 a n/a 38.3 aTotal n/a 31.9 a n/a 35.3 a n/a 36.8 a n/a 36.2 a n/a 35.8 a
1 BedroomOct-15
2 Bedroom 3 Bedroom + TotalOct-15 Oct-16 Oct-15 Oct-16
Oct-16 Oct-16Size
Oct-15Bachelor
Oct-15 Oct-16
Edmonton CMALT $700 5.3 d 7.1 c - 4.1 d 3.3 d - 0.0 d ** ** ** 4.6 d 5.4 c -
$700 - $849 5.8 c 9.2 b ↑ 3.8 c 8.8 b ↑ ** ** ** ** 4.4 b 8.8 a ↑$850 - $999 3.8 b 5.6 b ↑ 5.1 b 8.0 a ↑ 3.8 c 13.1 a ↑ ** ** 4.7 a 9.0 a ↑$1000 - $1149 0.7 a 2.4 a ↑ 2.8 a 6.1 a ↑ 4.4 b 8.0 a ↑ 3.5 d 17.8 d ↑ 3.3 a 7.1 a ↑$1150 - $1299 1.3 a 5.8 a ↑ 3.3 a 4.6 a ↑ 5.7 a 6.2 a ↑ 4.9 c 11.0 d ↑ 4.8 a 6.0 a ↑$1300+ ** 43.5 a 3.3 a 5.6 b ↑ 4.5 a 5.8 a ↑ 3.4 b 6.3 b ↑ 4.2 a 5.9 a ↑Total 3.7 b 6.8 a ↑ 3.8 a 6.8 a ↑ 4.7 a 7.2 a ↑ 3.7 a 8.2 a ↑ 4.2 a 7.1 a ↑
1.4 Private Apartment Vacancy Rates (%)1
by Rent Range and Bedroom TypeEdmonton CMA
3 Bedroom + TotalRent Range
Bachelor 1 Bedroom 2 BedroomOct-15
1Vacancy rate by rent range when rents are known. For the Total, vacancy rates include all structures.
Oct-16Oct-16 Oct-15 Oct-16 Oct-15Oct-16 Oct-15 Oct-16 Oct-15
Rental Market Report - Edmonton CMA - Date Released - 2016
Canada Mortgage and Housing Corporation
18
For an explanation of the letters and symbols used in the Rental Market tables, please refer to our Methodology page.
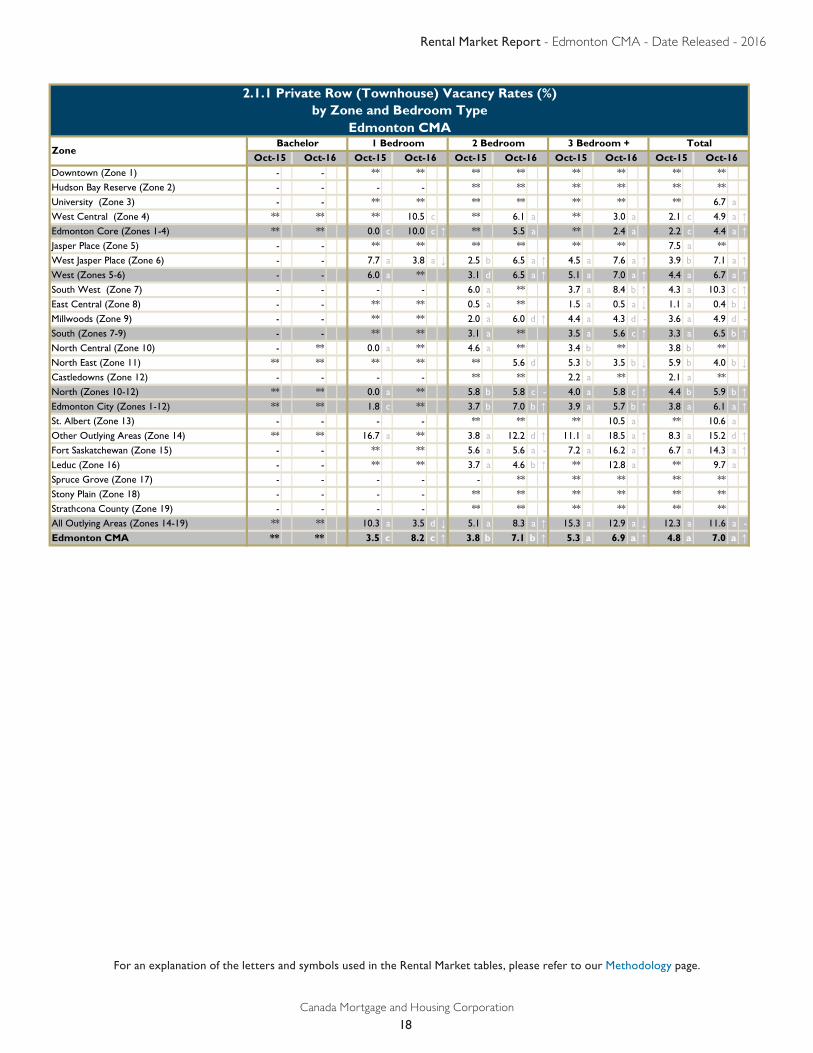
2.1.1 Private Row (Townhouse) Vacancy Rates (%)by Zone and Bedroom Type
Edmonton CMA
Downtown (Zone 1) - - ** ** ** ** ** ** ** **
Hudson Bay Reserve (Zone 2) - - - - ** ** ** ** ** **
University (Zone 3) - - ** ** ** ** ** ** ** 6.7 a
West Central (Zone 4) ** ** ** 10.5 c ** 6.1 a ** 3.0 a 2.1 c 4.9 a ↑Edmonton Core (Zones 1-4) ** ** 0.0 c 10.0 c ↑ ** 5.5 a ** 2.4 a 2.2 c 4.4 a ↑Jasper Place (Zone 5) - - ** ** ** ** ** ** 7.5 a **
West Jasper Place (Zone 6) - - 7.7 a 3.8 a ↓ 2.5 b 6.5 a ↑ 4.5 a 7.6 a ↑ 3.9 b 7.1 a ↑West (Zones 5-6) - - 6.0 a ** 3.1 d 6.5 a ↑ 5.1 a 7.0 a ↑ 4.4 a 6.7 a ↑South West (Zone 7) - - - - 6.0 a ** 3.7 a 8.4 b ↑ 4.3 a 10.3 c ↑East Central (Zone 8) - - ** ** 0.5 a ** 1.5 a 0.5 a ↓ 1.1 a 0.4 b ↓Millwoods (Zone 9) - - ** ** 2.0 a 6.0 d ↑ 4.4 a 4.3 d - 3.6 a 4.9 d -
South (Zones 7-9) - - ** ** 3.1 a ** 3.5 a 5.6 c ↑ 3.3 a 6.5 b ↑North Central (Zone 10) - ** 0.0 a ** 4.6 a ** 3.4 b ** 3.8 b **
North East (Zone 11) ** ** ** ** ** 5.6 d 5.3 b 3.5 b ↓ 5.9 b 4.0 b ↓Castledowns (Zone 12) - - - - ** ** 2.2 a ** 2.1 a **
North (Zones 10-12) ** ** 0.0 a ** 5.8 b 5.8 c - 4.0 a 5.8 c ↑ 4.4 b 5.9 b ↑Edmonton City (Zones 1-12) ** ** 1.8 c ** 3.7 b 7.0 b ↑ 3.9 a 5.7 b ↑ 3.8 a 6.1 a ↑St. Albert (Zone 13) - - - - ** ** ** 10.5 a ** 10.6 a
Other Outlying Areas (Zone 14) ** ** 16.7 a ** 3.8 a 12.2 d ↑ 11.1 a 18.5 a ↑ 8.3 a 15.2 d ↑Fort Saskatchewan (Zone 15) - - ** ** 5.6 a 5.6 a - 7.2 a 16.2 a ↑ 6.7 a 14.3 a ↑Leduc (Zone 16) - - ** ** 3.7 a 4.6 b ↑ ** 12.8 a ** 9.7 a
Spruce Grove (Zone 17) - - - - - ** ** ** ** **
Stony Plain (Zone 18) - - - - ** ** ** ** ** **
Strathcona County (Zone 19) - - - - ** ** ** ** ** **
All Outlying Areas (Zones 14-19) ** ** 10.3 a 3.5 d ↓ 5.1 a 8.3 a ↑ 15.3 a 12.9 a ↓ 12.3 a 11.6 a -
Edmonton CMA ** ** 3.5 c 8.2 c ↑ 3.8 b 7.1 b ↑ 5.3 a 6.9 a ↑ 4.8 a 7.0 a ↑
3 Bedroom + TotalZone
Bachelor 1 Bedroom 2 BedroomOct-15 Oct-16 Oct-15 Oct-16 Oct-15 Oct-16Oct-15 Oct-16 Oct-15 Oct-16
Rental Market Report - Edmonton CMA - Date Released - 2016
Canada Mortgage and Housing Corporation
19
For an explanation of the letters and symbols used in the Rental Market tables, please refer to our Methodology page.
Downtown (Zone 1) - - ** ** ** ** ** ** ** **
Hudson Bay Reserve (Zone 2) - - - - ** ** ** ** ** **
University (Zone 3) - - ** ** ** ** ** ** ** 1,135 b
West Central (Zone 4) ** ** 768 a 859 c 1,205 a 1,188 a 1,330 b 1,323 a 1,254 b 1,234 a
Edmonton Core (Zones 1-4) ** ** 933 c 924 b 1,236 a 1,207 a 1,353 a 1,344 a 1,278 a 1,254 a
Jasper Place (Zone 5) - - ** ** ** ** ** ** 1,408 a **
West Jasper Place (Zone 6) - - 1,317 a 1,305 a 1,452 a 1,399 a 1,538 a 1,452 a 1,501 a 1,428 a
West (Zones 5-6) - - 1,129 a 1,326 a 1,439 a 1,391 a 1,528 a 1,454 a 1,487 a 1,429 a
South West (Zone 7) - - - - 1,308 a 1,314 a 1,474 a 1,455 a 1,435 a 1,419 a
East Central (Zone 8) - - ** ** 1,312 b ** 1,375 b 1,317 b 1,350 c 1,293 c
Millwoods (Zone 9) - - ** 970 b 1,230 a 1,218 a 1,380 a 1,398 b 1,326 a 1,319 a
South (Zones 7-9) - - ** 932 b 1,283 a 1,267 a 1,427 a 1,410 a 1,385 a 1,364 a
North Central (Zone 10) - ** 802 c 848 b 1,189 a 1,200 b 1,314 a 1,302 a 1,261 a 1,257 a
North East (Zone 11) ** ** ** ** 1,261 a 1,255 a 1,329 a 1,317 a 1,311 a 1,297 a
Castledowns (Zone 12) - - - - ** ** 1,463 a 1,451 a 1,476 a 1,448 a
North (Zones 10-12) ** ** 802 c 848 b 1,249 a 1,240 a 1,362 a 1,351 a 1,331 a 1,319 a
Edmonton City (Zones 1-12) ** ** 985 d 1,030 b 1,301 a 1,279 a 1,415 a 1,390 a 1,375 a 1,349 a
St. Albert (Zone 13) - - - - ** ** ** 1,552 a ** 1,537 a
Other Outlying Areas (Zone 14) ** ** 925 b 972 b 1,020 a 1,063 a 1,325 b 1,413 a 1,094 a 1,251 b
Fort Saskatchewan (Zone 15) - - ** ** 1,106 a 1,149 a 1,252 a 1,401 a 1,218 a 1,356 a
Leduc (Zone 16) - - ** ** 1,087 a 1,019 a 1,563 a 1,326 b 1,398 b 1,213 b
Spruce Grove (Zone 17) - - - - - ** ** ** ** **
Stony Plain (Zone 18) - - - - ** ** ** ** ** **
Strathcona County (Zone 19) - - - - ** ** ** ** ** **
All Outlying Areas (Zones 14-19) ** ** 970 b 1,018 b 1,118 a 1,124 a 1,368 a 1,393 a 1,288 a 1,321 a
Edmonton CMA ** 848 b 982 d 1,028 b 1,280 a 1,262 a 1,408 a 1,394 a 1,364 a 1,348 a
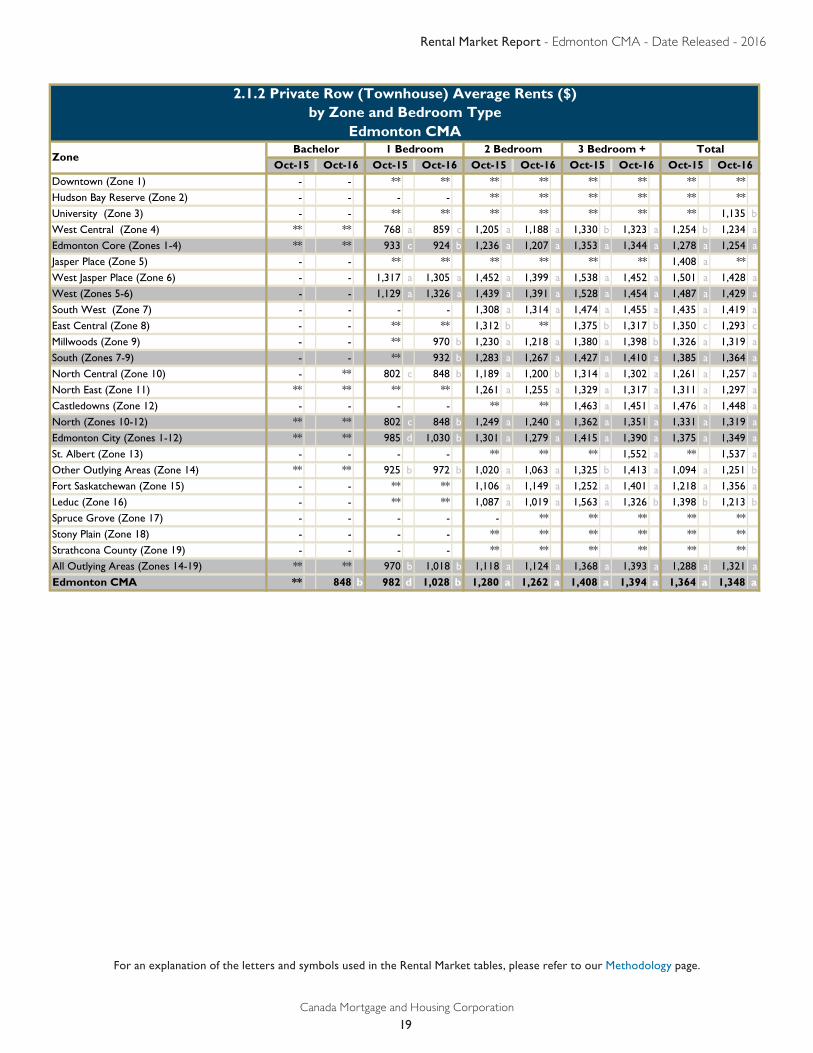
2.1.2 Private Row (Townhouse) Average Rents ($)by Zone and Bedroom Type
Edmonton CMA
ZoneBachelor 1 Bedroom 2 Bedroom 3 Bedroom + Total
Oct-15 Oct-16Oct-16 Oct-15 Oct-16 Oct-15Oct-16 Oct-15 Oct-16 Oct-15
Rental Market Report - Edmonton CMA - Date Released - 2016
Canada Mortgage and Housing Corporation
20
For an explanation of the letters and symbols used in the Rental Market tables, please refer to our Methodology page.
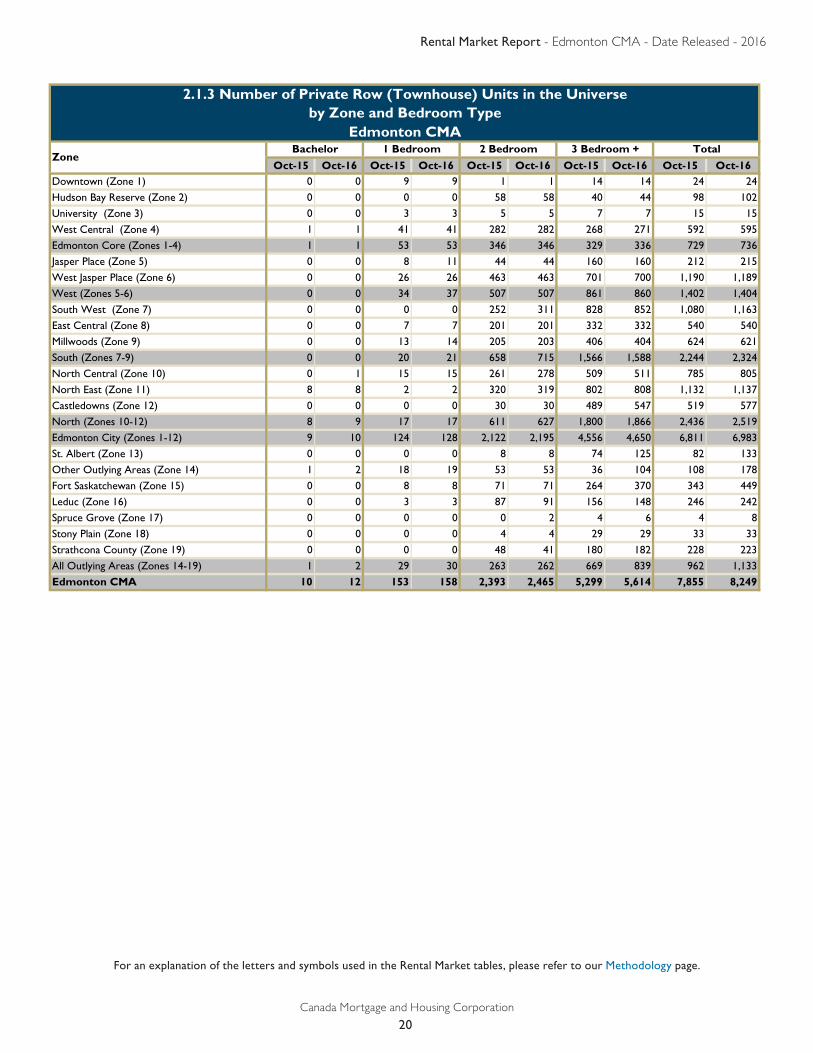
2.1.3 Number of Private Row (Townhouse) Units in the Universeby Zone and Bedroom Type
Edmonton CMA
Oct-15 Oct-16 Oct-15 Oct-16 Oct-15 Oct-16 Oct-15 Oct-16 Oct-15 Oct-16Downtown (Zone 1) 0 0 9 9 1 1 14 14 24 24
Hudson Bay Reserve (Zone 2) 0 0 0 0 58 58 40 44 98 102
University (Zone 3) 0 0 3 3 5 5 7 7 15 15
West Central (Zone 4) 1 1 41 41 282 282 268 271 592 595
Edmonton Core (Zones 1-4) 1 1 53 53 346 346 329 336 729 736
Jasper Place (Zone 5) 0 0 8 11 44 44 160 160 212 215
West Jasper Place (Zone 6) 0 0 26 26 463 463 701 700 1,190 1,189
West (Zones 5-6) 0 0 34 37 507 507 861 860 1,402 1,404
South West (Zone 7) 0 0 0 0 252 311 828 852 1,080 1,163
East Central (Zone 8) 0 0 7 7 201 201 332 332 540 540
Millwoods (Zone 9) 0 0 13 14 205 203 406 404 624 621
South (Zones 7-9) 0 0 20 21 658 715 1,566 1,588 2,244 2,324
North Central (Zone 10) 0 1 15 15 261 278 509 511 785 805
North East (Zone 11) 8 8 2 2 320 319 802 808 1,132 1,137
Castledowns (Zone 12) 0 0 0 0 30 30 489 547 519 577
North (Zones 10-12) 8 9 17 17 611 627 1,800 1,866 2,436 2,519
Edmonton City (Zones 1-12) 9 10 124 128 2,122 2,195 4,556 4,650 6,811 6,983
St. Albert (Zone 13) 0 0 0 0 8 8 74 125 82 133
Other Outlying Areas (Zone 14) 1 2 18 19 53 53 36 104 108 178
Fort Saskatchewan (Zone 15) 0 0 8 8 71 71 264 370 343 449
Leduc (Zone 16) 0 0 3 3 87 91 156 148 246 242
Spruce Grove (Zone 17) 0 0 0 0 0 2 4 6 4 8
Stony Plain (Zone 18) 0 0 0 0 4 4 29 29 33 33
Strathcona County (Zone 19) 0 0 0 0 48 41 180 182 228 223
All Outlying Areas (Zones 14-19) 1 2 29 30 263 262 669 839 962 1,133
Edmonton CMA 10 12 153 158 2,393 2,465 5,299 5,614 7,855 8,249
3 Bedroom + TotalZone
Bachelor 1 Bedroom 2 Bedroom

Rental Market Report - Edmonton CMA - Date Released - 2016
Canada Mortgage and Housing Corporation
21
For an explanation of the letters and symbols used in the Rental Market tables, please refer to our Methodology page.
2.1.4 Private Row (Townhouse) Availability Rates (%)by Zone and Bedroom Type
Edmonton CMA
Downtown (Zone 1) - - ** ** ** ** ** ** ** **
Hudson Bay Reserve (Zone 2) - - - - ** ** ** ** ** **
University (Zone 3) - - ** ** ** ** ** ** ** 6.7 a
West Central (Zone 4) ** ** ** 10.5 c ** 9.3 a ** 9.7 a 3.8 d 9.5 a ↑Edmonton Core (Zones 1-4) ** ** ** 10.0 c 3.8 d 9.0 a ↑ 4.5 d 8.1 a ↑ 4.2 d 8.7 a ↑Jasper Place (Zone 5) - - ** ** ** ** ** ** 7.5 a **
West Jasper Place (Zone 6) - - 7.7 a 7.7 a - 6.8 b 10.8 a ↑ 7.4 a 13.0 a ↑ 7.2 a 12.0 a ↑West (Zones 5-6) - - 6.0 a ** 7.0 b 11.5 a ↑ 7.4 a 11.5 a ↑ 7.2 a 11.4 a ↑South West (Zone 7) - - - - 8.3 a ** 4.7 a 12.5 a ↑ 5.6 a 14.9 a ↑East Central (Zone 8) - - ** ** 0.5 a 1.3 d - 1.8 a 0.5 a ↓ 1.3 a 0.7 b ↓Millwoods (Zone 9) - - ** ** 7.5 a 8.4 c - 5.4 a 5.9 d - 6.0 a 6.7 c -
South (Zones 7-9) - - ** ** 5.7 a 12.7 d ↑ 4.3 a 8.1 b ↑ 4.6 a 9.4 b ↑North Central (Zone 10) - ** 0.0 a ** 4.6 a ** 4.1 c ** 4.2 b **
North East (Zone 11) ** ** ** ** 10.5 d 6.4 c ↓ 6.1 b 5.8 a - 7.3 b 5.9 a ↓Castledowns (Zone 12) - - - - ** ** 5.3 a ** 5.4 a 10.4 d ↑North (Zones 10-12) ** ** 0.0 a ** 7.6 b 7.2 b - 5.3 a 7.3 b ↑ 5.9 a 7.4 b ↑Edmonton City (Zones 1-12) ** ** 3.5 d ** 6.2 a 10.2 c ↑ 5.3 a 8.4 a ↑ 5.6 a 9.0 a ↑St. Albert (Zone 13) - - - - ** ** ** 12.0 a ** 12.1 a
Other Outlying Areas (Zone 14) ** ** 16.7 a ** 3.8 a 12.2 d ↑ 11.1 a 20.4 a ↑ 8.3 a 16.9 d ↑Fort Saskatchewan (Zone 15) - - ** ** 5.6 a 5.6 a - 10.2 a 17.3 a ↑ 9.0 a 15.1 a ↑Leduc (Zone 16) - - ** ** 4.9 a 4.6 b - ** 12.8 a ** 10.1 a
Spruce Grove (Zone 17) - - - - - ** ** ** ** **
Stony Plain (Zone 18) - - - - ** ** ** ** ** **
Strathcona County (Zone 19) - - - - ** ** ** ** ** **
All Outlying Areas (Zones 14-19) ** ** 10.3 a ** 5.4 a 8.7 a ↑ 16.9 a 13.9 a ↓ 13.5 a 12.6 a ↓Edmonton CMA ** ** 4.8 c 10.4 d ↑ 6.1 a 10.1 a ↑ 6.7 a 9.3 a ↑ 6.5 a 9.6 a ↑
3 Bedroom + TotalZone
Bachelor 1 Bedroom 2 BedroomOct-15 Oct-16 Oct-15 Oct-16 Oct-15 Oct-16Oct-15 Oct-16 Oct-15 Oct-16
Rental Market Report - Edmonton CMA - Date Released - 2016
Canada Mortgage and Housing Corporation
22
For an explanation of the letters and symbols used in the Rental Market tables, please refer to our Methodology page.
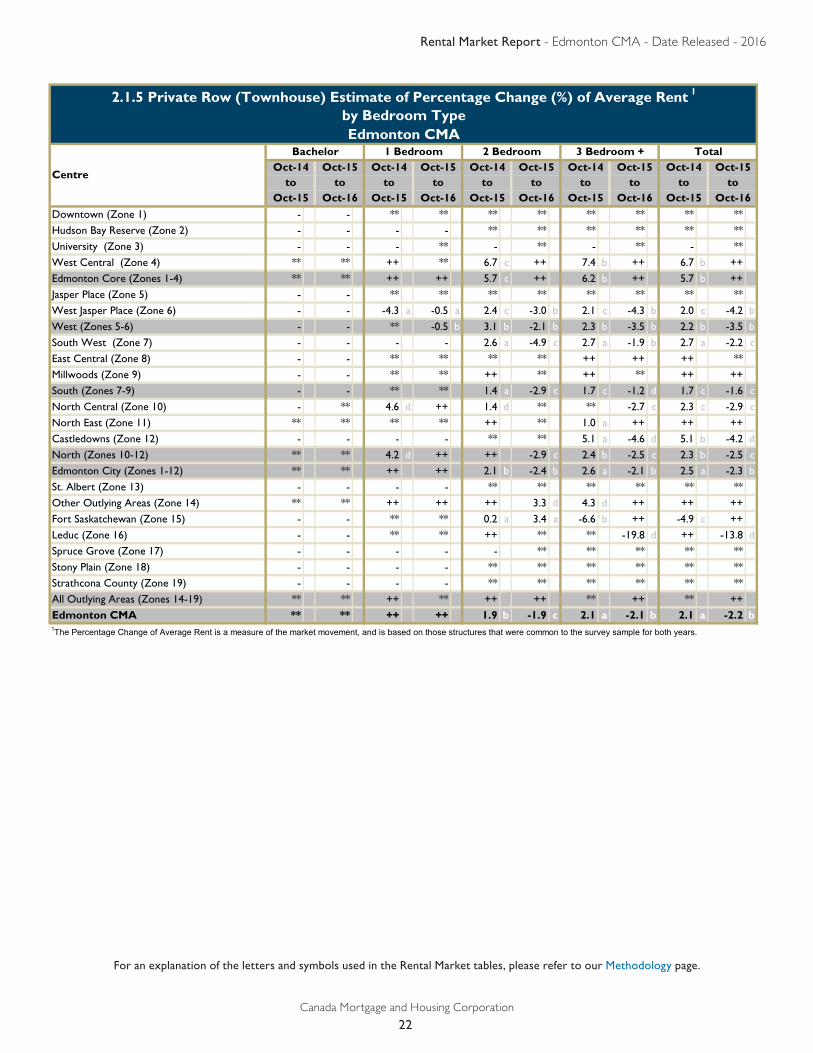
2.1.5 Private Row (Townhouse) Estimate of Percentage Change (%) of Average Rent 1
by Bedroom TypeEdmonton CMA
Downtown (Zone 1) - - ** ** ** ** ** ** ** **Hudson Bay Reserve (Zone 2) - - - - ** ** ** ** ** **University (Zone 3) - - - ** - ** - ** - **West Central (Zone 4) ** ** ++ ** 6.7 c ++ 7.4 b ++ 6.7 b ++Edmonton Core (Zones 1-4) ** ** ++ ++ 5.7 c ++ 6.2 b ++ 5.7 b ++Jasper Place (Zone 5) - - ** ** ** ** ** ** ** **West Jasper Place (Zone 6) - - -4.3 a -0.5 a 2.4 c -3.0 b 2.1 c -4.3 b 2.0 c -4.2 bWest (Zones 5-6) - - ** -0.5 b 3.1 b -2.1 b 2.3 b -3.5 b 2.2 b -3.5 bSouth West (Zone 7) - - - - 2.6 a -4.9 c 2.7 a -1.9 b 2.7 a -2.2 cEast Central (Zone 8) - - ** ** ** ** ++ ++ ++ **Millwoods (Zone 9) - - ** ** ++ ** ++ ** ++ ++South (Zones 7-9) - - ** ** 1.4 a -2.9 c 1.7 c -1.2 d 1.7 c -1.6 cNorth Central (Zone 10) - ** 4.6 d ++ 1.4 d ** ** -2.7 c 2.3 c -2.9 cNorth East (Zone 11) ** ** ** ** ++ ** 1.0 a ++ ++ ++Castledowns (Zone 12) - - - - ** ** 5.1 a -4.6 d 5.1 b -4.2 dNorth (Zones 10-12) ** ** 4.2 d ++ ++ -2.9 c 2.4 b -2.5 c 2.3 b -2.5 cEdmonton City (Zones 1-12) ** ** ++ ++ 2.1 b -2.4 b 2.6 a -2.1 b 2.5 a -2.3 bSt. Albert (Zone 13) - - - - ** ** ** ** ** **Other Outlying Areas (Zone 14) ** ** ++ ++ ++ 3.3 d 4.3 d ++ ++ ++Fort Saskatchewan (Zone 15) - - ** ** 0.2 a 3.4 a -6.6 b ++ -4.9 c ++Leduc (Zone 16) - - ** ** ++ ** ** -19.8 d ++ -13.8 dSpruce Grove (Zone 17) - - - - - ** ** ** ** **Stony Plain (Zone 18) - - - - ** ** ** ** ** **Strathcona County (Zone 19) - - - - ** ** ** ** ** **All Outlying Areas (Zones 14-19) ** ** ++ ** ++ ++ ** ++ ** ++Edmonton CMA ** ** ++ ++ 1.9 b -1.9 c 2.1 a -2.1 b 2.1 a -2.2 b
Oct-15 Oct-16to to
Oct-15 Oct-16to to
Oct-14 Oct-15 Oct-143 Bedroom + Total
Oct-14 Oct-15 Oct-14 Oct-15to to
2 Bedroom
Centre
Bachelor 1 Bedroom
to to to to
1The Percentage Change of Average Rent is a measure of the market movement, and is based on those structures that were common to the survey sample for both years.
Oct-15 Oct-16
Oct-15
Oct-15 Oct-16 Oct-15
Oct-14
Oct-16
Oct-15
Rental Market Report - Edmonton CMA - Date Released - 2016
Canada Mortgage and Housing Corporation
23
For an explanation of the letters and symbols used in the Rental Market tables, please refer to our Methodology page.
Downtown (Zone 1) n/a - n/a ** n/a ** n/a ** n/a ** Hudson Bay Reserve (Zone 2) n/a - n/a - n/a ** n/a ** n/a ** University (Zone 3) n/a - n/a ** n/a ** n/a ** n/a ** West Central (Zone 4) n/a ** n/a ** n/a 39.6 a n/a ** n/a ** Edmonton Core (Zones 1-4) n/a ** n/a ** n/a ** n/a ** n/a ** Jasper Place (Zone 5) n/a - n/a ** n/a ** n/a ** n/a ** West Jasper Place (Zone 6) n/a - n/a ** n/a ** n/a ** n/a 50.3 aWest (Zones 5-6) n/a - n/a ** n/a ** n/a ** n/a 42.7 aSouth West (Zone 7) n/a - n/a - n/a ** n/a ** n/a ** East Central (Zone 8) n/a - n/a ** n/a ** n/a ** n/a ** Millwoods (Zone 9) n/a - n/a ** n/a ** n/a ** n/a ** South (Zones 7-9) n/a - n/a ** n/a ** n/a 27.4 d n/a 25.7 dNorth Central (Zone 10) n/a ** n/a ** n/a ** n/a ** n/a ** North East (Zone 11) n/a ** n/a ** n/a ** n/a ** n/a ** Castledowns (Zone 12) n/a - n/a - n/a ** n/a ** n/a ** North (Zones 10-12) n/a ** n/a ** n/a ** n/a ** n/a ** Edmonton City (Zones 1-12) n/a ** n/a ** n/a ** n/a 36.1 a n/a 35.7 aSt. Albert (Zone 13) n/a - n/a - n/a ** n/a 10.7 a n/a 9.6 aOther Outlying Areas (Zone 14) n/a ** n/a ** n/a ** n/a ** n/a ** Fort Saskatchewan (Zone 15) n/a - n/a ** n/a ** n/a ** n/a ** Leduc (Zone 16) n/a - n/a ** n/a ** n/a ** n/a 28.0 dSpruce Grove (Zone 17) n/a - n/a - n/a - n/a ** n/a ** Stony Plain (Zone 18) n/a - n/a - n/a ** n/a ** n/a ** Strathcona County (Zone 19) n/a - n/a - n/a ** n/a ** n/a ** All Outlying Areas (Zones 14-19) n/a ** n/a ** n/a ** n/a ** n/a ** Edmonton CMA n/a ** n/a ** n/a ** n/a 34.5 a n/a 34.2 a
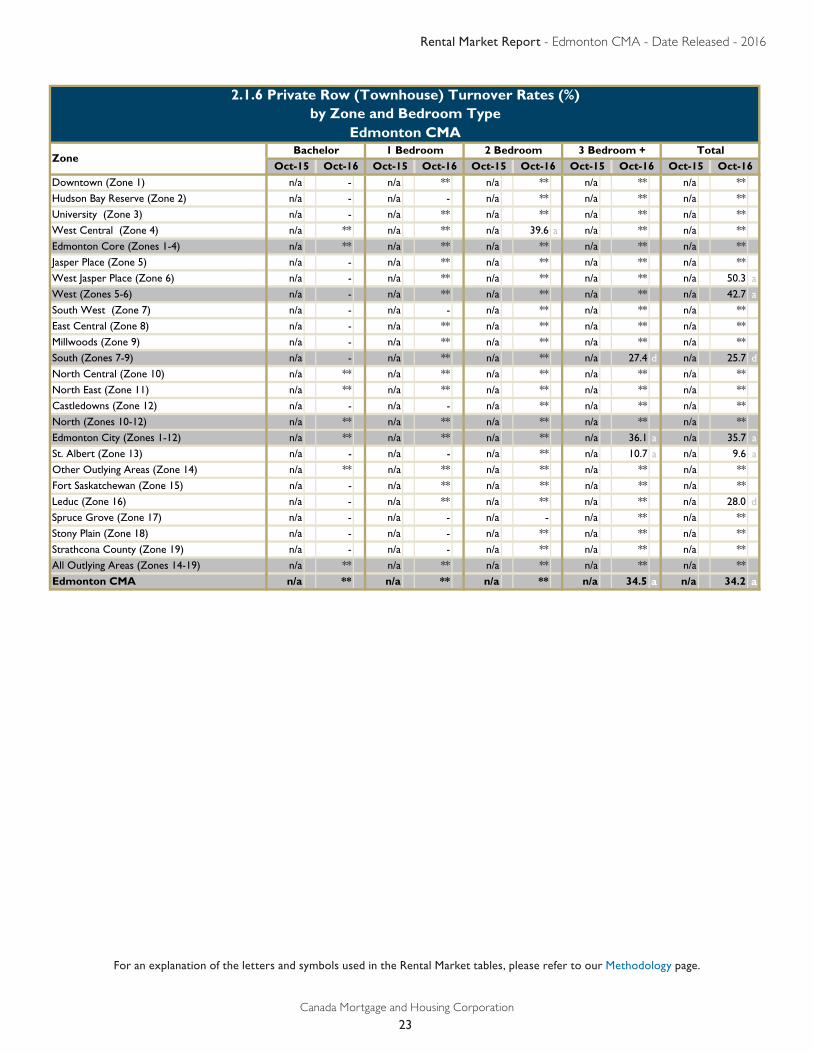
2.1.6 Private Row (Townhouse) Turnover Rates (%)by Zone and Bedroom Type
Edmonton CMA
ZoneBachelor 1 Bedroom
Oct-16 Oct-15 Oct-16
Oct-16 Oct-15 Oct-16 Oct-15
Oct-16 Oct-152 Bedroom 3 Bedroom + Total
Oct-15

Rental Market Report - Edmonton CMA - Date Released - 2016
Canada Mortgage and Housing Corporation
24
For an explanation of the letters and symbols used in the Rental Market tables, please refer to our Methodology page.
3.1.1 Private Row (Townhouse) and Apartment Vacancy Rates (%)by Zone and Bedroom Type
Edmonton CMA
Downtown (Zone 1) 3.1 c 6.7 a ↑ 3.5 b 6.8 a ↑ 4.0 b 7.4 a ↑ 2.4 c 7.5 c ↑ 3.6 a 7.0 a ↑Hudson Bay Reserve (Zone 2) ** 9.2 c 6.3 c 10.1 c ↑ 5.3 b 7.6 b ↑ ** 7.5 b 6.0 b 9.1 a ↑University (Zone 3) 3.3 d 5.9 c ↑ 3.4 b 6.1 b ↑ 2.4 a 5.8 b ↑ 1.3 d ** 3.1 b 6.1 a ↑West Central (Zone 4) 3.4 d 11.9 d ↑ 3.4 b 9.2 b ↑ 1.8 b 6.0 a ↑ ** 2.7 a 2.7 a 7.4 a ↑Edmonton Core (Zones 1-4) 3.6 b 7.1 a ↑ 4.0 a 7.5 a ↑ 3.6 a 6.9 a ↑ 3.0 d 6.1 b ↑ 3.8 a 7.2 a ↑Jasper Place (Zone 5) ** 9.6 c 4.9 c 6.9 b ↑ 5.8 c 8.0 b ↑ 4.9 c 6.6 b ↑ 5.3 b 7.4 a ↑West Jasper Place (Zone 6) 4.0 a ** 1.7 a 6.0 b ↑ 2.8 a 5.8 a ↑ 3.6 a 6.7 a ↑ 2.7 a 6.0 a ↑West (Zones 5-6) 5.8 c ** 3.7 b 6.5 a ↑ 4.0 b 6.6 a ↑ 4.0 a 6.7 a ↑ 3.9 a 6.6 a ↑South West (Zone 7) 1.5 a 3.6 d ↑ 2.6 a 4.3 a ↑ 4.0 a 7.8 a ↑ 3.7 a 8.9 b ↑ 3.4 a 6.8 a ↑East Central (Zone 8) 0.8 a ** 1.2 a 4.7 b ↑ 3.9 b 7.2 b ↑ 1.5 a 1.0 a - 2.4 a 5.1 b ↑Millwoods (Zone 9) 0.0 c 0.0 d - 2.8 a 6.1 c ↑ 2.7 a 6.2 a ↑ 4.0 a 4.1 d - 2.9 a 5.9 a ↑South (Zones 7-9) 1.1 a 3.4 d ↑ 2.3 a 4.7 a ↑ 3.6 a 7.2 a ↑ 3.4 a 6.3 b ↑ 3.1 a 6.3 a ↑North Central (Zone 10) 5.1 d ** 5.9 c 8.7 c ↑ 6.0 c 9.6 c ↑ 4.9 c ** 5.7 b 8.9 b ↑North East (Zone 11) 4.2 d 3.4 d - 5.0 a 4.2 b ↓ 7.3 a 5.5 a ↓ 5.6 b 3.8 b ↓ 6.4 a 4.8 a ↓Castledowns (Zone 12) 2.2 a 0.0 d ↓ 3.4 c 11.0 c ↑ 2.4 a 8.7 b ↑ 2.4 a 8.1 c ↑ 2.6 a 9.0 b ↑North (Zones 10-12) 4.7 d ** 5.2 b 7.8 b ↑ 5.7 a 7.5 a ↑ 4.4 a 6.3 b ↑ 5.3 a 7.3 a ↑Edmonton City (Zones 1-12) 3.7 b 6.8 a ↑ 3.8 a 6.9 a ↑ 4.1 a 7.1 a ↑ 3.8 a 6.4 a ↑ 4.0 a 6.9 a ↑St. Albert (Zone 13) - - 0.0 c 2.7 b ↑ 6.0 b 6.0 a - ** 9.1 a 4.4 c 6.1 a ↑Other Outlying Areas (Zone 14) 5.2 a ** 9.1 b 12.4 c ↑ 3.7 c 11.3 a ↑ 8.4 a 21.5 d ↑ 6.1 b 12.9 a ↑Fort Saskatchewan (Zone 15) ** 8.3 a 3.0 a 5.4 a ↑ 5.6 a 6.8 a ↑ 6.9 a 15.7 a ↑ 5.2 a 8.9 a ↑Leduc (Zone 16) 0.0 a ** 2.7 b 2.1 b - 6.6 b 13.3 a ↑ ** 10.7 c 11.1 c 10.7 a -
Spruce Grove (Zone 17) ** ** 2.4 b 3.8 a ↑ ** 4.2 a 0.0 a 9.4 a ↑ 11.9 d 4.2 a ↓Stony Plain (Zone 18) ** ** 10.5 a 4.4 d ↓ 8.6 a 13.3 c ↑ 14.8 c ** 10.2 a 13.7 c ↑Strathcona County (Zone 19) ** ** 0.8 a 3.4 c ↑ 2.8 a 4.0 a ↑ 2.0 a 5.2 a ↑ 2.2 a 4.1 a ↑All Outlying Areas (Zones 14-19) 3.0 c 5.6 c ↑ 4.4 a 5.3 a ↑ 7.8 b 8.5 a - 13.5 a 13.9 a - 7.9 a 8.6 a ↑Edmonton CMA 3.7 b 6.7 a ↑ 3.8 a 6.8 a ↑ 4.6 a 7.2 a ↑ 4.8 a 7.3 a ↑ 4.3 a 7.1 a ↑
3 Bedroom + TotalZone
Bachelor 1 Bedroom 2 BedroomOct-15 Oct-16 Oct-15 Oct-16 Oct-15 Oct-16Oct-15 Oct-16 Oct-15 Oct-16
Rental Market Report - Edmonton CMA - Date Released - 2016
Canada Mortgage and Housing Corporation
25
For an explanation of the letters and symbols used in the Rental Market tables, please refer to our Methodology page.
Downtown (Zone 1) 900 a 885 a 1,099 a 1,064 a 1,357 a 1,330 a 1,586 a 1,505 a 1,154 a 1,126 a
Hudson Bay Reserve (Zone 2) 719 a 744 a 878 a 876 a 1,108 a 1,110 a 1,264 a 1,500 a 956 a 961 a
University (Zone 3) 972 a 933 a 1,087 a 1,031 a 1,376 a 1,351 a 1,335 a 1,419 a 1,157 a 1,117 a
West Central (Zone 4) 756 a 749 a 935 a 915 a 1,137 a 1,120 a 1,333 a 1,324 a 1,049 a 1,035 a
Edmonton Core (Zones 1-4) 888 a 872 a 1,041 a 1,008 a 1,274 a 1,260 a 1,384 a 1,419 a 1,107 a 1,084 a
Jasper Place (Zone 5) 793 a 751 a 932 a 902 a 1,160 a 1,102 a 1,395 a 1,329 a 1,057 a 1,021 a
West Jasper Place (Zone 6) 926 a 904 a 1,118 a 1,076 a 1,346 a 1,294 a 1,517 a 1,436 a 1,304 a 1,260 a
West (Zones 5-6) 862 a 813 a 1,005 a 971 a 1,274 a 1,224 a 1,481 a 1,402 a 1,191 a 1,154 a
South West (Zone 7) 947 a 944 a 1,129 a 1,095 a 1,306 a 1,257 a 1,460 a 1,437 a 1,261 a 1,230 a
East Central (Zone 8) 870 a 909 b 961 a 932 a 1,151 a 1,122 a 1,393 b 1,319 b 1,105 a 1,076 a
Millwoods (Zone 9) 876 a 645 c 1,059 a 1,002 a 1,335 a 1,258 a 1,409 a 1,416 a 1,287 a 1,236 a
South (Zones 7-9) 914 a 915 a 1,080 a 1,046 a 1,292 a 1,241 a 1,434 a 1,411 a 1,239 a 1,207 a
North Central (Zone 10) 766 a 740 b 892 a 884 a 1,041 a 1,071 a 1,284 a 1,282 a 978 a 978 a
North East (Zone 11) 791 a 812 a 1,037 a 1,005 a 1,259 a 1,225 a 1,334 a 1,328 a 1,217 a 1,188 a
Castledowns (Zone 12) 820 a 726 a 1,020 a 1,028 a 1,214 a 1,268 a 1,438 a 1,431 a 1,222 a 1,242 a
North (Zones 10-12) 773 a 747 a 955 a 944 a 1,185 a 1,195 a 1,353 a 1,349 a 1,126 a 1,121 a
Edmonton City (Zones 1-12) 872 a 851 a 1,029 a 999 a 1,259 a 1,233 a 1,409 a 1,388 a 1,155 a 1,132 a
St. Albert (Zone 13) - - 1,045 a 1,055 a 1,382 a 1,322 a 1,334 a 1,467 a 1,321 a 1,312 a
Other Outlying Areas (Zone 14) 749 a 802 c 919 a 916 a 1,125 a 1,121 a 1,296 b 1,390 a 1,049 a 1,085 a
Fort Saskatchewan (Zone 15) 828 a 822 a 1,052 a 1,047 a 1,245 a 1,216 a 1,262 a 1,401 a 1,203 a 1,225 a
Leduc (Zone 16) 814 a ** 1,029 a 952 a 1,230 a 1,151 a 1,521 a 1,325 b 1,243 a 1,130 a
Spruce Grove (Zone 17) ** ** 1,039 a 1,051 a 1,285 a 1,222 a 1,265 a 1,136 a 1,220 a 1,169 a
Stony Plain (Zone 18) ** ** 961 a 890 a 1,146 a 1,026 a 1,274 a 1,217 a 1,130 a 1,038 a
Strathcona County (Zone 19) ** ** 1,128 a 1,143 a 1,376 a 1,358 a 1,377 a 1,427 a 1,333 a 1,329 a
All Outlying Areas (Zones 14-19) 808 a 823 a 1,018 a 1,008 a 1,246 a 1,197 a 1,354 a 1,370 a 1,208 a 1,177 a
Edmonton CMA 871 a 850 a 1,029 a 1,000 a 1,261 a 1,232 a 1,401 a 1,388 a 1,162 a 1,140 a
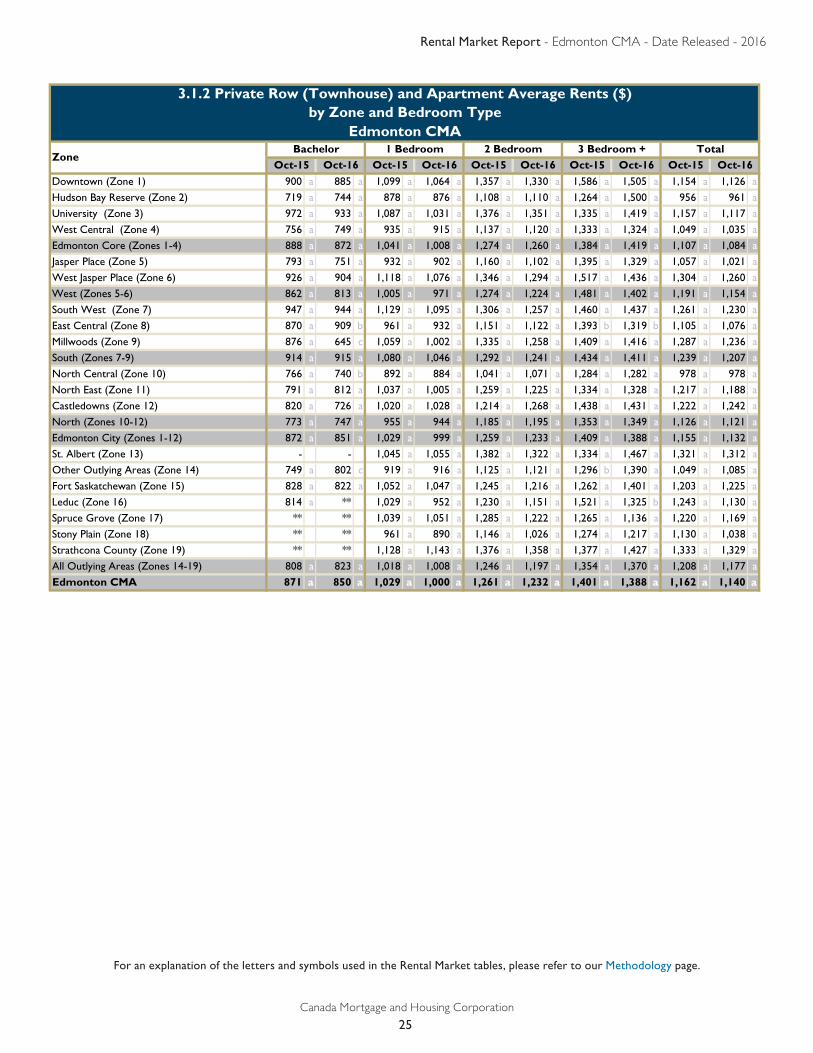
3.1.2 Private Row (Townhouse) and Apartment Average Rents ($)by Zone and Bedroom Type
Edmonton CMA
ZoneBachelor 1 Bedroom 2 Bedroom 3 Bedroom + Total
Oct-15 Oct-16Oct-16 Oct-15 Oct-16 Oct-15Oct-16 Oct-15 Oct-16 Oct-15
Rental Market Report - Edmonton CMA - Date Released - 2016
Canada Mortgage and Housing Corporation
26
For an explanation of the letters and symbols used in the Rental Market tables, please refer to our Methodology page.
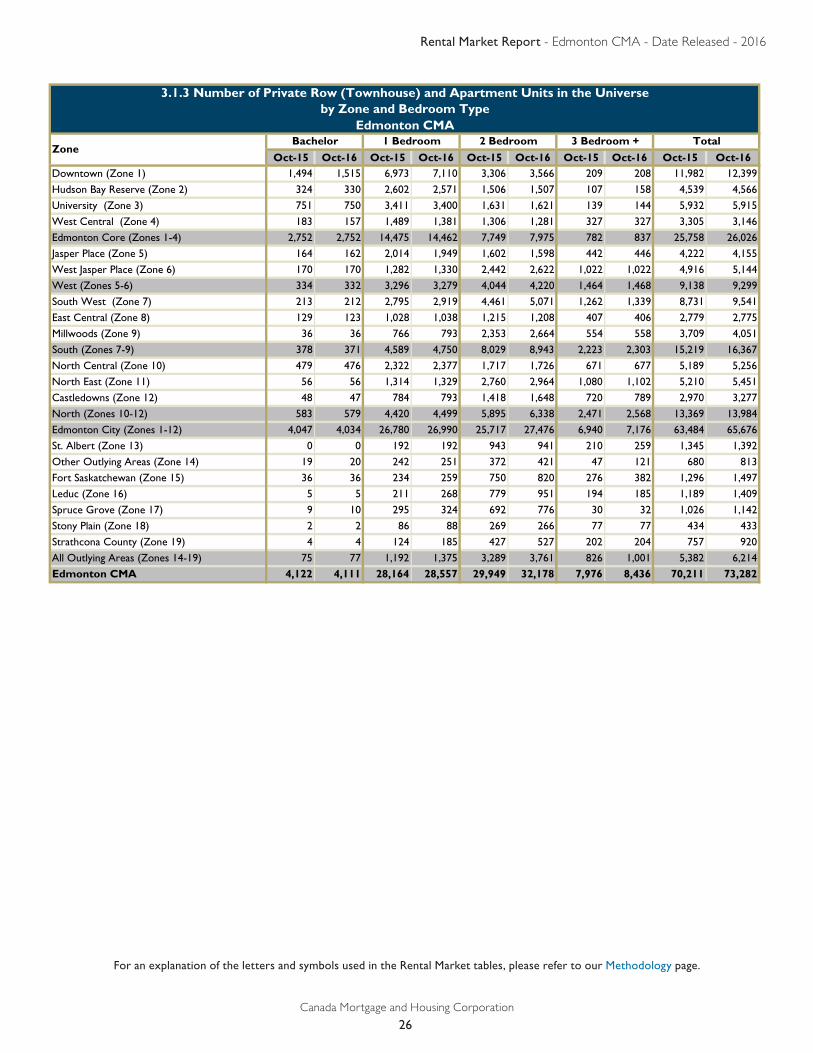
3.1.3 Number of Private Row (Townhouse) and Apartment Units in the Universeby Zone and Bedroom Type
Edmonton CMA
Oct-15 Oct-16 Oct-15 Oct-16 Oct-15 Oct-16 Oct-15 Oct-16 Oct-15 Oct-16Downtown (Zone 1) 1,494 1,515 6,973 7,110 3,306 3,566 209 208 11,982 12,399
Hudson Bay Reserve (Zone 2) 324 330 2,602 2,571 1,506 1,507 107 158 4,539 4,566
University (Zone 3) 751 750 3,411 3,400 1,631 1,621 139 144 5,932 5,915
West Central (Zone 4) 183 157 1,489 1,381 1,306 1,281 327 327 3,305 3,146
Edmonton Core (Zones 1-4) 2,752 2,752 14,475 14,462 7,749 7,975 782 837 25,758 26,026
Jasper Place (Zone 5) 164 162 2,014 1,949 1,602 1,598 442 446 4,222 4,155
West Jasper Place (Zone 6) 170 170 1,282 1,330 2,442 2,622 1,022 1,022 4,916 5,144
West (Zones 5-6) 334 332 3,296 3,279 4,044 4,220 1,464 1,468 9,138 9,299
South West (Zone 7) 213 212 2,795 2,919 4,461 5,071 1,262 1,339 8,731 9,541
East Central (Zone 8) 129 123 1,028 1,038 1,215 1,208 407 406 2,779 2,775
Millwoods (Zone 9) 36 36 766 793 2,353 2,664 554 558 3,709 4,051
South (Zones 7-9) 378 371 4,589 4,750 8,029 8,943 2,223 2,303 15,219 16,367
North Central (Zone 10) 479 476 2,322 2,377 1,717 1,726 671 677 5,189 5,256
North East (Zone 11) 56 56 1,314 1,329 2,760 2,964 1,080 1,102 5,210 5,451
Castledowns (Zone 12) 48 47 784 793 1,418 1,648 720 789 2,970 3,277
North (Zones 10-12) 583 579 4,420 4,499 5,895 6,338 2,471 2,568 13,369 13,984
Edmonton City (Zones 1-12) 4,047 4,034 26,780 26,990 25,717 27,476 6,940 7,176 63,484 65,676
St. Albert (Zone 13) 0 0 192 192 943 941 210 259 1,345 1,392
Other Outlying Areas (Zone 14) 19 20 242 251 372 421 47 121 680 813
Fort Saskatchewan (Zone 15) 36 36 234 259 750 820 276 382 1,296 1,497
Leduc (Zone 16) 5 5 211 268 779 951 194 185 1,189 1,409
Spruce Grove (Zone 17) 9 10 295 324 692 776 30 32 1,026 1,142
Stony Plain (Zone 18) 2 2 86 88 269 266 77 77 434 433
Strathcona County (Zone 19) 4 4 124 185 427 527 202 204 757 920
All Outlying Areas (Zones 14-19) 75 77 1,192 1,375 3,289 3,761 826 1,001 5,382 6,214
Edmonton CMA 4,122 4,111 28,164 28,557 29,949 32,178 7,976 8,436 70,211 73,282
3 Bedroom + TotalZone
Bachelor 1 Bedroom 2 Bedroom
Rental Market Report - Edmonton CMA - Date Released - 2016
Canada Mortgage and Housing Corporation
27
For an explanation of the letters and symbols used in the Rental Market tables, please refer to our Methodology page.
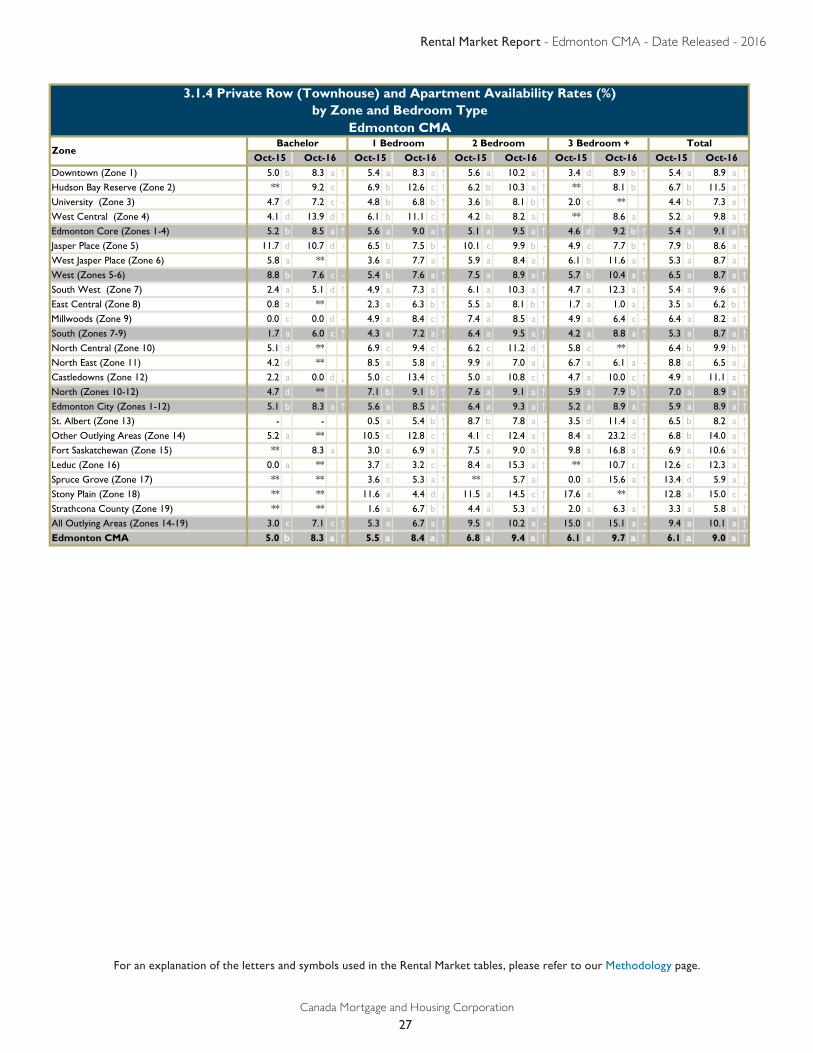
3.1.4 Private Row (Townhouse) and Apartment Availability Rates (%)by Zone and Bedroom Type
Edmonton CMA
Downtown (Zone 1) 5.0 b 8.3 a ↑ 5.4 a 8.3 a ↑ 5.6 a 10.2 a ↑ 3.4 d 8.9 b ↑ 5.4 a 8.9 a ↑Hudson Bay Reserve (Zone 2) ** 9.2 c 6.9 b 12.6 c ↑ 6.2 b 10.3 a ↑ ** 8.1 b 6.7 b 11.5 a ↑University (Zone 3) 4.7 d 7.2 c - 4.8 b 6.8 b ↑ 3.6 b 8.1 b ↑ 2.0 c ** 4.4 b 7.3 a ↑West Central (Zone 4) 4.1 d 13.9 d ↑ 6.1 b 11.1 c ↑ 4.2 b 8.2 a ↑ ** 8.6 a 5.2 a 9.8 a ↑Edmonton Core (Zones 1-4) 5.2 b 8.5 a ↑ 5.6 a 9.0 a ↑ 5.1 a 9.5 a ↑ 4.6 d 9.2 b ↑ 5.4 a 9.1 a ↑Jasper Place (Zone 5) 11.7 d 10.7 d - 6.5 b 7.5 b - 10.1 c 9.9 b - 4.9 c 7.7 b ↑ 7.9 b 8.6 a -
West Jasper Place (Zone 6) 5.8 a ** 3.6 a 7.7 a ↑ 5.9 a 8.4 a ↑ 6.1 b 11.6 a ↑ 5.3 a 8.7 a ↑West (Zones 5-6) 8.8 b 7.6 c - 5.4 b 7.6 a ↑ 7.5 a 8.9 a ↑ 5.7 b 10.4 a ↑ 6.5 a 8.7 a ↑South West (Zone 7) 2.4 a 5.1 d ↑ 4.9 a 7.3 a ↑ 6.1 a 10.3 a ↑ 4.7 a 12.3 a ↑ 5.4 a 9.6 a ↑East Central (Zone 8) 0.8 a ** 2.3 a 6.3 b ↑ 5.5 a 8.1 b ↑ 1.7 a 1.0 a ↓ 3.5 a 6.2 b ↑Millwoods (Zone 9) 0.0 c 0.0 d - 4.9 a 8.4 c ↑ 7.4 a 8.5 a ↑ 4.9 a 6.4 c - 6.4 a 8.2 a ↑South (Zones 7-9) 1.7 a 6.0 c ↑ 4.3 a 7.2 a ↑ 6.4 a 9.5 a ↑ 4.2 a 8.8 a ↑ 5.3 a 8.7 a ↑North Central (Zone 10) 5.1 d ** 6.9 c 9.4 c - 6.2 c 11.2 d ↑ 5.8 c ** 6.4 b 9.9 b ↑North East (Zone 11) 4.2 d ** 8.5 a 5.8 a ↓ 9.9 a 7.0 a ↓ 6.7 a 6.1 a - 8.8 a 6.5 a ↓Castledowns (Zone 12) 2.2 a 0.0 d ↓ 5.0 c 13.4 c ↑ 5.0 a 10.8 c ↑ 4.7 a 10.0 c ↑ 4.9 a 11.1 a ↑North (Zones 10-12) 4.7 d ** 7.1 b 9.1 b ↑ 7.6 a 9.1 a ↑ 5.9 a 7.9 b ↑ 7.0 a 8.9 a ↑Edmonton City (Zones 1-12) 5.1 b 8.3 a ↑ 5.6 a 8.5 a ↑ 6.4 a 9.3 a ↑ 5.2 a 8.9 a ↑ 5.9 a 8.9 a ↑St. Albert (Zone 13) - - 0.5 a 5.4 b ↑ 8.7 b 7.8 a - 3.5 d 11.4 a ↑ 6.5 b 8.2 a ↑Other Outlying Areas (Zone 14) 5.2 a ** 10.5 c 12.8 c ↑ 4.1 c 12.4 a ↑ 8.4 a 23.2 d ↑ 6.8 b 14.0 a ↑Fort Saskatchewan (Zone 15) ** 8.3 a 3.0 a 6.9 a ↑ 7.5 a 9.0 a ↑ 9.8 a 16.8 a ↑ 6.9 a 10.6 a ↑Leduc (Zone 16) 0.0 a ** 3.7 c 3.2 c - 8.4 a 15.3 a ↑ ** 10.7 c 12.6 c 12.3 a -
Spruce Grove (Zone 17) ** ** 3.6 c 5.3 a ↑ ** 5.7 a 0.0 a 15.6 a ↑ 13.4 d 5.9 a ↓Stony Plain (Zone 18) ** ** 11.6 a 4.4 d ↓ 11.5 a 14.5 c ↑ 17.6 a ** 12.8 a 15.0 c -
Strathcona County (Zone 19) ** ** 1.6 a 6.7 b ↑ 4.4 a 5.3 a ↑ 2.0 a 6.3 a ↑ 3.3 a 5.8 a ↑All Outlying Areas (Zones 14-19) 3.0 c 7.1 c ↑ 5.3 a 6.7 a ↑ 9.5 a 10.2 a - 15.0 a 15.1 a - 9.4 a 10.1 a ↑Edmonton CMA 5.0 b 8.3 a ↑ 5.5 a 8.4 a ↑ 6.8 a 9.4 a ↑ 6.1 a 9.7 a ↑ 6.1 a 9.0 a ↑
3 Bedroom + TotalZone
Bachelor 1 Bedroom 2 BedroomOct-15 Oct-16 Oct-15 Oct-16 Oct-15 Oct-16Oct-15 Oct-16 Oct-15 Oct-16
Rental Market Report - Edmonton CMA - Date Released - 2016
Canada Mortgage and Housing Corporation
28
For an explanation of the letters and symbols used in the Rental Market tables, please refer to our Methodology page.
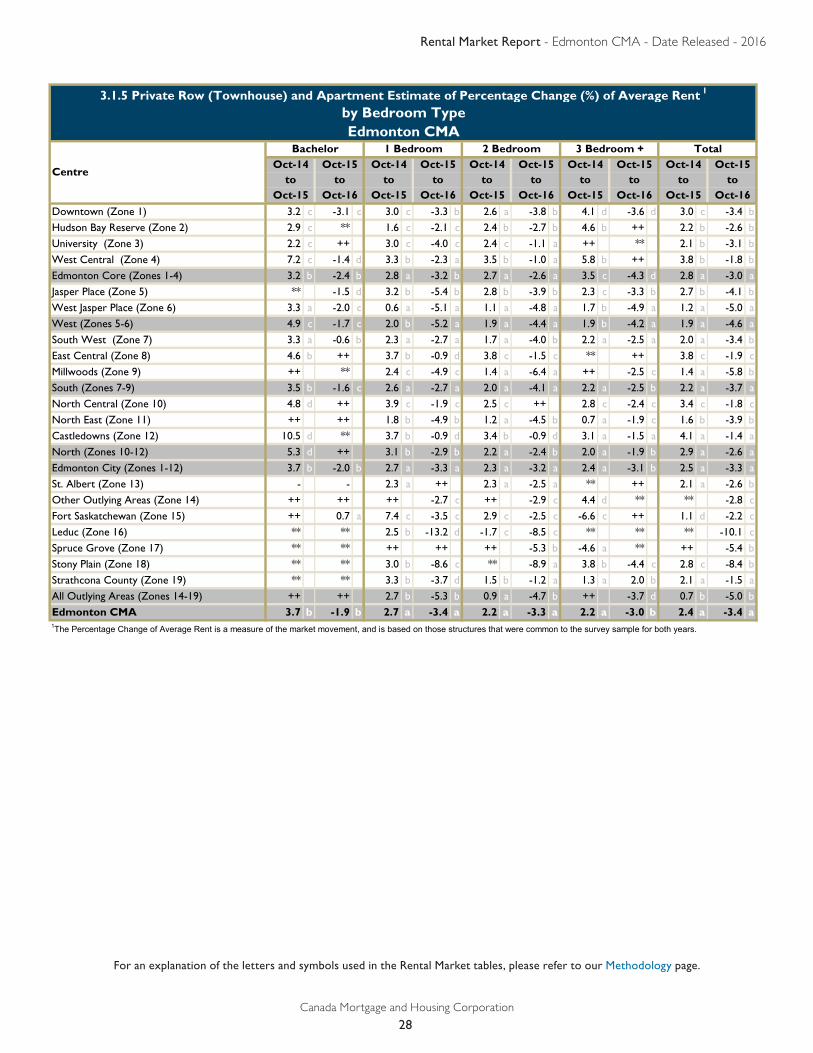
3.1.5 Private Row (Townhouse) and Apartment Estimate of Percentage Change (%) of Average Rent 1
by Bedroom TypeEdmonton CMA
Downtown (Zone 1) 3.2 c -3.1 c 3.0 c -3.3 b 2.6 a -3.8 b 4.1 d -3.6 d 3.0 c -3.4 bHudson Bay Reserve (Zone 2) 2.9 c ** 1.6 c -2.1 c 2.4 b -2.7 b 4.6 b ++ 2.2 b -2.6 bUniversity (Zone 3) 2.2 c ++ 3.0 c -4.0 c 2.4 c -1.1 a ++ ** 2.1 b -3.1 bWest Central (Zone 4) 7.2 c -1.4 d 3.3 b -2.3 a 3.5 b -1.0 a 5.8 b ++ 3.8 b -1.8 bEdmonton Core (Zones 1-4) 3.2 b -2.4 b 2.8 a -3.2 b 2.7 a -2.6 a 3.5 c -4.3 d 2.8 a -3.0 aJasper Place (Zone 5) ** -1.5 d 3.2 b -5.4 b 2.8 b -3.9 b 2.3 c -3.3 b 2.7 b -4.1 bWest Jasper Place (Zone 6) 3.3 a -2.0 c 0.6 a -5.1 a 1.1 a -4.8 a 1.7 b -4.9 a 1.2 a -5.0 aWest (Zones 5-6) 4.9 c -1.7 c 2.0 b -5.2 a 1.9 a -4.4 a 1.9 b -4.2 a 1.9 a -4.6 aSouth West (Zone 7) 3.3 a -0.6 b 2.3 a -2.7 a 1.7 a -4.0 b 2.2 a -2.5 a 2.0 a -3.4 bEast Central (Zone 8) 4.6 b ++ 3.7 b -0.9 d 3.8 c -1.5 c ** ++ 3.8 c -1.9 cMillwoods (Zone 9) ++ ** 2.4 c -4.9 c 1.4 a -6.4 a ++ -2.5 c 1.4 a -5.8 bSouth (Zones 7-9) 3.5 b -1.6 c 2.6 a -2.7 a 2.0 a -4.1 a 2.2 a -2.5 b 2.2 a -3.7 aNorth Central (Zone 10) 4.8 d ++ 3.9 c -1.9 c 2.5 c ++ 2.8 c -2.4 c 3.4 c -1.8 cNorth East (Zone 11) ++ ++ 1.8 b -4.9 b 1.2 a -4.5 b 0.7 a -1.9 c 1.6 b -3.9 bCastledowns (Zone 12) 10.5 d ** 3.7 b -0.9 d 3.4 b -0.9 d 3.1 a -1.5 a 4.1 a -1.4 aNorth (Zones 10-12) 5.3 d ++ 3.1 b -2.9 b 2.2 a -2.4 b 2.0 a -1.9 b 2.9 a -2.6 aEdmonton City (Zones 1-12) 3.7 b -2.0 b 2.7 a -3.3 a 2.3 a -3.2 a 2.4 a -3.1 b 2.5 a -3.3 aSt. Albert (Zone 13) - - 2.3 a ++ 2.3 a -2.5 a ** ++ 2.1 a -2.6 bOther Outlying Areas (Zone 14) ++ ++ ++ -2.7 c ++ -2.9 c 4.4 d ** ** -2.8 cFort Saskatchewan (Zone 15) ++ 0.7 a 7.4 c -3.5 c 2.9 c -2.5 c -6.6 c ++ 1.1 d -2.2 cLeduc (Zone 16) ** ** 2.5 b -13.2 d -1.7 c -8.5 c ** ** ** -10.1 cSpruce Grove (Zone 17) ** ** ++ ++ ++ -5.3 b -4.6 a ** ++ -5.4 bStony Plain (Zone 18) ** ** 3.0 b -8.6 c ** -8.9 a 3.8 b -4.4 c 2.8 c -8.4 bStrathcona County (Zone 19) ** ** 3.3 b -3.7 d 1.5 b -1.2 a 1.3 a 2.0 b 2.1 a -1.5 aAll Outlying Areas (Zones 14-19) ++ ++ 2.7 b -5.3 b 0.9 a -4.7 b ++ -3.7 d 0.7 b -5.0 bEdmonton CMA 3.7 b -1.9 b 2.7 a -3.4 a 2.2 a -3.3 a 2.2 a -3.0 b 2.4 a -3.4 a
Oct-15 Oct-16to to
Oct-15 Oct-16to to
Oct-14 Oct-15 Oct-143 Bedroom + Total
Oct-14 Oct-15 Oct-14 Oct-15to to
2 Bedroom
Centre
Bachelor 1 Bedroom
to to to to
1The Percentage Change of Average Rent is a measure of the market movement, and is based on those structures that were common to the survey sample for both years.
Oct-15 Oct-16
Oct-15
Oct-15 Oct-16 Oct-15
Oct-14
Oct-16
Oct-15

Rental Market Report - Edmonton CMA - Date Released - 2016
Canada Mortgage and Housing Corporation
29
For an explanation of the letters and symbols used in the Rental Market tables, please refer to our Methodology page.
Downtown (Zone 1) n/a ** n/a 35.5 a n/a 33.8 a n/a 29.9 d n/a 34.7 aHudson Bay Reserve (Zone 2) n/a ** n/a 43.5 a n/a 39.4 a n/a ** n/a 41.8 aUniversity (Zone 3) n/a ** n/a 33.7 a n/a 36.7 a n/a ** n/a 34.4 aWest Central (Zone 4) n/a ** n/a 41.1 a n/a 28.2 a n/a ** n/a 35.6 aEdmonton Core (Zones 1-4) n/a 34.6 a n/a 37.0 a n/a 34.5 a n/a ** n/a 36.0 aJasper Place (Zone 5) n/a ** n/a 29.5 a n/a 28.1 a n/a ** n/a 28.9 aWest Jasper Place (Zone 6) n/a ** n/a 44.7 a n/a 45.0 a n/a 49.1 a n/a 45.3 aWest (Zones 5-6) n/a 26.1 d n/a 35.6 a n/a 37.9 a n/a 45.6 a n/a 37.8 aSouth West (Zone 7) n/a ** n/a ** n/a ** n/a 28.7 d n/a 34.8 aEast Central (Zone 8) n/a ** n/a 27.3 a n/a 23.2 d n/a ** n/a 23.3 aMillwoods (Zone 9) n/a ** n/a ** n/a 44.4 a n/a ** n/a 41.9 aSouth (Zones 7-9) n/a ** n/a 34.1 a n/a 36.9 a n/a 28.4 d n/a 34.5 aNorth Central (Zone 10) n/a ** n/a 27.6 d n/a ** n/a ** n/a ** North East (Zone 11) n/a ** n/a ** n/a ** n/a ** n/a ** Castledowns (Zone 12) n/a ** n/a 36.4 a n/a 44.1 a n/a ** n/a 39.5 aNorth (Zones 10-12) n/a ** n/a 31.9 a n/a 37.3 a n/a 37.6 a n/a 35.5 aEdmonton City (Zones 1-12) n/a 32.7 a n/a 35.5 a n/a 36.4 a n/a 35.9 a n/a 35.8 aSt. Albert (Zone 13) n/a - n/a ** n/a ** n/a 28.9 a n/a ** Other Outlying Areas (Zone 14) n/a ** n/a ** n/a ** n/a ** n/a ** Fort Saskatchewan (Zone 15) n/a ** n/a ** n/a 39.1 a n/a ** n/a ** Leduc (Zone 16) n/a ** n/a ** n/a ** n/a ** n/a ** Spruce Grove (Zone 17) n/a ** n/a 22.3 d n/a 20.0 d n/a ** n/a 20.6 dStony Plain (Zone 18) n/a ** n/a ** n/a ** n/a ** n/a ** Strathcona County (Zone 19) n/a ** n/a 19.2 d n/a 42.0 a n/a ** n/a 37.2 aAll Outlying Areas (Zones 14-19) n/a ** n/a 27.9 d n/a 36.1 a n/a ** n/a 32.7 aEdmonton CMA n/a 32.0 a n/a 35.2 a n/a 36.6 a n/a 35.1 a n/a 35.6 a
3.1.6 Private Row (Townhouse) and Apartment Turnover Rates (%)by Zone and Bedroom Type
Edmonton CMA
ZoneBachelor 1 Bedroom
Oct-16 Oct-15 Oct-16
Oct-16 Oct-15 Oct-16 Oct-15
Oct-16 Oct-152 Bedroom 3 Bedroom + Total
Oct-15
Rental Market Report - Edmonton CMA - Date Released - 2016
Canada Mortgage and Housing Corporation
30
For an explanation of the letters and symbols used in the Rental Market tables, please refer to our Methodology page.
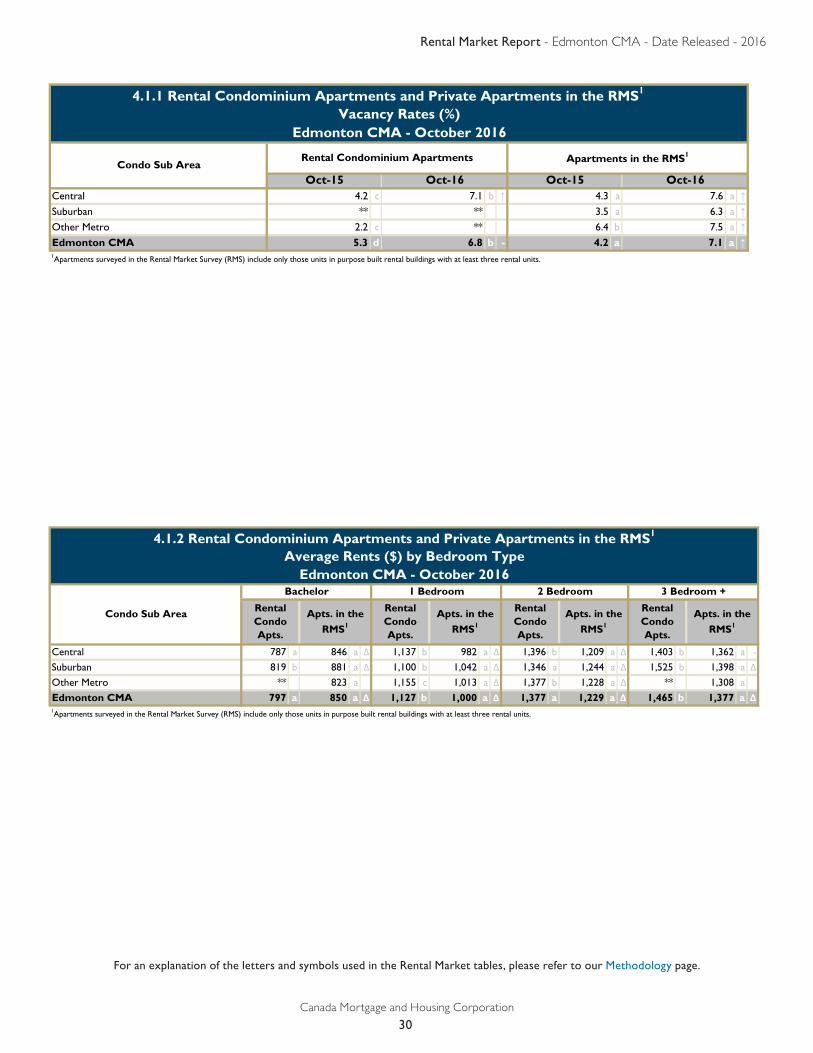
Central 4.2 c 7.1 b ↑ 4.3 a 7.6 a ↑Suburban ** ** 3.5 a 6.3 a ↑Other Metro 2.2 c ** 6.4 b 7.5 a ↑Edmonton CMA 5.3 d 6.8 b - 4.2 a 7.1 a ↑
Oct-16
1Apartments surveyed in the Rental Market Survey (RMS) include only those units in purpose built rental buildings with at least three rental units.
Rental Condominium Apartments Apartments in the RMS1
4.1.1 Rental Condominium Apartments and Private Apartments in the RMS1
Vacancy Rates (%)Edmonton CMA - October 2016
Condo Sub AreaOct-15 Oct-16 Oct-15
Central 787 a 846 a Δ 1,137 b 982 a Δ 1,396 b 1,209 a Δ 1,403 b 1,362 a -
Suburban 819 b 881 a Δ 1,100 b 1,042 a Δ 1,346 a 1,244 a Δ 1,525 b 1,398 a ΔOther Metro ** 823 a 1,155 c 1,013 a Δ 1,377 b 1,228 a Δ ** 1,308 a
Edmonton CMA 797 a 850 a Δ 1,127 b 1,000 a Δ 1,377 a 1,229 a Δ 1,465 b 1,377 a Δ
4.1.2 Rental Condominium Apartments and Private Apartments in the RMS1
Average Rents ($) by Bedroom TypeEdmonton CMA - October 2016
Condo Sub Area
Bachelor 1 Bedroom 2 Bedroom 3 Bedroom +
Apts. in the
RMS1
Apts. in the
RMS1
1Apartments surveyed in the Rental Market Survey (RMS) include only those units in purpose built rental buildings with at least three rental units.
Rental Condo Apts.
Apts. in the
RMS1
Rental Condo Apts.
Rental Condo Apts.
Apts. in the
RMS1
Rental Condo Apts.
Rental Market Report - Edmonton CMA - Date Released - 2016
Canada Mortgage and Housing Corporation
31
For an explanation of the letters and symbols used in the Rental Market tables, please refer to our Methodology page.
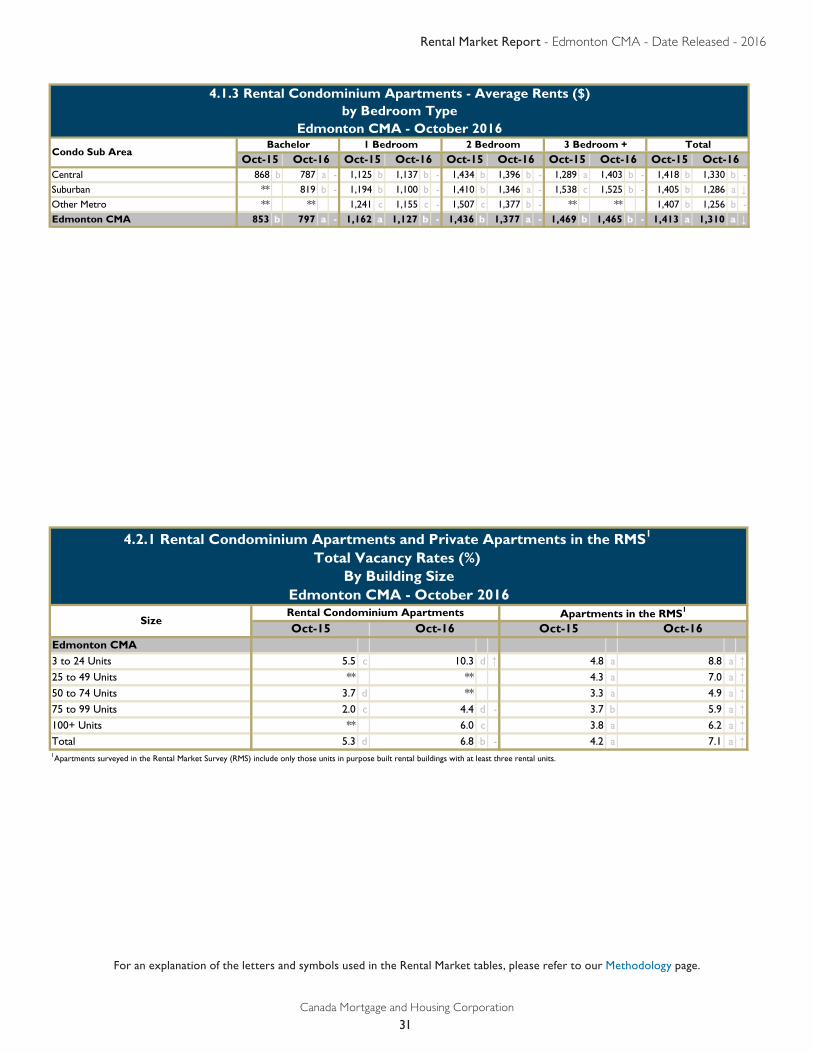
4.1.3 Rental Condominium Apartments - Average Rents ($)by Bedroom Type
Edmonton CMA - October 2016
Central 868 b 787 a - 1,125 b 1,137 b - 1,434 b 1,396 b - 1,289 a 1,403 b - 1,418 b 1,330 b -Suburban ** 819 b - 1,194 b 1,100 b - 1,410 b 1,346 a - 1,538 c 1,525 b - 1,405 b 1,286 a ↓Other Metro ** ** 1,241 c 1,155 c - 1,507 c 1,377 b - ** ** 1,407 b 1,256 b -Edmonton CMA 853 b 797 a - 1,162 a 1,127 b - 1,436 b 1,377 a - 1,469 b 1,465 b - 1,413 a 1,310 a ↓
Oct-15 Oct-163 Bedroom + Total
Oct-15 Oct-16Condo Sub Area
Bachelor 1 Bedroom 2 Bedroom
Oct-15 Oct-16Oct-15 Oct-16 Oct-15 Oct-16
Edmonton CMA3 to 24 Units 5.5 c 10.3 d ↑ 4.8 a 8.8 a ↑25 to 49 Units ** ** 4.3 a 7.0 a ↑50 to 74 Units 3.7 d ** 3.3 a 4.9 a ↑75 to 99 Units 2.0 c 4.4 d - 3.7 b 5.9 a ↑100+ Units ** 6.0 c 3.8 a 6.2 a ↑Total 5.3 d 6.8 b - 4.2 a 7.1 a ↑
Rental Condominium Apartments Apartments in the RMS1
Oct-15
1Apartments surveyed in the Rental Market Survey (RMS) include only those units in purpose built rental buildings with at least three rental units.
Oct-16
4.2.1 Rental Condominium Apartments and Private Apartments in the RMS1
By Building SizeTotal Vacancy Rates (%)
Edmonton CMA - October 2016
Oct-15 Oct-16Size
Rental Market Report - Edmonton CMA - Date Released - 2016
Canada Mortgage and Housing Corporation
32
For an explanation of the letters and symbols used in the Rental Market tables, please refer to our Methodology page.
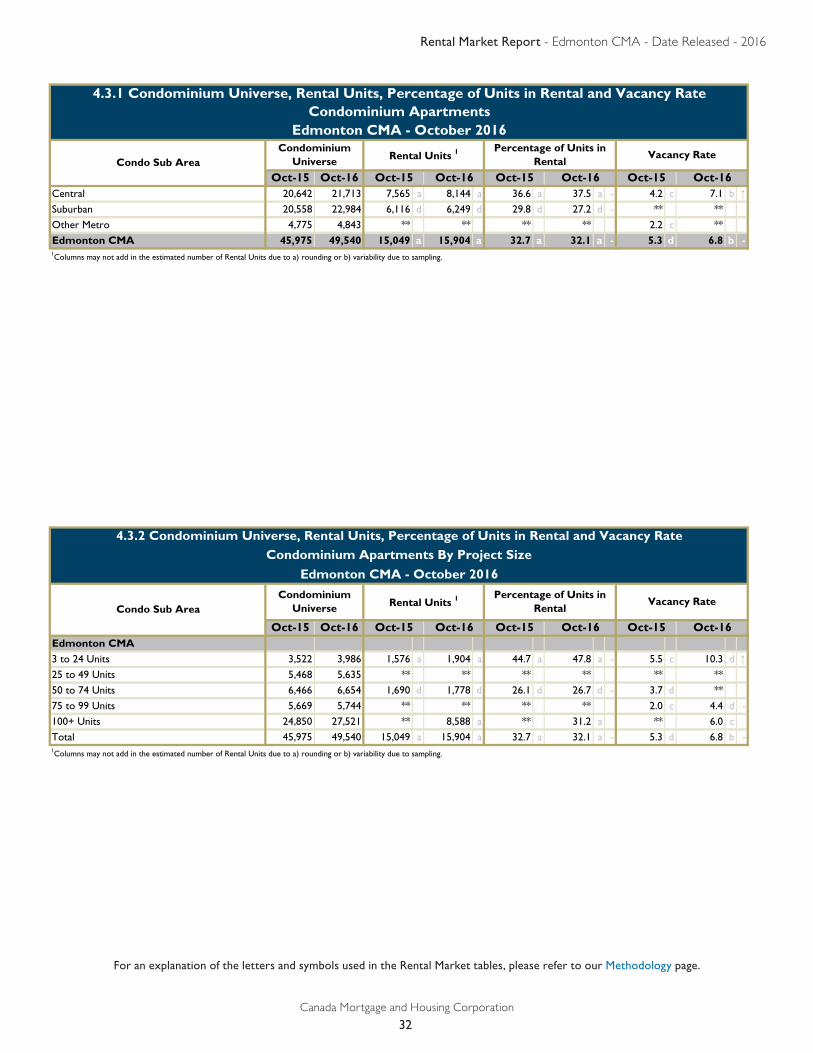
Oct-15 Oct-16Central 20,642 21,713 7,565 a 8,144 a 36.6 a 37.5 a - 4.2 c 7.1 b ↑Suburban 20,558 22,984 6,116 d 6,249 d 29.8 d 27.2 d - ** **
Other Metro 4,775 4,843 ** ** ** ** 2.2 c **
Edmonton CMA 45,975 49,540 15,049 a 15,904 a 32.7 a 32.1 a - 5.3 d 6.8 b -
4.3.1 Condominium Universe, Rental Units, Percentage of Units in Rental and Vacancy RateCondominium Apartments
Edmonton CMA - October 2016
Rental Units 1Percentage of Units in
RentalVacancy Rate
Condominium Universe
1Columns may not add in the estimated number of Rental Units due to a) rounding or b) variability due to sampling.
Oct-15 Oct-16Condo Sub Area
Oct-15 Oct-16 Oct-15 Oct-16
Oct-15 Oct-16Edmonton CMA3 to 24 Units 3,522 3,986 1,576 a 1,904 a 44.7 a 47.8 a - 5.5 c 10.3 d ↑25 to 49 Units 5,468 5,635 ** ** ** ** ** **
50 to 74 Units 6,466 6,654 1,690 d 1,778 d 26.1 d 26.7 d - 3.7 d **
75 to 99 Units 5,669 5,744 ** ** ** ** 2.0 c 4.4 d -
100+ Units 24,850 27,521 ** 8,588 a ** 31.2 a ** 6.0 c
Total 45,975 49,540 15,049 a 15,904 a 32.7 a 32.1 a - 5.3 d 6.8 b -
4.3.2 Condominium Universe, Rental Units, Percentage of Units in Rental and Vacancy RateCondominium Apartments By Project Size
Edmonton CMA - October 2016
Rental Units 1Percentage of Units in
RentalVacancy Rate
Condominium Universe
1Columns may not add in the estimated number of Rental Units due to a) rounding or b) variability due to sampling.
Oct-15 Oct-16
Condo Sub Area
Oct-15 Oct-16 Oct-15 Oct-16
Rental Market Report - Edmonton CMA - Date Released - 2016
Canada Mortgage and Housing Corporation
33
For an explanation of the letters and symbols used in the Rental Market tables, please refer to our Methodology page.
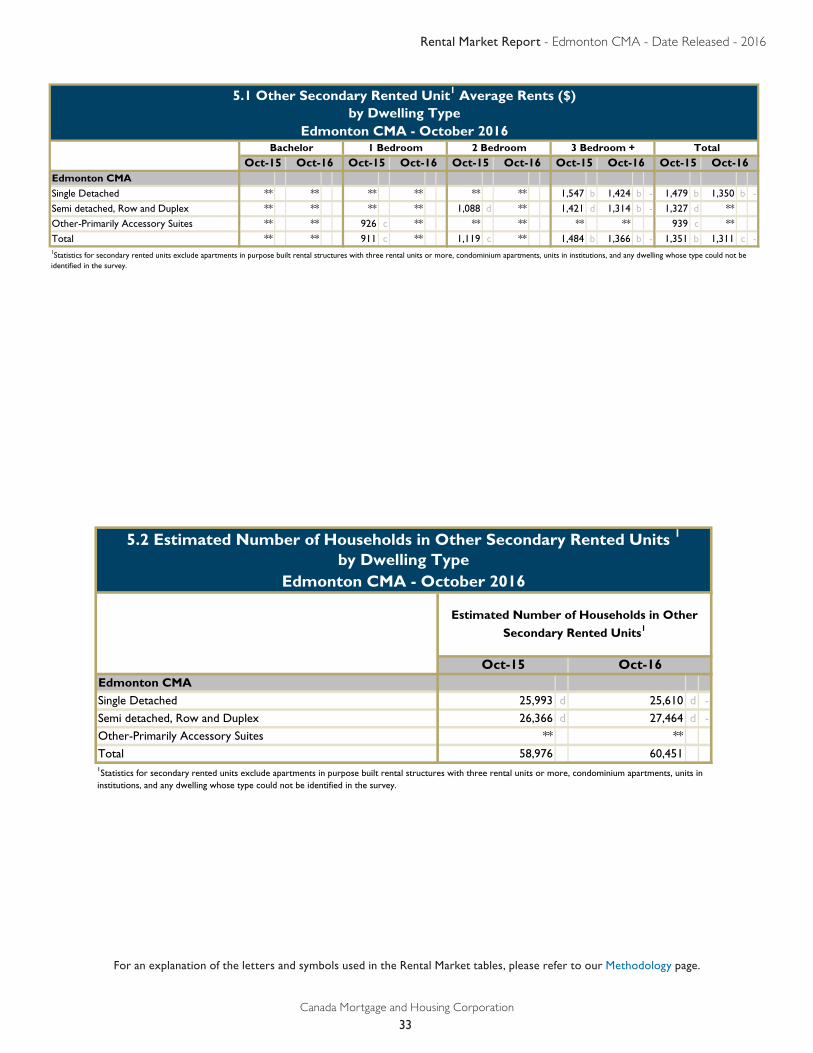
Edmonton CMASingle Detached ** ** ** ** ** ** 1,547 b 1,424 b - 1,479 b 1,350 b -
Semi detached, Row and Duplex ** ** ** ** 1,088 d ** 1,421 d 1,314 b - 1,327 d **
Other-Primarily Accessory Suites ** ** 926 c ** ** ** ** ** 939 c **
Total ** ** 911 c ** 1,119 c ** 1,484 b 1,366 b - 1,351 b 1,311 c -
Oct-15
5.1 Other Secondary Rented Unit1 Average Rents ($)by Dwelling Type
Edmonton CMA - October 2016Bachelor 1 Bedroom 2 Bedroom 3 Bedroom + Total
Oct-16
1Statistics for secondary rented units exclude apartments in purpose built rental structures with three rental units or more, condominium apartments, units in institutions, and any dwelling whose type could not be identified in the survey.
Oct-15 Oct-16 Oct-15 Oct-16Oct-15 Oct-16 Oct-15 Oct-16
Edmonton CMASingle Detached 25,993 d 25,610 d -
Semi detached, Row and Duplex 26,366 d 27,464 d -
Other-Primarily Accessory Suites ** **
Total 58,976 60,451 1Statistics for secondary rented units exclude apartments in purpose built rental structures with three rental units or more, condominium apartments, units in institutions, and any dwelling whose type could not be identified in the survey.
5.2 Estimated Number of Households in Other Secondary Rented Units 1
by Dwelling TypeEdmonton CMA - October 2016
Oct-15 Oct-16
Estimated Number of Households in Other
Secondary Rented Units1
Rental Market Report - Edmonton CMA - Date Released - 2016
Canada Mortgage and Housing Corporation
34
Technical note: Difference between Percentage Change of Average Rents (Existing and New Structures) AND Percentage Change of Average Rents from Fixed Sample (Existing Structures Only):
Percentage Change of Average Rents (New and Existing Structures): The increase/decrease obtained from the calculation of percentage change of average rents between two years (example: $500 in the previous year vs. $550 in current survey represents an increase of 10 percent) is impacted by changes in the composition of the rental universe (e.g. the inclusion of newly built luxury rental buildings in the survey, rental units renovated/upgraded or changing tenants could put upward pressure on average rents in comparison to the previous year) as well as by the rent level movement (e.g. increase/decrease in the level of rents that landlords charge their tenants).
Percentage Change of Average Rents from Fixed Sample (Existing Structures Only): This is a measure that estimates the rent level movement. The estimate is based on structures that were common to the survey sample for both the previous year and the current Rental Market Surveys. However, some composition effects still remain e.g. rental units renovated/upgraded or changing tenants because the survey does not collect data to such level of details.
Rental Market Report - Edmonton CMA - Date Released - 2016
Canada Mortgage and Housing Corporation
35
METHODOLOGY FOR RENTAL MARKET SURVEY Canada Mortgage and Housing Corporation (CMHC) conducts the Rental Market Survey (RMS) every year in October to estimate the relative strengths in the rental market. The survey is conducted on a sample basis in all urban areas with populations of 10,000 and more. The survey targets only privately initiated structures with at least three rental units, which have been on the market for at least three months. The survey collects market rent levels, availability, turnover and vacancy unit data for all sampled structures.
The survey is conducted by a combination of telephone interviews and site visits, and information is obtained from the owner, manager, or building superintendent. The survey is conducted during the first two weeks of October, and the results reflect market conditions at that time.
CMHC is constantly reviewing the Universe of rental structures in the rental market Universe to ensure that it is as complete as possible. Every year, any newly completed rental structures with at least 3 rental units are added to the Universe. In addition to this, CMHC undertakes comprehensive reviews by comparing the Universe listing to other sources of data to ensure that the list of structures is as complete as possible.
CMHC’s Rental Market Survey provides a snapshot of vacancy, availability, and turnover rates and average rents in both new and existing structures. There also exists a measure for the change in rent that is calculated based on existing structures only. The estimate is based on structures that were common to the survey sample for both the previous and the current Rental Market Surveys. The change in rent in existing structures is an estimate of the change in rent that the landlords charge and removes compositional effects on the rent level movement due to new buildings, conversions, and survey sample rotation. The estimate of percent change in rent is available in all Canada and Provincial Highlights publications, and also in the CMA reports. The rent levels in new and existing structures are also published. While the percent change in rents in existing structures published in the reports are statistically significant, changes in rents that one might calculate based on rent levels in new and existing structures may or may not be statistically significant.
METHODOLOGY FOR SECONDARY RENTAL MARKET SURVEYCanada Mortgage and Housing Corporation (CMHC) conducts a survey of the Secondary Rental Market (SRMS) in late summer and early fall to estimate the relative strengths in the secondary rental market which is defined as those dwellings not covered by the regular RMS – rented single-detached homes, semi-detached (double) homes, rented freehold row/townhomes, rented duplex apartments (i.e., one-above-other), rented accessory apartments (separate dwelling units that are located within the structure of another dwelling type), rented condominiums (can be any dwelling type but are primarily apartments), and one or two apartments which are part of a commercial or other type of structure.
The SRMS has two components which are conducted in selected CMAs:
• A Household Rent Survey of all households to collect information about rents in the following CMAs: Abbotsford-Mission, Barrie, Calgary, Edmonton, Halifax, Hamilton, Kelowna, Montréal, Ottawa, Québec, Regina, Saskatoon, St. Catharines-Niagara, St. John’s, Toronto, Vancouver, Victoria, Windsor and Winnipeg.
• A Condominium Apartment Survey to collect vacancy and rent information in the following CMAs: Calgary, Edmonton, Gatineau, Halifax, Hamilton, Kelowna, Kitchener-Cambridge-Waterloo, London, Montréal, Ottawa, Québec, Regina, Saskatoon, Toronto, Vancouver, Victoria and Winnipeg.
Both these surveys are conducted by telephone interviews. For the Condominium Apartment Survey, information is obtained from the property management company or condominium (strata) board, or building superintendent and can be supplemented by site visits if no telephone contact is made. For the Household Rent Survey, information is collected from an adult living in the household. Both surveys are conducted in late summer and early fall, and the results reflect market conditions at that time.
CMHC publishes the number of units rented and vacancy rates from the Condominium Apartment Survey. For the Household Rent Survey, the average rent is published. A letter code representing the statistical reliability (i.e., the coefficient of variation (CV)) for each estimate is provided to indicate the data reliability.
Every year CMHC reviews the method of estimation for Household Rent Survey, which may result in some changes to previously published estimates. All statistics in this report are reflective of the new method of estimation.
CMHC does not publish an estimate (e.g. Vacancy Rates and Average Rents) if the reliability of the estimate is too low or the confidentiality rules are violated. The ability to publish an estimate is generally determined by its statistical reliability, which is measured using the coefficient of variation (CV). CV of an estimate is defined as the ratio of the standard deviation to the estimate and CV is generally expressed a percentage. For example, let the average rent for one bedroom apartments in a given CMA be and its standard deviation be . Then the Coefficient of Variation is given by .
Please click Methodology or Data Reliability Tables Appendix link for more details.
Reliability Codes for Proportions
CMHC uses CV, sampling fraction and universe size to determine the ability to publish proportions such as vacancy rates, availability rates and turnover rates. The following letter codes are used to indicate the level of reliability of proportions: a – Excellent b – Very good c – Good d – Fair (Use with Caution) ** – Poor – Suppressed ++ – Change in rent is not statistically significant. This means that the change in rent is not statistically different than zero (0). - – No units exist in the universe for this category n/a – Not applicable
The following two tables indicate the level of reliability of proportions:
If the proportion is Zero (0) and sampling fraction is less than 100% then the following levels are assigned: Sampling Fraction (%) range
Structures in Universe (0,20]* (20,40] (40,60] (60,80] (80,100)
3 – 10 Poor Poor Poor Poor Poor
11 – 20 Poor Fair Fair Fair Good
21 – 40 Poor Fair Fair Good Very Good
41 – 80 Poor Fair Good Good Very Good
81+ Poor Good Good Very Good Very Good *(0, 20] means sampling fraction is greater than 0% but less than or equal to 20%; others are similar. Otherwise, the following table is used to determine the reliability level of proportions:
Coefficient of Variation (CV) %
Vacancy Rate 0 (0,5] (5,10] (10,16.5] (16.5,33.3] (33.3,50] 50+
(0,0.75] Excellent Excellent Excellent Excellent Excellent V. Good V. Good
(0.75,1.5] Excellent Excellent Excellent Excellent Excellent Fair Poor
(1.5,3] Excellent Excellent Excellent V. Good Good Poor Poor
(3,6] Excellent Excellent V. Good Good Fair Poor Poor
(6,10] Excellent Excellent V. Good Good Poor Poor Poor
(10,15] Excellent Excellent Good Fair Poor Poor Poor
(15,30] Excellent Excellent Fair Poor Poor Poor Poor
(30,100] Excellent Excellent Poor Poor Poor Poor Poor
RENTAL MARKET SURVEY (RMS) AND SECONDARY RENTAL MARKET SURVEY (SRMS) DATA RELIABILITY
Rental Market Report - Edmonton CMA - Date Released - 2016
Canada Mortgage and Housing Corporation
36
Rental Market Report - Edmonton CMA - Date Released - 2016
Canada Mortgage and Housing Corporation
37
Reliability Codes for Averages and Totals
CMHC uses the CV to determine the reliability level of the estimates of average rents and a CV cut-off of 10% for publication of totals and averages. It is felt that this level of reliability best balances the need for high quality data and not publishing unreliable data. CMHC assigns a level of reliability as follows (CV’s are given in percentages):
a – If the CV is greater than 0 and less than or equal to 2.5 then the level of reliability is Excellent. b – If the CV is greater than 2.5 and less than or equal to 5 then the level of reliability is Very Good. c – If the CV is greater than 5 and less than or equal to 7.5 then the level of reliability is Good. d – If the CV is greater than 7.5 and less than or equal to 10 then the level of reliability is Fair. ** – If the CV is greater than 10 then the level of reliability is Poor. (Do Not Publish)
Arrows indicate Statistically Significant Changes
Use caution when comparing statistics from one year to the next. Even if there is a year over year change, it is not necessarily a statistically significant change. When applicable, tables in this report include indicators to help interpret changes:
↑ indicates the year-over-year change is a statistically significant increase. ↓ indicates the year-over-year change is a statistically significant decrease. – indicates that the effective sample does not allow one to interpret any year-over-year change as being statistically significant. indicates that the change is statistically significant
DEFINITIONS Availability: A rental unit is considered available if the existing tenant has given, or has received, notice to move, and a new tenant has not signed a lease; or the unit is vacant (see definition of vacancy below).
Rent: The rent refers to the actual amount tenants pay for their unit. No adjustments are made for the inclusion or exclusion of amenities and services such as heat, hydro, parking, and hot water. For available and vacant units, the rent is the amount the owner is asking for the unit.
It should be noted that the average rents reported in this publication provide a sound indication of the amounts paid by unit size and geographical sector. Utilities such as heating, electricity and hot water may or may not be included in the rent.
Rental Apartment Structure: Any building containing three or more rental units, of which at least one unit is not ground oriented. Owner-occupied units are not included in the rental building unit count.
Rental Row (Townhouse) Structure: Any building containing three or more rental units, all of which are ground oriented with vertical divisions. Owner-occupied units are not included in the rental building unit count. These row units in some centres are commonly referred to as townhouses.
Vacancy: A unit is considered vacant if, at the time of the survey, it is physically unoccupied and available for immediate rental.
Turnover: A unit is counted as being turned over if it was occupied by a new tenant moved in during the past 12 months. A unit can be counted as being turned over more than once in a 12 month period.
Definitions of Census Areas referred to in this publication are as follows:
A census metropolitan area (CMA) or a census agglomeration (CA) is formed by one or more adjacent municipalities centred on a large urban area (known as the urban core). The census population count of the urban core is at least 10,000 to form a census agglomeration and at least 100,000 to form a census metropolitan area. To be included in the CMA or CA, other adjacent municipalities must have a high degree of integration with the central urban area, as measured by commuting flows derived from census place of work data. CMAs and CAs contain whole municipalities or Census Subdivisions.
Data presented is based on Statistics Canada’s 2011 Census area definitions.
Acknowledgement
The Rental Market Survey and the Secondary Rental Market Survey could not have been conducted without the cooperation of the rental property owners, managers, building superintendents and household members throughout Canada. CMHC acknowledges their hard work and assistance in providing timely and accurate information. As a result of their contribution CMHC is able to provide information that benefits the entire housing industry.
Rental Market Report - Edmonton CMA - Date Released - 2016
Canada Mortgage and Housing Corporation
38
CMHC—HOME TO CANADIANS
Canada Mortgage and Housing Corporation (CMHC) has been Canada's national housing agency for almost 70 years.
CMHC helps Canadians meet their housing needs. As Canada’s authority on housing, we contribute to the stability of the housing market and financial system, provide support for Canadians in housing need, and offer objective housing research and information to Canadian governments, consumers and the housing industry. Prudent risk management, strong corporate governance and transparency are cornerstones of our operations.
For more information, visit our website at www.cmhc.ca or follow us on Twitter, LinkedIn, Facebook and YouTube.
You can also reach us by phone at 1-800-668-2642 or by fax at 1-800-245-9274.
Outside Canada call 613-748-2003 or fax to 613-748-2016.
Canada Mortgage and Housing Corporation supports the Government of Canada policy on access to information for people with disabilities. If you wish to obtain this publication in alternative formats, call 1-800-668-2642.
The Market Analysis Centre’s (MAC) electronic suite of national standardized products is available for free on CMHC’s website. You can view, print, download or subscribe to future editions and get market information e-mailed automatically to you the same day it is released. It’s quick and convenient! Go to www.cmhc.ca/en/hoficlincl/homain
For more information on MAC and the wealth of housing market information available to you, visit us today at www.cmhc.ca/housingmarketinformation
To subscribe to printed editions of MAC publications, call 1-800-668-2642.
©2016 Canada Mortgage and Housing Corporation. All rights reserved. CMHC grants reasonable rights of use of this publication’s content solely for personal, corporate or public policy research, and educational purposes. This permission consists of the right to use the content for general reference purposes in written analyses and in the reporting of results, conclusions, and forecasts including the citation of limited amounts of supporting data extracted from this publication. Reasonable and limited rights of use are also permitted in commercial publications subject to the above criteria, and CMHC’s right to request that such use be discontinued for any reason.
Any use of the publication’s content must include the source of the information, including statistical data, acknowledged as follows:
Source: CMHC (or “Adapted from CMHC,” if appropriate), name of product, year and date of publication issue.
Other than as outlined above, the content of the publication cannot be reproduced or transmitted to any person or, if acquired by an organization, to users outside the organization. Placing the publication, in whole or part, on a website accessible to the public or on any website accessible to persons not directly employed by the organization is not permitted. To use the content of any CMHC Market Analysis publication for any purpose other than the general reference purposes set out above or to request permission to reproduce large portions of, or entire CMHC Market Analysis publications, please complete the CMHC Copyright request form and email it to CMHC’s Canadian Housing Information Centre at [email protected]. For permission, please provide CHIC with the following information: Publication’s name, year and date of issue.
Without limiting the generality of the foregoing, no portion of the content may be translated from English or French into any other language without the prior written permission of Canada Mortgage and Housing Corporation.
The information, analyses and opinions contained in this publication are based on various sources believed to be reliable, but their accuracy cannot be guaranteed. The information, analyses and opinions shall not be taken as representations for which Canada Mortgage and Housing Corporation or any of its employees shall incur responsibility.
CMHC’s Market Analysis Centre provides a wealth of local, regional, and national data, information, and analysis through its suite of reports, data tables, and interactive tools.
■■ Forecasts and Analysis – Future-oriented information about local, regional and national housing trends.
■■ Statistics and Data – Information on current housing market activities – starts, rents, vacancy rates and much more.
FREE REPORTS AVAILABLE ON-LINELocal, regional and national analysis and data pertaining to current market conditions and future-oriented trends.■■ Canadian Housing Statistics■■ Condominium Owners Report■■ Housing Information Monthly■■ Housing Market Assessment■■ Housing Market Insight■■ Housing Now Tables■■ Housing Market Outlook, Canada■■ Housing Market Outlook, Highlight Reports – Regional and Northern■■ Housing Market Outlook, Canada and Major Centres■■ Housing Market Tables: Selected South Central Ontario Centres■■ Preliminary Housing Starts Data■■ Rental Market Reports, Canada and Provincial Highlights ■■ Rental Market Reports, Major Centres■■ Residential Construction Digest, Prairie Centres■■ Seniors’ Housing Reports
FREE DATA TABLES AVAILABLE ON-LINE■■ Housing Construction Activity by Municipality■■ Comprehensive Rental Market Survey Tables■■ Comprehensive New Home Construction Tables
Housing Observer Online
Featuring quick reads and videos on...■■ Analysis and data■■ Timely insights■■ Updates to housing conditions and trends & much more!
All links can be shared in social media friendly formats!
Subscribe today to stay in the know!
www.cmhc.ca/observer
Housing Observer Online
HOUSING MARKET INFORMATION PORTAL!The housing data you want, the way you want it.■■ Information in one
central location■■ Quick and easy access■■ Neighbourhood level data
cmhc.ca/hmiportal
Get the market intelligence you need today!Click www.cmhc.ca/housingmarketinformation to view, download or subscribe.
Housing market intelligence you can count on
Recommended