1
Rent Control, Housing Price Constraints, and Economic Productivity: A Case Study in San
Francisco
Hanrin Cho
Department of Economics University of California, Berkeley
Undergraduate Honors Thesis
Advised by Professor Moretti, Department of Economics
Abstract: In an analysis of the municipal 1994 rent control law in San Francisco, we analyze the effect of limiting housing prices on worker productivity and nominal wages. We utilize American Community Survey data from 2000 to 2017, organized into microdata through IPUMS to analyze municipal housing units. We find that on average, 51% of all residential units are rented and 66% of all renter-occupied units are under some form of citywide rent control. Controlling for broader demographic characteristics including education level, race, gender, and household status, we find that there’s a 17.2% decline in the price of controlled units and a 6.62% decline in occupant nominal wage within rent-controlled units. We tentatively conclude, under the assumptions of the Rosen-Roback model, that there is a consistent correlation between rent-controlled prices and lower average nominal wage. *A special thank you to Professor Moretti, for both his advisorship and his previous research for valued insight.
2
Table of Contents:
1 Introduction
2 Data and Summary
3 Literature Review
4 Methodology
5 Model and Implications
6 References
3
INTRODUCTION Over recent decades, the Bay Area, and in particular, the city of San Francisco, has
experienced some of the strongest increases in labor productivity within the United States, and
with it, rapidly accelerated living costs within the area. Like many, large metropolitan areas with
significant industry growth, a high demand for housing, and a static housing supply, San
Francisco and neighboring cities have experienced rapidly accelerating housing demands and
sharp increases in both the costs of purchasing and renting housing within the area.
Subsequently, structuring housing policy in urban areas to increase the amount of affordable
housing has been a key focus of public policy1. Within the San Francisco city area and the
greater Bay Area, rent control is a highly popular policy proposal to combat accelerating rent and
living costs, with the primary objective being to limit displacement, largely for those who are
disenfranchised. Although the precise definition and enactment of rent control can vary
depending on the location, in essence, the policy of rent control first and foremost, limits the
magnitude of rent increases landlords are able to implement amongst existing tenants and limits
tenant eviction. Since existing households that hold a constant amount of income are particularly
vulnerable in the wake of rising housing demand, rent control and similar housing pricing
policies are proposed to limit the amount of dislocation amongst current residents.
Within the city of San Francisco, due to a municipal 1994 rent control law, The
Residential Rent Stabilization and Arbitration Ordinance, units located in multi-family buildings
built prior to 1979 are thus subject to rent control, which provides principal protections against
both evictions and rent raises. In such a scenario, rents are dictated and set from the date of first
occupancy, and can only be raised annually up to a predetermined amount. Within San Francisco
1 Moretti, Enrico. 2012. The New Geography of Jobs. Boston: Houghton Mifflin Harcourt.

4
specifically, a 2018 housing report by the San Francisco Planning Department found that 65% of
all city households rented their residence, which was significantly higher than the Bay Area
average of 45% of all households2. Amongst the 65% of the city’s renting population, 40%
resided in rent-controlled housing, 16% resided in non-rent controlled housing, and 9% of the
household was deed-restricted affordable housing. However, the precise number of rent-
controlled units appears to fluctuate amongst different bodies of research and according to
different sources. For instance, the San Francisco Rent Board reported that amongst rental units
under rent control or subsidy status, 71% of all city units were rent-controlled, 11% were market-
rate units, and 18% of the units are simply categorized as ‘other’. Subsequently, a significant
portion of the units appear to be subsidized or are of unknown status based on a single data
source.3 We discuss the implications of the fluctuations in data and how precisely to remedy the
discrepancies in results in Section III, in methodologies.
Within the broader Bay Area, the Costa-Hawkins Rental Housing Act, a California state
law enacted in 1995, places limits on municipal rent control ordinances, limiting the
effectiveness and enforcement of rent control laws. The Cost-Hawkins Act of 1995 limits local
government’s ability to apply rent control in three ways: (1) rent regulation can no longer be
applied to single-family homes, (2) housing built after 1995, or any earlier cut-off date already in
local rent ordinances is thus exempted from any local rent regulation, and (3) vacancy decontrol
becomes mandatory, meaning that rent controls no longer apply to vacant units and owners can
2 “San Francisco Housing Needs and Trends Report.” San Francisco Planning, San Francisco Planning Department, July 2018, San Francisco Housing Needs and Trends Report. 3 “San Francisco Rent Board Appendix,”, San Francisco Rent Board, 2018 https://sfrb.org/sites/default/files/FileCenter/Documents/1868-housing.pdf).

5
thus increase rents to market rate between tenancies.4 Thus, rent control in the state of California
is largely enacted by city governments, with one of the key exceptions being San Francisco’s
1994 rent control law, which despite existing state and federal limitations, has ultimately left the
majority of San Francisco’s housing stock under rent control and has left market-rate units
comprising a mere fraction of the existing units5. Currently, nine of California’s fourteen rent
control ordinances are located in Bay Area cities, and in total, current Bay Area rent regulations
cover 318,000 housing units, or a quarter of total rental units in the Bay Area6.
Unfortunately, a significant body of economic research on rent control as a means of
mitigating housing displacement in urban areas primarily highlights its negative consequences,
including publications that focus specifically on the Bay Area, and on the city of San Francisco,
even examining the aforementioned 1994 rent control law. A recent 2018 publication examining
the 1994 law change and subsequent variation in rent control assignment in San Francisco
concluded that while rent control prevented the displacement of a number of incumbent
residences, it ultimately drove up market prices in the long-run, rendering the intention of the
law moot. Due to the municipal law, landlords were ultimately driven by the dynamics of rent
control to remove 30% of the rent-controlled units in the study from the market, leading to a 15%
4 Cash, Anna, et al. “Proposition 10: Estimating the Scale of Expanded Rent Control in the Bay Area.” Urban Displacement, 25 Oct. 2018, https://www.urbandisplacement.org/sites/default/files/images/policybrief_rentcontrol_102518.pdf. 5 Diamond, Rebecca, Tim McQuade, and Franklin Qian. 2018. �Who Bene�fits from Rent Control? The Equilibrium Consequences of San Francisco's Rent Control Expansion.� Stanford University Mimeo. 6 Cash, Anna, et al. “Proposition 10: Estimating the Scale of Expanded Rent Control in the Bay Area.” Urban Displacement, 25 Oct. 2018, https://www.urbandisplacement.org/sites/default/files/images/policybrief_rentcontrol_102518.pdf.

6
citywide decrease in total rental units.7 Additional research on the impact of rent control
illustrates that limiting rent increases below market rates leads to spatial misallocation and
overconsumption of rent-controlled apartments8, maintenance neglect9, and negative spillovers
onto neighboring housing, and ultimately, devaluing the area10.
Whilst it appears the general consensus amongst economists regarding rent control is that
it 1) accelerates housing price increase in the long run by 2) decreasing incentives for increasing
housing supply, there is relatively little research on the impact of rent control on the worker
productivity and worker wages. Understandably, within regions that have growing industries and
high levels of economic productivity, an increase in economic productivity is normally followed
by a rise in housing demand, as laborers choose to optimize their housing residence by living
closely to their place of employment. Previous research centered on rent control demonstrates
that implementing such a policy limits the amount of displacement for certain demographics,
particularly for incumbent residents, for those residing on the lower spectrum of the city’s
income bracket, and for racial minorities11.
Though rent control limits housing supply in the long-run and generally constrains access
to living amenities who benefit, the net effect of rent control on the economic productivity of
7 Diamond, Rebecca, Tim McQuade, and Franklin Qian. 2018. �Who Bene�fits from Rent Control? The Equilibrium Consequences of San Francisco's Rent Control Expansion.� Stanford University Mimeo. 8 Gyourko, Joseph, and Peter Linneman. 1990. �Rent Controls and Rental Housing Quality: A Note on the E�ffects of New York City's Old Controls.� Journal of Urban Economics, 27(3): 398� 409. 9 Downs, Anthony. 1988. �Residential Rent Controls.� Washington, DC: Urban Land Institute. 10 Autor, David H, Christopher J Palmer, and Parag A Pathak. 2014. �Housing Market Spillovers: Evidence from the End of Rent Control in Cambridge, Massachusetts.� Journal of Political Economy, 122(3): 661�717. 11 Diamond, Rebecca, Tim McQuade, and Franklin Qian. 2018. �Who Bene�fits from Rent Control? The Equilibrium Consequences of San Francisco's Rent Control Expansion.� Stanford University Mimeo.

7
cities remains ambiguous. Alternative pieces of literature, particularly in increasing housing
supply for urban areas that experience high amounts of demand, conclude that constraints on
housing supply result in misallocation, given that it limits the number of workers who have
access to high productivity in cities12. Housing-constrained cities, namely cities that restrict
housing supply through zoning laws and building codes, ultimately face lower aggregate output
and welfare of workers. This also falls under a general consensus that increased housing density
in cities ultimately generates higher levels of productivity amongst workers, and thus raises
overall economic wages, by increasing access to the various amenities available within cities and
by minimizing commute time of laborers13.
Subsequently, within the following report, I seek to evaluate the effect of rent control on
labor productivity and worker nominal wage, utilizing the city of San Francisco as a case study.
Given that the enforcement of Costa-Hawkins leaves only the impact of the 1994 rent control
law, The Residential Rent Stabilization and Arbitration Ordinance to study, in a region that has
experienced rapid industry growth and intense demand for housing. Within examining the effect
of the law, we concentrate on the effect of rent control, the alterations in housing prices, and the
subsequent changes in worker productivity. Moreover, due to the Costa-Hawkins Act placing
limits on potential rent control laws, this provides a natural experiment for us to examine the sole
effect of the 1994 law in question. Thus, the following paper distinguishes itself on a number of
key factors from previous economic literature. Firstly, we focus on the city of San Francisco
12 Hsieh, Chang-Tai, and Enrico Moretti. 2019. "Housing Constraints and Spatial Misallocation." American Economic Journal: Macroeconomics, 11 (2): 1-39. 13 Kline, Patrick, and Enrico Moretti. 2014. “People, Places, and Public Policy: Some Simple Welfare Economics of Local Economic Development Programs.” Annual Review of Economics 6 (1): 629–62.

8
specifically, rather than analyzing a variety of urban areas, and utilize the 1994 municipal rent
control law to evaluate a different natural experiment, analyzing data at the municipal level.
Secondly, while other papers have utilized the impact of the 1994 rent control law to evaluate the
value of rent control protection and the effect of rent control on housing prices and supply, little
past literature analyzes its impact on the potential productivity of the city region. Past references
examine the changes in productivity within alternative housing laws, such as removing building
codes and zoning restrictions, but not the effect of rent control, rendering the following paper a
new contribution to economic literature on rent control laws.
Thus, the following paper is divided into the following sections: Section I describes the
data and summarizes the variables used in analysis; Section II discusses past literature and
history, including providing context on the history of rent control in San Francisco to explain
data and methodologies and other publications on rent control. Section III describes the
methodologies. Section IV presents the empirical results from the data. Section V presents the
Rosen-Roback model, its implications, and potential shortcomings. Ultimately, the paper seeks
to evaluate the potential effect of rent control in impacting nominal wage, and thus, limiting
economic productivity in the area.
SECTION I: DATA In order to analyze the effect of the 1994 rent control law, we utilize data from the
American Community Survey (ACS), organized in the format of the Integrated Public Use
Microdata Series (IPUMS). The IPUMS database collects and systematizes U.S. Census Bureau
data with enhanced documentation, particularly on information regarding local and municipal
data. Since we intend to analyze the intended effect of a citywide rent control law, we utilize
annually documented, city-specific data, organized and weighted by household. From the
IPUMS-USA database, we acquire current information regarding the size and composition of the

9
city’s housing inventory, including the year of construction, condition of the building, building
unit size and structure, alternative housing costs, as well as population demographic
characteristics and characteristics of both unit occupants and recent movers.
We initiate our analysis from the year 2000, since this is the earliest year in which the
present format of the American Community Survey data is available and the earliest year in
which the required municipal data is available to distinguish between rent-controlled and non
rent-controlled city-specific units for San Francisco. IPUMS data additionally includes
harmonized income and occupation variables. Since we seek to not only analyze the composition
of residents who live within rent-controlled units, but to evaluate the subsequent correlations
between worker wage, we also focus on occupant nominal wages, employment status, education
level, worker placement in an occupational prestige index depending on industry, and
socioeconomic status, among a number of additional variables, described in detail later.
Table 1.1: Ownership Summary
Variable: No of Obs.: Mean: Median: Std. Dev.: Min: Max: Skewness: Ownership: 94,786 1.466482 1 0.5590897 0 2 -0.414649
We provide context first by examining the status of city homeownership. In the above
table, out of a total of 94,786 city-specific observations, the value of 1 represents homes that are
owned or in the process of being purchased. The minimum value, 0, represents household units
in which the ownership status is certain, and the maximum value, 2, represents units that are
rented. Disregarding household units of unknown status, we can re-summarize the data, in which
the maximum value of 1 represents units which are purchased and the minimum value of 0
represents rented units.

10
Table 1.2: Ownership Summary - Adjusted Variable: No. of Obs.: Mean: Median: Std. Dev.: Min: Max: Skewness:
Ownership: 91,767 .4852725 0 0.4997858 0 1 0.0589356 Figure 1.1:
Thus, out of a total of 91,767 observations, approximately 48.5% are purchased units and
the remaining 51.5% are rented units. Since we seek to evaluate the impact of the rent control
law in contrast to the case scenario in which units are not rent-controlled, we focus our analysis
on only those occupying rented units, disregarding the characteristics of homeowners. The
following structure of our analysis is centered on the 47,235 rented units. Below, we include a
table of summary statistics regarding this city sub-population, which provides information on
occupant renters, including, the value of rent, the nominal worker wage, usual hours worked, sex,
age, education level, household occupational score, and household socioeconomic status.
To “score” occupational prestige and socioeconomic status, we utilize (1) a constructed
variable that assigns occupational prestige scores to each occupation and (2) the Hauser and
Warren Socioeconomic Index, a measure of occupational status on the basis of educational
attainment and earnings. We do this for a number of reasons, with the primary being that the
sector in which a person is employed is likely to impact predicted wages, but also because of the
47,235 44,532
91,767
010,00020,00030,00040,00050,00060,00070,00080,00090,000100,000
RentedUnits OwnedUnits Total
Rentedvs.ControlledUnits
*Averaged from2000-2017ACSdata,weighted

11
wide variety of industries to account for, the implications of their prestige and influence, and
their inherent link to a person’s previous socioeconomic status and educational level. Since both
indices are designed to be applicable to datasets with occupational data coded to the 1990 census
occupational scheme, we incorporate both within the American Community Survey extraction.
We also note the accounted household and person weight, in which each recorded
observation within the IPUMS sample is weighted by the frequency by which its values are
estimated to occur. Though a number of database samples remain unweighted, meaning that each
observation has an equal chance of occurring, but the variation for the metropolitan data for San
Francisco indicates that household observations hold unequal probabilities.
Table 1.3A: Summary Statistics Variable: No. of
Obs.: Mean: Median: Std. Dev.: Min: Max: Skewness:
Rent: 47,235 1555.625 1500 1011.701 0 3800 0.4945225
Log(rent) 45,932 7.176707 7.313221 0.7214405 1.386294 8.242756 -1.424642
Incwage: 47,235 138171.8 30000 292031.7 0 999999 2.508234
Log(incwage): 34,339 10.95684 10.91509 1.598014 3.401197 13.81551 -0.077995
Household weight:
47,235 113.7571 91 74.68675 14 1028 2.365088
Person weight: 47,235 123.769 97 84.94374 11 1180 2.424265
Sex (= 1 for male):
47,235 0.5010903 1 0.5000041 0 1 -0.004361
Age: 47,235 38.54692 35 19.57045 0 94 0.1809894
Usual hours worked:
47,235 26.88667 37 21.43706 0 99 -0.055497
Education: 47,235 7.436837 8 3.435726 0 11 -0.839196
Occupational score index:
47,235 22.3898 24 16.95557 0 80 0.1949544
Socioeconomic index:
47,235 30.72865 30.3 23.24446 0 80.53 0.0549516
12
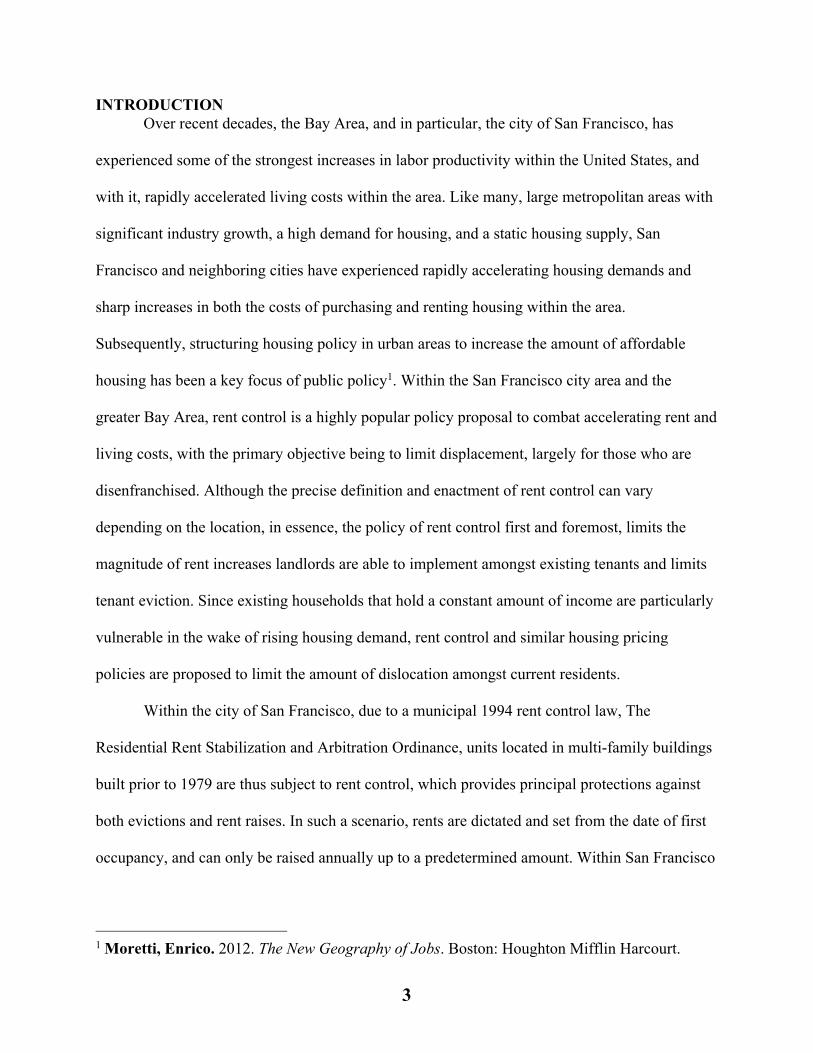
Table 1.3B: Summary Statistics – Race Variable: Obs.: Mean: Median: Std. Dev.: Min: Max: Skewness:
Race: white 47,235 0.5621255 1 0.4961307 0 1 -0.2504429
Race: black 47,235 0.059511 0 0.236581 0 1 3.723829
Race: Asian 47,235 0.2720864 0 0.4450388 0 1 1.024252
Race: Native 47,235 0.0048693 0 0.0696108 0 1 14.22584
Race: other 47,235 0.0557002 0 0.2293443 0 1 3.874563
Race: mixed 47,235 0.0457076 0 0.2088525 0 1 4.350412
Table 1.3C: Summary Statistics – Household Structure
Variable: Obs.: Mean: Median: Std. Dev.: Min: Max: Skewness:
Married, spouse present: 47,235 0.2664126 0 0.4420872 0 1 1.056759
Married, spouse absent: 47,235 0.0227797 0 0.1492021 0 1 6.397031
Separated: 47,235 0.1335027 0 0.3401208 0 1 2.155123
Never married: 47,235 0.577305 1 0.493993 0 1 -0.312983
Figure 1.2: Race
White56%
Black6%
Asian27%
Native0.5%
Other6%
Mixed5%
City Race Distribution
White Black Asian Native Other Mixed
*Averaged from 2000-2017ACS data, weighted
Total of 47,235 obs.

13
Figure 1.3: Household Structure
Figure 1.4: Sex
We include the above variables summarized later on in our analysis; we also separately
account for the divisions of race, household status, and sex. It appears that the majority of the
surveyed sample size, comprising of San Francisco renting occupants, are generally speaking,
white, with unmarried or single households, and have at least some college education. There is
little to no gender bias within sample selection.
Married, spouse present
27%
Married, spouse absent
2%
Separated13%
Never58%
Division of City Household Status
Married, spouse present Married, spouse absent Separated Never
Total of 47,235 obs.
12,608
1,0786,318
27,321
Male50.1%
Female49.9%
Division by Sex:
Male Female
23,565 23,669
*Averaged from 2000-2017ACS data, weighted
Total of 47,235 obs.

14
SECTION 2: PAST LITERATURE AND HISTORY Section 2.A: Rent Control in San Francisco For the majority of U.S. history, local economic booms were followed by booms in
housing construction, in which within the 1960s, construction was only subject to light
regulation in nearly all major American cities, though this altered between the 1960s and the
1990s - particularly amongst regions which experienced strong economic growth. Higher
economic productivity in the San Francisco Bay Area, in conjunction with its extensive
restrictions on housing construction and land use, now results in higher housing prices, rather
than more homes and more workers. To provide context regarding the 1994 municipal law, we
examine the precise history and legal restrictions San Francisco’s rent control established. Rent
control in San Francisco began the year of 1979, when the city’s first rent control was signed
after intense pressure to rent control rose due to strong housing demand in San Francisco. A
recently passed Proposition 13, which capped nominal rent increases to 7% and covered all
rental units built prior to June 13th, 1979, held one key exemption: owner-occupied buildings
containing 4 units or less. Small multi-family structures made up about 44% of the rental housing
stock in 1990, substantiating a large exemption to the rent control law. Hence, in 1979, the city
of San Francisco imposed rent control all standing buildings with five or more apartments,
categorized in the American Housing Survey as units. Though all large buildings built as of 1979
would be rent-controlled, new construction would be exempt from rent control in order to
continue new development and construction.
Subsequently, the 1979 rent control law placed rent control restrictions on large
buildings, while all buildings built in 1980 and afterwards would be exempt from the law. In
addition, smaller multi-family units were exempt from rent control, being viewed as lacking
market power over rents. in a 1994 San Francisco ballot initiative, the 1979 rent control law
15
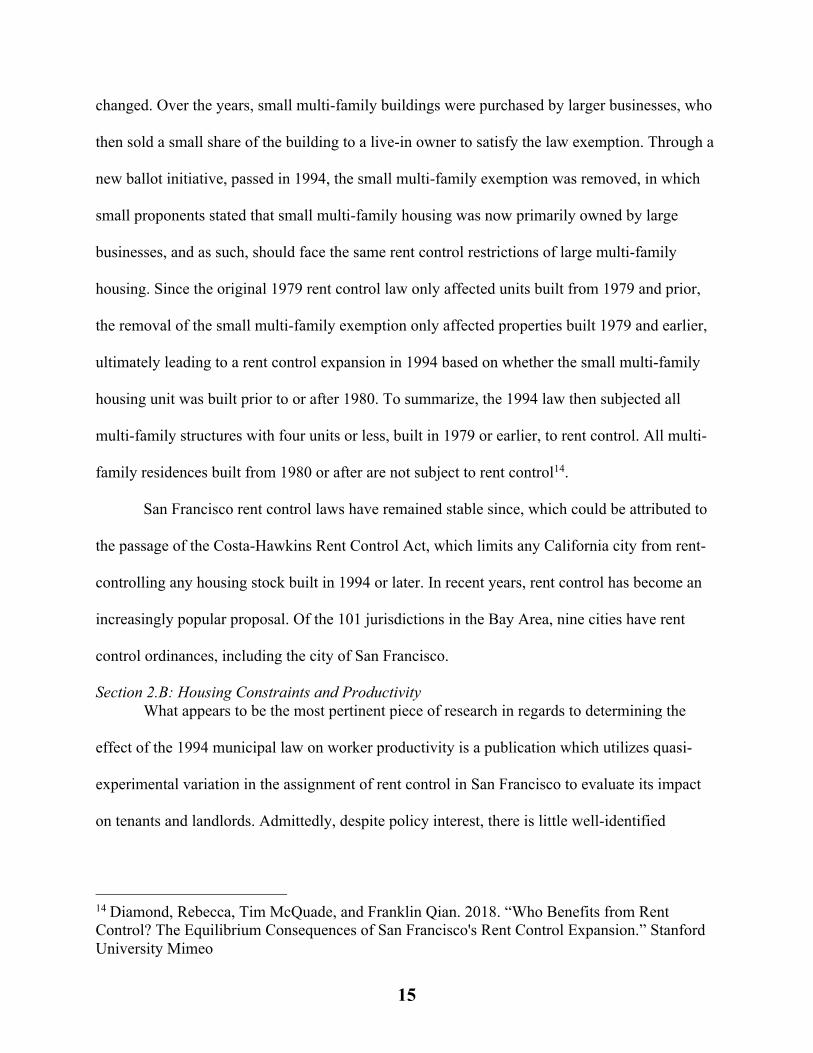
changed. Over the years, small multi-family buildings were purchased by larger businesses, who
then sold a small share of the building to a live-in owner to satisfy the law exemption. Through a
new ballot initiative, passed in 1994, the small multi-family exemption was removed, in which
small proponents stated that small multi-family housing was now primarily owned by large
businesses, and as such, should face the same rent control restrictions of large multi-family
housing. Since the original 1979 rent control law only affected units built from 1979 and prior,
the removal of the small multi-family exemption only affected properties built 1979 and earlier,
ultimately leading to a rent control expansion in 1994 based on whether the small multi-family
housing unit was built prior to or after 1980. To summarize, the 1994 law then subjected all
multi-family structures with four units or less, built in 1979 or earlier, to rent control. All multi-
family residences built from 1980 or after are not subject to rent control14.
San Francisco rent control laws have remained stable since, which could be attributed to
the passage of the Costa-Hawkins Rent Control Act, which limits any California city from rent-
controlling any housing stock built in 1994 or later. In recent years, rent control has become an
increasingly popular proposal. Of the 101 jurisdictions in the Bay Area, nine cities have rent
control ordinances, including the city of San Francisco.
Section 2.B: Housing Constraints and Productivity What appears to be the most pertinent piece of research in regards to determining the
effect of the 1994 municipal law on worker productivity is a publication which utilizes quasi-
experimental variation in the assignment of rent control in San Francisco to evaluate its impact
on tenants and landlords. Admittedly, despite policy interest, there is little well-identified
14 Diamond, Rebecca, Tim McQuade, and Franklin Qian. 2018. “Who Benefits from Rent Control? The Equilibrium Consequences of San Francisco's Rent Control Expansion.” Stanford University Mimeo

16
evidence demonstrating how precisely local rent controls affect tenants, landlords, and the
broader housing market. Diamond et. al utilizes the unexpected 1994 law change, which
ultimately rent-controlled a subsector of city buildings and their tenants, ultimately finding that
with new data tracking individual migration, that the rent control law limited renter mobility by
20% and lowered displacement from San Francisco. The study found that between five to ten
years after the law change, that the beneficiaries of rent control are on average, 3.5 percentage
points more likely to remain at their 1994 address relative to the control group. Given that only
18% of the control group remained at their 1994 address, the rent control in effect correlated
with a 19.4 percent increase in not moving. Admittedly, the majority of the renters residing at
their rent-controlled residence would not have continued living there if it were not for the rent
control law. However, the landlords did not react to the law change passively, but rather chose to
convert the existing buildings into alternative forms of real estate. In particular, large buildings
subject to rent control laws were then converted to condos and redeveloping buildings. Thus, in
the long-run, landlords substituting owner-occupied and newly constructed rental supply both
lowered the supply of affordable housing available, raised the average rent of a unit in the city,
and accelerated the gentrification of San Francisco. Subsequently, while rent control benefited a
number of incumbent renters in the short run, the long-run loss of housing supply rose up market
rents in the long run.
There is a wealth of literature that describes the economic impact of rent control, and
more precisely, limiting rent increases below market rates, including over-consumption of
housing by tenants of rent-controlled apartments, misallocation of heterogeneous housing to
heterogeneous tenants, negative spillovers onto neighboring housing, and neglect of
maintenance. A substantial body of economic research has warned about potential negative
17
efficiency consequences of limiting rent increases below market rates, including over-
consumption15 of housing by tenants of rent-controlled apartments16, misallocation of
heterogeneous housing to heterogeneous tenants17 18 19 20, negative spillovers onto neighboring
housing21 22 and neglect of required maintenance23. Yet, in an empirical model of joint decisions
of where to live and where to work, Kim et. al found that wages are higher in metropolitan
markets, but that housing prices are also higher in urban areas, and when equal wage growth
across labor markets occurs, there is a shift in the relative population from less populated to
urban areas24.
Misallocation arises because the constraints on housing supply in the most productive US
cities effectively limit the number of workers who have access to such high productivity. Instead
of increasing local employment, productivity growth in housing-constrained cities primarily
15 Olsen, Edgar O. 1972. “An Econometric Analysis of Rent Control.” Journal of Political Economy, 80(6): 1081-1100. 16 Gyourko, Joseph, and Peter Linneman. 1989. “Equity and Efficiency Aspects of Rent Control: An Empirical Study of New York City.” Journal of Urban Economics, 26(1): 54-74. 17 Suen, Wing. 1989. “Rationing and rent dissipation in the presence of heterogeneous individuals.” Journal of Political Economy, 97(6): 1384-1394. 18 Glaeser, Edward L, and Erzo FP Luttmer. 2003. “The Misallocation of Housing under Rent Control.” The American Economic Review, 93(4): 1027-1046. 19 Sims, David P. 2007. “Out of Control: What Can We Learn from the End of Massachusetts Rent Control?” Journal of Urban Economics, 61(1): 129-151. 20 Bulow, Jeremy, and Paul Klemperer. 2012. “Regulated prices, rent seeking, and consumer surplus.” Journal of Political Economy, 120(1): 160-186. 21 Sims, David P. 2007. “Out of Control: What Can We Learn from the End of Massachusetts Rent Control?” Journal of Urban Economics, 61(1): 129-151. 22 Autor, David H, Christopher J Palmer, and Parag A Pathak. 2014. “Housing Market Spillovers: Evidence from the End of Rent Control in Cambridge, Massachusetts.” Journal of Political Economy, 122(3): 661-717. 23 Downs, Anthony. 1988. “Residential Rent Controls.” Washington, DC: Urban Land Institute. 24 Kim S. So, Peter F. Orazem, Daniel M. Otto.“The Effects of Housing Prices, Wages, and Commuting Time on Joint Residential and Job Location Choices.” American Journal of Agricultural Economics, Volume 83, Issue 4, November 2001, Pages 1036–1048, https://doi.org/10.1111/0002-9092.00228

18
pushes up housing prices and nominal wages. The resulting misallocation of workers lowers
aggregate output and welfare of workers in all US cities. In a related paper, Hsieh and Moretti
analyzed the aggregate productivity costs of housing constraints through the prism of a Rosen-
Roback model, in which aggregate output and welfare growth are affected by local shocks within
cities. Subsequently, aggregate output and welfare growth depend on a weighted average of
productivity shocks in each city and the efficiency of the allocation of workers across cities, the
latter of which heavily depends on the elasticity of housing supply in high productivity cities. In
the scenario that a city has a significant housing supply and simultaneously experiences
productivity growth, local employment increases and workers in other cities benefit from
reallocation of jobs. Alternatively, if a city has a restrictive housing supply, then the reallocation
of jobs is limited, and thus productivity growth in the city is limited due to the higher price of
housing. We find that the increased spatial misallocation of labor due to housing supply
constraints in cities with high productivity growth rates lowered aggregate growth between 1964
and 2009 by a significant amount. By calculated an increase in housing supply in New York, San
Jose, and San Francisco by relaxing land use restrictions to the level of the median US. city, the
U.S. growth rate of aggregate output would increase by 36.3%. In the following scenario, U.S.
GDP in 2008 would 3.7 percent higher, translating into an additional $3,685 in average annual
earnings. Within the framework of the Rosen-Roback model, the aggregate benefit of growth in
New York and the Bay Area was offset by increased misallocation of labor due to inelastic
supply of housing25. More precisely, the annual earnings and subsequently, the average nominal
25 Hsieh, Chang-Tai, and Enrico Moretti. 2019. "Housing Constraints and Spatial Misallocation." American Economic Journal: Macroeconomics, 11 (2): 1-39.

19
wage of the city, would decline in relation to a less elastic housing supply, which is due to
housing constraints.
Thus, within the same framework, despite the absence of literature on the precise effect
of rent control, the alteration on changing housing prices, previous literature implies that rent
control while reducing housing prices below the market-rate price, high housing prices are
correlated with higher wages, though the framework of causality may be in question. Within a
hedonic model, the spatial equilibrium assumption holds the possibility that housing prices can
be used to accurately assess people’s willingness to pay for location specific amenities. In an
agglomeration model, the spatial equilibrium framework iterates that high housing prices,
objectively bad things, are offset by good things in a location, such as high wages. High wages
may also be a locational attribute, that attract workers - and thus, high wage regions are assumed
to be areas that are more economically productive. Whether it is the higher wages of individuals
supplying an increase in housing demand that results in overall high housing prices, or the value
of certain amenities and the demand of location that causes a spike in demand, there appears to
be a correlation between high housing prices and high wages.
SECTION III: METHODOLOGY
To evaluate the effect of the 1994 rent control policy, we first distinguish between rent-
controlled and market-rate units. Under the 1994 law, which additionally encompasses the
original 1979 rent control law in San Francisco, we therefore classify rent-controlled units as
units built prior to 1980, which are also not single-family homes or condominiums where the
respondent moved in or after January 1, 1996. The latter statement, regarding single-family
homes and condominiums, is a key addition largely because owners of large rental units were
converting large buildings to smaller multi-family units in order to become exempt from rent
20
control. In contrast, market-rate units are city units constructed in the year 1980 or afterwards,
which demonstrate no government housing subsidy and are separate from public housing and
include all single-family homes and condominiums where the respondent moved in January 1,
1996, or later.
Subsequently, the primary variable of interest, representing whether a household is under
rent control or not, is dictated by 1) the decade in which the building is constructed, specifically
before or after 1980, 2) the structure of the building – and whether it is a single family home or
condominium or not, 3) the move-in date of the occupants, 4) the number of units in the building
structure, and 5) exclusion from public housing and government subsidy, in which we have
already disregarded all housing units that have been purchased. All remaining units that did not
fit into the labels of rent-controlled or market-rate were classified as other and excluded from
analysis, as noted prior in the summary statistics. This leaves us with a sample size of
approximately 47, 235 for which we can construct a treatment variable of rent control for.
Understandably, the ‘other’ has a statistically significant impact on the results, though to
justify the exclusion, upon comparison of our data results to recent studies on rent control from
numerous sources, including the San Francisco Housing Data Hub, the San Francisco Rent
Board, the San Francisco Planning Commission, all of which had a distinct category of ‘other in
contrast to market-rate and rent-controlled units. Thus, we see such an exclusion both as a
precedent established in previous forms of analysis and add, as a result, the analysis here should
primarily be considered a comparative analysis of the two types of units, market-rate and rent-
controlled, which comprise the outstanding majority of San Francisco households. This is largely
due to the limited amount of construction in recent years, leaving the majority of building units
constructed prior to 1980.

21
Table 3.1: Decade of Construction:
Variable: No of Obs.: Mean: Median: Std. Dev.: Min: Max: Skewness:
Before 1980: 47,235 0.8461734 1 0.3607863 0 1 -1.919015
1980's: 47,235 0.0532232 0 0.2244807 0 1 3.980578
1990's: 47,235 0.0465333 0 0.2106392 0 1 4.30567
2000's: 47,235 0.0470202 0 0.2116844 0 1 4.279812
After 2010: 47,235 0.0070499 0 0.0836678 0 1 11.78363
The overwhelming majority of city units were built prior to 1980, with an estimated
84.6% of occupant renters residing in such buildings. San Francisco belongs to a number of
cities in which rent-controlled units form the majority of rented housing, likely due to the low
levels of new housing construction. Less than one percent of all sample units were constructed
within the past decade. It also explains the relatively static nature of city rent-controlled units,
especially in comparison to other urban regions: with little new construction and few legislative
changes, rent-controlled buildings substantiate the better part of metropolitan housing.
Figure 3.1: Decade of Construction:
Before 1980:84%
1980's:5%
1990's:5%
Before 2010:5%
After 2010:1%
Construction date of citywide buildings:
Before 1980: 1980's: 1990's: Before 2010: After 2010:
Total of 47,235 obs.

22
Table 3.2: Description of rent control dummy Variable: No. of Obs.: Mean: Median: Std. Dev.: Min: Max: Skewness:
Rent control: 47,235 0.6643802 1 0.4722117 0 1 -0.6962215
Following applying previously listed restrictions in rent control regarding building unit
size, construction date, move-in date, and the absence of government subsidy, rent-controlled
units appear to substantiate approximately 66.4% of all citywide rent units, or make up
approximately 31,400 units, while only 33.6% of all renting occupants reside in market-rate
housing. Given that this outcome falls within the estimated range of already published research
on the number of rent-controlled units, the outcome of the dummy variable appears reasonable.
We find the average of the percentage of rent-controlled units by applying listed household and
person weights to the data and by taking the average of the rent control dummy variable over
time. Though there is an initial negative correlation between the years passed and the average
value of city units under rent control, with the addition of other key demographic variables,
particularly rent, estimated worker wage, and race, there is no statistically significant change
found in the value of the rent control variable over time.
Table 3.3: Regression of rent control over time No. obs. 47, 235 47, 235
Rent control: -0.2975592*** [.0365607]
-0.0486249 [0.0359738]
Rent:
0.0011109*** [0.0000191]
Incwage:
-1.11e-08 [5.77e-08]
Race: white
-0.4362465* [0.2397534]
Race: black
-0.2041007 [0.2480734]
Race: Asian
0.0771728 [0.2405699]
Race: other
0.7723133*** [0.2486919]
Race: mixed
0.4684593* [0.2510817]
Constant: 2011.429*** [0.0298005]
2009.685*** [0.2409219]
Note: *** = p < 0.01, ** = p < 0.05, * = p < 0.1
23
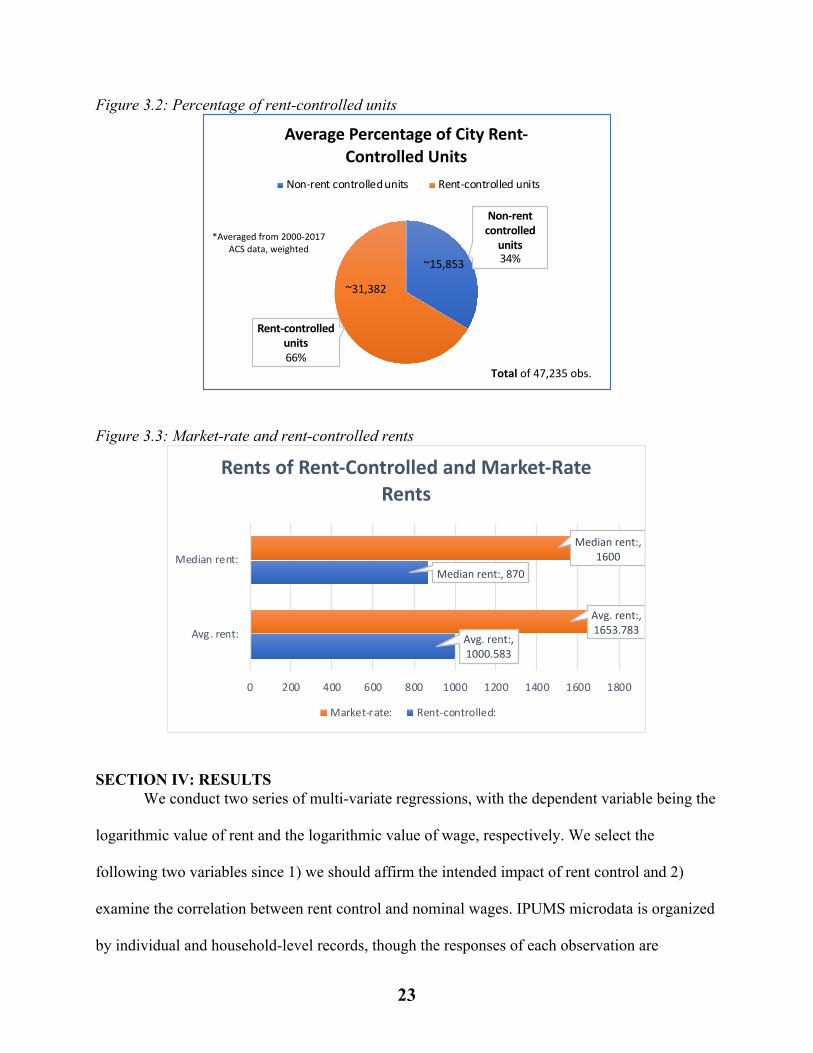
Figure 3.2: Percentage of rent-controlled units
Figure 3.3: Market-rate and rent-controlled rents
SECTION IV: RESULTS
We conduct two series of multi-variate regressions, with the dependent variable being the
logarithmic value of rent and the logarithmic value of wage, respectively. We select the
following two variables since 1) we should affirm the intended impact of rent control and 2)
examine the correlation between rent control and nominal wages. IPUMS microdata is organized
by individual and household-level records, though the responses of each observation are
Non-rent controlled
units34%
Rent-controlled units66%
Average Percentage of City Rent-Controlled Units
Non-rent controlled units Rent-controlled units
*Averaged from 2000-2017
ACS data, weighted
~31,382
~15,853
Total of 47,235 obs.
Avg. rent:, 1000.583
Median rent:, 870
Avg. rent:, 1653.783
Median rent:, 1600
0 200 400 600 800 1000 1200 1400 1600 1800
Avg. rent:
Median rent:
Rents of Rent-Controlled and Market-Rate Rents
Market-rate: Rent-controlled:
24
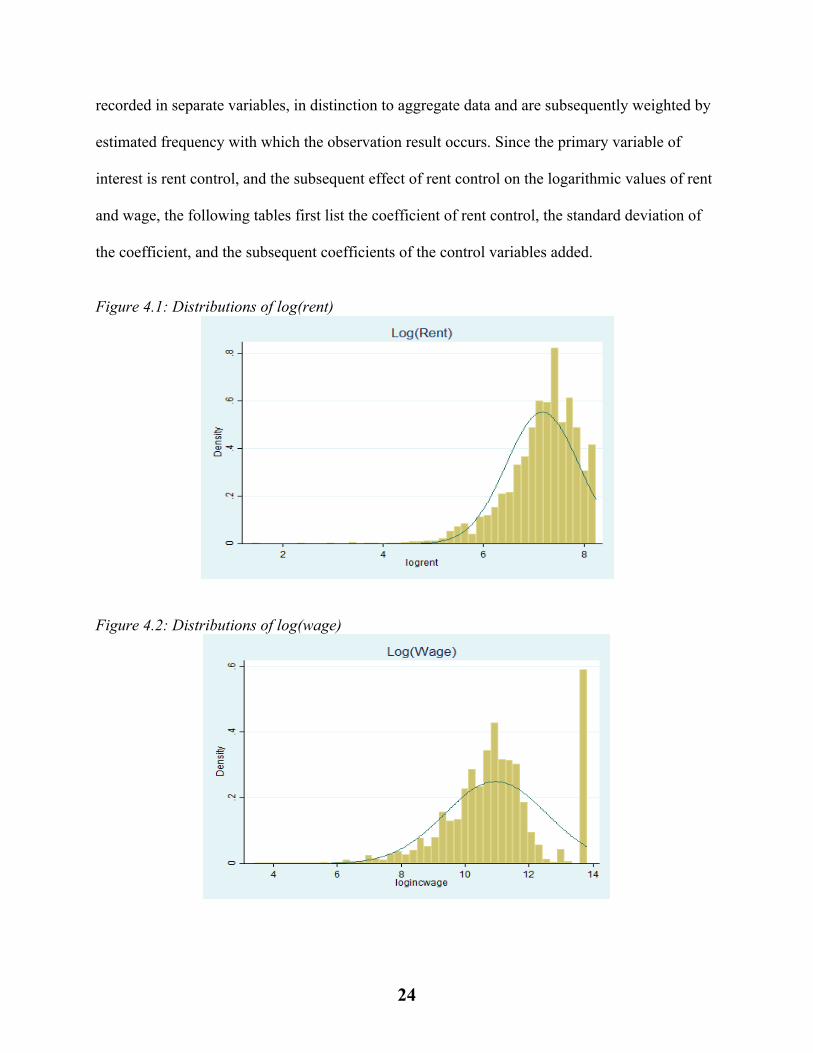
recorded in separate variables, in distinction to aggregate data and are subsequently weighted by
estimated frequency with which the observation result occurs. Since the primary variable of
interest is rent control, and the subsequent effect of rent control on the logarithmic values of rent
and wage, the following tables first list the coefficient of rent control, the standard deviation of
the coefficient, and the subsequent coefficients of the control variables added.
Figure 4.1: Distributions of log(rent)
Figure 4.2: Distributions of log(wage)

25
Table 4.1: Regression on log(rent) No. obs. 45,932 45,932 45,932 45,932 45,932 45,932 45,932
Rent control: -0.09571*** [0.0071513]
-0.16413*** [0.006833]
-0.13484*** [0.0064353]
-0.1346803*** [0.0064335]
-0.16585*** [0.0062727]
-0.1710267*** [0.0062027]
-0.1724176*** [0.0061952]
Education:
0.068368*** [0.0009354]
0.078244*** [0.0008886]
0.0781789 [0.0008884]
0.066907*** [0.0009056]
0.0435389*** [0.0011443]
0.0389987*** [0.0012103]
Age:
-0.01211*** [0.0001559]
-0.0120895 [0.0001559]
-0.01135*** [0.0001531]
-0.0104376*** [0.0001539]
-0.0102428*** [0.0001546]
Sex:
0.0313874 [0.0059794]
0.018111*** [0.0058083]
0.0020198*** [0.0057626]
0.0037894 [0.0057566]
Race: white
0.408221*** [0.0418047]
0.4060025*** [0.0413245]
0.4014133*** [0.0412688]
Race: black
-0.23555*** [0.0432293]
-0.2079153*** [0.042741]
-0.2076536*** [0.0426813]
Race: Asian
0.203408*** [0.0419591]
0.2078263*** [0.0414773]
0.2052233*** [0.04142]
Race: other
0.260147*** [0.0433365]
0.2637759*** [0.0428388]
0.2644363*** [0.042779]
Race: mixed
0.260147*** [0.0437514]
0.3237874*** [0.0432495]
0.3199952*** [0.0431903]
Occupation index:
0.0073662***
[0.0002247] 0.0035775***
[0.0004014]
Socioeconomic index
0.0035457***
[0.0003115] Constant: 7.240938***
[0.0058585] 6.776744***
[0.0084313] 7.148148***
[0.0092574] 7.132109***
[0.0097461] 6.914599***
[0.0424219] 6.897492***
[0.0419378] 6.903047***
[0.0418821]
Note: *** = p < 0.01, ** = p < 0.05, * = p < 0.1 In Table 4.1, in running regressions on the logarithmic value of rent, we utilize years of
education, sex, race, occupational index score, and socioeconomic index score as control
variables to evaluate the changes due to rent control with a total of 45,932 observations. The
initial regression of the treatment variable of rent control onto the logarithmic value of rent, with
no added control variables, results in a negative coefficient of -0.0957076, statistically
significant at the p-value of 0.01, meaning that rent-controlled municipal units are correlated
with a decrease in the value of rent by 9.57%. With each added control variable, Table 4.1
demonstrates an additional decrease in the coefficient value for rent control, meaning that with
the more variables controlled for in the multivariate regression, the more significantly the
treatment effect of rent control appears to affect the logarithmic value of rent. The full
regression, accounting for all aforementioned control variables, lists a negative coefficient of -
0.1724176, or that rent-controlled units are correlated with a decrease in the value of rent by
17.2%, in which all coefficients, both for the treatment and control variables, are statistically
significant at a p-value of 0.01. This implies a significant correlation between rent-controlled

26
units and lowered values of rent within the city of San Francisco and affirms the purpose of the
1994 law in question.
Table 4.2: Regression on log(wage) No. obs. 34,339 34,339 34,339 34,339 34,339 34,339
Rent control: -0.205039*** [0.0183073]
-0.20189*** [0.0182708]
-0.221282*** [0.0184011]
-0.233015*** [0.0180952]
-0.13817*** [0.0176095]
-0.0662422*** [0.0170468]
Sex:
0.20736*** [0.017194]
0.2018252*** [0.0171817]
0.192395*** [0.016918]
0.248651*** [0.0164035]
0.1745734*** [0.0158916]
Race: white
0.4920404*** [0.1252133]
0.474468*** [0.1230683]
0.643496*** [0.1190801]
0.8529357*** [0.1149478]
Race: black
0.4806796*** [0.1305128]
0.4363074 [0.128267]
0.381974*** [0.1240626]
0.4268203*** [0.1196831]
Race: Asian
0.3212656** [0.1259174]
0.3626314 [0.1237992]
0.395820*** [0.1197383]
0.4744651*** [0.1155187]
Race: other
0.3789212*** [0.1296882]
0.3718361 [0.1274666]
0.339309*** [0.1232852]
0.2523904** [0.1189423]
Race: mixed
0.8707326*** [0.1304031]
0.7717198 [0.1281933]
0.717885*** [0.1239912]
0.8251388*** [0.1196297]
Married, spouse
present:
0.1226076 [0.0330561]
0.158179*** [0.0319796]
0.1793507*** [0.0308527]
Married, spouse absent:
-0.1846679
[0.0647983] -0.17196***
[0.0626723] -0.2143551***
[0.060464]
Never married:
0.6836382 [0.0300757]
0.512815*** [0.0292996]
0.5282629*** [0.0282661]
Usual hours worked:
-0.02328***
[0.0004783] -0.0022763***
[0.0006206] Education:
-0.1630573***
[0.0032219] Constant: 11.09423***
[0.0149858] 10.98451***
[0.0175044] 10.53985***
[0.125539] 10.09418***
[0.1257629] 10.80989***
[0.1225208] 11.16383***
[0.1183992] Note: *** = p < 0.01, ** = p < 0.05, * = p < 0.1
In the above table, Table 4.2, we run multivariate regressions on the logarithmic value of
nominal wage, evaluating the effect of the treatment variable, rent control, and utilizing sex,
race, household status – such as married or never married, usual hours worked by individual, and
years of education as control variables to evaluate the impact from a database comprised of
34,339 observations. In the initial regression, in which we solely evaluate the effect of rent
control on the logarithmic value of wage, the initial coefficient is -0.205039, or that rent-
controlled units on average hold a lower nominal wage by 20.5% in comparison to non rent-
controlled units, statistically significant at a p-value of 0.01. Interestingly enough, with each
control variable added, the coefficient of the rent control variable remains negative, but

27
decreases in weight. The final regression, incorporating all of the aforementioned control
variables, states the coefficient value for rent control is -0.0662422, or that while accounting for
sex, race, household status, usual hours worked, and years of education, the estimated effect of
rent control upon nominal wage is a decrease of approximately 6.62%, statistically significant at
a p-value of 0.01
Thus, the microdata set acquired by the American Community Survey affirms two
important premises, the first being that rent-controlled units are strongly correlated to a decrease
in rent and housing prices, and the second that, rent-controlled units are also correlated to
lowered nominal wage, while separately controlling and accounting for the impact of
demographic effects including age, sex, and education level, among others.
Table 4.3: Ownership status and rent No. obs. 94,786
Rent control: 0.000404*** [1.22e-06]
Constant: 1.153227*** [0.0015606]
To affirm the validity of the constructed rent control variable, we first run a regression
between the variable ownership and rent; given that ownership represents home status, the
evident conclusion is that rented homes should yield not be affected by the ownership variable.
The above table, which illustrates the regression of documented rent on ownership status has a
coefficient of 0.000404, or approximately zero, statistically significant at a p-value of 0.01.
Table 4.4: Homeownership and rent control
No. obs. 47,325
Rent control: 0.00*** [1.22e-06]
Constant: 2*** [1.22e-06]
We also examine the relationship between the ownership variable and the rent control
variable; since the rent control variable should only affect renting occupants, it should yield no

28
effect on home owners, and thus, should have no relationship – and above, the regression which
examines the effect of rent control on homeowners demonstrates a negligible effect.
Subsequently, the multivariate regressions denote a correlation between the enforcement of rent
control and a consistent decline in both housing prices and nominal wages; we evaluate the
implications of this within the model framework listed below.
SECTION V: Section 5.1: Model Framework In order to determine the relationship between city housing prices and nominal wages of
workers, we utilize the Rosen-Roback model to finalize our interpretation, in which local forces
in a city affect local employment, wages, and housing, and as such, such a model functions as a
core tool for understanding housing price differentials amongst different areas. Within the
Rosen-Roback model, we treat each metropolitan area as a single homogeneous entity, and as
such, every individual residing within the same metropolitan area is assumed to hold the same
housing costs, transport costs, and amenity levels, given differentials in income. Subsequently,
upon examining a single metropolitan area, we enforce the following assumptions:
Within the Rosen-Roback model and to facilitate data analysis, we assume perfect
mobility. In such a setting, workers choose the city that maximizes utility. In the scenario of
perfect mobility across cities, we assume workers hold homogenous tastes and subsequently, are
willing to relocate to cities where wages, net of cost of housing and amenities, are higher. Thus,
the local labor supply to a city - namely the number of workers who are willing to relocate for a
higher wage or better amenities - is infinitely elastic. As a result, cities with higher wages, lower
cost of housing, or better amenities attract more workers, but not an infinite number of workers.
Subsequently, given that the following data analysis focuses solely on a single
metropolitan region, we assume that laborers in the city exist within the city per choice since it

29
maximizes the individual’s utility. As a result, the local labor supply to the metropolitan area in
question is held as negligible to the question we seek to answer, which is how rent control and
the subsequent changes in housing pricing affect worker wages and productivity.
Local employment, wages, and housing prices - in a city indexed by i produces a homogenous good with the following technology, can be represented by the equation below:
(1) Yi = AiLi^aKi^nTi^(1-a-n)
In the above equation, Ai captures the productivity of the city, Li the employment of the
city, Ki the capital of the city, and Ti, the land available for business use. We assume that within
the above production function, there are constant returns to scale in capital, labor, and land. We
also assume that the supply of land Ti is fixed in each city. The above production function makes
three assumptions. It first assumes that all cities produce the same product. It then assumes the
production function elasticities a and n are the same in all cities. Lastly, it assumes that the
production function is constant returns to scale in capital, labor, and land. We assume the supply
of land, Ti, is fixed in each city.
Labor supply in a city is limited by the condition that workers are freely mobile and in equilibrium choose the city that maximizes utility. Indirect utility of workers, V, is given by:
(2) V = Wi*Zi/Pi^β
In the above equation, Pi denotes the local housing price, β the expenditure share on
housing, and Zi the value of local amenities. Using previous literature as a precedent, we note
two important characteristics of the above Rosen-Roback model. The first being that workers
have homogenous tastes over locations. While workers do care about wages, housing costs, and
amenities, there is no individual specific preference for a city over another. Subsequently, we
assume that the labor supply facing a city is infinitely elastic and constant. Secondly, we assume

30
that the wage is the only source of income, discounting other potential sources of wealth
accumulation. Thus, utilizing the listed parameters, we use the definition of indirect utility,
listed in equation 2, to express the nominal wage as a function of V and the ratio of local housing
prices and local amenities:
(3) Wi = V*Pi^β/Zi
As a result, as dictated amongst the above equations, the nominal wage and its
fluctuations is determined by differences in city size and population, local amenities, and the
local elasticity of the city’s housing supply. Holding all other variables constant, if city housing
prices increase, assuming the expenditure share of housing is constant, the nominal wage
increases. In the same scenario in which all other variables are held constant, if housing prices
decrease, then the nominal wage would decrease as well. Hence, nominal wage is increasing in a
city’s employment with a city-specific elasticity, depending on the elasticity of housing supply
and the value of local amenities. Henceforth, in examining the value of V, the indirect utility, by
concentrating on a single city and metropolitan area, it is reasonable to extend that the labor
supply of the city remains at a constant, and thus, the value of indirect utility of a city remains at
a constant. In addition, within the same metropolitan area, it is reasonable to see that the value of
Z, of amenities, remains constant. Since, rather than examining the Rosen-Roback model at a
national level and the differentials of nominal wages between different cities, we examine the
differences in housing prices amongst a single city, we hold the value of indirect utility V,
constant and we control for the value of local amenities, Z, as constant, since within the same
city, we may assume a negligible difference for amongst different households.
And thus, within the following model and the assumptions in place, the average nominal
wage of the city of San Francisco is proportional to the average value of the housing price unit

31
raised to the power of the unit expenditure share of housing. With the values of indirect utility
and local amenities assumed to be constant in a single city, this means that the percentage change
in housing price raised to the expenditure share of housing reflects the percentage change in
nominal wage.
(4) Wi = (fraction of rent-controlled housing)*avg[Prent-controlledi^β] + (fraction of market-rate housing)*avg[Pmarket-ratei^β] By virtue of the following Rosen-Roback model and the assumptions made with it, in
distinction between market-rate and rent-controlled housing as iterated previously, the above
equation dictates that the recorded nominal wage of San Francisco is thus proportional to the
sum of the fraction of rent-controlled units in the city, multiplied by the average of the rent-
control price raised to the power of expenditure share of housing for rent-control units, added to
the fraction of the market-rate housing units in the city, multiplied by the average of the market-
rate price raised to the power of the expenditure share of housing on market-rate units.
Subsequently, utilizing the analysis from the IPUMS microdata sample and assuming the
conditions for the Rosen-Roback model would yield true, the negative correlation between rent
control and both housing prices and nominal wage, while controlling for a number of
demographic variables, implies that the implementation of rent control is in some way,
connected to lower nominal wage. The previous multivariate regressions for rent control yielded
an estimated decrease in housing price of 17.24% for renter-occupied units, and subsequently a
decrease of 6.62% in worker nominal wage; holding that the assumptions of the above equation
hold true, the decrease in housing price does directly relate to lower nominal wage. The precise
reason is unknown: it could be that those with higher wages are more likely to reside in market-
rate housing, or that rent-controlled housing is likely to attract those with less disposable income.

32
Section 5.2: Shortcomings However, the primary shortcoming of using the above model to interpret results is that
we only use city-specific data within our analysis, whereas the Rosen-Roback model is
dependent on assuming workers come from a variety of cities. Within the model, we assume that
spatial equilibrium allows for housing prices to accurately assess people’s willingness to pay for
location-specific amenities, but that characteristic is absent here – in which we hold no
comparative city data, aside from that of San Francisco, which makes the model application
significantly weaker and less rigorous. By virtue of only having a single city’s data and
concentrating on the specific dynamics of a municipal law there, we cannot assume that the
assumptions that substantiate the model hold – so the conclusion that relates the decline in
housing price from a citywide rent control law to a decline in nominal wage and extends what
was produced by the multivariate regressions, remains tentative at best.

33
REFERENCES: Autor, David H, Christopher J Palmer, and Parag A Pathak. 2014. “Housing Market Spillovers: Evidence from the End of Rent Control in Cambridge, Massachusetts.” Journal of Political Economy, 122(3): 661�717. Cash, Anna, et al. “Proposition 10: Estimating the Scale of Expanded Rent Control in the Bay Area.” Urban Displacement, 25 Oct. 2018, https://www.urbandisplacement.org/sites/default/files/images/policybrief_rentcontrol_102518.pdf.
Diamond, Rebecca. 2016. “The Determinants and Welfare Implications of US Workers’ Diverging Location Choices by Skill: 1980–2000.” American Economic Review 106 (3): 479–524.
Diamond, Rebecca. 2017. “Housing Supply Elasticity and Rent Extraction by State and Local Govern- ments.” American Economic Journal: Economic Policy 9 (1): 74–111.
Diamond, Rebecca, Tim McQuade, and Franklin Qian. 2018. “Who Benefits from Rent Control? The Equilibrium Consequences of San Francisco's Rent Control Expansion.” Stanford University Mimeo. Downs, Anthony. 1988. “Residential Rent Controls.” Washington, DC: Urban Land Institute.
Ganong, Peter, and Daniel Shoag. 2017. “Why Has Regional Income Convergence in the US Declined?” Journal of Urban Economics 102: 76–90.
Glaeser, Edward. 2014. “Land Use Restrictions and Other Barriers to Growth.” CATO Online Forum, December 1. https://www.cato.org/publications/cato-online-forum/land-use-restrictions-other- barriers-growth.
Glaeser, Edward L, and Erzo FP Luttmer. 2003. “The Misallocation of Housing under Rent Control.” The American Economic Review, 93(4): 1027-1046. Gyourko, Joseph, and Peter Linneman. 1990. “Rent Controls and Rental Housing Quality: A Note on the E�ffects of New York City's Old Controls.” Journal of Urban Economics, 27(3): 398� 409.
Hsieh, Chang-Tai, and Enrico Moretti. 2019. “Housing Constraints and Spatial Misallocation: Data- set.” American Economic Journal: Macroeconomics. https://doi.org/10.1257/mac.20170388.
Kim S. So, Peter F. Orazem, Daniel M. Otto, “The Effects of Housing Prices, Wages, and Commuting Time on Joint Residential and Job Location Choices,” American Journal of Agricultural Economics, Volume 83, Issue 4, November 2001, Pages 1036–1048, https://doi.org/10.1111/0002-9092.00228
Kline, Patrick. 2010. “Place Based Policies, Heterogeneity, and Agglomeration.” American Economic Review 100 (2): 383–87.

34
Kline, Patrick, and Enrico Moretti. 2014. “People, Places, and Public Policy: Some Simple Welfare Economics of Local Economic Development Programs.” Annual Review of Economics 6 (1): 629–62.
Moretti, Enrico. 2012. The New Geography of Jobs. Boston: Houghton Mifflin Harcourt. Olsen, Edgar O. 1972. “An Econometric Analysis of Rent Control.” Journal of Political Economy, 80(6): 1081-1100. “San Francisco Housing Needs and Trends Report.” San Francisco Planning, San Francisco Planning Department, July 2018, San Francisco Housing Needs and Trends Report. “San Francisco Rent Board Appendix,”, San Francisco Rent Board, 2018 https://sfrb.org/sites/default/files/FileCenter/Documents/1868-housing.pdf Sims, David P. 2007. “Out of Control: What Can We Learn from the End of Massachusetts Rent Control?” Journal of Urban Economics, 61(1): 129-151. Suen, Wing. 1989. “Rationing and rent dissipation in the presence of heterogeneous individuals.” Journal of Political Economy, 97(6): 1384-1394.
Recommended