Ryan M. Yonk PhD &
Randy T Simmons PhD
Renewable Energy Siting and
Transmission Resource Requirements
Renewable Energy Siting and Transmission Resource
Requirements Final Report
May 2012
Principal Investigators:
Ryan M. Yonk PhD Department of Political Science and Criminal Justice
Southern Utah University 351 West University Blvd Cedar City Utah 84720
Randy T Simmons PhD Department of Economics and Finance
Utah State University 3565 Old Main Hill Logan Utah 84322
Student Research Associates Neal Mason
Rhett Busk
Mathew Coates
Amy McIff
Nicholas Hilton
Traves Bills
Kristen Dawson
Luci Griffiths
Joshua Blotter
Justine Larsen
Josh DeFrieze
Kayla Harris
Heidi Eysser Richard Criddle
Table of Contents
Executive Summary 1
Summary Charts 2
Wind Energy Narrative 10
Solar Energy Narrative 18
Geothermal Energy Narrative 29
Hydro Energy Narrative 38
Oil Shale Narrative 50
Ethanol Narrative 57
Biodiesel Narrative 63
Works Cited 70
1
Executive Summary
The term renewable energy can be misleading. Due to the presence of the
word ‘renewable’ it is often assumed that renewable energy is easily produced,
transmitted, and requires few inputs besides the respective natural resource.
These inputs range from natural resources, to infrastructure, to man hours, and
location requirements. An investigation of wind, solar, geothermal, hydropower,
biofuels, and oil shale reveals, however, that each of these energy types have
resource requirements for both production and transmission.
Requirements for siting, planning, and transmission differ according to
energy type and size of the project. For example, while a geothermal plant must
have geothermal fluid generally heated to at least 300º F, water requirements for
biofuel production is negligible. Different types of renewable energy require
different resource allocations, such as the water requirements for solar.
Depending on the type of cooling required, water needed for solar energy plants
varies from 450 gallons/day per MW to 13,500 gallons/day per MW. There are
also resources that are specific to certain types of renewable energy. While wind
energy must have wind ≥ Class 3 (~15.7 mph at 50 meters) for an economically
viable wind project, wind is not necessary for hydro, biofuel, solar, or geothermal
energy.
Included in this reports are the siting, construction, and transmission
requirements for the above mentioned fuel types. The first half of this report is
composed of summary charts noting the basic requirements for the siting and
remission of the respective fuel type. That section will be followed by a detailed
report for each energy type discussing the siting of the energy from the planning
to transmission stages. Each section may be read alone or together with all
sections to create a comprehensive overview of renewable energy siting, planning,
and transmission resource requirements. Because of the unique status of biofuel
among renewable energy sources, the biofuel section is broken into biodiesel and
ethanol. The requirements addressed in the biofuel section differ from other
sections because the producer of oil, rather than the producer of biofuel,
customarily addresses resource requirements.
2
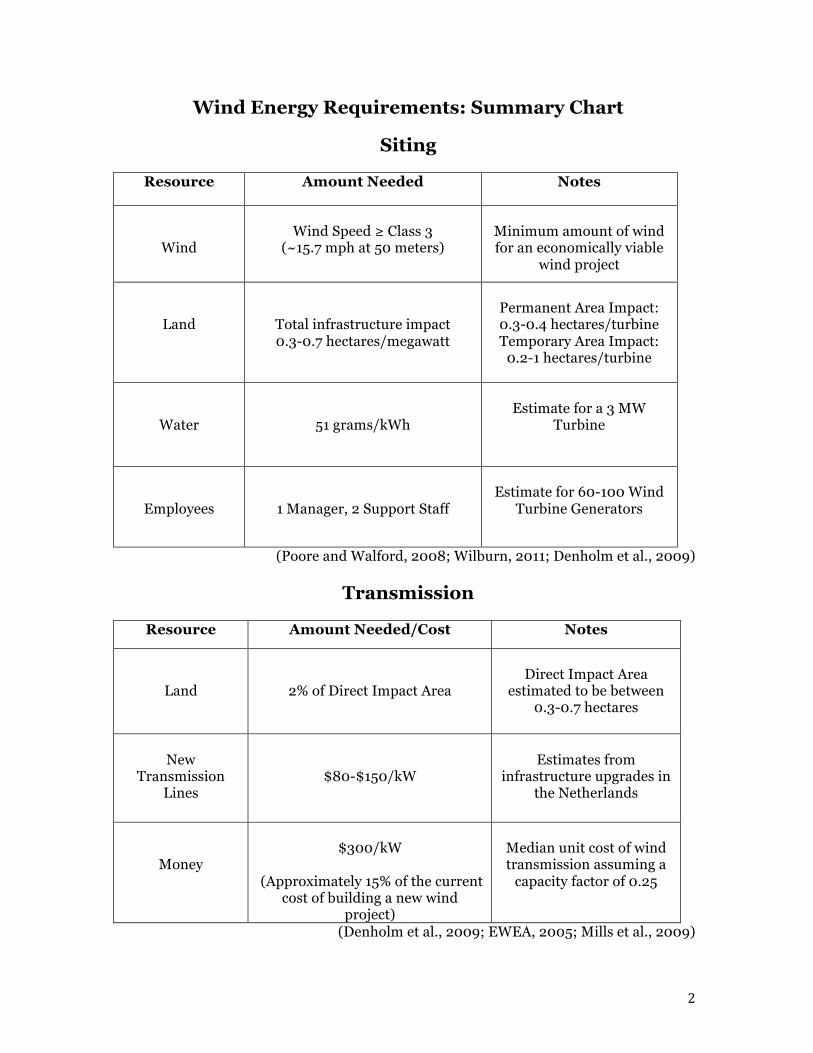
Wind Energy Requirements: Summary Chart
Siting
Resource Amount Needed Notes
Wind
Wind Speed ≥ Class 3
(~15.7 mph at 50 meters)
Minimum amount of wind for an economically viable
wind project
Land
Total infrastructure impact 0.3-0.7 hectares/megawatt
Permanent Area Impact: 0.3-0.4 hectares/turbine Temporary Area Impact:
0.2-1 hectares/turbine
Water
51 grams/kWh
Estimate for a 3 MW
Turbine
Employees
1 Manager, 2 Support Staff
Estimate for 60-100 Wind
Turbine Generators
(Poore and Walford, 2008; Wilburn, 2011; Denholm et al., 2009)
Transmission
Resource Amount Needed/Cost Notes
Land
2% of Direct Impact Area
Direct Impact Area
estimated to be between 0.3-0.7 hectares
New Transmission
Lines
$80-$150/kW
Estimates from
infrastructure upgrades in the Netherlands
Money
$300/kW
(Approximately 15% of the current
cost of building a new wind project)
Median unit cost of wind transmission assuming a
capacity factor of 0.25
(Denholm et al., 2009; EWEA, 2005; Mills et al., 2009)
3
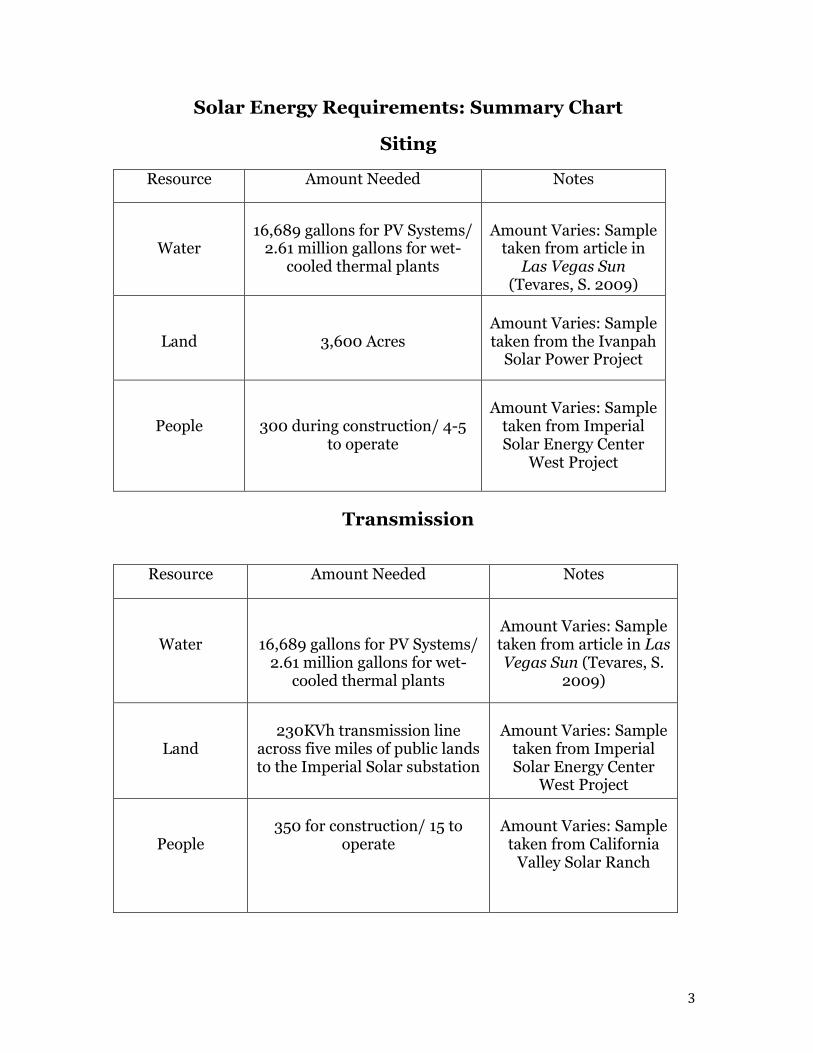
Solar Energy Requirements: Summary Chart
Siting
Resource Amount Needed Notes
Water
16,689 gallons for PV Systems/
2.61 million gallons for wet-cooled thermal plants
Amount Varies: Sample
taken from article in Las Vegas Sun
(Tevares, S. 2009)
Land
3,600 Acres
Amount Varies: Sample taken from the Ivanpah
Solar Power Project
People
300 during construction/ 4-5 to operate
Amount Varies: Sample
taken from Imperial Solar Energy Center
West Project
Transmission
Resource Amount Needed Notes
Water
16,689 gallons for PV Systems/ 2.61 million gallons for wet-
cooled thermal plants
Amount Varies: Sample taken from article in Las Vegas Sun (Tevares, S.
2009)
Land
230KVh transmission line
across five miles of public lands to the Imperial Solar substation
Amount Varies: Sample
taken from Imperial Solar Energy Center
West Project
People
350 for construction/ 15 to
operate
Amount Varies: Sample
taken from California Valley Solar Ranch
4
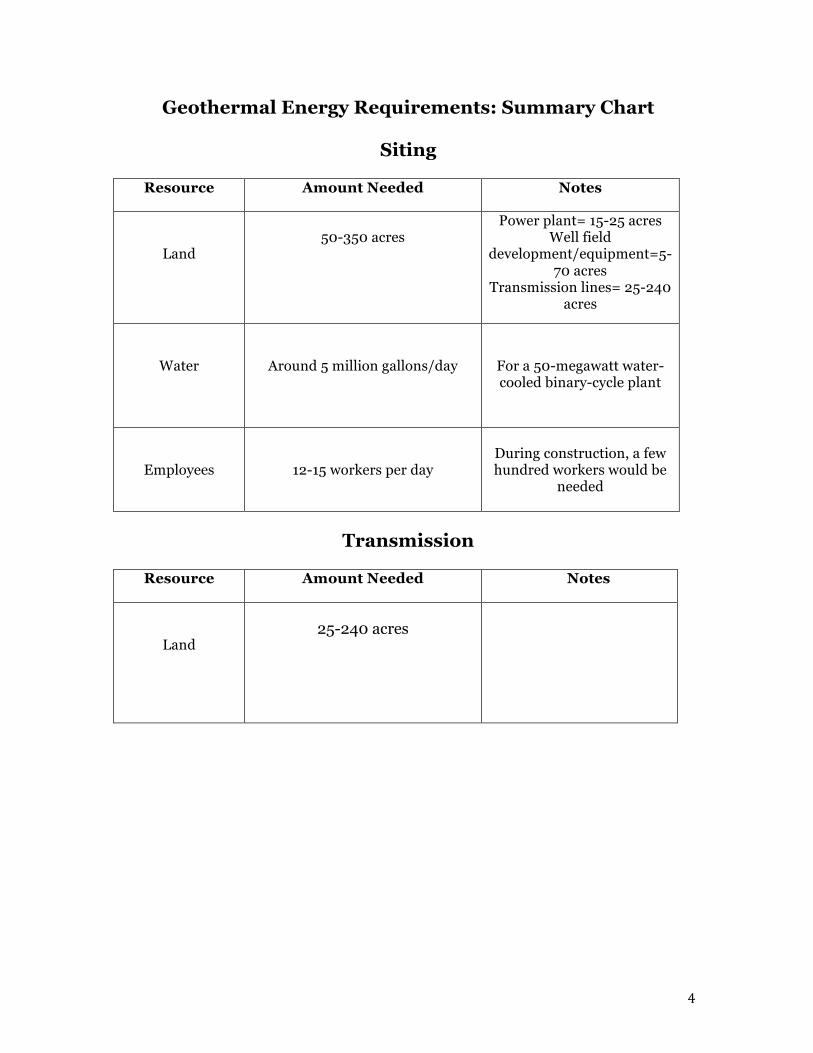
Geothermal Energy Requirements: Summary Chart
Siting
Resource Amount Needed Notes
Land
50-350 acres
Power plant= 15-25 acres Well field
development/equipment=5-70 acres
Transmission lines= 25-240 acres
Water
Around 5 million gallons/day
For a 50-megawatt water-cooled binary-cycle plant
Employees
12-15 workers per day
During construction, a few hundred workers would be
needed
Transmission
Resource Amount Needed Notes
Land
25-240 acres
5
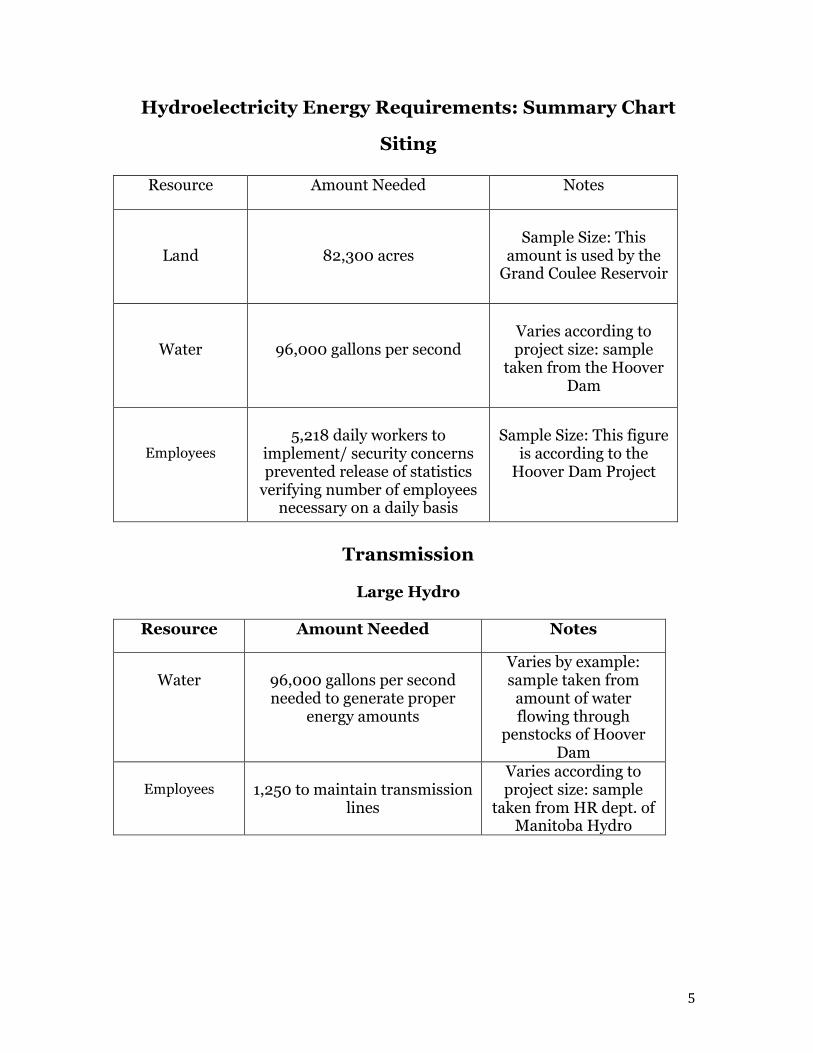
Hydroelectricity Energy Requirements: Summary Chart
Siting
Resource Amount Needed Notes
Land
82,300 acres
Sample Size: This
amount is used by the Grand Coulee Reservoir
Water
96,000 gallons per second
Varies according to project size: sample
taken from the Hoover Dam
Employees
5,218 daily workers to
implement/ security concerns prevented release of statistics
verifying number of employees necessary on a daily basis
Sample Size: This figure
is according to the Hoover Dam Project
Transmission
Large Hydro
Resource Amount Needed Notes
Water
96,000 gallons per second needed to generate proper
energy amounts
Varies by example: sample taken from
amount of water flowing through
penstocks of Hoover Dam
Employees
1,250 to maintain transmission
lines
Varies according to project size: sample
taken from HR dept. of Manitoba Hydro
6
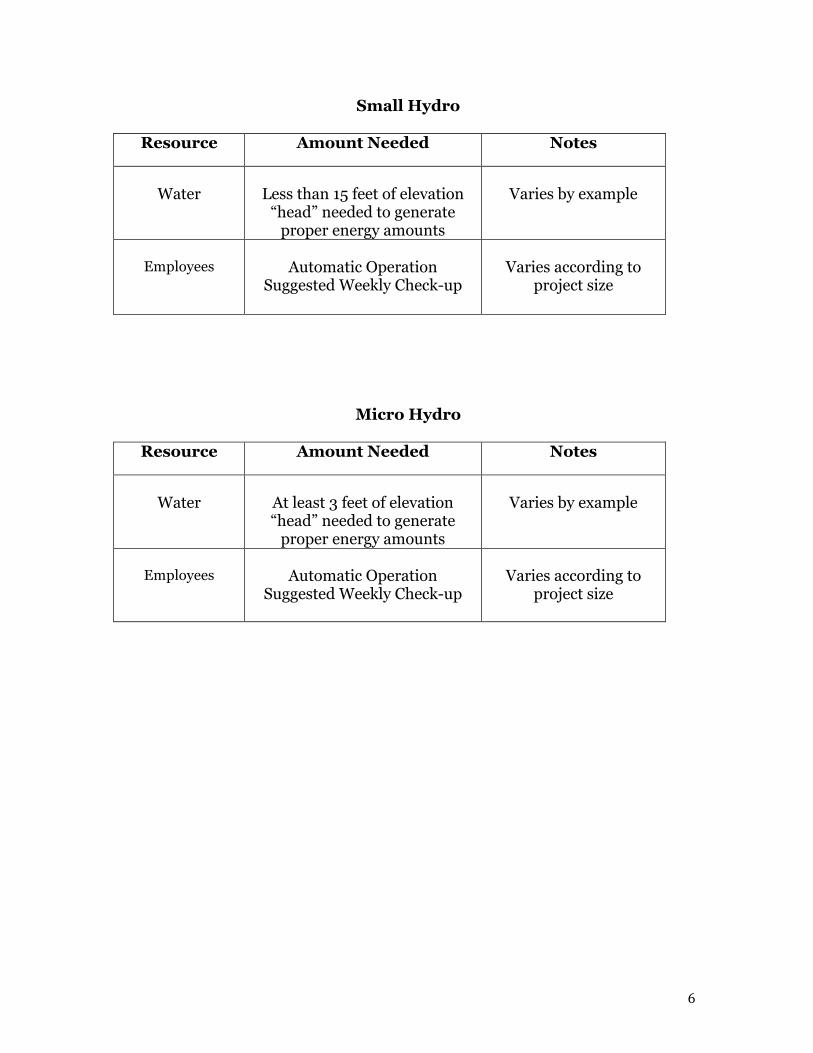
Small Hydro
Resource Amount Needed Notes
Water
Less than 15 feet of elevation
“head” needed to generate proper energy amounts
Varies by example
Employees
Automatic Operation
Suggested Weekly Check-up
Varies according to
project size
Micro Hydro
Resource Amount Needed Notes
Water
At least 3 feet of elevation “head” needed to generate
proper energy amounts
Varies by example
Employees
Automatic Operation
Suggested Weekly Check-up
Varies according to
project size
7
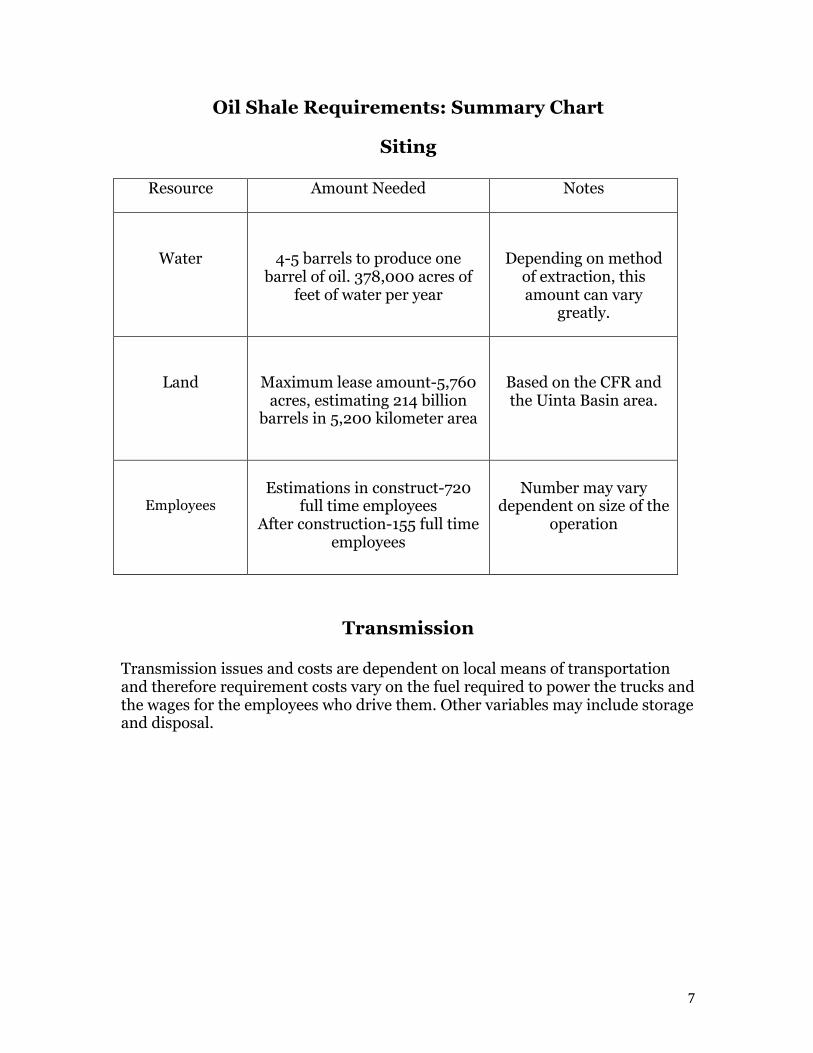
Oil Shale Requirements: Summary Chart
Siting
Resource Amount Needed Notes
Water
4-5 barrels to produce one barrel of oil. 378,000 acres of
feet of water per year
Depending on method of extraction, this amount can vary
greatly.
Land
Maximum lease amount-5,760 acres, estimating 214 billion
barrels in 5,200 kilometer area
Based on the CFR and the Uinta Basin area.
Employees
Estimations in construct-720
full time employees After construction-155 full time
employees
Number may vary
dependent on size of the operation
Transmission
Transmission issues and costs are dependent on local means of transportation and therefore requirement costs vary on the fuel required to power the trucks and the wages for the employees who drive them. Other variables may include storage and disposal.
8
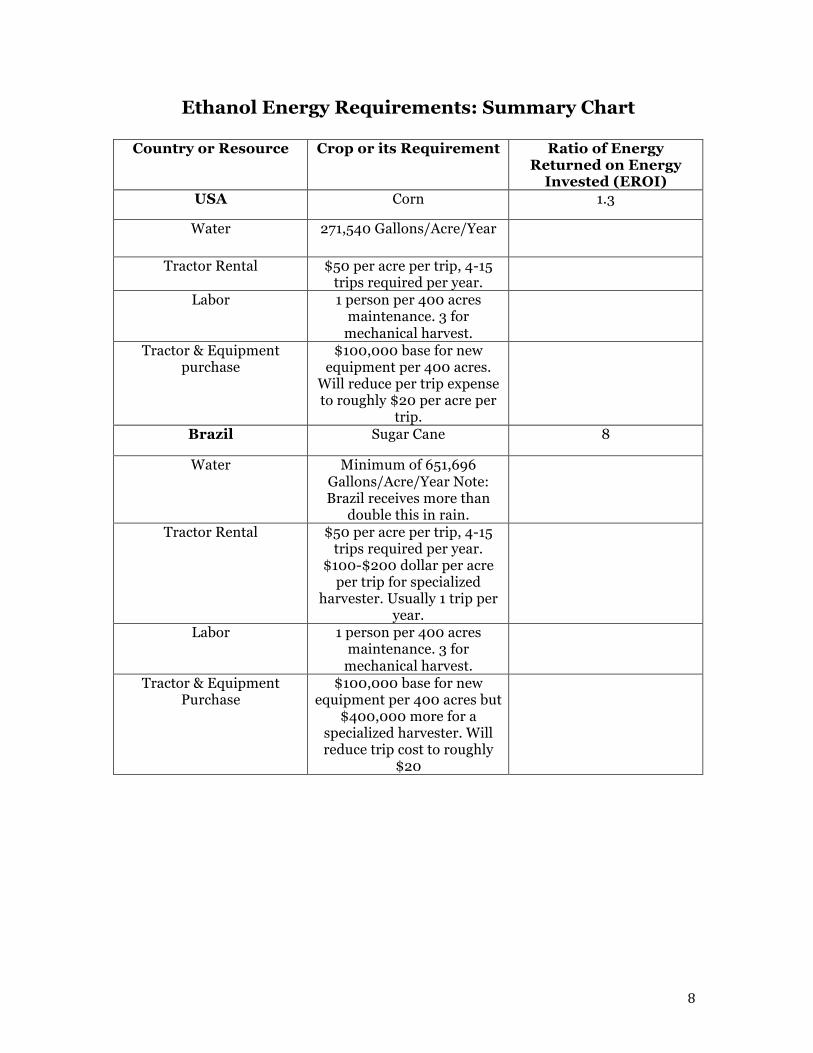
Ethanol Energy Requirements: Summary Chart
Country or Resource Crop or its Requirement Ratio of Energy Returned on Energy
Invested (EROI) USA Corn 1.3
Water 271,540 Gallons/Acre/Year
Tractor Rental $50 per acre per trip, 4-15 trips required per year.
Labor 1 person per 400 acres maintenance. 3 for
mechanical harvest.
Tractor & Equipment purchase
$100,000 base for new equipment per 400 acres.
Will reduce per trip expense to roughly $20 per acre per
trip.
Brazil Sugar Cane 8
Water Minimum of 651,696 Gallons/Acre/Year Note: Brazil receives more than
double this in rain.
Tractor Rental $50 per acre per trip, 4-15 trips required per year.
$100-$200 dollar per acre per trip for specialized
harvester. Usually 1 trip per year.
Labor 1 person per 400 acres maintenance. 3 for
mechanical harvest.
Tractor & Equipment Purchase
$100,000 base for new equipment per 400 acres but
$400,000 more for a specialized harvester. Will reduce trip cost to roughly
$20
9
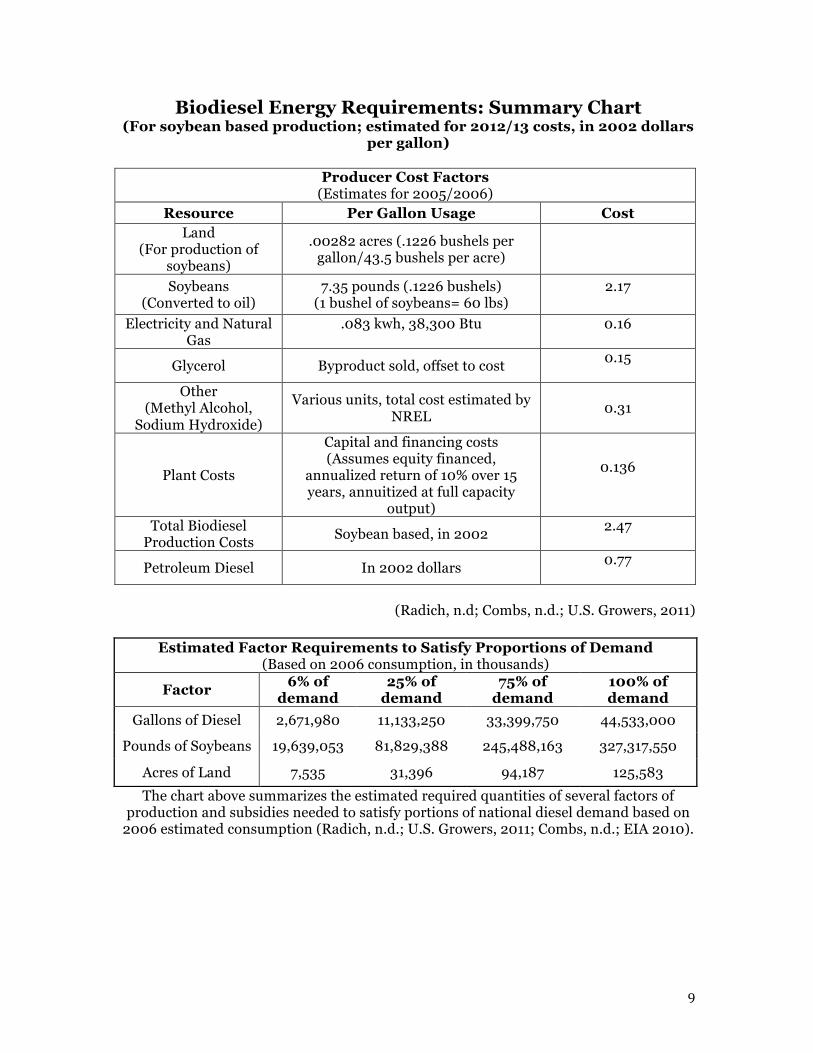
Biodiesel Energy Requirements: Summary Chart (For soybean based production; estimated for 2012/13 costs, in 2002 dollars
per gallon)
Producer Cost Factors (Estimates for 2005/2006)
Resource Per Gallon Usage Cost Land
(For production of soybeans)
.00282 acres (.1226 bushels per gallon/43.5 bushels per acre)
Soybeans (Converted to oil)
7.35 pounds (.1226 bushels) (1 bushel of soybeans= 60 lbs)
2.17
Electricity and Natural Gas
.083 kwh, 38,300 Btu
0.16
Glycerol Byproduct sold, offset to cost 0.15
Other
(Methyl Alcohol, Sodium Hydroxide)
Various units, total cost estimated by NREL
0.31
Plant Costs
Capital and financing costs (Assumes equity financed,
annualized return of 10% over 15 years, annuitized at full capacity
output)
0.136
Total Biodiesel Production Costs
Soybean based, in 2002 2.47
Petroleum Diesel In 2002 dollars 0.77
(Radich, n.d; Combs, n.d.; U.S. Growers, 2011)
The chart above summarizes the estimated required quantities of several factors of production and subsidies needed to satisfy portions of national diesel demand based on
2006 estimated consumption (Radich, n.d.; U.S. Growers, 2011; Combs, n.d.; EIA 2010).
Estimated Factor Requirements to Satisfy Proportions of Demand (Based on 2006 consumption, in thousands)
Factor 6% of
demand 25% of
demand 75% of
demand 100% of demand
Gallons of Diesel 2,671,980 11,133,250 33,399,750 44,533,000
Pounds of Soybeans 19,639,053 81,829,388 245,488,163 327,317,550
Acres of Land 7,535 31,396 94,187 125,583
10
Wind Energy Resource Requirements One of the oldest forms of energy, wind energy harnesses the power of air
convection from the Sun’s uneven heating of the Earth’s surface. Early windmills
appeared two thousand years ago, though modern wind turbines are significantly
larger and more efficient than their predecessors. Contemporary turbines are
able to generate enough energy (7.5 megawatts per unit) to power as many as
6,000 homes. As the push for renewable energy has increased at the federal level,
the demand wind energy production has also increased. By the end of 2011,
nameplate capacity of wind energy turbines worldwide was 238 gigawatts, up 41
gigawatts from 2010 (GWEC). These numbers are predicted to continue to
increase throughout this century. Several studies have indicated hundreds of
terawatts could be economically generated from wind power, potentially meeting
a large portion of energy needs (de Azua). Using wind as a resource carries
several requirements, including land, energy, transmission, and resource
requirements.
Siting Requirements
Land
One concern surrounding the development of wind energy is land. Though
wind energy facilities often don’t require significantly more land than alternative
methods of generating energy, the requirements can question the economic
viability of wind farms. In addition, the turbines often have significant impact on
their surroundings. One study evaluating 172 projects (collectively able to
generate 80% of total US wind power) performed by the National Renewable
Energy Laboratory found that, in practice, area requirements for wind energy
11
result in a total direct surface area disruption of about 0.3 to 1.7 hectares per
megawatt. Permanent infrastructure impacts per turbine amounted to 0.3 to 0.4
hectares, and temporary impacts amounted to 0.2 to 1.0 hectares per turbine.
In terms of land impact, wind plants sited on cropland require the largest
total land. Results from the study also highlight the variability of wind energy
capacity; for total area requirements, excluding a handful of outliers, the range of
values extends from 9 hectares/MW to 100 hectares/MW. The values range
widely because the efficiency of a wind project depends on several variables,
including plant size, geography, and the configuration of wind farms. Several of
the 172 projects in the study provided detailed information about how land was
used in the projects; most of the land used was dedicated to roads, with the
remainder used for turbines (10%), substations (6%), and transmissions (2%)
(Denholm et al 2009).
How much land a specific wind harnessing facility requires depends
significantly on the terrain where the turbines are constructed. For instance,
turbines in forested areas usually require less total land area because of the
economic cost associated with clearing forest, but they also have the most
permanent impact on the land they occupy, as construction requires
deforestation. Though most locations have similar balances between pros and
cons, strategic placement of wind farms can generate increased monetary output.
For example, because crops can be planted up to the base of turbines, and
livestock can graze around them, many farmers could potentially lease their land
to wind utilities while continuing to farm, creating multiple uses for their land. In
fact, the Union of Concerned Scientists reports that developing wind energy on
12
farmed land alone could provide $1.2 billion in new income for farmers and rural
landowners by 2020, as well as create 80,000 new jobs. Identifying similar
niches for wind energy greatly reduces the amount of land required for wind
farming (UCS, n.d.).
One final wind energy trend that should be addressed is the increasing
interest in offshore wind developments. Research by BTM Consults (2010)
indicates that currently 3.16 gigawatts (GW) of offshore wind farms have been
installed, a number expected to increase to 75 GW by 2020. Though heavily
implemented in Europe, no large-scale farms have yet to be completed in the
United States, although several are in various stages of pre-construction (BTM
2010). Though off-shore wind developments run into many of the same problems
that traditional wind farms do, it should be noted that turbines can be placed off-
shore in relatively unobtrusive off-shore locations. Recent turbine designs have
introduced turbines that can float, which could further reduce wind energy’s
dependence on land requirement. Further, these turbines are not required to rest
in permanent locations (The Guardian, 2010).
Energy
The potential for a wind farm generating electricity, and the cost per unit
of that electricity, depends almost entirely on how much energy (in the form of
wind) the turbines are exposed to. The power output of wind turbines increases
as a cube of wind speed, and thus winds with higher speeds are much more
economically viable. Wind speeds are separated into seven categories, with
higher numbers indicating higher wind speeds. Generally, wind speeds of class
three and above are necessary; in other words, wind speeds need to be at least
13
15.7 miles per hour at 50 meters for an area to be deemed economically viable as
a potential wind farm location. A 2009 study performed by the National
Renewable Energy Laboratory found that in the United States, most areas that
meet these requirements can be found in the relatively less-populated Midwest,
particularly in northern states like Montana and the Dakotas. The U.S. coasts are
also rich with wind speeds above class 5 (Denholm et al., 2009).
Wind speed is merely one factor to consider, however. One of the largest
drawbacks of utilizing wind energy, and easily among the most common issues
presented by wind energy critics, is the volatility and intermittency of wind.
Sometimes, the wind doesn’t blow, and often, the speed of the wind that does
blow varies significantly by time, day, or season. Wind turbines are generally
calibrated to maximize power production of the wind that usually surrounds
them, and so such variance can reduce the amount of power that can be
generated. Further, if wind reaches speeds that are markedly higher than normal,
the turbines will in some cases be forced to shut down to avoid damage to the
turbine. The number that relates the maximum capacity to the actual amount of
energy generated is the “capacity factor” (UMass, n.d.). If the nameplate capacity
(or maximum potential capacity) for a 5-megawatt turbine were 50%, then that
turbine would generate, on average, only 2.5 megawatts. Typically, capacity
factors for wind farms are roughly 20-40%, although some offshore sites where
wind is more constant can achieve higher capacity factors.
There are a variety of other methods that are used to reduce the energy
requirement for a wind farm site. For example, wind speed increases with
altitude; for class 7 winds, wind blows at about 11.1 miles per hour at 10 meters,
14
but at 50 meters, wind blows at least at 19.7 miles per hour. Placing farms where
there are few geographic or man-made features to interrupt the flow of wind also
maximizes the amount of electricity that can be generated (UCS, 2009).
Employees and Water
Wind energy development requires a variety of workers for construction,
maintenance, routine management, and operation. A 100-megawatt wind
development project in Canada, called Greenwich Wind, estimated that the wind
farm would bring 300 construction jobs during the peak construction phase; after
construction ended the company employed eight to ten people in management
and maintenance (RES Canada, n.d.). Operating costs for wind farms come from
paying managers, technicians and specialized maintenance crews as well as new
equipment. Routine maintenance, ordering and receiving inventory for turbine
parts, generating status and production reports, and scheduling outside services
for specialized maintenance are a few duties that require paid staff.
Since the most time-consuming activities for operations are linked to the
number of turbines in a wind farm, Poole and Walford (2008) provide various
manpower requirements based on the number of wind turbine generators in a
facility. For a facility with less than 20 wind turbine generators (WTG), a single
manager usually assumes routine tasks and maintenance (Poole and Walford,
2008). For large facilities with more than 60 WTGs, an administrative assistant
and a support person are required in addition to a manager.
Compared to other forms of energy, wind energy uses little water. In arid
climates, small amounts of water are used to clean turbine rotor blades to
maintain performance (EcoGen, 2012). Citing a 2006 study by Vesta Wind
15
Systems looking at onshore wind turbines in Europe, Wilburn (2011) estimates
freshwater consumption for a 1.65 megawatt turbine at 38 grams per kilowatt-
hour, and 51 grams per kilowatt-hour for a three megawatt turbine. Wilburn
writes, “These estimates include the resources used in raw material extraction,
component manufacturing and transport, wind turbine installation and
operation, and decommissioning and disposal of turbine components at the end
of their life cycle” (2011).
Transmission Requirements
The intermittency of wind energy strongly affects the transmission
requirements for power generated from wind turbines. Although significant
problems generally don’t occur until wind power accounts for over 20% of all
electricity, relying too heavily on wind energy could create grid shortages on days
with inadequate wind. Many of the electrical transmission changes aren’t
technological, per se, but rather require different large-scale energy management
techniques.
The European Wind Energy Association lists certain general guidelines for
an electrical grid relying on wind energy that should be addressed to consistently
utilize wind energy. First, operation of the power system needs to be changed.
Wind power generation isn’t dispatchable, which means that it’s impossible to
start or stop generating as the need arises. Weather forecasting and statistical
evaluation of wind variation is necessary to predict how much power wind can
provide on the grid during any given time period. Second, utilizing wind energy
often requires upgrading connection requirements to maintain a stable and
secure supply. A study by Mills et al. (2009) estimated median transmission costs
16
for wind development at $300/kW (assuming a capacity factor of 0.25), or
approximately fifteen percent of the current cost of building a new wind project.
In the Netherlands, infrastructure upgrades to enable wind farms have cost the
dollar equivalent of $80-$150 per kilowatt, while in Spain, upgrades have cost
roughly $70 per kilowatt (EWEA, 2005). Despite these relatively small, one-time
expenses, the cost of upgrading and enlarging a wind energy plant is much larger.
A final change is extending and modifying the grid infrastructure.
Diversifying the geographic locations of turbines reduces the risk of a shortage,
and many small suppliers from a variety of locations may want to participate.
Both factors require longer grid connections. The offshore branch of wind
farming also has unique requirements to connect to the grid, including cables
installed underneath the seabed. One notable benefit of utilizing offshore wind
farming, however, is that wind farms can be located close to coastal population
centers. Despite these requirements, strategic wind energy siting can significantly
reduce transmission costs (Holttinen et al., 2006).
Conclusion
Although wind energy has the capability to serve as a supplementary
source of energy, it cannot serve as a primary source of power due to the
unreliability of the resource from which it derives energy i.e. wind. And while
wind energy requires minimal water resources for siting, there are few areas that
qualify as economically viable wind energy sites. This is because wind must be
greater than or equal to 15.7 mph at 50 meters in the air, a requirement that most
areas do not meet. In addition, while an individual turbine only requires .3-.4
hectares of land, economically viable wind energy projects require several wind
17
turbines to generate electricity. Costs to link to the current power grid can be
expensive, when a power grid is available and permission to hook up to the
current power grid is granted. Finally, for a 60-100 wind turbine project, only
one manager and 2 support staff are needed; while more are needed for the
construction of wind turbines, the addition of wind turbines does not necessarily
generate increased long-term employment opportunities in the communities
where wind energy projects are found.
18
Solar Energy Resource Requirements
The 1973 OPEC oil embargo on the United States proved effective in
crippling the U.S. economy. This denial of oil exports revealed the significant
weakness of a country dependent on oil from other countries. Diplomacy began
almost immediately as fears rose regarding the future of energy in the United
States, leaving the United States in the meantime to depend on oil supplies from
allied nations to keep the economy afloat (Office of the Historian, n.d.). Finally,
in 1974 under the Nixon Administration, a sense of normalcy was reinstated as
the embargo was lifted (Office of the Historian, n.d.).
Two Presidencies later, Jimmy Carter sat in the Oval Office during yet
another energy crisis, in which the Iranian revolution affected the flow of oil to
the United States and again threatened the economy. In response, President
Carter pushed for more renewable energy use and development to prevent a
similar situation in the future (Carter, J. n.d.). As part of his proposed energy
reform, President Carter made the specific goal to “use solar energy in more than
two and one-half million houses” by the end of 1985 (Carter, J. n.d.).
Solar power is unique among alternative energy resources in its versatility;
it is neither confined to the traditional solar farm approach, nor to limited-impact
home installments. Due to this variance in types of solar generating units, it is
necessary to examine resource and land requirements in all areas before properly
instating one of these facilities.
Types of Solar Plants
There are two main distinctions in types of solar plants; solar technology
either uses concentrating solar power (CSP) to produce steam and turn turbines,
19
or individual cells used to transform solar energy directly into electricity. These
two technologies are referred to as solar thermal and solar photovoltaic (PV)
(Office of Indian Energy and Economic Development, A, n.d.). Solar energy
generating systems vary in size dependent of the amount of energy needed and
land availability. Some projects are small enough to fasten to the rooftops of
homes, while others require vast mirror fields. Due to this variance, it is
necessary for developers to first decide upon which type of solar energy to
implement.
CSP Systems
Concentrating solar power collection facilities use mirrors to concentrate
sunlight onto receivers, creating thermal energy. This heat is used to boil water,
turning a turbine that produces electricity (Department of Energy, A, n.d.). CSP
plants consist of two parts: one converting light from the sun into heat, and the
other using the heat to create electricity.
There are four types of CSP systems: linear concentrator, dish/engine, and
power tower systems (Department of Energy, A, n.d.). Linear Concentrator
systems use mirrors to concentrate sunlight into linear receiver tubes containing
liquid. As the sun heats the liquid, a “superheated steam” is created, which is
used to drive turbines and produce electricity. Linear concentrating power plants
are the most common type of CSP system in the United States, which consist of
parallel rows of panel-shaped mirrors aligned to maximize exposure to the sun
(Department of Energy, B, n.d.).
Dish/Engine systems, on the other hand, use a system of parabolic mirrors
shaped like a satellite dish, reflecting the light into a receiver to create steam.
20
These systems are the least productive of CSP systems in terms of kilowatts
(Department of Energy, C, n.d.). Power tower systems use mirrors that are
arranged circularly around a large tower, allowing them to collect light from the
sun at any angle, and reflect light to a receiver at the top of the tower,
subsequently superheating liquid to turn turbines. Power tower systems have
proven especially effective at providing electricity during bad weather, and even
at night. In one instance, a power tower operation provided uninterrupted
electricity 24 hours per day for 7 consecutive days (Department of Energy, D,
n.d.).
Photovoltaic Systems
PV systems use the light from the sun to directly create electricity. As the
sun’s light is absorbed into photovoltaic cells, electrons in the semiconductor
material absorb the light; the energy absorbed causes them to escape normal
rotation patterns in the atom and become part of an electrical current. These cells
range in size, but average only a few inches across. Grouping many PV cells
together then forms a solar panel. PV solar electric systems are versatile in that
they can be designed to fit any available space and provide the needed electricity.
PV systems also generally contain a converter and batteries to transform power
into usable electricity and then store it for future demands. These converters and
batteries are referred to as balance of system (BOS) components.
There are only two types of PV systems: flat-plate and concentrator
systems (Department of Energy, E., n.d.). Flat-plate systems organize solar arrays
into flat plates that can be conveniently placed on rooftops or mounted on the
ground. Flat-plate systems are convenient, but expensive. Because of their fixed
21
nature, they are also inevitably inefficient at times of day or in seasons when the
angle of the sun changes (Department of Energy, F, n.d.). Concentrator systems
use glass or plastic to concentrate sunlight onto smaller areas, using fewer cells
more efficiently to create more electricity. However, concentrator systems run
higher costs in light-concentrating optics and generally need to be mounted so
that the system can track the sun; otherwise, the system is ineffective.
Siting Requirements
Land Requirements
PV systems are more diverse in application than CSP systems, which need
large amounts of land. PV systems can be small enough to power a road sign or
large enough to power a community (Department of Energy, G, n.d.). The
diversity of solar projects necessitates varying amounts of land and resources for
each facility. Because there is not a set list of requirements needed to develop
solar energy facilities, insight to basic requirements for each can be gained from
looking to existing examples of solar energy.
The Ivanpah solar power plant in California is currently under
construction and was named the 2012 Energy Project of the Year (Blog
Brightsource Ivanpah, n.d.). Ground was broken in 2010 for the plant, which is
expected to double the amount of solar energy generated in the US when
completed. The system will be composed of three power towers surrounded by
mirror fields, and is the largest thermal solar energy plant currently under
construction (Blog Brightsource Ivanpah, n.d.). Although land requirements vary
according to project size and terrain, the Ivanpah project properly reiterates the
vast amount of land needed for commercial-scale solar facilities through its use of
22
3,600 acres- revealing the far end of the spectrum in relation to land required for
implementation (About Brightsource Ivanpah, n.d.).
Solar energy is not limited to large-scale productions; the Solar America
Cities Partnership Program, implemented by the U.S. Department of Energy, is a
competitive means to promote increased use of solar energy in cities throughout
the country (Powering Our Future, October 2010). Salt Lake City, Utah, a city
participating in the program, uses small solar energy projects to reduce strain on
the electrical grid (Powering Our Future, October 2010). As part of the program,
Salt Lake City is one of fifteen different cities across the country that has made
the goal of increasing solar-electric generation by 10MW by 2015 (Powering Our
Future, October 2010). This will be done through small-scale solar systems, such
as the installation of solar panels on rooftops. Select solar projects, such as this
one, require minimal areas for implementation- some of which aren’t in use
anyway (as is the case in rooftop space).
A comparison of the Ivanpah Solar Power Plant and the many smaller
systems being implemented in Salt Lake City, indicates that there are many
different possible area requirements for solar energy systems. The 3,600 acres
needed to run the Ivanpah project varies in size from not only with the rooftop
space needed for small PV systems, but also with other large solar projects. Land
type, weather characteristics, and energy demands all cause differing solar
projects to vary in the amounts of area needed for their implementations. Variety
in land needs can be seen in the projects approved by the Bureau of Land
Management (BLM): “projects range in size from a 45 MW photovoltaic system
23
on 422 acres to a 1,000 MW parabolic trough system on 7,025 acres” (BLM Fact
Sheet, 2012).
Resource Requirements
Acreage, however, is not the only matter to take into consideration with
site evaluation. The quality of the area is critical, and therefore evaluations of
climate, meteorology, and topography are also important. To that end, the
installation of meteorological towers and solar sensors are necessary during the
site evaluation phase. Meteorological towers provide information such as wind
speeds and temperature. They are lightweight and most often require no
foundation. There is little maintenance or effort required to care for these towers
(Solar energy site evaluation, n.d.).
Solar energy developers must consider two other essential needs in citing
solar energy plants: water needs and workforce support. Solar energy sites are
placed in sun-intensive locations; however, these locations are often located far
from populations, increasing the overall cost. The most useful areas for solar
development tend to be in rural desert areas, which complicate the ability to get
water to the employees as water is scarce and employees are required to commute
long distances. Because of these complications, larger power plants are most cost
effective when compared with smaller facilities because they are able to serve
larger volumes of individuals and therefore generate more income (NREL, 2011).
Similar to the land requirement for instating solar energy generating systems,
water needs also differ dependent on size and location. Each solar energy system
requires water in one way or another; whether it’s used for dust control, or
actually heated to generate electricity, water is a must.
24
An article that adequately gives a representation of water needed for PV
systems surfaced in Las Vegas in 2009. The sunny areas of southern Nevada
offered potential benefits to solar power; however, the implementation of these
facilities received criticism at the large amounts of water needed to properly
operate the plant (Tevares, 2009). Photovoltaic solar developers in the area
hadn’t properly estimated their water usage, and estimated that the plant would
require “only enough water to run the office bathrooms and wash the arrays of
panels a couple of times a year” (Tevares, 2009).
Locals, however, argued that such an estimate was unfeasible, and that
water needs would be much greater because of excessive dust in the area, thus
creating a greater number of times the panels would need to be sprayed down.
Dust on the PV panels could generate a decrease in efficiency by three percent,
adding incentives for the project overseers to double-dip into water reserves
(Tevares, 2009). Although PV systems use significantly less water (16,689 gallons
per megawatt compared with 2.61 million gallons needed for wet-cooled solar
thermal plants) the use of such large amounts of water remains a concern for
residents of desert communities (Tevares, 2009).
Employment is yet another varying factor to look to in developing solar
energy projects. Only minimal maintenance and regular checkup is required for
small projects such as rooftop panels or those powering road signs. Larger
projects on the other hand, require a significant number of employees to
construct a facility, but afterwards then generally require fewer workers to tend
to daily operations. An example of this is found in the upcoming California Valley
Solar Ranch, where 350 construction jobs are made available through the
25
project- followed by 15 long-term positions to operate the facility that will
generate 250MW (California Valley Solar Ranch, n.d.; CVSR Project Benefits Fact
Sheet, n.d.).
Transmission Requirements
With advancing technologies, and growing contributions to the electrical
grid from multiple renewable sources, solar energy developers need to keep
transmission in mind when considering the construction of new facilities. Rural
locations needed to create large-scale solar energy generating systems increase
costs, as additional resources are needed to transmit the energy generated to the
electrical grid. In focusing on solar transmission it is necessary to note the land,
water and employee requirements needed to operate solar energy plants.
The process of transmitting the energy cultivated within the plant is not
cheap. Many resources go into implementing an effective transmission system
such as land, wiring, support structures, and transformers. After the energy is
converted into electricity, it is sent through transformers, which increase the
voltage in order to send it through the lines and into communities (NextEra
Energy Resources, n.d.). Energy capacities, distance from the electrical grid, and
land terrains all influence the size of transmission systems. Differing
characteristics for each transmission system prevent the existence of an all-
knowing spreadsheet with figures depicting the exact amount of resources
needed during transmission. It is ideal, however, to look at similar solar energy
facilities for ballpark numbers regarding transmission statistics. One such
example is the Imperial Solar Energy Center West Project.
26
Land Requirement
The Imperial Solar Energy Center West Project is currently being
constructed in Imperial County, California and when completed, is estimated to
generate as much as 250MW (Imperial Solar Energy Center, n.d.). Lands once
used for agriculture have been found to be un-economic and were therefore
abandoned. These abandoned agricultural lands are being used for the facility,
and cover an estimated area of 1,057 acres (Proposed: Imperial Solar Energy
Center West, n.d.). Land needed for transmission varies from project to project.
The Bureau of Land Management has authorized a 230KVh transmission line to
cross five miles of public lands and connects the facility to the Imperial Valley
Substation (Imperial Solar Energy Center- West Project, 2011). Lands needed for
transmission in the project serves as a sample of potential lands needed by other
similar solar energy facilities.
Employee Requirement
Solar energy plants require differing numbers of employees, dependent on
the size and location. As expected, the actual construction of the plant and
transmission lines requires many more employees than does regular
maintenance and daily operations. A sample size of necessary employees is
shown through the creation of approximately 300 construction jobs and 4-5 long-
term employment positions (Proposed: Imperial Solar Energy Center West, n.d.).
Once in operation, transmission lines require minimal upkeep, which lessens the
overall need for employees.
27
Water Requirement
As was seen in the water dispute in Las Vegas, residents near these
developments often fear that water will be wasted in maintaining solar plants
(Tavares, 2009). Many developers respond to this fear through using as little
water as possible. In the case of the Imperial solar Energy Center West project,
developers specifically chose PV systems to reduce water needs and gain further
approval from residents near the area (Proposed: Imperial Solar Energy Center
West, n.d). Contrary to CSP systems, which use heated water to turn turbines, PV
systems transform sunlight directly into energy and therefore need water only for
regular yearly cleanings.
Energy transmitted by PV systems is directly affected by the cleanliness of
the panels, therefore creating a need for these regular cleanings. Amounts of
water used to remove dust from the arrays can still be extensive, and vary
according to the number of panels. Operators may plan around expected rainfall;
however, areas with little rainfall may continue to require as much as 16,689
gallons of water per megawatt (Tavares, 2009). Additional water may also be
needed to supply employee facilities, but dependent on the number of employees
this amount may be rather small.
Diversity in types of solar plants facilitates a wide variety of transmission
needs. Non-invasive rooftop installments used to power individual homes need
far less land, water, and maintenance than large facilities that power entire
communities. Although the amounts of resources needed may vary, the processes
these projects follow in regards to transmission all follow the same pattern. Plant
construction is a major undertaking, however, the plant is useless unless
28
connected to the electric grid to serve customers and generate income. Through
looking at the examples of similar plants, developers can gain further insight as to
the research and planning needed for transmission regarding solar energy.
Conclusion
A major concern in the construction and transmission of solar energy is
the amount of water needed for solar energy. As a scarce resource, particularly in
the West (where most of the potential solar energy development sites are
located), there is concern that extensive water use for solar energy will take water
from critical economic activities such as agriculture and grazing. While a
somewhat large workforce is needed for construction of large scale solar energy
plants, maintenance and operation of a solar energy plant does not require very
many full-time, long-term employees. As with wind energy, the addition of solar
energy plants does not necessarily generate increased long-term employment
opportunities in the communities where solar energy projects are found. Large
tracts of land are necessary for large solar energy projects, adding yet another
difficulty to solar energy development.
29
Geothermal Energy Resource Requirements
Geothermal energy is harnessed from the heat of the earth. While there are
different methods of obtaining energy from geothermal sources, the basic model
uses steam and heated water to spin a turbine, which produces electricity. This
electricity is then transmitted through transmission lines to its intended
destination. The water is returned to the heat source as warm water to extend the
life of the geothermal spot and can be reused after the earth reheats it.
Geothermal energy plants have been in use since 1904 in Italy and have
continued to improve and expand as technology advances (Geothermal
Education Office, 2000).
Siting Requirements
Land
A good site for geothermal electric development must have shallow
aquifers that produce heated geothermal fluid (generally at least 300º F,
although some plants can utilize fluids as low in temperature as 210º F) and can
be recharged by re-injecting the fluid. The site must also have access to extra
water for evaporative cooling and ideally, to existing transmission lines and roads
(Department of Energy (b), 2012).
Typically, about 2 to 7 acres of land are required for initial exploration and
drilling depending on the size of the plant being built. Power lines connecting the
power plant generator transmit the electricity to homes, buildings, and
businesses. Once construction begins, the acreage requirements increase to 5 to
50 acres, so as to include land for access roads, actual construction, and the
“drilling and installation of flow testing wells” (Department of Energy (a), 2012).
30
Construction requires about 50 to 350 acres of land; while most of the land will
remain a part of the plant, some of the land will be reclaimed after construction
(Department of Energy (c), 2012). Likewise, depending on the size of the
geothermal system the operations and maintenance phase takes about 50 to 350
acres. “The power plant itself would account for 15 to 25 acres; the well field
development and equipment (including the pipeline system) would account for 5
to 70 acres. The transmission lines would require from 25 to 240 acres, ranging
in length from 5 to 50 miles with a corridor width of about 40 feet” (Department
of Energy (d), 2012).
Assessing the Site
Before construction for a geothermal plan can begin, pre-construction
surveys and studies must be conducted, including: “satellite imagery and aerial
photography, volcanology studies, geologic and structural mapping, geochemical
surveys, geophysical surveys, and electrical, magnetic, chemical, seismic, and
rock studies” (Department of Energy (b), 2012). Following these surficial surveys
and studies, more intrusive procedures must take place, specifically drilling for
temperature gradient wells, and holes for seismic investigation, core drilling, and
geophysical testing. While most of these assessment activities take place
underground, the procedures require a significant amount of land obliteration:
vegetation must be cleared around the site, roads built for easier access to project
sites, drilling, explosions for seismic testing, and “sludge”, or slushy fluid
remains, must be removed and disposed of (Department of Energy (b), 2012).
The time it takes to perform the seismic surveys and surficial data collection is
quite short, only lasting a few days.
31
A geothermal plant can be compared to a volcano: a relatively small
amount of space can produce a significant amount of energy. Geothermal energy
utilizes the least amount of land of any energy form: a geothermal energy plant
requires about as much space as a gas-fired plant that produces the same amount
of energy, omitting the miles of underground pipeline needed to transport gas
(Pros and Cons of Geothermal Energy, 2007).
Specific requirements and regulations must be considered when assessing
a possible site for a geothermal energy production plant. A relatively small
workforce of 10 to 15 people is required for the exploration phase, while extra
workers might be hired to install or operate specific machinery and/or data
collections or surveys. Once construction begins, however, several hundred
employees are needed to build pipelines and roughly 50 are needed to construct a
transmission line, depending on the length of the line.
Drilling activities normally take numerous weeks to complete, resulting in
a total of between one and five years to complete all exploration and assessment
activities and studies. The materials and resources needed for initial assessment
are not particularly demanding. Roughly 80-1000 gallons of water per MWh of
plant output is required to control dust, mix concrete, and provide drinkable
water for the crew. This water can be brought in from an off-site location or
found in an on-site well or local water supply. No utilities are necessary for
beginning exploration and assessment, as drill rigs are powered and operated by
diesel engines (Department of Energy (a), 2012).
The preliminary investigation does generate some emissions and waste
resulting from vehicles used to transport drill rigs, perhaps a diesel generator
32
trucked onto the site to power equipment, and possibly certain gases from well
venting, including hydrogen sulfide, carbon dioxide, mercury, arsenic, and boron.
These emissions are most easily controlled after construction of the plant, by
installing hydrogen sulfide abatement systems or by re-injecting gas emissions
into the geothermal reservoir, which may or may not have adverse effects on the
reservoir. The waste produced is mostly sludge, as mentioned above, which is
typically removed from plastic and clay lined pits on site. After all the water has
evaporated, the sludge is disposed of in a licensed off-site location (Department
of Energy, 2012).
Construction
Once the site has been approved and deemed ready, construction begins.
Geothermal fields are prepared, power plants are built, and the infrastructure
and transmission lines put in place. During construction, typically a few hundred
workers work on site; the number, however, may vary over the two to four years it
takes to finish construction of a large geothermal development.
Operations and Maintenance
Maintaining geothermal plants requires minimal maintenance and does
little to disrupt the land. Approximately 3 workers are required per shift to
perform routine operations; as many as 12 workers, based on plant size, might
execute additional maintenance and management operations when needed
(Department of Energy (d), 2012).
Regarding waste emissions, carbon dioxide is the main emission generated
from geothermal power plants; however maintenance vehicle traffic, heating,
ventilation, and air conditioning systems also produce a certain amount of
33
greenhouse gases. If wet cooling is used, cooling tower drift might give off
particulate emissions (or emissions that contain small particles of liquids and
solids). Additional waste generated consists of sanitary waste resulting from on-
site workers, and used cooling water is released to a permitted evaporation pond
(Department of Energy (d), 2012).
Any water required is piped in from an off-site municipal water facility or
an on-site well. Certain types of geothermal plants, namely water-cooled binary
cycle plants, utilize significant amounts of cooling water (S. Williams, K. Porter,
1989). “For example, a 50-megawatt water-cooled binary-cycle plant requires
more than 5 million gallons of cooling water per day (100,000 gallons per
megawatt per day)” (United States Department of Energy, 1995). Most
geothermal plants are located in desert regions, making it difficult to acquire
adequate water quantities to continue production.
Transmission
The transmission line takes a few more months to build, depending on its
length. Portable generators supply any electrical power needs on-site, and water
requirements are similar to pre-construction requirements, needing an adequate
amount for making concrete, providing drinkable water, and controlling fugitive
dust. Construction vehicles emit dust and exhaust, and similar to the assessment
process, well venting might release hydrogen sulfide, carbon dioxide, mercury,
arsenic, and boron. Sanitary waste from the construction workforce is the only
waste generated during the construction period (Department of Energy (c),
2012).
34
The siting of geothermal energy production plants is limited to areas
containing high levels of volcanic activity and functional geothermal hotspots.
Thus, the majority of usable sites are often geographically isolated, which limits
the ability to efficiently transmit geothermal energy. The major limiting factor to
geothermal energy use is the remoteness of sites and areas suitable to geothermal
energy development.
Transmission of geothermal electricity and its use are also limited in
several minor ways. The first is the fact that “geothermal resources cannot be
transported distances over a few miles without heat loss.” (Kagel, 2008, p.13).
Thus, geothermal steam must be used to generate electricity at or relatively near
the source of the steam and/or its point of extraction. In addition, the majority of
suitable sites are found in predominantly rural, remote locations. Consequently,
“[a] large amount of capital is required for transmission expansion, providing a
disincentive for utilities to build infrastructure to reach remote geothermal
sources” (Geothermal Technologies Program, n.d. p. 31).
For geothermal energy to be effective in supplying energy to a large
percentage of the population it would, in theory, necessitate one of three
dramatic changes. These solutions include first, an expansion or upgrade of the
current infrastructure system, development of technology in participating
communities. And finally, a major improvement in the technology used to collect
geothermal resources that would lead to the expansion of geothermal energy
production in areas that currently are unfeasible for the collection of geothermal
energy resources. Each of these three methods has benefits that are promising,
but as with all solutions to energy problems they also have downsides.
35
The US Department of Energy's (hereafter abbreviated as DOE) lists
“Limited access to transmission infrastructure” as the first limiting barrier to
expansion (Geothermal Technologies Program, n.d., p. 31). Since geothermal
energy sources are often located in remote areas, it is necessary to transport the
energy generated large distances into major population centers. Technological
improvements that expand the energy grid are therefore required to transport
energy farther and more efficiently.
For a new geothermal site to begin transmission, it requires the
construction of a new series of “...transmission lines [which] would require from
25-240 acres, ranging in length from five to fifty miles with a corridor width of
about forty feet” (Department of Energy (e), n.d.). In some extreme cases the
distances that must be spanned are astronomical. For example, the current
transmission line system that runs from Dixie Valley, Nevada to Bishop,
California, totaling approximately 220 miles (Kagel, 2008, p. 13). The voltage size
of transmission systems can vary considerably as well, depending upon the power
involved; with a low of 60 kilovolts to a high of 230 kilovolts, and a mean of
roughly 100 kilovolts (Kagel, 2008, p. 13).
Longer transmission lines result in an increase in funding necessary to
build each geothermal plant. In addition to the requirements necessary for
construction, a study performed by the Bonneville Power Administration and the
Northwest Gas Association, indicated that the average annual cost of
maintenance for 100 miles of transmission wire is upwards of $25 million
(Comparing Pipes and Wires, n.d.). While this data was found specifically with
natural gas in mind, the transmission of electricity produced by geothermal

36
energy is practically identical to the electricity produced by the burning of fossil
fuels. According to the DOE, “[g]eothermal resources are generally remote from
load centers, requiring investment in transmission infrastructure, which can lead
to high delivery costs that many not be competitive with conventional
technologies” (Geothermal Technologies Program, n.d., p. 31).
The expansion of electrical grids has environmental impacts upon the
land, but is generally not overly intrusive. These limited impacts are true of both
the environment itself as well as some human commercial activities. Evidence
from the past shows that “...to some extent, land use can revert to its original uses
(e.g., livestock grazing) [after geothermal plant siting, however] many other uses
(e.g., mining, farming, or hunting) would be precluded during the life span of the
geothermal development” (Department of Energy (d), n.d.). The construction of
massive electrical grids also has, as does any construction project upon non-
inhabited land, a negative impact upon the surrounding ecosystem.
Expanding communities closer to geothermal resources holds some
potential as a solution as the United States’ population rapidly expands past the
three hundred million mark. The creation and expansion of cities closer to
geothermal resources makes it possible for geothermal energy to reach a greater
percentage of the population. An added benefit is that, with shorter transmission
distance, this solution effectively cuts into the amount of funds needed to
construct new grids for energy transportation. This efficiency is demonstrated by
the mere two miles required for transmission from the plant at Steamboat Hills
Nevada, to its delivery point on the Sierra Pacific system (Kagel, 2008, p.13).
37
Conclusion
Geothermal energy siting and transmission requirements are similar to
solar energy requirements. The vast amounts of cooling water needed for
geothermal energy plants creates difficulties in geothermal energy generation,
especially as most geothermal plants are found in deserts. In addition, while a
few hundred jobs are generated during the construction of a geothermal energy
plant, roughly a dozen long-term workers are needed for maintenance of a
geothermal plant once it has been constructed. Land requirements for
geothermal energy are somewhat less restricting than those for wind and solar
energy, but the specificity of location for geothermal plants i.e. the geothermal
plant must be built in a location where geothermal fluid is generated, means that
there are very few locations where construction of geothermal plants can occur.
38
Hydroelectric Energy Resource Requirements
The replenishing nature of water has led to its development as a power
source dating back thousands of years (History of Hydro, n.d.). Coincidentally, it
was this same characteristic which inspired thinkers of the 1800’s to tap into
running water as an unlimited source of fuel. Hydropower statistics shine
favorably on these technologies through revealing that sixty-five percent of all
renewable energy within the United States is generated through hydroelectric
power plants (Why Hydro, n.d). It is interesting to note however, that while
hydropower plants are almost guaranteed an unrestricted amount of fuel (water)
for their efforts, the hydropower industry only represents approximately ten
percent of total energy production within the U.S (Water Power Program: History
of Hydropower, n.d.).
The potential expansion of the hydro industry is illustrated by the fact that
in the United States there is approximately 60,000 MW of potential growth (Faq:
National Hydropower Association, n.d). To put this statistic in perspective, one
megawatt of power has the capability to power 750-1000 different homes (Faq:
National Hydropower Association, n.d.). With such high potential for further
growth, the perpetuity of water, and the benefits of reduced greenhouse gasses, it
is natural to expect endeavors to increase in the area of hydropower expansion.
Such an increase however, requires involved parties to take a closer look into
several key areas needed for implementing hydroelectric power plants: land,
water, employee requirements, as well as transmission needs.
39
Siting Requirements
Large Hydro
There are three different types of hydropower plants. This distinction is
necessary because each require different amounts/types of land. Definitions vary
according to source; however, the U.S. Department of Energy has defined each
type of hydropower according to energy output (Water Power Program: types of
hydropower plants, n.d.). The first type of plant is large hydropower, which is
any plant that generates more than 30 megawatts (water power program: types of
hydropower plants, n.d.). If one megawatt is able to power 750-1000 households,
30 megawatts has the potential to power 22,500-30,000 average households.
Large hydroelectric plants not only require a decent portion of land, but also
require large amounts of water and employees to operate/maintain machinery.
Large areas of land are needed for large hydro systems, not only for the plant
itself, but also for roadways, transmission lines, and any additional surrounding
facilities.
Land
Although large hydro plants have the capability to supply energy to
millions of people, there is only minimal potential for furthering large hydro
systems in the U.S. because the majority of suitable areas have already been
developed. Most large hydropower systems take the form of an impoundment
facility, where large amounts of water are stored and then gradually released to
cultivate energy. Due to limited land availability, the future of large hydro in the
United States is restricted to improving existing facilities. In looking at the
40
development of these impoundment facilities, there is a clear need for vast
amounts of land, although there is no ‘blanket’ statistic that adequately covers the
average land needed to cite a large hydroelectric facility. Different terrain and
river depths, along with varying river widths, create different land requirements
for each project.
To gain further insight into the diverse area needs of large hydro projects,
it is helpful to compare two of the largest plants within the United States: the
Grand Coulee dam and the Hoover dam. The Washington Grand Coulee dam
located on the Columbia River, has a generating capacity of almost 6,809MW
while the Hoover dam in Nevada follows behind with a generating capacity of
2,078MW (Grand Coulee Dam Statistics and Facts, n.d.). Each dam is
monumental, with the Grand Coulee even being labeled as one of the modern
wonders of the world (Grand Coulee Dam Statistics and Facts, n.d.). However, to
display the vast differences in land requirements, insight is gained from looking
into the size of the reservoirs created; keeping in mind that much more land is
needed for the structure itself, as well as means for transmitting the energy
generated.
The Grand Coulee reservoir (Lake Roosevelt) covers approximately 82,300
acres of land in comparison to the Hoover dam, which holds back waters
spanning across 157,900 acres (Grand Coulee Dam Statistics and Facts, n.d.;
Hoover dam, n.d.). One would think that as the amount of water increases, the
more energy output would increase; however, this is not the case with these two
as the Grand Coulee generates a much higher amount of electricity. Most
examples of large hydro plants follow the patterns of these two dams, in the fact
41
that many different qualities (terrain and river characteristics) affect land use and
ultimately, energy output. As the Colorado River travels through the canyon
leading up to the Hoover dam, canyon walls act as additional barriers and
streamline the body of water (minimizing the flooding of nearby
lands).Conversely, the Columbia River does not have these natural barriers,
therefore the water spreads and greater land purchases are needed to contain the
impounded waters.
Land requirements for large hydro projects vary in size dependent on the
type of land as well as the size of the river. Those developing such large facilities
require Congressional approval, for the placement of a dam, followed by an
assessment from an engineering team to determine the dam’s actual size (FERC:
Off-Limits Sites, n.d.; River Operations Office: Tennessee Valley Authority,
Phone Interview, 2012). However, most of the potential for large hydro projects
within the United States has already been exhausted, making the future of
hydropower in the U.S. likely to be in the form of smaller hydro projects
(Hydroelectric power and water use, n.d.). The availability of lands with adequate
characteristics for large hydro systems is scarce, limiting further developments to
simply improving existing facilities.
Water and Employees
The number of employees needed to implement a hydro facility varies
according to project size. After construction is complete, the minimum amount of
workers required also varies according to size dimensions and energy output.
One example of worker requirements is found in looking at the Hoover dam:
where “A total of 21,000 men worked on the dam with an average of 3,500 and a
42
maximum of 5,218 daily” during construction in the 1930’s (Bureau of
Reclamation: Lower Colorado Region - Hoover Dam FAQs, n.d.) As expected, the
number of workers required for construction would be much greater than those
needed for daily operations; however, due to security concerns the number of
daily required operators is unavailable (Hoover Dam, Visitors Center, Phone
Interview, 2012).
Finding an adequate amount of water needed to generate 30 MW or more
is made complicated by fluctuating river capacities, as well as the speed of their
currents. Enormous amounts of water are necessary for large hydro projects;
however, these amounts vary according to each facility. In the case of the Hoover
Dam, there are four penstocks capable of holding 96,000 gallons of water per
second (Hoover Dam, Visitors Center, Phone Interview, 2012). Oftentimes, as
shown by the Hoover Dam, a general capacity can be given but the amount of
actual water running through on a daily basis is less clear as amounts fluctuate
depending on downstream community water needs (Hoover Dam, Visitors
Center, Phone Interview, 2012).
Small Hydro
Small hydro refers to hydroelectric systems that produce less than 30 MW.
Some agencies classify mini and micro hydro systems in the larger category of
small hydro, but for the sake of consistency emphasis will be placed on the
Department of Energy’s plant-type classifications to limit confusion (Hydropower
Program: Types of Hydropower Plants, n.d.). Small hydropower holds many
advantages over large-scale hydropower. It combines “the advantages of
hydropower with those of decentralized power generation without the
43
disadvantages of large-scale installations” (Hydropower Basic: Introduction,
n.d.). According to Jon Wellinghoff, the chairman of the Federal Energy
Regulatory Commission, "Efforts to reduce carbon emissions and meet the
growing number of state renewable energy standards are drawing increased
attention to small hydropower project development” (FERC: News Release:
FERC looks to ease development of small hydropower projects, 2010).
Siting Requirements
Land
Similarly to large hydro, the land requirements for citing small hydro
projects are very diverse, but for separate reasons. It is true that smaller facilities
are also reliant on terrain and river characteristics to determine the land
required; but small hydro carries even greater variety in the implementation of
such systems. There are many ways to go about creating smaller systems, which
can take place as small dams, irrigation pipes connected to turbines, or a series of
iconic waterwheels (Riverbank Power: Utah Office, Phone Interview, 2012).
These many different systems, classified as small hydro, cause the land
requirement to vary for each. One example of a small hydro project is the system
implemented in Afton Wyoming which generates $95,435 worth of electricity
(DWSRF ARRA Success Story, n.d.). The initial land asked for to run the
profitable operation was 10.5 acres, a significant difference compared with the
thousands used by large hydro systems (Federal Register/Vol. 73, No. 248,
2008).
44
Water and Employees
Areas where small hydro is applicable include: small industries, farms or
households, and rural communities. These are all decentralized locations with
small demand for power (Hydropower Basic: Introduction, n.d.). Generally, small
hydro utilizes low head sites. In this context, head refers to the distance the water
falls before impacting the turbine. For small hydro, the elevation difference is less
than five meters (fifteen feet). These types of systems often rely on run-of-river
hydropower facilities that utilize the natural flow of stream and rivers. These
facilities do not require large dams or reservoirs but some do have a small dam
that simply keeps the impounded waters within the river’s banks. Therefore, a
natural flow of water continues over the dam.
Small hydro does not have near the costs for energy distribution or to the
environment in comparison with large hydro projects. Generally, daily operations
are automatic and small hydro facilities require once-weekly maintenance visits
to secure that everything is working correctly (Low-Head Hydropower Operation:
Resource Requirements and Impact Sources, n.d.). The low operating need cuts
employee costs dramatically and makes small hydro even more economically
feasible.
Increased use of small hydro projects is expected due to their minimal
environmental impact on both land and in the waters they use. Many different
options are available to developers looking to implement small hydro systems,
with some being as simple as an irrigation pipe leading to a turbine (Riverbank
Power:Utah Office, Phone Interview, 2012). The number of hydroelectric systems
is expected to rise, thus providing greater energy independence while generating
45
profits. In 2006 the Idaho National Laboratory assessed 100,000 sites
throughout the United States for small hydro capability and determined that
approximately 5,400 had potential. The U.S. Department of Energy
approximated that if these projects were developed, they would result in more
than a 50% increase in total hydroelectricity generation (Campbell, 2010;
Feasibility Assessment of Water Energy Resources, n.d.). With this supposed
increase of hydroelectric power plants, the dependence the country has on
conventional energy such as coal and oil would be decreased dramatically.
Micro Hydro
Micro systems are the smallest classification of hydroelectric power
according to the Department of Energy (Water Power Program: types of
hydropower plants, n.d.). With an energy supply of 100KW or less these systems
are not expected to be a major priority for developers. Similarly to small hydro,
micro hydropower on this small of a scale is used to power homes, villages, or
other small properties, but on a lesser scale (Water Power Program: types of
hydropower plants, n.d.). To exemplify the land used by micro systems, it is
helpful to look to the lands used by small hydro facilities and realize that micro
systems use even less.
The small hydropower system in Afton, Wyoming started out as a
community project to tap into the forces behind the town’s culinary water supply
(Riverbank Power: Utah Office, Phone Interview, 2012). The original land
requested for the project was 10.5 acres of land (DWSRF ARRA Success Story,
n.d.). Because Micro hydroelectric systems generate even less energy, it is easily
anticipated that micro systems require even smaller portions of land. Some
46
systems are so simple and small they can even be purchased online and
transported to homes across the country and fit within 15 square feet (Energy
Systems and Design, n.d.).
Micro hydro is generally used to provide power in remote areas by utilizing
water resources available at a specific site. These systems generally use run-of-
river systems and therefore do not require a dam. Consequently, they are
dependent on the flow available which often varies with the seasons. Run-of-river
systems consist of an intake structure which channels water through a pipe or
conduit down to the turbines before the water is set free downstream. A
generator or alternator controls the speed of the turbine. Generally, at least three
feet of head is required with a water flow of approximately twenty gallons per
minute to run the turbine efficiently (Campbell, 2010). In addition, no full-time
employees are needed but a once a week maintenance visit is suggested (Low-
Head Hydropower Operation: Resource Requirements and Impact Sources, n.d.).
Transmission Requirements
The current state of large hydro, along with the growing interest in small
hydro systems generates an increased need to focus on the transmission
requirements to maintain and create these facilities. With advancing
technologies, and growing contributions to the electrical grid from multiple
renewable sources, hydroelectric developers need to keep transmission in mind
when considering implementing new facilities.
In all hydro facilities, volumes of water flow and elevation differences,
known as “head,” determine the amount of electricity produced. The produced
power can be utilized locally or carried through transmission lines to industrial or
47
metropolitan areas (Campbell, 2010). As has been previously expressed, there is
great diversity in the implementation of hydroelectric projects, which means that
there is also some diversity in the ways energy is transmitted from those projects
(dependent on the project size). Some projects may require very basic
transmission systems, while others may require more complex systems
dependent on the accessibility or location of the hydroelectric plant.
Hydro-Quebec TransEnergie “…operates the most extensive transmission
system in North America,” and is located in Quebec (TransÉnergie Hydro-Québec,
n.d.). Their systems include 33,630 km of transmission lines, which have
10,850MW of import capacity and 7,994MW of export capacity. The complex
manages this large amount of power through its 514 substations (TransÉnergie
Hydro-Québec, n.d.). This impressive and complex system generates power for
both Quebec and parts of the Northeastern United States (TransÉnergie- Hydro-
Québec. Transmission System Overview, n.d). Although this particular example is
rather large, it is similar to smaller transmissions, which follow the same pattern.
The energy process begins at the project site where the flowing water is
converted into energy, usually through the use of turbines. For large systems, like
the one operated by Hydro-Quebec TransEnergie, such large amounts of energy
are generated that this power must first be converted into smaller amounts
before being transmitted to the electrical grid. This conversion to manageable
amounts takes place within substations, whose purpose is to “reduce its voltage,
and route it [to] the area surrounding it.” (Willis, 1997). Transmission lines are
then connected to these substations and are directly connected to the electrical
48
grid (Manitoba Hydro, Transmission Line Design Section, Phone Interview
2012).
Transmission requires many different kinds of employees for large
systems, where engineers, system control managers, and linesman all play an
active role. Another Canadian hydropower company, Manitoba Hydro, employs
an approximate total of 6,500 workers. Of these 6,500, approximately 1,250 deal
directly with operating and maintaining the many transmission lines which
spread throughout Canada and the Northern United States (Manitoba Hydro,
H.R. Department, Phone Interview, 2012).
Hydropower is desirable “due primarily to the fact that once a facility has
been built it is one of the least expensive sources of electricity to operate”
(Campbell, 2010). Unlike other mainstream electricity sources, hydroelectricity
requires no fuel costs; however, dam maintenance is a significant ongoing cost
(Campbell, 2010). This cost includes the transmission of electricity as well as
water storage for flood control, irrigation, and recreational activities (Campbell,
2010). Hydroelectric facilities have a significant initial cost; however, this cost is
arguably worth it when considering the cost of maintenance compared with the
profit generated. Transmission lines are required for hydroelectric projects due to
the fact that many hydro facilities are in rural areas and need a means of
transmitting energy generated. Land and material needs for the implementation
of transmission systems vary based on the size of each plant and the amount of
energy generated.
49
Conclusion
While large hydroelectric plants require the largest amount of land, water,
and employees for siting and transmission of all renewable energy examined in
this study, the potential of large hydro plants in the United States has largely
been exhausted. Because of this, any expansion of hydroelectric energy will likely
come in the form of small and micro hydro projects. For both of these, a weekly
check-up is all that is required for maintenance of the plant. In addition, a water
elevation “head” is required for both to ensure proper energy generation.
50
Oil Shale Energy Resources
Oil shale, sometimes called kerogen shale, is a sedimentary rock that
contains organic matter. Oil is extracted from liquid hydrocarbons within the
kerogen, which is part of the organic matter within the rock. The oil is extracted
through a process called ‘retorting’, where the rock is heated to approximately
700 degrees Fahrenheit in an oxygen-free environment. This heat encourages the
kerogen to expel the oil, releasing approximately three quarters of the rock’s total
oil content. There are two different methods of retorting—surface retorting and
situ retorting. Yield percentages vary slightly, depending upon the specific
physical characteristics of the rock.
Oil shale popularity began in the 1970’s during the oil crisis. The new
means of power and technology were considered the savior of the industry,
however after oil prices fell back down to a more standard normality, oil shale
was forgotten and was not developed further. Recently markets have pushed for
more oil drilling in the U.S., and the probability of gas and oil prices decreasing
are not as likely to happen within the near future, or at least not as dramatic to
have a major impact. Oil shale is becoming more widely recognized as an
alternative, especially with the quantity that the United States has available. The
following represents the process and requirements necessary for the production
of oil shale.
Where Oil Shale is Found
Over half of the world’s known deposits of oil shale are located within the
United States. These deposits are centralized in the West, appearing in Colorado,
Utah and Wyoming. A majority of this shale, 72 percent, is located on federally-
51
owned lands within a 16,000 square mile area that the three states share. The
Bureau of Land Management (BLM) estimates that these deposits contain 2.6
trillion barrels of in-place oil and 1.5 trillion barrels of oil that is recoverable. The
grade quality of oil derived from shale varies, depending upon the location and
nature of the shale. On average, a ton of shale will yield 15 gallons of oil (BLM,
2012). In order for oil shale to be a reliable resource on a large scale, a great deal
of land must be used.
Siting Requirements
The siting of oil shale projects is primarily dependent upon regulations
imposed by the Environmental Protection Agency. Fortunately for the industry,
the process of extracting oil shale produces a relatively small amount of pollution.
As a result, the practice receives a certain level of protection under the Clean Air
Act’s Prevention of Significant Deterioration provisions (Center of the American
West, 2008). These provisions outline the requirements that classify oil shale
sites, based on the air quality of the region and the designation of lands in close
proximity to the site.
There are two levels of classification in the Clean Air Act for oil shale
sites—Class I and Class II. The bulk of existing sites are categorized as Class II,
the more lenient of the designations, which permits moderate levels of ambient
air pollution in the area. Class I areas are held to a greater standard of air quality
because of their close proximity to sensitive, protected lands such as national
parks and monuments and areas designated as wilderness (Center of the
American West, 2008). To date, there are ten Class I sites in the U.S., primarily
in Utah but also in Colorado and Wyoming.
52
Land Requirements
Since the specific characteristics of the shale dictate how much oil it will
produce and also determine what grade it will be it is difficult to pin down
precisely how much land is needed to produce a certain amount of shale oil.
Estimates of the presence of oil shale in the Washakie Basin in southwest
Wyoming reveal as much as 8.7 million tons of in-situ oil shale per square
kilometer. In terms of what the shale may actually yield researchers studying
Utah’s Unita Basin have calculated that the land contains 214 billion barrels of oil
shale in an area sized 5,200 kilometers (Trudell et. al., 1983).
Because the bulk of oil shale is located on federally owned land, the land
must be leased in order for extraction operations to take place. The Bureau of
Land Management follows a semi-formal process in granting competitive oil
shale leases, beginning by notifying state and local governments and interested
Indian tribes and inviting comment. The lease applicant must pay a fee before the
application will be considered.
Upon payment, the BLM will publish a notice of competitive lease sale
dated no later than thirty days prior to the proposed sale. In the application, the
applicant must estimate the total surface area of land that will be affected and the
source and quantity of water that will be used in the extraction process. The
maximum size of an oil shale lease is 5,760 acres. While bidding prices vary, the
minimum amount per acre is $1,000. Leases are issued for a period of twenty
years but may continue as long as the annual minimum production is met. Leases
may also endure for as long as payments in lieu of production are received (43
CFR 3920).
53
Water Requirements
Water is a necessary resource used in the process of oil shale recovery. The
Government Accountability Office (GAO) estimates that between four and five
barrels of water are needed to produce one barrel of oil shale (Western Resource
Advocates, 2010). Water is used in several different ways throughout the process.
It is used during drilling and processing procedures and for filling and cooling the
heated interval during reclamation. Water is also used on the construction site at
large, controlling dust and rinsing the zone inside the freeze wall that keeps the
extraction site isolated from seeping groundwater. Potable water is also used to
sustain the construction site.
Recent estimates by the GAO indicate that oil shale developed on a large
scale would require 378,000 acres of feet of water per year. Recognizing that
deposits of oil shale are located in arid, desert areas of the West, the need for
water poses a great challenge to such endeavors. To demonstrate this challenge,
in a water diversion program called the Colorado Big-Thompson project, average
prices per share (0.7 acre feet (860 m3)/share) increased from some $2,000 in
1990 to more than $12,000 in mid-2003 (constant 2001 dollars). The Colorado
Big-Thompson project prices from 2001 to 2006 had a range of $10,000 to
$14,000 per share, or $14,000 to $20,000 per acre foot. At $10,000 per acre
foot, capital costs for water rights to produce 2.5 million barrels per day
(400×103 m3/d) would range between 1.8 to 4.2 billion dollars (Adams, 2004,
p.10-12).
54
Energy Requirements
To measure the energy that oil shale produces we use the energy return on
investment (EROI). EROI is the ratio of energy delivered to energy costs. The
most reliable studies suggest that the EROI for oil shale falls between 1:1 and 2:1
(Cleveland, 2010, p.2). In comparison, shown is also the EROI of conventional
crude oil which is at about 20:1. This places the EROI for oil shale considerably
below the conventional crude oil at the wellhead. This conclusion holds for both
the crude product and refined fuel stages of processing. Even in its depleted
state—smaller and deeper fields, depleted natural drive mechanisms, etc.—
conventional crude oil generates a significantly larger energy surplus than oil
shale (Cleveland, 2010, p.2).
To see how this measurement occurs, the more technical side must be
discussed. The refined fuel delivered is 2333-2475 MJ, or megajoule, per ton of
shale. The energy inputs prior to crude transport are 1309-1638 MJ per ton of
shale. Thus, resource recovery consumes an amount of energy equal to 53-70% of
the energy in the final product. Crude transport, refining, and fuel distribution
consume an additional 231-342 MJ per ton, or 9-15% of the energy in the final
product. Overall, processing requires 62-85% of the energy in the final product;
so production of 100 MJ of oil shale requires inputs of 62-85 MJ along the way.
This gives the overall EROI of 1.2-1.6 (Cleveland, 2010, p.16). What this technical
jargon means is that due to resource recovery, crude transportation, refining, and
fuel distribution of the oil shale, over half of the energy produced is burned in the
process of its creation. That is why the EROI is so low, representing a weak and
costly fuel to produce.
55
Manpower Requirements According to JBR Environmental Consultants, currently there are twenty-
five full time employees in state of Utah employed directly with the oil shale
industry, which estimates an annual payroll of $1,750,000 (Bayer, 2010, p.2).
Those numbers are expected to increase dramatically due to future projects. Both
Brazil and Estonia have oil shale investments in the state of Utah, both with
planned projects, pending on regulatory procedures.
A 2006 endeavor by Shell Company illustrates the manpower necessary to
operate an oil shale project. Shell produced a plan of operation for the Bureau of
Land Management to consider the approval an oil shale test project. They
estimated that to construct a 160-acre in-situ project would require 720 full time
employees. The construction would take up to eighteen to twenty-four months.
After the construction phase is through, only 155 full time employees would be
required (Oil Shale Test Project, 2006, p.4-22).
Transmission Requirements
Once oil shale is in its final form, it is loaded onto trucks and transported
on the highway, limiting transmission costs to the diesel fuel required to power
those trucks and the wages for the employees who drive them.
Conclusion
The amount of water needed for oil shale, while quite a bit larger than the
requirements for wind energy, is less than the amount necessary for geothermal,
solar, and hydroelectric energy. And while oil shale siting land requirements may
exceed solar, geothermal, wind, and small and micro hydro energy land
requirements, the number of employees required is much higher for oil shale site

56
construction and maintenance than for the other types of renewable energy
discussed in this report. Transmission requirements for oil shale are unique in
that they consist solely of costs associated with the transport of oil shale from the
supplier to the seller of the oil shale.
57
Ethanol Resource Requirements Producing ethanol for fuel is an extremely resource intensive process. The
main reason for this is efficiency; it takes 50% more ethanol than gas for the same
energy results. Because this energy source is less efficient than petroleum fuel
sources it also causes more air pollution. Ethanol actually puts more carbon
dioxide into the atmosphere than petroleum when combusted to reach the same
energy output. Other problems result from ethanol’s water and land usage. These
are very limited non-producible resources that ethanol production requires in
huge amounts. We will look at these factors to discuss how ethanol compares as a
fuel source to gasoline.
Fuel Efficiency
A major problem with ethanol as a fuel source is that it takes 1.5 gallons of
ethanol to produce the same amount of energy as one gallon of gasoline (U.S.
Department of Energy n.d.). This inefficiency causes serious problems in all
aspects of its use and production because we must burn 50% more of it in our
engines than gasoline to get the same return. The answer then is to make higher
compression engines that can produce better efficiency. But even if you have a
high efficiency high compression engine, it is still 50% better to use that new
engine with gasoline than with ethanol. This problem becomes the greatest factor
in all the other problems that need to be looked at when using ethanol as a fuel
source instead of gasoline.
Air pollution
The second greatest concern for most people in fuel combustion is air
pollution. Because ethanol is less efficient than gasoline it releases 19% more CO2
58
into the atmosphere to achieve equivalent energy in our engines. Proponents of
ethanol often ignore this difference in efficiency. Instead they cite the fact that
gasoline produces 2.44 kg/l of CO2 when it is combusted while ethanol releases
1.94 kg/l of CO2 when it is combusted. Taken at face value, it appears as though
ethanol is a cleaner fuel source, when in fact it is not due to decreased fuel
efficiency (Bogdan 2009).
An even greater concern for many people like Stanford Professor Dr. Mark
Z. Jacobson, is the release of toxins into the atmosphere, particularly the increase
of ozone from burning ethanol. Ozone is a good thing in the upper atmosphere,
where a layer of it protects us from harmful radiation, but at ground level it is a
serious health concern when we are exposed to it for long periods of time or in
high quantities. This increase, especially in cities with many cars, can increase
0zone related deaths, hospitalization, and asthma (Jacobsen 2007).
Another surprising effect of growing our fuel is the release of Green House
Gases (GHG). GHG are stored in soil when organic material is trapped under the
earth (Soil Science Society of America n.d.). As new land is cleared for ethanol
production, GHG, mainly carbon, is emitted into the atmosphere. As we increase
demand for ethanol, farmers clear new land to grow more crops. Researchers like
Timothy Searchinger at Princeton University and scientist Joseph Fargione at the
Nature Conservancy explain how these Green House Gasses are released (2008).
Fargione warns that the gases released from clearing new land are ninety three
times greater than the gases saved by the fuel made annually on the same new
land (Rosenthal 2008).
59
The amount of GHG trapped under the soil depends greatly on the type of
land. Arid desolate land such as the Sahara desert has very little organic material
trapped in it because very little organic material can grow there. The majority of
land that can effectively be converted to farmland is grassland, forest, and
wetland. While grassland traps the least organic material in the soil of the three,
it is still a significant bank for carbon storage. Forestland is next just a little less
effective than wetlands for trapping organic material under the ground because
wetlands trap more organic material under water keeping the plants from normal
decay. Any of these three have the possibility to collect enough organic material
to form peat. Peat is one of the most effective ways to store carbon in the earth.
Given enough pressure heat and time it will become coal. When we clear new
land that has trapped organic matter in it to grow crops, the GHG that was
trapped is now brought to the surface with soil preparation techniques such as
tilling and plowing and released into the atmosphere.
Water and Land Usage
Increasing the demand for growing crops such as corn and sugar cane
increases the need for fresh water to grow them. This is a major concern in many
places where we already have water shortages, and can create water shortages in
places where new crops are grown. There are two major crops currently being
used to produce the vast majority of the ethanol being used, corn and sugar cane.
Corn produces 321 gallons per acre, while sugar cane produces 727 gallons per
acre (Brazil Institute 2007). Using the data from 2011 regarding yearly motor fuel
consumption energy we find that the US would need as much as
207,736,830,000 gallons of ethanol to completely replace petroleum as a fuel
60
source (assuming we could do a full conversion from gasoline), (U.S Energy
Information Administration 2011). In the last census, 922,095,840 acres or
40.8% of the country was farmland (United States Department of Agriculture
2007). Taking the best case scenario, if the United States were to produce 727
gallons per acre, we would need to convert 31% of our farmland to ethanol
production to fuel our cars.
The loss of this land from its current use to produce food would increase
the price of foodstuffs drastically (ICTSD 2011). It would also force the expansion
of our farmland to try to cover the new demand. This transition could result in a
greater dependency on imported food. Not only would the costs go up, but we
would have even less control over food prices. A much worse problem though is
the quality of food we would be consuming. Deadly dog food from China, (Lisa
Paddock n.d.) mutant E. coli found in Germany, (B.B.C 2011) and salmonella
poisoned Papayas from Mexico (Fair Warning 2011) are just a few examples of
problems resulting from imported food. The simple fact is that the less control
and fewer inspectors we have during the cultivation, processing, and
transportation process, the greater the risk is of contaminated food making it into
the market.
The problem is compounded, however, because these numbers are much
better than logic dictates. Much of the United States is unsuitable for sugar cane
production, leaving us with corn as the other currently used alternative, which is
less than half as efficient in the production of ethanol. In addition, the oil we use
for our motor gas consumption is less than half of the total oil we use in our day
to day lives (U.S Energy Information Administration 2011).
61
Energy Returned on Energy Invested
There are several factors that must be addressed when looking at ethanol
as a fuel source. Regardless of the type of biofuel being produced there are basic
costs associated with their production. Seeds must be bought or saved from
previous growing seasons. Irrigation canals, pipes, pumps, gates, regulators, and
sprinklers are used in many fields. Tractors of various sizes and capabilities must
have fuel and maintenance to pull plows, discs, harrows, tillers, levelers,
cultivators, planters, fertilizer spreaders, insecticide sprayers, reapers, combines
and finally trailers full of the final products. The many trips to, through, and from
the fields also must be noted in the accounting. When the product is finally
harvested it then must be sent to the distillery to be converted to ethanol.
After the product is distilled into fuel grade ethanol there is the final cost
of transporting it to distributor. Through all of these steps there is also the cost of
labor. National Geographic has concluded that for every acre of corn converted to
ethanol there is a ratio of 1 unit energy put into that acre to receive 1.3 units in
return. The return on sugar cane, however, is much higher. In Brazil the ratio is
increased to 8 units of return for every single unit of energy used to create the
fuel (Joel K. Bourne, Jr. 2007). Unfortunately the climate and water enjoyed in
Brazil is found in very few regions of the United States; leaving corn as the option
for mass ethanol production in the U.S.
Conclusion
When compared to traditional fossil fuels, ethanol is less efficient and
causes more air pollution. In addition, the amount of land and water needed for
the production of ethanol is much higher in the United States than in Brazil, a
62
major producer of ethanol. A comparison of costs associated with the
development and production of ethanol indicates that the amount of energy
returned on energy invested is roughly six times higher in Brazil than in the
United States. A key reason for this is that sugar cane, the main source of ethanol
in Brazil, produces more ethanol than corn does, the main source of ethanol in
the United States. Because of climatic differences, however, the United States
cannot switch from mass corn production to mass sugar cane production.
Because of this, Brazil has a distinct comparative advantage over the United
States in the production of ethanol.
63
Biodiesel Resource Requirements
Biodiesel is an organic source replacement fuel for petroleum diesel. Use
can be problematic in low temperatures common in the US in winter, as at low
temperatures it forms wax crystals which can clog fuel lines and filters. “The
‘cloud point’ is the temperature at which a sample of the fuel starts to appear
cloudy, indicating that wax crystals have begun to form” (Radich, n.d.). At even
lower temperatures, it becomes a gel which cannot be pumped. “The “pour point”
is the temperature below which the fuel will not flow” (Radich, n.d.). Energy
efficiency is another problem; the volumetric efficiency (expressed as miles per
gallon) is approximately 11 percent lower than that of petroleum diesel. A vehicle
running on B20 (the most common blend) are expected to see a 2.2 percent (20
percent blended x 11 percent fuel economy reduction) reduction in miles per
gallon of fuel (Radich, n.d.).
Many processes can produce Biodiesel, but there are two most commonly
used. The first involves converting vegetable oils or fats to fatty acids, which are
then converted to esters. Alternatively, oils or fats can be converted directly to
methyl or ethyl esters, using a catalyst to accelerate the reaction (this is referred
to as transesterification. Most commonly, the catalyst used is sodium hydroxide
(lye), and the reaction is done with methanol. The process produces methyl esters
and glycerin (Radich, n.d.). Ethanol can be substituted for methanol, but is
generally not because the cost is higher.
Siting Requirements
Barriers to siting a biodiesel refinery are similar to those faced by any fuel
refinery. Given the emissions and volatile nature of any combustible fuel, citizens
64
are generally resistant to any site in close proximity to residences. Furthermore,
the Clean Air Act governs operations and registration with the Environmental
Protection Agency (EPA) (under 40 CFR parts 79 and 80) to ensure compliance
with fuel and emissions standards (Guidance for Biodiesel Producers and
Biodiesel Blenders/Users (Guidance), 2007). Properties of the fuel produced are
also subject to registration with the EPA and must comply with the standards of
ASTM D 6751, or the fuel is considered an unregistered fuel and the company is
subject to daily civil penalties (Guidance, 2007).
Numerous other factors influence the siting of a biodiesel refinery
including distance from feedstocks, proximity to transportation routes, and
accessibility to a power source. These last three are more factors of profitability
that influence preferable locations for siting, rather than requirements for doing
so. Often both Federal and State required permits must be obtained for
compliance with air, water, emissions, fire safety, and (for operations) workforce
safety and other regulations. These applications for permits generally take time,
and often must be completed and approved before any construction can
commence.
Feedstock costs make up 50-60 percent of the operational cost of a typical
biofuel facility (Sabrsula, 2007). Utility costs are the next largest factor (20-30
percent), including natural gas and water (Sabrsula, 2007). These factors
influence profitablitity of a production facility, and availability can determine
choice of siting. In general, sites are chosen to minimize the distance from
feedstock supplies, and distance from major markets (Sabrsula, 2007).
Requirements for land vary with the size of the facility being considered. A typical
65
ethanol plant (comparable to a biodiesel facility) will require 40-80 acres, but
some smaller companies have reported sites as small as 10 acres (Sabrsula,
2007). Extremely large production facilities, capable of producing 100 million
gallons per year of ethanol (comparable to biodiesel production) require up to
160 acres (trade). Price per acre of land varies across the US. Proximity to rail
lines and major road routes also strongly influence selection and profitability of
sites (Sabrsula, 2007).
Federal and state incentives and regulations can also have a strong
influence on site selection, affecting tax incentives, start-up costs (in the form of
grants), and legalities involved in citing (Sabrsula, 2007). Local communities
concerns also affect choice of siting, through effects of noise, light, sound, dust,
air, and odors on local communities (Sabrsula, 2007).
Soybeans require specific soil type, temperature, and sunlight to grow
efficiently. In general, loose soil, a minimum of 55 degrees, and 3-5 months
growing season are recommended (National Soybean Research Laboratory
(NSRL), n.d.). These requirements are not particularly prohibitive for most
potential farming areas, and are not significantly different than that of most other
plant types. US average yield in 2010 was estimated at 43.5 bushels per acre, with
77.4 million acres planted, yielding 3.33 billion bushels (U.S. Growers Produce
Abundant Crops in 2010 (U.S. Growers), 2011). As with any commodity good, the
price of soybeans varies; the price for one bushel (at 10 am on April 30, 2012) was
1363.75 cents per bushel (Soybeans Prices, Grain Prices, n.d.).
In addition to the feedstock costs, the National Renewable Energy
Laboratories estimated a cost of 31 cents per gallon (in 2002 cents) (Radich,
66
n.d.). Some costs (15 cents per gallon) are recuperated by sale of glycerol (a
byproduct of the production process). The production process also uses .083
kilowatt-hours of electricity, and 38,300 Btus of natural gas per gallon (Radich,
n.d.). Costs of these inputs were estimated (in 2002 cents) at 18 cents per gallon
in 2004, and 16 cents in 2005 and 2006 (Radich, n.d.). Capital costs for a new
biodiesel plant are estimated at 13.6 cents per gallon at full output (2002 cents)
(Radich, n.d.).
This yields a set of estimated production costs (in 2002 dollars) for 2012 of
$2.80 per gallon of soybean oil, $1.55 per gallon for yellow grease diesel,
compared to $0.75 per gallon of petroleum (Radich, n.d.). Subsidies (in the form
of tax credits, blending credits, and grants), reduce the effective producer cost per
gallon. These tax and transfers are, however, borne by the public and create an
effective transfer from non-biodiesel using citizens to those who produce and use
biodiesel. According to the AFDC, the average nationwide price of B20 in January
of 2012 was $3.95 per gallon, while B100 was $4.20 per gallon (in 2012 dollars)
(EERE, n.d.). This reflects the “at-the pump” price, with the effects of subsidies
already incorporated. If the subsidies are removed, this implies the true price per
gallon is approximately $1 per gallon higher ($4.95 for B20, $5.20 for B100), as
compared to the price of petro diesel of $3.86 per gallon.
With efficiency accounted for (percent biodiesel x 11% reduction in fuel
economy) comparisons for true cost to the consumer can be more accurately
reported.
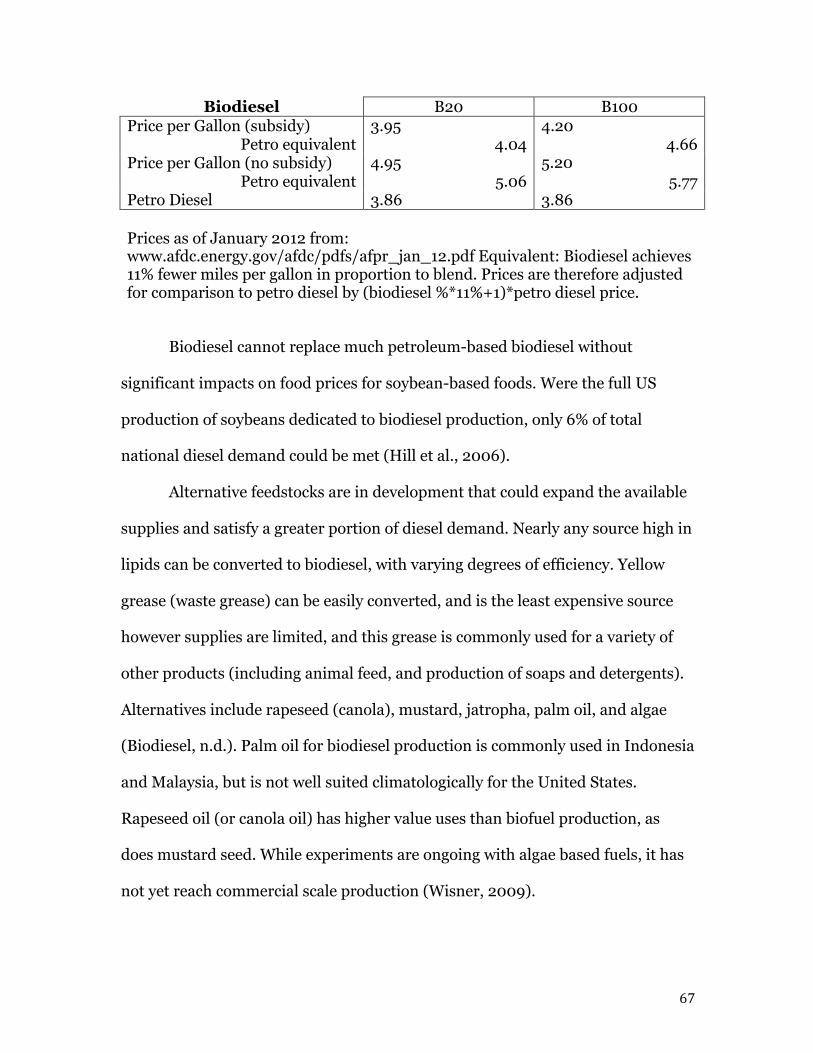
67
Biodiesel B20 B100 Price per Gallon (subsidy) 3.95 4.20
Petro equivalent 4.04 4.66 Price per Gallon (no subsidy) 4.95 5.20
Petro equivalent 5.06 5.77 Petro Diesel 3.86 3.86
Prices as of January 2012 from: www.afdc.energy.gov/afdc/pdfs/afpr_jan_12.pdf Equivalent: Biodiesel achieves 11% fewer miles per gallon in proportion to blend. Prices are therefore adjusted for comparison to petro diesel by (biodiesel %*11%+1)*petro diesel price.
Biodiesel cannot replace much petroleum-based biodiesel without
significant impacts on food prices for soybean-based foods. Were the full US
production of soybeans dedicated to biodiesel production, only 6% of total
national diesel demand could be met (Hill et al., 2006).
Alternative feedstocks are in development that could expand the available
supplies and satisfy a greater portion of diesel demand. Nearly any source high in
lipids can be converted to biodiesel, with varying degrees of efficiency. Yellow
grease (waste grease) can be easily converted, and is the least expensive source
however supplies are limited, and this grease is commonly used for a variety of
other products (including animal feed, and production of soaps and detergents).
Alternatives include rapeseed (canola), mustard, jatropha, palm oil, and algae
(Biodiesel, n.d.). Palm oil for biodiesel production is commonly used in Indonesia
and Malaysia, but is not well suited climatologically for the United States.
Rapeseed oil (or canola oil) has higher value uses than biofuel production, as
does mustard seed. While experiments are ongoing with algae based fuels, it has
not yet reach commercial scale production (Wisner, 2009).
68
Subsidies
Before December 31, 2009, blender tax credits allowed biodiesel blenders
to claim a tax credit against the Federal motor fuels excise tax if a batch of diesel
fuel contains biodiesel (Radich, n.d.) For biodiesel sourced from virgin oil (such
as soybean oil) the credit allowed was $1 per gallon of biodiesel (Radich, n.d.).
Use of yellow grease sourced biodiesel allowed a tax credit of 50 cents per gallon
(Radich, n.d.). This tax credit was effectively a tax and transfer system, allowing
credits for producers (and users, in effect) which came at a cost to the remainder
of the US taxpayers. The “no subsidy” cost reflected in the following chart reflects
the price of biodiesel with the $1 tax credit removed. Even with the subsidy in
effect, the price per gallon of biodiesel is 9 cents higher than the price of
petroleum based diesel. When the reduced efficiency of biodiesel (as compared to
petro diesel) is accounted for, the cost is even higher; to adjust for the 11 percent
reduction in efficiency, the percentage mix of biodiesel is multiplied by the 11
percent reduction in efficiency (Radich, n.d.). This yields the effective cost in
biodiesel to achieve the same effect as a gallon of petro diesel.
The lapse of the biodiesel tax incentive (December 31, 2009) revealed the
fundamentally higher production cost of biodiesel, when a 42% drop in
production was observed for the 2010 year (Wisner, 2009). Upon
reimplementation of the credit in December 2010, production expanded again.
Conclusion Barriers to siting a biodiesel refinery include regulatory demands, citizen
resistance, and various other factors including distance from feedstocks,
proximity to transportation routes, and accessibility to a power source. These

69
factors influence profitability of a production facility, and availability can
determine siting choice. The major source of biodiesel in the United States is
soybeans; however, the plant requires specific soil type, temperature, and
sunlight to grow efficiently. In addition, biodiesel cannot replace a large portion
of petroleum-based biodiesel without significant impacts on food prices for
soybean-based foods Alternative feedstocks, including rapeseed (canola),
mustard, jatropha, palm oil, and algae, can be used, but with lesser degrees of
efficiency. Federal and state incentives, regulations, and subsidies can also have a
strong influence on biodiesel site selection and production.
70
References
Adams, J., Crews, D., and Cummings, R. (2004, April). “The Sale and Leasing of Water Rights in Western States.” North Georgia Water Planning and Policy Center, Georgia State University, Andrew Young School of Policy Studies. Retrieved from http://www2.gsu.edu/~wwwenv/waterPDF/W2004004.pdf.
Bayer, R. J. (2010). “People the Environment, and Oil Shale: Opportunities and
Challenges for Utah.” JBR Environmental Consultants. Retrieved from http://www.energy.utah.gov/media/energysummit/docs/2012/Mar/Shale6BobBayer.pdf.
Bureau of Land Management. (2012). “Oil Shale Description”. Retrieved April 13,
2012, from http://www.blm.gov/wy/st/en/field_offices/Rock_Springs/minerals/oil_shale.print.html.
Center of the American West. (2008). University of Colorado at Boulder.
Retrieved from http://www.centerwest.org/publications/oilshale/5managing/5air.php.
Cleveland, J., and O’Connor, P. (2010, June). “An Assessment of the Energy
Return on Investment (EROI) of Oil Shale.” Western Resource Advocates. Retrieved from http://www.westernresourceadvocates.org/land/pdf/oseroireport.pdf.
Electronic Code of Federal Regulations (n.d.). GPO Home Page. Retrieved April
12, 2012, from http://ecfr.gpoaccess.gov/cgi/t/text/text-idx?c=ecfr&rgn=div5&view=text&node=43:2.1.1.4.90&idno=43#43:2.1.1.4.90.1.180.1
“Oil Shell Test Project.” (2006, February 15). Plan of Operations. Shell Frontier
Oil and Gas Inc. Retrieved from http://www.blm.gov/pgdata/etc/medialib/blm/co/field_offices/white_river_field/oil_shale.Par.79837.File.dat/OSTPlanofOperations.pdf.
“Oil Shale Triple Threat”. (2010). Western Resource Advocates. Retrieved from
http://www.oilshalefacts.org/background/fact-sheets/oil-shales-triple-threat.pdf.
Trudell, L.G., Smith, J.W., Beard, T.N., and Mason, G.M. (1983). “Primary oil-
shale resources of the Green River Formation in the eastern Uinta Basin”. Department of Energy Laramie Energy Technology Center. Retrieved from http://pubs.usgs.gov/sir/2005/5294/pdf/sir5294_508.pdf.
Brazil Institute. April 2007. “The Global Dynamics of Biofuels.” Accessed April 1
2012. http://www.wilsoncenter.org/sites/default/files/Brazil_SR_e3.pdf.
71
Bruce B.A. (2011, June). “The Impact of US Biofuel Policies on Agricultural Price
Levels and Volatility.” International Centre for Trade and Sustainable Development. Accessed April 1 2012. http://ictsd.org/downloads/2011/12/the-impact-of-us-biofuel-policies-on-agricultural-price-levels-and-volatility.pdf.
Bogdan P. (2009). “Emissions: Gasoline vs. Diesel vs. Bioethanol.” Auto
Evolution. Accessed April 1 2012. http://www.autoevolution.com/news/emissions-gasoline-vs-diesel-vs-bioethanol-3657.html.
Elisabeth R. (2008, February 8,). “Biofuels Deemed a Greenhouse Threat.” The
New York Times. Accessed April 1 2012. http://www.nytimes.com/2008/02/08/science/earth/08wbiofuels.html?_r=1&em&ex=1202792400&en=b90a6c6cca379cde&ei=5087%0A.
Fair Warning. (2011, August 26). “Mexican Papaya Imports Halted Due to
Salmonella.” Accessed April 1 2012. http://www.fairwarning.org/2011/08/mexican-papaya-imports-halted-due-to-salmonella/.
Lisa P. (n.d.) “FDA Recalls Deadly Pet Food.” Salem Press Accessed on April 1
2012. http://salempress.com/store/samples/great_events_from_history_scandals/gefh_scandals_fda.htm.
Mark J.Z. (2007, March 14) “Effects of Ethanol (E85) versus Gasoline Vehicles on
Cancer and Mortality in the United States.” Accessed April 1 2012. http://www.stanford.edu/group/efmh/jacobson/Articles/I/es062085v.pdf.
Soil Science Society of America. (n.d.) “Why soil is important.” Accessed April 1
2012. http://www.envirothon.org/pdf/CG/Why_Soil_is_Important.pdf.
United States Department of Agriculture. (2012, January 17). “Farm Characteristics.” Accessed April 1 2012. http://www.ers.usda.gov/StateFacts/US.htm#FC.
U.S Department of Energy. (n.d.) “Gasoline Gallon Equivalent Definition.”
Accessed on April 1 2012. https://www.afdc.energy.gov/afdc/prep/popups/gges.html.
U.S Energy Information Administration. 2011, July 5. “Oil Crude and Petroleum
Products Explained.” Accessed April 1 2012. http://www.eia.gov/energyexplained/index.cfm?page=oil_home#tab2.
72
Joel K. Bourne, Jr. (2007, October). “Biofuels.” National Geographic Accessed on April 20 2012. http://ngm.nationalgeographic.com/2007/10/biofuels/biofuels-text/2.
“Biodiesel” (n.d.). Energy Justice Network. Retrieved April 10, 2012, from
http://www.energyjustice.net/biodiesel.
Clean Cities Alternative Fuel Price Report. (2012, January 1). U.S. Department of Energy. Retrieved April 9, 2012, from www.afdc.energy.gov/afdc/pdfs/afpr_jan_12.pdf.
“Alternative Fuels and Advanced Vehicles Data Center Program.” (n.d.). EERE.
Retrieved April 9, 2012, from http://www.afdc.energy.gov/afdc/.
“Guidance for Biodiesel Producers and Biodiesel Blenders/Users.” (2007, October 1). US Environmental Protection Agency. Retrieved April 12, 2012, from www.epa.gov/oms/renewablefuels/420b07019.pdf.
Hill, J., Nelson, E., Tilman, D., Polasky, S., and Tiffany, D. (2006).
Environmental, economic, and energetic costs and benefits of biodiesel and ethanol biofuels. Proceedings Of The National Academy Of Sciences, 103(30), 11206-11210. doi:10.1073/pnas.0604600103.
National Soybean Research Laboratory. (n.d.). National Soybean Research
Laboratory. Retrieved April 30, 2012, from http://www.nsrl.illinois.edu/general/soyprod.html.
Radich, A. (n.d.). Biodiesel Performance, Costs, and Use. U.S. Energy
Information Administration (EIA). Retrieved April 9, 2012, from http://www.eia.gov/oiaf/analysispaper/biodiesel/
Sabrsula, J. (2007, December 31). Site Selection for the Biofuels Industry | Trade
and Industry Development. Trade and Industry Development | Defining Corporate Strategies for Growth. Retrieved April 30, 2012, from http://www.tradeandindustrydev.com/industry/alternative-energy-fuels/site-selection-biofuels-industry-485
Soybeans Prices, Grain Prices. (n.d.). Soybeans Prices, Grain Prices. Retrieved
April 30, 2012, from http://www.quotesoybeans.com/
Urbanchuck, J. (2011, June 8). Economic Impact of Removing the Biodiesel Tax Credit for 2010 and Implementation of RFS2 Targets Through 2015. National Biodiesel Board. Retrieved April 10, 2012, from www.biodiesel.org/reports/20110608_gen-425.pdf
73
U.S. Growers Produce Abundant Crops in 2010. (2011, January 12). NASS - National Agricultural Statistics Service. Retrieved April 30, 2012, from http://www.nass.usda.gov/Newsroom/2011/01_12_2011.asp
Wisner, R. (2009, June 1). Agricultural Marketing Resource Center – Biodiesel
Economics - Costs, Tax Credits and Co-product. Agricultural Marketing Resource Center. Retrieved April 10, 2012, from http://www.agmrc.org/renewable_energy/biodiesel/biodiesel_economics__costs_tax_credits_and_coproduct.cfm
Water Power Program: Types of Hydropower Plants. (n.d.). EERE.
Retrieved February 13, 2012, from http://www1.eere.energy.gov/water/hydro_plant_types.html
Wind Energy Basics. American Wind Energy Association.
http://archive.awea.org/faq/wwt_basics.html (accessed May 6, 2012).
How Hydroelectric Energy Works. Union of Concerned Scientists. http://www.ucsusa.org/clean_energy/our-energy-choices/renewable-energy/how-hydroelectric-energy.html#The_Hydropower_Resource (accessed May 6, 2012).
Grand Coulee Dam Statistics and Facts. U.S. Bureau of Reclamation.
www.usbr.gov/pn/grandcoulee/pubs/factsheet.pdf (accessed May 6, 2012).
Hoover Dam . DesertUSA. http://www.desertusa.com/colorado/lm_nra/hoover/du_hoover.html (accessed May 7, 2012).
Hydroelectric power and water use. USGS Georgia Water Science Center - Home
page. http://ga.water.usgs.gov/edu/wuhy.html (accessed May 7, 2012).
Federal Register /Vol. 73, No. 248. U.S. Government Printing Office. www.gpo.gov/fdsys/pkg/FR-2008-12-24/pdf/E8-30565.pdf (accessed May 8, 2012).
DWSRF ARRA Success Story. EPA.
www.epa.gov/region8/eparecovery/AftonHydropower.pdf (accessed May 8, 2012).
Energy Systems and Design. Microhydropower.
http://www.microhydropower.com/ (accessed May 8, 2012).
Hydropower basic: introduction. Microhydro web portal. N.p., n.d. Web. 9 May 2012. http://www.microhydropower.net/basics/intro.php#Small.
74
FERC: News Release: FERC looks to ease development of small hydropower projects. (n.d.). Federal Energy Regulatory Commission. Retrieved February 27, 2012, from http://www.ferc.gov/media/news-releases/2010/2010-2/04-15-10-A5.asp#skipnav
Low-Head Hydropower Operation: Resource Requirements and Impact Sources.
Tribal Energy and Environmental Information Clearinghouse (TEEIC) Home Page.
http://teeic.anl.gov/er/lhhydro/activities/op/index.cfm (accessed May 9, 2012).
River Operations Office, Tennessee Valley Authority. Interview by author. Phone interview. River Operations Office, May 8, 2012.FERC: Off-Limits Sites. Federal Energy Regulatory Commission.
http://www.ferc.gov/industries/hydropower/gen-info/licensing/small-low-impact/get-started/sites.asp (accessed May 9, 2012).
Riverbank Power, Utah Office. Interview by author. Phone interview. 975 South State Highway Logan, UT 84321, May 8, 2012.
Campbell, R. J. (2010, March). Small Hydro and Low-Head Hydro Power
Technologies and Prospects. Congressional Research Service. Retrieved February 27, 2012, from http://nepinstitute.org/get/CRS_Reports/CRS_Energy/Renewable_Fuels/Small_hydro_and_Low-head_hydro_power.pdf
TransÉnergie- Hydro-Québec. Hydro-Québec.
http://www.hydroquebec.com/transenergie/en/index.html (accessed May 9, 2012).
TransÉnergie- Hydro-Québec. Transmission System Overview. Hydro-Québec.
http://www.hydroquebec.com/transenergie/en/reseau-bref.html (accessed May 9, 2012).
Willis, H. Lee. Power distribution planning reference book. New York [u.a.:
Dekker, 1997.
Manitoba Hydro, Transmission Line Design Section. Interview by author. Phone interview. Transmission Line Design Section, May 9, 2012.
Bureau of Reclamation: Lower Colorado Region - Hoover Dam FAQs. Bureau of
Reclamation Homepage. http://www.usbr.gov/lc/hooverdam/faqs/damfaqs.html (accessed May 9, 2012).
Hoover Dam, Visitors Center. Phone Interview, May 10, 2012. Manitoba Hydro,
H.R. Department. Phone interview. May 10, 2012.Comparing Pipes and Wires. (n.d.). Comparing Pipes and Wires. Retrieved April 9, 2012, from
75
www.chpcenternw.org/NwChpDocs/Transmission_and_N_Gas_Comparing_Pipes_and_Wires_032304.pdf.
Department of Energy (a). (n.d.). Geothermal Energy Resource Exploration and Drilling: Resource Requirements and Impact Sources. Tribal Energy and Environmental Information Clearinghouse (TEEIC) Home Page. Retrieved April 2, 2012, from http://teeic.anl.gov/er/geothermal/activities/siteeval/index.cfm
Department of Energy (b). (n.d.). Geothermal Energy Project Phases and
Activities. Tribal Energy and Environmental Information Clearinghouse (TEEIC) Home Page. Retrieved March 26, 2012, from http://teeic.anl.gov/er/geothermal/activities/act/index.cfm
Department of Energy (c). (n.d.). Geothermal Energy Construction: Resource Requirements and Impact Sources. Tribal Energy and Environmental Information Clearinghouse (TEEIC) Home Page. Retrieved April 2, 2012, from http://teeic.anl.gov/er/geothermal/activities/construct/index.cfm
Department of Energy (d). (n.d.). Geothermal Energy Development Operations and Maintenance: Resource Requirements and Impact Sources. Tribal Energy and Environmental Information Clearinghouse (TEEIC) Home Page. Retrieved April 2, 2012, from http://teeic.anl.gov/er/geothermal/activities/op/index.cfm
Department of Energy (e). Geothermal Energy: Operations and Maintenance
Impacts. (n.d.). Tribal Energy and Environmental Information Clearinghouse (TEEIC) Home Page. Retrieved April 9, 2012, from http://teeic.anl.gov/er/geothermal/impact/op/index.cfm
Energy Efficiency & Renewable Energy. (2006, April 11). Geothermal
Technologies Program: How a Geothermal Power Plant Works (Simple). Advanced Manufacturing Office: Technology Deployment. Retrieved March 30, 2012, from http://www1.eere.energy.gov/geothermal/gpp_animation.html
Geothermal Education Office (2000). Introduction to Geothermal Energy - First Plant Italy 1904.Geothermal Energy. Retrieved May 8, 2012, from http://geothermal.marin.org/geopresentation/sld050.htm
Geothermal Technologies Program Multi-Year Research. (n.d.). Geothermal Technologies Program Multi-Year Research. Retrieved April 9, 2012, from www1.eere.energy.gov/geothermal/pdfs/gtp_myrdd_2009-program_challenges.pdf
Johansson, T. B. (1993). Renewable Energy: Sources For Fuels And Electricity.
76
Google Books. Retrieved April 9, 2012, from http://books.google.com/bookshl=en&lr=&id=40XtqVMRxOUC&oi=fnd&pg=PA1&dq=geothermal+energy+transmission&ots=j_EtA1_oQs&sig=PELziwArqraxp009-MX09ziRV98#v=onepage&q=geothermal%20energy%20transmission&f=false
Kagel, A. (2008). Surface Technology. The State of Geothermal Energy.
Retrieved April 16, 2012, from www.geo-energy.org/reports/Geothermal%20Technology%20-%20Part%20II%20%28Surface%29.pdf
Pros and Cons of Geothermal Energy. (2007). Energy Consumers Edge.
Retrieved March 23, 2012, from http://www.energy-consumers-edge.com/pros_and_cons_of_geothermal_energy.html
S. Williams and K. Porter, Power Plays: Geothermal. (p. 178). (1989). Washington, DC: Investor Responsibility Research Center.
United States Department of Energy, Renewable energy annual 1995. (p. 78).
(1995). Geothermal. Washington, D.C.: Energy Information Administration.
Department of Energy, A. (n.d.). Solar Energy Technologies Program:
Concentrating Solar Power. Advanced Manufacturing Office: Technology Deployment. Retrieved April 9, 2012, from http://www1.eere.energy.gov/solar/csp_program.html
Department of Energy, B. (n.d.). Energy Basics: Linear Concentrator Systems for
Concentrating Solar Power. U.S. DOE Energy Efficiency and Renewable Energy (EERE) Home Page. Retrieved April 9, 2012, from http://www.eere.energy.gov/basics/renewable_energy/linear_concentrator.html
Department of Energy, C. (n.d.). Energy Basics: Dish/Engine Systems for
Concentrating Solar Power. U.S. DOE Energy Efficiency and Renewable Energy (EERE) Home Page. Retrieved April 9, 2012, from http://www.eere.energy.gov/basics/renewable_energy/dish_engine.html
Department of of Energy, D. (n.d.). Energy Basics: Power Tower Systems for
Concentrating Solar Power. U.S. DOE Energy Efficiency and Renewable Energy (EERE) Home Page. Retrieved April 9, 2012, from http://www.eere.energy.gov/basics/renewable_energy/power_tower.html
Department of Energy, E. (n.d.). Energy Basics: Photovoltaic Cells. U.S. DOE
Energy Efficiency and Renewable Energy (EERE) Home Page. Retrieved
77
April 9, 2012, from http://www.eere.energy.gov/basics/renewable_energy/pv_cells.html
Department of Energy, F. (n.d.). Energy Basics: Flat-Plate Photovoltaic Systems.
U.S. DOE Energy Efficiency and Renewable Energy (EERE) Home Page. Retrieved April 9, 2012, from http://www.eere.energy.gov/basics/renewable_energy/flat_plate_pv_systems.html
Department of Energy, G. (n.d.). Energy Basics: Concentrator Photovoltaic
Systems. U.S. DOE Energy Efficiency and Renewable Energy (EERE) Home Page. Retrieved April 9, 2012, from http://www.eere.energy.gov/basics/renewable_energy/concentrator_pv_systems.html
Department of Indian Energy and Economic Development, A. (n.d.). Solar
Energy and Its Uses. Tribal Energy and Environmental Information Clearinghouse (TEEIC) Home Page. Retrieved April 9, 2012, from http://teeic.anl.gov/er/solar/restech/uses/index.cfm
Department of Indian Energy and Economic Development, B. (n.d.). Solar
Energy Development Activities and Resource Requirements. Tribal Energy and Environmental Information Clearinghouse (TEEIC) Home Page. Retrieved April 9, 2012, from http://teeic.anl.gov/er/solar/activities/index.cfm
Department of Indian Energy and Economic Development, C. (n.d.). Solar
Energy Site Evaluation: Resource Requirements and Impact Sources. Tribal Energy and Environmental Information Clearinghouse (TEEIC) Home Page. Retrieved April 9, 2012, from http://teeic.anl.gov/er/solar/activities/siteeval/index.cfm
Department of Indian Energy and Economic Development, D. (n.d.). Solar
Energy Construction: Resource Requirements and Impact Sources. Tribal Energy and Environmental Information Clearinghouse (TEEIC) Home Page. Retrieved April 9, 2012, from http://teeic.anl.gov/er/solar/activities/construct/index.cfm
Department of Indian Energy and Economic Development, E. (n.d.). Solar
Energy Operations: Resource Requirements and Impact Sources. Tribal Energy and Environmental Information Clearinghouse (TEEIC) Home Page. Retrieved April 9, 2012, from http://teeic.anl.gov/er/solar/activities/op/index.cfm
Department of Indian Energy and Economic Development, F. (n.d.). Solar
Energy Decommissioning/Site Reclamation: Resource Requirements and Impact Sources. Tribal Energy and Environmental Information
78
Clearinghouse (TEEIC) Home Page. Retrieved April 9, 2012, from http://teeic.anl.gov/er/solar/activities/decom/index.cfm
Electric Transmission and Transmission Facilities. (n.d.). Solar Energy
Development PEIS Information Center. Retrieved March 29, 2012, from http://solareis.anl.gov/guide/transmission/index.cfm
Flynn, H. (2011, September 7). Smart Grid: FERC transmission line rule: Good
news for solar projects . Smart Grid: Smart Grid News - Grid Modernization and the Smart Grid. Retrieved April 12, 2012, from http://www.smartgridnews.com/artman/publish/Business_Policy_Regulation/FERC-transmission-line-rule-good-news-for-solar-projects-3978.htm
Kaplan, S. Energy and Environmental Policy , Congressional Research Service.
(2009). Electric power storage. District of Columbia
Solar Power Plant. (n.d.). FAMU-FSU College of Engineering. Retrieved April 9, 2012, from http://www.eng.fsu.edu/~shih/succeed-2000/roadmap/solar%20power%20plant.htm
Transmission Planning process and opportunities for utility scale solar
engagement . (2011). National Renewable Energy Labratory. Retrieved April 4, 2012, from www.nrel.gov/docs/fy12osti/51279.pdf
CARD: Historical Biodiesel Operating Margins. (n.d.). CARD: Center for
Agricultural and Rural Development. Retrieved April 23, 2012, from http://www.card.iastate.edu/research/bio/tools/hist_bio_gm.aspx
GWEC. (n.d.). Global Wind Energy Council: Resource library. Global Wind
Energy Council. Retrieved April 4, 2012, from http://www.gwec.net/index.php?id=102&L=0%252Findex.php%253Fid%253D
de Azua, C. R. (2010, February 18). AWEA Statement on FERC Westar Filing.
American Wind Energy Association. Retrieved April 4, 2012, from http://archive.awea.org/newsroom/releases/02-18-10_US_Wind_Resource_Larger.html
Denholm, P., Hand, M., Jackson, M., & Ong, S. (2009). Land-Use Requirements
of Modern Wind Power Plants in the United States. National Renewable Energy Laboratory. Retrieved April 4, 2012, from www.nrel.gov/docs/fy09osti/45834.pdf
UCS, (n.d.) Renewable Energy and Agriculture. Union of Concerned Scientists.
Retrieved April 9, 2012, from http://www.ucsusa.org/clean_energy/coalvswind/gd_reandag.html
79
BTM, 2010. Offshore Wind Power. BTM Consult. November 22, 2010. Retrieved April 9, 2012, from http://btm.dk/news/offshore+wind+power+2010/?s=9&p=&n=39
Floating turbines promise to deliver reliable wind, says report. (2010, October
11). The Guardian . Retrieved April 3, 2012, from http://www.guardian.co.uk/environment/2010/oct/11/floating-turbines-reliable-wind
UMass, (n.d.) Wind Power: Capacity Factor, Intermittency, and what happens
when the wind doesn't blow? Renewable Energy Research Laboratory, University of Massachusetts at Amherst . Retrieved April 3, 2012, from www.umass.edu/windenergy/publications/published/communityWindFactSheets/RERL_Fact_Sheet_2a_Capacity_Factor
UCS, (2009). How Wind Energy Works. Union of Concerned Scientists.
December 15th, 2009. Retrieved April 9, 2012, from http://www.ucsusa.org/clean_energy/technology_and_impacts/energy_technologies/how-wind-energy-works.html
EWEA (2005). Large scale integration of wind energy in the European power
supply: analysis, issues and recommendations. European Wind Energy Association. December 2005. Retrieved April 4, 2012, from www.ewea.org/fileadmin/ewea_documents/documents/publications/grid/051215_Grid_report.pdf
Holttinen, H., Meibom, P., Soder, L., Strbac, G., Parsons, B., Smith, J. C., et al.
(2006). Design and Operation of Power Systems with Large Amounts of Wind Power, first results of IEA collaboration. September 18 2006. Retrieved April 3, 2012, from http://www.ieawind.org/AnnexXXV/Meetings/Oklahoma/IEA%20SysOp%20GWPC2006%20paper_final.pdf
Poore, R. and C. Walford. (January 2008). Development of an Operations and
Maintenance Cost Model to Identify Cost of Energy Savings for Low Wind Speed Turbines. National Renewable Energy Laboratory. Retrieved May 4, 2012, from http://www.nrel.gov/docs/fy08osti/40581.pdf
RES Canada. (n.d.) The Greenwich Wind Farm. Renewable Energy Systems
Canada. Retrieved May 4, 2012, from http://greenwichwindfarm.com/the-facts.php
Mills, Andrew, Ryan Wiser, and Kevin Porter. (February, 2009). The Cost of Transmission for Wind Energy: A Review of Transmission Planning Studies. Ernest Orlando Lawrence Berkeley National Laboratory: Environmental Energy Technologies Division. Retrieved May 4, 2012, from http://eetd.lbl.gov/ea/EMP/reports/lbnl-1471e.pdf
80
Wilburn, David R. (2011). Wind Energy in the United States and Materials
Required for the Land-Based Wind Turbine Industry from 2010 Through 2030. United States Geological Survey. Retrieved May 4, 2012, from, http://pubs.usgs.gov/sir/2011/5036/sir2011-5036.pdf
EcoGen. (2012). Wind Faqs. EcoGen, LLC. Retrieved May 4, 2012, from
http://www.ecogen-energy.com/windfaqs.html#28 Clean Cities Alternative Fuel Price Report. (2012, January 1). Energy Efficiency &
Renewable Energy. Retrieved April 30, 2012, from www.afdc.energy.gov/afdc/pdfs/afpr_jan_12.pdf
Combs, S. (n.d.). Window on State Government. Texas Comptroller of Public
Accounts. Retrieved April 23, 2012, from www.window.state.tx.us/specialrpt/energy/exec/biodiesel.html
“EIA Renewable Energy- Estimated Consumption of Vehicle Fuels in the United
States, by Fuel Type." U.S. Energy Information Administration (EIA). N.p., 1 Apr. 2010. Web. 7 May 2012. http://www.eia.gov/cneaf/alternate/page/atftables/attf_c1.html.
Radich, A. (n.d.). Biodiesel Performance, Costs, and Use. U.S. Energy
Information Administration (EIA). Retrieved April 9, 2012, from http://www.eia.gov/oiaf/analysispaper/biodiesel/
U.S. Growers Produce Abundant Crops in 2010. (2011, January 12). National
Agricultural Statistics Service. Retrieved April 30, 2012, from http://www.nass.usda.gov/Newsroom/2011/01_12_2011.asp
Office of the Historian. Milestones - 1969-1976 - OPEC Oil Embargo. Office of the
Historian. n.p., n.d. Web. 12 May 2012. http://history.state.gov/milestones/1969-1976/OPEC.
Carter, J. (n.d.). Proposed Energy Policy. PBS: Public Broadcasting Service.
Retrieved May 12, 2012, from http://www.pbs.org/wgbh/americanexperience/features/primary-resources/carter-energy/
Blog Brightsource Ivanpah. (n.d.). Brightsource Ivanpah | Proven Leadership in
Solar Energy. Retrieved May 13, 2012, from http://ivanpahsolar.com/blog About Brightsource Ivanpah. (n.d.). Brightsource Ivanpah | Proven Leadership
in Solar Energy. Retrieved May 13, 2012, from http://ivanpahsolar.com/about
81
Powering Our Future: Solar Salt Lake Implementation Plan. (October 2010). Utah Clean Energy. Retrieved May 13, 2012, from utahcleanenergy.org/files/u1/uture_Solar_Salt_Lake_Implementa
BLM Fact Sheet. (n.d.). Bureau of Land Management. Retrieved May 14, 2012,
from www.blm.gov/pgdata/etc/medialib/blm/wo/MINERALS__REALTY__AND_RESOURCE_PROTECTION_/energy/solar_and_wind.Par.99571.File.dat/Fact_Sheet_Solar_Feb_2012.pdf
Tevares, S. (2009, September 18). Dirty detail: Solar panels need water - Friday,
Sept. 18, 2009. Las Vegas Sun. Retrieved May 14, 2012, from http://www.lasvegassun.com/news/2009/sep/18/dirty-detail-solar-panels-need-water/
California Valley Solar Ranch. (n.d.). California Valley Solar Ranch. Retrieved
May 14, 2012, from http://www.californiavalleysolarranch.com/economic-benefits.html
CVSR PROJECT BENEFITS FACT SHEET. (n.d.). California Valley Solar Ranch.
Retrieved May 14, 2012, from www.californiavalleysolarranch.com/pdfs/CVSR_BENEFITS.pdf
Solar Energy Site Evaluation: Resource Requirements and Impact Sources. (n.d.).
Tribal Energy and Environmental Information Clearinghouse (TEEIC) Home Page. Retrieved April 24, 2012, from http://teeic.anl.gov/er/solar/activities/siteeval/index.cfm
NREL: TroughNet - Parabolic Trough FAQs. (2011, June 9). National Renewable
Energy Laboratory (NREL) Home Page. Retrieved April 24, 2012, from http://www.nrel.gov/csp/troughnet/faqs.html
NextEra Energy Resources. (n.d.). Next Era Energy Resources. Retrieved May
14, 2012, from http://www.nexteraenergyresources.com/what/solar_works.shtml
Imperial Solar Energy Center (CSolar) West. (n.d.). BLM - The Bureau of Land
Management. Retrieved May 15, 2012, from http://www.blm.gov/ca/st/en/fo/elcentro/nepa/isec_west.html
Proposed: Imperial Solar Energy Center West. (n.d.). Tenaska Solar Ventures.
Retrieved May 14, 2012, from www.tenaskasolarventures.com/pdf/Solar-Fact-sheet-West.pdf
Imperial Solar Energy Center- West Project. (2011, August 25). bureau of Land
Management. Retrieved May 15, 2012, from

82
www.blm.gov/pgdata/etc/medialib/blm/wo/MINERALS__REALTY__AND_RESOURCE_PROTECTION_/energy/priority_projects.Par.25264.File.dat/Imperial_Solar_West_Fact_Sheet.pdf
Recommended