Available online www.jocpr.com
Journal of Chemical and Pharmaceutical Research, 2017, 9(3):56-68
Research Article ISSN : 0975-7384
CODEN(USA) : JCPRC5
56
Removal of Paracetamol from Aqueous Solution by Adsorption onto
Activated Carbon Prepared from Rice Husk
Ndifor-Angwafor George Nche1*
, Aurelien Bopda1, Donald Raoul Tchuifon Tchuifon
1,
Christian Sadeu Ngakou1, Idris-Hermann Tiotsop Kuete
1 and Anagho Solomon Gabche
1,2
1Laboratory of Noxious Chemistry and Environmental Engineering, Department of Chemistry, University of
Dschang, Dschang, Cameroon 2Department of Chemistry, Faculty of Science, The University of Bamenda, Bambili, Cameroon
_____________________________________________________________________________
ABSTRACT
Removal of paracetamol from aqueous solution onto two activated carbons CANa1 and CANa2 obtained by the
chemical activation of rice husk with sodium hydroxide was study in this work. The characterization of the activated
carbons showed that the ph at zero charge was 6.80 for CANa1 and 6.54 for CANa2, while the pH of CANa1 was
7.10 and that of CANa2 was 7.13. from the adsorption of acetic acid, the specific surface areas were obtained as
178.13 m2/g for CANa1 and 104.82 m
2/g for CANa2. The determination of the iodine number gave values 528.39
mg/g and 494.67 mg/g for CANa1 and CANa2 respectively. The kinetics of the adsorption was adequately
described by the pseudo-second order and intraparticulate diffusion models. Concerning the equilibrium studies, the
model of langmuir described best the adsorption on CANa1 while the model of freundlich described best the
adsorption on CANa2. From the results obtained, CANa1 and CANa2 constitute effective adsorbents for the
elimination of paracetamol from industrial waste water, the equilibrium is in according with the langmuir model,
while the quantities adsorbed were 20.964 mg/g and 14.881 mg/g respectively.
Keywords: Paracetamol; Adsorption; Activated carbon; Chemical activation
Abbreviations: CANA1: activated carbon obtained by chemical activated of rice husk with NaOH as activating
agent at 500°C; CANa2: activated carbon obtained by chemical activated of rice husk with NaOH as activating
agent at 450°C
_____________________________________________________________________________
INTRODUCTION
The lack of appropriate treatment systems for effluents from pharmaceutical industries is responsible for introducing
significant amounts of medicines into diverse aquatic ecosystems, thus creating serious environmental problems
throughout the world. The production of pharmaceuticals has increased rapidly in the last decades, providing better
health quality for humans and animals [1]. The presence of these pharmaceuticals in the environment in
concentrations in the µg/L or ng/L
range poses the threat to aquatic organisms in terms of mutagenicity as well as
currently unknown effects to humans. Pharmaceuticals originally from humans and feedstock wastewaters often
found their way into surface water sources [2]. Among the drugs frequently used in the world; analgesics and anti-
inflammatories are the most common, and they are widely consumed with or without medical prescription. Of these
drugs, paracetamol stands out as being highly toxic to the liver, and it has a high potential for developing hepatitis
[3]. Paracetamol; an antipyretic/analgesic drug has been widely investigated because of its common use and because

NAG Nche et al J. Chem. Pharm. Res., 2017, 9(3): 56-68 __________________________________________________________________________________________
57
of the fact an overdose of it results in health problems such as acute hepatic failure, liver damage [4,5,6,7] and even
death.
To prevent the release of pharmaceuticals from industries into natural water sources, a number of conventional
methods for the removal of organic pollutants are being investigated. These methods may be divided into three main
categories: physical, chemical and biological. Often, in drug poisoning, the amount of drugs in the order of
magnitude of many grams may have been ingested. This amount is close to the adsorption capacity of the activated
carbons often used. As standard treatment, a dose of 50 g activated carbon has been shown to be effective as a
gastro-intestinal decontaminant in human volunteers who ingested multiple drugs, although these investigations
involved only sub-toxic drug [8-11]. Adsorption, one of the physical methods is generally considered to be an
effective method for quickly lowering the concentrations of organic molecules in an effluent [12]. The activated
carbons have been previously used to remove lead from aqueous effluents. The most important commercial
adsorbent is a carbonaceous material with a large surface area, high porosity, adequate pore size distribution and
high mechanical strength [13]. Activated carbons can be produced from different carbonaceous materials such as
coal, wood, peat and agricultural wastes especially lignocellulosic by-products like pinewood [14], date’s stone [15],
cola nut shells [16], and maize stalks [17]. Recent progress of industrial technologies provides new application fields
for activated carbons in super-capacitors, and the carbons are required to have the desired pore structure [18]. The
production of activated carbon from agricultural by-products has potential economic and environmental benefits. It
converts unwanted, low value agricultural waste to useful, high value adsorbents. Activated carbons are increasingly
being used to remove organic compounds and heavy metals of environmental and/ or economic concern [16] from
waste streams.
The aim of this study was to use rice husk; a local agricultural waste, to produce activated carbons, and to
investigate the removal of paracetamol from aqueous solution using these activated carbons.
MATERIALS AND METHODS
Preparation of activated carbon
The rice husk used in this work was collected from Ndop subdivision in the North-West Region of Cameroon. The
rice husk was washed with tap water, then rinsed with distilled water to eliminate impurities and then dried under
sunlight for 72 hours before activation.
The ratio of impregnation is defined as the ratio of the mass of the activating agent to the mass of the dry
biomass precursor. To produce an activated carbon with an impregnation ratio of 35%, 200 g of dried rice husk was
put in contact with 350 mL of a 1.0 molar solution of NaOH. The mixture was kept for 30 minutes for activation to
take place before being dried in an oven set at 105°C for 24 hours. The samples of impregnated rice husk were
carbonized for 1 hour at 450°C and 500°C, at a heating rate of 5°C/min. The activated carbons obtained were
labeled CANa1 for rice husk carbonized at 500°C and CANa2 for rice husk carbonized at 450°C. The carbonization
was carried out in an electric furnace of mark ISUNU, which has an automatic regulation, and a temperature
programmer coupled to it. The various activated carbons thus obtained were dried for 24 hours at the temperature of
105°C, before being crushed and filtered to obtain activated carbon of particles of sizes lower than 100 µm.
Characterization of adsorbents
Bulk density:
A 15 cm3
specific gravity bottle was weighed empty, and later when carefully filled to the mark with powder
activated carbon. The difference in the masses gave the mass of the powder activated carbon. The bulk density was
calculated from the equation:
(1)
Moisture content
A previously weighed crucible was weighed with 1 g of powdered air dried activated carbon. It was then placed on a
hot plate maintained at 110 °C. After one hour, it was taken out and cooled in a desiccator before being weighed
again. The ratio of the mass of the powder lost to its original mass gave the moisture content of the sample.
Iodine number
To gain further knowledge of the porous structure of activated carbon, the adsorption of iodine from liquid phase
was adopted by other researchers in the characterization of sludge-based activated carbons [19,20]. The adsorption
of aqueous I2 is considered a simple and quick test for evaluating the microporosity of activated carbons associated
with pore diameter less than 2 nm. The iodine number, defined as the amount of iodine adsorbed per gram of

NAG Nche et al J. Chem. Pharm. Res., 2017, 9(3): 56-68 __________________________________________________________________________________________
58
activated carbon at an equilibrium concentration of 0.02 N, was measured according to the procedure established by
the American Society for Testing and Materials [20]. Activated carbon of mass 0.1 g, was mixed with 30 mL of 0.02
N iodine solutions and stirred for 3 hours. After filtration, 10 mL of the filtrate was titrated against 0.005 N sodium
thiosulphate solution using starch as indicator.
Surface area
Another method of determining the specific surface area of adsorbent is based on adsorption of molecules of acetic
acid [21], whose molecular surface area of 21 Å2 is close to that of nitrogen, N2 (16.2 Å
2). To determine the specific
surface area of the adsorbent, 20 ml of acetic acid solution of concentration ranging between 4x10⁻³
and 8x10⁻³
M
was put in contact with 0.1 g of activated carbon. This mixture was filtered after agitating for 60 minutes. The
residual concentration of the acid was determined by the volumetric assay technique [21]. The specific surface area
SL (in m2/g) was determined using the equation (2):
(2)
Where N = 6.02x10²³
mol-1
(Avogadro constant), SA = 21 Å2 (molecular surface area of acetic acid) and Qm
maximum quantity of acid adsorbed as obtained from the isotherm of Langmuir.
Batch adsorption
Adsorption experiments were carried out by mechanical agitation at room temperature. For each run, 20 mL of
paracetamol solution of known initial concentration (between 70-120 mg/L) was treated with a known weight of
different activated carbon. After agitation, the solution was filtered, and the filtrate analyzed to obtain the residual of
concentration paracetamol by using the UV/Vis spectrophotometer (Jenway, model 6715). Similar measurements
were carried out by varying adsorbent doses, pH of the solution, ionic strength and the initial concentrations of the
solution. The percentage removal (%R) of paracetamol, and the amount (Qe) of paracetamol adsorbed were
calculated using the following expressions:
(3)
(4)
C0 is the initial concentration of the phenol, Ce is its equilibrium concentration, Ct is the concentration of the
paracetamol solution at the time t, V is the volume of the solution, and m is the mass of the absorbent.
Effect of contact time
To determine the effect of agitation time on the adsorption process, 0.1 g of ground adsorbent was agitated in a 20
mL solution of paracetamol of initial concentration 100 mg/L for different time intervals. At each time t, the solution
was rapidly filtered and the residual concentration determined by spectrophotometer. The amount (Qe) of
paracetamol adsorbed was calculated by using equation (4).
Effect of amount of adsorbent
In this set of experiments, different masses of the adsorbents ranging between 0.025 to 0.45 g were treated with 20
mL solution of the paracetamol of initial concentration 100 mg/L.
Effect of initial pH
For each adsorbent, the optimal mass of adsorbent obtained at the end of the preceding study was treated with 20 mL
of aqueous solution of 100 mg/L of paracetamol in the pH range of 2.0 – 3.5. The adjustment was done by adding
either HCl or NaOH.
Kinetics of adsorption studies
The kinetics experiments were conducted using a series of 20 mL solutions containing known amounts of adsorbent
and concentrations of paracetamol. The solutions were vigorously agitated for increasing time intervals. At the end
of each interval, the solution was analyzed in order to determine the residual concentration of paracetamol. A
number of kinetic models were used to test the fit of the experimental data. These are:
The pseudo-first order model
The pseudo-first order equation is generally expressed as [22,23]:

NAG Nche et al J. Chem. Pharm. Res., 2017, 9(3): 56-68 __________________________________________________________________________________________
59
(5)
Where and are the adsorption capacities at equilibrium and at time t, respectively (in mg/g) and K1 is the rate
constant for the pseudo-first order adsorption (1/min).
After integration and applying boundary conditions that at t = 0, Qt= 0; and at t = t, Qt = Qt, the integrated form of
equation (5) becomes:
(6)
The pseudo-second order model
The pseudo-second order chemisorption kinetic equation [24,25] is expressed as Equation 7:
(7)
Where is the rate constant for the pseudo-second order adsorption (g/mg.min).
For boundary conditions are that, at t = 0, Qt= 0; and at t = t, Qt = Qt, the integrated and rearranged form of equation
(7) is:
(8)
In the equation (8), is the initial rate for the adsorption
Intraparticle diffusion model
The intra-particle diffusion model or the Weber and Morris equation [26] models the type of diffusion mechanism
involved in adsorption processes. It is given here by equation (9):
(9)
Where is the intra-particle diffusion constant (mg/g.min). The linear form of this equation takes the following
form [27].
(10)
Where; P is the percentage of paracetamol removed at instant t and a is a constant that depends on the adsorption
mechanism. When intra-particle diffusion plays a significant role in controlling the kinetics of the sorption process,
the plots of yield straight lines passing through the origin and the slope gives the rate constant, .
However, when the transport of the solute molecules from the liquid phase up to the solid phase boundary plays the
most significant role in adsorption, the liquid film diffusion model may be applied.
Batch equilibrium experiments
For each run, the adsorbent was mixed with 20 mL solution of paracetamol at different initial concentrations from
50-110 mg/L. The suspension was stirred for 60 minutes with different activated carbon. The amount of paracetamol
adsorbed at equilibrium, Qe (mg/g) was calculated using equation (4). Equilibrium data were then fitted by using the
isotherms of Langmuir, Freundlich, Dubinin-Radushkevich and Temkin.
The Langmuir isotherm:
The Langmuir adsorption isotherm is often used of the equilibrium of the adsorption of solutes from solutions. It is
expressed as [28]:
(11)
Where, Qe is the adsorption capacity at the equilibrium solute concentration, (in mg of adsorbate per g of adsorbent);
Ce is the equilibrium concentration of adsorbate in solution (mg/L), while Qm is the maximum adsorption capacity
corresponding to complete monolayer coverage expressed in mg of solute adsorbed per g of adsorbent. is the
Langmuir constant in L of adsorbate per mg of adsorbent, and it is related to the energy of adsorption. Equation (11)
can be rearranged in the linear form:
(12)
The factor of separation of Langmuir, RL, which is an essential factor characteristic of this isotherm is calculated by
using the relation [29]:

NAG Nche et al J. Chem. Pharm. Res., 2017, 9(3): 56-68 __________________________________________________________________________________________
60
(13)
Where C0 is the higher initial concentration of paracetamol, while and Qm are the Langmuir constant and the
maximum adsorption capacity respectively. The parameters indicate the shape of the isotherm as follows: RL values
indicate the type of isotherm. when RL = 1 adsorption is linear; when 0 < RL< 1, it is favourable, when RL = 0, it is
irreversible, while to be unfavorable, while when RL> 1, it is unfavorable.
The Freundlich isotherm:
The Freundlich isotherm is based on adsorption on a heterogeneous surface, and it is expressed as [30].
(14)
Where and are empirical constants. By taking logarithms on both sides, the equation gives the more convenient
linear form:
(15)
A linear graph of ln Qe versus ln Ce gives the values of 1/n and ln Kf.
The values indicate the type of isotherm as follows: to be irreversible = 0; to be favorable 0 < < 1,
while to be unfavorable > 1.
The Temkin isotherm:
The isotherm of Temkin developed in 1941 [31] for an adsorption in gas phase was transposed to the liquid phase by
Zarrouki in 1990 [32]. The isotherm of Temkin was generally presented by the following equation:
(16)
Where
is the rate of covering the surface of the adsorbent, A is the constant of balance and is the variation of
the energy of adsorption. The linear form of the equation (16) is:
(17)
The value of is obtained from the equation of Langmuir.
The Dubinin-Radushkevich isotherm:
Langmuir and Freundlich isotherms are insufficient to explain the physical and chemical characteristics of
adsorption. The Dubinin-Radushkevich isotherm is commonly used to describe the sorption isotherms of single
solute systems. The Dubinin-Radushkevich isotherm, apart from being an analogue of the Langmuir isotherm, is
more general than Langmuir isotherm because it does not apply to the homogeneous surfaces or surfaces of
constant adsorption potential. The Dubinin-Radushkevich isotherm is expressed as [33].
(
)
(18)
Where, is the main energy of adsorption and gives information about the physical and chemical features of
adsorption. The linear form of the Dubinin-Radushkevich isotherm equation is:
(19)
Where, (
) is called the Polanyi potential.

NAG Nche et al J. Chem. Pharm. Res., 2017, 9(3): 56-68 __________________________________________________________________________________________
61
RESULTS AND DISCUSSION
Characterization of activated carbons
The physicochemical properties of the adsorbents as obtained in this work after their characterization are shown in
table 1.
Table 1: Characterization of adsorbents
Adsorbent Bulk density (kg/m3) Moisture Content (%) pH pHpcz
CANa1 655.53 7 7.1 6.8
CANa2 645.33 9.09 7.13 6.54
Iodine number:
Iodine number is defined as the number of milligrams of iodine absorbed by one gram of activated carbon powder.
Table 2 gives the values of the iodine number of the samples. The iodine numbers of activated carbons prepared in
this investigation lie between 490.00-530.00. Generally, the higher the iodine number, the greater the sorption
capacity. ASTM D 4607 describes the procedure of determining the iodine number. The iodine number
recommended as a minimum by the American Water Works Association for a carbon to be used in removing low
molecular weight compounds is 500. The two factors that determine good iodine number are activation
temperature and raw materials. This suggests that surface area increases in terms of microscopic pores. Iodine
adsorption is usually associated with micro pores because of the small size of iodine molecule.
Surface area: The specific surface area of an adsorbent is its surface area per unit of mass. From Table 2, it can be
observed that the specific surface area of CANa1 is higher than that of CANa2. Since CANa2 was obtained at 450°C
and CANa1 was obtained at 500°C, it implies that increasing the temperature of carbonization increases the
development of pores. Table 2: Iodine number and surface area values of the samples
Samples Iodine number(mg/g) Surface area(m2/g)
CANa1 528.39 178.13
CANa2 494.67 104.82
Fourier transform infrared spectroscopy
From figure 1, the presence of either a free O-H or alcohol is depicted by the broad band between 3200 cm-1
and
3600 cm-1
. The vibration band at 3352 cm-1
was attributed to the presence of acetylenic stretching. The adsorption
band 1631.35 cm-1
is attributed to quinonic, monosubstituted alkene and carboxylate structures mean while the
adsorption band at 1724.52 cm-1
is attributed to a carboxylic tautomeric structure (C=O). The precursor from rice
husks contain C-N, C=N, due to vibrations around 1630-1730 cm-1
. The C-O single bond adsorptions at about 1033
cm-1
. It also has peaks around the range from 2858 cm-1
to 2925.66 cm-1
, which indicate the existence of symmetric
-CH3, -CH2 stretching groups. Strong stretching vibration+ at 3352.11 cm-1
may correspond to the acetylenic C-H
bonds. Aliphatic nitro compounds (N-O) are present at 1373.56 cm-1
could be allocated to halogeno-alkanes
vibrations between 400 cm-1
and 800 cm-1
.
Figure 1: FTIR spectra of rice husks

NAG Nche et al J. Chem. Pharm. Res., 2017, 9(3): 56-68 __________________________________________________________________________________________
62
The FTIR spectra of the activated carbons treated with sodium hydroxide at different temperatures are shown in
figure 2. The bands present in the IR spectrum of activated carbon are: 1694.74, 1566.55, 1371.14, 1067.32, 789.27,
452.28, 415.77, 386.96 cm-1
. Absorption band between 1700 – 1650 cm-1
with maximum at 1694.74 cm−1
is
attributed to C=O bond stretching of the carboxylic anhydride groups. The peak observed at 1566.55 cm-1
is
attributed to the carbonyl functional group. The shoulder at 1371.14 cm-1
can be ascribed to N-O stretching of
aliphatic nitro compounds of the activated carbon derived from sodium hydroxide activation. The absorption band at
900 – 1070 cm-1
can be attributed to C–O groups of esters or ethers. The band between 600–400 cm-1
corresponds to
C-H bond vibrations in the aromatic ring.
Figure 2: FTIR spectra of CANa1 (a) and CANa2 (b)
Figure 3: The effect of pH solution on uptake of the paracetamol onto activated carbon
Effect of contact time:
Figure 4 presents the effect of contact time on the adsorption of paracetamol. In the figure, it is observed that
adsorption takes place at a very fast rate during the first 20 minutes. This is followed by a slower rate of adsorption
up to 100 minutes before equilibrium is attained. Furthermore, a large fraction of the total amount of paracetamol
was removal within a very short time. In the first stage, the sorbate molecules are being adsorbed onto a surface
where there are no other such molecules already attached, and consequently the sorbate-sorbate interactions are
negligible [36]. Therefore, paracetamol molecules reach the adsorption sites easily. The second part of the curve
shows that as time progresses, the number of free sites on the activated carbon decreases, and the non-adsorbed
molecules are assembled at the surface, thus limiting the capacity of adsorption.

NAG Nche et al J. Chem. Pharm. Res., 2017, 9(3): 56-68 __________________________________________________________________________________________
63
Figure 4: Effect of agitation time on the adsorption of paracetamol onto activated carbon
Effect of adsorbent dose
In this part of the experiment, different masses of the adsorbent were stirred with paracetamol solution of constant
initial concentration 100 mg/L for 100 minutes. The results show that the percentage adsorption increases with
adsorbent mass (figure 5). This is explained by the fact that increasing the mass of adsorbent leads to an increase in
the number of adsorption sites on the surface of the adsorbent. It should be noted that adsorbent CANa1 has the
greater percentage of elimination than CANa2. The percentage of elimination is 53.01 and 48.55 for CANa1 and
CANa2 respectively. This implies that percentage adsorption increases with the increase in surface area, and this too
depends on the number of pores. That is the greater the surface area, the greater the number of pores, and the
number of pores increases with an increases in the carbonization temperature.
Figure 5: Effect of adsorbent mass on paracetamol adsorption onto activated carbon
Kinetic study
Modeling of kinetic data is important for the industrial application of the adsorption process, because it gives
information that can be used to compare different adsorbents under different operating conditions [37]. The kinetic
models used to investigate and describe the adsorption of paracetamol are the pseudo-first order, pseudo-second
order, and intra particular diffusion models. The plots of the kinetic models are presented in figures 6 to 8. The
validity of the order of adsorption process is based on the regression coefficients, R2 and on the predicted values of
Qe. The parameters for the kinetics models are presented in table 3.
Table 3: Parameters of kinetic models for paracetamol adsorption on CANa1 and CANa2
Model Parameters CANa1 CANa2
Pseudo first order
R2 0.917 0.926
Qe (mg/g) 7.775 3.407
K1 (1/min) 0.021 0.015
pseudo-second order
R2 0.976 0.987
Qe (mg/g) 12.345 8.13
K2 (g/min.mg) 0.0036 0.01
h (mg/min.g) 0.549 0.661
Intraparticle diffusion
R2 0.976 0.965
Kid (min-1) 5.72 10.601
a (mg/g) 0.314 0.196

NAG Nche et al J. Chem. Pharm. Res., 2017, 9(3): 56-68 __________________________________________________________________________________________
64
The results show that the first and second order correlation coefficient, R², for these studies are greater than 0.92.
Consequently, these adsorption data may be assumed to follow the first and second order mechanisms in the early
stages of the adsorption process. It is often incorrect to apply simple kinetic models such as first or second order rate
equations to an adsorption with solid surfaces, because they are rarely homogeneous and the effects of transport
phenomena and chemical reactions are often experimentally inseparable [38]. In the multiple first order kinetics
adsorption process, the first stage is attributed to the binding or anchorage of paracetamol molecules with the active
spots on the solid surface by removal and reorganization of the surface-bound originally adsoerded. The second
stage is attributed to the denaturation and reorganization of the activated carbon of the interface, leading to the
formation of spread films [39]. Atuna and Sismanoghu [40] reported that in the case of two kinetics steps, the first
step of adsorption was more rapid than the second, and the adsorption rate was controlled by either a film diffusion
or intraparticule diffusion.
Figure 6: Linearized pseudo-first order plots
Figure 7: Linearized pseudo-second order plots
Adsorption isotherms
The Langmuir, Freundlich, Dubinin-Radushkevich and Temkin models have been used in this study. The adsorption
isotherms relate the amount of paracetamol adsorbed at equilibrium Qe (mg/g) to the paracetamol concentration at
equilibrium, Ce (mg/L) and the plots are given in figures 9 to 12. The parameters of the adsorption isotherm are
shown in table 4.
In comparing the values given in table 4 above, one realizes that the coefficients of correlation obtained are higher
than 0.9 for the studied models. This suggests that the equilibrium of the adsorption of paracetamol on the activated
carbons from rice husks is adequately represented by the models of Langmuir, Freundlich, or Temkin and Dubinin-
Radushkevich.
NAG Nche et al J. Chem. Pharm. Res., 2017, 9(3): 56-68 __________________________________________________________________________________________
65
Figure 8: Linearized Intraparticle diffusion plots
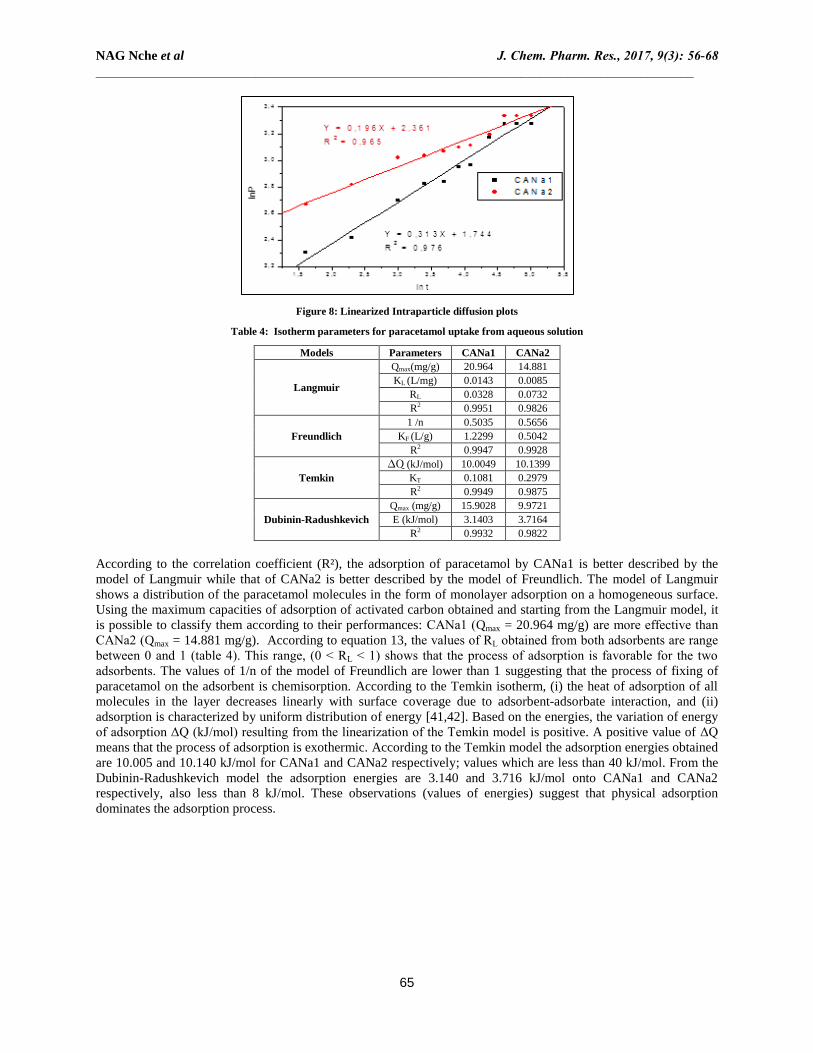
Table 4: Isotherm parameters for paracetamol uptake from aqueous solution
Models Parameters CANa1 CANa2
Langmuir
Qmax(mg/g) 20.964 14.881
KL (L/mg) 0.0143 0.0085
RL 0.0328 0.0732
R2 0.9951 0.9826
Freundlich
1 /n 0.5035 0.5656
KF (L/g) 1.2299 0.5042
R2 0.9947 0.9928
Temkin
∆Q (kJ/mol) 10.0049 10.1399
KT 0.1081 0.2979
R2 0.9949 0.9875
Dubinin-Radushkevich
Qmax (mg/g) 15.9028 9.9721
E (kJ/mol) 3.1403 3.7164
R2 0.9932 0.9822
According to the correlation coefficient (R²), the adsorption of paracetamol by CANa1 is better described by the
model of Langmuir while that of CANa2 is better described by the model of Freundlich. The model of Langmuir
shows a distribution of the paracetamol molecules in the form of monolayer adsorption on a homogeneous surface.
Using the maximum capacities of adsorption of activated carbon obtained and starting from the Langmuir model, it
is possible to classify them according to their performances: CANa1 (Qmax = 20.964 mg/g) are more effective than
CANa2 (Qmax = 14.881 mg/g). According to equation 13, the values of RL obtained from both adsorbents are range
between 0 and 1 (table 4). This range, (0 ˂ RL ˂ 1) shows that the process of adsorption is favorable for the two
adsorbents. The values of 1/n of the model of Freundlich are lower than 1 suggesting that the process of fixing of
paracetamol on the adsorbent is chemisorption. According to the Temkin isotherm, (i) the heat of adsorption of all
molecules in the layer decreases linearly with surface coverage due to adsorbent-adsorbate interaction, and (ii)
adsorption is characterized by uniform distribution of energy [41,42]. Based on the energies, the variation of energy
of adsorption ΔQ (kJ/mol) resulting from the linearization of the Temkin model is positive. A positive value of ΔQ
means that the process of adsorption is exothermic. According to the Temkin model the adsorption energies obtained
are 10.005 and 10.140 kJ/mol for CANa1 and CANa2 respectively; values which are less than 40 kJ/mol. From the
Dubinin-Radushkevich model the adsorption energies are 3.140 and 3.716 kJ/mol onto CANa1 and CANa2
respectively, also less than 8 kJ/mol. These observations (values of energies) suggest that physical adsorption
dominates the adsorption process.

NAG Nche et al J. Chem. Pharm. Res., 2017, 9(3): 56-68 __________________________________________________________________________________________
66
Figure 9: Linear plot of the model of Langmuir
Figure 10: Linear plot of the model of Freundlich
Figure 11: Linear plot of Temkin

NAG Nche et al J. Chem. Pharm. Res., 2017, 9(3): 56-68 __________________________________________________________________________________________
67
Figure 12: Linear plot of Dubinin-Radushkevich
CONCLUSION
In this work, the potential of two activated carbons, obtained from rice husks by chemical activation using NaOH,
for the removal of paracetamol from aqueous solutions was established. The investigation revealed that the quantity
of paracetamol adsorbed increases with the increase in the initial concentration of paracetamol and contact time
between the adsorbent and paracetamol solution. Maximum adsorption took place at pH=2 for both adsorbents.
Using the same adsorbent mass of 450 mg, the percentage eliminations were recorded as 52.87 and 48.56
respectively for CANa1 and CANa2. The kinetic model of pseudo-second order described better the adsorption of
paracetamol by both materials. As for the equilibrium the study, isotherm of Langmiur described better the
adsorption of paracetamol on CANa1 while CANa2 was best described by the Freundlich. These results suggest the
competition between physisorption and chemisorption during the adsorption of paracetamol on these activated.
REFERENCES
[1] RC Ferreira; OM Couto Junior; KQ Carvalho; PA Arroyo; MASD Barros. Chem Biochem Eng Quart,
2015, 29(1): 47-53.
[2] T Ratpukdi. J Clean Energ Technol, 2014, 2(2), 168-170.
[3] Y Kim; K Choi; J Jung; S Park; PG Kim; J Park. Environ Int, 2007, 33(3): 370-375.
[4] JR Mitchell; SS Thorgeirsson; WZ Potter; DJ Jollow; H Keiser. Clin Pharmacol Therap, 1974, 16(4), 676-
684
[5] O James; M Lesma; SH Rorberts; L Pulman; AP Douglas; AP Smith; AJ Watson. Lacent, 1975, 27, 579-
581
[6] MF Dixon; TH Hughes-Davies. Lacent, 1976, 3, 35-49
[7] LF Prescortt. Drugs, 1983, 25(3), 290-314
[8] PJ Neuvonen; H Kannisto; EL Hirvisalo. Eur J Clin Pharmacol, 1983, 24, 243-246
[9] PJ Neuvonen; M Vartiainen; O Tokola. Eur J Clin Pharmacol, 1983, 24,557-562
[10] O Lapatto-Reiniluoto; KT Kivisto; PJ Neuvonen. Brit J Clin Pharmacol, 1999, 48, 148-153.
[11] O Lapatto-Reiniluoto; KT Kivisto; PJ Neuvonen. Eur J Clin Pharmacol, 2000, 56, 286-288.
[12] TDR Tchuifon; SG Anagho; JM Ketcha; GN Ndifor-Angwafor; JN Ndi. Int J Eng Tech Res, 2014, 2, 166-
173
[13] K Mohanty; D Das; MN Biswas. Chem Eng J, 2005, 115, 121-131
[14] RL Tseng; FC Wu; RS Juang. Carbon, 2003, 41, 487-495
[15] AA Yahia. Eng Sci, 2006, 17(2), 75-100
[16] JN Ndi; MJ Ketcha. J Chem, 2013, 1-7.
[17] DJD Dina; AR Ntieche; JN Ndi; MJ Ketcha. Res J Chem Sci, 2012, 2(9), 42-49.
[18] JA Menèndez–Diaz; I Martin-Gullon. Activated Carbon Surfaces in Environmental Remediation, 2006, 1-
45
[19] MJ Martin; A Artola; MD Balaguer; M Rigola. Chem Eng J, 2003, 94(3), 231-239.

NAG Nche et al J. Chem. Pharm. Res., 2017, 9(3): 56-68 __________________________________________________________________________________________
68
[20] ASTM International. Standard Test Method for Determination of Iodine Number of Activated Carbon
2006: PA 19428-2959, United States,1-5
[21] J Avom; JM Ketcha; MRL Matip; P Germain. Afr J Sci Technol, 2001, 2(2), 1-7.
[22] S Lagergren. Handlingar Band, 1898, 24(4), 1-39.
[23] YS Ho. Scientometrics, 2004, 59, 171-177.
[24] YS Ho; G McKay. Process Biochem, 1999, 34, 451-465.
[25] YS Ho. J Hazard Mater, 2006, B136, 681-689.
[26] WJ Weber; JC Morris. J Sanitary Eng Div Am Soc, 1963, 89, 31-60.
[27] SG Anagho; JM Ketcha; DR Tchuifon; JN Ndi. Int J Res Chem Environ, 2013, 3, 1-11
[28] I Langmuir. J Am Chem Soc, 1916, 38(11), 2221-2295
[29] KR Hall; LC Eagleton; A Acrivos; T Vermeulen. Ind Eng Chem Fund. 1966: 5, 212-223.
[30] H Freundlich. Zeitschrift für Physikalische Chemie, 1906, 57,385-471.
[31] MI Temkin. J Phys Chem. 1941, 15: 296-332.
[32] M Zarrouki. Thèse de Doctorat de l'Ecole Nationale Supérieure des Mines de St Etienne, 1990.
[33] A Benhammou; A Yaacoubi; B Tanouti. J Hazard Mater, 2005, 117, 243-249.
[34] AP Terzyk; G Rychlicki. Colloid Surface A, 2000, 163, 135-150
[35] G Lü; J Hao; L Liu; H Ma; Q Fang. Chinese J Chem Eng, 2011, 19, 380-385.
[36] KG Varshney; AA Khan; U Gupta; SM Maheshwari. Colloid Surface A, 1996, 113, 19-23.
[37] TDR Tchuifon; SG Anagho; E Njanja; JN Ghogomu; NG Ndifor-Angwafor; T Kamgaing. Int J Chem Sci,
2014, 12(3), 741 -761
[38] DL Sparks. Academic Press, New York. 1989.
[39] YS Ho; G McKay. Can J Chem Eng, 1998, 76, 822-827.
[40] G Atuna; T Sismanoglu. J Environ Sci Heal A, 1996, 31, 2055-2069.
[41] D Kavitha; C Namasivayam. Bioresource Technol, 2007, 98, 14-21.
[42] DR Tchuifon; AS Gabche; NG Ndifor; KJ Mbadcam. Int J Curr Eng Technol, 2015, 5(3), 1641-1652.
Recommended