Western Kentucky UniversityTopSCHOLAR®
Masters Theses & Specialist Projects Graduate School
5-2012
Removal of Heavy Metals Using ModifiedLimestone Media: Zinc and CadmiumKeerthy MandadiWestern Kentucky University, [email protected]
Follow this and additional works at: http://digitalcommons.wku.edu/theses
Part of the Environmental Chemistry Commons, and the Materials Chemistry Commons
This Thesis is brought to you for free and open access by TopSCHOLAR®. It has been accepted for inclusion in Masters Theses & Specialist Projects byan authorized administrator of TopSCHOLAR®. For more information, please contact [email protected].
Recommended CitationMandadi, Keerthy, "Removal of Heavy Metals Using Modified Limestone Media: Zinc and Cadmium" (2012). Masters Theses &Specialist Projects. Paper 1170.http://digitalcommons.wku.edu/theses/1170


REMOVAL OF HEAVY METALS FROM DRINKING WATER USING MODIFIED LIMESTONE MEDIA: ZINC AND CADMIUM
A Thesis
Presented to The Faculty of the Department of Chemistry
Western Kentucky University Bowling Green, Kentucky
In Partial Fulfillment Of the Requirements for the Degree
Master of Science
By Keerthy Mandadi
May 2012


I dedicate this thesis to my family for always being an inspiration to me and who
supported and encouraged me the most during my challenging times here at Western
Kentucky University. Also, I dedicate this thesis to my research advisor, Dr. Cathleen
Webb, for her support and help throughout my research.

iv
ACKNOWLEDGMENTS
I would like to thank many people who made this work possible. I would start
with my research advisor, Dr. Cathleen Webb, for her constant support and guidance.
Thanks to her for having faith in me and for her timely advice which made this work
possible and also for supporting me financially, by offering me a teaching assistantship in
all of my semesters and helping me out every time I needed help. I would also like to
acknowledge Dr. Bangbo Yan for being a good mentor and giving the right advice in
order to accomplish my goals. I would like to express my sincere gratitude and thanks to
Pauline Norris for not just helping me with Inductively Coupled Plasma (ICP) at the
Advanced Materials Institute (AMI) but also for being kind always and for her valuable
suggestions. I thank Mrs. Alicia McDaniel for her support and help in providing the
required materials on time and being patient with me. Thanks to Dr. John Andersland for
his help with the SEM. I would also like to express my gratitude to the faculty and staff
of the Department of Chemistry for their valuable assistance, support, and guidance. I
also thank Mrs. Shannon Marble and Ms. Aly Anderson for always helping me and
making things easier for me. Big thanks to my research group members and all my dear
friends for their support, encouragement and friendship.
I owe my deepest gratitude to my family members who have been a constant
source of love, concern, support and strength forever. Nothing was possible without their
blessings, support and encouragement throughout this journey. Thanks for always being
with me. At last a very special thanks to Graduate Studies, Ogden College and the
Department of Chemistry for providing me this opportunity to be a part of Western
family.

v
TABLE OF CONTENTS
List of Figures...…………………………………………………………………….........vi
List of Tables……………………………………………………………………………..ix
Abstract …………………………………………………………….……………………xii
Chapter One: Introduction…………………………………………………………….......1
Chapter Two: Methods and Instrumentation ……………………………………............14
Chapter Three: Experimental Section ……………………………………………..........22
Chapter Four: Results and Discussions…………………………….................................29
Chapter Five: Conclusions…………………………........................................................78
Chapter Six: Future work ………………………………………………………………..82
Chapter Seven: Perspective………....…………………………………………………...83
Bibliography………………………………………………………………………..........84

vi
LIST OF FIGURES
Figure 1: Zinc pE-pH diagram…………………………………………………………….5
Figure 2: Cadmium pE-pH diagram ……………………………………………………...7
Figure 3: Thermoscientific ICAP 6500 ……………………………………..…………...16
Figure 4: Burrell Wrist action shaker………………………….........................................18
Figure 5: ARL Thermo X-ray Diffractometer……….......................................................20
Figure 6: Accumet basic AB15 pH meter………………………………………...….......21
Figure 7: Calibration graph for zinc obtained on ICP…………………….….………......30
Figure 8: Kinetics studies for zinc with uncoated limestone………………….…………32
Figure 9: Kinetics studies for zinc with iron-coated limestone……………………….....34
Figure 10: Batch tests with an initial concentration of 20ppm zinc in various…………...
amounts of iron-coated limestone……………………………………………………......36
Figure 11: Batch experiment for zinc with an initial concentration of 40 ppm …………....
zinc in various amounts of iron-coated limestone……………………………………….38
Figure 12: Batch experiment with an initial concentration of 100 ppm zinc………............
in various amounts of iron-coated limestone with a contact time of 24 hours……..……40
Figure 13: Effect of pH on zinc removal with an initial concentration of 40ppm …………
zinc solution in 10g of iron-coated limestone. …………………………………………..42

vii
Figure 14: Calibration graph obtained for cadmium on ICP at wavelengths…………........
214.4nm and 226.5nm…………………………………………………………………....44
Figure 15: Kinetic studies for cadmium with iron-coated limestone…………………....46
Figure 16: Kinetics experiment for cadmium with uncoated limestone ………………...48
Figure 17: Batch test for cadmium with an initial concentration of 20ppb……………...50
Figure 18: Batch test for cadmium with an initial concentration of …………….................
40ppb with 2hrs contact time…………………………………………………………….52
Figure 19: Batch test for cadmium with an initial concentration of …………………….…
100ppb with 2hrs contact time…………………………………………………………...54
Figure 20: Batch test for cadmium with an initial concentration of………………………..
20ppb with 15min contact time………………………………………………………….56
Figure 21: Batch test for cadmium with an initial concentration of …………………….…
40ppb with 15min contact time……………………………………………………..........58
Figure 22: Batch test for cadmium with an initial concentration of …………………..…..
100ppb with 15min contact time………………………………………………………....60
Figure 23: Effect of pH on cadmium removal…………………………………………...62
Figure 24: SEM image for uncoated limestone…………………………………….........66
Figure 25: Analysis report for SEM image obtained for uncoated limestone…………...67
Figure 26: SEM image for iron-coated limestone…………………………………….…68
Figure 27: Analysis report for SEM image obtained for iron-coated limestone…….…..69

viii
Figure 28: 350x SEM image for iron-coated limestone treated with zinc solution….…..70
Figure 29: 750x SEM image for iron-coated limestone treated with zinc solution……...71
Figure 30: Analysis report for SEM image obtained for iron-coated limestone……………
treated with zinc……………………………………………………………………….....71
Figure 31: SEM image for uncoated limestone treated with cadmium………………….73
Figure 32: Analysis report for SEM image obtained for uncoated limestone treated……...
with cadmium………………………………………………………………………….....74
Figure 33: XRD graph comparing peaks of uncoated limestone with calcium……………
carbonate…………………………………………………………………………………76
Figure 34: XRD graph comparing uncoated limestone with iron-coated limestone….…77

ix
LIST OF TABLES
Table 1: Table for Different chemicals and materials…………………………………...14
Table 2: Detection limits for various heavy metals………………………………….......17
Table 3: Calibration data obtained for zinc on ICP…………………...………………....29
Table 4: Kinetics experiment with an initial concentration of 20ppm……………………..
zinc in 5g of uncoated limestone………………………………………………………...31
Table 5: Kinetics Experiment with an initial concentration of 20ppm……………………..
zinc in 5g of iron-coated limestone………………………………………………………33
Table 6: Batch test with an initial concentration of 20ppm zinc solution………………….
in various amounts of iron-coated limestone with 24hrs contact time…………………..35
Table 7: Batch experiment for zinc with an initial concentration of ………………………
40ppm in various amounts of iron-coated limestone with 24hrs contact time. …………37
Table 8: Batch experiment for zinc with an initial concentration of……………………….
100ppm zinc solution in iron-coated limestone with 24hrs contact time. ……………...39
Table 9: Effect of pH on zinc removal with an initial concentration……………………....
of 40ppm zinc solution in 10g of iron-coated limestone………………………………...41
Table 10: Calibration data obtained for cadmium on ICP…………………………….....43
Table 11: Kinetics studies for cadmium with an initial concentration ……………………
of 20ppb cadmium solution in 10g of iron-coated limestone……………………………45

x
Table 12: Kinetics experiment with an initial concentration of 20ppb………………….….
cadmium solution in 10g of uncoated limestone………………………………..............47
Table 13: Batch test for cadmium with an initial concentration …………………………...
of 20ppb cadmium solution in 5g, 10g, 10g, 20g and 50g of uncoated……………………
limestone with 2hrs contact time. ……………………………………………………….49
Table 14: Batch test for cadmium with an initial concentration of…………………………
40ppb cadmium solution in 5g, 10g, 10g, 20g and 50g of iron-coated…………….……....
limestone with 2hrs contact time…………………………………………………….......51
Table 15: Batch test for cadmium with an initial concentration of ………………………...
100ppb cadmium solution in 5g, 10g, 10g, 20g and 50g of iron-coated…………………...
limestone with 2hrs contact time. ……………………………………………………….53
Table 16: Batch test for cadmium with an initial concentration of ………………………...
20ppb cadmium solution using 0.1g, 0.2g, 0.2g, 0.5g and 1g uncoated…………………....
limestone with 15min contact time………………………………………………………55
Table 17: Batch test for cadmium with an initial concentration of 40ppb …………………
cadmium solution in 0.1g, 0.2g, 0.2g, 0.5g and 1g of uncoated……………………………
limestone with 15min contact time………………………………………………………57
Table 18: Batch test for cadmium with an initial concentration of…………………………
100ppb cadmium solution in 0.1g, 0.2g, 0.2g, 0.5g and 1g of uncoated……………….…..
limestone with 15min contact time………………………………………………………59
Table 19: Effect of pH on cadmium removal……………………………………............61
Table 20: pH measurements of various solutions………………………………………..63

xi
Table 21: pH measurements zinc solutions treated with iron-coated limestone…............64
Table 22: pH measurements of cadmium solutions treated with……………………….......
uncoated limestone……………………………………………………………………….65
Table 23: Analysis data for SEM image obtained for uncoated limestone……………....67
Table 24: Analysis data for SEM image obtained for iron-coated limestone……………69
Table 25: Analysis data for SEM image obtained for iron-coated limestone ……………..
treated with zinc……………………………………………………………………….....72
Table 26: Analysis data for SEM image obtained for uncoated limestone…………………
treated with cadmium…………………………………………………………………….74

xii
REMOVAL OF HEAVY METALS FROM DRINKING WATER USING MODIFIED
LIMESTONE MEDIA: ZINC AND CADMIUM
Keerthy Mandadi May 2012 87 Pages
Directed by: Dr. Cathleen Webb, Dr. Bangbo Yan, Dr. Rui Zhang
Department of Chemistry Western Kentucky University
Heavy metal contamination is a serious concern throughout the world. Increased
concentrations in drinking water have many negative impacts on human health.
Limestone is an inexpensive and simple media for removing high concentrations of heavy
metals from drinking water supplies. Ferric based media is commonly used to remove
zinc, cadmium, lead, arsenic and other heavy metals. The drinking water standards set by
the US EPA for cadmium, zinc and arsenic are 0.005 mg/L, 5 mg/L and 0.010 mg/L
respectively. Bangladesh, parts of India, China and the United States have high
concentrations of arsenic in drinking water. Although many technologies exist for heavy
metal removal, most of these are complicated and are associated with high costs making
them ineffective and unfavorable to be used in impoverished areas.
We propose a novel method that combines the benefits of limestone with the
capacity of ferric media in an iron-coated limestone based material. Samples of water
with various concentrations of zinc and cadmium were prepared and batch tests were
performed using both uncoated and iron coated limestone and are compared in removal
efficiency. Kinetics studies showed that zinc is removed to a maximum level after 24
hours, while cadmium takes only 15 minutes. The effect of pH on removal of heavy
metals was also studied. Metals are analyzed using Inductively Coupled Plasma Emission
Spectroscopy (ICP-ES). Limestone is readily available and is also easy to coat with iron,

xiii
making this material a cost effective and affordable method to be used by developing
countries.
1
Chapter 1
INTRODUCTION
Heavy metal contamination is a serious concern as it has many negative impacts
on human health. Heavy metals are the natural components of the earth’s crust, rocks and
raw mineral ores. Heavy metals such as lead, cadmium, nickel, copper, and their
compounds are used in steel industries, batteries, electroplating techniques, paints and
pigments (Aziz, 2005). Ground water, which is a major source of drinking water, is
contaminated with arsenic and other heavy metals by natural dissolution of minerals and
volcanic eruptions as well as human activities, industrial pollution and agricultural
pollution. Other anthropogenic sources of heavy metal emissions include waste
incinerating plants and fossil fuel burning (Zereini, 2005). Fuel and power industries
generate 2.4 million tons of arsenic (As), cadmium (Cd), copper (Cu), mercury (Hg),
nickel (Ni), lead (Pb), selenium (Se), vanadium (V), zinc (Zn) annually (Browner, 1997).
Arsenic, cadmium, cobalt, nickel, lead, vanadium, zinc and platinum group elements are
considered as road specific elements since they are derived from combustion residues,
abrasion from tires, brake linings, road pavement and corrosion of galvanized protection
barriers (Zereini, 2005). Geochemical conditions are responsible for higher levels of
arsenic in ground water (Kim, 2000).
In recent years, arsenic contamination in ground water has been found to be
epidemic in ground water in Asian countries like Bangladesh, India and China (Hossain,
2005; Ferguson, 2007). Arsenic poisoning has become a great threat to the millions of
people in Bangladesh, where the ground water is in contact with arsenic-rich minerals.

2
Water arsenic levels > 50 µg/L was associated with children’s reduced intellectual
function in Araihazar, Bangladesh (Wasserman, 2004). Higher content of arsenic was
found to cause skin, lung, bladder cancers (Le, 2000). Arsenic interferes with cellular
activity by inhibiting cellular enzymes thus causing cell death and also causes lactic
acidosis and other health problems (Janet, 1997; Stocker, 2003). To protect the public
health and environment, the US EPA has set standards for pollutants in the air and
drinking water contaminants (Benner, 2004). The drinking water standards for some of
the heavy metals like cadmium, arsenic, lead and selenium set by the US-EPA
(Environmental Protection Agency) are 0.005mg/L, 0.01mg/L, 0.015mg/L and 0.05mg/L,
respectively (Peters, 1999). The secondary maximum contaminant level for zinc in
drinking water set by US EPA is 5mg/L. Many methods are used for removal of metals
such as granular activated carbon (Gu, 2005), carbonate rich aquifer materials (Romero,
2004), mixed valent iron adsorbents (Mishra and Farrell, 2005), dealginated seaweed
waste (Gonzalez, 2001), aragonite shells (Kohler, 2007), nanosorbents (Zhang, 2008) and
maghemite (Morin, 2008). Many of these materials are not suitable for the limited
resources and rural environment of countries like Bangladesh.
The EPA methods of choice for the elemental analysis of water samples are
graphite furnace atomic absorption spectroscopy, inductively coupled plasma emission
spectroscopy, X-ray fluorescence spectroscopy and stripping potentiometry (Darwish and
Blake, 2001). Immunoassays offer an alternate choice as they can be portable and can be
used at contamination sites and require minimum sample treatment (Darwish and Blake,
2001). Other methods for detecting arsenic include fluorescent microplate bioassay by

3
E.coli, electrochemical techniques and iodine solution method (Tani, 2009; Pal, 2010;
Yu, 2010; Yuan, 2010).
Heavy metals such as zinc, iron, manganese, and molybdenum are essential
micronutrients for plants, animals and human beings and are required in trace amounts.
High concentrations have negative impacts on human health. Other heavy metals such as
cadmium, vanadium, arsenic, and mercury do not have known biological uses and are
only used for industrial purposes.
Zinc (Zn) is a Group 12 element with atomic number 30. The outer shell
electronic configuration is [Ar] 3d104s2. It has a melting point of 419°C and the boiling
point is 907°C. Zinc is electropositive and has an oxidation state +2. Because of its
properties (softness and high charge to radius ratio), it has an important role in
biochemistry. It occurs in many minerals but the major ore is sphalerite, a form of zinc
sulfide (ZnS), which also contains iron and is associated with galena (PbS) (Cotton,
1999). Other minerals, from which zinc is extracted, include smithsonite (zinc carbonate),
hemimorphite (zinc silicate), wurzite (zinc sulfide) and hydrozincite (zinc carbonate).
Compounds such as zinc hydroxide [Zn(OH) 2] are basic and also amphoteric. It has
distorted hexagonal close-packed structures. Zinc reacts with oxygen on heating to form
zinc oxide (ZnO).
Zinc is mainly used for galvanization and in the preparation of alloys. It is also
used in preparation of some pharmaceuticals, cosmetics and construction materials. Both
anthropogenic and natural sources are responsible for zinc contamination in environment.
The sources include combustion exhaust (Pierson, 1974; Hildemann, 1991), galvanized

4
metal parts and railings (Legret, 1999; Barbosa, 1999), tire dust (Dannis, 1974), motor oil
and hydraulic fluid, brake linings and cement production (Councell, 2004). From the
reservoirs of Chattahoochee River basins in Georgia and Florida, sediment cores were
studied by Callender and Rice (Callender, 2000) and showed the zinc concentration is in
direct correspondence to the traffic density indicating the zinc source to be tire-wear
particles (Councell, 2004). Water samples from the Serine River basin (France) showed
the presence of zinc isotopes which were due to anthropogenic contamination (Chem,
2008).
Zinc is essential to maintain a good health but increased concentrations may cause
skin irritations, vomiting, nausea and stomach cramps. Even higher concentrations cause
liver damage, respiratory disorders and disturb protein metabolism. Some of the
industrial activities such as coal combustion, mining and galvanizing steel cause water
pollution with zinc which increases the acidity of water. Aquatic organisms may
accumulate zinc in their bodies. Zinc polluted soil may affect plants, cattle and can
contaminate the ground water. Breakdown of the organic matter is also affected by this as
zinc has a negative influence on the activities of earthworms and other microorganisms.
The activity of the soil is greatly influenced.

5
The stability of various zinc species in aqueous system at equilibrium is shown in
figure 1. Figure 1 represents the oxidation-reduction potential as a function of pH. The
upper broken line represents the oxidizing boundary of water whereas the lower line
represents reducing boundary. Drinking water is well oxygenated and has a pH of 6-8
where zinc exists as Zn2+ ions. At surface pH of 9-11, Zn(OH)2 is the dominant species
Figure 1: Zinc pE-pH diagram (Brookins, 1988).
Cadmium (Cd) is a transition metal with atomic number 48 and the outer shell
configuration is [Kr] 4d10 5s2. It has a melting point of 321°C and the boiling point is
767°C. Cadmium is present in small amounts in most of the zinc ores. Cadmium is also
present in some of the lead and copper ores. Some of the rocks mined to produce

6
phosphate fertilizers also contain large quantities of cadmium. Cadmium does not
dissolve in bases but dissolves in simple acids to produce Cd2+ ions. Cadmium hydroxide
[Cd(OH)2] is precipitated by the addition of alkali metal hydroxides. It has a solubility
product of 10-14 (Cotton, 1999).
Cadmium does not have any biological uses but is widely used for industrial
purposes. It is used in electroplating and in the preparation of rechargeable nickel-
cadmium batteries. It is also used in photovoltaic cells to convert light energy to electrical
energy. Cadmium-helium lasers are a common source of blue-ultraviolet laser light.
Cadmium, in the form of cadmium sulfide, is used as a photosensitive material in black
and white television phosphors.
Cadmium is released by volcanic activities, metal production, fossil fuel
combustion and waste incineration. Industrial processes such as battery production,
cement manufacturing, fertilizer production, smelters, iron and steel plants are also
sources of cadmium contamination in water and landfills.
Most health and safety agencies identified cadmium and cadmium compounds to
be carcinogenic. Cadmium can cause a variety of effects such as nausea, vomiting,
diarrhea, muscle cramps, salivation, sensory disturbances, liver injury, convulsions,
shock and renal failure. After ingestion or inhalation, cadmium accumulates in the
kidney, liver, lungs, and gastrointestinal tract where it causes progressive toxic effects,
including cancer and renal damage (Darwish and Blake, 2001).
Cadmium exists as Cd2+ ions in the drinking water pH range as shown in figure 2.
Cadmium hydroxide [Cd(OH)2] is the dominant species at a pH greater than 10.

7
Figure 2: Cadmium pE-pH diagram (Brookins, 1988).
Dealginated seaweed waste (Gonzalez, 2001) was used for the biosorption of
cadmium and showed a removal efficiency of 91% in 5 minutes. After 1 hour contact
time, the residual cadmium concentration was found to be 0.8mg/L from an initial
concentration of 10mg/L. Ion-exchange is the proposed mechanism for removal of the
metal. The effect of pH on cadmium biosorption was also observed and showed an
optimal cadmium removal at a pH of 6. Other toxic metals like lead (Pb), copper (Cu),
nickel (Ni) and chromium (Cr) can also be removed using this sorbent material.

8
Aragonite shells (Kohler, 2007) were used to remove cadmium from wastewaters
where the cadmium metal bearing solutions were treated with shell fragments of various
diameters and the uptake of metal crystallites on to the shell surfaces was thought to be
through heterogeneous nucleation. Surface precipitation of otavite aided in cadmium
removal. The presence of other metals like lead and zinc ≤ 0.3mM does not have any
effect on cadmium removal but at higher concentrations lead and zinc compete with
cadmium for the carbonate ions which reduces the cadmium removal rates significantly
whereas presence of magnesium shows slight enhancement in removal. Zinc and lead
were removed faster than cadmium using this method precipitating as Zn5(CO3)2(OH) 6,
PbCO3 and Pb3(CO3)2(OH) 2.
In near neutral waters, sphalerite dissolution can be accelerated by the oxidation-
reduction reactions involving iron. This was proposed by observing the aqueous metal
concentrations and pH of pond water and stream water in contact with high iron
sediments. Zinc was observed to undergo partitioning into secondary iron hydroxide and
ironoxyhydroxide. Cadmium uptake by calcite takes place only in water with a pH
greater than 7 (Carroll, 1998).
Different strains of algae were studied for its uptake capacity for metals like
cadmium, zinc, lead and nickel from the aqueous solution through desorption. Lead was
removed preferably over the other metals. Phosphorylation of biomass enhanced the
binding capacity of Lyngbya taylorii with the metals (Klimmek, 2001).
Nanostructured sorbents (Lee, 2005) such as in situ generated agglomerated silica
and montmorillonite were also used to capture cadmium species. Suppression of

9
cadmium nucleation was observed using silica which had a higher surface area and
showed a firm binding through chemisorption. Polymeric cation exchanger containing
nano-Zr(HPO3S)2 is used for the selective sorption of lead, cadmium and zinc (Zhang,
2008).
Previously hydrated lime was used to remove arsenic from the flue gas. Arsenate
and arsenite adsorption and desorption behavior on co-precipitated aluminum: iron
hydroxides was also studied (Masue, 2007). Other methods proposed for arsenic removal
utilized rice husk (Nurul, 2006), hematite, feldspar, aquifer material, schwertmannite and
ferrihydrite (Carlson, 2002). A carbonate rich aquifer (Romero, 2004) produces arsenic
retention by co-precipitation of complex calcium arsenates or arsenate adsorption onto
calcite or clay materials.
Arsenic is released into the drainage and the environment during hard rock mining
and leaching of metals and metalloids. Sorption by carbonate rich aquifer material is
designed to control the arsenic mobility and retain it during the flow of polluted natural
waters. Batch experiments were conducted which showed that 35-90% of soluble arsenic
is retained on carbonate rich aquifer material in a pH range of 7-9. Three samples of
limestone with minerals hydrous ferric oxides, calcite and a range from hydrous ferric
oxides and calcite were used which showed that adsorption and co-precipitation may be
the main mechanisms involved in controlling arsenic mobility. In acidic and near neutral
solutions hydrous ferric oxides play an important role in arsenic sorption (Romero, 2004).
Research was conducted to determine if Fe (III) containing iron oxides (Yoko,
2007) could produce enough ferric hydroxides to remove minute levels of arsenic in

10
packed–bed reactors and simultaneously which could prevent bed clogging by avoiding
excessive oxide generation. Various column experiments showed the effect of hydraulic
detention time, solution pH value, influent arsenic concentration, and concentration of
dissolved oxygen on removal efficiency. Arsenic removal rates were higher for media
which had higher corrosion rates and removal increased with an increase in the dissolved
oxygen levels since Fe2+ released by corrosion of media oxidizes at a faster rate.
The primary mechanism involved in arsenic removal by both granular iron oxides
and zerovalent iron (ZVI) filings (Dhananjay and James, 2005) is formation of mono-
dentate and bi-dentate complexes between arsenic species and ferric hydroxides.
Akaganeite and goethite are the granular iron oxide forms generally used to eliminate
arsenic in packed bed adsorption systems by many public utilities. In some developing
nations, zerovalent iron filings are added to household filters and permeable reactive
barriers to remove arsenic. For greater adsorption capacity, an adsorbent should have
high porosity, obtained by granulation. Granular ferric hydroxides have slow adsorption
kinetics because intra granular diffusion may limit arsenic removal in spite of their rapid
complexation with arsenic species. Dissolved oxygen oxidizes Fe2+ followed by cationic
hydrolysis which generates ferric hydroxides that act as adsorption sites for both As (V)
and As (III) compounds.
Granular activated carbon and iron containing adsorbent (As-GAC) (Gu, 2005)
was developed for efficient removal of arsenic from drinking water. This method mainly
uses granular activated carbon (GAC) as the supporting medium for ferric iron which in
turn is charged with ferrous chloride (FeCl2). With approximately 6% iron content, As-
GAC had the highest arsenic removal efficiency but further increases actually reduced

11
arsenic adsorption. Removal efficiency was observed in a pH range of 4.4-11 but usually
reduced above pH 9. Both As (V) and As (III) could be removed to below 10µg/L when
groundwater with a concentration of 50µg/L was treated using this method. The
important characteristic of activated carbon is its porous structure which gives it a high
specific surface area that ranges from hundreds to two thousand m2/g.
The internal pores with specific dimensions act as sites for contaminant
adsorption during waste water treatment. The adsorbent abilities were calculated by
performing column and batch studies. The adsorption efficiency for arsenic is decreased
by 50% with the use of larger sized media. During and after the iron impregnation, the
granular nature of activated carbon is conserved and, hence, can be conveniently used for
packed-bed applications. “The adsorbent characteristics of GAC were studied using
Energy Dispersive Spectroscopy (EDS), Scanning Electron Microscope (SEM), X-Ray
Diffraction (XRF) and nitrogen absorption analyses for Brunauer-Emmett-Teller (BET)
specific surface area and mesoporous size distribution” (Gu, 2005).
Electrochemical pH adjustment and co-precipitation with iron hydroxide is
mainly used to treat acid mine drainage (AMD).The biological oxidation of sulfide
materials containing arsenic forms such as arsenite (III) and arsenate As (V) along with
large amount of dissolved iron concentrations produce acid mine drainage. By
electrochemically reducing H+ to elemental hydrogen, pH is raised and arsenic is co-
precipitated with iron (III) hydroxide to remove arsenic from synthetic AMD. This is
followed by catholyte aeration. Four different AMD model systems were studied. These
were Fe (III)/As (V), Fe (III)/As (III), Fe (II)/As (V) and Fe (II)/As (III). Solutions of 300
mg/L of Fe (II), 260mg/L of Fe (III) and 8mg/L of As (V) and As (III) were the initial

12
concentrations used. Irrespective of the pH adjustment method (done either by adding
NaOH or electrochemically), independent results were obtained and all four systems
showed quantitative arsenic removal efficiency. Batch tests with Fe (II)/As (V) showed
that some elemental iron is deposited on the cathode at higher pH values. When effluent
pH is about 4-7, around 85% removal efficiency is observed and the concentrations were
reduced to below drinking water standards (10µg/L) (Jenny, 2003).
Arsenic uptake by calcite (Alexandratos, 2007) was studied by macroscopic and
spectroscopic studies which indicated that uptake mechanism was by both adsorption and
co-precipitation. Batch experiments indicated that sorption was rapid in the initial stages
and gradually decreased as the sorption sites decreased. Atomic force microscopic studies
(Duckworth, 2004) indicate that dissolution and adsorption rates of the adsorbent affects
the alkalinity and redox state of natural waters. AFM studies of fluorite removal by
calcite again suggest that both adsorption and precipitation occur. Adsorption of fluoride
on the surface of calcite and precipitation of fluorite at step edges and kinks where
dissolved calcium concentration is highest (Turner, 2005). A highly efficient and low cost
technique was developed for the removal of heavy metals using combinations of charcoal
and limestone. Coconut carbon can also be used as adsorbent for the removal process
(Aziz, 2005). Gravel, limestone, zeolite and cocopeat are used as wetland media and
found to enhance the removal rate of arsenic and other heavy metals (Lizama Allende,
2011). Addition of sodium carbonate drop wise to limestone was found to increase the
removal rates of heavy metals (Zhigang, 2007).
The main limitations of treatment processes or the technologies such as
coagulation/precipitation, membrane separations fluidized bed reactors (Zhou, 1999;

13
Chen, 2000), biosorption (An, 2001; Gardea, 2004) and ion exchange are that most of
them are expensive and are not suitable for small water systems with limited resources.
There is an increased necessity to reduce the heavy metal concentrations in drinking
water to drinking water standards to protect the consumer from hazardous effects.
Limestone is a readily available and inexpensive material which can be used for arsenic
and other heavy metal removal such as zinc, cadmium, selenium and lead.
Limestone is a sedimentary rock and is chiefly composed of minerals such as
calcite and aragonite. Chemically, limestone is primarily calcium carbonate (CaCO3). It
may contain dolomite (CaMg(CO3)2). Usually limestone has a light or white color but
sometimes is tan or grey.Limestone is also seen in different colors because of the
impurities such as sand, clay, organic materials, iron oxides and hydroxides. Among
sedimentary rocks limestone makes upto 10% of the total. Various types of limestone
such as pure limestone, carbonaceous limestone and brecciated limestone were found to
have varying degrees of heavy metal removal (Zhigang, 2009). Limestone is pulverized
and then sieved so that smaller particles with enhanced surface area are produced (Silva,
2010).
The main purpose of this research is to develop a method to reduce elevated zinc
and cadmium concentrations in drinking water to normal US EPA drinking water
standards, which is cost-effective, highly efficient, and environmentally friendly with no
hazardous waste products and which could be readily applied to real water samples, for
both small and large water bodies.

14
Chapter 2
METHODS AND INSTRUMENTION
1. Materials and Chemicals
The materials and chemicals used for the research are listed in Table 1.
Table 1: Materials and manufacturers/providers.
Chemical name Purchased from
Limestone (#16/60) Pete Lien and Sons, LaPorte, CO
Ferric chloride (FeCl3. 6H2O) Mallinckrodt
Zinc (1000 ppm) Inorganic Ventures
Cadmium (1000 ppm) Inorganic Ventures
Whatman cellulose nitrate membrane filters
(0.45 µm, 25mm)
Fisher Scientific
Millipore Swinnex Filter Holder Fischer Scientific
Sodium hydroxide (NaOH)
(ACS grade)
Fischer Scientific
Buffers (pH 4 and pH 7) Fischer Scientific
Nitric acid (Concentrated, Trace metal grade) Fischer Scientific

15
2. Inductively Coupled Plasma Emission Spectroscopy (ICP-ES)
Elements dissolved in aqueous or organic liquids can be quantitatively and
qualitatively analyzed by inductively coupled plasma spectroscopy. Solid samples may
also be digested and analyzed using this system. The excited atoms or ions produced by
inductively coupled plasma emit the electromagnetic radiation at wavelengths
characteristic of particular elements. Detection of the specific element is based upon the
emission of energy at characteristic wavelengths (Skoog, 1998).
Working Principle
It is composed of two parts: Inductively coupled plasma (ICP) and optical
spectrometer. Three concentric glass quartz tubes are present in the ICP torch. This
quartz torch is surrounded partly by a radiofrequency (RF) generator as can be seen in
figure 3. Plasma is created by Argon gas. The radiofrequency signal, which is of high
power, flows into the coil. An electromagnetic field is created inside the coil when torch
is turned on. The RF generator is a high power radio transmitter that creates the RF signal
and drives the “work coil” like a radio transmitter antenna.
The ionization process is initiated as the argon gas flows through the discharge arc.
The Tesla unit ignites argon gas that flows through the torch. As the plasma ignites, the
Tesla unit is switched off. The ionization of argon gas occurs in the intense
electromagnetic field, which flows to the RF coil magnetic field in a rotational
symmetrical pattern.

16
Charged particles collide inelastically with neutral argon atoms and produce stable
high temperature plasma of 7000K. Organic or aqueous samples are delivered into a
nebulizer by a peristaltic pump. This is converted into mist and directly delivered to the
plasma flame. The sample breaks into ions as it collides with charged ions present in the
plasma and with that of electrons. Different molecules break into atoms and atomic ions
again combine in plasma repeatedly remitting radiation at the characteristic wavelengths
of the elements involved. Detection limits are listed in Table 2.
Figure 3: Thermo scientific ICAP 6500

17
Table 2: Detection limits for various heavy metals.
Metal µg/L Cadmium 35
Zinc 2.3 Arsenic 1.2 Copper 3.6 Lead 28
Selenium 50
ICP Advantages
• Detection to ppm-ppb levels of numerous trace metals in a sample is possible.
• The important feature of ICP-AES over ICP-AAS is that it is a multi-elemental
analysis technique and requires much less time.
• It also requires very low sample volumes.
ICP Disadvantages
• Inert gases and some non-metals such as carbon, nitrogen and oxygen cannot be
analyzed by ICP-ES.
• It is an expensive instrument compared to ICP-AAS and is affected by the
interferences due to sample preparation and plasma operating conditions.
Applications
• ICP-AES is frequently used for the analysis of trace metals in soil and coal
samples.
• It is also used in motor oil analysis and mineral processing.

18
3. Wrist shaker
The Burrell Wrist action shaker, model 75 shown in figure 4 is used to perform
batch tests and to coat the base material. The shaker is constructed in such a way that it
may hold conical flasks of 100mL to 1000mL. Flasks that are mounted on a spindle and
oscillate through small amplitude shaking. Electronic regulator controls the action of
shaking speed.
Figure 4: Burrell Wrist Action Shaker
4. Scanning Electron Microscope (SEM)
Operation
SEM (Scanning Electron Microscopy) has higher resolution in comparison to
standard light microscope and used for observing the surface structure of the limestone
particles. The JEOL JSM-5400 LV SEM was the used to analyze the samples.

19
Preparation of Samples for SEM
The samples must be electrically conductive, dry of water and solvents that can
vaporize in vacuum and should be firmly mounted. Mounting of the samples for SEM is
usually done on metal holders called stubs. The samples are mounted on the stub with the
help of a mounting medium. The mounting medium commonly used is glue or tape. The
mounting medium should be stable upon production of electrons, should release minimal
levels of air or solvents, should not interfere with the image produced in SEM, be
mechanically stable and should also have electrical conductivity (Flegler, 1993).
If any of the samples are nonconductive they are usually coated to make the
samples electrically conductive. Mostly the nonconductive materials are coated with
very thin layers of gold. Depending on nature of sample other methods like air-drying,
drying using solvent, vapor fixation, vapor prefixation, freeze drying, and poly-L-lysine
procedure may be used.
5. X-ray diffractometer
X-ray diffraction studies determine the arrangement and the spacing of atoms in a
crystalline material. Both qualitative and quantitative information about the compounds
present in a solid sample can be provided by the x-ray powder diffraction. It is a non-
destructive analytical technique that gives information about the chemical composition,
crystalline structure and physical properties of materials and thin films. The scattered
intensity of an x-ray beam hitting a sample is measured as a function of incident and
scattered angle, polarization and wavelength. Each crystalline substance has a unique X-
ray diffraction pattern. By comparing the pattern of the unknown with a known

20
compound, the chemical identity of the material is obtained (Skoog, 1998). The ARL
Thermo X-ray diffractometer at the Advanced Materials Institute (AMI) shown in figure
5 was used for the analysis of the samples.
Figure 5: ARL Thermo X-ray diffractometer

21
6. pH meter
The Accumet basic AB15 pH meter shown in figure 6 is used to measure the pH
of the solutions. It consists of a glass electrode connected to an electronic meter that
measures and displays the pH reading. Buffer solutions of pH 4 and pH 7 were used to
calibrate the instrument.
Figure 6: Accumet basic AB15 pH meter

22
Chapter 3
EXPERIMENTAL SECTION
1. Preparation of working standards
Preparation of 0.1M iron chloride solution:
A sample of 27.00 g of FeCl3· 6H2O was dissolved in 10 mL of nanopure water
and transferred to a 1000 mL volumetric flask. The volume is made to 1000 mL with
nanopure water.
Preparation of iron-coated limestone:
A sample of 100.00 g of limestone was placed into a round bottom flask. A 100
mL solution of 0.1M iron (III) chloride (FeCl3) was then placed in the flask. The flask
was placed on a shaker. After 24 hours few drops of sodium hydroxide were added to
shock the solution, the granules were rinsed with nanopure water and then air dried.
Preparation of 1M sodium hydroxide solution:
A sample of 4.00 g of sodium hydroxide was dissolved in 10 mL of nanopure water
which was then transferred to a 100 mL volumetric flask. The volume is made to 100 mL
with nanopure water.
Preparation of 20 ppm zinc solution:
An aliquot of 20 mL of 1000 ppm standard zinc solution was placed in a 1000 mL
volumetric flask and the volume is made up to 1000 mL with nanopure water.

23
Preparation of 40 ppm zinc solution:
An aliquot of 40 mL of 1000 ppm standard zinc solution was placed in a 1000 mL
volumetric flask and the volume is made up to 1000 mL with nanopure water.
Preparation of 100 ppm zinc solution:
An aliquot of 100 mL of 1000 ppm standard zinc solution was placed in a 1000
mL volumetric flask and the volume is made up to 1000 mL with nanopure water.
Preparation of 100 ppm cadmium solution:
An aliquot of 10 mL of 1000 ppm standard cadmium solution was placed in a 100
mL volumetric flask and the volume is made up to 100 mL with nanopure water.
Preparation of 20 ppb cadmium solution:
An aliquot of 0.2 mL of 100 ppm standard cadmium solution was placed in a
1000 mL volumetric flask and the volume is made up to 1000 mL with nanopure water.
Preparation of 40 ppb cadmium solution:
An aliquot of 0.4 mL of 100 ppm standard cadmium solution was placed in a
1000 mL volumetric flask and the volume is made up to 1000 mL with nanopure water.
Preparation of 100 ppb cadmium solution:
An aliquot of 1.0 mL of 100 ppm standard cadmium solution was placed in a
1000 mL volumetric flask and the volume is made up to 1000 mL with nanopure water.
2. Methods and Experimental Design
Kinetics experiment for zinc with uncoated limestone
A sample of 5 g of uncoated limestone (#16/60) was placed into 10 different 500
mL round bottom flasks and 100 ml of 20 ppm zinc solution was added to each of them.
The pH of the 20 ppm zinc standard was measured before being added to the flasks. The
24
flasks were then placed on a rotary shaker for 0.25, 0.5, 0.75, 1, 1.5, 2, 3, 4, 10 and 24
hours. The speed of the shaker was set to 1-2 cycles/sec. The solution was micro filtered
using a 0.45µ Whatman cellulose nitrate membrane filter and collected into 10 mL vials.
The pH was measured and the metal concentration was analyzed by ICP-ES.
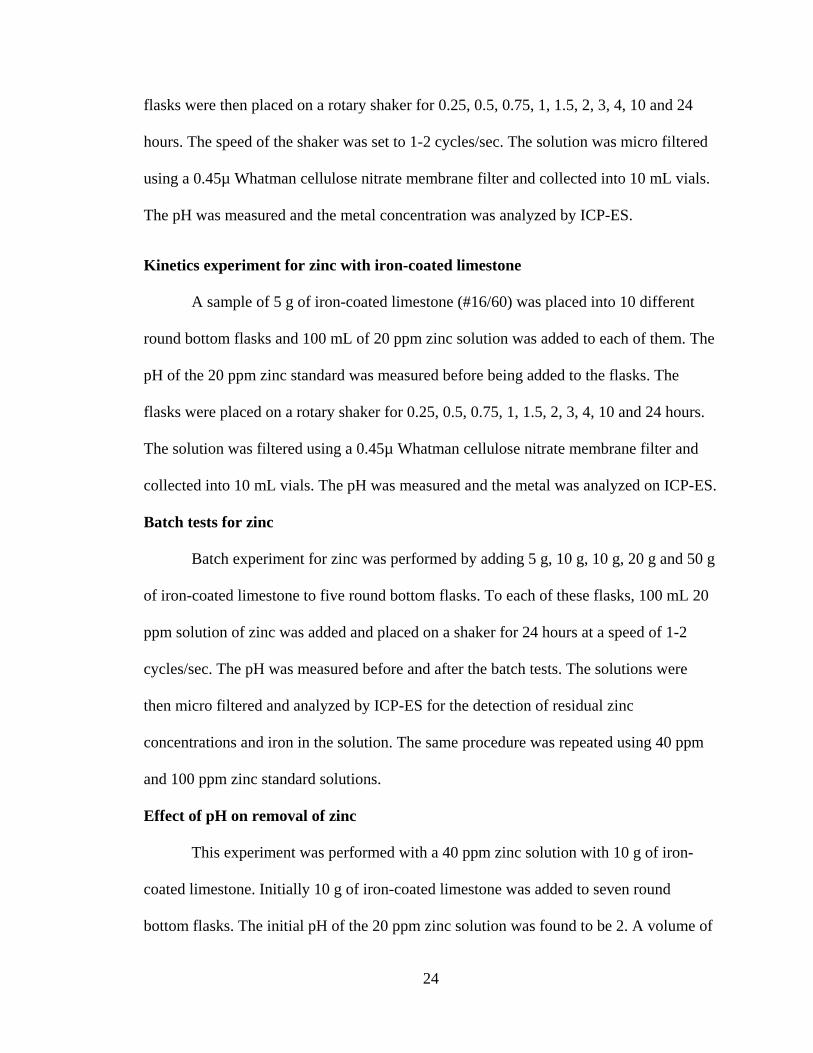
Kinetics experiment for zinc with iron-coated limestone
A sample of 5 g of iron-coated limestone (#16/60) was placed into 10 different
round bottom flasks and 100 mL of 20 ppm zinc solution was added to each of them. The
pH of the 20 ppm zinc standard was measured before being added to the flasks. The
flasks were placed on a rotary shaker for 0.25, 0.5, 0.75, 1, 1.5, 2, 3, 4, 10 and 24 hours.
The solution was filtered using a 0.45µ Whatman cellulose nitrate membrane filter and
collected into 10 mL vials. The pH was measured and the metal was analyzed on ICP-ES.
Batch tests for zinc
Batch experiment for zinc was performed by adding 5 g, 10 g, 10 g, 20 g and 50 g
of iron-coated limestone to five round bottom flasks. To each of these flasks, 100 mL 20
ppm solution of zinc was added and placed on a shaker for 24 hours at a speed of 1-2
cycles/sec. The pH was measured before and after the batch tests. The solutions were
then micro filtered and analyzed by ICP-ES for the detection of residual zinc
concentrations and iron in the solution. The same procedure was repeated using 40 ppm
and 100 ppm zinc standard solutions.
Effect of pH on removal of zinc
This experiment was performed with a 40 ppm zinc solution with 10 g of iron-
coated limestone. Initially 10 g of iron-coated limestone was added to seven round
bottom flasks. The initial pH of the 20 ppm zinc solution was found to be 2. A volume of
25
100 mL of 20 ppm zinc solution was added to the first flask. Then the pH of the 20 ppm
zinc solution was adjusted to pH 4, 5, 6, 7, 8 and 9 with 1M sodium hydroxide solution.
A 100 mL solution of each adjusted pH was added to the other five round bottom flasks.
The six flasks were then placed on the rotary shaker for 24 hours at a speed of 1-2
cycles/sec. The solutions were then micro filtered and analyzed by ICP-ES.
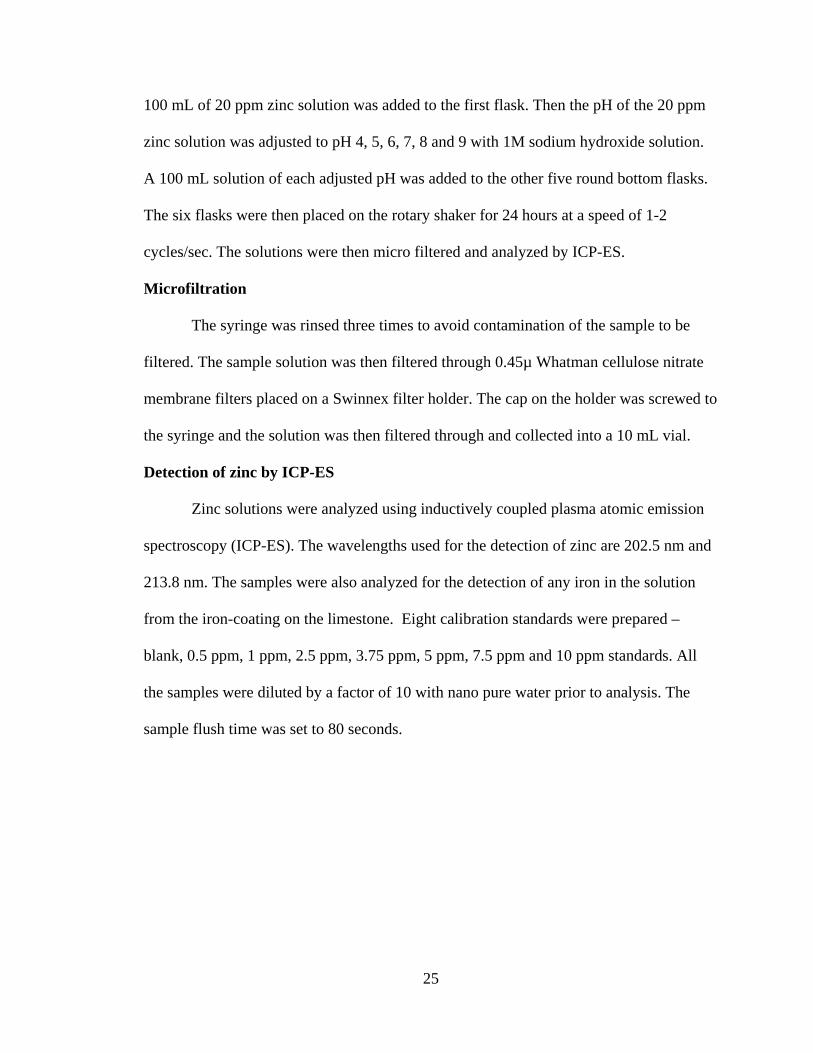
Microfiltration
The syringe was rinsed three times to avoid contamination of the sample to be
filtered. The sample solution was then filtered through 0.45µ Whatman cellulose nitrate
membrane filters placed on a Swinnex filter holder. The cap on the holder was screwed to
the syringe and the solution was then filtered through and collected into a 10 mL vial.
Detection of zinc by ICP-ES
Zinc solutions were analyzed using inductively coupled plasma atomic emission
spectroscopy (ICP-ES). The wavelengths used for the detection of zinc are 202.5 nm and
213.8 nm. The samples were also analyzed for the detection of any iron in the solution
from the iron-coating on the limestone. Eight calibration standards were prepared –
blank, 0.5 ppm, 1 ppm, 2.5 ppm, 3.75 ppm, 5 ppm, 7.5 ppm and 10 ppm standards. All
the samples were diluted by a factor of 10 with nano pure water prior to analysis. The
sample flush time was set to 80 seconds.

26
Methods and Experimental Design: Cadmium
Kinetics experiment for cadmium with uncoated limestone
A sample of 10 g of uncoated limestone (#16/60) was placed into 10 different 500
mL round bottom flasks and 100 ml of 20 ppb cadmium solution was added to each of
them. The pH of 20 ppb cadmium standard was measured before adding to the flasks.
The flasks were then placed on a rotary shaker for 0.25, 0.5, 0.75, 1, 1.5, 2, 3, 4, 10 and
24 hours. The speed of the shaker was set to 1-2 cycles/sec. The solution was micro
filtered using a 0.45µ Whatman cellulose nitrate membrane filter and collected into 10
mL vials. The pH was measured and the metal concentration was analyzed by ICP-ES.
Kinetics experiment for cadmium with iron-coated limestone
A sample of 10 g of iron-coated limestone (#16/60) was placed into 10 different
round bottom flasks and 100 mL of 20 ppb cadmium solution was added to each of them.
The pH of 20 ppb cadmium standard was measured before adding to the flasks. The
flasks were placed on a rotary shaker for 0.25, 0.5, 0.75, 1, 1.5, 2, 3, 4, 10 and 24 hours.
The solution was filtered using a 0.45µ Whatman cellulose nitrate membrane filter and
collected into 10 mL vials. The pH was measured and the metal was analyzed on ICP-ES.
Batch tests for cadmium
Batch experiment for cadmium was performed by adding 5 g, 10 g, 10 g, 20 g and
50 g of uncoated limestone to five round bottom flasks. To each of these flasks, 100 mL
20 ppb solution of cadmium was added and placed on a shaker for 2 hours at a speed of
1-2 cycles/sec. The pH was measured before and after the batch tests. The solutions were
then micro filtered and analyzed by ICP-ES for the detection of residual cadmium

27
concentrations and iron in the solution. The same procedure was repeated using 40 ppb
and 100 ppb cadmium standard solutions.
A second set of batch experiment was done using 0.1 g, 0.2 g, 0.2 g, 0.5 g and 1 g
of uncoated limestone and reducing the contact time to 15minutes. Firstly, 0.1 g, 0.2 g,
0.2 g, 0.5 g and 1 g of uncoated limestone was taken and transferred to 5 round bottom
flasks. To each of these flasks, 20 ppb solution of cadmium was added and placed on a
shaker for 15minutes at a speed of 1-2. The pH was measured before and after doing the
batch tests. The solutions are then micro filtered and analyzed by ICP-ES. The same
procedure was repeated using 40 ppb and 100 ppb cadmium standard solution.
Effect of pH on cadmium removal
This experiment was performed with a 40 ppb cadmium solution with 10 g of
iron-coated limestone. Initially 10 g of uncoated limestone was added to seven round
bottom flasks. The initial pH of 20 ppb zinc solution was found to be 3.6. A volume of
100 mL of 20 ppb cadmium solution was added to the first flask. Then the pH of the 20
ppb cadmium solution was adjusted to pH 4, 5, 6, 7, 8 and 9 with 1M sodium hydroxide
solution. A 100 mL solution of each adjusted pH was added to the other five round
bottom flasks. The six flasks are then placed on the rotary shaker for 2 hours at a speed of
1-2 cycles/sec. The solutions were then micro filtered and analyzed by ICP-ES.
Detection of cadmium by ICP-AES
Cadmium solutions were analyzed using inductively coupled plasma atomic
emission spectroscopy (ICP-ES). The wavelengths used for the detection of zinc are
214.4 nm and 226.5 nm. Seven calibration standards were prepared – blank, 5 ppb, 10

28
ppb, 25 ppb, 50 ppb, 75 ppb and 100 ppb standards. Full strength samples were ran
without any dilution. The sample flush time was set to 100 seconds.
Microscopic Studies
Pictures of plain limestone, iron-coated limestone, iron-coated limestone treated
with zinc and uncoated limestone treated with cadmium were taken using scanning
electron microscope (SEM).

29
Chapter 4 RESULTS AND DISCUSSIONS
1. Zinc Results
Zinc samples were analyzed using ICP-ES. The calibration data obtained is shown in
Table 3 and Figure 7.
Table 3: Calibration data obtained for zinc on ICP.
Zinc Concentration
(ppm)
Signal Intensity
(202.5 nm)
Signal Intensity
(213.8 nm)
0 127.7 132.8
0.5 8952 9192
1 17530 18130
2.5 43870 45050
3.75 65910 67320
5 86790 88070
10 168000 169000

30
Figure 7 shows the calibration curve obtained for zinc from ICP-ES at the element
wavelengths of 202.5 nm and 213.8 nm. Both lines are linear with R2 values of 0.996 and
0.998, respectively. The x-axis represents the concentrations of the zinc metal. The y-axis
represents signal intensity ratio for the instrument.
Figure 7: Calibration graph for zinc obtained on ICP

31
The effectiveness of the method was studied by performing kinetics experiment
with iron coated limestone and uncoated limestone. Table 4 and Figure 8 shows the
results obtained for kinetics experiment with uncoated limestone.
Table 4: Kinetics experiment with an initial concentration of 20 ppm zinc in 5g of
uncoated limestone.
Time (hours) Concentration of zinc
(ppm) (202.5 nm) (± 0.15)
Concentration of zinc
(ppm) (213.8 nm) (± 0.15)
0 20.00 20.00
0.25 18.25 18.10
0.5 18.82 16.63
0.75 18.48 16.22
1 18.44 16.12
1.5 16.66 14.66
2 18.89 16.58
3 17.98 17.73
4 19.03 18.77
10 17.9 17.66
24 9.38 8.20

32
Figure 8 shows a kinetics experiment performed with a fixed initial concentration
of 20 ppm zinc solution treated with 5 grams of uncoated limestone for various time
intervals. The x-axis represents the time in hours and the y-axis represents the residual
concentration of the zinc metal after treatment with plain limestone. The two series
represent the concentrations of zinc at wavelengths 202.5 nm and 213.8 nm. It showed
the maximum removal after 24 hours. Only about 50% of the metal was removed using
plain limestone.
Figure 8: Kinetics studies for zinc with uncoated limestone
33
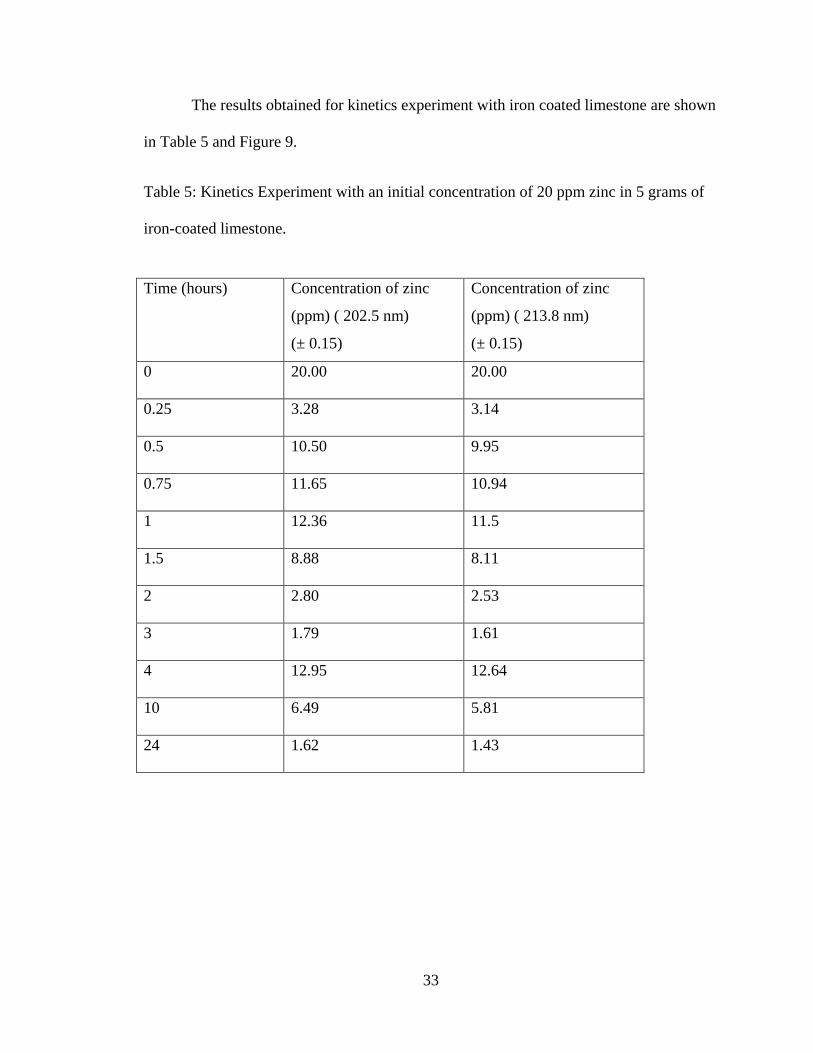
The results obtained for kinetics experiment with iron coated limestone are shown
in Table 5 and Figure 9.
Table 5: Kinetics Experiment with an initial concentration of 20 ppm zinc in 5 grams of
iron-coated limestone.
Time (hours) Concentration of zinc
(ppm) ( 202.5 nm)
(± 0.15)
Concentration of zinc
(ppm) ( 213.8 nm)
(± 0.15)
0 20.00 20.00
0.25 3.28 3.14
0.5 10.50 9.95
0.75 11.65 10.94
1 12.36 11.5
1.5 8.88 8.11
2 2.80 2.53
3 1.79 1.61
4 12.95 12.64
10 6.49 5.81
24 1.62 1.43

34
Figure 9 represents the kinetic studies performed with an initial concentration of
20 ppm zinc solution in contact with 5 grams of iron-coated limestone for various time
intervals. The x-axis represents the time in hours and the y-axis represents the zinc metal
concentration, post treatment with iron-coated limestone. Zinc metal was found to be
reduced in higher amounts with iron coated limestone in comparison to coated limestone.
More than 90% of the zinc was removed by 24 hours of treatment with iron-coated
limestone. Drinking water standards were met initially at less than 2 hours. The
oscillatory results may be due to two removal mechanisms (precipitation as
Zn (OH)2(s) and chemisorption through the iron coating).
Figure 9: Kinetics studies for zinc with iron-coated limestone
35
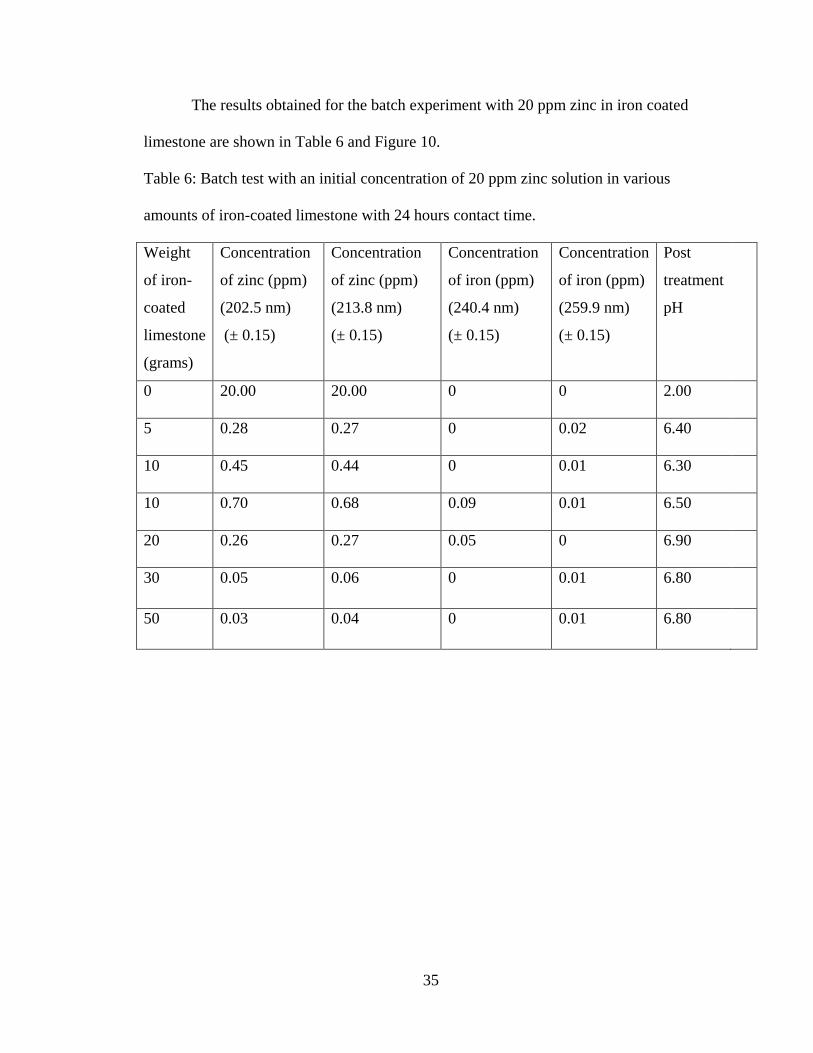
The results obtained for the batch experiment with 20 ppm zinc in iron coated
limestone are shown in Table 6 and Figure 10.
Table 6: Batch test with an initial concentration of 20 ppm zinc solution in various
amounts of iron-coated limestone with 24 hours contact time.
Weight
of iron-
coated
limestone
(grams)
Concentration
of zinc (ppm)
(202.5 nm)
(± 0.15)
Concentration
of zinc (ppm)
(213.8 nm)
(± 0.15)
Concentration
of iron (ppm)
(240.4 nm)
(± 0.15)
Concentration
of iron (ppm)
(259.9 nm)
(± 0.15)
Post
treatment
pH
0 20.00 20.00 0 0 2.00
5 0.28 0.27 0 0.02 6.40
10 0.45 0.44 0 0.01 6.30
10 0.70 0.68 0.09 0.01 6.50
20 0.26 0.27 0.05 0 6.90
30 0.05 0.06 0 0.01 6.80
50 0.03 0.04 0 0.01 6.80

36
Figure 10 shows the batch experiment for an initial concentration of 20 ppm zinc
solution in various amounts of iron-coated limestone. The x-axis represents the varying
weights of iron-coated limestone used and the y-axis represents concentration of zinc for
both elemental wavelengths 202.5 nm and 213.8 nm. It also represents the concentration
of iron at wavelengths 240.4 nm and 259.9 nm. It was observed that 50 grams of
limestone was efficient in reducing 99.8% of metal. The maximum level of iron observed
was 0.09 ppm in the solution treated with 10 grams of iron-coated limestone. The
drinking standard was met with all weights of iron coated limestone with a reduced zinc
concentration to below 5 ppm.
Figure 10: Batch tests with an initial concentration of 20 ppm zinc in various amounts of
iron-coated limestone.

37
The results obtained for the batch experiment with 40 ppm zinc in iron coated
limestone are shown in Table 7 and Figure 11.
Table 7: Batch experiment for zinc with an initial concentration of 40 ppm in various
amounts of iron-coated limestone with 24 hours contact time.
Weight of
iron-
coated
limestone
(grams)
Concentration
of zinc (ppm)
(202.5 nm)
(± 0.15)
Concentration
of zinc (ppm)
(213.8 nm)
(± 0.15)
Concentration
of iron (ppm)
(240.4 nm)
(± 0.15)
Concentration
of iron (ppm)
(259.9 nm)
(± 0.15)
Post
treatment
pH
0 40.00 40.00 0 0 2.2
5 0.77 0.74 0 0 6.7
10 4.44 4.26 0.01 0.01 6.9
10 5.62 5.38 0 0 7.0
20 4.67 4.45 0 0.03 7.2
50 0.82 0.79 0 0. 7.0

38
Figure 11 represents the batch experiment with an initial concentration of 40 ppm
zinc solution in varying amounts of iron-coated limestone. The x-axis represents the
weights of iron-coated limestone used to treat 40 ppm zinc solution. The y-axis represents
the residual concentration of zinc after the treatment. About 98% of the metal was
removed using 5 grams and 50 grams of limestone. The y-axis also represents the iron
concentrations in the treated zinc solutions. The maximum iron concentration was 0.02
ppm present in the solution treated with 20 grams of iron-coated limestone. The drinking
water standards were met by all the different weights of iron-coated limestone used.
Figure 11: Batch experiment for zinc with an initial concentration of 40 ppm zinc in
various amounts of iron-coated limestone.

39
The results obtained for the batch experiment with 100 ppm zinc in iron coated
limestone are shown in Table 8 and Figure 12.
Table 8: Batch experiment for zinc with an initial concentration of 100 ppm zinc solution
in iron-coated limestone with 24 hours contact time.
Weight
of iron-
coated
limestone
(grams)
Concentration
of zinc (ppm)
(202.5 nm)
(± 0.15)
Concentration
of zinc (ppm)
(213.8 nm)
(± 0.15)
Concentration
of iron (ppm)
(240.4 nm)
(± 0.15)
Concentration
of iron (ppm)
(259.9 nm)
(± 0.15)
Post
treatment
pH
0 100.00 100.00 0 0 2.0
5 2.56 2.46 0.03 0.02 6.3
10 25.74 24.74 0 0 6.3
10 23.56 23.44 0 0 6.3
20 8.20 7.93 0 0.01 6.2
50 1.30 1.25 0 0 6.2

40
Figure 12 represents the batch experiment with 100 ppm zinc solution in iron-
coated limestone which showed a maximum amount of metal removed at the highest
weight of iron-coated limestone used, i.e., 50 grams. The x-axis represents the weights of
iron-coated limestone used and y-axis and y-axis represents the concentrations of zinc
and iron. The drinking water standards were obtained with 5 grams and 50 grams of iron-
coated limestone.
Figure 12: Batch experiment with an initial concentration of 100 ppm zinc in various
amounts of iron-coated limestone with a contact time of 24 hours.

41
The data obtained for the pH experiment with zinc is shown in Table 9 and Figure
13.
Table 9: Effect of pH on zinc removal with an initial concentration of 40 ppm zinc
solution in 10 grams of iron-coated limestone.
Initial pH Percentage removal (%) Post treatment
pH
2 98.27
6.5
4 99.85
7.6
5 99.94 7.6
6 99.96 7.7
7 99.96
7.7
8 99.97 7.8
9 100.00
8
42
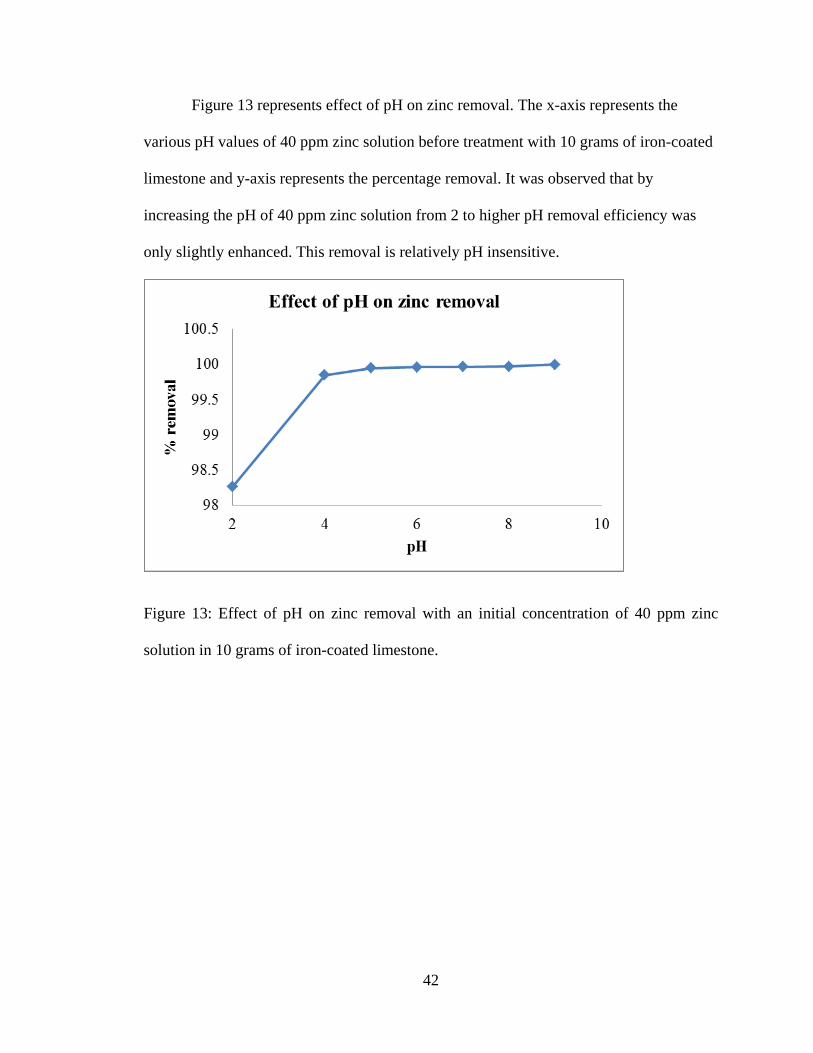
Figure 13 represents effect of pH on zinc removal. The x-axis represents the
various pH values of 40 ppm zinc solution before treatment with 10 grams of iron-coated
limestone and y-axis represents the percentage removal. It was observed that by
increasing the pH of 40 ppm zinc solution from 2 to higher pH removal efficiency was
only slightly enhanced. This removal is relatively pH insensitive.
Figure 13: Effect of pH on zinc removal with an initial concentration of 40 ppm zinc
solution in 10 grams of iron-coated limestone.
43
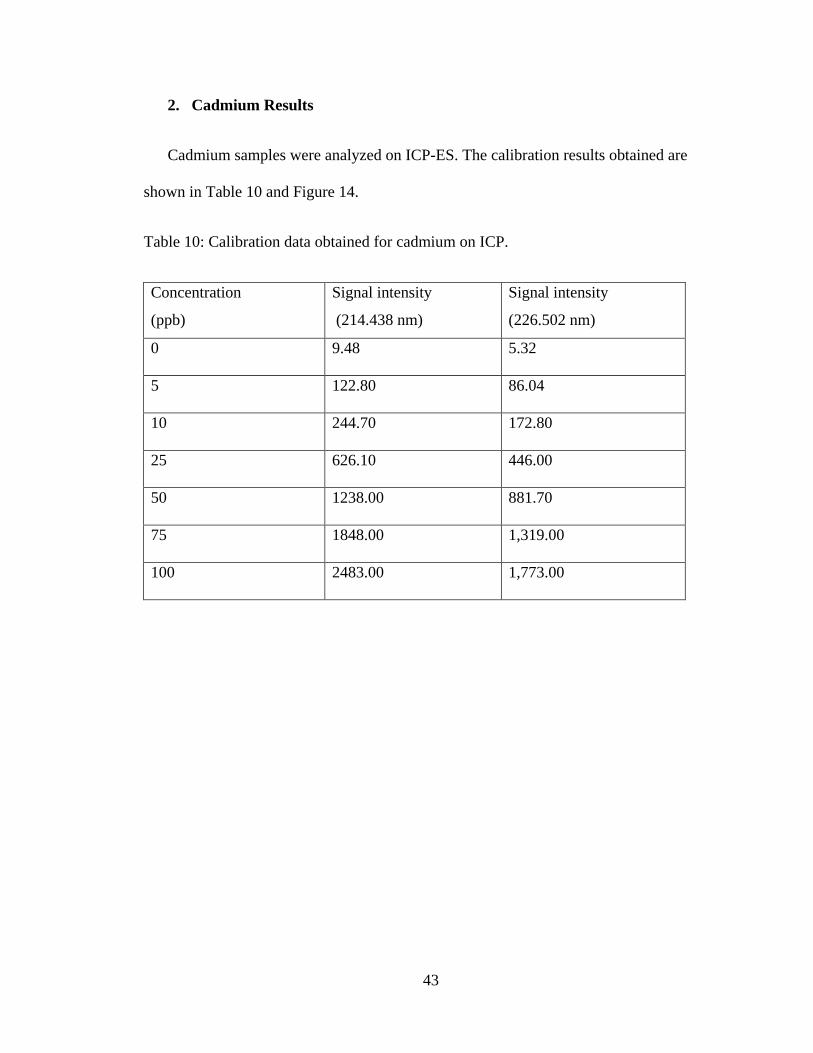
2. Cadmium Results
Cadmium samples were analyzed on ICP-ES. The calibration results obtained are
shown in Table 10 and Figure 14.
Table 10: Calibration data obtained for cadmium on ICP.
Concentration
(ppb)
Signal intensity
(214.438 nm)
Signal intensity
(226.502 nm)
0 9.48 5.32
5 122.80 86.04
10 244.70 172.80
25 626.10 446.00
50 1238.00 881.70
75 1848.00 1,319.00
100 2483.00 1,773.00

44
Figure 14 represents the calibration curve for cadmium obtained at 214.4 nm and
226.5 nm. The x-axis represents the signal intensity and y-axis represents the
concentration in ppb. Both the lines were linear with R2 value of 0.999 and 0.998,
respectively.
Figure 14: Calibration graph obtained for cadmium on ICP at wavelengths 214.4 nm and
226.5 nm

45
The efficiency of cadmium removal was studied using kinetics experiments done
with both uncoated limestone and iron coated limestone. The results obtained for the
kinetics experiment with iron coated limestone are shown in Table 11 and Figure 15.
Table 11: Kinetics studies for cadmium with an initial concentration of 20 ppb cadmium
solution in 10 grams of iron-coated limestone.
Time (hours) Concentration of
cadmium (ppb)
(214.438 nm) (± 0.15)
Concentration of
cadmium (ppb)
(226.502 nm) (± 0.15)
Post
treatment
pH
0.25 ND ND 7.5
0.50 ND ND 7.5
0.75 ND ND 7.6
1.00 ND ND 7.4
1.50 ND ND 7.5
2.00 ND ND 7.1
3.00 ND ND 7.5
4.00 ND ND 7.5
10.00 ND ND 7.5
24.00 ND ND 7.2

46
Figure 15 represents the kinetics studies using 20 ppb cadmium solution in 10
grams of iron-coated limestone with varying time intervals. The x-axis represents time in
hours and y-axis represents the concentration in ppb. The two wavelengths used are 214.4
nm and 226.5 nm. ICP results showed that the cadmium levels are reduced to zero from
an initial concentration of 20 ppb with iron-coated limestone within 15 minutes. The
concentration below the drinking water standard of 5 ppb was obtained within 15 minutes
with 10 grams of iron coated limestone.
Figure 15: Kinetic studies for cadmium with iron-coated limestone.

47
The results obtained for the kinetics experiment with uncoated limestone are
shown in Table 12 and Figure 16.
Table 12: Kinetics experiment with an initial concentration of 20 ppb cadmium solution
in 10 grams of uncoated limestone.
Time (hours) Concentration of
cadmium (ppb)
(214.438 nm) (± 0.15)
Concentration of
cadmium (ppb)
(226.502 nm) (± 0.15)
Post
treatment
pH
0.25 ND ND 8.1
0.50 ND ND 8.1
0.75 ND ND 8.1
1.00 ND ND 7.9
1.50 ND ND 8.1
2.00 ND ND 8.0
3.00 ND ND 7.9
4.00 ND ND 8.0
10.00 ND ND 7.9
24.00 ND ND 7.1

48
Figure 16 represents the kinetics studies using 20 ppb cadmium solution in 10
grams of uncoated limestone. The x-axis represents time in hours and y-axis represents
the concentration in ppb. The two wavelengths used are 214.4 nm and 226.5 nm. ICP
results showed that the cadmium levels are reduced to zero with uncoated limestone
within 15 minutes. All the concentrations were reduced to below drinking water standard
of 5 ppb cadmium.
Figure 16: Kinetics experiment for cadmium with uncoated limestone

49
Batch experiments were done to investigate the removal efficiency with varying
amounts of limestone. The results obtained for the first batch experiment with 20 ppb
cadmium in uncoated limestone are shown in Table 13 and Figure 17.
Table 13: Batch test for cadmium with an initial concentration of 20 ppb cadmium
solution in 5 grams, 10 grams, 10 grams, 20 grams and 50 grams of uncoated limestone
with 2 hours contact time.
Weight of uncoated limestone
(grams)
Concentration of
cadmium (ppb)
(214.438 nm)
(± 0.15)
Concentration of
cadmium (ppb)
(226.502 nm)
(± 0.15)
Post
treatment
pH
0 20 20 3.3
5 ND ND 7.8
10 ND ND 7.9
10 ND ND 7.9
20 ND ND 7.9
50 ND ND 8.0

50
Figure 17 represents the batch experiment for 20 ppb cadmium solution treated
with 5, 10, 10, 20 and 50 grams of uncoated limestone for 2 hours. The x-axis represents
the weight of uncoated limestone and y-axis represents the post treatment cadmium
concentration in ppb. ICP-ES results showed that the residual cadmium concentrations
were below the detection drinking water standard of 5 ppb.
Figure 17: Batch test for cadmium with an initial concentration of 20 ppb.
51
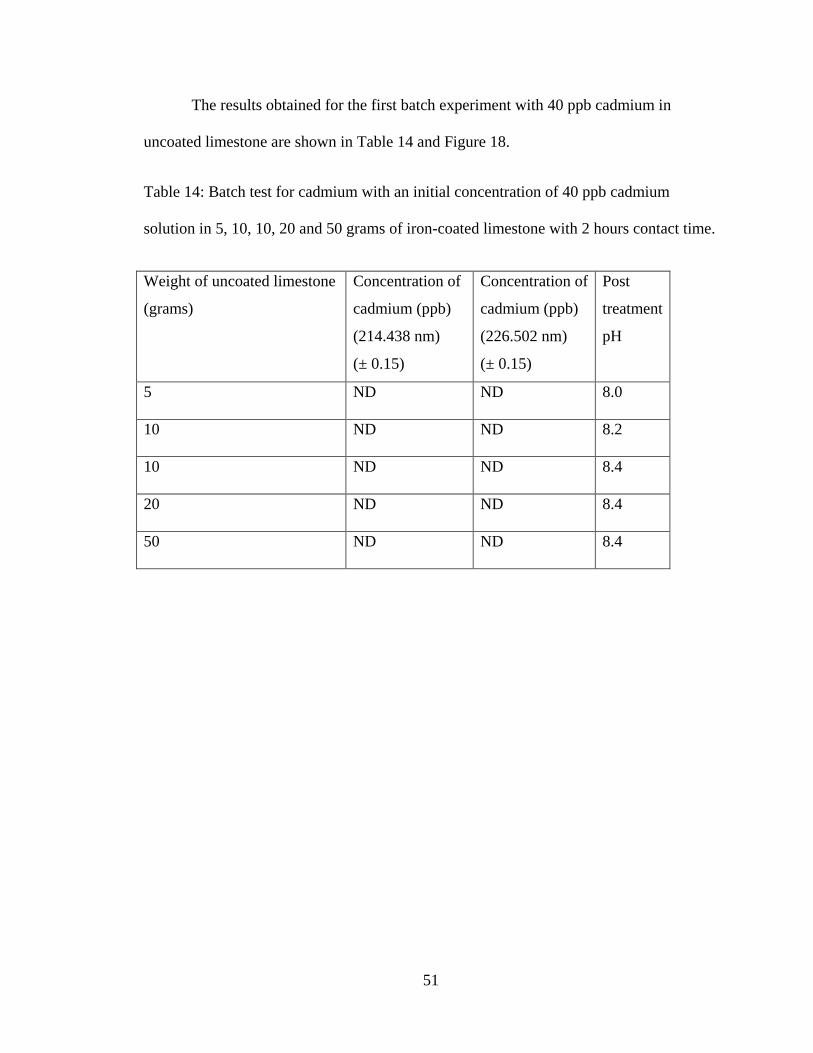
The results obtained for the first batch experiment with 40 ppb cadmium in
uncoated limestone are shown in Table 14 and Figure 18.
Table 14: Batch test for cadmium with an initial concentration of 40 ppb cadmium
solution in 5, 10, 10, 20 and 50 grams of iron-coated limestone with 2 hours contact time.
Weight of uncoated limestone
(grams)
Concentration of
cadmium (ppb)
(214.438 nm)
(± 0.15)
Concentration of
cadmium (ppb)
(226.502 nm)
(± 0.15)
Post
treatment
pH
5 ND ND 8.0
10 ND ND 8.2
10 ND ND 8.4
20 ND ND 8.4
50 ND ND 8.4

52
Figure 18 represents the batch experiment for 40 ppb cadmium solution treated
with 5, 10, 10, 20 and 50 grams of uncoated limestone for 2 hours. The x-axis represents
the weight of uncoated limestone and y-axis represents the post treatment cadmium
concentration in ppb. No residual cadmium concentrations were detected post treatment
with uncoated limestone. The drinking water standards were obtained with all the weights
used.
Figure 18: Batch test for cadmium with an initial concentration of 40 ppb with 2 hours
contact time.
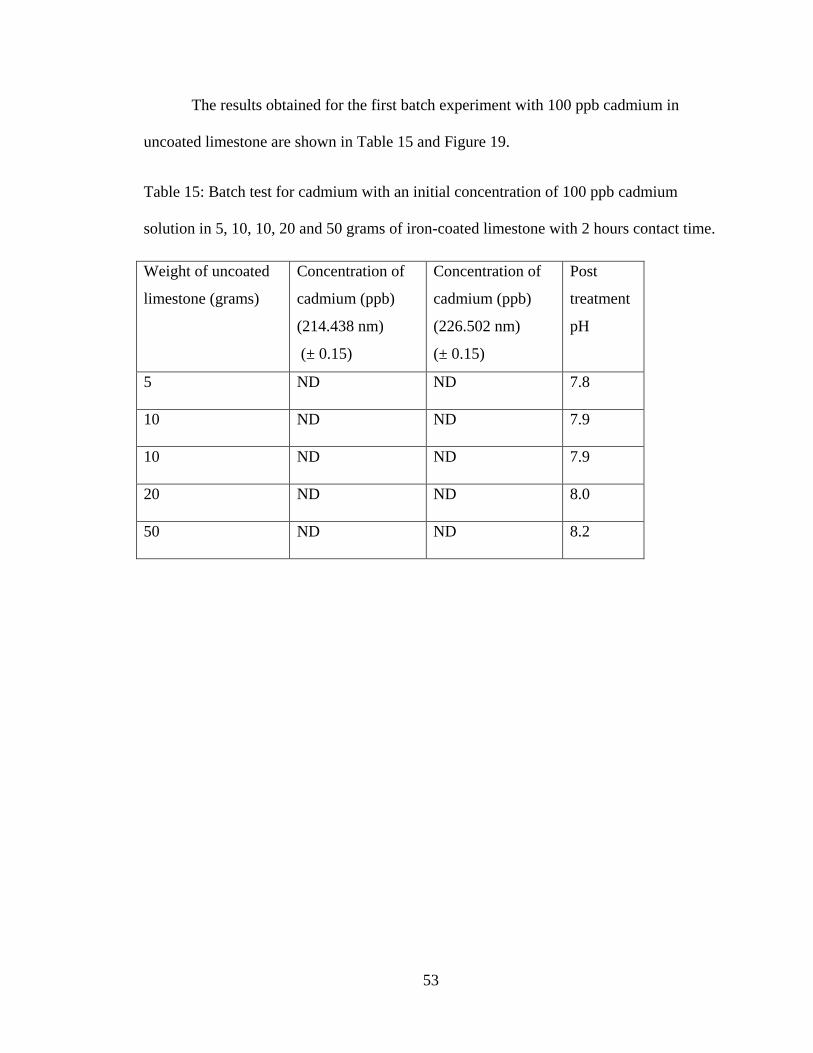
53
The results obtained for the first batch experiment with 100 ppb cadmium in
uncoated limestone are shown in Table 15 and Figure 19.
Table 15: Batch test for cadmium with an initial concentration of 100 ppb cadmium
solution in 5, 10, 10, 20 and 50 grams of iron-coated limestone with 2 hours contact time.
Weight of uncoated
limestone (grams)
Concentration of
cadmium (ppb)
(214.438 nm)
(± 0.15)
Concentration of
cadmium (ppb)
(226.502 nm)
(± 0.15)
Post
treatment
pH
5 ND ND 7.8
10 ND ND 7.9
10 ND ND 7.9
20 ND ND 8.0
50 ND ND 8.2

54
Figure 19 represents the batch experiment for 100 ppb cadmium solution treated
with 5, 10, 10, 20 and 50 grams of uncoated limestone for 2 hours. The x-axis represents
the weight of uncoated limestone and y-axis represents the post treatment cadmium
concentration in ppb. The cadmium concentrations in the solution were below the
detection limits indicating 100% removal efficiency of uncoated limestone for cadmium.
Figure 19: Batch test for cadmium with an initial concentration of 100 ppb with 2 hours
contact time.

55
Since the results obtained from the first batch experiments showed the cadmium
removal completely within 2 hours with just 5 grams of uncoated limestone for all the
concentrations, a second batch experiment was performed by using weights less than 1
gram and 15 minutes contact time. The results for the second batch experiment with 20
ppb cadmium are shown in Table 16 and Figure 20.
Table 16: Batch test for cadmium with an initial concentration of 20 ppb cadmium
solution using 0.1, 0.2, 0.2, 0.5 and 1 gram uncoated limestone with 15 minutes contact
time.
Weight of uncoated
limestone (grams)
Concentration of
cadmium (ppb)
(214.438 nm)
(± 0.15)
Concentration of
cadmium (ppb)
(226.502 nm)
(± 0.15)
Post
treatment
pH
0.1 ND 0.03 6.5
0.2 0.06 0.02 7.1
0.2 0.23 0.13 7.0
0.5 0.31 0.28 7.5
1.0 0.23 0.17 7.6

56
Figure 20 represents the batch experiment for 20 ppb cadmium solution in 0.1,
0.2, 0.2, 0.5 and 1gram of uncoated limestone with a contact time of 15 minutes. The
99% removal efficiency was observed with 0.2 gram but the concentration slightly
increased for 0.5 and 1 gram of uncoated limestone. Though 100 % efficiency was not
seen all the concentrations, were reduced to below drinking standard of 5 ppb cadmium.
Figure 20: Batch test for cadmium with an initial concentration of 20 ppb with 15
minutes contact time.

57
The results for the second set of batch experiment with 40 ppb cadmium are
shown in Table 17 and Figure 21.
Table 17: Batch test for cadmium with an initial concentration of 40 ppb cadmium
solution in 0.1, 0.2, 0.2, 0.5 and 1 gram of uncoated limestone with 15 minutes contact
time.
Weight of uncoated limestone
(grams)
Concentration of
cadmium (ppb)
(214.438 nm)
(± 0.15)
Concentration of
cadmium (ppb)
(226.502 nm)
(± 0.15)
Post
treatment
pH
0.1 0.51 0.53 6.5
0.2 0.87 0.92 6.2
0.2 1.77 1.76 6.6
0.5 2.25 2.21 7.5
1.0 1.72 1.73 7.8
58
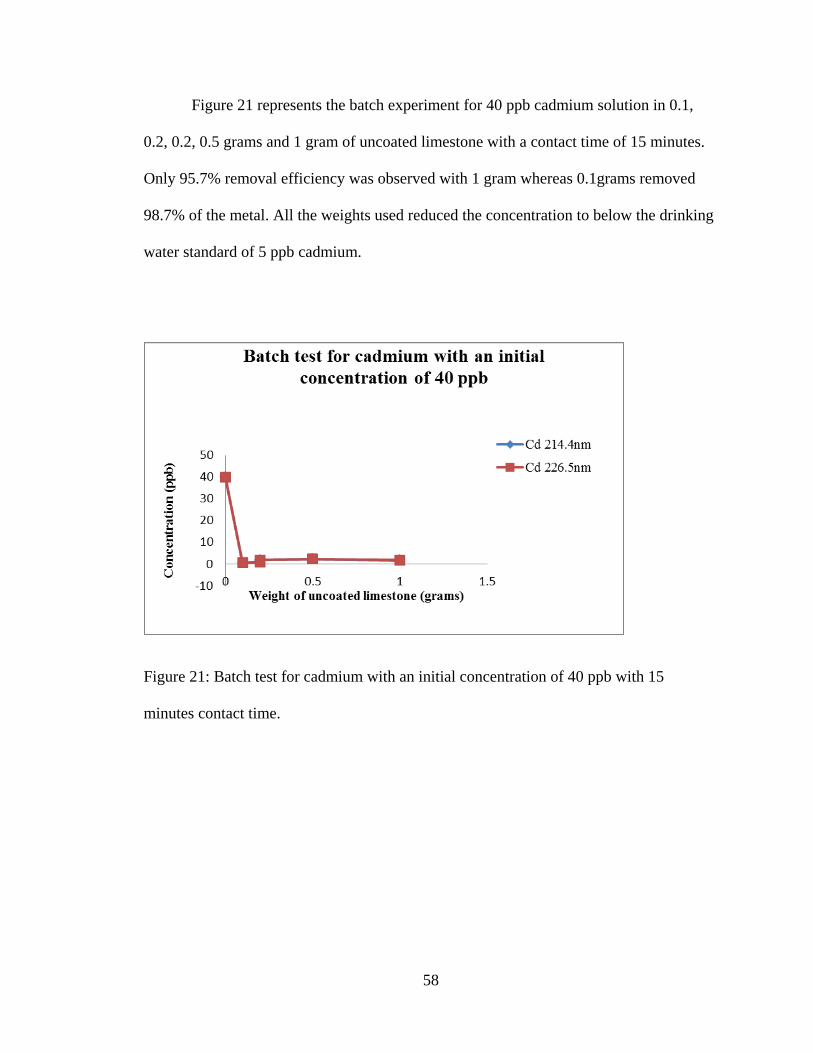
Figure 21 represents the batch experiment for 40 ppb cadmium solution in 0.1,
0.2, 0.2, 0.5 grams and 1 gram of uncoated limestone with a contact time of 15 minutes.
Only 95.7% removal efficiency was observed with 1 gram whereas 0.1grams removed
98.7% of the metal. All the weights used reduced the concentration to below the drinking
water standard of 5 ppb cadmium.
Figure 21: Batch test for cadmium with an initial concentration of 40 ppb with 15
minutes contact time.

59
The results for the second set of batch experiment with 100 ppb cadmium are
shown in Table 18 and Figure 22.
Table 18: Batch test for cadmium with an initial concentration of 100 ppb cadmium
solution in 0.1, 0.2, 0.2, 0.5 grams and 1 gram of uncoated limestone with 15 minutes
contact time.
Weight of uncoated
limestone (grams)
Concentration of
cadmium (ppb)
(214.438 nm)
(± 0.15)
Concentration of
cadmium (ppb)
(226.502 nm)
(± 0.15)
Post
treatment
pH
0.1 2.84 2.80 6.1
0.2 5.60 5.57 6.5
0.2 7.49 7.37 6.2
0.5 11.54 11.38 6.9
1.0 9.29 9.22 7.3

60
Figure 22 represents the batch experiment for 100 ppb cadmium solution in 0.1,
0.2, 0.2, 0.5 grams and 1 gram of uncoated limestone with a contact time of 15 minutes.
The highest removal efficiency was seen for 0.1 grams which removed about 97% of the
metal. The drinking standards were obtained with 0.1, 0.2 grams and 1 gram.
Figure 22: Batch test for cadmium with an initial concentration of 100 ppb with 15
minutes contact time.

61
The results obtained for the pH experiment with 40 ppb cadmium in 10 grams of
uncoated limestone are shown in Table 19 and Figure 23.
Table 19: Effect of pH on cadmium removal
Initial pH Percentage removal (%) Post treatment
pH
3.6 100 8.3
4.0 100 8.4
5.0 100 8.6
6.0 100 8.8
7.0 100 8.6
8.0 99.11 8.8
9.0 100 9.2

62
Figure 23 represents the effect of pH on cadmium removal with a fixed
concentration of 40 ppb in 10 grams of uncoated limestone. The x-axis represents the pH
of 40 ppb cadmium solution before treating with 10 grams of uncoated limestone. The y-
axis represents the residual cadmium concentration after treatment with uncoated
limestone. ICP-ES results showed the concentration to be below the detection limits
indicating pH independence of uncoated limestone for cadmium removal.
Figure 23: Effect of pH on cadmium removal
Effect of pH on cadmium removal
63
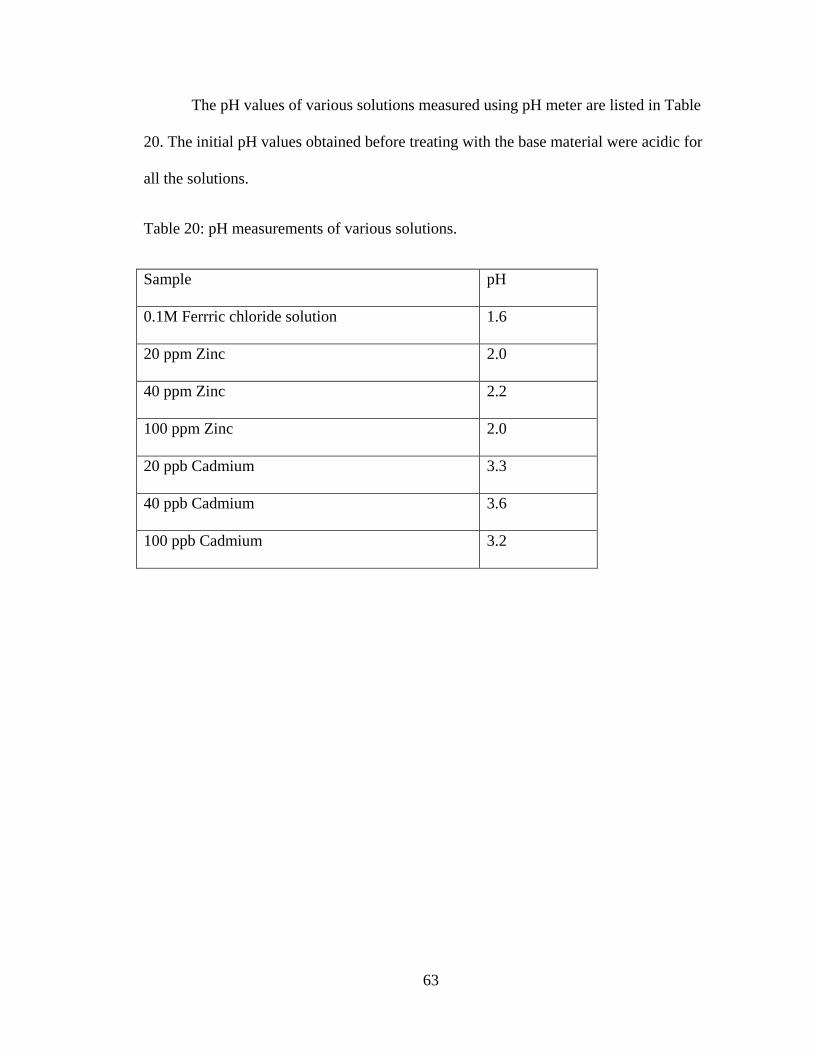
The pH values of various solutions measured using pH meter are listed in Table
20. The initial pH values obtained before treating with the base material were acidic for
all the solutions.
Table 20: pH measurements of various solutions.
Sample pH
0.1M Ferrric chloride solution 1.6
20 ppm Zinc 2.0
40 ppm Zinc 2.2
100 ppm Zinc 2.0
20 ppb Cadmium 3.3
40 ppb Cadmium 3.6
100 ppb Cadmium 3.2

64
The pH values of pre and post treated zinc and cadmium solutions are listed in
Table 21 and 22, respectively.
Table 21: pH measurements zinc solutions treated with iron-coated limestone.
Post treatment pH
Weight of iron-coated limestone
used (grams)
20 ppm
Zinc
40 ppm
Zinc
100 ppm
Zinc
5 6.4 6.7 6.3
10 6.3 6.9 6.3
10 6.5 7.0 6.3
20 6.9 7.2 6.2
50 6.8 7.0 6.2

65
Table 22: pH measurements of cadmium solutions treated with uncoated limestone.
Post treatment pH Post treatment pH
Weight
of
uncoated
limestone
(grams)
20 ppb
Cadmium
40 ppb
Cadmium
100 ppb
Cadmium
Weight
of
uncoated
limestone
used
(grams)
20 ppb
Cadmium
40 ppb
Cadmium
100 ppb
Cadmium
5 7.8 8 7.8 0.1 6.5 6.5 6.1
10 7.9 8.2 7.9 0.2 7.1 6.2 6.5
10 7.9 8.4 7.9 0.2 7 6.6 6.2
20 7.9 8.4 8 0.5 7.5 7.5 6.9
50 8.0 8.4 8.2 1 7.6 7.8 7.3
As can be seen from Tables 21 and 22, the post treatment pH values of all
solutions are near neutral. This shows the strong buffering capacity of the limestone.
Even small amounts such as 0.1 grams of limestone could buffer 100ml of the metal
solutions.

66
SEM Results
SEM for uncoated limestone
Figures 24 and 25 as well as Table 23 represents the SEM results obtained for
limestone before coating.
Figure 24: SEM image for uncoated limestone.

67
Figure 25: Analysis report for SEM image obtained for uncoated limestone.
Table 23: Analysis data for SEM image obtained for uncoated limestone.
Location 1 Location 2
Element Atomic % Concentration
(wt.%)
Atomic % Concentration
(wt.%)
C 5.07 3.03 9.88 5.71
O 66.35 52.80 66.43 51.13
Si 21.47 30.00 4.38 5.92
Ca 7.11 14.18 19.31 37.24
Figure 25 represents the SEM data obtained for uncoated limestone which shows the
surface elements calcium, oxygen, silicon and calcium.

68
SEM for iron-coated limestone
The acidic effect of iron chloride solutions is clearly seen in Figure 26. The SEM
results obtained for limestone after treatment with iron chloride solution are shown in
Figures 26 and 27 as well as Table 24.
Figure 26: SEM image for iron-coated limestone.

69
Figure 27: Analysis report for SEM image obtained for iron-coated limestone.
Table 24: Analysis data for SEM image obtained for iron-coated limestone.
Location 1
Location2 Location3
Element Atomic % Concentration
(wt. %)
Atomic
%
Concentration
(wt. %)
Atomic
%
Concentration
(wt. %)
C 20.01 13.01 18.17 10.89 16.34 10.23 O 65.46 56.67 63.38 50.58 67.36 56.17 Al 2.95 4.3 1.89 2.55 2.07 2.91 Si 0 0 0.55 0.77 0.29 0.42 Cl 0.47 0.91 2.41 4.27 0.72 1.33 Ca 9.9 21.46 8.8 17.59 11.61 24.24 Fe 1.21 3.65 4.8 13.37 1.61 4.7 Total 100 100 100 100 100 100

70
Figure 26 represents the SEM data obtained for iron-coated limestone which
shows a combination of carbon, oxygen, aluminum, silicon, chlorine, calcium and iron on
surface. The images clearly show the uneven distribution of iron on surface confirming
the heterogeneous nature of the limestone surface. The major elements were oxygen
which constituted about 56 % and around 21% of calcium.
SEM for iron-coated limestone treated with zinc
Images at 350X and 750X were obtained for iron coated limestone coated with
zinc were shown in Figures 28 and 29. The SEM data obtained is shown in Figure 30 and
Table 25.
Figure 28: 350X SEM image for iron-coated limestone treated with zinc solution.

71
Figure 29: 750X SEM image for iron-coated limestone treated with zinc solution.
Figure 30: Analysis report for SEM image obtained for iron-coated limestone treated with
zinc.

72
Table 25: Analysis data for SEM image obtained for iron-coated limestone treated with
zinc.
Location 1 Location 2
Element Atomic % Concentration
(wt.%)
Atomic % Concentration
(wt.%)
C 14.35 8.96 12.90 7.93
O 70.74 58.82 71.60 58.64
Ca 13.60 28.33 13.63 27.96
Fe 1.10 3.18 1.64 4.69
Zn 0.21 0.70 0.23 0.77
Figure 30 represents the SEM data obtained for iron-coated limestone treated with
zinc which showed the presence of carbon, oxygen, calcium, iron and zinc. The image
shows the diffuse distribution of the iron. Small amounts of zinc were also seen on the
surface.

73
SEM for uncoated limestone treated with cadmium
The SEM results obtained for uncoated limestone treated with cadmium solution
are shown in Figures 31 and 32 as well as Table 26.
Figure 31: SEM image for uncoated limestone treated with cadmium.

74
Figure 32: Analysis report for SEM image obtained for uncoated limestone treated with
cadmium.
Table 26: Analysis data for SEM image obtained for uncoated limestone treated with
cadmium.
Location 1 Location 2
Element Atomic % Concentration
(wt.%)
Atomic % Concentration
(wt.%)
C 16.31 10.57 16.65 10.33
O 70.17 60.59 66.31 54.76
Si 0.68 1.03 0.54 0.79
Ca 12.82 27.73 16.50 34.13
Cd 0.01 0.07 0.00 0.00

75
Figure 32 and Table 26 represents the SEM data obtained for uncoated limestone
treated with cadmium which showed the presence of carbon, oxygen, silicon, calcium and
cadmium.

76
XRD Results
The composition of uncoated limestone and iron coated limestone was studied
using XRD. The data obtained was shown in Figure 33 and 34.
Figure 33: XRD graph comparing peaks of uncoated limestone with calcium carbonate.
Figure 33 represents XRD peaks obtained for uncoated limestone with that of the
known compound calcium carbonate. Almost all the peaks matched confirming the base
material to be composed of calcium carbonate.

77
Figure 34: XRD graph comparing uncoated limestone with iron-coated limestone.
Little difference can be seen between the uncoated and iron-coated limestone.
Iron hydroxide is amorphous and is finely distributed. It cannot be directly observed at
this level using XRD.

78
Chapter 5 CONCLUSIONS
Heavy metal contamination is a serious worldwide issue faced by many people
throughout the world. Groundwater, which is a major source of drinking water, is
contaminated with heavy metals by natural as well as human activities, industrial
pollution and agricultural pollution. Although several technologies for heavy metal
removal have been established, most of them are expensive and complicated. The
proposed method uses chicken feed as the base material which is relatively cheap and
readily available. Iron coatings enhance the heavy metal removal by increasing the
surface area. The ffectiveness of the method was studied using kinetics and batch
experiments conducted with zinc and cadmium metals. The drinking water standards for
zinc and cadmium set by US-EPA are 5 ppm and 5 ppb respectively. This research was
mainly focused on reducing the high concentrations of zinc and cadmium to normal
drinking water standards by treating with uncoated and iron-coated limestone. Also, the
effect of pH on removal efficiency was investigated.
The objective of kinetics experiment was to find the appropriate time required for
the maximum removal of the metal. In this study, it was observed that zinc required a
minimum of 24 hours for an efficient removal whereas cadmium levels are reduced to
zero with both iron-coated and uncoated lime within 15 minutes. Initially kinetics
experiment for zinc metal was done using pure limestone without any iron-coatings. The
percentage removal of the zinc was only about 50%. The kinetics experiment was
repeated using iron-coated limestone and it was observed that iron-coated limestone was
more efficient than the pure limestone in removing zinc metal. The removal efficiency
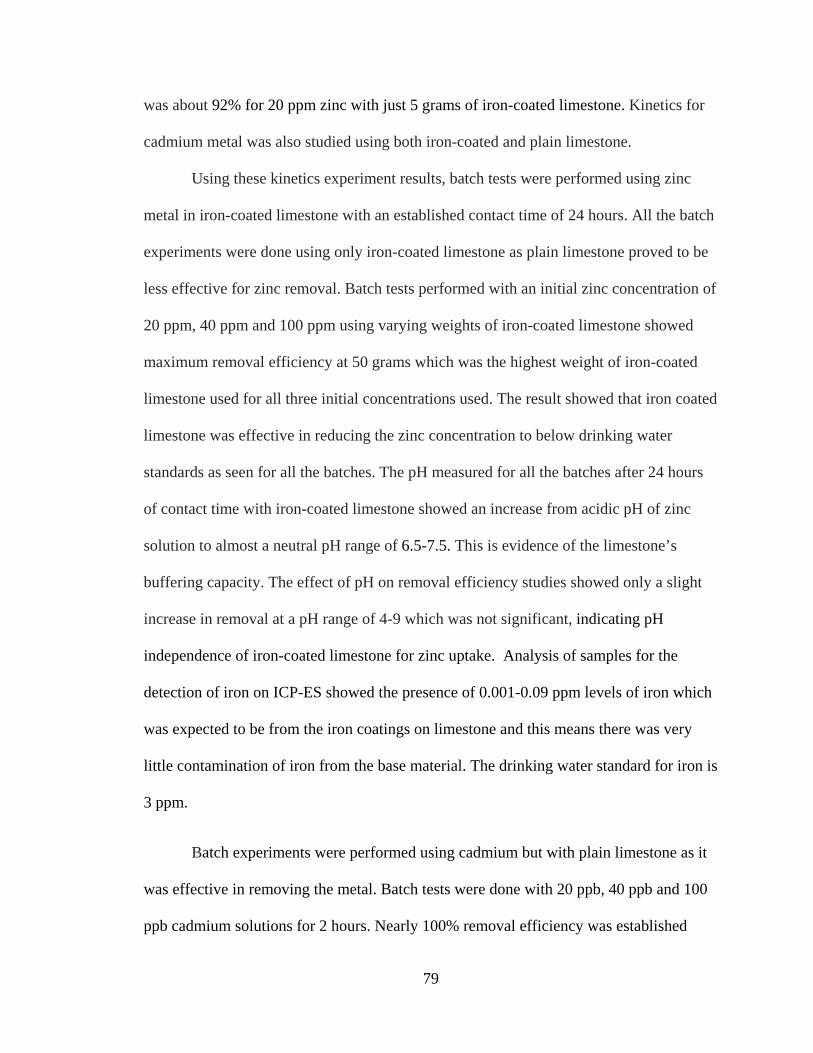
79
was about 92% for 20 ppm zinc with just 5 grams of iron-coated limestone. Kinetics for
cadmium metal was also studied using both iron-coated and plain limestone.
Using these kinetics experiment results, batch tests were performed using zinc
metal in iron-coated limestone with an established contact time of 24 hours. All the batch
experiments were done using only iron-coated limestone as plain limestone proved to be
less effective for zinc removal. Batch tests performed with an initial zinc concentration of
20 ppm, 40 ppm and 100 ppm using varying weights of iron-coated limestone showed
maximum removal efficiency at 50 grams which was the highest weight of iron-coated
limestone used for all three initial concentrations used. The result showed that iron coated
limestone was effective in reducing the zinc concentration to below drinking water
standards as seen for all the batches. The pH measured for all the batches after 24 hours
of contact time with iron-coated limestone showed an increase from acidic pH of zinc
solution to almost a neutral pH range of 6.5-7.5. This is evidence of the limestone’s
buffering capacity. The effect of pH on removal efficiency studies showed only a slight
increase in removal at a pH range of 4-9 which was not significant, indicating pH
independence of iron-coated limestone for zinc uptake. Analysis of samples for the
detection of iron on ICP-ES showed the presence of 0.001-0.09 ppm levels of iron which
was expected to be from the iron coatings on limestone and this means there was very
little contamination of iron from the base material. The drinking water standard for iron is
3 ppm.
Batch experiments were performed using cadmium but with plain limestone as it
was effective in removing the metal. Batch tests were done with 20 ppb, 40 ppb and 100
ppb cadmium solutions for 2 hours. Nearly 100% removal efficiency was established
80
with just 5 grams of plain limestone. Further batch experiments were performed to
investigate the efficiency of limestone at amounts less than 1 gram and with only 15
minutes contact time. This also showed a removal of 99% from the initial concentration
of 20 ppb cadmium metal. A sample of 0.1gram removed 98.7% of 40 ppb cadmium
metal. Though 100% removal was not obtained for second set of batch experiments, the
cadmium was reduced well below the drinking water standards. Changing the pH of
cadmium standards did not show any significant effect on removal efficiency, all being
reduced to below detection limits showing the independence of pH for cadmium removal.
Figures 24 and 26 represent SEM images for plain and iron-coated limestone. The
images for iron-coated limestone showed the uneven distribution of iron indicating the
heterogeneous nature of the iron coated limestone. Limestone treated with cadmium and
zinc showed the presence of the respective metals on the surface confirming their
removal. The weight of iron coated limestone was found to be 98.08 grams whereas the
initial weight of limestone before the treatment was 100.00 grams accurately. This infers
a decrease in the size after treatment with iron chloride solution indicating the dissolution
of base material in the acidic pH of iron chloride solution followed by the iron hydroxide
precipitation. The XRD studies showed that the uncoated limestone was mostly calcium
carbonate. The iron-coated limestone was investigated for the presence of iron hydroxide,
iron-carbonate and iron oxide but the peaks obtained were relatively insignificant
indicating that the coated substance on surface was very thin and diffusely distributed.
In conclusion, iron-coated limestone proved to be efficient in removing zinc which
removed about 99% of the metal whereas plain limestone was efficient in 100% cadmium
removal. From the kinetics experiments, it was proved that zinc takes 24 hours for
81
maximum removal whereas cadmium can be removed within 15 minutes. The pH studies
confirmed the pH independence of limestone to remove zinc and cadmium metals. The
SEM studies confirmed the heterogeneous nature of limestone surface.
Most of the methods and systems in current use have good efficiency but are
technically demanding. We explore a more suitable, inexpensive and efficient method for
use in third world nations. The proposed method uses modified limestone which could be
readily applied to many natural water systems as it does not produce any toxic products
and is readily available.
This is an inexpensive technique which uses chicken feed (limestone) as a base
material. Limestone occurs naturally in earth’s crust, and acts as the media for heavy
metal removal. Saturated material can be easily disposed by mixing with concrete and
cement. It can be synthesized and used easily by developing countries. This is a straight
forward low-cost process which does not require any complex implementation.

82
Chapter 6
FUTURE WORK
The efficiency of the limestone to remove other heavy metals in real water
samples may also be investigated. Removal efficiency of coated and plain limestone
using samples with a mixture of two or more metals could be studied as industrial
contamination may sometimes release more than one particular toxic metal. Properties of
the zinc and cadmium complexes or precipitates deposited on the limestone can be
identified further. Removal efficiency of different types of limestone can be investigated
and compared. Other mechanisms involved in heavy metal removal other than adsorption
and precipitation could be studied for better applications.

83
Chapter 7
PERSPECTIVE
Drinking water is polluted with metals that are harmful for people due to waste
from industries. There are ways to remove the metals from drinking water but they are
hard and costly. We came up with an idea to remove zinc and cadmium with a really
simple and cheap material. Our material is limestone. Limestone is available everywhere.
Metals are attracted to the surface of limestone and are removed easily. Plain limestone
worked well for cadmium but not for zinc. So we just coated the limestone with a small
amount of iron, and this removed all the zinc. After the limestone is full, we can just take
the limestone back to a cement plant because the metals won’t come off.

84
BIBILIOGRAPHY
Alexandratos, V. G., Elzinga, E. J. and Reeder, R. J. Geochim. Cosmochim. Acta. 2007,
71, 4172-4187.
An, H. K., Park, B. Y., Kim, D. S. and Water Res. 2001, 35, 3551-3556.
Aziz, H. A., Adlan, M. N., Hui, C. S., Zahari, M. S. M. and Hameed, B. H. Indian J. Eng.
Mater. Sci. 2005, 12, 248-258.
Barbosa, A. E. and Hvitved-Jacobsen, T. Environ. Sci. Technol. 1999, 235, 151-159.
Benner, T. C. Environ. Sci. Technol. 2004, 38, 3457-3464.
Brookins, D. G. Eh-Ph Diagrams for Geochemistry, Springer-Verlog, New York, 1988,
176p.
Callender, E. and Rice, K. C. Environ. Sci. Technol. 2000, 34, 232-238.
Carlson, L., Bigham, J. M., Schwertmann, U., Kyek, A., and Wagner, F. Environ. Sci.
Technol. 2002, 36, 1712-1719.
Carroll, S. A., Oday, P. A. and Piechowski, M. Environ. Sci. Technol. 1998, 32, 956-965.
Chen, J. p. and Yu, H. J. Environ. Sci. Health. 2000, 35, 817-835.
Cotton, F. A., Wilkinson, G., Murillo, C. A. and Bochmann, M. Advanced Inorganic
Chemistry, 6th Edition, 1999, 598-629.
Councell, T. B., Duckenfield, K. U., Landa, E. R., and Callender, E. Environ. Sci.
Technol. 2004, 38, 4206-4214.
Dannis, M. L. Rubber Chem. Technol. 1974, 47, 1011-1037.
Darwish, I. A. and Blake, D. A. Anal. Chem. 2001, 73, 1889-1895.
Dhananjay, M. and James, F. J. Environ. Sci. Technol. 2005, 39, 9689-9694.
Duckworth, O. W. and Martin, S. T. American Minerologist. 2004, 89, 554-563.

85
Ferguson, M. A., Fernandez, D. P. and Hering, J. G. J. American Water Works
Association. 2007, 99, 92-98.
Flegler, S. L., Heehman, J. W. and Klomparens, K. L. Scanning and Transmission
Electron Micoscopy An Introduction.
Gardea-Torresdey, J. L., De La Rosa, G. and Peralta-Videa, J. R. Pure Appl. Chem. 2004,
76, 801-813.
Gu, Z., Jun, F., and Baolin, D. J. Environ. Sci. Technol. 2005, 39, 3833-3843.
Hildemann, L. M., Markowski, G. R.; Cass. G. R. Environ. Sci. Technol. 1991, 25, 744-
759.
Hossain, M. A., Sengupta, M. K., Ahamed, S., Rahman, M. M., Mondal, D., Lodh, D.,
Das, B., Nayak, B., Roy, B., Mukherjee, A. and Chakraborti, D. Environ. Sci. Technol.
2005, 39, 4300-4306.
Janet, G. H., Pen-Yuan, C., Jennifer, A. W. and Menachem, E. J. of Environ. Eng. 1997,
800-807.
Kim, M. J., Nriagu, J. and Haack, J. Environ. Sci. Technol. 2000, 34, 3094-3100.
Klimmek, S., Stan, H. J., Wilke, A., Bunke, G. and Buchholz, R. Environ. Sci. Technol.
2001, 35, 4283-4288.
Kohler, S. J., Cubillas, P., Blanco, J. D. R., Bauer, C. and Prieto, M. Environ. Sci.
Technol. 2007, 41, 112-118.
Le, X. C., Yalcin, S. and Ma, M. J. Am. Chem. Soc. 2000, 34, 2342-2347.
Lee, M. H., Cho, K., Shah, A. P., and Biswas, P. Environ. Sci. Technol. 2005, 39, 8481-
8489.
Legret, M. and Pagotto, C., Sci. Tot. Environ. 1999, 235, 143-150.

86
Mause, Y., Loppert, R. H. and Kramer, T. A. Environ. Sci. Technol. 2007, 41, 837-842.
Nurul, A., Satoshi, K., Taichi, K., Aleya, B., Hideyuki, K., Tohru, S. and Kiyohisa, O.
Ind. Eng. Chem. Res. 2006, 45, 8105-8110.
Pal, P., Sarkar, P. and Bhattacharyay, D. Sensor Letters. 2010, 8, 577-583.
Peters, S. C., Blum, J. D, Klauke, B. and Karagas, M. R. Environ. Sci. Technol. 1999, 33,
1328-1333.
Pierson, W. R. and Brachaczek, W. W. Rubber Chem. Technol. 1974, 47, 1275-1299.
Romero, F. M., Armienta, M. A. and Carrillo-Chavez, A. J. Arch. Enviorn. Contam.
Toxicol. 2004, 47, 1-13.
Silva, A. M., Cruz, F. L. S., Lima, R. M. F., Teixeira. and M. C., Leao, V. A. J. of.
Hazardous Materials. 2010, 181, 514-520.
Stocker, J., Balluch, D., Monika, G., Harms, H., Feliciano, J., Daunert, S., Malik, K. A.
and Meer, J. R. V. D. Environ. Sci. Technol. 2003, 37, 4743-4750.
Skoog, Holler, and Nieman, Principles of Instrumental Analysis. 5th Edition, 1998, 230-
250.
Tani, C., Inoue, K., Tani, Y., Harun-Ur-Rashid, Md., Azuma, N., Ueda, S., Yoshida, K.
and Maeda, I. J. Bioscience and Bioengineering. 2009, 108, 414-420.
Turner, B. D., Binning, P. and Stipp, S. L. S. Environ. Sci. Technol. 2005, 39, 9561-9568.
Yoko, M., Richard, L. H., and Tim, K. A. J. Environ. Sci. Technol. 2007, 41, 837-842.
Yu, D., Wu, F. and Cao, A. Method for Detecting Arsenic content by Iodine Solution
Absorption. Faming Zhunali Shenqing. 2010.
Yuan, D. and Liu, J. Zhongguo Redai Yixue. 2010, 10, 389-390.

87
Zereini, F., Alt, F., Messerschmidt, J., Wiseman, C., Feldmann, I., Bohlen, A. V., Muller,
J., Liebl, K. and Puttmann, W. Environ. Sci. Technol. 2005, 39, 2983-2989.
Zhang, Q., Pan, B., Pan, B., Zhang, W., Jia, K. and Zhang, Q. Environ. Sci. Technol.
2008, 42, 4140-4145.
Zhigang, Y., Lifa, Z., Zhengyu, B., Pu, Gao. and Xingwang, S. J. Geochem. 2009, 28,
293-298.
Zhou, P., Huang, J. C., Li, A. and Wei, S. Water Res. 1993, 33, 1918-1924.

Recommended