Remote Sensing Image Analysis Methods in the Application to Flood Monitoring
Gabriele Moser¹
S. B. Serpico¹, S. Dellepiane¹, E. Angiati¹G. Boni², and R. Rudari²
¹ University of Genoa, Italy² CIMA Research Foundation, Savona, Italy

Outline
Introduction
Joining hydraulic modeling and remote sensing
Land cover and changed/flooded areas
Vulnerability, elements at risk, and damage
Markovian methods for land cover and change mapping
Markov random fields for spatial modeling
Fusing region, texture, and multisensor information
Examples of classification and change detection results
Flood case studies
Conclusion
2

Outline
Introduction
Joining hydraulic modeling and remote sensing
Land cover and changed/flooded areas
Vulnerability, elements at risk, and damage
Markovian methods for land cover and change mapping
Markov random fields for spatial modeling
Fusing region, texture, and multisensor information
Examples of classification and change detection results
Flood case studies
Conclusion
3

Introduction
Satellite remote sensing and Earth observation (EO) for disastermonitoring and damage assessment
Spatially distributed and temporally repetitive observations
Multispectral and synthetic aperture radar (SAR) images
All-weather and day-and-night through SAR
Very high resolution (VHR) (up to ~50 cm) and short revisit times (12to 24 h) with current EO missions (e.g., COSMO-SkyMed, Pléiades)
Need for a multidisciplinary approach: remote sensing imageanalysis and geophysical sciences
4
Boulder County (CO), September 2013

Introduction
Focus of the talk
Potential of remote sensing and its combination with hydraulicmodeling for flood monitoring and damage assessment
Advanced Markovian approaches to land cover classification andchange detection from VHR images in flood applications
Approaches developed mainly within applied research projects
OPERA, Italian Space Agency and Italian Department of CivilProtection, 2007-2010
COSMO-SkyMed AO ID-2181, Italian Space Agency, 2010-2012
PRIN-2012, Italian Minister of Education, University, and Research,2014-2017
5

Remote Sensing vs. Flood Risk
Prevention and prediction phases
Improved predictions of hydro-meteorological processes by mappingland cover and water bodies from EO
Mitigation and risk assessment phase
Often out-of-date cartography; time consuming in situ surveys.
Elements-at-risk and vulnerability assessment by mapping land coverand possibly buildings through VHR image analysis
Monitoring and management phases
Multitemporal remote sensing image analysis (before vs. after event)to assess flood impact (flooded areas, ground changes)
Hydraulic modeling to estimate damage from these EO products
6
Focus here
Outline
Introduction
Joining hydraulic modeling and remote sensing
Land cover and changed/flooded areas
Vulnerability, elements at risk, and damage
Markovian methods for land cover and change mapping
Markov random fields for spatial modeling
Fusing region, texture, and multisensor information
Examples of classification and change detection results
Flood case studies
Conclusion
7

Key Ideas of the Proposed Approach
Land cover► Elements at risk
EO-based land cover classes are reorganized into classes of elementsat risk that show similar behaviors wrt flooding.
Elements at risk► Vulnerability
Classes of elements at risk are assigned proper loss functions so thatdamage is known as a function of hydraulic forcing.
Flooded/changed areas► Flood exposure indicators
Water depth and other hydraulic parameters are estimated usinghydraulic models constrained to EO-based flooded or changed areas.
All derived information is merged to map damage.
8

Land Cover from Multispectral Images
9
Multispectral (VHR) image
Supervised classification
Land cover map
Ground truth data
for training
Main approach: supervised classification
Primary role of optical multi/hyperspectral images
Medium resolution (~30 m) to VHR (0.5 to 5 m)
Focus on VHR for spatially detailed analysis and small-size basins
Need for accurately mapping spatially diverse classes(homogeneous, textured, geometrically-shaped, etc.)
Land cover mapInput image with training pixels

Elements at Risk
10
Land cover map
Possible further land cover map
Elements-at-risk
mapping
Elements-at-risk map
Interactive many-to-manymapping from EO-basedland cover classes (andpossible ancillary classes,e.g., Corine) to element-at-risk classes through alookup table
Multispectral (VHR) image
Supervised classification
Ground truth data
for training
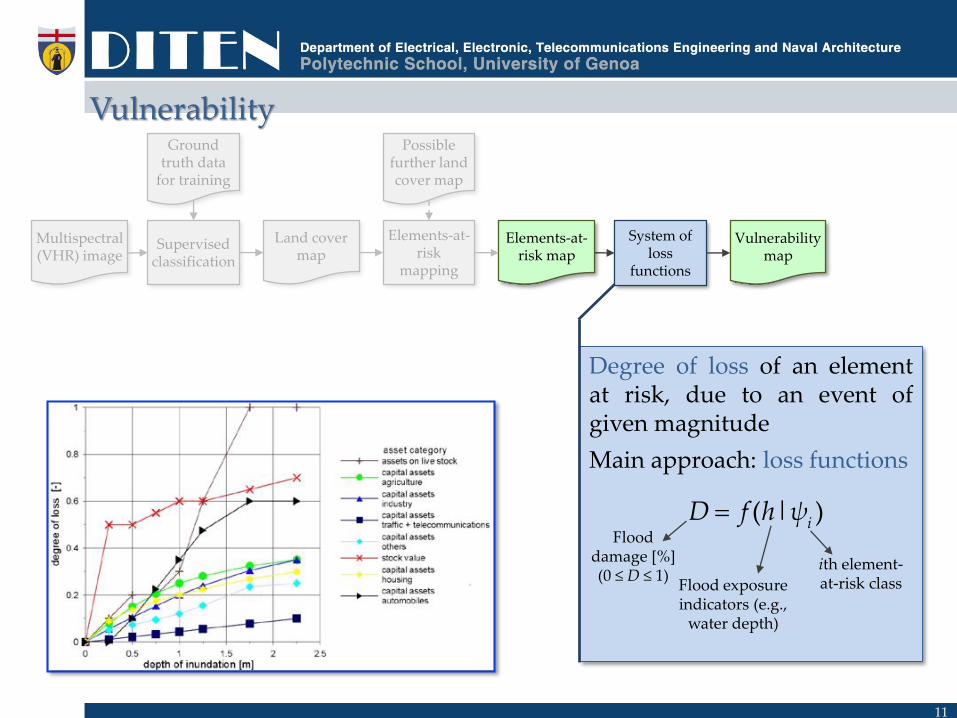
Vulnerability
11
System of loss
functions
Vulnerability map
Elements-at-risk map
Degree of loss of an elementat risk, due to an event ofgiven magnitude
Main approach: loss functions
( | )i
D f h ψFlood
damage [%] (0 ≤ D ≤ 1)
Flood exposure indicators (e.g.,
water depth)
ith element-at-risk class
Multispectral (VHR) image
Supervised classification
Land cover map
Elements-at-risk
mapping
Possible further land cover map
Ground truth data
for training

Buildings from VHR Images
12
Multispectral VHR image
Segmentation, edge detection, 3D
modeling
Extractedbuildings
Main approaches: stereo optical pairs, 3Dreconstruction from LiDAR, SARinterferometry, segmentation and edgedetection on optical VHR images.
A detected building is assigned a “type”based on its detected geometry and theelements-at-risk class of the area.
Detected roofs and shadows
VHR image
Multispectral (VHR) image
Supervised classification
Land cover map
Elements-at-risk
mapping
Elements-at-risk map
System of loss
functions
Vulnerability map
Possible further land cover map
Ground truth data
for training

Multispectral (VHR) image
Multispectral VHR image
Flooded Areas and Changes from Multitemporal Images
13
Supervised classification
Land cover map
Segmentation, edge detection, 3D
modeling
Extractedbuildings
Elements-at-risk
mapping
Elements-at-risk map
System of loss
functions
Vulnerability map
Possible further land cover map
Ground truth data
for training
Ground truthing often notcompatible with emergencyapplications
Main approaches:unsupervised detection andsegmentation
Primary role of VHR
Need for exploitingpossibly available optical,SAR, or multisensor data
Before
After
Image pair (before-after
the flood)
Unsupervisedchange detection
Segmentation
Change map
Map of flooded areas

Water Depth
14
Multispectral (VHR) image
Supervised classification
Multispectral VHR image
Land cover map
Segmentation, edge detection, 3D
modeling
Extractedbuildings
Image pair (before-after
the flood)
Unsupervisedchange detection
SegmentationMap of
flooded areas
Elements-at-risk
mapping
Elements-at-risk map
System of loss
functions
Vulnerability map
Possible further land cover map
Main approach: 2Dhydraulic modeling
Boundary and initialconditions based onflooded or changedareas from EO
Ensemble of modelruns: the ensemblemember that bestmatches floodextension is selected.
Ground truth data
for training
Digital terrain model
Hydraulic modeling
Flood exposure indicators
Change map

Damage Mapping
15
Multispectral (VHR) image
Supervised classification
Multispectral VHR image
Land cover map
Segmentation, edge detection, 3D
modeling
Extractedbuildings
SegmentationMap of
flooded areasHydraulic modeling
Flood exposure indicators
Elements-at-risk
mapping
Elements-at-risk map
System of loss
functions
Vulnerability map
Digital terrain model
Possible further land cover map
Ground truth data
for training
Damage is derived from waterdepth and loss functions.
Detected changes (e.g., toinfrastructures) or buildings canalso be marked with damage values.
Estimation of aereal or building-specific damage
percentages
Damage map
Image pair (before-after
the flood)
Unsupervisedchange detection
Change map

Extractedbuildings
Segmentation
Overall Architecture
16
Multispectral (VHR) image
Multispectral VHR image
Supervised classification
Land cover map
Segmentation, edge detection, 3D
modeling
Map of flooded areas
Hydraulic modeling
Flood exposure indicators
Digital terrain model
Possible further land cover map
Ground truth data
for training
S. B. Serpico, S. Dellepiane, G. Boni, G. Moser, E. Angiati, R. Rudari,, Proceedings
of the IEEE, 100:2946-2970, 2012
Elements-at-risk
mapping
Elements-at-risk map
System of loss
functions
Vulnerability map
Estimation of aereal or building-specific damage
percentages
Damage map
Multispectral VHR image
Segmentation, edge detection, 3D
modeling
Extractedbuildings
SegmentationMap of
flooded areasHydraulic modeling
Flood exposure indicators
Elements-at-risk
mapping
Elements-at-risk map
System of loss
functions
Vulnerability map
Estimation of aereal or building-specific damage
percentages
Damage map
Digital terrain model
Possible further land cover map
Image pair (before-after
the flood)
Unsupervisedchange detection
Change map

Outline
Introduction
Joining hydraulic modeling and remote sensing
Land cover and changed/flooded areas
Vulnerability, elements at risk, and damage
Markovian methods for land cover and change mapping
Markov random fields for spatial modeling
Fusing region, texture, and multisensor information
Examples of classification and change detection results
Flood case studies
Conclusion
17
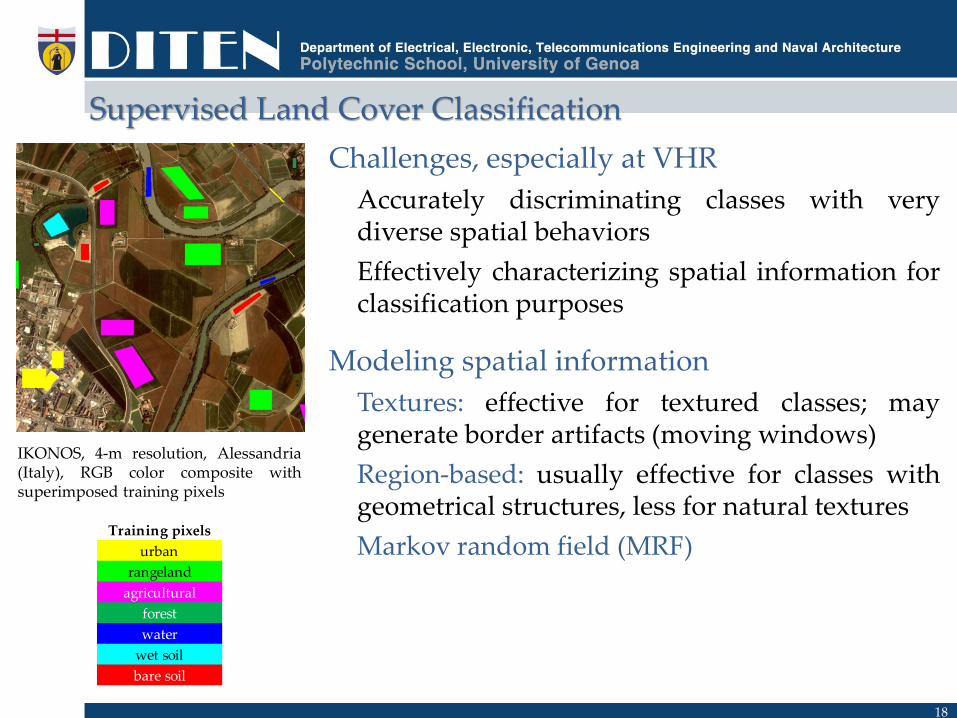
Supervised Land Cover Classification
Challenges, especially at VHR
Accurately discriminating classes with verydiverse spatial behaviors
Effectively characterizing spatial information forclassification purposes
Modeling spatial information
Textures: effective for textured classes; maygenerate border artifacts (moving windows)
Region-based: usually effective for classes withgeometrical structures, less for natural textures
Markov random field (MRF)
18
IKONOS, 4-m resolution, Alessandria(Italy), RGB color composite withsuperimposed training pixels
Training pixels
urban
rangeland
agricultural
forest
water
wet soil
bare soil

Markov Random Fields
MRF models
Representation of the statistical interactions among the class labels ofthe pixels (Y), by using only local relationships (neighborhood):
Maximum a posteriori (MAP), given the input image X
maxY P(Y| X) is generally intractable
When Y is an MRF, MAP is equivalent to minimizing a locallydefined energy function U(Y| X): tractable.
Possibly fusing multiple information sources by defining suitable U(·)
19
( ) 0
( , ) ( , ~ )i j i j
P Y
P y y j i P y y j iPixel j is a neighbor
of pixel i (j ~ i)
i
j
( | )
( | )( )
U Y XeP Y X
Z X

A Basic MRF: the Potts Model
Generally effective for medium resolution optical data
Often inappropriate for VHR optical data
Possible edge oversmoothing
Characterizes neighborhood context, but neglects texture andpossible membership to a homogeneous region.
20
~
( | )
ln ( | )
[1 ( , )]
i ii
i ji j
U Y X
p x y
β δ y y
Pixelwise energy contribution
Class-conditional distributions
Contextual energy term (Potts model)
Favors the same labeling for all pixels in ahomogeneous region

Multiscale Region-Based MRF
Incorporating region information
The multiscale approach is especially appealing for VHR.
Computing from X segmentation maps (S) at multiple (K) scales
Finer scales: precise spatial details, sensitivity to noise
Coarser scales: poor details, stronger immunity to noise
MRF to fuse class (Y) and segment (S) labels
21
1
~
( | )
ln ( | )
[1 ( , )]
K
k ik ik i I
i ji j
U Y S
α P s y
β δ y y
Multiscale region-based energy
One energy contribution for each scale, i.e.,each segmentation map
Class-conditional distribution of the regionlabel at each scale
Contextual neighborhood energy
Automatic optimization of (α, β) throughmean square error (MSE) algorithms
G. Moser, S. B. Serpico, J. A. Benediktsson, Proceedings of the IEEE, 101:631-651, 2013

Multiscale Region-Based MRF with Adaptive Textures
Incorporating region andtexture information
Feeding texture descriptors asadditional features to theregion-based MRF classifiermay lead to border artifacts.
Adaptive tuning of the movingwindow for texture extractionwrt class borders
Incorporates spatial informationassociated with neighborhoods,regions, and textures
22
Extract texture features by tuning the related processing window adaptively wrt
the class borders in the current classification map.
Update the classification map by applying the multiscale region-based MRF classifierto the multispectral and (adaptive) texture
features stacked together.
Generate an initial preliminary classification map
Convergence?
STOP
Yes No
G. Moser, S. B. Serpico, J. A. Benediktsson, Proceedings of the IEEE, 101:631-651, 2013

Unsupervised Change Detection
A “dissimilarity” image X is extracted from apair of optical, SAR or multisensor images.
May include multiple features, e.g., modulus ofmultispectral change vectors and ratios of(single- or multipolarization) SAR amplitudes.
Challenges
Effectively exploiting possibly available optical,SAR, or both (multisensor) input data
Ensuring robustness to speckle and noise
23
Time t₀ Time t₁
Comparison operator (e.g., difference, ratio, information-
theoretic distance)
Binary unsupervised classification (“change” vs. “no-change”)
X
Y

Data-Fusion Markovian Change Detection
Fusion of spatial and possibly multisensor information
Features (X) from SAR or optical data as multiple information sources
MRF to fuse change labels (Y) and multiple sources (X)
24
Γ
Γ
Γ Γ
Γ Γ
π
σ
2 1
NR 2 2 2
1
WR 2
2
LN 2
1/2 /2
GG 3/2 /2
2 (2 )( | , )
( ) ( )
( | , )( )
(ln )1( | , ) exp
22
(3 / ) (3 / )( | , , ) exp
(1 / ) (1 / )
ν ν
ν
ηη
η η
λλ
λ
γ xνp x γ ν
ν γ x
xp x ξ η ηξ
ξ x
x μp x μ σ
σxσ
x μλ λ λp x μ λ
σσ λ λ
Multisource energy
One energy contribution per feature
Distributions given “change” or “no-change”
Neighborhood energy
Favors robustness to speckle and noise
Unsupervised parameter estimation
Parametric distributions for SAR ratios andmodulus of spectral change vectors
Parameter estimation integrating EM, log-cumulants, and higher order moments
L. Gomez-Chova, D. Tuia, G. Moser, G. Camps.Valls, Proceedings of the IEEE, 103:1560-1584, 2015
+
1
~
( | )
ln ( | )
[1 ( , )]
K
k ik i ki I k
i ji j
U Y X
α p x y ,θ
β δ y y
Outline
Introduction
Joining hydraulic modeling and remote sensing
Land cover and changed/flooded areas
Vulnerability, elements at risk, and damage
Markovian methods for land cover and change mapping
Markov random fields for spatial modeling
Fusing region, texture, and multisensor information
Examples of classification and change detection results
Flood case studies
Conclusion
25

Segmentation maps
Example of VHR Classification Results
26
Test map
Non-contextual Gaussian Bayesian Potts-MRF Multiscale region-based MRF
IKONOS, 4-m res3 bands (Itaipu, Brazil-
Paraguay)
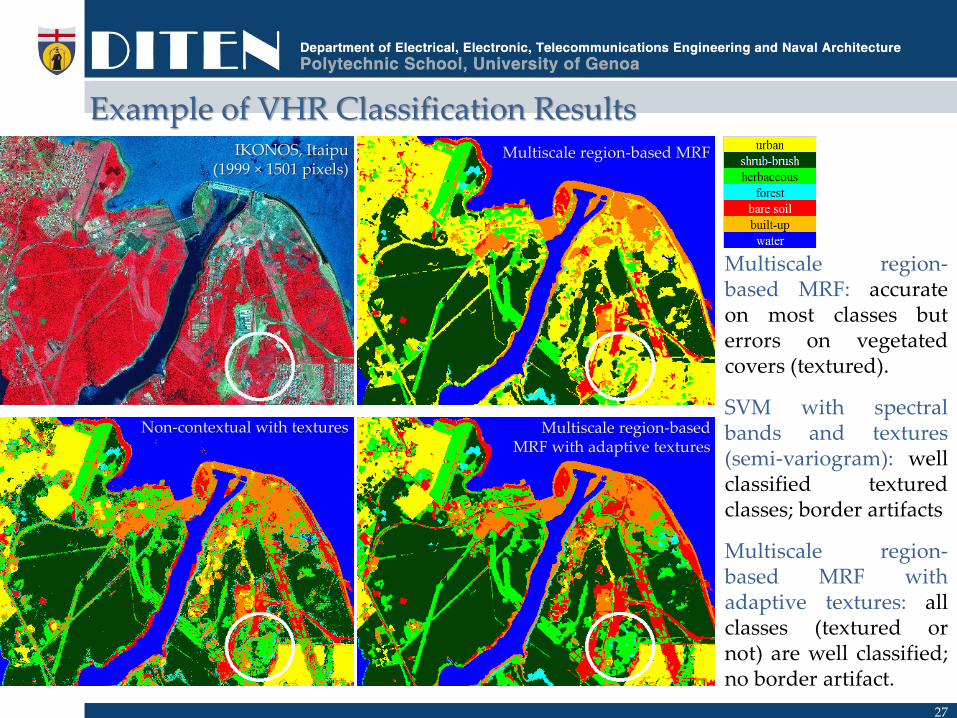
Example of VHR Classification Results
Multiscale region-based MRF: accurateon most classes buterrors on vegetatedcovers (textured).
SVM with spectralbands and textures(semi-variogram): wellclassified texturedclasses; border artifacts
Multiscale region-based MRF withadaptive textures: allclasses (textured ornot) are well classified;no border artifact.
27
IKONOS, Itaipu(1999 × 1501 pixels)
Multiscale region-based MRF
Non-contextual with textures Multiscale region-based MRF with adaptive textures
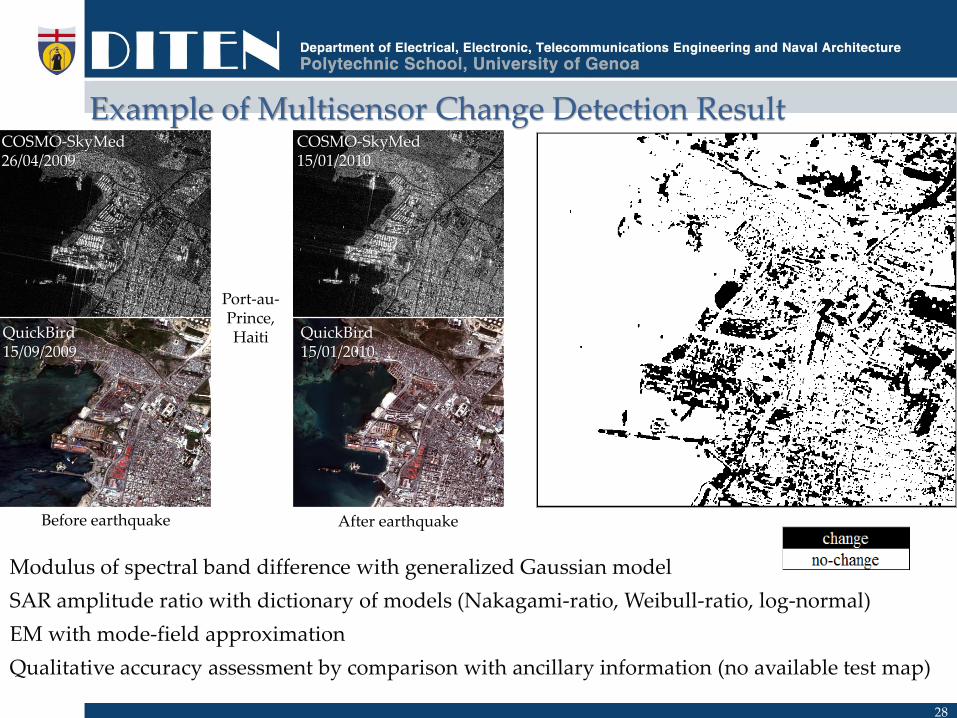
Example of Multisensor Change Detection Result
28
COSMO-SkyMed26/04/2009
COSMO-SkyMed15/01/2010
QuickBird15/09/2009
QuickBird15/01/2010
Port-au-Prince, Haiti
After earthquakeBefore earthquake

Example of Multisensor Change Detection Result
29
COSMO-SkyMed26/04/2009
COSMO-SkyMed15/01/2010
QuickBird15/09/2009
QuickBird15/01/2010
Port-au-Prince, Haiti
After earthquakeBefore earthquake
Only from SAR
Only from optical
Multisensor fusion

Outline
Introduction
Joining hydraulic modeling and remote sensing
Land cover and changed/flooded areas
Vulnerability, elements at risk, and damage
Markovian methods for land cover and change mapping
Markov random fields for spatial modeling
Fusing region, texture, and multisensor information
Examples of classification and change detection results
Flood case studies
Conclusion
30

Case Studies
Tanaro River, Italy, 2009
Flood near Alessandria, Italy, April 28, 2009
Heavy widespread rainfall in alpine and prealpine areas
Extension up to ~2 km, water depth up to 2-3 m
40 flooded buildings, 6000 people temporarily evacuated
31
Flooded area on April 28, 2009

Tanaro: from Land Cover to Vulnerability
32
IKONOS, 4-m res. Land cover map Land cover class
urban
rangeland
agricultural
forest
water
wet soil
bare soil
Elements-at-risk map Vulnerability map Elements-at risk class
Continuous urban area
Non-continuous urban area
Cultivations
Pasture lands, meadows
Woods
Bare soil
Humid areas
Insensitive to flood
Transparent: negligible
vulnerability

Tanaro: Flooded Area and Change Maps
33
COSMO-SkyMed, 1 day after the flood COSMO-SkyMed, 2 days after the flood
Flooded area map Change mapwater at both dates
water only at the first date

Tanaro: from Flooded Areas to Water Depth and Damage
Very short time scale of the flooding: hardto capture max flood extension with EO
The hydraulic model, initialized with EO-detected areas, reconstructs water passagewhile maintaining hydraulic connectivity.
Individual identified buildings could bemarked with damage values through thehydraulic model although they wereoutside the EO-detected flooded area.
34
Flooded areas
Estimated water depth
Extracted building footprints

Case Studies
Shkodër, Albania, 2010
Huge flood on January 11, 2010
Heavy rainfall and reduced snow accumulation (high temperatures)
Authorities were forced to release water from three hydroelectricpower lakes.
10500 ha inundated, 2500 flooded houses, 6000 people evacuated
Flood lasted until the end of January 2010.
35
Shkodër (Albania), flooded area, 2010

Shkodër: from Vulnerability to Damage
36
Vulnerability ► Flooded area ►Flood depth ► Flood velocity ►Damage [%]
Vulnerability legend
Cultivations
Vineyards, olive/fruit garden
Transparent: negligible
vulnerability
Flood-area map legend
water at both dates
water only at the first date
Damage map legend

Shkodër: Water Depth and Damage
Only a low-resolution (90 m) DTM was available.
Major break lines for the flood were evident in theEO result, but were fragmented in the DTM due tosampling issues.
Without remote sensing and with only the DTM,the hydraulic model would erroneously expandmuch more to the south as compared with whatcould be seen from the satellite images.
37
Water depth without EO
Water depth with EO (COSMO-SkyMed) Damage map
Outline
Introduction
Joining hydraulic modeling and remote sensing
Land cover and changed/flooded areas
Vulnerability, elements at risk, and damage
Markovian methods for land cover and change mapping
Markov random fields for spatial modeling
Fusing region, texture, and multisensor information
Examples of classification and change detection results
Flood case studies
Conclusion
38

Conclusion
Synergy between remote sensing and hydro-meteorology iscrucial for flood monitoring and damage assessment.
Case studies pointed out relationships and complementarities.
Using only one of these two components separately would lead toerroneous or more limited results.
Complementary properties also wrt in situ surveys: higher localaccuracy vs. spatially distributed and repetitive mapping.
Accurate mapping of flood-related thematic products through imageprocessing and pattern recognition techniques
Current maturity of image and pattern recognition supports not onlylaboratory experiments but also operational applications.
39

Conclusion
Effectiveness of advanced recent Markovian methods for land-cover and change mapping from VHR images
Allow jointly characterizing neighborhood, region, texture, andmultisensor information.
Accurate discrimination of classes with homogeneous, textured, andgeometrical behaviors
Capability to take benefit from multisensor input data
Automatic parameter estimation and time-efficient energyminimization (iterated conditional mode, graph cuts)
40

Related and Future Work
Keeping up to date with new missions, sensors, processingcapabilities and integrating them in the operational chains forflood management and damage assessment
Cloud or GPU processing
Semisupervised or active learning to ease the need for training data
Need for multitemporal analysis methods that are robust toheterogeneous acquisitions (e.g., different polarizations, differentacquisition geometries)
Reconfiguring currently consolidated operational chains for flood-risk management to exploit the information offered by EO.
41

ReferencesJ. Richards and X. Jia, Remote sensing digital image analysis, Springer, 2005
G. Boni and F. Siccardi, “Scenes and scenarios,” Public Service Review: European Science and Technology, vol. 10, pp. 128-129, 2011
A. Leopardi, E. Oliveri, and M. Greco, “Two-dimensional modeling of floods to map risk prone areas,” J. Water Res.Planning Management, vol. 128, pp. 168-178, 2002
S. B. Serpico, S. Dellepiane, G. Boni, G. Moser, E. Angiati, R. Rudari, “Information extraction from remote sensingimages for flood monitoring and damage evaluation”, Proceedings of the IEEE, vol. 100, no. 10, pp. 2946-2970, 2012
G. Moser, S. B. Serpico, and J. A. Benediktsson, “Land-cover mapping by Markov modeling of spatial-contextualinformation in very-high-resolution remote sensing images”, Proceedings of the IEEE, vol. 101, no. 3, pp. 631-651, 2013
L. Gomez-Chova, D. Tuia, G. Moser, G. Camps-Valls, “Multimodal classification of remote sensing images: a review andfuture directions,” Proceedings of the IEEE, 103(9):1560-1584, 2015
G. Moser and S. B. Serpico, “Unsupervised change detection from multichannel SAR data by Markovian data fusion,”IEEE Trans. Geosci. Remote Sensing, vol. 47, no. 7, 2009, pp. 2114-2128
S. B. Serpico, G. Moser, “Weight parameter optimization by the Ho-Kashyap algorithm in MRF models for supervisedimage classification”, IEEE Trans. Geosci. Remote Sensing, 44(12):3695-3705, 2006
G. Moser and S. B. Serpico, “Combining support vector machines and Markov random fields in an integratedframework for contextual image classification”, IEEE Trans. Geosci. Remote Sensing, vol. 51, no. 5, pp. 2734-2752, 2013
S. Dellepiane and E. Angiati, “A new method for cross-normalization and multitemporal visualization of SAR images forthe detection of flooded areas,” IEEE Trans. Geosci. Remote Sensing, vol. 50, no. 7, pp. 2765-2779, 2012
A. De Giorgi, G.Moser, S. B. Serpico, “Parameter optimization for Markov random field models for remote sensingimage classification through sequential minimal optimization,” Proc. of IGARSS 2015 , pp. 2346-2349, Milan, Italy, 2015
E. Angiati and S. Dellepiane, “Identification of roofs perimeter from aerial and satellite images”, Proc. 17th InternationalConference on Digital Signal Processing, Corfu, Greece, 2011
42
Recommended