33
Copyright © 2004 by Harcourt Assessment, Inc.
Reliability and Validity
Several studies were conducted to provide evidence of the reliability and validity of the
DELV–Standardization, African American edition. About three-quarters of the children
who participated in the reliability and validity studies were also part of the
standardization sample. The other children were recruited for the specific studies, and
they completed the DELV along with one or two other tests, as indicated.
Evidence of Reliability
Reliability refers to the consistency of scores obtained by repeatedly testing the same
student on the same test under identical conditions (including no changes to the child).
Although this is an unobtainable scenario, it is possible to obtain an estimate of
reliability. The reliability of the DELV–Standardization, African American edition was
estimated using test–retest stability (data that show that the standardization sample scores
are dependable and stable across repeated administrations), internal consistency (data
showing homogeneity of items, also known as coefficient alpha, and data using two
halves of the test to estimate reliability, also known as split-half reliability), and inter-
scorer reliability (data that show scoring is objective and consistent across scorers.)
Evidence of Test-Retest Stability
One way of estimating the reliability of an instrument is to examine its test-retest
stability. To do this, the child is administered the same test twice, each time under
34
Copyright © 2004 by Harcourt Assessment, Inc.
conditions that are as similar as possible. The scores are then compared for any
discrepancies. The interval chosen between the test and retest is as short as possible to
minimize changes in the child while being long enough that any practice or memory
effects have dissipated. It is expected that the child will not perform exactly the same way
during each of the two test sessions.
The DELV–Standardization, African American test–retest sample included 101 children,
the majority of whom were randomly selected from the standardization sample. The
children ranged in age from 4 years, 0 months through 6 years, 11 months (mean age: 5
years 5 months). The sample had the following composition: 51% females and 49%
males. The education level of the parents/caregivers of children in the sample included
18% with an 11th-grade education or less, 37% with a high school diploma or GED, 37%
with one to three years of college or technical school, and 8% with a college or post-
graduate degree. After being administered the DELV the first time, these children
repeated the test within a range of 13 to 32 days (mean of 19 days), with both tests
administered by the same examiner in the majority of cases.
The test–retest reliability was estimated using Pearson’s product-moment correlation
coefficient for the age bands 4:0–4:11, 5:0–5:11, 6:0–6:11, and all ages combined. The
mean domain scores and Total Language Scores, and their standard deviations, are
presented in Table 7. The test-retest coefficients were calculated using Fisher’s z
transformation. The table shows the correlation coefficients corrected for the variability
of the standardization sample (Allen & Yen, 1979; Magnusson, 1967). The table also
35
Copyright © 2004 by Harcourt Assessment, Inc.
shows the standard differences (i.e., effect size) between the first and second testing. The
standard difference was calculated using the mean score difference between two testing
sessions divided by the pooled standard deviation (Cohen, 1988). Cohen proposed that
effect sizes of .2, .5, and .8 would reflect small, medium, and large effect sizes,
respectively. Given these guidelines, it was expected that score gains from the first and
second administrations of the DELV Syntax, Pragmatics, and Semantics domains would
have a small to medium effect size due to practice effect. It also was hypothesized that
differences in test-retest scores on the DELV Phonology domain would be small, due to
the relative consistency over time in motor speech skills.
These expectations were met. As the data in Table 7 indicate, the DELV–Standardization,
African American sample scores possess adequate stability across time for all age bands
and for all ages combined. The average corrected stability coefficients for the Syntax
domain are good (in the .80s) for ages 4:0-5:11 and adequate (in the .70s) for ages 6:0-
6:11. The average corrected stability coefficients for the Pragmatics domain are adequate
for ages 4:0-4:11 (.69) and good for ages 5:0-6:11 (in the .80s). The average corrected
stability coefficients for the Semantics domain are good for ages 4:0-5:11 (in the .80s)
and adequate for ages 6:0-6:11 (.75); while the average corrected stability coefficients for
the Phonology domain are good to excellent for all ages (in the .80s and .90s).
The data also indicate that the mean retest scores are higher than the mean test scores
from the first testing with the exception of the Phonology domain for the 4:0–4:11 age
group. These results are primarily due to practice effects and are consistent across the

36
Copyright © 2004 by Harcourt Assessment, Inc.
three age groups. As hypothesized, the mean test-retest score differences are larger in the
Syntax, Pragmatics, and Semantics domains than in the Phonology domain for each of
the age groups. The standard differences reported in Table 7 reveal that several of the
score differences in the language domains are statistically meaningful. With the exception
of one Pragmatics domain score difference with a large effect size (.84), the other Syntax,
Pragmatics, and Semantics domains effect sizes are in the low to moderate range (.34 to
.68); for the Phonology domain, the effect sizes are in the negligible range (.04 to .17). In
the Phonology domain three of the four mean retest score comparisons are higher than the
mean test scores from the first testing; however, the differences between the scores are
very small and non-significant, with very small, even negligible effect-sizes. Since items
on the Phonology domain assess the child’s motor skills (i.e., production of phonemes in
continuous speech), it is expected that scores from one testing to another would be least
affected by practice for typically developing children. On the other hand, on the Syntax,
Pragmatics, and Semantic domains, the modest, yet statistically meaningful mean retest
score differences can be expected due to the child benefiting from having heard and
completed the items once before.

37
Copyright © 2004 by Harcourt Assessment, Inc.
Table 7. DELV-Standardization, African American Sample, Stability Coefficients for the Domain and CompositeScores by Age and All Ages Combined
Ages 4:0–4:11 (n = 32) Test Retest Standard Corrected
Domain/Composite Mean SD Mean SD Difference ra
Syntax 10.70 2.90 11.90 2.70 0.43 0.80Pragmatics 10.70 3.30 12.30 3.00 0.51 0.69Semantics 10.20 2.90 11.10 2.80 0.32 0.80Phonology 10.80 2.20 10.60 2.20 -0.09 0.88
Total Language Score 103.80 15.20 110.10 15.10 0.42 0.86
Ages 5:0–5:11 (n = 36) Test Retest Standard Corrected
Domain/Composite Mean SD Mean SD Difference ra
Syntax 10.40 2.70 11.60 2.60 0.45 0.81Pragmatics 10.20 3.10 11.20 2.70 0.34 0.80Semantics 10.00 3.30 11.20 3.80 0.34 0.82Phonology 10.00 2.50 10.10 2.50 0.04 0.88
Total Language Score 101.10 16.10 106.90 15.10 0.37 0.90
Ages 6:0–6:11 (n = 33) Test Retest Standard Corrected
Domain/Composite Mean SD Mean SD Difference ra
Syntax 10.00 2.20 11.40 1.90 0.68 0.70Pragmatics 10.10 1.90 11.70 1.90 0.84 0.84Semantics 9.40 2.50 10.40 2.40 0.41 0.75Phonology 10.30 2.50 10.70 2.10 0.17 0.92
Total Language Score 99.30 10.90 107.10 9.60 0.76 0.89
All Ages (n = 101) Test Retest Standard Corrected
Domain/Composite Mean SD Mean SD Difference rab
Syntax 10.40 2.60 11.70 2.40 0.52 0.77Pragmatics 10.30 2.90 11.70 2.60 0.51 0.78Semantics 9.90 2.90 10.90 3.00 0.34 0.79Phonology 10.30 2.40 10.40 2.30 0.04 0.90
Total Language Score 101.40 14.30 108.00 13.50 0.47 0.88Note. Standard difference is the difference of the two test means divided by the square root of the pooled variance,computed using Cohen's d (1996).a Correlations were corrected for variability of the standardization sample (Allen & Yen, 1979; Magnusson, 1967).b Average stability coefficients across the six age bands were calculated with Fisher's z transformation.
Evidence of Internal Consistency
Measures of internal consistency can also be used to estimate an instrument’s reliability.
Using internal consistency as a measure of reliability implies that the items in a domain
are measuring one construct (i.e., describes the homogeneity of the items in a domain).

38
Copyright © 2004 by Harcourt Assessment, Inc.
Internal consistency information is presented for both the standardization sample and for
the clinical samples, including children identified with language disorders and
articulation disorders. Reliability is reported based on the results of two analyses:
coefficient alpha and the split-half method. In addition to functioning as an indicator of
measurement error, the reliability coefficients were used to generate the critical values
that can be used to calculate confidence intervals for the scaled and standard scores used
in the sections describing the reliability and validity studies; however, they do not apply
to the percentile norms presented in Appendix A.
Coefficient Alpha
The DELV–Standardization, African American sample reliability for all domains was
examined using Cronbach’s coefficient alpha (Crocker & Algina, 1986). The coefficient
alpha for the Total Language Scores were calculated with the formula for calculating the
reliability of a composite (Nunnally, 1978). Coefficient alpha for the domain and Total
Language Scores are reported by age in Table 8 for the standardization sample. Data for
the two clinical groups tested (language disordered and articulation disordered) are
reported by domain in Table 10.
As the data in Table 8 indicate, the average coefficient alphas of the DELV domains
across the six age groups range from .77 to .91. All domains are in the .70s or higher.
This suggests adequate to good reliability across all domains. The reliability coefficients
for the DELV Total Language Score range from .91 to .95 and are generally higher than
39
Copyright © 2004 by Harcourt Assessment, Inc.
those of the individual domains that compose the Total Language Score. This difference
occurs because each domain represents only a small portion of an individual’s entire
language functioning, whereas the Total Language Score summarizes the individual’s
performance on a broader sample of abilities. Therefore, the high reliability coefficients
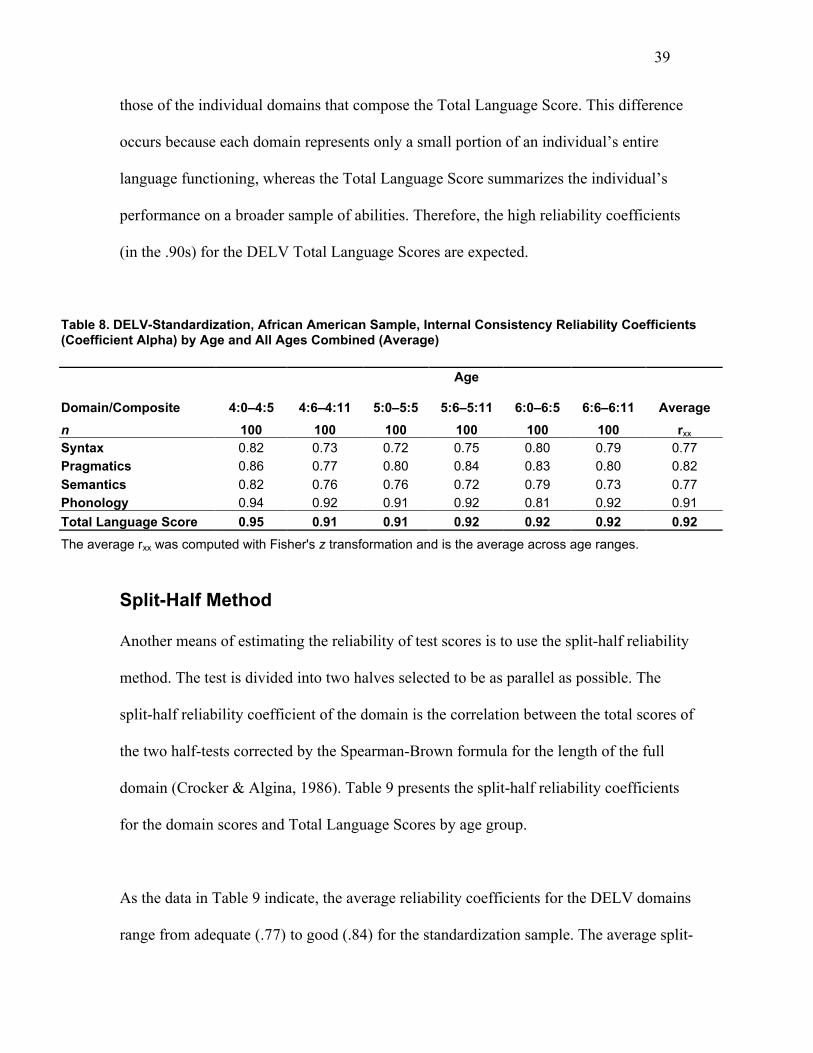
(in the .90s) for the DELV Total Language Scores are expected.
Table 8. DELV-Standardization, African American Sample, Internal Consistency Reliability Coefficients(Coefficient Alpha) by Age and All Ages Combined (Average)
Domain/Composite 4:0–4:5 4:6–4:11 5:0–5:5
Age
5:6–5:11 6:0–6:5 6:6–6:11 Average
n 100 100 100 100 100 100 rxx
Syntax 0.82 0.73 0.72 0.75 0.80 0.79 0.77Pragmatics 0.86 0.77 0.80 0.84 0.83 0.80 0.82
Semantics 0.82 0.76 0.76 0.72 0.79 0.73 0.77Phonology 0.94 0.92 0.91 0.92 0.81 0.92 0.91
Total Language Score 0.95 0.91 0.91 0.92 0.92 0.92 0.92
The average rxx was computed with Fisher's z transformation and is the average across age ranges.
Split-Half Method
Another means of estimating the reliability of test scores is to use the split-half reliability
method. The test is divided into two halves selected to be as parallel as possible. The
split-half reliability coefficient of the domain is the correlation between the total scores of
the two half-tests corrected by the Spearman-Brown formula for the length of the full
domain (Crocker & Algina, 1986). Table 9 presents the split-half reliability coefficients
for the domain scores and Total Language Scores by age group.
As the data in Table 9 indicate, the average reliability coefficients for the DELV domains
range from adequate (.77) to good (.84) for the standardization sample. The average split-

40
Copyright © 2004 by Harcourt Assessment, Inc.
half coefficient for the Phonology and Pragmatics domains is good (.84 and .80,
respectively). The average split-half coefficients for the Syntax and Semantics domains
are .79 and .77, respectively. The composite scores are in the excellent range (in the
.90s).
Table 9. DELV-Standardization, African American Sample, Internal Consistency Reliability Coefficients(Split-Half) by Age and All Ages Combined (Average)
Domain/Composite 4:0–4:5 4:6–4:11 5:0–5:5
Age
5:6–5:11 6:0–6:5 6:6–6:11 Average
n 100 100 100 100 100 100 rxx
Syntax 0.83 0.82 0.78 0.77 0.77 0.74 0.79Pragmatics 0.84 0.77 0.82 0.82 0.78 0.78 0.80Semantics 0.86 0.67 0.78 0.74 0.80 0.73 0.77Phonology 0.90 0.87 0.82 0.84 0.73 0.84 0.84
Total Language Score 0.95 0.90 0.91 0.91 0.90 0.91 0.92
The average rxx was computed with Fisher's z transformation and is the average across age ranges.
Evidence of Reliability for Clinical Groups
Reliability information was also examined for clinical groups of children. The evidence
of internal consistency reliability from clinical groups was obtained by the coefficient
alpha and split-half methods from a sample of 135 children in two groups: children
previously identified as having a language disorder and children previously identified as
having an articulation disorder. Detailed demographic information for both clinical
groups, along with descriptions of the inclusion criteria for each group, is reported in the
validity section of this report.
Tables 10 and 11 provide internal consistency reliability coefficients for the domain
scores and Total Language Scores for the two clinical groups. The reliability coefficients
were calculated using the same procedure described for Tables 8 and 9. The data show

41
Copyright © 2004 by Harcourt Assessment, Inc.
that the domain and Total Language Score reliability coefficients of the clinical groups
are either higher than or similar to those coefficients reported for the normative sample,
which suggests that DELV is as equally reliable for measuring the speech and language
skills of children from the general population as for children with clinical diagnoses of
speech and language disorders.
Table 10. DELV-Standardization, African AmericanSample, Internal Consistency Reliability Coefficients(Coefficient Alpha) for Clinical Groups
Domain/Composite LD ADn 102 33Syntax 0.78 0.89Pragmatics 0.82 0.89Semantics 0.76 0.85Phonology 0.94 0.94
Total Language Score 0.91 0.95
Note. LD = Language Disorder; AD = ArticulationDisorder
Table 11. DELV-Standardization, African AmericanSample, Internal Consistency Reliability Coefficients(Split-Half) for Clinical Groups
Domain/Composite LD ADn 102 33Syntax 0.77 0.88Pragmatics 0.81 0.94Semantics 0.77 0.76Phonology 0.88 0.87
Total Language Score 0.91 0.94
Note. LD = Language Disorder; AD = ArticulationDisorder
42
Copyright © 2004 by Harcourt Assessment, Inc.
Standard Error of Measurement and Confidence
Intervals
Observed scores, such as scores on measures of language skills, are based on
observational data. Observed scores reflect a child’s true abilities combined with some
degree of measurement error. An observed score is an estimate of a child’s true score. We
can more accurately represent a child’s true score by establishing a band of scores around
the observed score.
The standard error of measurement (SEM) is a statistic that estimates the amount of error
and is directly related to the test’s reliability coefficients and the variability (standard
deviation) of test scores. The SEM for a single score indicates the variability expected in
obtained scores around the “true” score. In other words, standard error of measurement
indicates how much a child’s score may vary if the child were repeatedly tested on the
same instrument under identical circumstances. When a test is administered to a child, the
resulting scores are estimates of his or her true scores, which include some error. Because
of this, the SEM of a test helps users gain a sense of how much the child’s score is likely
to differ from his or her true score.
The SEM can also be used to place a confidence interval around the child’s score (i.e., the
range of scores within which the child’s true score is likely to be). Confidence intervals
establish the range within which one can have a degree of confidence that the score
would occur if the test was administered to the same person again.

43
Copyright © 2004 by Harcourt Assessment, Inc.
Table 12 reports the SEMs for the DELV–Standardization, African American sample
domain scaled scores. The smaller the SEM, the less variability in a given score from a
true score. The SEMs were calculated for evaluation of the DELV scaled and standard
scores reported with the reliability and validity analyses. SEMs are appropriate for
standard scores; they should not be used for percentile ranks such as those reported in
Appendix A.
Table 12. DELV-Standardization, African American Sample, Standard Errors of Measurement (SEMs) Based onInternal Consistency Reliability Coefficients (Split-Half) for Domains and Composite by Age and All AgesCombined (Average SEM)
Domain 4:0–4:5 4:6–4:11 5:0–5:5 5:6–5:11 6:0–6:5 6:6–6:11 Average SEMa
Syntax 1.24 1.27 1.41 1.44 1.44 1.53 1.39Pragmatics 1.20 1.44 1.27 1.27 1.41 1.41 1.34
Semantics 1.12 1.72 1.41 1.53 1.34 1.56 1.46Phonology 0.95 1.08 1.27 1.20 1.56 1.20 1.22
Total Language Score 3.35 4.74 4.50 4.50 4.74 4.50 4.41
Note: The standard errors of measurement are reported in scaled score units for the domains and standard score unitsfor the total language score. The reliability coefficients shown in Table 12 and the population standard deviation (i.e., 3 forthe domains and 15 for the composite) were used to compute the standard errors of measurement.
a The average SEMs were calculated by averaging the sum of the squared SEMs for each age group and obtaining thesquare root of the result.
Evidence of Inter-Scorer Reliability
While four of the DELV–Standardization sub-domains are scored objectively, seven are
subjectively scored, requiring familiarity with different scoring criteria. Because there is
room for interpretation, it was necessary to evaluate the extent to which these
interpretations were consistent from one scorer to another. Scoring rules were developed
during the tryout phase of research for the following sub-domains: Wh-Questions;
Articles; Communicative Role-Taking; Short Narrative; Question Asking; Verb
44
Copyright © 2004 by Harcourt Assessment, Inc.
Contrasts, and Preposition Contrasts. These same scoring rules were used to train three
scorers during the standardization phase of research; these rules can be found in the
scoring directions and appendices of the DELV-Criterion Referenced Examiner’s
Manual. Two scorers scored each standardization record form independently. The results
were compared, and discrepancies in scores were flagged and reported. Discrepancies
were resolved by a third, independent scorer.
Table 13 reports the inter-scorer consistency percentage for each domain by age
(including both the objectively-and subjectively-scored sub-domains) and the average for
all ages combined. The agreement percentage for each age group ranges from .94 to 1.00,
and the average score agreement for all ages combined ranges from .95 to 1.00. As was
expected, the highest percentage agreements (1.00) occurred in the Phonology Domain
that is scored entirely objectively. Also, as expected, the slightly lower percentage
agreements (i.e., .94-.96) occurred in the totally subjectively scored Pragmatics Domain.
Overall, the results indicate a high degree of consistency between scorers’ interpretations
(i.e., scoring) of the children’s responses; this demonstrates that all subtests can be scored
reliably using the scoring rules contained in the existing DELV–Criterion Referenced
Examiner’s Manual.

45
Copyright © 2004 by Harcourt Assessment, Inc.
Table 13. Inter-Scorer Consistency Percentage for Each Domain by Age
AgeDomain 4:00-4:05 4:06-4:11 5:00-5:05 5:00-5:11 6:00-6:05 6:06-6:11 AverageSyntax 0.96 0.97 0.98 0.97 0.98 0.99 .98Pragmatics 0.94 0.94 0.95 0.95 0.96 0.95 .95Semantics 0.98 0.98 0.99 0.98 0.99 0.99 .99
Phonology 1.00 1.00 1.00 1.00 1.00 1.00 1.00
Summary
The information reported presents evidence for the reliability of scores derived from
administration of the DELV–Standardization, African American edition. It is important to
remember that the DELV scores provide only one piece of information about a child’s
language skills. The DELV–Standardization, African American edition scores should
always be integrated with other relevant information about a child’s skills in a variety of
settings, case history information, and information from a variety of sources, including
the child’s family and teachers.
Evidence of Validity
Test scores are valid to the extent that they measure what they are intended to measure.
There are multiple sources of information required in the process of test validation.
Evidence of test validity refers to the degree to which specific data, research, or theories
support that the test measures the concepts it purports to measure and is applicable to the
intended population (AERA, APA, & NCME, 1999). Although different sources of
evidence may represent different aspects of validity, these sources do not represent
46
Copyright © 2004 by Harcourt Assessment, Inc.
distinct types of validity. The DELV–Standardization presents evidence of validity based
on test content, response process, internal structure, and relationships to other variables.
Evidence Based on Test Content
A major source of evidence about the validity of a test is provided as a consequence of
thoroughly examining the relationship between a test’s content and the construct it is
intended to measure. Evidence of content validity is demonstrated by the degree to which
the test items adequately represent and relate to the developmental aspects of the
concepts that are being measured. Appropriate wording and format of items, as well as
appropriate procedures for administering and scoring the test contribute to the accurate
interpretation of test scores.
The DELV initially was designed by external experts at the University of
Massachusetts–Amherst and Smith College and, subsequently, was reviewed by internal
experts at Harcourt Assessment, Inc. DELV is the culmination of years of research and
conceptual advances in the areas of African American English, first language acquisition,
and communication disorders. The goal was to incorporate contemporary linguistic and
psycholinguistic principles involved in the acquisition of wh-movement, quantifiers,
speech acts, Theory of Mind, and other constructs in order to develop a speech and
language diagnostic test that would be culturally fair for all children, aged 4–6 years,
especially those who speak African American English (AAE).

47
Copyright © 2004 by Harcourt Assessment, Inc.
The DELV–Standardization is based on the contrastive/non-contrastive assessment
model, that acknowledges African American English as one of many legitimate, rule-
governed varieties of American English, and, as such, constitutes a language difference,
not a disorder (Labov, 1972; Wolfram, 1974). This assessment model, first proposed by
Seymour and Seymour (1977), identified potential markers of a disorder as those
language structures that are shared (non-contrastive) by AAE and MAE speakers, and
identified potential markers of difference as those language structures that are not shared
(contrastive). This model evolved into a contrastive/non-contrastive model in which the
identification of speakers of AAE relies on features that contrast with MAE, while the
diagnosis of language disorders focuses on only those linguistic patterns that do not
contrast with MAE.
The linguistic and psycholinguistic constructs upon which the DELV–Standardization
domains are based include syntax, pragmatics, semantics, and phonology. The language
skills sampled in the DELV–Standardization domains are well documented in the
literature and presented below. More detailed discussions of the theoretical bases of the
DELV domains are found the DELV–Screening Test and the DELV–Criterion
Referenced Examiner’s Manuals and in a special issue of Seminars in Speech and
Language (Thieme, Volume 25:1, 2004). Those discussions are summarized briefly in the
following paragraphs.
Research in the framework of Universal Grammar was integral to the DELV Syntax
domain. Chomsky’s (1973, 1977, 1986) research and insights into universal properties of

48
Copyright © 2004 by Harcourt Assessment, Inc.
language, and particularly the area of first language acquisition, have been further
explored across many different languages and language varieties, including African
American English (Coles, 1998; Green, 2002; Jackson, 1998; Terry, 2002). The
DELV–Standardization uses this research in the context of syntactic development to
probe the areas of movement rules, wh- words as variables, passive sentence
construction, and articles.
Research in the areas of speech acts, narrative development, Theory of Mind, and
question asking was integral to the development of the DELV Pragmatics domain
(Astington, 1993; Baron-Cohen, 1995; Bartsch & Wellman, 1995; Bates, 1976; Berman,
1988; Berman & Slobin, 1994; Bruner, 1986; de Villiers, 1988; de Villiers & de Villiers,
1985; de Villiers & de Villiers, 2000; Dore, 1974; Grice, 1975; Halliday & Hassan, 1976;
Karmiloff-Smith, 1986; Perner, 1991; Searle, 1969; Tabors, Roach, & Snow, 2001;
Wellman, 1990).
The development of the DELV Semantics domain was based on research in the areas of
lexical organization, quantification, and fast mapping (Aitchison, 1987; Anglin, 1970;
Blake 1984; Fisher, 1996; Gleitman, 1990; Huttenlocher & Lui, 1979; Levin, 1993;
Mattei & Roeper, 1975; Naigles, 1990; Phillip, 1995; Roeper & de Villiers, 1993;
Stockman, 1992; Stockman, 1999; Tomasello & Merriman, 1995; Rice & Bode, 1993;
Waxman & Hatch, 1992).
49
Copyright © 2004 by Harcourt Assessment, Inc.
Research in the areas of contrastive/non-contrastive elements and consonant clusters was
the basis for the development of the DELV Phonology domain (Abdulkarim, Bryant,
Seymour, & Pearson, 1999a; Abdulkarim, Bryant, Seymour, & Pearson, 1999b; Dubois
& Bernthal, 1978; Green, 2002; Moran, 1993; Morrison & Shriberg, 1992; Olmsted,
1972; Seymour, Green & Huntley, 1991; Seymour & Seymour, 1981; Stockman, 1993;
Stockman, 1996; Wolfram & Fasold, 1974).
There is a complex relationship between articulation development and phonological
development. Articulation involves the physical aspects of speech that modify the breath
stream, resulting in speech sounds. Phonology encompasses the linguistic rules governing
the sound system of the language, including speech sounds, speech sound production, and
the combination of sounds in meaningful utterances. Normal speech development
includes the acquisition of articulation and phonological skills. DELV takes this nexus
between articulation and phonology into account when assessing phonemes produced in
continuous speech.
Evidence Based on Response Processes
Another source of validity evidence comes from showing that the task formats elicit
responses in the desired manner, thus measuring the intended skills. This type of
evidence comes from an analysis of the intended process being assessed, analysis of the
child’s response processes, and evaluation of observers’ and/or scorers’ interpretations of
behavior and/or scores. The item tasks for the DELV–Standardization, African American
edition were based on the ones developed for the DELV–Criterion Referenced. When the
50
Copyright © 2004 by Harcourt Assessment, Inc.
item tasks were being developed for the DELV–Criterion Referenced, the authors
reviewed each of the tasks for the following:
1. the task focused on the intended skill (e.g., expressive responses required either
answering the question, telling a story, asking a question, finishing-the-sentence, or
imitating a sentence; receptive responses required pointing to a picture);
2. the task did not require skills that were not acquired by children at the target ages
(e.g., pointing to a picture; imitating a short sentence);
3. the task supports were in place to minimize confounding processes (e.g., picture
supports were provided to minimize auditory memory load); and
4. the content of the tasks focused on themes/topics that interest children.
After review of examiner feedback and data analysis, the authors and in-house staff
determined that the final item set met the criteria to a satisfactory degree.
Evidence Based on Internal Structure
Patterns of domain intercorrelations reflect the degree to which the domains are related.
Domains that measure similar constructs are expected to have moderate-to-high
correlations that reflect convergent validity. Domains that measure different constructs
are expected to have low-to moderate intercorrelations. The linguistic and
psycholinguistic constructs that form the basis for the DELV suggest that the language
domains will be somewhat independent of one another and have positive low-to-
moderate intercorrelations. The Phonology domain is expected to have the lowest
intercorrelations with the other language domains.
51
Copyright © 2004 by Harcourt Assessment, Inc.
Table 14 presents the average correlations of the DELV domains with the mean scaled
scores for domains and mean composites across ages. The average correlations were
computed using Fisher’s z transformation. The uncorrected coefficients appear below the
diagonal, and the corrected coefficients appear above the diagonal in the shaded area.
Statistical analysis indicates that all domains correlate positively and that all correlations
are statistically significant at the .01 level.
The Syntax, Pragmatics, and Semantics domains all have moderate intercorrelations (in
the .60s) with each other. This is not surprising considering that these domains all
measure language skills. Further, semantics is associated with the acquisition of words,
and knowledge of the associated meanings of words is required to formulate meaningful
sentences (syntax) and to use language appropriately (pragmatics).
Not unexpectedly, the lowest correlations are between the Phonology domain and the
other three domains of language, ranging from .22 to .36. This pattern of intercorrelations
is likely due to the fact that the Syntax, Pragmatics, and Semantics domains are used to
measure language skills rather than the motor speech skills measured by the tasks in the
Phonology domain.

52
Copyright © 2004 by Harcourt Assessment, Inc.
Table 14. DELV-Standardization, African American Sample, Intercorrelations of Domains andComposite Scores
Domain/Composite Syn Prag Sem Phon TLSSyntax (Syn) . . . . 0.70Pragmatics (Pra) 0.67 . . . 0.70Semantics (Sem) 0.63 0.60 . . 0.61Phonology (Pho) 0.32 0.36 0.22 . 0.35Total Language Score (TLS) 0.85 0.85 0.80 0.60 .
Mean1 10.01 10.01 9.99 10.09 100.02
SD2 3.00 3.01 2.97 2.79 15.76
n3 600 600 600 600 600Note. Correlations4 were averaged across all ages using Fisher's z transformations. Correlations above thediagonal are corrected correlations for the composite score.1 Mean is the arithmetic average across all ages.2 SD is the pooled standard deviation across all ages.3 n is the total n across all ages4 p ≤ .01 for all correlation coefficients
Evidence Based on Relationships to Other
Variables – DELV Correlations with Selected
External Measures
The examination of the relationship between test scores and external variables (test-
criterion relationships) provides additional evidence of a test’s validity. Frequently this
evidence is provided through an examination of the test’s relationship to other
instruments designed to measure similar constructs. Likewise, a test’s validity can be
determined by demonstrating that the test is dissimilar to instruments that are measures of
abilities not assessed by the test. As applied to the DELV–Standardization, African
American sample, evidence concerning test-criterion relationships is intended to answer
questions such as “Is the DELV–Standardization a valid measure of language?”

53
Copyright © 2004 by Harcourt Assessment, Inc.
Evidence of criterion-related validity was evaluated by comparing the performance of
children on the DELV–Standardization, African American edition, with selected subtests
of the Clinical Evaluation of Language Fundamentals–Fourth Edition (CELF®–4) (The
Psychological Corporation, 2003), the Naglieri Nonverbal Ability Test –Individual
(NNAT®–I) (The Psychological Corporation, 2002), and the Articulation Screener section
of the Preschool Language Scale–Fourth Edition (PLS–4) (The Psychological
Corporation, 2002). As both the DELV and the CELF–4 measure language, albeit in very
different ways, it is expected that there will be low to moderate correlations between the
two tests. The NNAT–I is a measure of nonverbal reasoning ability; consequently, the
expectation is for a very low correlation between NNAT–I and DELV scores. Finally, the
Articulation Screener section of the PLS–4 measures articulation. It is hypothesized that
there will be a low correlation between PLS-4 Articulation Screener scores and the
language domain scores of the DELV, but that there will be a moderate to high
correlation between the PLS-4 Articulation Screener scores and the Phonology domain
scores of the DELV.
Relationship to a Measure of Language
CELF–4 is a standardized clinical tool for the identification, diagnosis, and follow-up
evaluation of language and communication disorders. Fifty typically-developing children
and two children identified with language disorder (ages 6:0–6:11) were tested with the
DELV–Standardization, African American edition and four subtests of the CELF–4.
Twenty-six (26) of the children were AAE speakers, and they were matched as closely as

54
Copyright © 2004 by Harcourt Assessment, Inc.
possible by mean income level, parent education level (PED), age, gender, and region
with 26 MAE speaking children. Because correlations using small sample sizes (e.g., n =
26) are less meaningful statistically, the matched samples of AAE and MAE children
were combined to increase the statistical power for the analysis. The four CELF–4
subtests administered to each child were Expressive Vocabulary, Sentence Structure,
Understanding Spoken Paragraphs, and Word Classes, including Word
Classes–Receptive, and Word Classes–Expressive. The expectation was that there would
be low to moderate correlations between these CELF–4 subtests and the DELV Syntax,
Pragmatics, and Semantics domains as they measure the same language constructs but are
based on different theoretical models. It was also predicted that there would be little to no
correlation between the DELV Phonology Domain and the CELF-4 subtests, as the
former is a measure of articulation and the latter are measures of language.
The Expressive Vocabulary subtest assesses a child’s ability to name pictures that
represent nouns and verbs (referential word knowledge/naming). Since this subtest uses a
more traditional approach to assessing expressive vocabulary, but measures the same
construct (word meanings) as the Semantics domain (e.g., Verb Contrasts and Preposition
Contrasts sub-domains), it was hypothesized that the Expressive Vocabulary subtest
would have a low or moderate correlation with this DELV domain. The Listening to
Paragraphs subtest assesses a child’s ability to interpret factual and inferential
information presented in spoken paragraphs and understand increasingly complex syntax.
It was expected that there would be a moderate correlation between the Syntax domain
and the Listening to Paragraphs subtest because of the similarity of listening tasks (i.e.,

55
Copyright © 2004 by Harcourt Assessment, Inc.
answering Wh-questions) in both of them. The Sentence Structure subtest assesses the
acquisition of English structural rules in spoken language. It was hypothesized that this
subtest would correlate moderately with the Syntax domain (e.g., Wh-Questions,
Passives, and Articles sub-domains). The Word Classes subtest evaluates a child’s ability
to perceive the associative relationships between words. Similar to the rationale used for
selecting the Expressive Vocabulary subtest, the Word Classes was expected to have a
low or moderate correlation with the DELV Semantics domain (e.g., Verb Contrasts and
Preposition Contrasts sub-domains).
Test sessions were completed 1 to 27 days apart (mean = 6 days). The demographic
characteristics for this sample are presented in Table 15.
56
Copyright © 2004 by Harcourt Assessment, Inc.
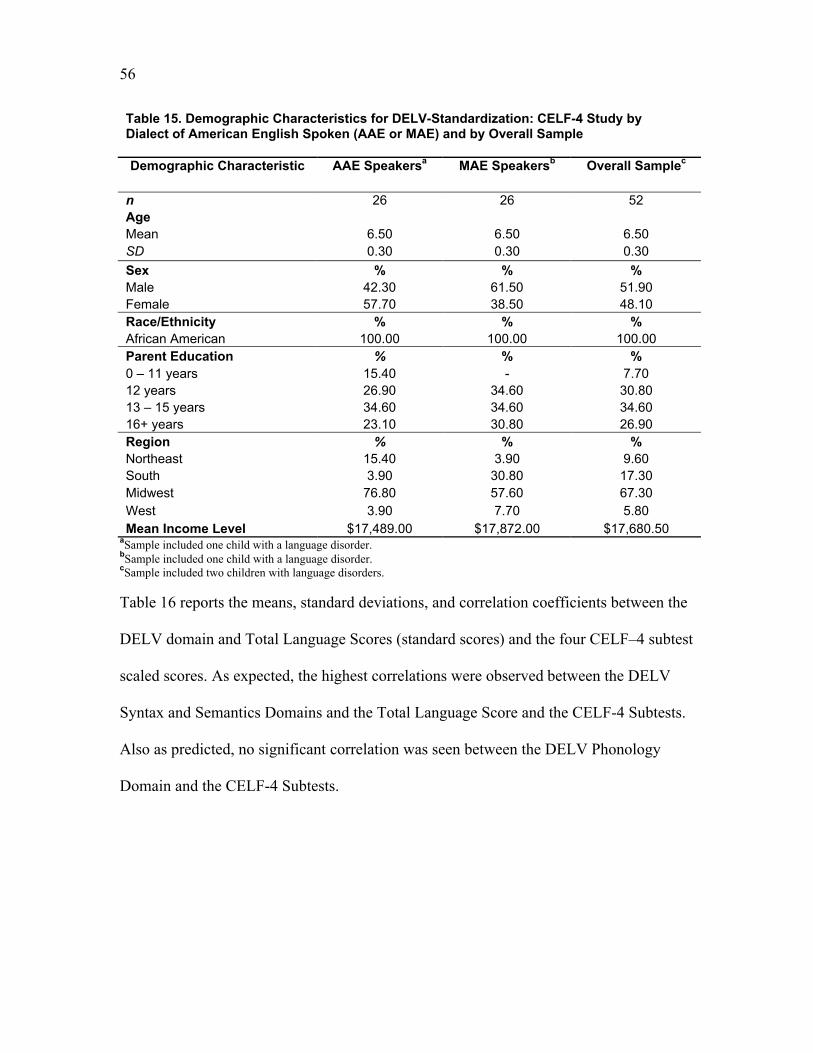
Table 15. Demographic Characteristics for DELV-Standardization: CELF-4 Study byDialect of American English Spoken (AAE or MAE) and by Overall Sample Demographic Characteristic AAE Speakersa MAE Speakersb Overall Samplec
n 26 26 52AgeMean 6.50 6.50 6.50SD 0.30 0.30 0.30
Sex % % %Male 42.30 61.50 51.90Female 57.70 38.50 48.10Race/Ethnicity % % %African American 100.00 100.00 100.00Parent Education % % %0 – 11 years 15.40 - 7.7012 years 26.90 34.60 30.8013 – 15 years 34.60 34.60 34.6016+ years 23.10 30.80 26.90Region % % %Northeast 15.40 3.90 9.60South 3.90 30.80 17.30Midwest 76.80 57.60 67.30West 3.90 7.70 5.80Mean Income Level $17,489.00 $17,872.00 $17,680.50
aSample included one child with a language disorder.bSample included one child with a language disorder.cSample included two children with language disorders.
Table 16 reports the means, standard deviations, and correlation coefficients between the
DELV domain and Total Language Scores (standard scores) and the four CELF–4 subtest
scaled scores. As expected, the highest correlations were observed between the DELV
Syntax and Semantics Domains and the Total Language Score and the CELF-4 Subtests.
Also as predicted, no significant correlation was seen between the DELV Phonology
Domain and the CELF-4 Subtests.

57
Copyright © 2004 by Harcourt Assessment, Inc.
Table 16. Means, Standard Deviations, and Correlation Coefficients Between DELV-StandardizationDomain and Total Language Scores and CELF-4 Subtest Scores (n = 52)
DELV-Standardization CELF–4 Subtests DELV-Standardization
Domain/Composite WC WC-R WC-E SS EV USP Mean SD
Syntax 0.54 0.58 0.51 0.46 0.40 0.43 10.1 2.7Pragmatics 0.15 0.16 0.14 0.24 0.25 0.27 10.0 2.5Semantics 0.33 0.33 0.34 0.33 0.37 0.55 10.1 2.7Phonology -0.16 -0.11 -0.17 -0.06 0.04 0.00 10.7 1.5Total Language Score 0.37 0.39 0.35 0.38 0.41 0.49 101.3 11.6
CELF–4 Mean 10.3 10.0 10.7 9.6 8.8 9.8 SD 3.3 3.1 3.3 3.0 2.9 2.6
Note. All correlations were corrected for the variability of the DELV-Standardization, African American sample(Guilford & Fruchter, 1978).Critical Value for Significant Correlation (r = 0.273; α = .05)
WC = Word ClassesWC-E = Word ClassesExpressive EV = Expressive Vocabulary
WC-R = Word Classes - Receptive SS = Sentence Structure USP = Understanding Spoken Paragraphs
Relationship to a Measure of Nonverbal Ability
The Naglieri Nonverbal Ability–Individual Administration (NNAT–I) is a culturally fair
test for assessing nonverbal cognitive ability. To examine the relationship, or lack
thereof, between the DELV–Standardization, African American edition and nonverbal
ability, the NNAT–I was administered to 34 typically developing children (ages
5:0–5:11), with a testing interval of 0 to 26 days (mean = 7 days). Seventeen of the
children were AAE speakers and 17 were MAE speakers. They were matched to each
other as closely as possible by income level, parent education level (PED), age, gender,
and region. The samples were combined to increase the statistical power for the analysis;
the demographic characteristics for this sample are presented in Table 17.
58
Copyright © 2004 by Harcourt Assessment, Inc.
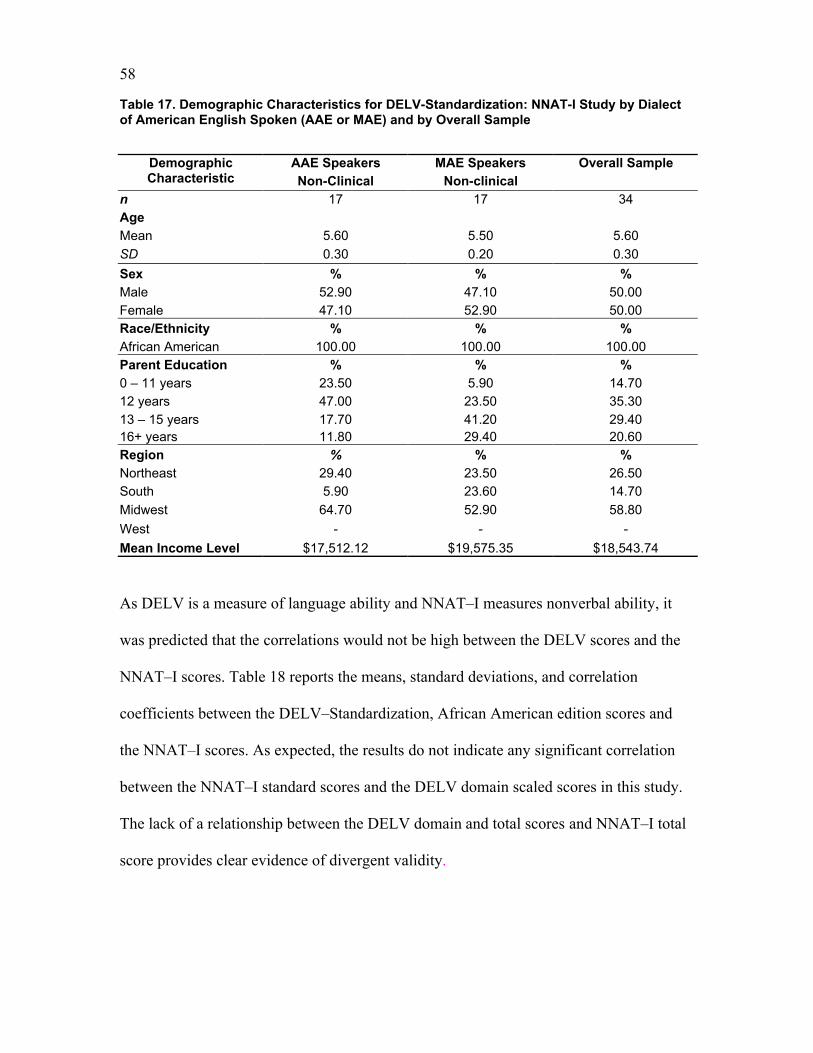
Table 17. Demographic Characteristics for DELV-Standardization: NNAT-I Study by Dialectof American English Spoken (AAE or MAE) and by Overall Sample
AAE Speakers MAE SpeakersDemographicCharacteristic Non-Clinical Non-clinical
Overall Sample
n 17 17 34AgeMean 5.60 5.50 5.60
SD 0.30 0.20 0.30
Sex % % %Male 52.90 47.10 50.00Female 47.10 52.90 50.00Race/Ethnicity % % %African American 100.00 100.00 100.00Parent Education % % %0 – 11 years 23.50 5.90 14.7012 years 47.00 23.50 35.3013 – 15 years 17.70 41.20 29.4016+ years 11.80 29.40 20.60Region % % %Northeast 29.40 23.50 26.50South 5.90 23.60 14.70
Midwest 64.70 52.90 58.80
West - - -
Mean Income Level $17,512.12 $19,575.35 $18,543.74
As DELV is a measure of language ability and NNAT–I measures nonverbal ability, it
was predicted that the correlations would not be high between the DELV scores and the
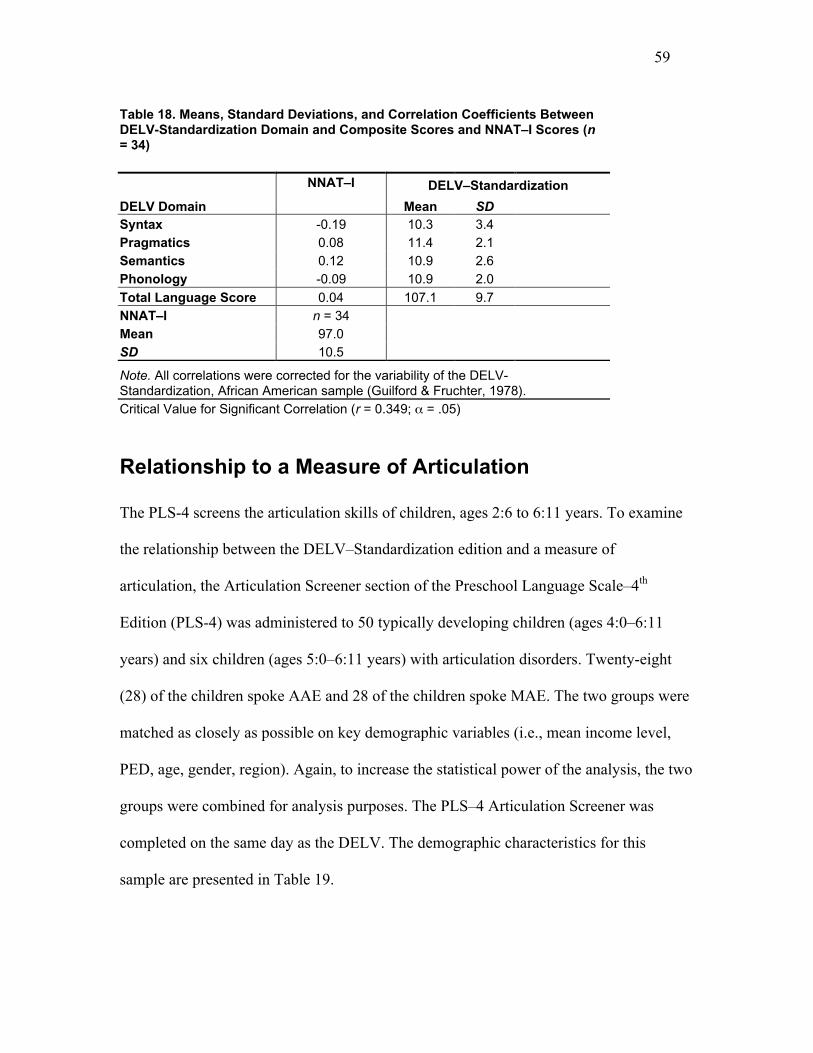
NNAT–I scores. Table 18 reports the means, standard deviations, and correlation
coefficients between the DELV–Standardization, African American edition scores and
the NNAT–I scores. As expected, the results do not indicate any significant correlation
between the NNAT–I standard scores and the DELV domain scaled scores in this study.
The lack of a relationship between the DELV domain and total scores and NNAT–I total
score provides clear evidence of divergent validity.
59
Copyright © 2004 by Harcourt Assessment, Inc.
Table 18. Means, Standard Deviations, and Correlation Coefficients BetweenDELV-Standardization Domain and Composite Scores and NNAT–I Scores (n= 34)
DELV–Standardization
DELV Domain
NNAT–I
Mean SDSyntax -0.19 10.3 3.4Pragmatics 0.08 11.4 2.1Semantics 0.12 10.9 2.6Phonology -0.09 10.9 2.0
Total Language Score 0.04 107.1 9.7NNAT–I n = 34 Mean 97.0 SD 10.5
Note. All correlations were corrected for the variability of the DELV-Standardization, African American sample (Guilford & Fruchter, 1978).Critical Value for Significant Correlation (r = 0.349; α = .05)
Relationship to a Measure of Articulation
The PLS-4 screens the articulation skills of children, ages 2:6 to 6:11 years. To examine
the relationship between the DELV–Standardization edition and a measure of
articulation, the Articulation Screener section of the Preschool Language Scale–4th
Edition (PLS-4) was administered to 50 typically developing children (ages 4:0–6:11
years) and six children (ages 5:0–6:11 years) with articulation disorders. Twenty-eight
(28) of the children spoke AAE and 28 of the children spoke MAE. The two groups were
matched as closely as possible on key demographic variables (i.e., mean income level,
PED, age, gender, region). Again, to increase the statistical power of the analysis, the two
groups were combined for analysis purposes. The PLS–4 Articulation Screener was
completed on the same day as the DELV. The demographic characteristics for this
sample are presented in Table 19.

60
Copyright © 2004 by Harcourt Assessment, Inc.
Table 19. Demographic Characteristics for DELV-Standardization: PLS-–4 ArticulationScreener Study by Dialect of American English Spoken (AAE or MAE) and ClinicalStatus and by Overall Sample
AAE Speakers MAE SpeakersDemographic CharacteristicNon-Clinical Clinicala Non-Clinical Clinicala
OverallSample
n 25 3 25 3 56
AgeMean 5.50 5.90 5.70 6.10 5.60SD 0.80 0.60 0.70 0.80 0.80
Sex % % % % %Male 48.00 33.30 44.00 66.70 46.40Female 52.00 66.70 56.00 33.30 53.60Race/Ethnicity % % % % %African American 100.00 100.00 100.00 100.00 100.00Parent Education % % % % %0 – 11 years 12.00 33.30 16.00 - 14.3012 years 56.00 33.30 16.00 33.30 35.7013 – 15 years 28.00 - 48.00 66.70 37.50
16+ years 4.00 33.40 20.00 - 12.50Region % % % % %Northeast 8.00 - 16.00 - 10.70South 52.00 100.00 40.00 100.00 51.80Midwest 28.00 - 8.00 - 16.10
West 12.50 - 36.00 - 21.40
Mean Income Level $18,724.86 $18,607.96 $18,666.41a Clinical = Articulation Disorder
It was hypothesized that low or no significant correlations would be found between the
DELV Pragmatics, Semantics, and Syntax domain raw scores (i.e., the language domain
raw scores) and the PLS–4 Articulation Screener’s raw scores; it was also hypothesized
that a high correlation would be found between the DELV Phonology domain raw scores
and the PLS–4 Articulation Screener raw scores. (Raw scores were correlated because
they are the criterion score metric used in the PLS-4 Articulation Screener. Moreover, all
matched pairs were within the same chronological year age range, so raw scores were an
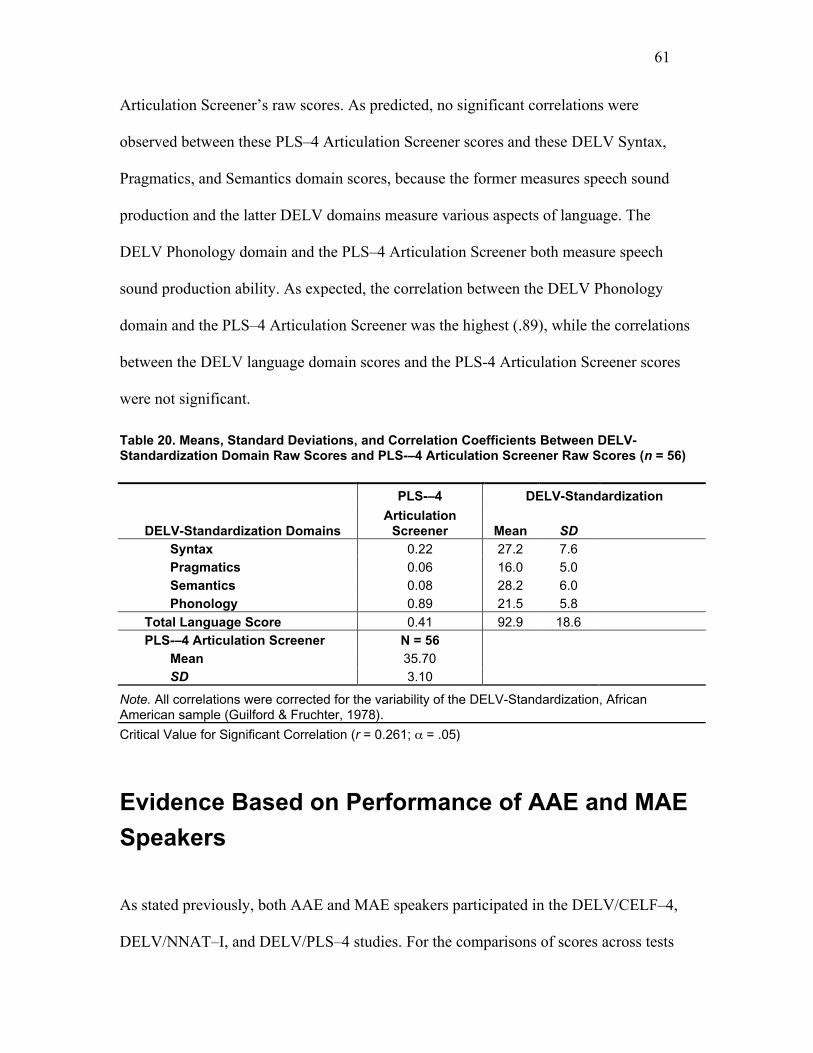
appropriate score metric.) Table 20 reports the means, standard deviations, and
correlation coefficients between the DELV–Standardization raw scores and the PLS–4
61
Copyright © 2004 by Harcourt Assessment, Inc.
Articulation Screener’s raw scores. As predicted, no significant correlations were
observed between these PLS–4 Articulation Screener scores and these DELV Syntax,
Pragmatics, and Semantics domain scores, because the former measures speech sound
production and the latter DELV domains measure various aspects of language. The
DELV Phonology domain and the PLS–4 Articulation Screener both measure speech
sound production ability. As expected, the correlation between the DELV Phonology
domain and the PLS–4 Articulation Screener was the highest (.89), while the correlations
between the DELV language domain scores and the PLS-4 Articulation Screener scores
were not significant.
Table 20. Means, Standard Deviations, and Correlation Coefficients Between DELV-Standardization Domain Raw Scores and PLS-–4 Articulation Screener Raw Scores (n = 56)
PLS-–4 DELV-Standardization
DELV-Standardization DomainsArticulation
Screener Mean SDSyntax 0.22 27.2 7.6Pragmatics 0.06 16.0 5.0Semantics 0.08 28.2 6.0Phonology 0.89 21.5 5.8
Total Language Score 0.41 92.9 18.6PLS-–4 Articulation Screener N = 56
Mean 35.70 SD 3.10
Note. All correlations were corrected for the variability of the DELV-Standardization, AfricanAmerican sample (Guilford & Fruchter, 1978).
Critical Value for Significant Correlation (r = 0.261; α = .05)
Evidence Based on Performance of AAE and MAE
Speakers
As stated previously, both AAE and MAE speakers participated in the DELV/CELF–4,
DELV/NNAT–I, and DELV/PLS–4 studies. For the comparisons of scores across tests

62
Copyright © 2004 by Harcourt Assessment, Inc.
the groups were composed of equal numbers of children identified as AAE and MAE
speakers, matched for age and socioeconomic status (SES), and to the extent possible,
gender and region. In addition to parent education level (PED), which was the original
index of SES for the purpose of recruitment of subjects, average per-capita income levels
derived from zip code information from the 2000 U.S. census were used to ensure
comparable income levels for both the AAE speakers and the MAE speakers in each of
the studies.
Matched Sample Results: CELF-4/DELV Study
Descriptive and group comparison statistics are presented in Table 21 for the
DELV/CELF–4 study. As the data show, there were no statistically significant
differences between the performance of the AAE and MAE speakers on the two
DELV–Standardization, African American Edition sub-domains (Syntax and Semantics)
included in the DELV/CELF–4 study, suggesting that the DELV is appropriate for both
groups. When compared to a matched group of MAE speakers, the AAE speakers
performed similarly on three of the four CELF–4 subtests, with the exception of
Expressive Vocabulary. The mean standard score on that subtest was 7.6 for the AAE
speakers, compared with a mean standard score of 9.9 for the MAE speakers (p<.01).
Research has shown that African American families from some working-class
communities do not place a lot of emphasis on labeling objects and events (Heath, 1983).
This pattern of socialization can place a child at a disadvantage when faced with a task
such as labeling pictures (as on the Expressive Vocabulary Subtest) if the child has
limited exposure to this type of activity and to the items tested.

63
Copyright © 2004 by Harcourt Assessment, Inc.
Table 21. Mean Performance and Difference of Two DELV-Standardization Domain Scaled Scores and Four CELF–4Subtest Scaled Scores for Children Who Speak African American English (AAE) and a Matched Sample of ChildrenWho Speak Mainstream American English (MAE)
African AmericanEnglish Speakers
(AAE)Mainstream American English
Speakers (MAE) Mean Difference of Two Samples
DELV Domains Mean SD n Mean SD n Difference t value p
Standard
Difference
Syntax 10.2 2.1 26 10.0 3.2 26 0.23 0.31 NS 0.09Semantics 10.0 2.9 26 10.2 2.6 26 -0.23 -0.30 NS -0.08
CELF–4 Subtests Word Classes 10.3 3.20 26 10.3 3.4 26 0.08 0.08 NS 0.02
Word Classes-Receptive 10.1 2.7 26 9.9 3.5 26 0.15 0.18 NS 0.05Word Classes-Expressive 10.7 3.4 26 10.7 3.2 26 -0.08 -0.08 NS -0.02SentenceStructure 9.5 2.5 26 9.7 3.5 26 -0.23 -0.27 NS -0.08
ExpressiveVocabulary 7.6 2.5 26 9.9 2.9 26 -2.31 -3.07 <.01 -0.85UnderstandingSpokenParagraphs 9.8 2.6 26 9.7 2.7 26 0.15 0.21 NS 0.06
Note. Standard difference is the difference of the two test means divided by the square root of the pooled variance,computed using Cohen's d (1996).
Matched Sample Results: NNAT–I/DELV Study
Descriptive and group comparison statistics are presented in Table 22 for the NNAT–I
study. It was expected that the performance of the AAE speakers would resemble that of
the MAE speakers. As Table 22 demonstrates, the mean performance for the AAE
speakers was similar to that of the MAE speakers (i.e., no differences were significant.)
Table 22. Mean Performance and Difference of DELV-Standardization Domain Scores and NNAT–I Scores forChildren Who Speak African American English (AAE) and a Matched Sample of Children Who SpeakMainstream American English (MAE)
African AmericanEnglish Speakers
(AAE)
MainstreamAmerican EnglishSpeakers (MAE)
Mean Difference of Two Samples

64
Copyright © 2004 by Harcourt Assessment, Inc.
English Speakers(AAE)
American EnglishSpeakers (MAE)
DELV Domain Mean SD n Mean SD n Difference t value pStandardDifference
Syntax 9.94 3.63 17 10.59 3.30 17 -0.65 -0.54 NS -0.19Pragmatics 11.71 1.79 17 11.00 2.37 17 0.71 0.98 NS 0.34Semantics 11.00 2.69 17 10.71 2.66 17 0.29 0.32 NS 0.11Phonology 10.24 2.56 17 11.59 1.00 17 -1.35 -2.03 NS -0.70
NNAT–I
Standard Score 96.82 10.73 17 97.24 10.65 17 -0.41 -0.11 NS -0.04Note. Standard difference is the difference of the two test means divided by the square root of the pooled variance,computed using Cohen's d (1996).
Matched Sample Results: PLS-4/DELV Study
Descriptive and group comparison statistics are presented in Table 23 for the PLS–4
Articulation Screener study. It was expected that the AAE speakers would perform
similarly to the MAE speakers on the DELV Phonology domain and that there would be
a difference in performance between the two groups on the PLS–4 Articulation Screener
and DELV, as these tests measure different aspects of articulation. As Table 22
demonstrates, the mean performance reported for the AAE speakers was not significantly
different from the mean performance reported for the MAE speakers on the DELV
Phonology domain. Also as predicted, the difference in performance between the two
groups on the PLS–4 Articulation Screener was significantly different. There are several
possible explanations for the difference in performance on the two measures. The PLS–4
Articulation Screener primarily screens the articulation of single phonemes, whereas
DELV assesses the articulation of sound clusters. Furthermore, DELV specifically
incorporates non-contrastive phonemes (phonemes produced by both AAE and MAE
speakers) into the articulation assessment so as not to penalize the speech of AAE

65
Copyright © 2004 by Harcourt Assessment, Inc.
speakers. The PLS–4 Articulation Screener uses phonemes that do not necessarily
differentiate a variation from MAE from an actual production error; therefore, the speech
of AAE speakers may actually mimic that of an individual with an articulation error and
be identified as such on the PLS–4 Articulation Screener.
Table 23. Performance of AAE and MAE Speakers on DELV Phonology and PLS–4 Articulation Screener
African AmericanEnglish Speakers
(AAE)
MainstreamAmerican EnglishSpeakers (MAE) Mean Difference of Two Samples
DELV Domain Raw Score Mean SD n Mean SD n Difference t value pStandardDifference
Phonology 20.50 6.30 28 22.50 5.20 28 -2.00 -1.30 NS -0.35
PLS-–4 Raw Score
Articulation Screener 34.80 3.00 28 36.50 3.10 28 -1.70 -2.09 <.05 -0.56Note. Standard difference is the difference of the two test means divided by the square root of the pooled variance,computed using Cohen's d (1996).
Evidence Based on Special Group Studies
Studies of children diagnosed with language disorders and articulation disorders were
completed as part of the validation of the DELV–Standardization, African American
edition. A sample of 50 children, ages 4 years, 0 months through 6 years, 11 months,
diagnosed with a language disorder (mean age: 5 years 7 months), and 32 children
diagnosed with an articulation disorder (mean age: 5 years 6 months) were tested as part
of the DELV–Standardization validity research. Table 24 reports the demographic
characteristics of the two clinical samples.
Table 24. Distribution of the DELV-Standardization Clinical Samples By Sex,Race/Ethnicity, Geographic Region, and Parent Education Level
DemographicCharacteristic
Language Disordered(LD)
Articulation Disordered(AD)
n 50 32
66
Copyright © 2004 by Harcourt Assessment, Inc.
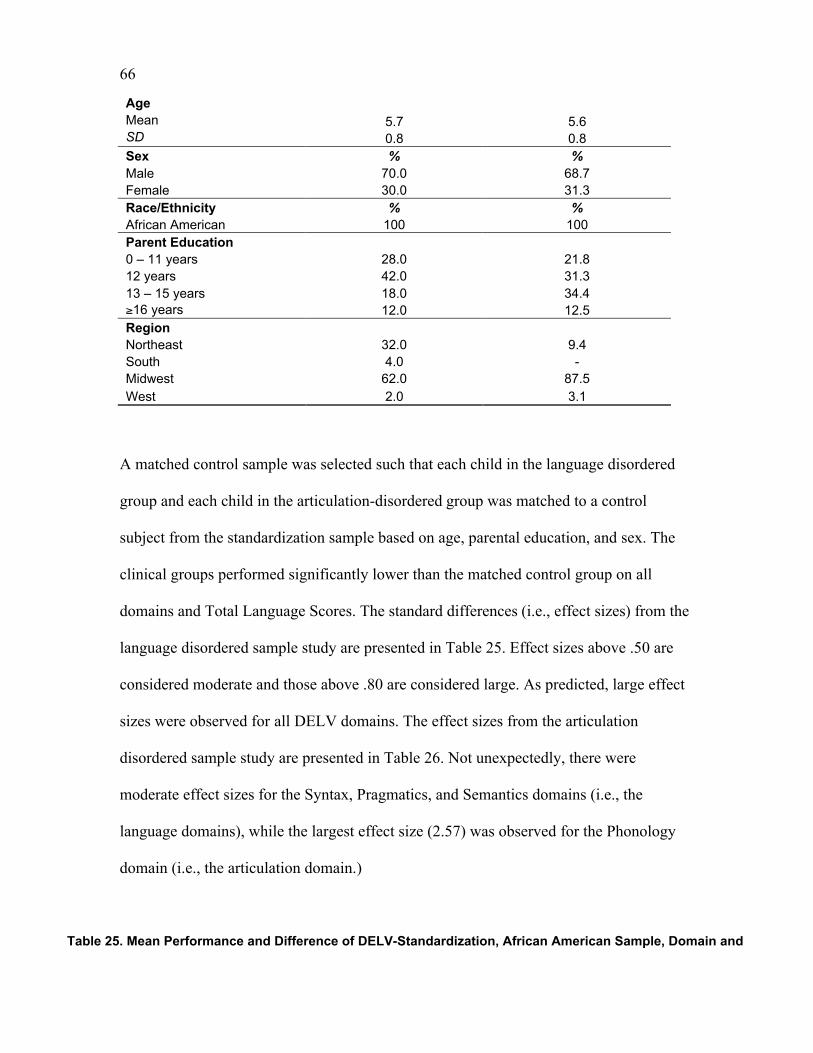
Age Mean 5.7 5.6SD 0.8 0.8Sex % %Male 70.0 68.7Female 30.0 31.3Race/Ethnicity % %African American 100 100Parent Education 0 – 11 years 28.0 21.812 years 42.0 31.313 – 15 years 18.0 34.4≥16 years 12.0 12.5Region Northeast 32.0 9.4South 4.0 -Midwest 62.0 87.5West 2.0 3.1
A matched control sample was selected such that each child in the language disordered
group and each child in the articulation-disordered group was matched to a control
subject from the standardization sample based on age, parental education, and sex. The
clinical groups performed significantly lower than the matched control group on all
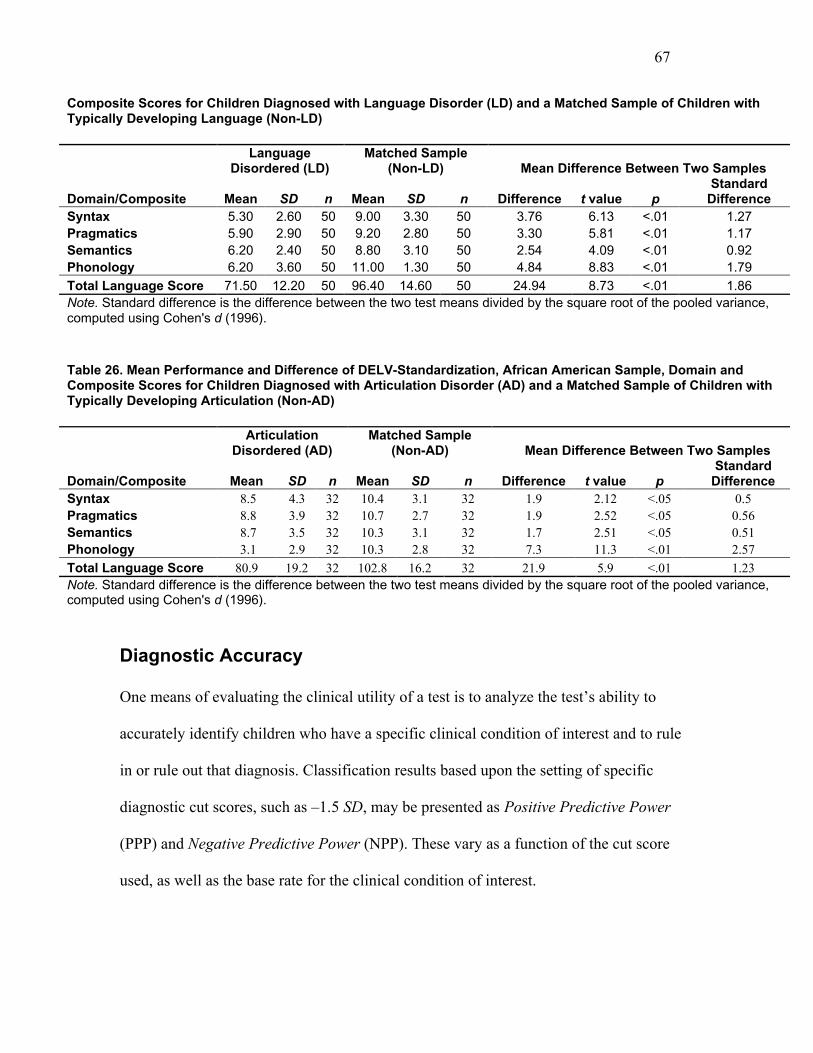
domains and Total Language Scores. The standard differences (i.e., effect sizes) from the
language disordered sample study are presented in Table 25. Effect sizes above .50 are
considered moderate and those above .80 are considered large. As predicted, large effect
sizes were observed for all DELV domains. The effect sizes from the articulation
disordered sample study are presented in Table 26. Not unexpectedly, there were
moderate effect sizes for the Syntax, Pragmatics, and Semantics domains (i.e., the
language domains), while the largest effect size (2.57) was observed for the Phonology
domain (i.e., the articulation domain.)
Table 25. Mean Performance and Difference of DELV-Standardization, African American Sample, Domain andComposite Scores for Children Diagnosed with Language Disorder (LD) and a Matched Sample of Children withTypically Developing Language (Non-LD)
67
Copyright © 2004 by Harcourt Assessment, Inc.
Composite Scores for Children Diagnosed with Language Disorder (LD) and a Matched Sample of Children withTypically Developing Language (Non-LD)
LanguageDisordered (LD)
Matched Sample(Non-LD) Mean Difference Between Two Samples
Domain/Composite Mean SD n Mean SD n Difference t value pStandard
DifferenceSyntax 5.30 2.60 50 9.00 3.30 50 3.76 6.13 <.01 1.27Pragmatics 5.90 2.90 50 9.20 2.80 50 3.30 5.81 <.01 1.17Semantics 6.20 2.40 50 8.80 3.10 50 2.54 4.09 <.01 0.92Phonology 6.20 3.60 50 11.00 1.30 50 4.84 8.83 <.01 1.79
Total Language Score 71.50 12.20 50 96.40 14.60 50 24.94 8.73 <.01 1.86Note. Standard difference is the difference between the two test means divided by the square root of the pooled variance,computed using Cohen's d (1996).
Table 26. Mean Performance and Difference of DELV-Standardization, African American Sample, Domain andComposite Scores for Children Diagnosed with Articulation Disorder (AD) and a Matched Sample of Children withTypically Developing Articulation (Non-AD)
ArticulationDisordered (AD)
Matched Sample(Non-AD) Mean Difference Between Two Samples
Domain/Composite Mean SD n Mean SD n Difference t value pStandard
DifferenceSyntax 8.5 4.3 32 10.4 3.1 32 1.9 2.12 <.05 0.5Pragmatics 8.8 3.9 32 10.7 2.7 32 1.9 2.52 <.05 0.56Semantics 8.7 3.5 32 10.3 3.1 32 1.7 2.51 <.05 0.51Phonology 3.1 2.9 32 10.3 2.8 32 7.3 11.3 <.01 2.57
Total Language Score 80.9 19.2 32 102.8 16.2 32 21.9 5.9 <.01 1.23Note. Standard difference is the difference between the two test means divided by the square root of the pooled variance,computed using Cohen's d (1996).
Diagnostic Accuracy
One means of evaluating the clinical utility of a test is to analyze the test’s ability to
accurately identify children who have a specific clinical condition of interest and to rule
in or rule out that diagnosis. Classification results based upon the setting of specific
diagnostic cut scores, such as –1.5 SD, may be presented as Positive Predictive Power
(PPP) and Negative Predictive Power (NPP). These vary as a function of the cut score
used, as well as the base rate for the clinical condition of interest.

68
Copyright © 2004 by Harcourt Assessment, Inc.
The base rate is most commonly thought of as the prevalence of the clinical condition in
the population, but it is of more clinical usefulness to think of it as the a priori probability
that someone in the clinician’s own referral population will have the condition.
Obviously this varies widely depending on the clinical setting. In screening a population
of school-age children, you could expect to identify more children than actually have a
language disorder. Since the prevalence rate of specific language impairment in the U.S.
population was reported to be approximately 7.4% (Tomblin, et al., 1997), a slightly
larger figure could be chosen when screening for children who might be found “at risk
for language disorders and in need of further testing.” As Table 30 indicates, 10% was
selected as a base rate for screening the population of children between 4–6 years of age
and 70%, 80%, and 90% were used as base rates for referral populations.
Values of PPP and NPP are provided for five different base rates (10%, 50%, 70%, 80%,
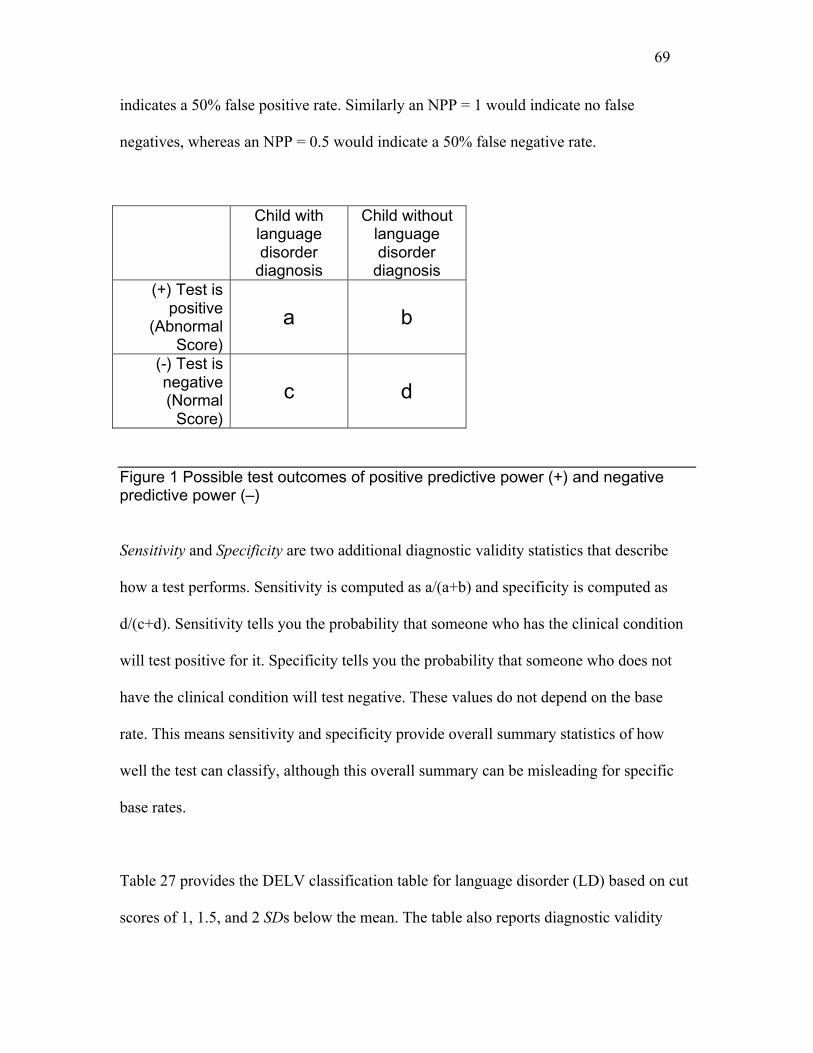
and 90%). Figure 1 shows the possible outcomes of a classification using any test of
language. The test outcomes are “Test is positive” (prediction of a language disorder) or
“Test is negative” (prediction of no language disorder). Positive Predictive Power is
calculated using the formula PPP = (a x br) ÷ [(a x br) + (1 – br) x c], where a and c
represent the values indicated in Figure 1 and br = base rate. PPP is interpreted as the
likelihood that someone with a positive test result actually has the disorder. Negative
Predictive Power is calculated using the formula NPP = (d x (1 – br) ÷ [d x (1 – br) + (b x
br)] and is interpreted as the likelihood that someone with a negative test result actually
does not have the disorder. A PPP = 1 indicates no false positives, while PPP = 0.5
69
Copyright © 2004 by Harcourt Assessment, Inc.
indicates a 50% false positive rate. Similarly an NPP = 1 would indicate no false
negatives, whereas an NPP = 0.5 would indicate a 50% false negative rate.
Child withlanguagedisorder
diagnosis
Child withoutlanguagedisorder
diagnosis (+) Test is
positive(Abnormal
Score)
a b
(-) Test isnegative(Normal
Score)
c d
Figure 1 Possible test outcomes of positive predictive power (+) and negativepredictive power (–)
Sensitivity and Specificity are two additional diagnostic validity statistics that describe
how a test performs. Sensitivity is computed as a/(a+b) and specificity is computed as
d/(c+d). Sensitivity tells you the probability that someone who has the clinical condition
will test positive for it. Specificity tells you the probability that someone who does not
have the clinical condition will test negative. These values do not depend on the base
rate. This means sensitivity and specificity provide overall summary statistics of how
well the test can classify, although this overall summary can be misleading for specific
base rates.
Table 27 provides the DELV classification table for language disorder (LD) based on cut
scores of 1, 1.5, and 2 SDs below the mean. The table also reports diagnostic validity

70
Copyright © 2004 by Harcourt Assessment, Inc.
statistics and adjusted PPPs based on different base rates. The results indicate good
sensitivity and specificity if the cut score is 1 SD below the mean. For example,
regardless of the base rate, if the cut score is 1 SD below the mean, 86% of those with LD
were correctly identified as such by the DELV, and 86% of those without LD, were
correctly classified as not LD by the DELV.
In the real world, we only see the test results; how accurate these are depends on the base
rate as well as the cut score, which is where we use PPP and NPP. For example, if the
base rate is low such as 10%, which might be observed in screening a normal population,
and we use a cut score of –2 SDs, we have a PPP = 1.00. This means that 100% of those
who are identified as having a language disorder actually have one. The NPP in this
situation equals .95, meaning that 95% of those classified as not having a language
disorder indeed don’t have one, leaving us with only 5% decision error. Likewise, if the
base rate is .50 (half the children referred have a language disorder), then the PPP = 1.00,
meaning that, as with the 10% screening base rate, none of those classified as LD is
misclassified, and the NPP = .67, meaning that 33% of those classified as not LD are
misclassified. Table 30 shows these values for other combinations of base rates and cut
scores. As the cut score becomes more extreme (more SDs below the mean), the PPP
becomes higher and the NPP gets lower. Likewise, as the base rate becomes higher, the
PPP becomes higher and the NPP gets lower.
Table 27. Classification of Language Impairment by DELV-Standardization, African American Sample, CompositeScore at 1, 1.5, and 2 SDs Below the Mean, and PPP and NPP for Five Base Rates
Base Rates

71
Copyright © 2004 by Harcourt Assessment, Inc.
DELV-Standardization,AfricanAmericanSample,CompositeScore <= SD Sensitivity Specificity
PredictivePower
Screening10%
MatchedSample
50% 70%Referral
80 % 90%PPP 0.41 0.86 0.93 0.96 0.98
- 1 SD 0.86 0.86NPP 0.98 0.86 0.72 0.61 0.41PPP 0.66 0.95 0.98 0.99 0.99
- 1.5 SD 0.70 0.96NPP 0.97 0.76 0.58 0.44 0.26PPP 1.00 1.00 1.00 1.00 1.00
- 2 SD 0.50 1.00NPP 0.95 0.67 0.46 0.33 0.18
Correlation between DELV–Screening Test Diagnostic Risk
Status Score and DELV–Standardization Score
The Diagnostic Risk Status section of the DELV–Screening Test can be used to
differentiate children who are developing language normally from those who are at risk
for a language disorder. Additional validity information was obtained by examining the
correlation between the children’s performance on the Diagnostic Risk Status section of
the DELV–Screening Test and on the DELV–Standardization. As the data in Table 28
indicate, there is a moderate to high correlation between the raw scores of both language
measures. The negative correlations are expected because the screening test score is
based on an error score while the diagnostic test score is based on the number of correct
responses. The moderate to high correlations provide additional support for DELV as a
valid measure of language.
Table 28. Means, Standard Deviations, and Correlation Coefficients BetweenDELV-Standardization Domain Raw Scores and DELV-Screening Test Raw Scores(n = 600)
DELV-Screening Test DELV-Standardization
DELV Domain Diagnostic Risk Status Mean SD
Syntax -0.70 25.7 7.6

72
Copyright © 2004 by Harcourt Assessment, Inc.
Pragmatics -0.64 14.4 5.9Semantics -0.56 26.1 6.8
Phonology -0.45 22.0 4.8
Total Language Score -0.73 88.2 20.7
Mean 7.1
SD 5.1
Note. All correlations were corrected for the variability of the DELV-Standardization,African American sample (Guilford & Fruchter, 1978).
Summary
The results of the correlation studies done with CELF-4, NNAT-I, and the PLS-4
Articulation Screener provide evidence that the DELV has clinical utility as a test of
language and articulation. Also, strong evidence is presented against the clinical use of
DELV as a measure of non-verbal reasoning ability.
The results of the language variation validity studies indicate that the DELV has the same
clinical utility as a test of language and articulation regardless of whether the child speaks
African American English or Mainstream American English.
The results of the two clinical validation studies reveal that DELV is very sensitive to,
and clinically useful for, identifying language and articulation disorders.
The diagnostic validity of the DELV was shown in the evaluation of the children with
language disorders. Validity statistics indicate good sensitivity at –1 SD and –1.5 SD
from the mean and good to excellent specificity at all cut scores reported.

73
Copyright © 2004 by Harcourt Assessment, Inc.
Overall, the evidence of validity presented provides strong support for the clinical use of
DELV as a measure of language and articulation ability for AAE and MAE speaking
African American children.
Recommended