RELATIONSHIP BETWEEN STOCK MARKET PERFORMANCE AND
ECONOMIC PERFORMANCE fN KENYA
CHERUIYOT CHARLENE JEPKOGE1
REG NO: 1)61/63503/2011
A RESEARCH REPORT SUBMITTED TO THE SCHOOL OF BUSINESS IN
PARTIAL FULFILLMENT OF THE REQUIREMENT OF MASTER OF
BUSINESS ADMINISTRATION DEGREE OF THE UNIVERSITY OF
NAIROBI
2012

DEDICATION
I dedicate this study to my late Mother who taught me the virtues of determination, hardwork
and persistence.
lii

ACKNOWLEDGEMENT
My appreciation goes to the many people who in different and varied ways helped nte in the
development and completion of this project.
My special thanks go to my supervisor. Dr. J.O Aduda, Chairman of the Department of
finance and Accounting, who so generously and tirelessly gave his time and energy and
professionally contributed to the development and completion o f this project.
My gratitude to my family for their valuable time, support and encouragement during the
period o f this project It is my hope that their sacrifice lias finally paid olT.
To all other people who in one way or another assisted me or contributed to the development
and completion o f this project, your willingness to help is itsell inspirational. To you all, I am
deeply and sincerely grateful.
is
ABSTRACT
Stock markets play a significant role as market intermediaries by providing a link between
savers and investors. This is made possible by a growing economy which requires additional
financing from markets whereas savers have surplus funds for investments. However, lor the
economy to grow there is a need for a vibrant stock market, l ew studies have been done in
Kenya to establish the relationship between the slock market performance and economic
performance. Ibis study therefore seeks to establish the relationship between these two
factors.
In order to do this, the research was designed as a causal study where relationships were
tested I he population comprised o f companies listed at the MSI while the sample size was
the companies forming the NSFi 20 Share Index. Secondary data collected from the Kenya
Bureau ol Statistics and the Central Bank was used in the studs. Data was then analysed using
descriptive analysis, correlation analysis and regression analysis.
The findings of the study arc that there is no correlation between economic performance anti
stock market performance. There is however a strong negative correlation between stock
market performance and inflation and a strong positive correlation between stock market
performance and exchange rates. GDP was affected by interest rate and inflation. I he study
concludes that there is no significant relationship between stock market performance and
economic performance. I lie study therefore recommends that there is need to develop policies
aimed .it improving contribution of the NSI to economic development.
v
TABLE OF C O M ENTS
DECLARATION................................................................................................................................ ii
ABBREVIATIONS........................................................................................................................... ix
CHAPTER ONE...................................................................................................................................I
INTRODUCTION................................................................................................................................I
I . I Background o f the Study....................................................................................................I
I . I . I Stock Market Performance................................................................................................. I
1.1.2 Economic Performance.........................................................................................................2
1.1.3 Relationship between Stock Market Performance and Economic Performance.............2
1.1.4 Nairobi Securities Exchange............................................................................................... 6
1.2 Statement of the Problem........................................................................................................X
1.3 Research objective...................................................................................................................10
1.4 Significance of the Study........................................................................................................10
CHAPTER TWO............................................................................................................................... 12
LITERATURE REVIEW..................................................................................................................12
2.1 Introduction............................................................................................................................. 12
2.2 theoretical review............................................................................................ 12
2.2.1 Arbitrage Pricing I heory.....................................................................................................12
2.2.2 Life Cycle Theory'................................................................................................................ 13
2.2.3Q Theory............................................................................................................................... 13
2.3 General Literature................................................................................................................. 14
2.3.1 Impacts of Stock Market Performance on Economic Growth.........................................14
2.3.2 Effects o f GDP on Stock Market Index............................................................................. IX
2.3.3 Interrelationship between GDP Growth and Stock Market Performance..................... 20
2.4 I mpirical Evidence................................................................................................................ 22
2.5 Conclusion..... ......................................................................................................................... 30
CHAPTER THREE........................................................................................................31RESI ARCH METHODOLOGY.....................................................................................................31
3.1 Introduction............................................................................................................................. 31
3.2 Research Design......................................................................................................................3 1
3.3 Population..... ........................................................................................................ ................. 31
3.4 Sample......................................................................................................................................31
VI

3.5 Data Collection........................................................................................................................32
3.6 Data Analysis........................................................................................................................... 32
3.7 Data Reliability and Validity................................................................................................. 33
CHAPTER FOUR.............................................................................................................................34
DATA ANALYSIS, RESULTS AND PRFSF.NTATION.......................................................... 34
4.1 Introduction............................................................................................................................. 34
4.2 Descriptive analysis................................................................................................................ 35
4.3 Testing Assumptions for Multiple Regression.....................................................................36
4.4 Correlation and Regression Analysis................................................................................... 40
4.5 Summary and Interpretation o f Findings..............................................................................44
CHAPTER FIVE...............................................................................................................................47
SUMMARY. CONCI USIONS AND RFCOMMFNDA HONS............................................... 47
5.1 Summary.................................................................................................................................. 47
5.2 Conclusion............................................................................................................................... 48
5.3 Policy Recommendations.......................................................................................................48
5.4 Limitations of the study.......................................................................................................... 49
5.5 Suggestions for Further Research..........................................................................................50
APPENDICES...................................................................................................................................57
Appendix I: Companies I isted at the NSF................................................................................ 57
Appendix 2: Companies I omting the NSI -20 Share Index....................................................59
Appendix 3: Quarterly GDP Growth Rates................................................................................ 60
Appendix 4: Monthly Interest Kate. Inflation. Fxchange Rales and Stock Market Index .. 60
Appendix 5: Quarterly Interest Rate. Inflation. I xchange Rales and Stock Market Index...62
vii
LIST OF TABLES
Table I: Descriptive Statistics......................................................................................................35
Table 2: Tests o f Normality.......................................................................................................... 36
Table 4: Test o f Homogeneity of Variances............................................................................... 38
Table 5: rest for serial autocorrelation.......................................................................................39
Table 6: Residuals Statistics.........................................................................................................39
Table 7: l ull Rank Correlation Analysis.....................................................................................40
Table 8: Full Rank Regression Analysis: <il>1* determinants m odel......................................4 1
Table 9: Full Rank Regression analysis for determinants o f GDP...........................................40
Table 10: Full Rank Regression analysis:Slock Market index determinants model............. 41
Table 11: Rank Regression Analysis for stock market index .................................................42
Table 12: Model Summary lor Normal OLS Regression Analysis for GDP......................... 42
Table 13: Normal Score Regression Analysis for G D P........................................................... 43
I able 14: Model Summary for Normal OLS Regression analysis for Stock Market index..43
fable 15: Normal Score Regression Analysis lor Stock Market Index..................................43
viii

ABBREVIATIONS
ATS: - Automatic Trailing Systems
CBK: - ( entral Bank of Kenya
CPI: -ConsumerPrice Index
GDP: - Gross Domestic Product
KShs - Kenya Shillings
IPO: - Initial Public Offer
NASI - NSF All-Share Index
NSF.: - Nairobi Securities Lxchange
USD: -1 Inited States Dollar
i\
CHAPTER ONE
INTRODUCTION
1.1 Background or the Study
1 . 1 . 1 Stock Market Performance
Simiyu (1992) underscores the importance o f deriving an objective measurement basis for the
performance of the stock exchange. Whereas there has been no single conclusion on the
measurement basis that should l>e used, most researchers concur that the use of stock market
index is plausible given that it helps to assess the performance o f the market over a period ol
time. He proposes the use of a weighted stock market index which reflects the market
capitalization o f stocks.
I he Nairobi Securities Exchange, until recently was referred to as the Nairobi Stock Exchange,
has been providing slock market indexes since its formation in 1953. I hc NSE 20-share index
was developed to provide a review of weighted movement in price o f major counters. I he index
was revised in year 2007 with an aim to ensure that it was a true barometer of the market since it
was fell that the stocks which used to comprise the index had since lost their prominence in the
market anJ that some sectors such as the telecommunication market segment were not
represented. Further. NASI was introduced in the year 2008 as an alternative index which was an
overall indicator o f market performance since it includes all the shares quoted in the market
provided that there was activity in the specific stock for the day. Obunde (2011) argues that
NASI had not gamed prominence since its launch and therefore the NSE 20-Share Index still
remains as the main market index. I his study makes use ol the 20-Share index since its revision
in July 2007 to July 2012 to measure stock market performance.
1.1.2 Economic Performance
The pace o f economic growth in a country is very useful in assessing improvement in economic
welfare such as rise in disposable income, expansion of infrastructure, growth in national
income, reduction in unemployment as well as level of aggregate demand and supply (Lee,
1902). The rule o f economic growth refers to the increase in aggregate demand and supply in an
economy as measured using output, net income or expenditure approach. Conventionally,
assessment o f economic growth is done through the use o f GDP. lo measure economic growth,
the percentage change in GDP is computed and the rate compared with the previous period
growth. An economy is said to exhibit a growth trend where the rate of change in GDP is
continuously rising. According to I abo/i and Modigliani (1995), GDP will usually vary in the
four economic cycles namely, expansion, crisis, recession and recovery. The economy therefore
moves through the four cycles with high economic growth rates recorded during expansion and
low growth rates experienced during recession. 1 his study was based on GDP for the country
from year 2007 to 2012 as a measure o f economic performance. The pace of growth was
compared with that of changes in the stock market index to assess whether there is any
relationship between the two variables, further, the impact ol interest rates, inflation was also
studied.
1.1.3 Relationship between Stock Market Performance anti Economic
Performance
I he stock market is an institution which oilers a platform for efficient allocation o f capital.
I low ells and Keith (2000) observe that borrowers ran to the market so as lo access funds for long
term projects whereas savers use the market to invest their capital. Stock markets offer individual
corporations as well as the government the avenue to raise capital for use in financing long-term
■>

project. Short term market segments in the exchange normally referred to as the money market
on the other hand oilers short-term capital to borrowers and equally short-term investment
Opportunities for investors. As such Va/akidis (2009) observed that performance orthe economy
x> measured by GDP is boosted when adequate funds are available in the market for use by the
government and private enterprises for development. The market therefore serves as a barometer
of economic performance since as economies develop, funds will be required to expand
increasing demand for securities traded in the securities exchange ami thereby prices. Seyyed
(2010) is ol the view that there is a strong positive correlation between the efficiency of the stock
market and economic performance o f a country.
Stock markets arc considered vital in economic development since they provide public
companies that are quoted in the exchange an opportunity to raise necessary funds for investors
ns well as providing savers with an avenue to invest their funds for a gain Gitobu (2000)
observes that the main role of a securities exchange market is to intermediate between borrowers
and savers lor economic development, fhey encourage those with surplus funds to save by
providing a better rale of return than commercial banks. I he market is also attractive to those
seeking to borrow to finance long term projects. C harkravarty (2005) argues that unlike
commercial banks, stock market do not require collateral for borrowed lunds. oilers flexible
financing options such as by issuing ordinary stocks, preference stocks, or debt. I be cost of
borrowing is also relatively low compared to the rates charged by commercial hanks. I he
government also benefits from the exchange by having an avenue to raise funds for economic
development. for instance, in Kenya the government issues the infrastructure bonds, treasury
bonds and treasury bills to access funds for use in improvement of roads, provision o f water as
"ell as in funding social programmes such as education and health. Otuke (2006) observes that
3
ihe government through the CHK carries out its responsibilities o f ensuring a stable
macroeconomic environment through the securities exchange. For instance, during recessionary
periods characterized by low aggregate demand, low savings and investments. CBK. increases
supply o f money in the economy by repurchasing treasury bills in the market. This helps to
provide necessary cash flows lor investment and to increase output. According to Nyumuie
(I9‘>8). performance o f the slock market interests a number o f parties such as investors,
regulators, the government, borrowers just to mention a few. Kuthurimu (2010) found out that
the market has gained increased popularity ever since the year 2007 after the Safaricom
Company I.united's IPO. This caused the number o f investors in the market to rise as well as
increased interest among investors and financial institutions. Gilobn (2000) tound out that
performance o f the market is affected by a number of factors such as government activities,
availability ol other investment assets, political factors, composition of investors, and economic
performance.
The causal relationship between economic performance and the performance ol the stock market
is an interesting one. Calderon (2002) argued that this relationship could be best described as an
egg and hen problem since it is not clear whether changes in the stock market have an effect on
economic growth or if the market is actually influenced by changes in the economy. A number ot
past researches are usually interested in how development in financial sector such as banks and
insurance companies influence economic growth with little focus on the stock market. Kathurima
(2010) however argues that having a well developed market would increase sav mgs albeit from a
theoretical base. Savings have been found out to be critical in economic development since
according to Mauro (2000). they form the basis for investment. I here lore. by harnessing savings,
stock markets spur investments which in turn lead to improvement in economic growth. Recent
4
evidence have confirmed this view where it was found that efficient and effective stock markets
offer a big boost to economic development. Focus on economic growth has therefore become a
new opening in the financial literature and though ignored in the past, the role played by stock
markets in economic growth is recognized by most countries and thus the concerted efforts to
ensure that these markets arc operational Regulators are currently seeking ways to improve their
stock markets more so in developing countries.
(iuo. 1 iu and t'liuan (2005) argued that sustaining well performing capital markets is an impetus
to economic development by providing a smooth flow o f finances lor long term development.
Ihis however requires addressing issues which inhibit growth in stock markets in developing
countries such us Kenya Some of these challenges include; effects o f political instability, poor
macroeconomic environment, and weak corporate governance practices among market
intermediaries, poor regulators requirements and government interference. In addition.
Kathurima (2010) criticizes the mode o f operation for the NSF. arguing the market is prone to
corporate governance issues because o f adopting a mutualised structure. I here are however
attempts to demutualise the market which is hoped to improve its efficiency and effectiveness in
determining asset prices as well as hi provision ol market information.
fhis study was informed by the need to establish the relationship between performance o f the
stock market and that of the country. I he reasoning was that to have a well performing stock
market, the economy must be growing and thus investors must be carrying out expansionary
SUralc8'cs requiring additional financing from the market whereas savers would be having surplus
funds lor investment. On the other hand, for the economy to grow there is need for a vibrant
**OCk market to provide necessary financing to fund the growth and at the same time provide
5

with incentives so as to provide needed funds. Having a strong stock market during periods of
economic prosperity is also vital in ameliorating allocation problem. That is it ensures that
borrowers get the surplus funds held by savers. Assessment o f performance o f both the stock
market and the economy forms the heart o f this study. The study seeks to establish the
relationship between these two factors.
1.1.4 Nairobi Securities Exchange
ITie NSE was started in Kenya during the pre-colonial periods around 1920. The market was
informal and there we no rules governing its practices. Its formal set up was officiated in July
1953 alter London officials gave a not to the exchange. This saw the market constituted as a
voluntary association of stock brokers registered under the Societies Act. After independence in
1963, loads were allowed to take part in the market. The first major activity in the market took
place in I9XX with the privatization of Kenya Commercial Bunk where the government sold 20
percent of its shares in the company In July 199*1. a computerized delivery settlement system
(DASS) was implemented leading to a growth of licensed brokers when X new brokers were
licensed.
• he Kenyan Government relaxed restrictions on foreign ownership in locally controlled companies
and foreign investor participation was introduced in 1995. The entire Exchange control act was
repealed in December 1995 seeing more stock brokers licensed to bring the number of licensed
brokers to twenty In 1996 the largest share issue in the then history of NSK. the privatization of
Kc"ya Airways, came to the market and more than 110.000 shareholders acquired a stake in the
*,rhnc Die Kenya Airways privatization team was awarded the World Bank award lor Excellence in
,W6 for ^inB a success story in the divestiture of state owned enterprise. In 1998 the government
e*Pan<fed Ibc scope for foreign investment by introducing incentives for capital markets growth
6
including the wiling up of lax-free Venture ('apitul Funds, and removal of Capital Cains l ax.
Subsequently, listed companies split their shares at NSE while others issued bonus shares.
fhe capital market authority in liaison with NSE commissioned a study in 2006 to spearhead the
process of demutualization. Ernst & Young, a leading financial consulting firm was engaged to guide
the market on the process of demutualization. I hese activities arc ongoing and significant ground has
been covered towards improving corporate governance practices in the exchange. Trading activities
have also been heightened with the introduction of ATS in 2006 to replace the Open Outcry Trading
Rules. In July 2007. the MSI index was revised which was aimed at ensuring that the index is a true
barometer of the economy. In 2008. an alternative index, NASI was introduced. In September 201 I
the Nairobi Securities Exchange converted from a company limited by guarantee to a company
limited by shares and adopted a new Memorandum and Articles o f Association reflecting the
change. In October 2011, the Broker Back Office commenced operations The system has the
capability to facilitate internet trading which improved the integrity o f the I xchange trading
systems and facilitates greater access to our securities market. In November 2011 the FTSE NSE
Kenya 15 and F 1ST NSF Kenya 25 Indices were launched. I he launch of the indices was the
result ot an extensive market consultation process with local asset owners and fund managers
and reflects the growing interest in new domestic investment and diversification opportunities in
the l ast African region. As of March 2012. the Nairobi Securities Exchange became a member
ut the Financial Information Services Division (I ISD) o f the Software and Information Industry
Association (SNA). In March 2012 I I SI NSI Kenya 15 Index and the FTSE NSE Kenya 25
Index were made available on the NSI website www.nsc.co.kc. The new initiative gives
investors the opportunity to access current information and provides a reliable indication o f the
Kenyan equity market's performance during trading hours.
7
1.2 Statement o f the P ro b le m
Suxk markets play a significant role as market intermediaries by providing a link between savers
and borrowers (Kith 2000). A number o f studies have been undertaken to establish relationship
between the performance of stock exchanges in the globe and economic performance. Most o f
these studies were carried out in developed stock exchanges.
The relationship between stock market performance and economic development has interested a
number o f researchers such as Scyycd (2010). Charkravarty (2005) and C alderon and Liu (2002).
In the early studies such as Shaw (I‘>73) and McKinnon (1973) the researchers independently
observed that development in financial market is positively correlated to gross per capita income.
It can therefore be concluded that financial markets are useful in advancing development in the
economy. This is because financial markets are intermediaries providing a mechanism for
borrowers to access finances as well as savers to invest surplus funds. A robust financial market
is therefore critical in economical development. It would help to allocate capital to essential
industries as well as encourage increased savings which would ultimately result to a rise in the
rate o f economic growth. I here is however conflicting literature regarding the relationship
between stock market and economic performance.
Thca* is conflicting evidence on whether movement in share prices in stock markets could be an
indicator of economic growth, lo r instance Guo. Liu and Chunn (2005) argues that whereas
economists and financial professionals have spent much of their lime reviewing whether
economic growth rates as measured by <il)l\ across the globe are related to movement in stock
et prices, historical data do not back up this association. He argued that the stock market
Joc' 004 rc^ect ‘I1*-* full economy and therefore has no relationship with GDI* which is a measure
X

of the performance o f ihc whole economy. However, Kolnpo and Aduramola (2012) found out
thal CiDI’ and stock market index were correlated. They noted that stock market prices reflect
future expectations o f stock market prices Therefore, countries which have strong long-term
growth prospects are likely to offer attractive slock market returns than those with slower growth
expectations. Thus where growth prospects are expected to be high, similarly market prices of
stocks arc likely to soar.
Research in the Nairobi Stock Exchange (currently, Nairobi Securities Exchange) have focused
on understanding measures to improve performance of the stock market such as through
maintaining a stable political environment (Kithinji and Ngugi. 2010). impact of macroeconomic
indicators such as interest rates and inflation on the stock market (Gekone. 2011) and Kiptoo
(2010). and impact o f demutualization o f the market (Kaihurima. 2010). I he impact of
macroeconomic environment to the stock market cannot be overemphasized and thus the
relevance o f the various studies carried out to inform policy making. Past studies have however
not looked at the stock exchange as an engine for economical growth which would cause policy
makers to give its development more attention Attention has been largely focused on the
banking sector assuming the sunk market which is very useful in allocation o f long term capital
and sharing of risk in the financial market This study is informed by a need to carry out a study
in the Nairobi Securities Exchange to understand whether there is a relationship between the
performance o f the slock market and economic growth so as to bridge the study gap as well as
clear the research conflicts drawn from studies in other regions such as the study o f the Pakistan
Nock market by Seyycd (2010) which concluded that there was no relationship between macro-
ccon°mic indicators and stock market prices. I.cvinc and Zcrvos ( l ‘>%). Levine and Zcrvos

, 1098) and Calderon und l.iu (2002) however found a strong correlation between stock market
performance and economic growth.
Hie following research questions were used to guide the study:
I Is there a relationship between stock market performance and economic performance?
2. What is the nature of the relationship between stock market performance and economic
performance?
1.3 Research objective
1.3.1 Main objective
To establish the relationship between stock market performance and economic performance.
1.3.2 Specific objectives
Specifically, this study seeks to find out to
i Investigate presence o f relationship between stock market performance and economic
performance: and
ii Examine whether there is a uni-directional or bi-directional relationship between
economic performance and stock market performance.
1.4 Significance o f the Study
I he study o! relationship between stock market pcrlormancc and economic performance in
Kenya is expected to he beneficial to a number of parties such as:
Policy makers
II is hoped that the study will provoke policy makers to give more attention to the stock market
given its contribution to the economic performance.
Nairobi stock exchange
study will provide information useful to the management of the Nairobi Stock Exchange
could be used to lobby for market improvement.
10

Academicians
The study will contribute to the body of knowledge and hence will be of interest to both
(tscarchcrs and academicians who seek to explore the relationship between stock market
performance and economic growth.
II

CHAPTER TWO
LITERATURE REVIEW
2.1 Introduction
flic purpose of this chapter is to present a review of literature relating to the relationship between
GDP anti Stock Market Index using a case study of the Nairobi Securities Exchange. Although
the stock market plays an important role in the economy, it has not attracted much attention from
scholars since corporate finance literature has traditionally focused on the study of the
contribution o f commercial banks.
2.2 Theoretical review
2.2.1 Arbitrage Pricing Theory
I he relationship between stock market returns and fundamental economic activities in developed
economies and especially in the US have been documented in numerous studies (I ama, 1970.
1990). Arbitrage pricing theory (AIM) has been extensively used in studies analysing the
relationship between stock market and macroeconomic indicators An early theory of arbitrage
pricing uses a functional form to test the relationship between stock index and macroeconomic
variables. All individual stocks arc affected by common factors Market index can be affected by
macroeconomic variables, such ns changes in interest rate, money supply, economic growth, and
inflation However, the APT model has a drawback as it assumes the constant term to be a risk-
rrcc rd,c « f return (Brahmasrcnc and Jiranyakul. 2007) Among the macroeconomic indicators;
®*changc rates have been displayed to influence stock prices through trade effect (Geske and
P II0 • 1983), I urthcr. whereas the model seeks to find out the impact o f changes in
n'acroccon‘'iiiic activities on slock market returns, it does not help in establishing whether there

is any relationship between stock market index and GDP growth rates which is the heart o f this
study.
2.2.2 Life Cycle Theory
The relationship between slock prices and consumption expenditures is based on the life cycle
theory, developed by Ando and Modigliani (l% 3), which stales that individuals base their
consumption decision on their expected lifetime wealth. Pari o f their wealth may be held in the
form of stocks linking slock price changes to changes in consumption expenditure. Thus, an
increase in stock prices will increase the expected wealth, which, in turn, will increase the
consumption expenditures, suggesting the direction o f causality from stock prices to
consumption expenditures. On the other hand, an increase in consumption expenditures may
result in an increase in the corporate sector's earnings, which will result in higher stock prices,
implying causality from consumption expenditures to stock prices.
Hie relationship between stock prices and investment spending is based on the </ theory by Tobin
(l%9), where </ is the ratio o f total market value of firms to the replacement cost of their existing
2.2.3 Q Theory
13

labour, capital, and expected sales and then determine the rate o f investment depending on how
last they wish to reach the desired capital stock in the face of significant adjustment cost. Thus,
ihe expected changes in sales and planned output are the major factors affecting investments.
However, as noted by Bosworth (1975). if higher earnings are implied by higher expected output
that increases slock puces, then the market valuation model implicitly accounts for the effect of
expected output.
finally, the relationship between stock prices and economic activity is investigated to examine
the role o f stock market, that is. whether it leads or lags economic activity. Moreover, the
relationship of stock prices with the components of aggregate demand, consumption, and
investment sometimes provide conflicting results, causing an ambiguity concerning the direction
ol causality between stock price changes and macro variables. As mentioned above, the
economic activity is generally measured by (JL)P
2.3 General Literature
I he following i.s a review of general literature on the impact o f stock market performance on
economic grow th as well as the impact o f economic growth on the stock market. The feedback
cHect between stock performance and economic growth has also been reviewed.
2-3.1 Impacts of Stock Market Performance on Economic Growth
Moclt exchange market is of very fundamental importance in an economy. As an institution
1 Ips promote entrepreneurial growth in countries such as Kenya With a wide economical
aud expansion it becomes impossible to limit business organizations to proprietorship or
P^Ucrxhip. &'ving people an option o f credible institutions to invest their money in the stock
r " W5 *nc°Uragc ami cultivate a deep culture o f saving in any economy which is a vital
14
folc of the slock exchange markets. People have the incentive to save more ami consume less due
to the fact that there are credible institution(s) where these people can safely invest their money
and cam a return. As such, the stock market assists in the transfer of savings to investment in
productive enterprises as an alternative to keeping the savings idle. The outcome of this is that
the investor can earn investment income from the savings converted into investments.
In their research documentation, Dcmirguc-Kunt and Zervos (1996) argued that having strong
markets offer financial services which would help to improve the economy. Therefore,
improvement in stock market would create a momentum to investment. They argued that
improvement in stock market could help to mobilize savings as well as lead to diversification of
financing and investment risks. Therefore, they envisaged a stock market where different forms
of securities are traded such as debt, equity and financial derivatives. I his view was supported
by Majid (2007) who noted that a strong financial sector offers savers an opportunity to invest
their surplus funds whereas borrowers will access finances from the market to meet their deficit.
Hicks <l%9) held the view that giving investors an easy access to finances would promote the
level of industrialization by offering funds to finance investment
Khan and Scnhadji ( I99S) found out that the stock market plays a critical role in improvement of
emerging economies. They observed that liquidity risks as well as investment risks are
minimized by having strong markets. The researchers also noted that there is a relationship
between developments o f stock markets with economic development. I or instance, they noted
liquid stock markets reduce transaction costs incurred when sourcing funds, fhercforc
governments in emerging economics such as Kenya should encourage increased liquidity in
ar*e,s so us to facilitate an efficient and cost effective llnunting. Nyamutc (200X)
observe that most business organizations in Kenya were facing challenges in accessing funds
ftvm the Nairobi Stock Ixchangc mainly due to legal bottlenecks and high cost of entry. This is
ihcrefbrc an impediment to investment in the country. Levine and Zervos (1996) noted that level
of market activity is an indicator of real investment activity with the association even becoming
strong for emerging economies.
Liquidity creation is one of the critical roles played by stock markets by ensuring that investors
with deficiency in funds access the same from those having surplus. Investors are given an
opportunity to sell securities in the market to meet their liquidity shortfall whereas savers buy
such investment vehicles as an avenue to utilise their surplus funds. Whereas investors benefit
from stock markets by getting the needed resources. Lee (1992) observe that savers also benefit
from the markets since instead o f holding idle funds, they arc given an opportunity to gain a
return by purchasing income earning assets from the market. An efficient market therefore
should help to provide investors with cheap sources of funds and offer savers an opportunity to
earn high returns for investments carried out. Rogers noted that having liquid markets
offers attraction to investors by providing them a quick solution in case of liquidity deficits,
further, it assures savers that assets purchased could he sold as and when need arises. I he need
bold liquid cash therefore reduces in countries where the stock market is liquid as savers
l*efer to hold income hearing assets rather than cash. Mauro (2000) argues that reducing the
'fced tdr holding liquid cash balances for Silvers through efficient stock markets is a positive
mov« ‘n an economy since it would ensure that there are no idle resources held, fherefore. a well
^form ing Mock market is one that oilers demand for money giving savers an attractive
0W*orUinit) to invest their surplus funds us well as giving investors funds to meet liquidity
deficits
16
A number of researchers have also supported the idea o f creating strong stock markets noting
that such markets are a useful barometer for economic performance. Nasseh and Strauss (2000)
argue that stock market trends are an indicator of the performance of the economy. I or instance,
a bullish market could be an indicator o f growing economy whereas a bearish market might he
an indicator of a decline. They observed (hat economic recession is usually characterized by low
stock prices. Ylauro (2000) pointed out that share prices in a stock market are based on investors'
expectation of future economic performance. Therefore where the economy is expected to slump
for instance due to political risks, demand for shares usually fall and thereby decline in stock
prices. Therefore, movement in stock prices could be used to infer expected economic
performance in a country.
Shleiler and summers (1088) however disagreed with other researchers that the stock market has
m impact on economic performance I hey noted that the slock market only provides information
for quoted companies which in emerging countries are an insignificant part o f the whole
economy. Stiglitz ( IW I) holds similar sentiments noting that movement in share prices is merely
in response to changes in short term profits for commercial enterprises mainly based on
accounting reports However, financial reports are subject to manipulation and thus cannot be
used to reflect the long term performance o f the economy, lie therefore observes that whereas
(jDl' is a measure of the long-term performance of the economy, stock market index is a
measure o f movement in share prices which is based on fundamentals oI quoted companies, their
management as well as profitability The two variables according to Stigliu (1993) cannot and
should not be compared.
17

2.3.2 F.ff'ccts o f ( iD P on S to c k M a rk e t Index
There are a number of studies carried out on the impact of various macroeconomic variables on
the stock market For instance. Kithinji and Ngugi (2010) observed that political factors have an
important impact on the stock market where market indexes arc usually lower before elections
and rtse thereafter depending on the confidence that investors and savers have on the elected
government. Kiptoo (2010) and Lee (1992) held similar views arguing that interest rates,
inflation and exchange rates have an impact on the slock market. Ibrahim (1999) found out that
prices o f slocks are influenced by systematic factors due to their impact on expected returns.
Fluctuations in macroeconomic variables therefore impact on expectations held in the market
influencing stock prices. Singh (1997) argues that even when there are negative forecasts
regarding the economy, there might be a rise in stock prices making the market to be very
dynamic C'harkavarty (200$) however found out that stock market prices are very sensitive to
changes in macroeconomic indicators such as changes in GDP. As the economy expands, there is
a likelihood that demands for financial securities such as stocks and debt instruments increase.
Growth in GDI* complemented by an increase in GDI* per capita and increase in disposable
income will lead to increase in savings as well as investments. Further, it will also lead to
increase in consumption expenditure which stimulates increase in aggregate output.
Nieuwerburgh. Buclens and Ouyvcrs (2006) found out that growth in GDP has a direct impact on
development in the stock market.
stock market is likely to he vibrant where future prospects in returns are positive. Market
Pr,ccs will therefore rally where strong economic forecasts are made. Stock market prices are
kn'vevcr mainly attributable to the forces o f demand and supply which are dynamic thus causing
St°c '̂ prices to fluctuate over time. Movement in share prices is usually erratic and dependent on
changes in investors' perceptions as well as their expectations about the future. However since
such expectations are dependent on the status o f the economy, variation in macroeconomic
variables arc believed to have an impact on the performance of the stock market. Researchers
argue that changes in macroeconomic forces influence slock prices though they are not the only
factors responsible for movement in stock market index. I his is because at times, stock prices
change merely due to irrational behaviour and decision made on unreliable accounting
information that is subject to manipulation.
There have been a number of studies in developed markets on the relationship between the stock
market and other macroeconomic factors such as interest rates, inflation and exchange rates such
as Lee ( I ‘>92). However, such studies are scanty in developing markets. Markets in emerging
economics such as Kenya, Uganda and Tanzania arc viewed as still in their infancy stage
suffering from unwarranted government influence and inadequate information regarding the
quoted companies. Stock markets therefore suffer from significant influence from the
government (jekone (2011) determined that that interest rate ranks as one o f the significant
macroeconomic factor that influences stock market performance. 1 or instance, he noted that il
•be CBK raises the base lending rate, the rate paid to treasury bills and treasury bonds (risk free
ra,c) will increase and therefore causing the required rate of return for risky assets such as stock
"'H also increase. As such, share prices arc likely to fall in ease interest rules rise. Gekonc
*‘^l I) also noted that demand for slocks will fall in response to higher interest rates for treasury
bonds since investors will be attracted by their higher returns per unit of risk as compared to
Further, high interest rates reduce liquidity in the market by limiting credit creation
•bl'ity o f commercial banks thus resulting to a depressed demand for stocks. Therefore, there
an inverse relationship between interest rates and stock market prices.
19
I'hramann and Frai2schcr (2004) however observed that not all stocks will react in a similar
manner following upsurge in interest rates. Thus they recommended further research on the
reasons why individual stocks respond in a different manner to changes in macroeconomic
factors as well as monetary policy shocks. Bernanke and Kuttner (2003) were also skeptical of
the influence ol macroeconomic factors on stock performance. I hey reached a conclusion that
there exists a very little, if any, impact of changes in monetary policy on real interest rates.
Robinson (1052) supported this view arguing that stock market do not in any way spur growth in
the economy but rather respond changes in the real sector. Economists therefore do not consider
the stock market as an agent for economic growth. Another school of thought that has been
presented by llongbin (2007) is that the there exists a bi-directional causality between GDP
growth and performance ol the stock market rather than a unidirectional relationship. I he
argument is stock market is likely to flourish during economic prosperity whereas a strong stock
market contributes to economic growth by improving investments and savings. I he concept is
discussed in 2.3 3 here under.
2-3.3 Interrelationship between CiDP Growth and Stock Market Performance
Interrelationship between CiDP and stock market performance has been assessed by a number of
RKarchers. I or instance. I uintel and Khan (1999) from a study o f 10 countries observed that
" S e x is t s a feedback effect between economic growth and stock market performance. This was
***° confirmed by Hongbin's (2007) study of the China's stock market performance and
Ccono,nic growth. The conclusion was that slock market does not only help to spur economic
but growth m the economy also fosters development of the stock market. I he effect of
^,Cs,l*k market is largely fell in the long term since it mainly acts as a capital market which is a

market for long term investment securities. Singh (1907) argued that since the stock market is an
undisputed barometer of the economy, it should be strengthened so as to remain a credible
predictor of future economic performance. He observed that where a country has a well
developed financial system, economic development could be achieved through innovation and
investments financed in a cost effective and efficient manner. Majid (2007) holds similar view
noting that stock market developments as well as economic growth arc interdependent.
Chen et ul (1986) arc o f the view that a one-directional relationship between economic growth
and stock market performance ennuot be supported. They observe that stock prices are
responsive to external shocks. Some o f these shocks include natural calamities such as Hoods
and earthquakes as well as impacts of government policies for instance exchange rate und
interest rates. In emerging economies, impact of some o f these macroeconomic variables might
however not have the expected causal effects on the stock market due to inefficiencies. For
instance. Sifujo et al (2008) noted that foreign exchange market in Kenya is not efficient and
therefore, movement in foreign exchange rates might not be responsive to fundamental changes
in the economy. Chen et al (1986) opposes the view that there exists a bidirectional relationship
between stock market development and economic growth arguing that the two variables are
endogenous. Other studies reviewed earlier point to a two-way causation between the two
variables whereas others do not even establish existence o f any relationship between the two
'ariables. It is important however to note that most researchers agree that development of the
Mt*k market as a source o f finances for capital development is very critical. In addition, ensuring
th.u a stable macroeconomic environment is maintained is equally important to bolster investor
c°nfidencc in the market.
21
Developed economies arc characterized by having strong and efficient markets pointing to the
critical role played by stock markets in economic development. Markets in such economies are
also very efficient offering investors a quick and low cost source o f finances. Savers are also
accorded an opportunity to generate returns on their surplus funds. Kolapo and Adaramnla
(2012) observe that emerging economics have inefficient and highly regulated stock markets
inhibiting economic growth. I or instance, the regulatory bottlenecks faced hinder investors from
sourcing funds from these markets whereas savers are not motivated to invest their surplus funds
in such markets, kiptoo (2010) noted that the mutual structure of the Nairobi Stock hxchange is
detrimental to investor confidence due to its corporate governance issues, lie recommended a
revision o f the structure so as to move ownership of the market from the market intermediaries to
independent shareholders. I his lie argues would ensure that market intermediaries do not have
any personal interest on the exchange which could be in conflict with their roles. Other
improvement measures recommended for the market include reduction in transaction costs both
for investors (savers) as well as borrowers. Researchers have also noted that provision o f real
lime and quality information regarding the market is also very important in minimizing
speculation which is detrimental tor the long run success of the market.
2.-I Kiiipineal Kvidcnce
Researchers m developed economies have carried out extensive research on the relationship
^'tween the stock market development and economic trends. Some of these studies include
^CV,r'c B,ld Zervos (19%). Levine and Zervos (1998) and Calderon and l.iu (2002). The
have evaluated the contribution of stock market to economic growth as well ns
'***t*R*T there is a casual relationship between economic development and the stock market. The
H P findings from these studies point to a positive relationship between economic growth and
slock market development. The level o f development in stock market has also been found to be
positively correlated to that of other financial markets such as banking institutions leading to
economic growth. Other researchers in developed countries such as Scyyed (2010) have however
found out that there is no relationship between economic growth and stock market performance
more so in developing countries where government influence is usually significant. This
hypothesis therefore deserves investigation in the context of Kenya's market which is the main
focus of this study to fill this knowledge gap.
Adjasi and Bickcpc (200f>) in their study o f the selected African countries found out that markets
in these countries arc undeveloped and suffer from significant government influence. This
negatively influences efficiency of these markets 3S well as reducing their liquidity. This study
was confirmed by Scyyed <2010) who observed that level of macroeconomic activity was the
main cause o f movement in stock prices albeit in the long run. The slock market was also found
to play a critical role as an indicator for future economic growth. Kolapo and Adaruniola (2012)
held similar studies in Nigeria where they found u correlation between market capitalization and
GDP ratio. They found out that development in stock market spurs economic growth in the
Country. I herefore, they recommended that the government should consider reducing regulatory
bottlenecks, transaction costs and legal barriers which are detriment for a smooth running
market. Vazakidis (2009) carried out a similar study in Trance investigating the relationship
between economic growth and development in the stock exchange. I he study established that
economic growth was a contributory factor to the development of Trance stock market. Mauro
(2000) noted that in emerging and advanced economies as well, there is a positive correlation
between stock returns and output growth.
23
Levine and Zervos (1998) analyzed the empirical relationship between the measures of the stock
market development and long-run growth rates. They produced indexes o f the overall stock
market development that bring together information on stock market si/c. liquidity, and
international integration. Levine and Zervos used instrumental variables procedures, and controls
for many other variables related to economic growth, to estimate the strength o f the empirical
relationship between economic growth and stock market development. After controlling the
initial level o f GDP per capita, initial investment in human capital, political stability, the level o f
[unking development, and measures ol the monetary, fiscal, and exchange rate policy, the
predetermined component of slock market development remains positively and significantly
correlated with long-term economic growth.
Icvine and /ervos (1998) claim that the Mock market encourages savings hy providing
individuals with an additional financial instrument that may better meet their risk preferences
and liquidity needs. Better savings mobilization ma\ increase the savings rate (Levine and
Zervos. 1998). Stock markets also provide an avenue for growing companies to raise capital at
lower costs. In addition, companies in countries with developed stock markets are less dependent
on bank financing, which can reduce the risk of a credit crunch. Stock markets therefore arc able
io positively influence economic growth through encouraging savings amongst individuals, and
k> providing avenues for firm financing. Looks like Kwon and Shin (1999) announced that for a
-term perspective, stock markets are playing several crucial roles. First, by spreading the
24
contribute to more efficient investments. Third, by pulling foreign portfolio capital inward, the
enlargement o f stock markets can serve to increase the supply of invcstablc resources in
developing countries. Slock markets also have a role in domestic resource mobilization and
provision o f fresh equity capital to the corporate sector. I his is particularly important in
emerging capital markets, where the early enlargement of stock markets is often characterized by
an increase in the number o f companies going public, or by enhanced offerings of seasoned
shares by listed companies.
I evine (1997) also asserts that the reduction of international investment harriers significantly
increase the liquidity of stock markets, with positive effects on economic growth. Although stock
market volatility tends to rise for a few years after financial liberalization, a greater openness to
international capital has been associated with lower stock return volatility in the long term.
Moreover, stock return volatility does not appear detrimental to long-term growth. I bus. if
policymakers have the patience to weather some short-term volatility, liberalizing restrictions on
international portfolio flows oilers expanded opportunities for economic development.
In the literature, amidst the factors affecting economic growth of countries in the aftermath of
financial liberalization, it is evident that a comparison can be made between the banking system
•*nd slock markets. In relation to this subject I.evine (1997) claims that countries with both liquid
'lock markets and well-developed banks grew faster than countries with both liquid markets and
underdeveloped banks. More interestingly, greater stock market liquidity implies faster growth
1,0 matter what the level of hanking development. Similarly, greater banking development
^Plies faster growth regardless o f the level of stock market liquidity. Thus, it is not stock
***** versus banks: it is stock markets and banks. Fach of these components of the financial
25
system is an independently strong predictor o f growth Related to this subject also Brahmasrcnc
and Jiranyakul (2007) state that stock market liquidity has been a catalyst for long-term growth
in developing countries. Also, they conclude that stock markets produce higher growths than
hanks. On the other hand Mauro (2000) examines the role that the stock-market can play in the
economic and industrial development of newly industrializing countries, taking into account their
particular circumstances and drawing on the experience o f the countries with well-functioning
markets. The main conclusion of the study is that, to the extent that developing countries do have
a choice, they should attempt to promote hank-based financial systems rather than to establish
,ind encourage stock markets.
Eaisan and Olulisayo (2009) examined the long-term and causal relationship between stock
market development and economic growth for seven countries in sub-Saharan Africa. Using the
autoregressive distributed lag (AKIM.) bounds test, the study found that the stock market
development is co integrated with the economic growth in Egypt and South Africa. Moreover,
tins test suggests that stoik market development has a significantly positive long term impact on
economic growth The Granger causality test based on the vector error correction model
iVE( M) further shows that the stock market development Granger causes economic growth in
*-l?ypi and South Africa I lowever. Granger causality in the context o f VAR shows evidence of a
^directional relationship between slock market development and economic growth for Cote
ire. Kenya. Morocco and Zimbabwe. Ibis implies that the stock market helps to induce
<CtWon'ic grtmtli amt in turn economic growth stimulates stock market development.
burnt,and Odit (2009) examine the impact of stock market development on growth in
H p K They performed a time series econometric investigation for the period 1989-2000.
26
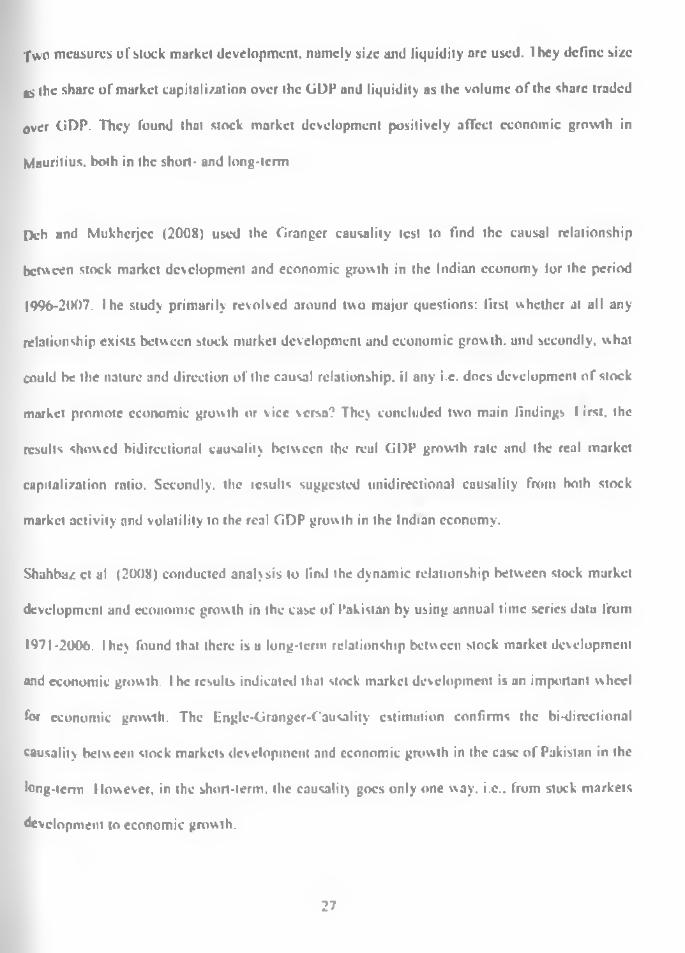
■fvvo measures o f slock market development, namely size and liquidity are used. 1 hey define size
^ the share o f market capitalization over the GDP and liquidity as the volume o f the share traded
over GDP. They found that stock market development positively affect economic growth in
Mauritius, both in the short- and long-term
LX-h and Mukherjee (2008) used the Granger causality test to find the causal relationship
between stock market development and economic growth in the Indian economy lor the period
1996-2007. I he study primarily revolved around two major questions: first whether at all any
relationship exists between stock market development and economic growth, and secondly, what
could be the nature and direction of the causal relationship, il any i.c. does development o f stock
market promote economic growth or vice versa? They concluded two main findings I irst. the
results showed bidirectional causality between the real GDP growth rate and the real market
capitalization ratio. Secondly, the icsults suggested unidirectional causality from both stock
market activity and volatility to the real GDP growth in the Indian economy.
Shahbaz cl al (2008) conducted analysis to lind the dynamic relationship between stock market
development and economic growth in the case o f Pakistan by using annual time series data from
1971-2006. I hey found that there is a long-term relationship between stock market development
and economic growth. I he results indicated that stock market development is an important wheel
for economic growth. The Englc-Grangcr-Causality estimation confirms the bi-directional
causality between stock markets development and economic growth in the case o f Pakistan in the
long-term However, in the short-term, the causality goes only one way. i.c.. from stock markets
development to economic growth.
27

Ake find Dchuan (2010) used the Granger Causality Test to find the causal relationship between
stock market proxies through market capitalisation, total trade value, turnover ratio and
economic growth (GDP and 11)1). The results o f the study suggest positive links between the
stock market and economic growth for some countries (France and United Kingdom) for which
the stock market is liquid and highly active. However, the causality relationship is rejected for
the countries (Belgium and Portugal) in which the stock market is small and less liquid.
Contrary to the general aim of the literature. Shleifer and Vishnev (1997) claim that very liquid
markets hurt economic development. By allowing investors to sell sticks quickly, liquid murkets
may reduce investor commitment, and discourage stock owners to exert corporate control by
monitoring the performance o f managers and firms. In other words, dissatisfied owners sell their
shares instead of working to make the firm operate better. According to this view, greater stock
market liquidity may obstruct economic growth by disturbing corporate governance.
Harris (1997) examines the empirical relationship between stock markets and economic growth.
Contrary to studies by Randal el al ( I ‘>*>9) it reveals no strong evidence that the level of stock
market activity helps to explain growth in per capita output. I he sample is divided into
developed and less developed countries. For the less developed sample, the stock market effect,
as with the full sample, is at best very weak. For developed countries, however, sunk market
activity does have some explanatory power. As can be seen, is not a full consensus amidst the
studies focusing on the relationship between the stock market development and economic
growth. However in a great number of studies it has been detected that there still exists either a
one-way relationship from the stock market towards economic growth, or from economic growth
towards the stock market, or a mutual relationship. These dilTcrent findings reveal that the
28

research analyzing Ihc relationship between the stock market and economic growth must be
explored respectively for every single country. I lowcvcr, there has been scanty research on the
inipact o f economic growth on stock market development in Kenya.
Gitohu (2000) and Kiptoo (2010) found out performance of the stock market is influenced by a
number o f macroeconomic factors. Kithinji and Ngugi (2010) most specifically identified the
impact of political factors where they established that the stock market is usually depressed
before elections and flourishes just after elections. They recommended an enhanced stability in
the political environment so as to stabilize stock markets. Kulhurima (2010) recommended for a
review o f the mutual structure o f the market to boost investor confidence and enhance corporate
governance. Nynniutc ( l ‘WX) investigated the relationship between stock prices and exchange
rates, interest rates, money supply and inflation She ascertained that there exists a strong
relationship between these macroeconomic variables and the stock prices. For instance stock
prices have an inverse relationship with inflation and interest rates. I he relationship between
exchange rates and stock market prices was however found to be very weak which could be
explained by Sifujo el al (2008) findings that the foreign exchange market in Kenya is quite
under developed and incITicient. The relationship between the stock market index and economic
growth usually measured by GDP despite attracting numerous research in developed countries
Have not gained any notable attention by researchers in Kenya. This study seeks to bridge this
gap by finding out the relationship between GDP and slock market index It is motivated by the
need to gain more understanding on the role played by the Slock market in economic
development.
29
2.5 Conclusion
A number o r researchers have been interested in whether there is relationship between stock
market performance and economic performance. As noted from the empirical evidence above,
stock markets play a critical role in fostering economic growth by creating an avenue for
financing o f economic activities, encouraging savings which could he used in investment,
allowing investors spread their risks, and creating efficiency and liquidity in investment. There is
however contradictory evidence which shows that there is no relationship between economic
growth and stock market performance since stock markets only represent quoted companies.
Further, stock markets encourage liquidity which might hurt economic growth. Other researchers
have found out that where markets arc characterized by significant government influence,
movement in stock market prices is simply dependent on government policies with little impact
on economic performance This study is motivated by the need to understand whether the NSI:
plays any significant role in influencing economic development in Kenya.
30

C H A P T E R T H R E E
RESEARCH METHODOLOGY
3.1 Introduction
This chapter deals with the research design, population, sample, data collection and data
analysis, which describes the firms and variables included in the study and applied statistical
techniques in investigating the relationship between stock market performance and economic
performance.
3.2 Research Design
The main purpose o f this research is to assess whether there exist a relationship between stock
market performance and economic performance. Cooper and Schindler (2000) observe that a
causal research design is less explicit in business studies and therefore was the most appropriate
design for this study. I here fore, the studs focuses on the causal relationship study between stock
market performance and economic pcrtormance.
3.3 Population
According to Cooper and Schindler (2000). a population is the total collection of elements about
which we wish to make inferences. I be population in the study is nil companies listed in the
Nairobi Securities Exchange.
3-4 Sample
Rata was drawn from companies forming the NSF 20 Share index for the period between July
2007 and July 2012. thus covering a period o f five years. The NSE 20 Share index has been used
since it is « weighted price index of 20 companies representing all sectors of the economy I he
five years period has been chosen because other studies have considered such a period to be
adequate. Further, the index was revised in July 2007 and thus use o f prior indexes would be
unrepresentative.
3.5 Data Collection
The study will use secondary data obtained from the Nairobi Securities Exchange for slock
market index data, Kenya Bureau of Statistics lor GDP growth rates and ( entral Bank o f Kenya
for exchange rates, interest rates and inflation rales from the second quarter o f 2007 to the first
quarter o f 2012. Due to the change o f the N'SE 20-share index in July 2tK)7. the indexes for
period before 2007 are considered unreliable.
3.6 l);it;i Analysis
Data was analyzed with the help of Statistical package for social scientists (SPSS version 17)
Descriptive statistics such as mean, maximum and minimum were computed and tabulated using
frequency distribution tables In order to test the relationship between the variables the inferential
tests including the Pearson Product-Moment Correlation Coefficient and regression analysis
were used. First. Pearson Product-Moment Correlation Coefficient as measures o f association
was used to examine the relationship Ivetween the independent and dependent variables. The
relations were explored with the use of Pearson's correlation coefficient. Pearson’s correlation
coefficient calculates a relationship between two variables. Correlation co-efficient is a measure
of the strength o f linear association between two variables. Correlation ranges between *1.0 and
+1.0. If the correlation is positive, a positive relationship is inferred. If it is negative, the
relationship is negative. Secondly, regression analysis was used to analyze the relationship
between stock market index and GDP growth rales in Kenya between July 2007 and July 2012.
32
Further, a relationship between GDP and stock market index vis-a-vis inflation and interest rates
was also tested. Given the five-year panel structure of the sample data gathered, regression
analysis was conducted to investigate the relationship between stock market prices and on
economic performance. I he regression model that was evaluated is represented as follows:
X, " |5i GDPi ' {52 Inti * (53 I xci ♦ [54 Inlli + .................................................... ....... equation /
Equation 1 defines the regression equation used in this study where: X is the stock market index .
GDP is GDP growth rates, Int refers to interest rates. I xch relates to Exchange rates whereas Infl
refers to inflation rate On the other hand. |5 is the slope coefficients whose sign depict the
relationship between stock market performance and various factors GDP. interest rate tint),
exchange rate (Exc). and inflation (Infl).
3.7 Data Reliability and Validity
Mugendu and Mugenda (2004) asserted that, the accuracy o f data largely depended on the data
collection instruments in terms of validity and reliability. Validity as denoted by Robinson
(2002) is the degree to which results obtained from the analysis of the data actually represents
the phenomenon under study. Validity was ensured by having objective data. This was achieved
by collaborating the data from various sources. Reliability on the other hand refers to a measure
of the degree to which research instruments yield consistent results (Mugenda and Mugenda
2003) In this study, reliability was ensured by collecting information from reliable sources only
'uch as from Kenya Burcau of Statistics and Central Bank o f Kenya.
C H A P T E R F O U R
DATA ANALYSIS, RESULTS AND PRESENTATION
This chapter presents the results of the study. The chapter is organized as follows. First, the
descriptive results arc shown in section 4.1. Section 4.2 provides the results on OI.S regression
assumption tests while sections 4.3 and 4.4 provide the results o f regression analysis.
4.1 Introduction
Ihe study collected and used secondary data. Data relating to GDP growth rates for each quarter
from year 2007 to quarter I o f 2012 were collected from the Kenya Bureau of Statistics as
summarized by Appendix I to this report. Further, monthly data in relation to inflation rales. NSh
20 Share index. 91 treasury hill rales, and the USD exchange rate lor the same period was also
collected from the CBK's Monthly Lconomic Review reports (please see appendix 4 to this
report). Further, quarterly averages were computed for euch of the four variables as summarized
in appendix 5.
The variables in the study were as follows. First, stock market performance was evaluated
through the use of quarterly average for NSF 20 share index. Independent variables used include
inflation rates which were determined as an average of lour monthly inflation rates. Quarterly
inflation rates in percentage were computed lor years 2007 to 2012. Secondly, short term interest
rates were determined using the average benchmark ‘>| I rcasury bill rales us reported by C'BK
An average interest rate was computed lor each quurtcr for years 2007 to 2012.
Thirdly, exchange rates were determined using the exchange rate for most common currency in
Kenya, the USD According to Sifujo ct al (2008) a significant portion of Kenya's international
34
trade is conducted in terms o f USD and thus the importance o f the USD as an indicator of
movement in exchange rate, lhc monthly average rate of kShs to USD was collected from the
(. I lk 's Monthly Economic Review Reports. Monthly exchange rates were used to compute
quarterly rules which were used in this analysis.
Monthly overall inflation rates were also sourced from the ( Ilk Monthly Rconomic Review
reports. Quarterly rales were computed as an average for the respective 4 months inflation rates
from May 2007 to April 2012.
4.2 Descriptive analysis
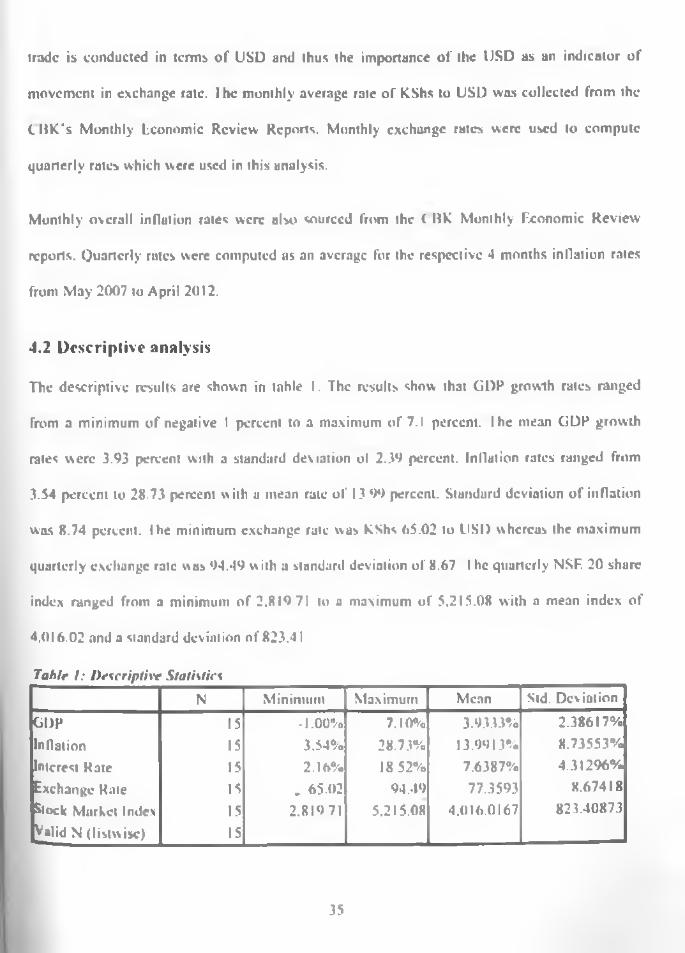
The descriptive results are shown in table I. The results show that GDP growth rates ranged
from a minimum o f negative I percent to a maximum o f 7.1 percent, l hc mean GDP growth
rates were 3.93 percent with a standard deviation ol 2.39 percent. Inllalion rates ranged from
3.54 percent to 28.73 percent w ith a mean rate o f 13 99 percent. Standard deviation o f inflation
was 8.74 percent, lhc minimum exchange rate was kShs 65.02 to USD whereas the maximum
quarterly exchange rate was 94.49 with a standard deviation of 8.67. l hc quarterly NSF. 20 share
index ranged from a minimum o f 2.819 71 to a maximum of 5,215.08 with a mean index of
4.016.02 and a standard deviation of 823.41
Table I: Descriptive StatisticsN Minimum Maximum Mean Std. Deviation
GDP 15 -1.00% 7.10% 3.9333% 2.38617%
Inflation 15 3.54% 28.73% 13.9913% 8.73553%Interest Rate 15 2.16% 18 52% 7.6387% 4.31296%
Exchange Kate 15 . 65.02 94.49 77.3593 8.67418
Stock Market Index 15 2.81971 5.215.08 4.016.0167 823.40873
Valid N (listwise) 15
35
The analysis was based on a total o f 15 quarters from 2007 to the first quarter of 2012. The stock
market index was revised with cl feet from July 2007 and thus indices for prior periods were
considered unrepresentative. Data collected was subjected to regression and correlation analysis
after rigorous tests were carried out on the assumption o f regression analysis in 4.3 hereunder.
4.3 Testing Assumptions for Multiple Regression
In order to run a multiple regression analysis. Cooper and Schindler (2000) advise that a number
of assumptions for the same should be cheeked. These assumptions include; test for normality,
non-multicollincarity. homoscedasticity of variance, independence o f errors, and outliers. I hese
tests arc carried out as follow s.
4.3.1 Normality of Distribution
Normality o f distribution is usually tested using either Kohnouorov-Smirnov or Shapiro-Wilk
lest Cooper and Schindler (2000) observe that Shapiro-Wilk test is suitable lor a sample o f 50 or
less. As such, this test is used to lest normality o f distribution in this study I he test evaluates the
hypothesis that the distribution is not normal and therefore a significant value should lead to
acceptance of the hypothesis.
As shown in table 2. the results showed that the GDI* was significant at 5 percent level. I his
therefore leads to the acceptance o f the null hypothesis that the data is not normally distributed.
The data must therefore be transformed for regression.
36
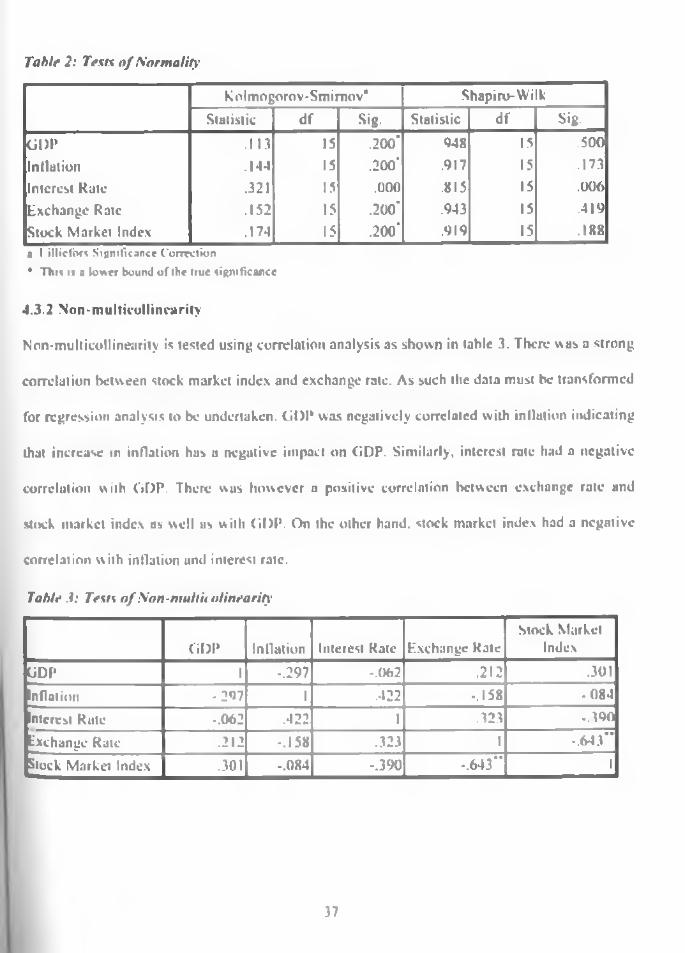
Table 2: Tests o f Normality
Kolmogorov-Smimov* Shapiro-Wilk
Statistic df Sig. Statistic df Sig.
GDP .113 IS .200* 948 15 .500
Inflation .144 15 .200* .917 15 .173
Interest Rate .321 15 .000 .815 15 .006Exchange Rate .152 15 .200’ .943 15 .419Stock Market Index .174 15 .200* .919 15 .188a 1 illicfon Significance Correction • T im i* a lower bound o f ihe Hue significance
4.3.2 Non-multicollincarity
Non-multicollinearity is tested using correlation analysis as shown in table 3. There was a strong
correlation between stock market index and exchange rate. As such the data must be transformed
for regression analysis to be undertaken. GDI* was negatively correlated with inflation indicating
that increase m inflation has a negative impact on GDP. Similarly, interest role had a negative
correlation with GDP. There was however a positive correlation between exchange rate and
stock market index us well as with GI)P. On the other hand, stock market index had a negative
correlation with inflation and interest rate.
Table .1: Tests of Non-nwIt'uoTtnearity
GDP Inflation Interest Rate Exchange RateStock Market
Index
GDP 1 -.297 -.062 .212 .301
Inflation -297 1 .422 -.158 -084
Interest Rate -.062 .422 1 .323 -.390
Exchange Rate .212 -.158 .323 1 -.643”
Stock Market Index .301 -.084 -.390 -.643“ 1
37
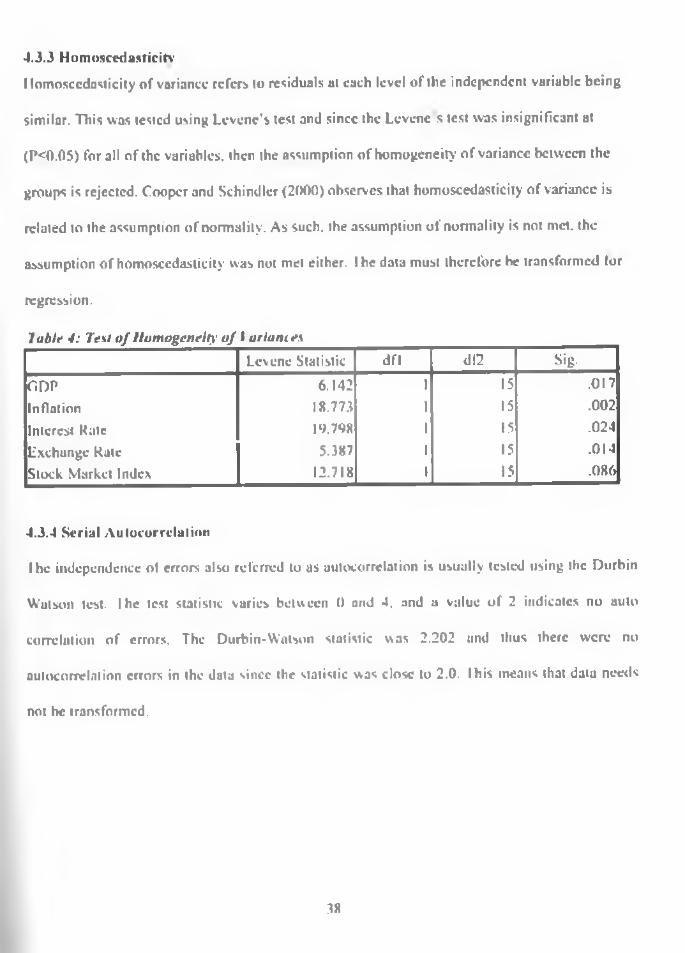
4.3.3 Homoscedasticitv
I lomosccdasticity of variance refers to residuals at each level of the independent variublc being
similar. This was tested using Levcnc’s test and since the Levenes test was insignificant at
(P<0.05) for all of the variables, then the assumption o f homogeneity of variance between the
groups is rejected. Cooper and Schindler (2000) observes that homoscedasticity of variance is
related to the assumption o f normality. As such, the assumption o f normality is not met. the
assumption of homoscedasticity was not met either. I he data must therefore be transformed lor
regression.
l ablf 4: Test of Homogeneity of > oriainesLcvene Statistic dfl d!2 ■Sig.
C.DP 6.142 1 15 .017
Inflation 18.773 1 15 .002
Interest Kate 19.798 1 15 .024
Exchunge Kate 5.387 1 15 .014
Stock Market Index 12.718 1 15 .086
4.3.4 Serial Autocorrelation
I he independence of errors also referred to as autocorrelation is usually tested using the Durbin
Watson test. I he test statistic varies between 0 and 4, and a value of 2 indicates no auto
correlation o f errors. The Durbin-Watson statistic was 2.202 and thus there were no
autocorrelation errors in the data since the statistic was close to 2.0. I his means that data needs
not be transformed.
38
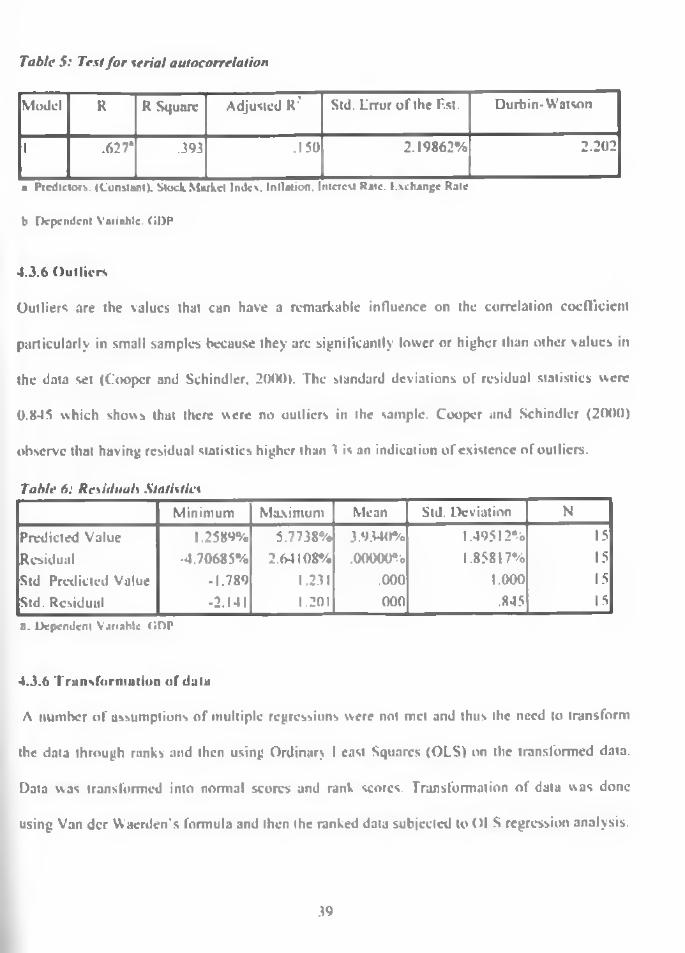
Table 5: Test for serial autocorrelation
Model R R Square Adjusted R: Std. Lrror o f the F.st. Durbin-Watson
1 .627* .393 .150 2.19862% 2.202
a Predictors. {Constant). Slock Market lodes, Inflation. Inter cm Rate, exchange Kate
b Dependent Variable; GDP
4.3.6 Outliers
Outliers are the values that tan have a remarkable influence on the correlation coefficient
particularly in small samples because they are significantly lower or higher than other values in
the data set (Cooper and Schindler, 20(H)). The standard deviations of residual statistics were
0.845 which shows that there were no outliers in the sample. Cooper and Schindler (2000)
observe that having residual statistics higher than 4 is an indication o f existence of outliers.
Table 6: Residuals StatisticsMinimum Maximum Mean Std. Deviation N
Predicted Value 1.2589% 5.7738% 3.9340% 1.49512% 15
Residual -4.70685% 2.64108% .00000% 1.85817% 15Std Predicted Value -1.789 1.231 .000 1.000 15Std. Residual -2.141 1.201 000 .845 15
a . Dependent Variable GDP
4.3.6 Transform ation of data
A number o f assumptions o f multiple regressions were not met and thus the need to transform
the data through ranks and then using Ordinary I east Squares (OLS) on the transformed data.
Data was transformed into normal scores and rank scores. Transformation of data was done
using Van dcr Waerden’s formula and then the ranked data subjected toO l S regression analysis.
39
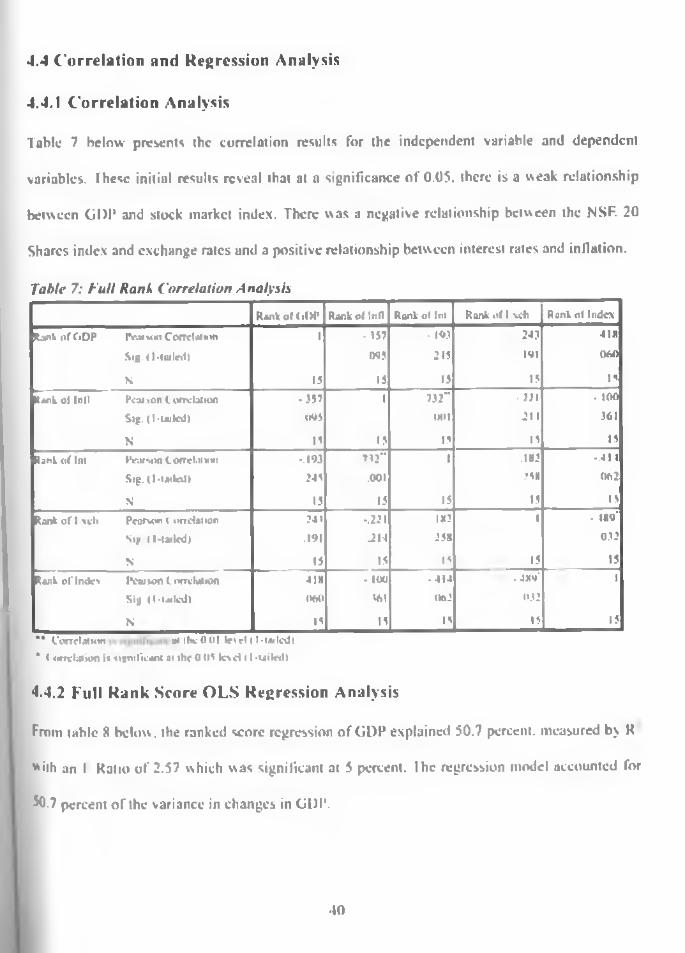
4.4 Correlation and Regression Analysis
4.4.1 Correlation Analysis
Tabic 7 below presents the correlation results for the independent variable and dependent
variables, these initial results reveal that at a significance o f 0.05. there is a weak relationship
between GDI* and stock market index. There was a negative relationship between the NSF. 20
Shares index and exchange rates and a positive relationship between interest rates and inflation.
Table 7: full Rank Correlation Analysis
Rank o f G O P Rank o f Inti Rank of Ini Rank o f Ix c ti Rank o f Index
Rank o f G D P iVjfuMi C o rrtla u m 1 • t$ 7 • 193 24.7 41X
S i j . < 1 -tutlol) .0**5 215 191 060
N 15 1) 15 15 1*
Rank of lull Pcui>on C orrelation -.557 1 732” • 721 . to o
Sig , (1 -tailed) 09} 001 211 361
N 15 15 15 15 15
Rank o f Ini Pen/son CofTcl.it*t»i -.193 .732" 1 .18? -.411
Sig . (1 -tailed i .245 .001 ,?5K 062
N 15 15 15 15 15
Rank o f l-vch Pcarvwi t o n elation 74) -.221 1*2 1 ■ 189'
s»K ll- ta iled ) .191 -214 258 032
N 15 IS |S 15 15
Rank o f Index IV arton lo /rv ta tio n 41H • too -4 1 4 -4X 9' 1
Siy ( 1 -tailed) 060 361 062 .032
N 15 15 1 5 15 15
** Corrclotum at i k 0.01 Ic 'd ( I-tailed!* ( otrclaiiofl i» lutnificunt at the 0 05 level i I .tailed)
4.4.2 Full Rank Score OLS Regression Analysis
From table 8 below, the ranked score regression of GDP explained 50.7 percent, measured by K
"ith an I Ratio of 2.57 which was significant at 5 percent I he regression model accounted for
50-7 percent o f the variance in changes in GDI*.
•10
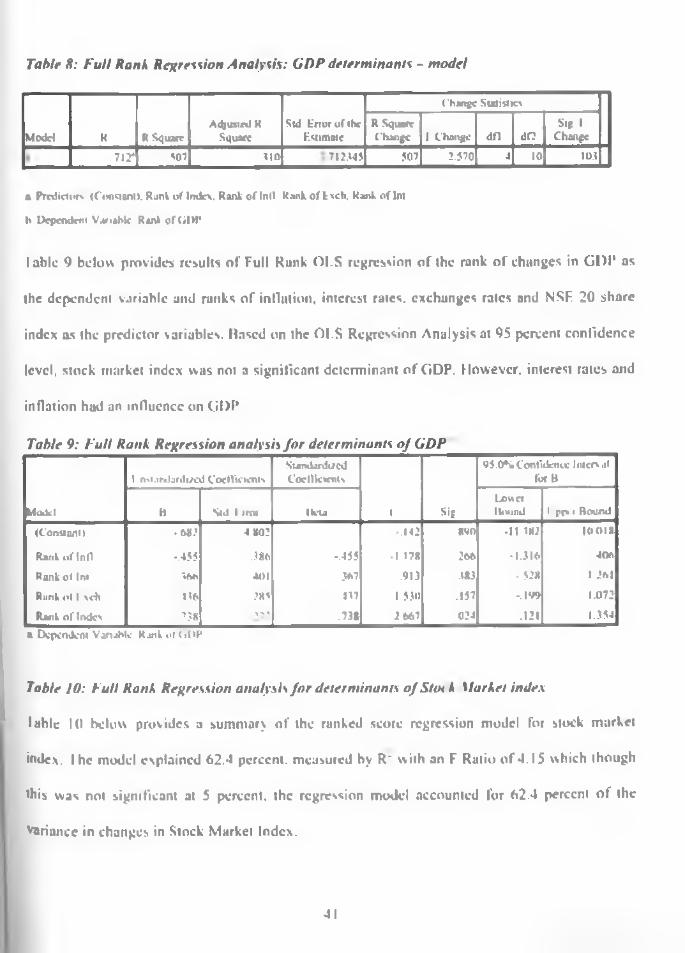
Table H: Full Rank Re/iression Analysis: GDP determinants - model
Change Statistic'
Model R R SquareAdjusted R
SquareSid Error of ihv
F.stimatcR SquareChange 1 Change dfl dl?
Sip 1 Change
712* S07 tin 712345 507 2.570 4 10 103
a Prolidorv (Constant). Rank of In in . Rank of Inll Rank oflxcb, Rank o f In
K Dependent Vur.aNc Rank of G W
I able 9 below provides results o f Full Rank 01.S regression of the rank o f changes in GDI* as
the dependent variable and ranks of inflation, interest rates, exchanges rates and NSF. 20 share
index as the predictor variables. Rased on the 01.S Regression Analysis at 95 percent confidence
level, stock market index was not a significant determinant of GDP. However, interest rates and
inflation had an influence on GDP
Table 9: Full Rank Regression analysis for determinants of GDP
1 nti.irdurdi/cd CoefficientsStandardizedCoefficients
95.0%Confidence liitcrs.il for U
Model B Std 1 irw IWta 1 SifLowerIRuind t rr* < Bound
(Const uni) • 682 4 802 -.142 *90 •It 382 10018
Rank of lull -.455 .386 -.455 -1 178 266 -1.316 406
Rank ol Int '.60 .401 367 .913 .3*3 . 528 1 261
Rank «*l 1 \clt .436 285 437 1 53D .157 -.199 1.072
Rank of Index 738 > 7 7 .738 2 667 024 . 1 2 1 1.354
a. Dependent VanuMc Rank of GOP
Table 10: Full Rank Regression analysis for determinants of Sun k Market index
I able 1(1 below provides a summary of the ranked score regression model for stock market
index. I he model explained 62.4 percent, measured by R' with an F Ratio o f 4.15 which though
this was not significant at 5 percent, the regression model accounted for 62.4 percent o f the
variance in changes in Stock Market Index.
41
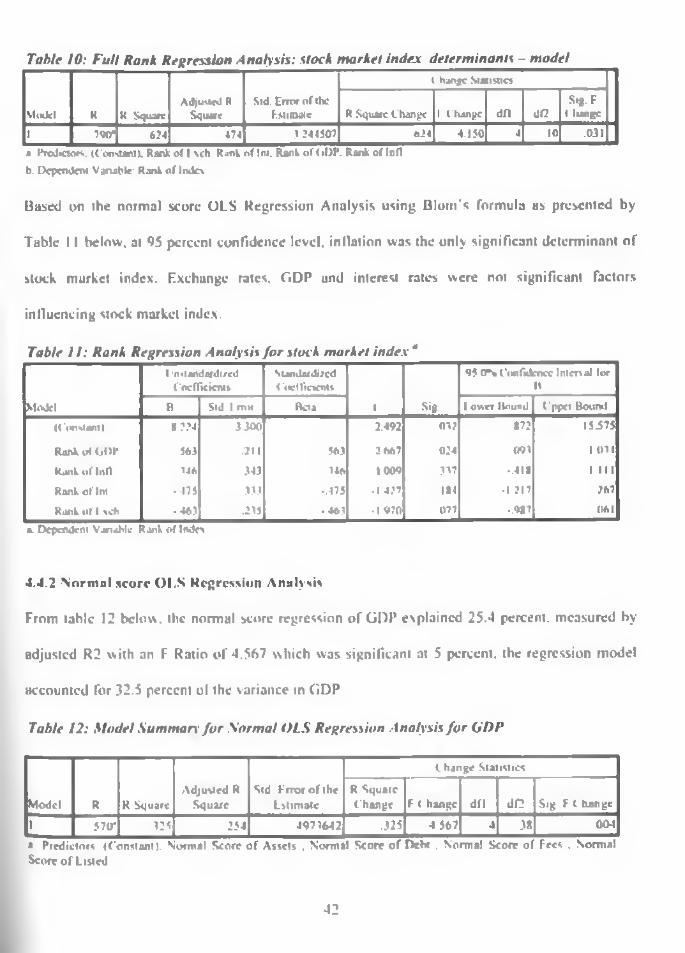
Table 10: Full Rank Regression Analysis: stock market index deter mi na nls - mode!
Model K R SquareAdjusted R
SquareStd. Error of the
Fstimole
( hangc Statistics
R Square Change 1 Change dfl df2Stg.F
( lunge
1 700* 624 .474 3 241507 624 4.150 4 10 .031a Predictors: (Constant). Rank of l \ch Rank of Ini. Rank of f»DP. Rank of Infl b. Dependent Vanabk- Rank of Index
Based on Ihe normal score OLS Regression Analysis using Blum's formula as presented by
Table 11 below, at 95 percent confidence level, inflation was the only significant determinant of
stock market index. Exchange rates, GDP and interest rates were not significant factors
influencing stock market index.
Table / 1: Rank Regression Analysis for Mock market index "I n standardized
CoefficientsStandardized < 'oclliocnu
95.0% Confidence Interval lor It
Model n Std 1 row Beta 1 Sip 1 ovver Hound Cppct Bound
((‘tmsl ant) H 224 3.300 2.492 032 872 15.575
Rank of 01 >P 563 .211 563 2 667 024 093 1 Oil
Rank of Inti »46 -343 146 1.009 337 -.418 t i l l
Rank of list -.475 333 -.475 • 1 477 Iftl • 1 217 267
Rank of 1 sell • 463 .235 .463 • 1.970 077 -.987 (161
i Dependent Variable. Rank of Index
4.4.2 Normal score OI.S Regression Analysis
From table 12 below, the normal score regression o f GDP explained 25.4 percent, measured by
adjusted R2 with an F Ratio of 4.567 which was significant at 5 percent, the regression model
accounted for 32.5 percent ol the variance in GDP
Table 12: Mode! Summon for Normal (US Regression Analysis for ODP
Model R R SquareAdjusted R
SquareStd F rrorofthe
Lstimatc
Change Statistics
R Square Change F < hinge dfl d!2 Sig F t lunge
1 570* 325 254 4973642 .325 4567 4 38 004
» Predictors (Constant). Normal Score of Assets . Normal Score o f r>eht . Normal Score of Fees . Normal Score o f Listed
42
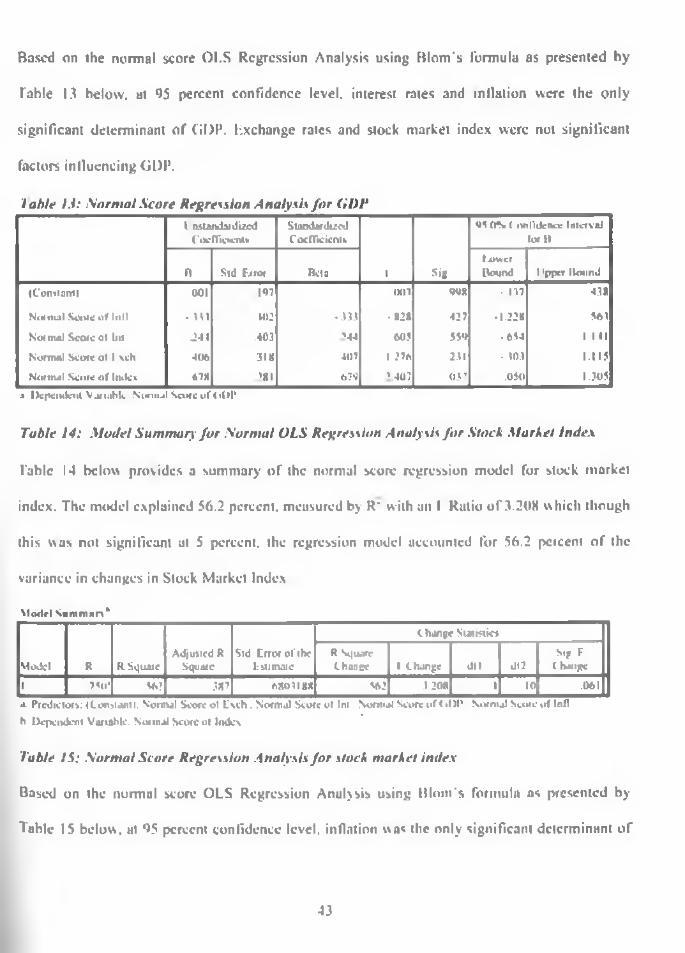
Based on the normal score 01.S Regression Analysis using Blom's formula as presented by
fable 13 below, at ‘)5 percent confidence level, interest rates and inilalion were the only
significant determinant of GOP. Exchange rates and stock market index were not significant
factors influencing GDP.
/ able 1.1: Normat Score Regression Analysis for (il)l’l ^standardized
CocffietctUi.Standardized C acfYicicntx
95 (l% l nnlidence Interval lor II
Ft Sul Frror Beta I SiglowerBound 1 'pjyrr Hound
(Conitiintl 001 . 197 tx n WX • 117 ■138
Normal Score of loll • J J . l M)2 -.133 ■ 828 427 • 1.228 563
Normal Score o! hit •241 .403 '44 605 5 J*> • 654 1 III
Normal Score ol E.xeh •tot. .318 407 1 .’76 231 • 303 1.11$
Normal Score of Index 67X ’81 .679 ’ .407 .037 .OJO 1.305.i Dependent Vanuhle Nonii.il Score of Cit>l*
Table 14: Mode! Summary for .\ormal OLS Regression Analysis for Slock Market Index
fable 14 below provides a summary o f the normal score regression model for stock market
index. The model explained 56.2 percent, measured by R' with an I Ratio o f 3 .208 which though
this was not significant at 5 percent, the regression model accounted for 56.2 percent o f the
variance in changes in Slock Market Index
Model Sum m im *
Model R R SquareAdjusted R
SquareStd Error ol'the
Estimate
Change Statistic*
R Square Chance 1 Change •in dl?
Sijr F C barigc
1 750* 562 387 6803188 562 3.208 • 10 .061a- Predictors: tConsiami. Normal Score ol Exch. Normal Score of Ini Normal Score of < d)l* Normal Score of lull h Dependent Variable. Normal Score oi Index
Table IS: Normal Score Regression Analysis for stock market index
Based on the normul score OLS Regression Analysis using Blom's formula as presented by
Table 15 below, at ‘>5 pereent confidence level, inflation was the only significant determinant of
43
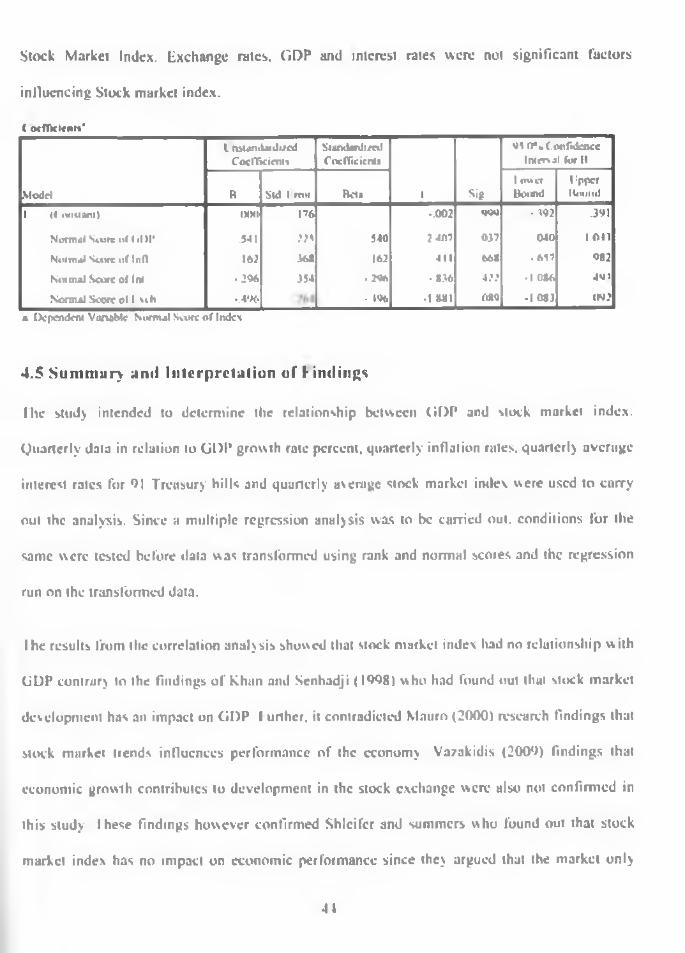
Stock Market Index. Exchange rates. GDP and interest rates were not significant factors
influencing Stock market index.
(o tlT K lu m '
Modd
Imnm.Ut Ji/cd CoelTkicnu
StandardizedCoefficient*
1 Sig
9S 0*. Confidence lmerv.il for H
B Sul 1 mtr Beta1 ovvvr Bound
UpperIII VIII III
1 It ixioanil (MX! 176 -.002 '>99 - 192 .391
Normal Store of ( il >1’ .541 2 1 i 540 ? 407 037 040 i o n
Normal Store of lull 16? 368 163 411 668 • M7 982
Normal Store ol Ini •29ft 354 . 196 • 836 *1 1 •1 086 401
Normal Store oi l vih • 4 9 6 • 196 • 1 881 MW •1 083 092
a. IX-pendcnt Variable Normal Suite o f Index
4.5 Summary ami Interpretation of f ind ing
fhe study intended to determine the relationship between GDP and stock market index.
Quarterly data in relation to GDP growth rate percent, quarterly inflation rates, quarterly average
interest rates for 9 | Treasury hills and quarterly average stock market index were used to carry
out the analysis. Since a multiple regression analysis was to be carried out. conditions for the
same were tested before data was transformed using rank and normal scoies and the regression
run on the transformed data.
I he results from the correlation analysis showed that stock market index had no relationship w ith
GDP contrary to the findings o f Khan and Senhadji (1998) who had found out that stock market
development has an impact on GDP further, it contradicted Mauro (2000) research findings that
slock market trends influences performance of the economy Vazakidis (200*>) findings that
economic growth contributes to development in the stock exchange were also not confirmed in
this study I hese findings however confirmed Shleifcr and summers who found out that stock
market index has no impact on economic performance since they argued that the market only
41
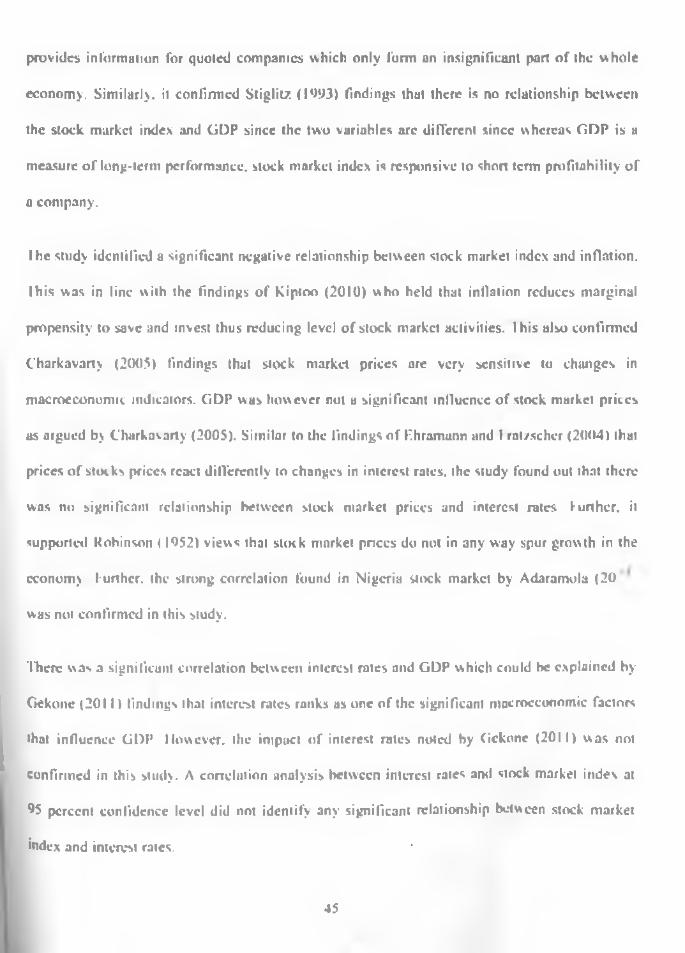
provides information for quoted companies which only form an insignificant pan of the whole
economy. Similarly, it confirmed Stiglitz (1993) findings that there is no relationship between
the stock market index and GDP since the two variables are different since whereas GDP is a
measure o f long-term performance, stock market index is responsive to short term profitability of
a company.
I he study identified a significant negative relationship between stock market index and inflation.
Ibis was in line with the findings o f kiptoo (2010) who held that inflation reduces marginal
propensity to save and invest thus reducing level o f stock market activities. I his also confirmed
Charkavarty (2005) findings that stock market prices are very sensitive to changes in
macroeconomic indicators. GDP was however not a significant inlluencc of Stock market prices
as argued by Charkavarty (2005). Similar to the findings of P.hramann and I rat/scher (2004) that
prices o f slocks prices react differently to changes in interest rates, the study found out that there
was no significant relationship between stock market prices and interest rates, further, it
supported Robinson (1952) views that slock market prices do not in any way spur growth in the
economy further, the strong correlation found in Nigeria stock market by Adaramola (20
was not confirmed in this study.
There was a significant correlation between interest rates and GDP which could be explained by
Gekone (2011) findings that interest rates ranks as one of the significant macroeconomic factors
that influence GDP However, the impact of interest rates noted by Gekone (2011) was not
confirmed in this study. A correlation analysis between interest rates ami stock market index at
95 percent confidence level did not identify any significant relationship between stock market
index and interest rates.
45

The study did not confirm interrelationship between GDF and stock market since at 95 percent
confidence level, correlation analysis for the two variables did not identify significant
relationship. This was a contrast to Luinlcl and Khan (1999) findings that there exists a feedback
effect between economic growth and stock market index. The study also contradicted llongbin's
findings that slock market performance is related to economic growth. However, this confirmed
C hen ct al (1986) arguments that stock market index and GDP growth rates are endogenous
factors. As such, the two variables are not interrelated as confirmed by this study.
A correlation analysis at 95 percent confidence level between movement in exchange rates and
stock market index indicated a significant negative correlation between the two variables. I his
contradicted Silujo el al (2008> findings that movement in foreign exchange rates has no impact
on the stock market. This could be explained by the significant role played by foreigners and
Kenyans in the Diaspora in the NSl in the recent past. As such, depreciation o f the local
currency KShs against major currencies such as the USD is likely to discourage foreign
investments in stock market thus reducing demand o f shares and thereby a decline in share
prices.
16
CHAPTER FIVE
SUMMARY. CONCLUSIONS AND RECOMMENDATIONS
5.1 Summary
This study intends to establish whether there is a relationship between stock market performance
and economic performance in Kenya. In order to do this, the research was designed as a causal
study where relationships were tested. The population comprised of 60 companies listed at the
NSF., while the sample comprised o f 20 companies forming the NSE 20 share index. The NSK
20 share Index was used as a measure o f stock market performance while the GDP was used as a
measure o f economic performance. Other variables used were inflation, interest rates and
exchange rates. Secondary data was used in the study where data on GDP were obtained front
the Kenya Bureau of Statistics while data on NSE 20 Share Index, Inflation rates. Interest rates
and exchange rates were obtained from the Central Bank Data was analysed using correlation
and regression analysis.
The study found that there is no significant relationship between slock market performance and
economic performance. However, slock market index was negatively affected by inllalion thus
indicating that an increase in inllalion would cause a decline in stock market index. Exchange
rates on the other hand had a positive impact on GDP whereas inllalion and interest rates
impacted negatively on (iDP.
I tom the correlation analysis, there was a significant negative relationship between exchange
rates and stock market index, significant positive relationship between interest rates and inflation
at a significance level of 0 01
•17
5.2 Conclusion
The study reaches a conclusion that GDP is undirected by movement in stock market index.
Further, there exists no strong correlation between GDP and stock market index since the two are
exogenous Factors. There is however a strong negative correlation between stock market index
and inflation indicating that increase in inflationary pressure would hamper investment in the
stock market and thus its performance. There was a significant negative relationship between
stock market index and exchange rates. GDP was mainly affected bv interest rates and in Hat ion.
A significant positive relationship existed between interest rates and GDP indicating that
investments are likely to increase in such a case and thereby resulting to growth in GDP.
However, inflation lias a negative impact on GDP growth rate since it hampers investments and
savings.
5.3 Policy Recommendations
The stud) makes a number o f recommendations, theoretically, there exists a strong positive
correlation between stock market performance and GDP growth rate. I rom this studs however,
this relationship could not be confirmed Therefore there is need for policy makers to develop
policies aimed at improving contribution of the NM to economic development. I his could be
achieved by relaxing listing rules to attract more companies to list their stocks in the market and
attraction of more investors to the market through improvement of corporate governance
practices in the market.
Management ol the stock exchange should be cognizant o f the critical role played by the NSL
and thus focus on areas which could improve us impact on GDP I he proposed demutualization
of the stock market for instance should he supported so as to improve market activity. Another
•IX
improvement could be in terms of increasing the popularity ol the market through publicity and
advertisement. Ibis would help to create awareness and interest among investors as well as
companies that could list their stocks. The importance of foreign investors should also be
considered and thus policies pul in plucc to even increase their participation in the market.
Popularizing the market internationally should therefore be done as well as creation of a platlorm
that would help to mobilize investments from global investors.
5.4 Limitations of the study
The study faced a number o f limitations The first limitation is in the explanatory power o f the
model. The model explained between 32.5 percent and 56.2 percent of the variance. I his
suggests that there arc a number o f variables that were left out ol the model which would
improve the explanatory power of the model.
Secondly , the study only focused on the NSF. 20 share index as a basis for measurement o f stock
market performance. Other indices such as the NASI and I ISF. Kenya were not used due to
unavailability ol data NASI was introduced in year 2008 and had not gained prominence as at
the time of this study Further. I TSF. NSI Kenya 15 and 25 indices were introduced in
November 2011 and therefore could not be used in the analysis due to the limited data available.
Interest rates were determined as an average of four months 91 treasury bills rate and thus other
rates o f interest such as Central Hank Lending Rale. Bank Rate and 181 treasury bills rates were
not considered in this study. Use o f such rates might cause a variation in changes.
This study covered u period o f only five years. However, studies o f this nature spun for periods
o f several decodes. This is because economic performance and stock market performance cover a
long period of time. Accordingly, the results may not be conclusive.
5.5 Suggestions for Further Research
This is need for more research on this area in order to provide an analysis of the relationship
between exchange rates and economic growth, This should be done b> using more independent
variables in the model so as to improve the explanatory power of the model.
further studies should also be carried out by finding out the reasons lor identified relationship
between stock market index and foreign exchange. It is also imperative to study the reason
behind the identified strong negative correlation between inflation and interest rates In-depth
analysis is equally important to understand the reasons for the lack o f a significant correlation
between GDI* and stock market index Another study should have a similar strategy though
covering periods subsequent to the second quarter of 2012. This would help to collaborate with
findings in this study.
50
REFERENCES
Adjasi. K. A Biekepc. B.. (2006). Stock exchange and economic growth the case of selected
African countries. University of Stellenbosch Business School. Cape Town, South
Africa
Ake. B. i t Dolman. J., (2010). Ihe Role of Slock Market Development in Economic Growth:
Evidence from Some Euronext Countries. International Journal o f finance Research.
Vol. 1(1). Pp. 14-20
Bcmankc, B.S. A Kuttncr. K. N., (2003). What Explains the Stock Market's Reaction to federal
Reserve Policy? Federal Reserve Bank o f New York
Bosworth. B. (1075). The Slock Market and the Economy. Brookings Papers on Economic
Activity Vol. 2. Pp. 257-300.
Brahmasrene I . & Jiranvakul. k ., (2007). Cointcgration and causality between sunk index and
macroeconomic variables in an emerging market. Academy of Accounting am!
Financial Studies Journal. Vol. II . pp 17-30.
Calderon C. & Liu L.. (2002). The direction o f causality between financial development and
economic growth Working Papers, Central Bank of Chile
Charkravartv. S,. (2005). Stock market and macroeconomic behaviour in India. Institute of
Economic Growth. Delhi. India
Chen. N.F . Richard. R. & Ross. S.A., (1980). Economic forces and the stock market. Journal of
Business. Vol. 59. Pp. 383-40.3
Deb. S. G. itMukhcrjee. J.. (2008) Does Stock Market Development Cause Economic Growth?
A Time Scries Analysis for Indian Economy. International Research Journal oj
Finance and Economics. Vol. 2 1. pp. 142-49
51
Demirguc-kunt. A. & Levine. K.. (1996). Stock Market Development and Financial
Intermediaries: Stylized l ads, World Bunk Economic Review, Vol. 10. No. 2. (1996).
291-321.
t.nisan A.A. «* Olufisayo. A.O.. (2009). Stock market development and economic growth:
I Evidence from seven Sub-Sahara African countries. Journal of Economics. Vol. 6 1. pp.
162-171.
Fuboz/i I . & Modigliani F.. (1995). C apital Market Institutions and Instruments. New Jersey:
Prentice Mall. Inc.
l ama L I .. (1990). Stock returns, expected returns, and real activity. Journal of Finance. Vol.
4 5 ,pp.I0X9-II08
Cekonc. N.A.. (201 I ). Relationship between the NSF. .stock index and selected macroeconomic
indicators (2000-2010) Unpublished MBA dissertation. University o f Nairobi
(ieske. R A Roll. R . (1983). The fiscal and monetary linkage between stock returns and
inflation. Journal of Finance. Vol. 38. pp. 7-33
(iitobu M.. (2000). Determining the Influence of Macro Economic Indicators on Stock Market
Indicators. Unpublished MBA dissertation. University ol Nairobi
Ciuo. L.. Liu. S.. A Oman, M.. (2005). Empirical study on relationship between GDP and stock
index hosed on the degree of grey incidences. Retrieved on July 7. 2012 from,
in u i ent inn ae.lkiml ICIA2(m Papers ■( HOOTfR C M
I larris. K . (1997). Stock Markets and Development. A Rc-asscssment European Economic
Review. Vol 41. Pp 139-46.
Flicks. .1.. (1969). A Theory o f Economic History. ( larendon Press
Ilongbin, D.. (2007). Slock Market Development anti Economic Growth: Evidence o f China, the
Index of Science i t Engineering, (SRI) Database
Howells. P. & Keith. B.. (2000). Financial Markets and Institutions, 3rd Edition. Prentice Hall
Ibrahim. II.M., (1999). Macroeconomic indicators and stock prices in Malaysia: An empirical
analysis. Asian Economic Journal. Vol. 13. No. 2. Pp. 210-31
Kathurimn, C.K.. (2010). The perceived benefits and challenges of demutualisation of the NSE
Unpublished MBA dissertation. University of Nairobi
Kithinji. A & Ngugi. \\ .. (2010). Stock Market performance before and after general elections.
A case stud) of the \atrobi Stock Exchange. Retrieved on 8 July 2012 from, <
www.aibuma.org/proceedingsJ..7Angela%20Kiihinji. %20kcnya.pdf-
kiptoo. S.C.. (2010). An empirical investigation oj the relationship between selected
macroeconomic variables and slock prices evidence from l Ik XSl I Inpublishcd MBA
dissertation. University o f Nairobi
Khan, M. A Scnhadji. A . (2000) Financial Development and Economic Growth: An Overview
IMF H arking Paper
Kolapo. F.T A Adaramola. A.O.. (2012). I he impact of the Nigerian capital market on economic
growth (1990-2010). International Journal of Developing Societies. Vol. I. No. I. Pp
11-9
kwon C.S. A Shin. T.S.. (1999). Cointcgralion and causality between macroeconomic variables
and stock market returns. Global Finance Journal. Vol 10. pp. 71-81
I cc, B.S.. ( 1992) Causal relations among slock returns, interest rates, real activity and inflation.
Journal of Finance Vol. 47. Pp. 1591-1603
53
Levine. R. & Zervos. S., (1996). Stock Market Development and Long-Run Growth. World
Hank. Policy' Research Working Pufier. Vol. 1582
l.evinc. R.. (1997). f inancial Development and Economic Growth: Views and Agenda. Journal
o f Economic Literature. Vol. 35. Pp. <>88-726.
Levine, R. & /ervos. S.. (1998). Stock Markets, Banks, and Economic Growth American
Economic Review Vol. 88. Pp. 537-558.
Majid. M.S.A.. (2007). Re-Examining the l inancc-Growth Nexus: Empirical Evidence from
Indonesia. Gadjah Mad International Journal of Hus incss Vol. 2. No. 9. Pp. 137-56
Mnuro. P., (2000). Stock Returns and Output Growth in Emerging and Advanced Economies.
IMF Working Paper, 89
McKinnon. R.I.. (1973). Money and< apttal in Economic Development, The Brookings
Institution. Washington. DC, 1973
Modigliani. I . &. Ando A., (1963). I he life cycle hypothesis of saving: Aggregated implications
and tests. American Economic Review, Vol. 53. pp. 55-84
Nassch, A. & Strauss, J.. (2000). Stock prices and domestic and international macroeconomic
activity a cointegration approach. The (■hmrterly Review of Economics and Finance.
Vol. 40. No. 2. 229-45.
Nieuwerburgh, S.V.. Buelens. h. & Cuyvers. L.. (2006). Stock market development and
economic growth in Belgium. Explorations in Economic History Vol 43. Pp. 13-38
Nowbutsing. U.M & Odit A1.P.. (2009). Slock Market Development and Economic Growth: I he
Case o f Mauritius. International Business Economics Research Journal. Vol. 8(2), Pp,
77-88
54
Nyamute M. ( I99X). The Relationship In-tween Stock Prices and Exchange Rates. Interest Rates.
Money Supply and Inflation. Unpublished MM A dissertation. University of Nairobi
Obunde. W.W.. (2011). An empirical examination of the relationship between slock splits and
slock performance of firms listed on Nairobi Stock Exchange t\SEf
Otukc, J.. (2000). Impact of Central Depository System on the Performance of NSE. Unpublished
MBA Dissertation, University o f Nairobi
Randall. K.F.. I lanousek. J. »* Nauru, F.C., (1999). Do stock markets promote economic growth?
Working paper, No. 267
Robinson, J.. (1952). The generalization of the general theory The Rate of Interest and Other
Essays. MacMillan. I ondon. UK
Rogers. M.K.. (2005). Diffusion of Innovations. 5th edition. I he Free Press. New York. USA
Scyyed. A.. (2010). I m erging Stock Market Performance and Lconomic Growth. American
Journal of Applied Sciences. Vol 7, No. 2. Pp. 265-69
Shnhba/., M . Nadeem, A. &. Ali. I ., (2(M)8). Stock Market Development and I conomic Growth:
ARDL Causality in Pakistan International Research Journal of Finance and Fconomics
Vol. 14(1). Pp 182-95.
Shaw. I S . (1973) Financial Deepening in Economic Development. Oxford l niversity Press.
New York. 1973.
Shleifer & Summers. (19X8). Preach of Thrust in Hostile Corporate: Cuuses and Consequences.
University o f Chicago Press
Sifujo. I K. . Ngugi \5 R.. Pokhuriyal. G. & Wainaina, G.. (2008). An Analysis of the Lfticiency
of the Foreign Fxchange Market in Kenya. Economic Bulletin. Vol 14. No.2. pp. I - I 3
55
Simiyu M.. (1992). Measuring Market Performance of the ASE. Unpublished MBA dissertation.
University o f Nairobi
Singh. A.. (1997). Stock Markets, Financial l iberalisation and Economic Development,
Economic Journal. Vol. 107. No. 442, Pp.771-82
Slight/. J.. (1993). I he Hole of the State in Financial Markets. Proceedings o f the World Bank
Annual Conference on Development Economics. Supplement to World Bank Economic
Review ami World Bank Research ( thserver
Tobis, J.. ( I %9). A general equilibrium approach to monetary theory. Journal of Money ( redit
and Banking Vol. I.N o. I. Pp. 15-29
Va/akidis. A.. (2009). Stock Market Development and Economic Growth, tmertcan Journal of
Applied Sciences. Vol. 6. No. 11, Pp. 1932-40
56

APPENDICES
1. A.Baumann Company I united
2. AcccssKenya Croup Limited
3. Athi River Mining
4. B.O.C Kenya l imited
5. Bamburi Cement I imited
6. Barclays Bank I.imited
7. British American Tobacco Kenya Limited
8 British-Amcrican Investments Company (Kenya) Limited
9. Car and General (K) Limited
10. Carbacid Investments I imited
11. Centum Investment Co 1 imited
12. CFC Insurance Holdings
13. CFC Stanbic I foldings I united
14. C1C Insurance Group Limited
15. City Tnist I imited
16. CMC Holdings I imited
17. Crown Berger Limited
18. Diamond Trust Bank Kenya Limited
19. E.A.Cables Limited
20 I .A.Portland ( cmeni I united
21. Laagads Limited
22. East African Breweries Limited
23. Equity Bank I imited
24. Evcready Last Africa Limited
25 Express I imited
26. Housing I inance Co I imited
27. Hutchings Biemcr Limited
28 Jubilee I loldings I imited
29. kakuzi
Append ix I: Com pan ies Listed at the NSF.
57

30. Kapchonia Tea Company l imited
31. KenGen Limited
32. KcnolKobil Limited
33. Kenya Airways I imited
34. Kenya Commercial Bank Limited
35. Kenya Orchards Limited
.36. Kenya Power A I ighting Company Limited
37. Kenya Re-Insurance Corporation Limited
38. Limuru Tea Company Limited
39. Longhorn Kenya Limited
40. Marshalls (L.A.) Limited
41 Mumias Sugar Company Limited
42. Nation Media Group
43. National Bank o f Kenya Limited
44. NIC Bank Limited
45. Olympia Capital Holdings Limited
46. Pan Africa Insurance Holdings I imited
47. Rea Vipingo Plantations Limited
48. Safaricom Limited
49. Samccr Africa Limited
50 Sasini Limited
51. Semigroup l imited
52. Standard Chartered Bank Limited
5.3. Standard Group Limited
54 I he ( o-operulive Bank of Kenya I united
55 Total Kenya Limited
56. TPS Eastern Africa (Serena) I imited
57. Trans-Century Limited
58 IJchumi Supermarket I imited
59. Unga Group Limited
60 Williamson Tea Kenya Limited
58

1. Mumias Sugar
2. Express Kenya
3. Rea Vipingo
4. Sasini Tea
5. CMC Holdings
(). Kenya Airways
7. Sal'aricom
X. Nation Media Group
9. Barclays Bank Kenya
10. Equity Bank
11. Kenya Commercial Bank
12. Standard Chartered Bank
13 Bamburi Cement
14. British American Tobacco
15. Kengen
11> Centum Investment Company
17. East African Breweries
IX. I A Cables
19. Kenya Power & Lighting Company Ltd
20. Athi River Mining
Appendix 2: Com pan ies Fo rm ing Ihe N SE -2 0 Share Index
59
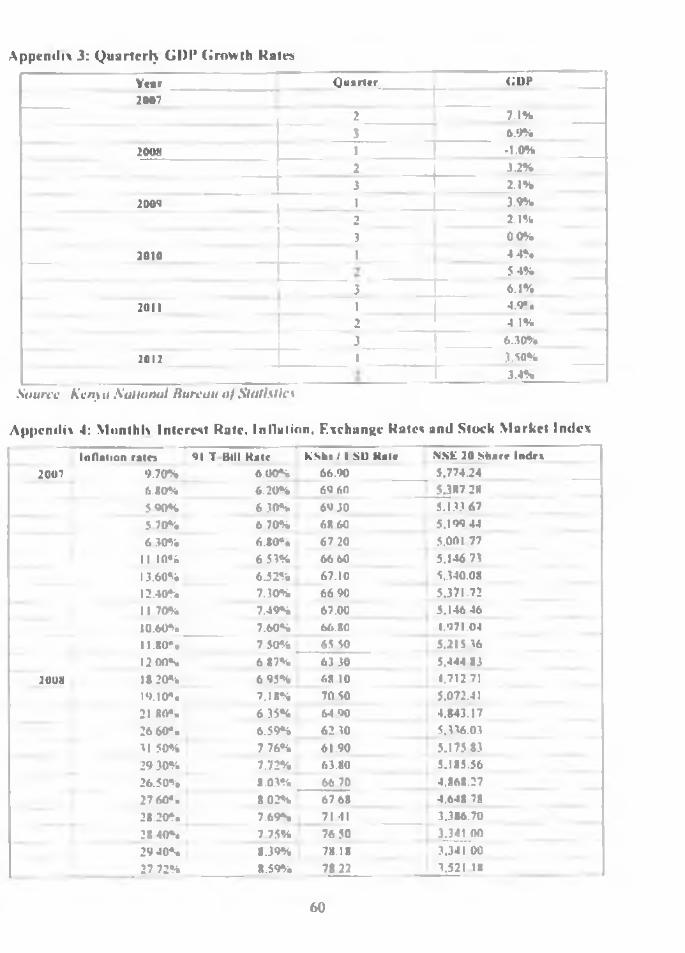
Appendix 3: Quarterly G D I* G row th Rates
Y e a r------------
Q u a r t e r < ; n r
2 0 tP
2 7 . 1 %
3 6.9%2008 1 -1.0%
2 3.2%3 2.1%
200*1 1 3 . 9 %
2 2 .1 %
3 00%2010 1 4 4%
S.4%3 6.1%
2011 l 4.0" d2 4 1%3 6.30%
2012 1 3 .5 0 %
3.4%Source Keny a Sol tonal Bureau of Statistic*
Appendix 4: Monthlx Interest Rate, Inflation. Exchange Rates and Stock Market Index
Inflation r u n 91 T Bill Kale kSh* / 1 SD Kale NSfc 20 Share Index2007 9.70% 6.00% 66.90 5,77424
6.80% 6.20% 69 60 5.387 285.90% 6 30% 69 30 5.1.3.3 675.70% 6 70% 68 60 5.199 446.30% 6.80% 67 20 5.001 77
11 10% 6 53% 66 60 5.146 7313.60% 6.52% 67.10 5..340.0812.40% 7.30% 66 90 5.371.72I t 70% 7.49% 67.00 5.146 4610.60% 7.60% 66.80 1.'>71.0411.80% 7 50% 65 50 5.215 3612 00% 6 87% 63 30 5.444 83
2008 1*20% 6 95% 68 10 1.712 7119.10% 7.18% 70 50 5.072.4121 80*. 6 35% 64 90 4.843.1726 60*. 6.59% 62 30 5.336.0331 50% 7.76% 61.90 5.175 8329 30% 7.72% 63.80 5.185.3626.50% 8.0.3% 6670 4,868.272760*. 8.02% 67 68 4.648 7828.20% 7.69% 71.41 3.386.7028.40% 7 75% 76 50 3.341 0029 40% 1.39% 78.18 .3.341 00
___________ 27.72% 8.59% 78 22 3.521 18
60
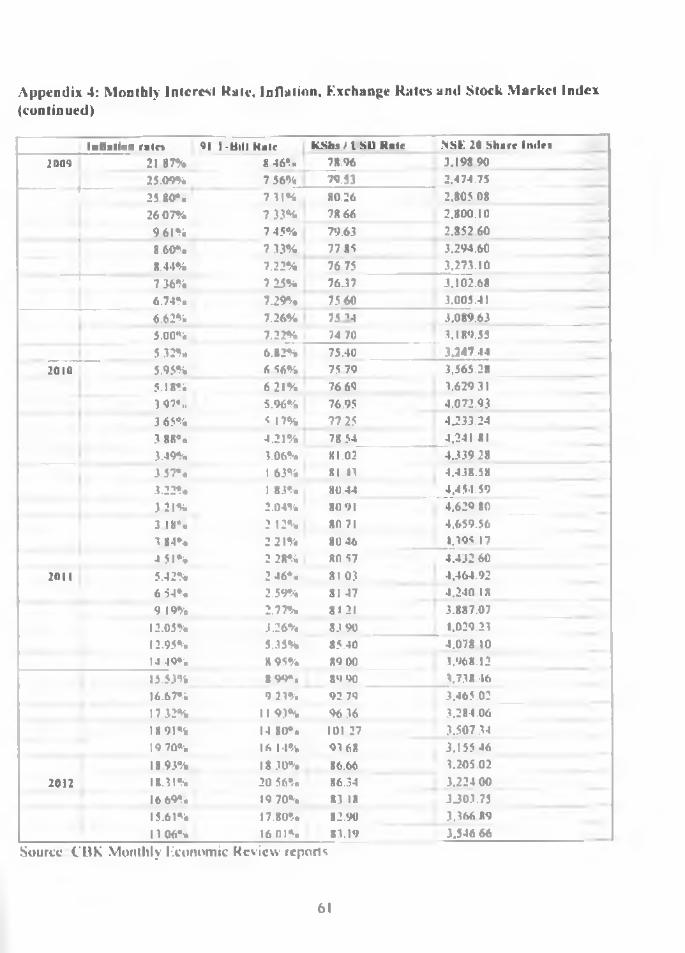
Appendix 4: Monthly Interest Rate. Inflation, Exchange Kates anti Slock M arket Index (continued)
Inflation rates 91 1-Bill Kate k-Nh» / l SD Kate NSL 20 Share Imle*200') 21.87% 8 46*!.. 78.96 3.198 90
25.09% 756% 79.53 2.474.75f
25 80*. 7 31% 80.26 2.805 0826 07% 7 33% 78 66 2.800.10
961% 7 45% 79.63 2.85260«
8.60% 7 33% 77 85 3.294,608.44% 7.22% 76 75 3.273.10
-------------- )--------- 7 36% 7.25% 76 J 7 3.102.686.74% 7.29% 75 60 3.005.416.62% 7.26% 7 5 ’ 4 3.089.635.00% 7.22% 74 70 3,189.555.32% 6.82% 75.40 3.247.44
2010 5.95% 6 56% 75.79 3.565.285.18% 6 2 1 % 7669 3.629 313 97“., 5.96% 76.95 4.072.933 65% 5 17% 77 25 4.233.243.88% 4.21% 7854 4,241 813.49% 3.06% XI.02 4.339 283.57*o 1 63% s i n 4.4J8.583.22% 1 83% 80.44 4.454.59321% 2.04% 80 91 4.629 803 18*. 2 12% 80 71 4.659.563 84% 2 21% 80 46 I.39S 17
4 51% 2.28% 80 57 4.432602011 5.42% 2 46% 8103 4.464.92
6 54% 2.59% 81 47 4.240 189 19% 2.77% 8121 3.887.07
12.05% 3.26% 83 90 1.029.2.312.95% 5.35% 85.40 4.078 1014 49% 8 95% 89 00 3.968.1215.53% 899% 89 90 3.7,38 4616.67% 9 23% 92 79 3.465.0217 32% 11 93% 96.36 3,28-1.061X91% 14 80% 101 27 3.507 3419 70% 16 14% 93 68 3.155 4618.93% 18 30% 86.66 3.205.02
2012 18.31% 20.56% 86.34 3.224 0016 69% 19 70% 8318 JJ03.7515.61% 17.80% 82.90 3.366 8913.06% 16.01% 83.19 3.546 66
Source CBK Monthly Economic Review reports
61
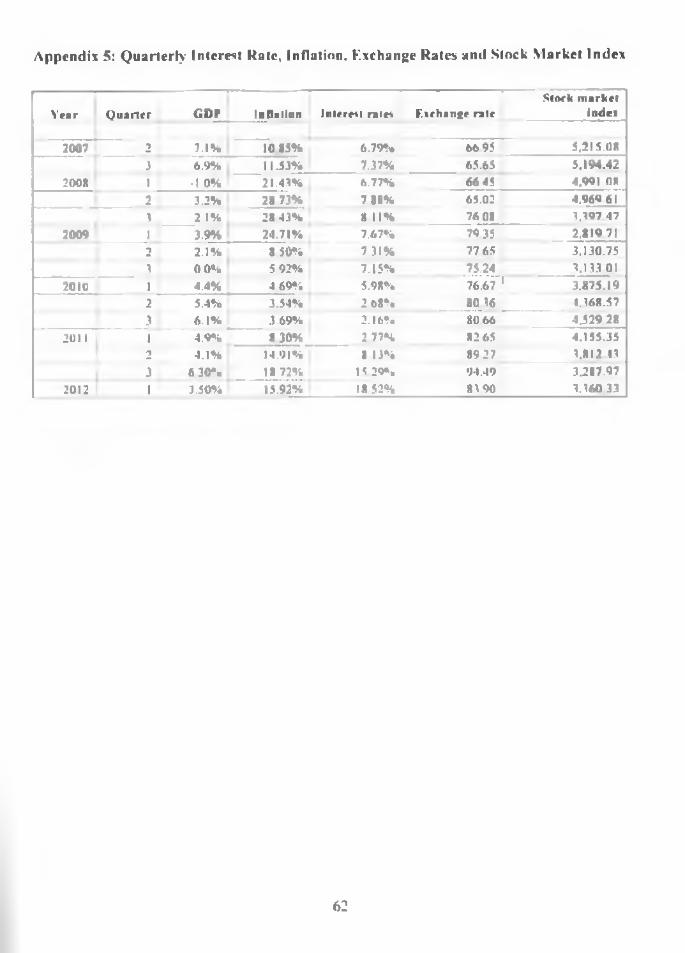
Append ix 5: Quarterly Interest Rate, Inflation. Kxchange Rates and S lock M arke t Index
Slock m arketY ear Q uarter G PP Inflation Interest rales F.xehanee rate index
2007 2 7.1% 10*5% 6.79% 6695 5.215.0*
3 6.9% 11.53% 7.37% 65.65 5,194.42200* 1 •10% 21.43% 6.77% 6645 4,991 OX
2 3.2% 2*73% 7*8% 65.02 4.969 613 2 1% 2*43% * 11% 76 0* 3.397 47
2009 1 3.9% 24.71% 7,67% 7935 2.819 712 2.1% 8 50% 7 31% 7765 3.130.753 00% 5 92% 7.15% 75.24 3.13.3 01
2010 1 4.4% 4 69% 5.9*% 76.67 ' 3.875.192 5.4% 3.54% 2 oS% *0 36 1.168.573 6.1% 3.69% 2.16% 80.66 4.529 28
2011 1 4.9% *30% 2 77% *265 4.155.352 4.1% 14.91% 8 13% 89 27 3.812 133 630* . 1* 72% 15 29% 94.49 3.287.97
2012 1 3.50% 15.92% 1*52% *3 90 3.360 3.3
62
Recommended