JOINT SUBCOMMITTEERESOURCE MANAGEMENT COMMISSION, WATER & WASTEWATER
COMMISSION, AND IMPACT FEE ADVISORY COMMI1TEE
REFERENCE MATERIALAUSTIN WATER FINANCIAL PLANNING
IMPACT FEE LAND USE ASSUMPTIONS
IMPACT FEE CAPITAL IMPROVEMENTS PLAN
Austin
IMPACT FEE REPORTS:
IMPACT FEE LAND USE ASSUMPTIONS
AND
IMPACT FEE CAPITAL IMPROVEMENTS PLAN
City of Austin, TexasAustin Water Utility
Year 2007 Update
Adopted September 10, 2007
IMPACT FEE REPORTS
TABLE OF CONTENTS
IMPACT FEE LAND USE ASSUMPTIONSPAGE
TABLE OF CONTENTS LUA-i
LIST OF MAPS LUA-ii
LIST OF TABLES LUA-ii
I. INTRODUCTION LUA-I
II. SERVICE AREA LUA-l
III. GROWTH PROJECTIONS LUA-3
IV. SERVICE UNITS LUA-6
APPENDIX A -- DESCRIPTION OF IMPACT FEE BOUNDARY LUA A-I
IMPACT FEE CAPITAL IMPROVEMENTS PLAN
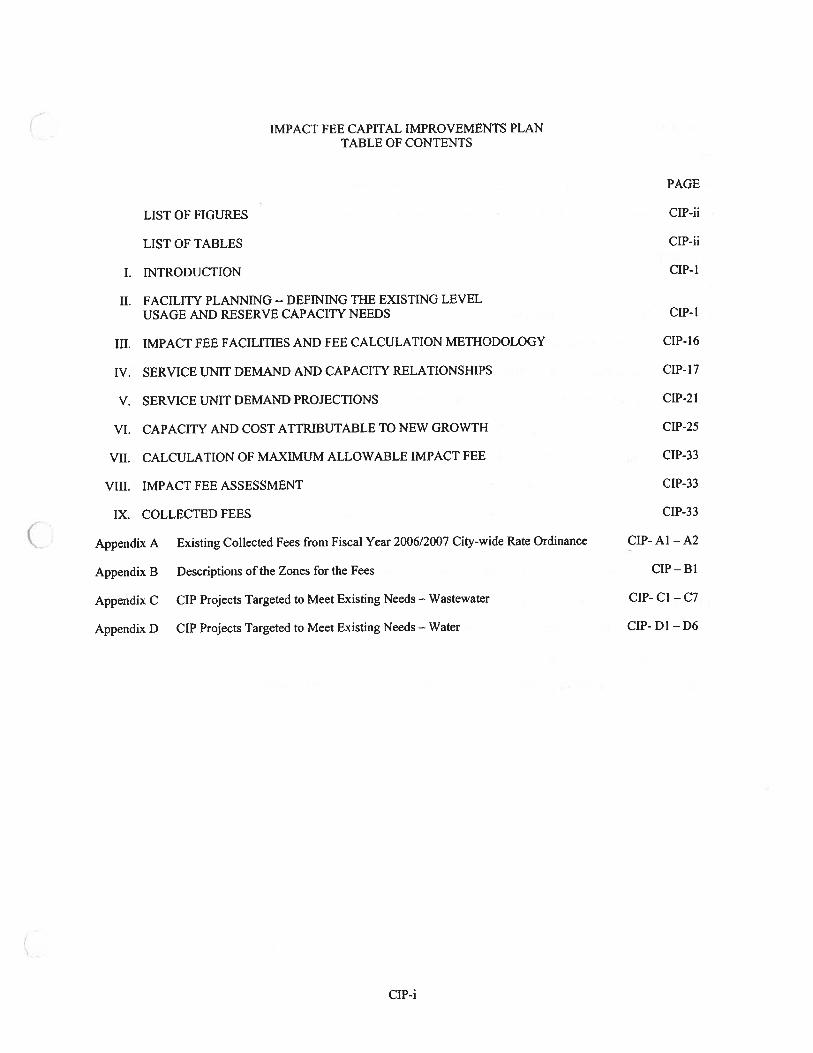
TABLE OF CONTENTS CIP-i
LIST OF FIGURES CIP-ii
LIST OF TABLES CIP-ii
I. INTRODUCTION CIP-I
II. FACILITY PLANNING -- DEFINING THE EXISTING LEVELUSAGE AND RESERVE CAPACITY NEEDS CIP-1
III. IMPACT FEE FACILITIES AND FEE CALCULATION METHODOLOGY CIP-16
IV. SERVICE UNIT DEMAND AND CAPACITY RELATIONSHIPS CIP-17
V. SERVICE UNIT DEMAND PROJECTIONS CIP-2 I
VI. CAPACITY AND COST ATFRJBUTABLE TO NEW GROWTH CIP-25
VII. CALCULATION OF MAXIMUM ALLOWABLE IMPACT FEE CIP-33
VIII. IMPACT FEE ASSESSMENT CIP-33
IX. COLLECTED FEES CIP-33
Appendix A Existing Collected Fees from Fiscal Year 2006/2007 City-wide Rate Ordinance CIP-A- 1
Appendix B Descriptions of the Zones for the Fees CIP-B-I
Appendix C CIP Projects Targeted to Meet Existing Needs — Wastewater CIP-C- I
Appendix D CIP Projects Targeted to Meet Existing Needs — Water CIP-D- I
IMPACT FEE LAND USE ASSUMPTIONS
City of Austin, TexasAustin Water Utility
Year 2007 Update
Adopted September 10, 2007
C
IMPACT FEE LAND USE ASSUMPTIONSTABLE OF CONTENTS
PAGELIST OF MAPS LUA-ii
LIST OF TABLES LUA-ii
I. INTRODUCTION LUA-1
IL SERVICE AREA LUA-1
III. GROWTH PROJECTIONS LUA-3
IV. SERVICE UNITS LUA-6
APPENDIX A DESCRIPTION OF IMPACT FEE BOUNDARY LUA A-I
LUA-i
LIST OF MAPS
TITLE PAGE
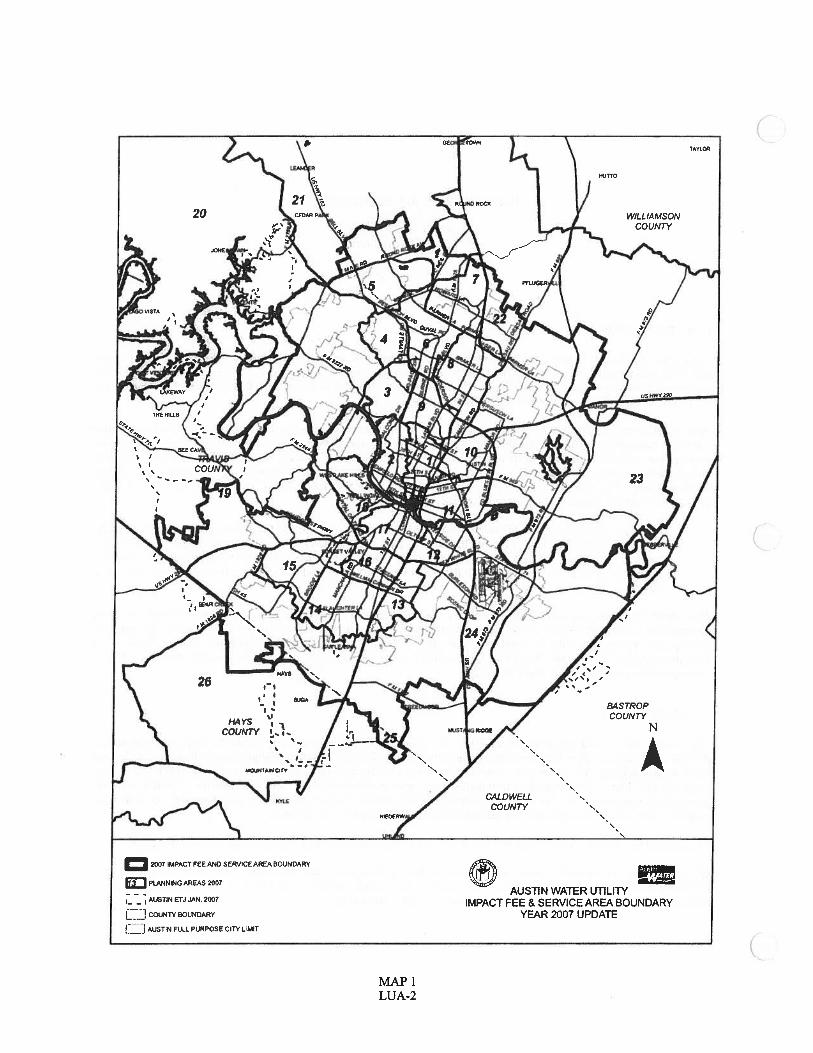
Map 1. Proposed Impact Fee and Service Area Boundary Map (with Planning Areas) LUA-2
LIST OF TABLES
TITLE PAGE
Table 1. Population Growth LUA-4
Table 2. Employment Growth LUA-5
Table 3. Calculation of Service Units LUA-6
Table 4. Estimate of Service Units in Austin Water System (January 2006) LUA-7
Table 5. Projection of Service Units (Connected to City of Austin Water System) LUA-8
Table 6. System-wide Projections of Growth for Decentralized Cluster Wastewater Systems LUA-9
C
(LUA-ii
IMPACT FEE LAND USE ASSUMPTIONS
City of Austin, TexasAustin Water Utility
Year 2007 Update
I. INTRODUCTION
Texas law, specifically Texas Local Government Code, Chapter 395, enacted by the State Legislature in 1987 (SenateBill 336) and amended in 1989, empowers cities to impose and collect “impact fees” and establishes the guidelinescities must follow to do so. The term “impact fee” includes the “capital recovery fees” that the City of Austin chargesfor facility expansion of its water and wastewater systems.
Among the several requirements imposed on cities by Chapter 395 is the development and approval of a report called“land use assumptions.” Section 395.001 (5) of the Local Government Code defines the term succinctly: “Land useassumptions’ includes a description of the service area and projections of changes in land uses, densities, intensities,and population therein over at least a 10-year period.” In a definitive article written by three people who helpeddevelop Chapter 395, entitled “Impact Fees: The Intent Behind the New Law” (St. B. Tex. Envtl, L. J., vol. 19; 1989;pp. 68-73) by Ray Farabee, et.al., the term is so described:
“Land use assumptions” are the basic projections of population growth and future land uses on which plans fornew or expanded facilities must be based. The land use assumptions may be general and do not requiredetailed projections for specific parcels of land. They should, however, be thorough enough to permitreasonably accurate long range planning. The time period on which these projections are based must be atleast ten years.
This report has been prepared for the purpose of complying with the requirements of Chapter 395 of the LocalGovernment Code with respect to “land use assumptions.” It is an amendment to the City’s impact fee land useassumptions approved by the City Council on February 13, 1997, and subsequently amended and updated twice, mostrecently in August 2001, and adopted by City Council November 29, 2001. State law requires that the land useassumptions be updated at least every five years.
II. SERVICE AREA
The “service area’, for the purposes of these land use assumptions, is the entire area within the corporate boundary ofthe City of Austin and its existing extraterritorial jurisdiction (ETJ) that is anticipated to be served within the next tenyears by the existing city water and wastewater systems and the facilities listed in the revised Impact Fee CapitalImprovements Plan. The boundary encompassing this area is illustrated by Map 1. Appendix A of this land useassumptions report provides the written description of the updated impact fee service area boundary for ordinancepurposes. The written description is the official service area description, not the map.
The Impact Fee “service area” defines the area to be used to calculate projected “service units” and the impact fee.
The service area for this 2007 update was reduced in size by eliminating land transferred since 2001 from the AustinETJ to other ETJ’s. The service area was increased in part to include property added to the ETJ since 2001, and wherenecessary, to include land adjacent to existing water or wastewater mains.
LUA-1
WILLIAMSONCOUNTY
BASTROPCOUNTY
A
C
C
2007 IMPACT FEE AND SERVICE AREA BOUNDARY
PLANNING AREAS 2007
AUSTIN ETJ JAN. 2007
[EJ COUNTY BOUNDARY
1 AUSTIN FULL PURPOSE CITY LIMIT
AUSTIN WATER UTILITYIMPACT FEE & SERVICE AREA BOUNDARY
YEAR 2007 UPDATE
MAP 1LUA-2
These land use assumptions anticipate that the impact fees to be calculated will be imposed uniformly over the entireservice area and will be calculated in a manner consistent with that premise. This is explicitly provided for by 1989amendments to Chapter 395 of the Local Government Code, which added Section 395.0455. This section reads in part:
System-Wide Land Use Assumptions.
(a) In lieu of adopting land use assumptions for each service area, a political subdivision may, except forstorm water, drainage, flood control and roadway facilities, adopt system-wide land use assumptions,which cover all of the area subject to the jurisdiction of the political subdivision for the purpose ofimposing impact fees under this chapter.
Another paragraph in this section further clarifies the requirements of state law:
(c) After adoption of system-wide land use assumptions, a political subdivision is not required to adoptadditional land use assumptions for a service area for water supply, treatment, and distribution facilitiesor wastewater collection and treatment facilities as a prerequisite to the adoption of a capitalimprovements plan or impact fee, provided the capital improvements plan and impact fee are consistentwith the system-wide land use assumptions.
III. GROWTH PROJECTIONS
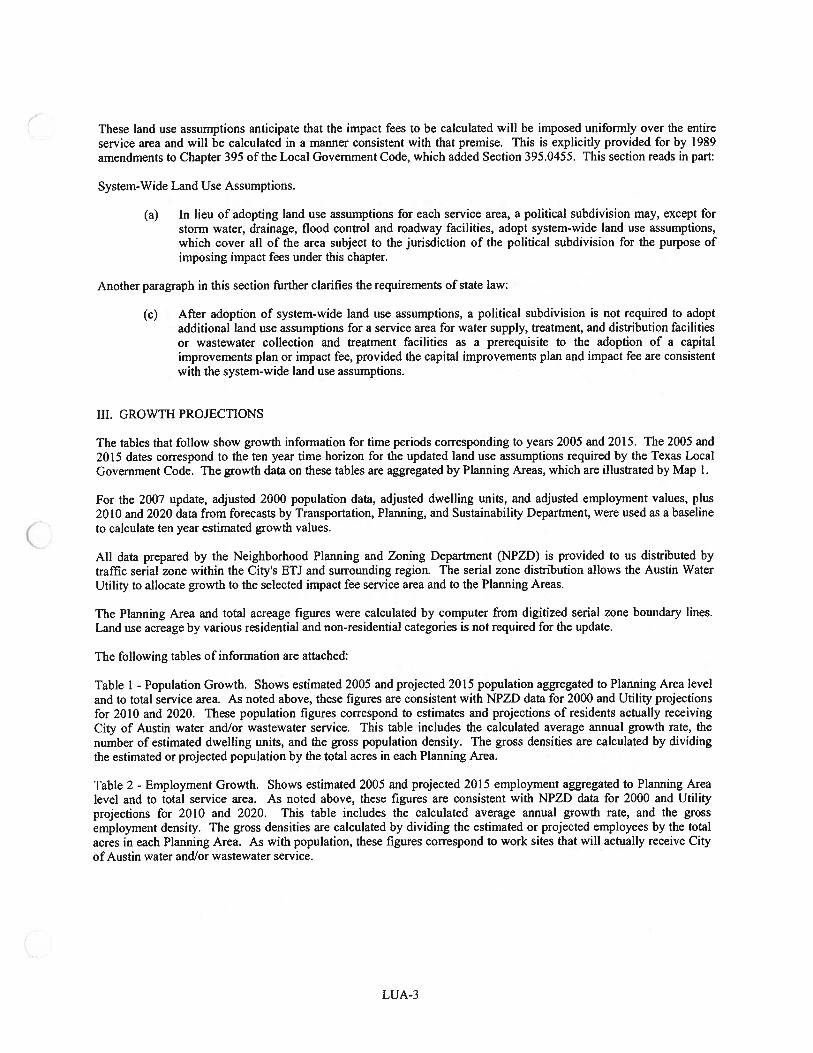
The tables that follow show growth information for time periods corresponding to years 2005 and 2015. The 2005 and2015 dates correspond to the ten year time horizon for the updated land use assumptions required by the Texas LocalGovernment Code. The growth data on these tables are aggregated by Planning Areas, which are illustrated by Map 1.
For the 2007 update, adjusted 2000 population data, adjusted dwelling units, and adjusted employment values, plus2010 and 2020 data from forecasts by Transportation, Planning, and Sustainability Department, were used as a baselineto calculate ten year estimated growth values.
All data prepared by the Neighborhood Planning and Zoning Department (NPZD) is provided to us distributed bytraffic serial zone within the City’s ETJ and surrounding region. The serial zone distribution allows the Austin WaterUtility to allocate growth to the selected impact fee service area and to the Planning Areas.
The Planning Area and total acreage figures were calculated by computer from digitized serial zone boundary lines.Land use acreage by various residential and non-residential categories is not required for the update.
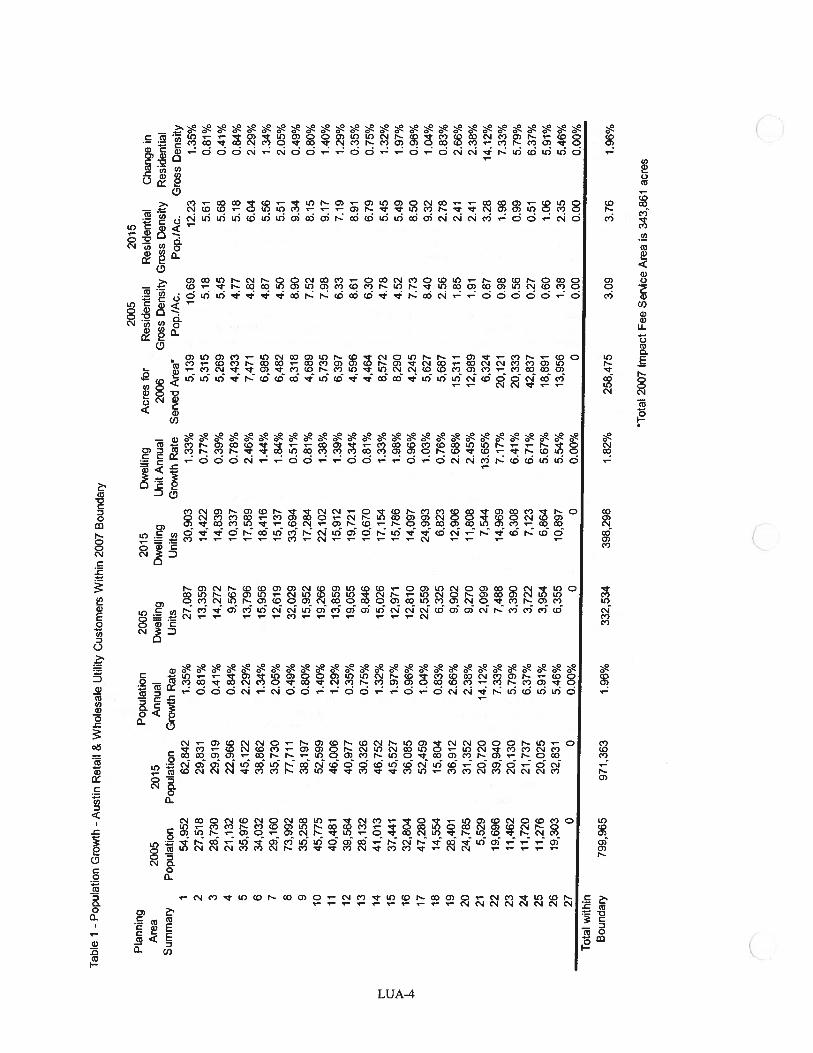
The following tables of information are attached:
Table 1 - Population Growth. Shows estimated 2005 and projected 2015 population aggregated to Planning Area leveland to total service area. As noted above, these figures are consistent with NPZD data for 2000 and Utility projectionsfor 2010 and 2020. These population figures correspond to estimates and projections of residents actually receivingCity of Austin water and/or wastewater service. This table includes the calculated average annual growth rate, thenumber of estimated dwelling units, and the gross population density. The gross densities are calculated by dividingthe estimated or projected population by the total acres in each Planning Area.
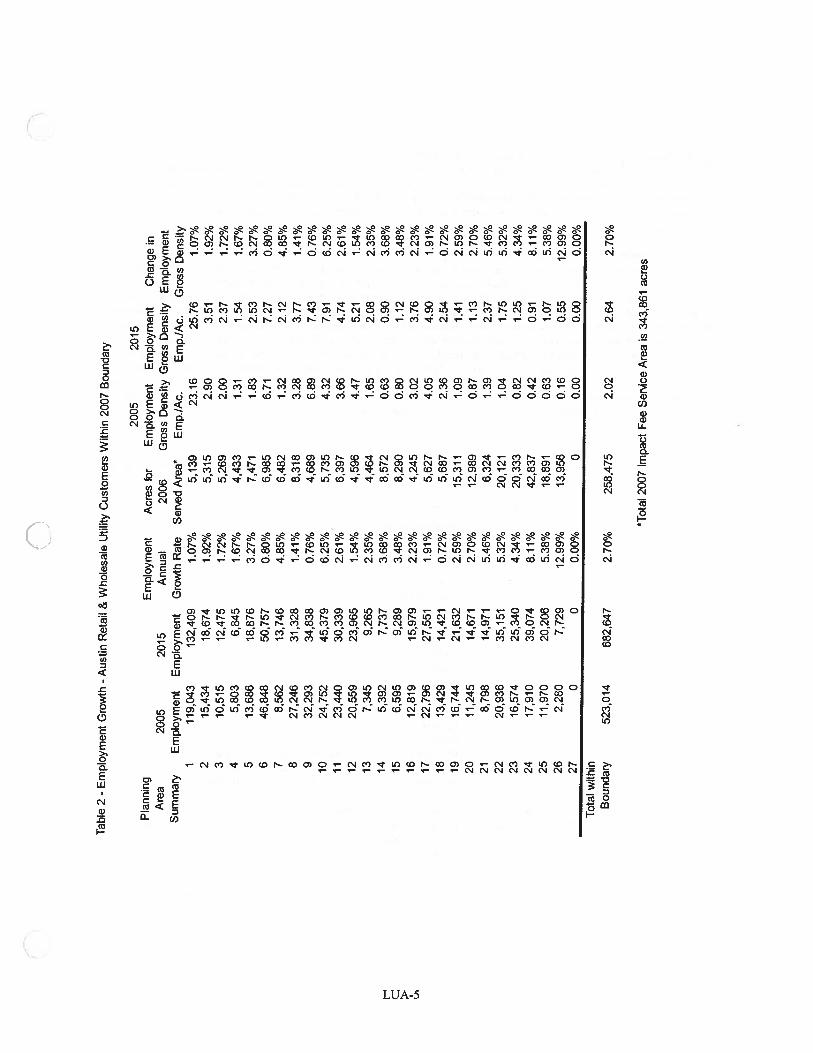
Table 2 - Employment Growth. Shows estimated 2005 and projected 2015 employment aggregated to Planning Arealevel and to total service area. As noted above, these figures are consistent with NPZD data for 2000 and Utilityprojections for 2010 and 2020. This table includes the calculated average annual growth rate, and the grossemployment density. The gross densities are calculated by dividing the estimated or projected employees by the totalacres in each Planning Area. As with population, these figures correspond to work sites that will actually receive Cityof Austin water and/or wastewater service.
LUA-3
Tab
leI
-P
opul
atio
nG
row
th..A
usti
nR
etai
l&
Who
lesa
leU
tility
Cus
tom
ers
With
in20
07B
ound
ary
2005
2015
Pla
nnin
gP
opul
atio
n20
0520
15D
wel
ling
Acr
esfo
rR
esid
enti
alR
esid
enti
alC
hang
ein
Are
a20
0520
15A
nnua
lD
wel
ling
Dw
ellin
gU
nit
Ann
ual
2006
Gro
ssD
ensi
tyG
ross
Den
sity
Res
iden
tial
Sum
mar
yP
opul
atio
nP
opul
atio
nG
row
thR
ate
Uni
tsU
nits
Gro
wth
Rat
eS
eed
Are
a*P
op./
Ac.
Pop
JAc.
Gro
ssD
ensi
ty1
54,9
5262
,842
1.35
%27
,087
30,9
031.
33%
5,13
910
.69
12.2
31.
35%
227
,518
29,8
310.
81%
13,3
5914
,422
0.77
%5,
315
5.18
5.61
0.81
%3
28,7
3029
,919
0.41
%14
,272
14,8
390.
39%
5,26
95.
455.
680.
41%
421
,132
22,9
660.
84%
9,56
710
,337
0.78
%4,
433
4.77
5.18
0.84
%5
35,9
7645
,122
2.29
%13
,796
17,5
892.
46%
7,47
14.
826.
042.
29%
634
,032
38,8
621.
34%
15,9
5618
,416
1.44
%6,
985
4.87
5.56
1.34
%7
29,1
6035
,730
2.05
%12
,619
15,1
371.
84%
6,48
24.
505.
512.
05%
873
,992
77,7
110.
49%
32,0
2933
,694
0.51
%8,
318
8.90
9.34
0.49
%9
35,2
5838
,197
0.80
%15
,952
17,2
840.
81%
4,68
97.
528.
150.
80%
1045
,775
52,5
991.
40%
19,2
6622
,102
1.38
%5,
735
7.98
9.17
1.40
%11
40,4
8146
,006
1.29
%13
,859
15.9
121.
39%
6,39
76.
337.
191.
29%
1239
,564
40,9
770.
35%
19.0
5519
,721
0.34
%4,
596
8.61
8.91
0.35
%13
28,1
3230
,326
0.75
%9,
846
10,6
700.
81%
4,46
46.
306.
790.
75%
1441
,013
46,7
521.
32%
15,0
2617
,154
1.33
%8,
572
4.78
5.45
1.32
%15
37,4
4145
,527
1.97
%12
,971
15,7
861.
98%
8,29
04.
525.
491.
97%
1632
,804
36,0
850.
96%
12,8
1014
,097
0.96
%4,
245
7.73
8.50
0.96
%17
47,2
8052
,459
1.04
%22
,559
24,9
931.
03%
5,62
78.
409.
321.
04%
1814
,554
15,8
040.
83%
6,32
56,
823
0.76
%5,
687
2.56
2.78
0.83
%19
28,4
0136
,912
2.66
%9,
902
12,9
062.
68%
15,3
111.
852.
412.
66%
2024
,785
31,3
522.
38%
9,27
011
,808
2.45
%12
,989
1.91
2.41
2.38
%21
5,52
920
,720
14.1
2%2,
099
7,54
413
.65%
6,32
40.
873.
2814
.12%
2219
,696
39,9
407.
33%
7,48
814
,969
7.17
%20
,121
0.98
1.98
7.33
%23
11,4
6220
,130
5.79
%3,
390
6,30
86.
41%
20,3
330.
560.
995.
79%
2411
,720
21,7
376.
37%
3,72
27,
123
6.71
%42
,837
0.27
0.51
6.37
%25
11,2
7620
,025
5.91
%3,
954
6,86
45.
67%
18,8
910.
601.
065.
91%
2619
,303
32,8
315.
46%
6,35
510
,897
5.54
%13
,956
1.38
2.35
5.46
%27
00
0.00
%0
00.
00%
00.
000.
000.
00%
Tot
alw
ithin
Bou
ndar
y79
9,96
597
1,36
31.
96%
332,
534
398,
298
1.82
%25
8,47
53.
093.
761.
96%
*Tot
al20
07Im
pact
Fee
Ser
vice
Are
ais
343,
861
acre
s
Tab
le2
-E
mpl
oym
ent
Gro
wth
-A
usti
nR
etai
l&
Who
lesa
leU
tility
Cus
tom
ers
With
in20
07B
ound
ary
2005
2015
Pla
nnin
gE
mpl
oym
ent
Acr
esfo
rE
mpl
oym
ent
Em
ploy
men
tC
hang
ein
Are
a20
0520
15A
nnua
l20
06G
ross
Den
sity
Gro
ssD
ensi
tyE
mpl
oym
ent
Sum
mar
yE
mpl
oym
ent
Em
ploy
men
tG
row
thR
ate
Sen
edA
rea*
Em
p./A
c.E
mp.
fAc.
Gro
ssD
ensi
ty1
119,
043
132,
409
1.07
%5,
139
23.1
625
.76
1.07
%2
15,4
3418
,674
1.92
%5,
315
2.90
3.51
1.92
%3
10515
12,4
751.
72%
5,26
92.
002.
371.
72%
45,
803
6,84
51.
67%
4,43
31.
311.
541.
67%
513
.686
18,8
763.
27%
7,47
11.
832.
533.
27%
646
,848
50,7
570.
80%
6,98
56.
717.
270.
80%
78,
562
13,7
464.
85%
6,48
21.
322.
124.
85%
827
,246
31,3
281.
41%
8,31
83.
283.
771.
41%
932
,293
34,8
380.
76%
4,68
96.
897.
430.
76%
1024
,752
45,3
796.
25%
5,73
54.
327.
916.
25%
1123
,440
30,3
392.
61°!
o6,
397
3.66
4.74
2.61
%12
20,5
5923
,965
1.54
%4,
596
4.47
5.21
1.54
%13
7,34
59,
265
2.35
%4,
464
1.65
2.08
2.35
%14
5,39
27,
737
3.68
%8,
572
0.63
0.90
3.68
%15
6,59
59,
289
3.48
%8,
290
0.80
1.12
3.48
%16
12,8
1915
,979
2.23
%4,
245
3.02
3.76
2.23
%17
22,7
9627
,551
1.91
%5,
627
4.05
4,90
1.91
%18
13,4
2914
,421
0.72
%5,
687
2.36
2.54
0.72
%19
16,7
4421
,632
2.59
%15
,311
1.09
1.41
2.59
%20
11,2
4514
,671
2.70
%12
,989
0.87
1.13
2.70
%21
8,79
814
,971
5.46
%6,
324
1.39
2.37
5.46
%22
20,9
3635
,151
5.32
%20
,121
1.04
1.75
5.32
%23
16,5
7425
,340
4.34
%20
,333
0.82
1.25
4.34
%24
17,9
1039
.074
8.11
%42
,837
0.42
0.91
8.11
%25
11,9
7020
,206
5.38
%18
,891
0.63
1.07
5.38
%26
2,28
07,
729
12.9
9%13
,956
0.16
0,55
12.9
9%27
00
0.00
%0
0.00
0.00
0.00
%T
otal
with
inB
ound
ary
523,
014
682,
647
2.70
%25
8,47
52.
022.
642.
70%
*Tot
al20
07Im
pact
Fee
SenA
ceA
rea
is34
3,86
1ac
res
IV. SERVICE UNITS
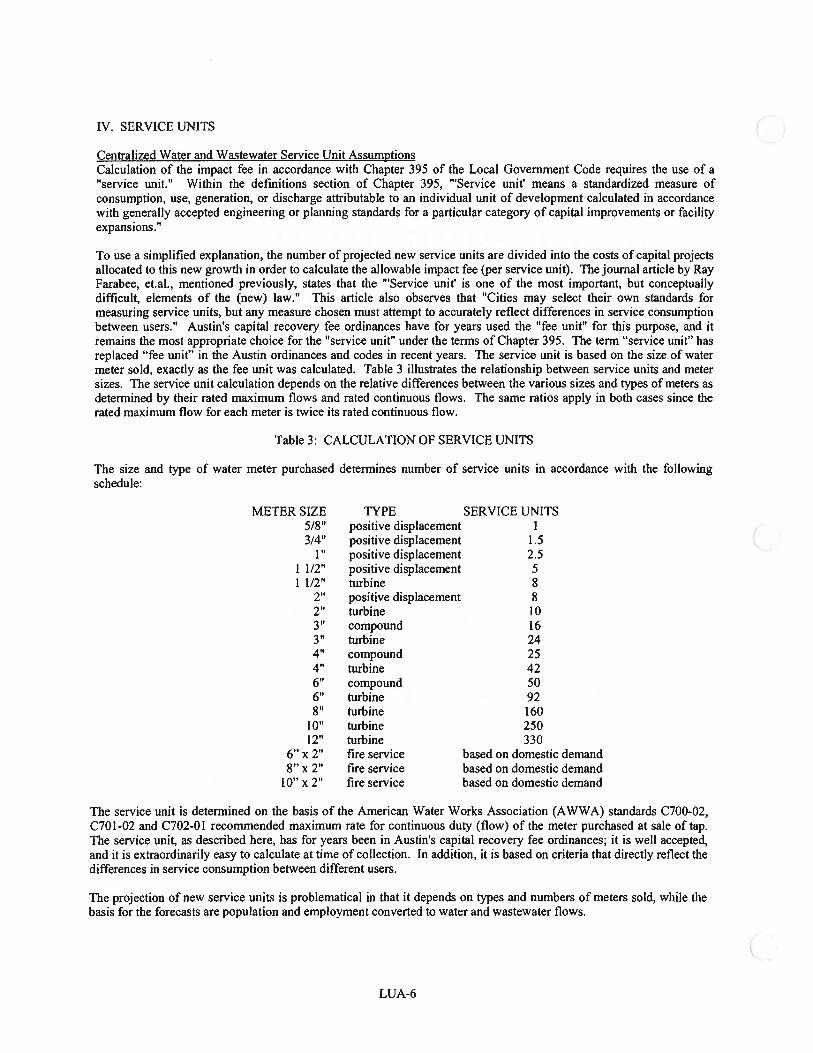
Centralized Water and Wastewater Service Unit AssumptionsCalculation of the impact fee in accordance with Chapter 395 of the Local Government Code requires the use of a“service unit.” Within the definitions section of Chapter 395, “Service unit’ means a standardized measure ofconsumption, use, generation, or discharge attributable to an individual unit of development calculated in accordancewith generally accepted engineering or planning standards for a particular category of capital improvements or facilityexpansions.”
To use a simplified explanation, the number of projected new service units are divided into the costs of capital projectsallocated to this new growth in order to calculate the allowable impact fee (per service unit). The journal article by RayFarabee, et.al., mentioned previously, states that the “Service unit’ is one of the most important, but conceptuallydifficult, elements of the (new) law.” This article also observes that “Cities may select their own standards formeasuring service units, but any measure chosen must attempt to accurately reflect differences in service consumptionbetween users.” Austin’s capital recovery fee ordinances have for years used the “fee unit” for this purpose, and itremains the most appropriate choice for the “service unit” under the terms of Chapter 395. The term “service unit” hasreplaced “fee unit” in the Austin ordinances and codes in recent years. The service unit is based on the size of watermeter sold, exactly as the fee unit was calculated. Table 3 illustrates the relationship between service units and metersizes. The service unit calculation depends on the relative differences between the various sizes and types of meters asdetermined by their rated maximum flows and rated continuous flows. The same ratios apply in both cases since therated maximum flow for each meter is twice its rated continuous flow.
Table 3: CALCULATION OF SERVICE UNITS
The size and type of water meter purchased determines number of service units in accordance with the followingschedule:
METER SIZE TYPE SERVICE UNITS5/8” positive displacement3/4” positive displacement 1.5
1” positive displacement 2.51 1/2” positive displacement 51 1/2” turbine 8
2” positive displacement 82” turbine 103t compound 163” turbine 244” compound 254” turbine 426” compound 506’ turbine 928” turbine 160
10” turbine 25012” turbine 330
6” x 2” fire service based on domestic demand8” x 2” fire service based on domestic demand
10” x 2” fire service based on domestic demand
The service unit is determined on the basis of the American Water Works Association (AWWA) standards C700-02,C70 1-02 and C702-0 1 recommended maximum rate for continuous duty (flow) of the meter purchased at sale of tap.The service unit, as described here, has for years been in Austin’s capital recovery fee ordinances; it is well accepted,and it is extraordinarily easy to calculate at time of collection. In addition, it is based on criteria that directly reflect thedifferences in service consumption between different users.
The projection of new service units is problematical in that it depends on types and numbers of meters sold, while thebasis for the forecasts are population and employment converted to water and wastewater flows.
CLUA-6
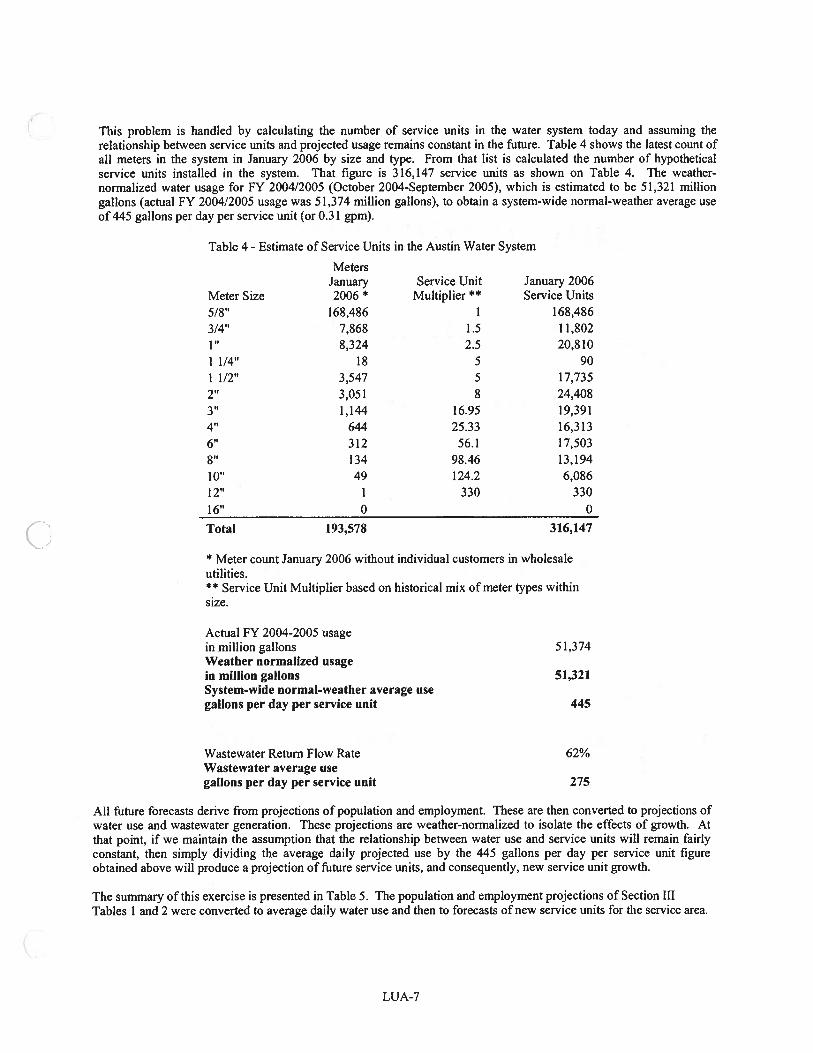
This problem is handled by calculating the number of service units in the water system today and assuming therelationship between service units and projected usage remains constant in the future. Table 4 shows the latest count ofall meters in the system in January 2006 by size and type. From that list is calculated the number of hypotheticalservice units installed in the system. That figure is 316,147 service units as shown on Table 4. The weather-normalized water usage for FY 2004/2005 (October 2004-September 2005), which is estimated to be 51,321 milliongallons (actual FY 2004/2005 usage was 51,374 million gallons), to obtain a system-wide normal-weather average useof 445 gallons per day per service unit (or 0.31 gpm).
Table 4 - Estimate of Service Units in the Austin Water System
MetersJanuary Service Unit January 2006
Meter Size 2006 * Multiplier ** Service Units5/8” 168,486 1 168,4863/4” 7,868 1.5 11,8021’ 8,324 2.5 20,8101 1/4” 18 5 901 1/2” 3,547 5 17,7352’ 3,051 8 24,4083” 1,144 16.95 19,3914” 644 25.33 16,3136” 312 56.1 17,5038” 134 98.46 13,19410” 49 124.2 6,08612” 1 330 330
16’ 0 0
Total 193,578 316,147
* Meter count January 2006 without individual customers in wholesaleutilities.** Service Unit Multiplier based on historical mix of meter types withinsize.
Actual FY 2004-2005 usagein million gallons 51,374Weather normalized usagein million gallons 51,321System-wide normal-weather average usegallons per day per service unit 445
Wastewater Return Flow Rate 62%Wastewater average usegallons per day per service unit 275
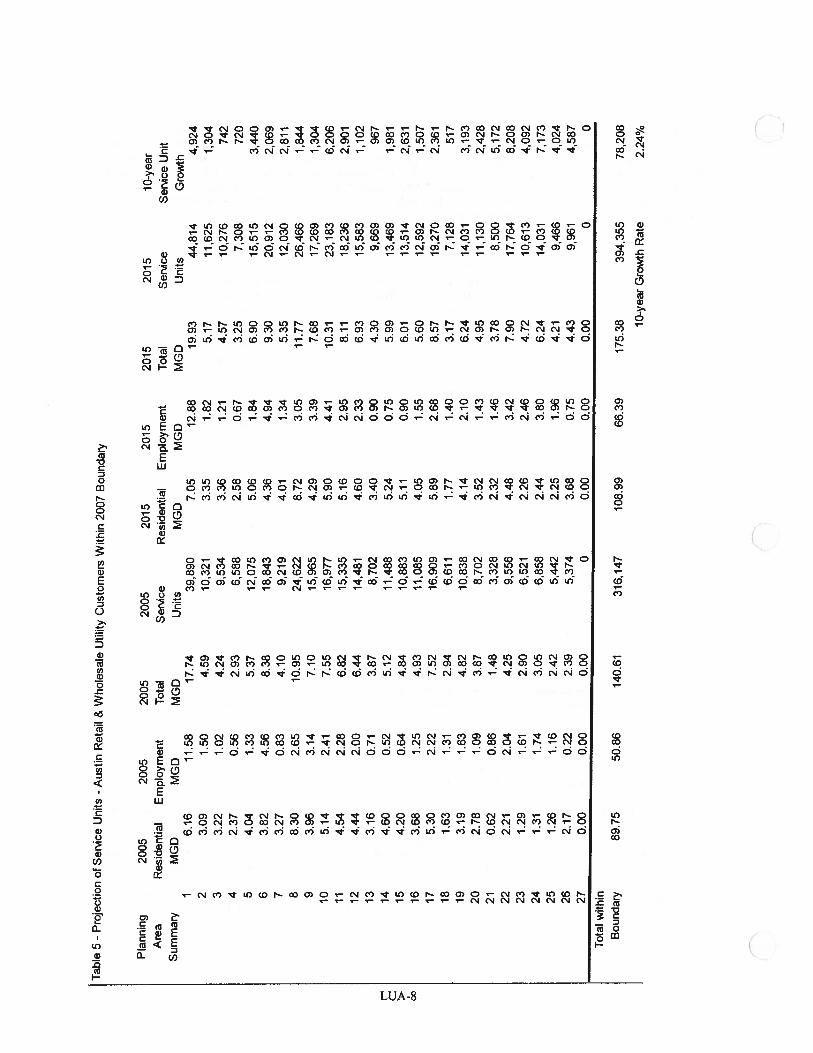
All future forecasts derive from projections of population and employment. These are then converted to projections ofwater use and wastewater generation. These projections are weather-normalized to isolate the effects of growth. Atthat point, if we maintain the assumption that the relationship between water use and service units will remain fairlyconstant, then simply dividing the average daily projected use by the 445 gallons per day per service unit figureobtained above will produce a projection of future service units, and consequently, new service unit growth.
The summary of this exercise is presented in Table 5. The population and employment projections of Section IIITables I and 2 were converted to average daily water use and then to forecasts of new service units for the service area.
LUA-7
Tab
le5
-Pr
ojec
tion
ofS
erc
eU
nits
-A
ustin
Ret
ail
&W
hole
sale
Util
ityC
usto
mer
sW
ithin
2007
Bou
ndar
y
Plan
ning
2005
2005
2005
2005
2015
2015
2015
2015
10-y
ear
Are
aR
esid
enti
alE
mpl
oym
ent
Tota
lS
eric
eR
esid
enti
alE
mpl
oym
ent
Tot
alSe
rvic
eSe
rvic
eU
nit
Sum
mar
yM
GD
MG
DM
GD
Uni
tsM
GD
MG
DM
GD
Uni
tsG
row
th1
6.16
11.5
817
.74
39,8
907.
0512
.88
19.9
344
,814
4,92
42
3.09
1.50
4.59
10,3
213.
351.
825.
1711
,625
1,30
43
3.22
1.02
4.24
9534
3.36
1.21
4.57
10,2
7674
24
2.37
0.56
2.93
6,58
82.
580.
673.
257,
308
720
54.
041.
335.
3712
,075
5.06
1.84
6.90
15,5
153,
440
63.
824.
568.
3818
,843
4.36
4.94
9.30
20,9
122,
069
73.
270.
834.
109,
219
4.01
1.34
5.35
12,0
302,
811
88.
302.
6510
.95
24,6
228.
723.
0511
.77
26,4
661,
844
93.
963.
147.
1015
,965
4.29
3.39
7.68
17,2
691,
304
105.
142.
417.
5516
,977
5.90
4.41
10.3
123
,183
6,20
611
4.54
2.28
6.82
15,3
355.
162.
958.
1118
,236
2,90
112
4.44
2.00
6.44
14,4
814.
602.
336.
9315
,583
1,10
213
3.16
0.71
3.87
8,70
23.
400.
904.
309,
669
967
144.
600.
525.
1211
,488
5.24
0.75
5.99
13,4
691,
981
154.
200.
644.
8410
,883
5.11
0.90
6.01
13,5
142,
631
co16
3.68
1.25
4.93
11,0
854.
051.
555.
6012
,592
1,50
717
5.30
2.22
7.52
16,9
095.
892.
688.
5719
,270
2,36
118
1.63
1.31
2.94
6,61
11.
771.
403.
177,
128
517
193.
191.
634.
8210
,838
4.14
2.10
6.24
14,0
313,
193
202.
781.
093.
878,
702
3.52
1.43
4.95
11,1
302,
428
210.
620.
861.
483,
328
2.32
1.46
3.78
8,50
05,
172
222.
212.
044.
259,
556
4.48
3.42
7.90
17,7
648,
208
231.
291.
612.
906,
521
2.26
2.46
4.72
10,6
134,
092
241.
311.
743.
056,
353
2.44
3.80
6.24
14,0
317,
173
251.
261.
162.
425,
442
2.25
1.96
4.21
9,46
64,
024
262,
170.
222.
395,
374
3.68
0.75
4.43
9,96
14,
587
270.
000.
000.
000
0.00
0.00
0.00
00
Tot
alw
ithin
Bou
ndar
y89
.75
50.8
614
0.61
316,
147
108.
9966
.39
175.
3839
4,35
578
,208
10-y
ear
Gro
wth
Rat
e2.
24%
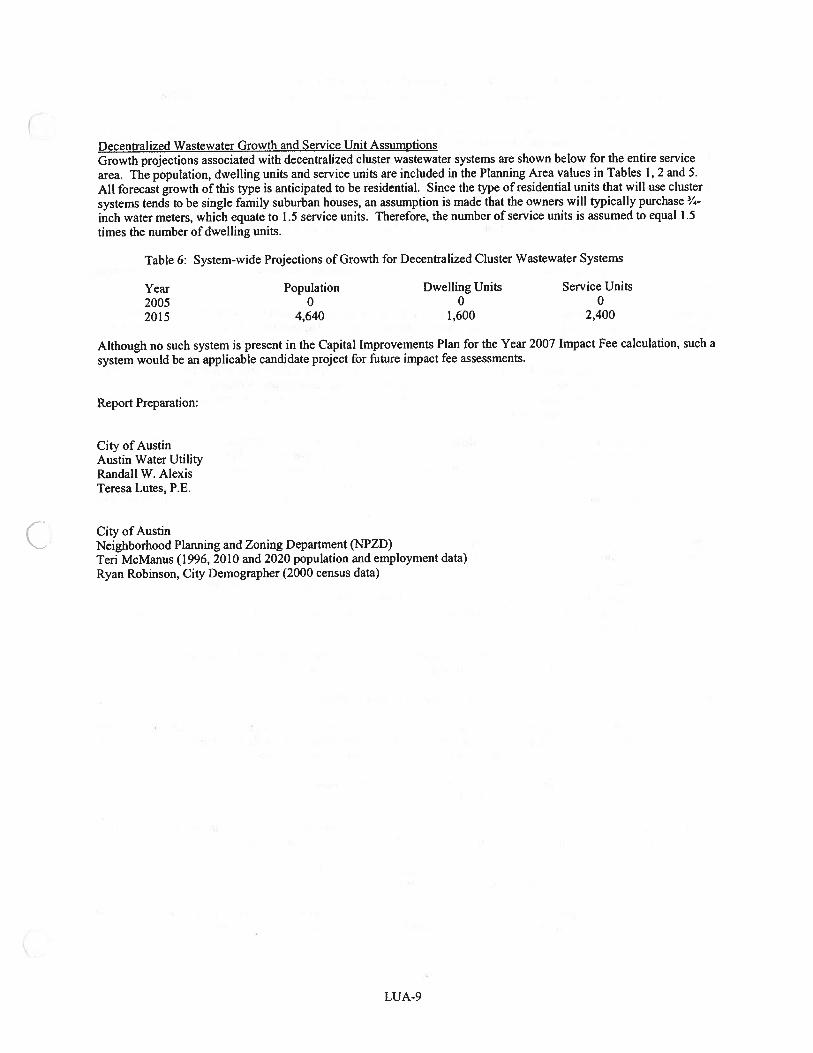
Decentralized Wastewater Growth and Service Unit AssumptionsGrowth projections associated with decentralized cluster wastewater systems are shown below for the entire servicearea. The population, dwelling units and service units are included in the Planning Area values in Tables 1, 2 and 5.All forecast growth of this type is anticipated to be residential. Since the type of residential units that will use clustersystems tends to be single family suburban houses, an assumption is made that the owners will typically purchase 3/4
inch water meters, which equate to 1.5 service units. Therefore, the number of service units is assumed to equal 1.5times the number of dwelling units.
Table 6: System-wide Projections of Growth for Decentralized Cluster Wastewater Systems
Year Population Dwelling Units Service Units2005 0 0 02015 4,640 1,600 2,400
Although no such system is present in the Capital Improvements Plan for the Year 2007 Impact Fee calculation, such asystem would be an applicable candidate project for future impact fee assessments.
Report Preparation:
City of AustinAustin Water UtilityRandall W. AlexisTeresa Lutes, P.E.
City of AustinNeighborhood Planning and Zoning Department (NPZD)Ten McManus (1996, 2010 and 2020 population and employment data)Ryan Robinson, City Demographer (2000 census data)
LUA-9
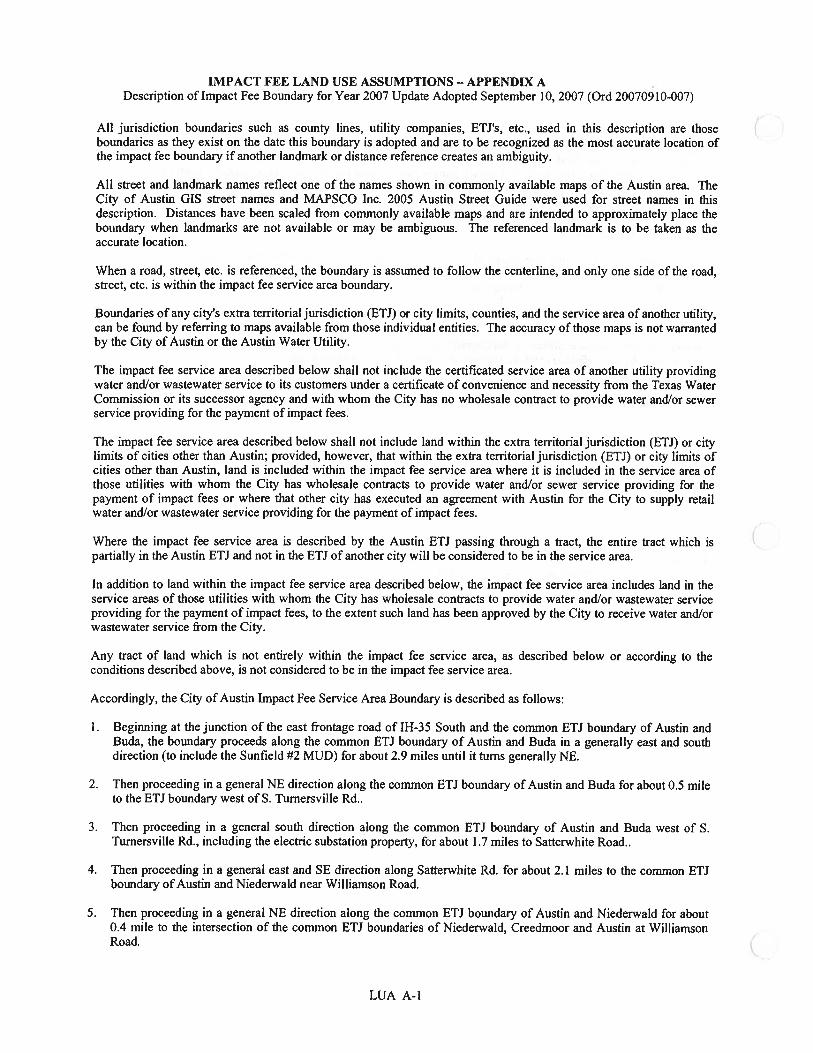
IMPACT FEE LAND USE ASSUMPTIONS - APPENDIX ADescription of Impact Fee Boundary for Year 2007 Update Adopted September 10, 2007 (Ord 20070910-007)
All jurisdiction boundaries such as county lines, utility companies, ETJs, etc., used in this description are thoseboundaries as they exist on the date this boundary is adopted and are to be recognized as the most accurate location ofthe impact fee boundary if another landmark or distance reference creates an ambiguity.
All Street and landmark names reflect one of the names shown in commonly available maps of the Austin area. TheCity of Austin GIS street names and MAPSCO Inc. 2005 Austin Street Guide were used for Street names in thisdescription. Distances have been scaled from commonly available maps and are intended to approximately place theboundary when landmarks are not available or may be ambiguous. The referenced landmark is to be taken as theaccurate location.
When a road, street, etc. is referenced, the boundary is assumed to follow the centerline, and only one side of the road,street, etc. is within the impact fee service area boundary.
Boundaries of any city’s extra territorial jurisdiction (ETJ) or city limits, counties, and the service area of another utility,can be found by referring to maps available from those individual entities. The accuracy of those maps is not warrantedby the City of Austin or the Austin Water Utility.
The impact fee service area described below shall not include the certificated service area of another utility providingwater and/or wastewater service to its customers under a certificate of convenience and necessity from the Texas WaterCommission or its successor agency and with whom the City has no wholesale contract to provide water and/or sewerservice providing for the payment of impact fees.
The impact fee service area described below shall not include land within the extra territorial jurisdiction (ETJ) or citylimits of cities other than Austin; provided, however, that within the extra territorial jurisdiction (ETJ) or city limits ofcities other than Austin, land is included within the impact fee service area where it is included in the service area ofthose utilities with whom the City has wholesale contracts to provide water and/or sewer service providing for thepayment of impact fees or where that other city has executed an agreement with Austin for the City to supply retailwater and/or wastewater service providing for the payment of impact fees.
Where the impact fee service area is described by the Austin ETJ passing through a tract, the entire tract which is (partially in the Austin ETJ and not in the ETJ of another city will be considered to be in the service area.
In addition to land within the impact fee service area described below, the impact fee service area includes land in theservice areas of those utilities with whom the City has wholesale contracts to provide water and/or wastewater serviceproviding for the payment of impact fees, to the extent such land has been approved by the City to receive water and/orwastewater service from the City.
Any tract of land which is not entirely within the impact fee service area, as described below or according to theconditions described above, is not considered to be in the impact fee service area.
Accordingly, the City of Austin Impact Fee Service Area Boundary is described as follows:
I. Beginning at the junction of the east frontage road of IH-35 South and the common ETJ boundary of Austin andBuda, the boundary proceeds along the common ETJ boundary of Austin and Buda in a generally east and southdirection (to include the Sunfield #2 MUD) for about 2.9 miles until it turns generally NE.
2. Then proceeding in a general NE direction along the common ETJ boundary of Austin and Buda for about 0.5 mileto the ETJ boundary west of S. Tumersville Rd..
3. Then proceeding in a general south direction along the common ETJ boundary of Austin and Buda west of S.Turnersville Rd., including the electric substation property, for about 1.7 miles to Satterwhite Road..
4. Then proceeding in a general east and SE direction along Satterwhite Rd. for about 2.1 miles to the common ETJboundary of Austin and Niederwald near Williamson Road.
5. Then proceeding in a general NE direction along the common ETJ boundary of Austin and Niederwald for about0.4 mile to the intersection of the common ETJ boundaries of Niederwald, Creedmoor and Austin at WilliamsonRoad. (
LUA A-i
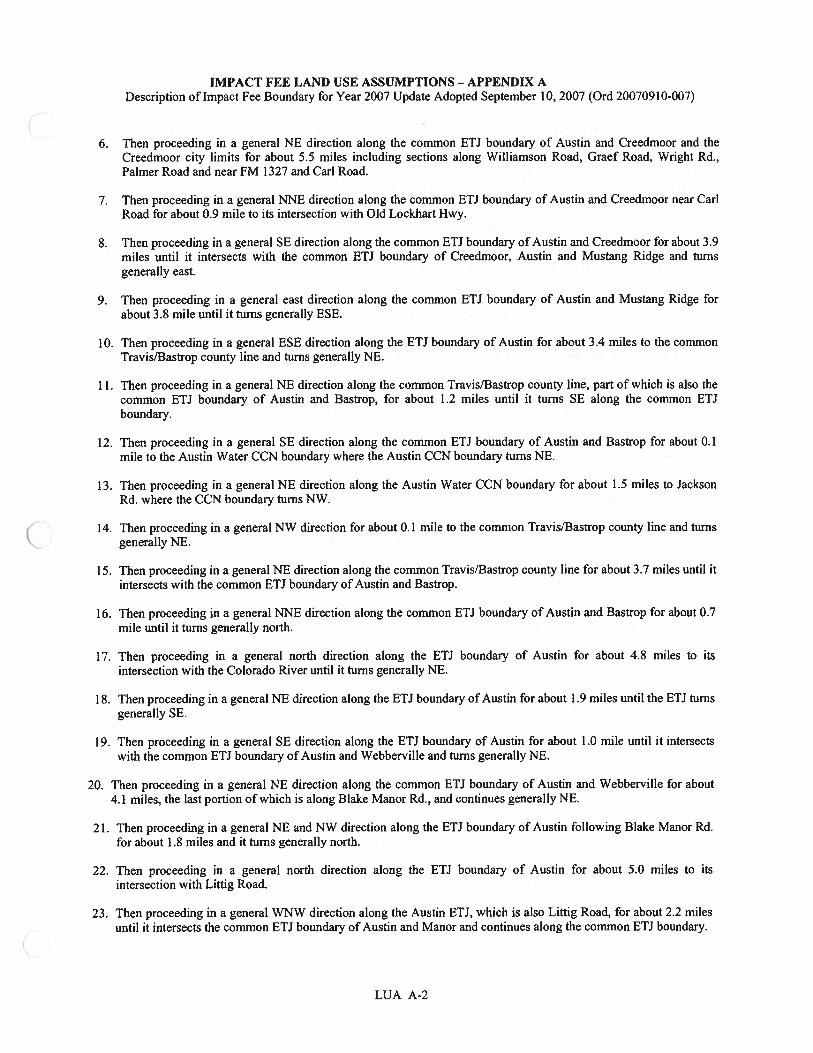
IMPACT FEE LAND USE ASSUMPTIONS APPENDIX ADescription of Impact Fee Boundary for Year 2007 Update Adopted September 10, 2007 (Ord 20070910-007)
6. Then proceeding in a general NE direction along the common ETJ boundary of Austin and Creedmoor and theCreedmoor city limits for about 5.5 miles including sections along Williamson Road, Graef Road, Wright Rd.,Palmer Road and near FM 1327 and Carl Road.
7. Then proceeding in a general NNE direction along the common ETJ boundary of Austin and Creedmoor near CarlRoad for about 0.9 mile to its intersection with Old Lockhart Hwy.
8. Then proceeding in a general SE direction along the common ETJ boundary of Austin and Creedmoor for about 3.9miles until it intersects with the common ETJ boundary of Creedmoor, Austin and Mustang Ridge and turnsgenerally east.
9. Then proceeding in a general east direction along the common ETJ boundary of Austin and Mustang Ridge forabout 3.8 mile until it turns generally ESE.
10. Then proceeding in a general ESE direction along the ETJ boundary of Austin for about 3.4 miles to the commonTravis/Bastrop county line and turns generally NE.
11. Then proceeding in a general NE direction along the common Travis/Bastrop county line, part of which is also thecommon ETJ boundary of Austin and Bastrop, for about 1.2 miles until it turns SE along the common ETJboundary.
12. Then proceeding in a general SE direction along the common ETJ boundary of Austin and Bastrop for about 0.1mile to the Austin Water CCN boundary where the Austin CCN boundary turns NE.
13. Then proceeding in a general NE direction along the Austin Water CCN boundary for about 1.5 miles to JacksonRd. where the CCN boundary turns NW.
14. Then proceeding in a general NW direction for about 0.1 mile to the common Travis/Bastrop county line and turnsgenerally NE.
15. Then proceeding in a general NE direction along the common Travis/Bastrop county line for about 3.7 miles until itintersects with the common ETJ boundary of Austin and Bastrop.
16. Then proceeding in a general NNE direction along the common ETJ boundary of Austin and Bastrop for about 0.7mile until it turns generally north.
17. Then proceeding in a general north direction along the ETJ boundary of Austin for about 4.8 miles to itsintersection with the Colorado River until it turns generally NE.
18. Then proceeding in a general NE direction along the ETJ boundary of Austin for about 1.9 miles until the ETJ turnsgenerally SE.
19. Then proceeding in a general SE direction along the ETJ boundary of Austin for about 1.0 mile until it intersectswith the common ETJ boundary of Austin and Webberville and turns generally NE.
20. Then proceeding in a general NE direction along the common ETJ boundary of Austin and Webberville for about4.1 miles, the last portion of which is along Blake Manor Rd., and continues generally NE.
21. Then proceeding in a general NE and NW direction along the ETJ boundary of Austin following Blake Manor Rd.for about 1.8 miles and it turns generally north.
22. Then proceeding in a general north direction along the ETJ boundary of Austin for about 5.0 miles to itsintersection with Littig Road.
23. Then proceeding in a general WNW direction along the Austin ETJ, which is also Littig Road, for about 2.2 milesuntil it intersects the common ETJ boundary of Austin and Manor and continues along the common ETJ boundary.
LUA A-2
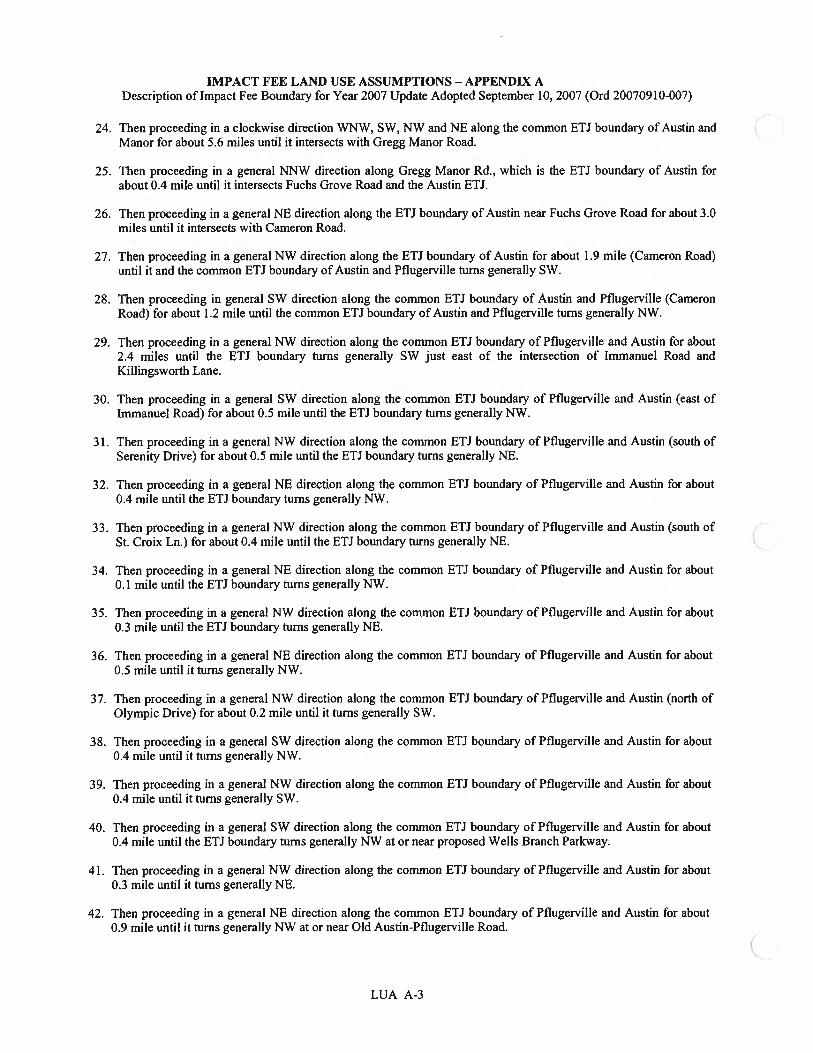
IMPACT FEE LAND USE ASSUMPTIONS - APPENDIX ADescription of Impact Fee Boundary for Year 2007 Update Adopted September 10, 2007 (Ord 20070910-007)
24. Then proceeding in a clockwise direction WNW, SW, NW and NE along the common ETJ boundary of Austin andManor for about 5.6 miles until it intersects with Gregg Manor Road.
25. Then proceeding in a general NNW direction along Gregg Manor Rd., which is the ETJ boundary of Austin forabout 0.4 mile until it intersects Fuchs Grove Road and the Austin ETJ.
26. Then proceeding in a general NE direction along the ETJ boundary of Austin near Fuchs Grove Road for about 3.0miles until it intersects with Cameron Road.
27. Then proceeding in a general NW direction along the ETJ boundary of Austin for about 1.9 mile (Cameron Road)until it and the common ETJ boundary of Austin and Pflugerville turns generally SW.
28. Then proceeding in general SW direction along the common ETJ boundary of Austin and Pflugerville (CameronRoad) for about 1.2 mile until the common ETJ boundary of Austin and Pflugerville turns generally NW.
29. Then proceeding in a general NW direction along the common ETJ boundary of Pflugerville and Austin for about2.4 miles until the ETJ boundary turns generally SW just east of the intersection of Immanuel Road andKillingsworth Lane.
30. Then proceeding in a general SW direction along the common ETJ boundary of Pflugerville and Austin (east oflmmanuel Road) for about 0.5 mile until the ETJ boundary turns generally NW.
31. Then proceeding in a general NW direction along the common ETJ boundary of Pflugerville and Austin (south ofSerenity Drive) for about 0.5 mile until the ETJ boundary turns generally NE.
32. Then proceeding in a general NE direction along the common ETJ boundary of Pflugerville and Austin for about0.4 mile until the ETJ boundary turns generally NW.
33. Then proceeding in a general NW direction along the common ETJ boundary of Pflugerville and Austin (south ofSt. Croix Ln.) for about 0.4 mile until the ETJ boundary turns generally NE.
34. Then proceeding in a general NE direction along the common ETJ boundary of Pflugerville and Austin for about0.1 mile until the ETJ boundary turns generally NW.
35. Then proceeding in a general NW direction along the common ETJ boundary of Pflugerville and Austin for about0.3 mile until the ETJ boundary turns generally NE.
36. Then proceeding in a general NE direction along the common ETJ boundary of Pflugerville and Austin for about0.5 mile until it turns generally NW.
37. Then proceeding in a general NW direction along the common ETJ boundary of Pflugerville and Austin (north ofOlympic Drive) for about 0.2 mile until it turns generally SW.
38. Then proceeding in a general SW direction along the common ETJ boundary of Pflugerville and Austin for about0.4 mile until it turns generally NW.
39. Then proceeding in a general NW direction along the common ETJ boundary of Pflugerville and Austin for about0.4 mile until it turns generally SW.
40. Then proceeding in a general SW direction along the common ETJ boundary of Pflugerville and Austin for about0.4 mile until the ETJ boundary turns generally NW at or near proposed Wells Branch Parkway
41. Then proceeding in a general NW direction along the common ETJ boundary of Pflugerville and Austin for about0.3 mile until it turns generally NE.
42. Then proceeding in a general NE direction along the common ETJ boundary of Pflugerville and Austin for about0.9 mile until it turns generally NW at or near Old Austin-Pflugerville Road.
LUA A-3
IMPACT FEE LAND USE ASSUMPTIONS - APPENDIX ADescription of Impact Fee Boundary for Year 2007 Update Adopted September 10, 2007 (Ord 20070910-007)
43. Then proceeding in a general NW direction along the common ETJ boundary of Pflugerville and Austin (OldAustin-Pflugerville Road, Pecan St. and FM 1825) for about 0.7 mile until the ETJ boundary turns generally NE.
44. Then proceeding in a general NE direction along the common ETJ boundary of Pflugerville and Austin (also alongor near Central Commerce Dr. and West Pflugerville Loop) for about 0.5 mile until the ETJ boundary turnsgenerally WNW.
45. Then proceeding in a general WNW direction along the common ETJ boundary of Pflugerville and Austin forabout 0.2 mile until the ETJ boundary turns generally west at or near White River Blvd.
46. Then proceeding in a general west direction along the common ETJ boundary of Pflugerville and Austin (alsoalong or near Grand Avenue Parkway) for about 0.2 mile until the ETJ boundary turns generally NNW.
47. Then proceeding in general NNW and NNE directions along the common ETJ boundary of Pflugerville and Austinfor about 0.3 mile until the ETJ boundary turns generally NW at or near Royston Lane.
48. Then proceeding in a general WNW direction along the common ETJ boundary of Pflugerville and Austin (alsoalong or near Royston Lane) for about 0.1 mile until the ETJ boundary turns generally NW.
49. Then proceeding in a general north direction along the common ETJ boundary of Pflugerville and Austin (alsoalong or near Central Commerce Dr.) for about 0.2 mile until the ETJ boundary turns generally NW.
50. Then proceeding in a general WNW direction along the common ETJ boundary of Pflugerville and Austin (alsoalong or near Picadilly Dr.) for about 0.7 mile until the ETJ boundary turns generally NW.
51. Then proceeding in general NW and west directions along the common ETJ boundary of Round Rock and Austinfor about 0.4 mile until the ETJ boundary turns generally SSW at or near Bratton Lane.
52. Then proceeding in a general SSW direction along the common ETJ boundary of Round Rock and Austin for about0.2 mile (along or near Bratton Lane) until the ETJ boundary turns generally WNW.
53. Then proceeding in a general WNW direction along the common ETJ boundary of Round Rock and Austin forabout 0.2 mile until it turns generally NNE.
54. Then proceeding in a general NNE direction along the common ETJ boundary of Round Rock and Austin for about0.2 mile until it turns generally WNW.
55. Then proceeding in a general WNW direction along the common ETJ boundary of Round Rock and Austin forabout 0.7 mile until it turns generally NW at or near FM 1325.
56. Then proceeding in a general NW direction along the common ETJ boundary of Round Rock and Austin for about0.2 mile until it turns generally west in the vicinity of SH 45.
57. Then proceeding in a general west direction along the common ETJ boundary of Round Rock and Austin for about1.0 mile until it turns generally SW at or near McNeil Road.
58. Then proceeding in a general SW direction along the common ETJ boundary of Round Rock and Austin (and alsoalong or near McNeil Road) for less than 0.1 mile until it turns generally WNW.
59. Then proceeding in a general WNW direction along the common ETJ boundary of Round Rock and Austin forabout 0.1 mile until it turns generally NNW.
60. Then proceeding in a general NNW direction along the common ETJ boundary of Round Rock and Austin forabout 2.1 miles until it turns generally SW at or near RM 620.
61. Then proceeding in a general SW direction along the common ETJ boundary of Round Rock and Austin (and alsoalong or near RM 620) for about 0.8 mile until it turns generally SSE.
LUA A-4
IMPACT FEE LAND USE ASSUMPTIONS - APPENDIX ADescription of Impact Fee Boundary for Year 2007 Update Adopted September 10, 2007 (Ord 20070910-007)
62. Then proceeding in a general SSE direction along the common ETJ boundary of Round Rock and Austin (and alsoalong the boundary of the Brushy Creek MUD) for about 0.8 mile until it turns generally WSW.
63. Then proceeding in a general WSW direction along the common ETJ boundary of Round Rock and Austin(and also along the boundary of the Brushy Creek MUD) for about 0.6 mile until it turns generally NNW.
64. Then proceeding in a general NNW direction along the common ETJ boundary of Round Rock and Austin (andalso along the boundary of the Brushy Creek MUD) for about 0.3 mile until it turns generally SW at or near RM620.
65. Then proceeding in a general SW direction along the common ETJ boundary of Round Rock and Austin (and alsoalong or near RM 620 and the boundary of Brushy Creek MUD) for about 0.6 mile until it turns generally NNW.
66. Then proceeding in a general NNW direction along the common ETJ boundary of Round Rock and Austin (andalso along the boundary of Brushy Creek MUD) for about 0.2 mile until it turns generally WSW.
67. Then proceeding in a general WSW direction along the common ETJ boundary of Round Rock and Austin (andalso along the boundary of Brushy Creek MUD) for about 0.2 mile until it turns generally NNW.
68. Then proceeding in a general NNW direction along the common ETJ boundary of Round Rock and Austin (andalso along the boundary of Brushy Creek MUD) for about 1.1 mile until it turns generally ENE.
69. Then proceeding in a general ENE direction along the common ETJ boundary of Round Rock and Austin (and alsoalong the boundary of Brushy Creek MUD) for about 0.3 mile until it turns generally NNW.
70. Then proceeding in a general NNW direction along the common ETJ boundary of Round Rock and Austin (andalso along the boundary of Brushy Creek MUD and Fern Bluff MUD) for about 1.3 mile until it turns generallyWSW at or near Brushy Creek Road.
71. Then proceeding in a general WSW direction along the northern ETJ boundary of Austin that also generallymeanders alongside South Brushy Creek, for about 5.0 miles until it turns generally SW at or near US 183.
72. Then proceeding along US 183 North, also called South Bell Blvd., which marks the common ETJ boundary ofCedar Park and Austin for about 0.8 mile until it turns generally WSW.
73. Then proceeding in a general WSW direction along the common ETJ boundary of Cedar Park and Austin for about0.8 mile until it turns generally SSE.
74. Then proceeding in a general SSE direction along the common ETJ boundary of Cedar Park and Austin for about0.8 mile until it intersects FM 620 North.
75. Then proceeding in a general WSW direction along FM 620 North, which marks the common ETJ boundary ofCedar Park and Austin for about 1.1 mile until it intersects with FM 2769.
76. Then proceeding in general WNW direction along FM 2769, which marks the common ETJ boundary of CedarPark and Austin for about 0.9 mile until it turns generally SW along FM 2769.
77. Then proceeding in a general WSW direction along FM 2769 (part of which marks the common ETJ boundary ofCedar Park and Austin) for about 2.7 miles until it intersects with Bullick Hollow Rd.
78. Then proceeding in a general SSE direction along Bullick Hollow Rd. for about 3.0 miles until it intersects with theAustin full purpose city limits as of November 2006 near FM 620.
79. Then proceeding in a general SSW and WSW direction along the full purpose city limits (to include lots annexedfor full purpose fronting on FM 620) for about 0.9 mile until the end of the full purpose city limits along FM 620.
80. Then proceeding in a general SSW direction along the west boundary of Cortana for about 2.7 miles until it turnsgenerally SE.
LUA A-S
IMPACT FEE LAND USE ASSUMPTIONS - APPENDIX ADescription of Impact Fee Boundary for Year 2007 Update Adopted September 10, 2007 (Ord 200709 10-007)
81 Then proceeding in a general SE direction along the west boundary of Cortana for about 0.3 mile until it turns
generally SSW.
82. Then proceeding in a general SSW direction along the west boundary of Cortana for about 1.5 mile until itintersects the Colorado River.
83. Then proceeding in a general WSW direction upstream along t he Colorado River, along the border of Commons
Ford Park, for about 0.3 mile..
84. Then proceeding in a general SW direction upstream along the Colorado River, along the border of the Balfour
Tract, for about 1.0 mile.
85. Then proceeding in a general SSE and SSW direction along the common ETJ boundary of Austin and Bee Caves
(which is the border of the Balfour Tract), for about 0.9 mile, until it turns generally SSE.
86. Then proceeding in a general SSE direction along the common ETJ boundary of Austin and Bee Caves (which is
the border of the Balfour Tract), for about 0.7 mile, until it intersects FM 2244.
87. Then proceeding in a general east direction along FM 2244 for about 0.1 mile until it intersects the eastern
boundary of the Balfour Tract.
88. Then proceeding in a general NNE direction along the border of the Balfour Tract for about 1.6 mile until it turns
generally SE.
89. Then proceeding in a general SE direction along the border of the Balfour Tract and Commons Ford Ranch Park
for about 0.2 mile to the south corner of Commons Ford Ranch Park.
90. Then proceeding in a general NNE direction along the border of Commons Ford Ranch Park for about 0.3 mile
until it turns generally north in an arc.
91. Then proceeding in an approximate arc, following the boundary of Commons Ford Ranch Park for about 0.6 mile
as it turns from north to NE.
92. Then proceeding in a general NNW direction along the border of Commons Ford Ranch Park for about 0.3 mile
until it intersects the Colorado River.
93. Then proceeding in a general NE direction downstream along the Colorado River for about 1.9 mile.
94. Then proceeding in an approximate arc, following the course of the river for about 3.1 miles as it turns from east to
south, and then from south to east.
95. Then proceeding in a general south direction along the WCID#10 boundary for about 1.7 mile until it intersects FM
2244 in the vicinity of Barton Creek Blvd.
96. Then proceeding in a general SW direction along the WCID #10 boundary (and along Barton Creek Blvd.) for
about 0.4 mile until the district boundary turns generally SE.
97. Then proceeding in a general SE direction along the WCID #10 boundary for about 0.5 mile until it turns generally
SSW.
98. Then proceeding in a general SSW direction along the WCID #10 boundary for about 0.4 mile until its junction
with the boundary of Lost Creek MUD and Country Club at or near Barton Creek.
99. Then proceeding in a varying direction from southwest to southeast along the western boundary of Lost Creek
Country Club for about 2.4 mile until it turns generally NE.
LUA A-6
IMPACT FEE LAND USE ASSUMPTIONS - APPENDIX ADescription of Impact Fee Boundary for Year 2007 Update Adopted September 10, 2007 (Ord 20070910-007)
100. Then proceeding in a general east direction along the boundary of Lost Creek Country Club, Lost Creek MUDand Barton Creek for about 1.0 mile until it intersects with the west property line of the Gaines Ranch.
101. Then proceeding in a general SSW direction along the west property lines of the Gaines Ranch and Chapmantract for about 1.5 mile until it turns generally ESE.
102. Then proceeding in a general ESE direction along the southwest property line of the Chapman Tract for about0.2 mile until it turns generally SSW.
103. Then proceeding in a general SSW direction along Foster Ranch Rd. for about 0.3 mile until it turns generallyWNW.
104. Then proceeding in a general WNW direction for about 1.7 mile, intermittently touching the Austin full purposecity limit as of November 2006, until it turns generally SW.
105. Then proceeding in a general SW direction for about 0.2 mile until it intersects the Austin full purpose city limitas of November 2006.
106. Then proceeding in a general WNW direction along the Austin full purpose city limit as of November 2006 andrear lot lines of property along Southwest Parkway and Barton Creek Blvd for about 1.0 mile until it turns SSW.
107. Then proceeding in a general SSW direction along the back lot lines of lots on Barton Creek Blvd., and continuesfor about 0.5 mile until the boundary intersects with the full purpose city limits as of November 2006 and turnsgenerally west.
108. Then proceeding in a general west and SSW direction along the Austin full purpose city limit as of November2006, and along the boundary of the Uplands tract for about 0.6 mile until it intersects with Old Bee Caves Road.
109. Then proceeding in a general west direction along Old Bee Caves Road for about 0.4 mile until it intersects withthe boundary of WCID #14 near the eastern right of way of Hwy. 71 and turns generally NE.
110. Then proceeding in a general NE direction along the east boundary of WCID #14 for about 0.4 mile and turnsgenerally NW.
ill. Then proceeding in a general NW direction along the east boundary of WCID #14 for about 0.5 mile until itintersects with Hwy 71.
112. Then proceeding in a general NW direction along Hwy. 71, for about 1.5 mile until the boundary intersects withthe common ETJ boundary of the Village of Bee Cave and City of Austin.
113. Then proceeding in a general arc from east to west along the common ETJ boundary of the Village of Bee Caveand City of Austin for about 3.5 miles until the ETJ intersects with the boundary of the Wong Tract which is alsothe Bee Cave CCN boundary.
114. Then proceeding in a general south direction along various portions of the east boundary of the Wong Tractwhich is also the Bee Cave CCN boundary for about 5.7 miles until it turns generally WNW.
115. Then proceeding in a general WNW direction along the southern boundary of the Wong Tract which is also theBee Cave CCN boundary for about 0.9 mile until it turns generally NNE.
116. Then proceeding in a general NNE direction along the western boundary of the Wong Tract which is also theBee Cave CCN boundary for about 0.1 mile until it turns generally east.
117. Then proceeding in a general east direction along the western boundary of the Wong Tract which is also the BeeCave CCN boundary for about 0.5 mile until it turns generally north.
LUA A-7
IMPACT FEE LAND USE ASSUMPTIONS — APPENDIX ADescription of Impact Fee Boundary for Year 2007 Update Adopted September 10, 2007 (Ord 20070910-007)
118. Then proceeding in a general north direction along the western boundary of the Wong Tract which is also theBee Cave CCN boundary for about 0.5 mile until it turns generally west.
119. Then proceeding in a general east direction along the western boundary of the Wong Tract which is also the BeeCave CCN boundary for about 0.5 mile until it intersects the Shield-Ayres City of Austin Conservation propertyand turns generally south.
120. Then proceeding in a general south direction about 0.4 mile along the boundary of the Shield-Ayres City ofAustin Conservation Easement property until it turns generally WNW.
121. Then proceeding in a general WNW direction about 0.8 mile along the boundary of the Shield-Ayres City ofAustin Conservation Easement property until it turns generally SSW.
122. Then proceeding in a general SSW and NW direction about 3.4 miles along the southern boundary of the ShieldAyres Private Conservation Easement property until it intersects the Austin ETJ boundary and turns generallySSE.
123. Then proceeding in a general SSE and SSW direction 1.9 miles along the Austin ETJ until it intersects the countyline boundary between Travis and Hays and it turns generally SE.
124. Then proceeding in a general SE direction 5.3 miles along the county line boundary between Travis and Haysuntil it turns generally south at the village limits of Bear Creek.
125. Then proceeding in a general south direction along the common city limits of Austin and Bear Creek and thecommon ETJ boundary of Austin and Dripping Springs for about 5.1 miles until it turns generally east.
126. Then proceeding in a general east direction along the common ETJ boundary of Austin and Dripping Springs forabout 1.0 mile until it intersects with the common Austin ETJ and Hays ETJ.
127. Then proceeding in a general east direction along the common ETJ boundary of Austin and Hays for about 1.7mile until it turns generally north.
128. Then proceeding in a general north direction along the common ETJ boundary of Austin and Hays which followsvarious subdivision boundaries for about 4.1 miles until it turns generally east.
129. Then proceeding in a general east direction along the common ETJ boundary of Austin and Hays for about 0.9mile until it turns generally south.
130. The proceeding in a general south direction along the common ETJ boundary of Austin and Hays for about 1.4mile until it turns generally east.
131. Then proceeding in a general east and south direction along the common ETJ boundary of Austin and Hays forabout 1.6 mile until it intersects the common ETJ boundary of Austin and Buda and turns generally SE.
132. Then proceeding in a general SE direction along the common ETJ boundary of Austin and Buda for about 1.9mile until it turns generally south.
133. Then proceeding in a general south direction along the common ETJ boundary of Austin and Buda for about 1.2mile until it turns generally east.
134. Then proceeding in a general east direction along the common ETJ boundary of Austin and Buda for about 1.7miles to the east frontage road of IH-35 South which marks both the end and beginning points of the Impact FeeService Area Boundary.
LUA A-8
IMPACT FEE CAPITAL IMPROVEMENTS PLAN
City of Austin, TexasAustin Water Utility
Year 2007 Update
Adopted September 10, 2007
C
IMPACT FEE CAPITAL IMPROVEMENTS PLANTABLE OF CONTENTS
LIST OF FIGURES
LIST OF TABLES
I. INTRODUCTION
II. FACILITY PLANNING -- DEFINING THE EXISTING LEVELUSAGE AND RESERVE CAPACITY NEEDS
III. IMPACT FEE FACILITIES AND FEE CALCULATION METHODOLOGY
IV. SERVICE UNIT DEMAND AND CAPACITY RELATIONSHIPS
V. SERVICE UNIT DEMAND PROJECTIONS
VI. CAPACITY AND COST ATTRIBUTABLE TO NEW GROWTH
VII. CALCULATION OF MAXIMUM ALLOWABLE IMPACT FEE
VIII. IMPACT FEE ASSESSMENT
IX. COLLECTED FEES
Appendix A Existing Collected Fees from Fiscal Year 2006/2007 City-wide Rate Ordinance
Appendix B Descriptions of the Zones for the Fees
Appendix C CIP Projects Targeted to Meet Existing Needs — Wastewater
Appendix D CIP Projects Targeted to Meet Existing Needs — Water
PAGE
CIP-ii
CIP-ii
CIP-I
CIP-1
CIP-16
CIP-17
CIP-21
CIP-25
CIP-33
CIP-33
CIP-33
CIP-Al -A2
CIP-Bi
CIP- CI -C7
CIP-DI -D6
CIP-i
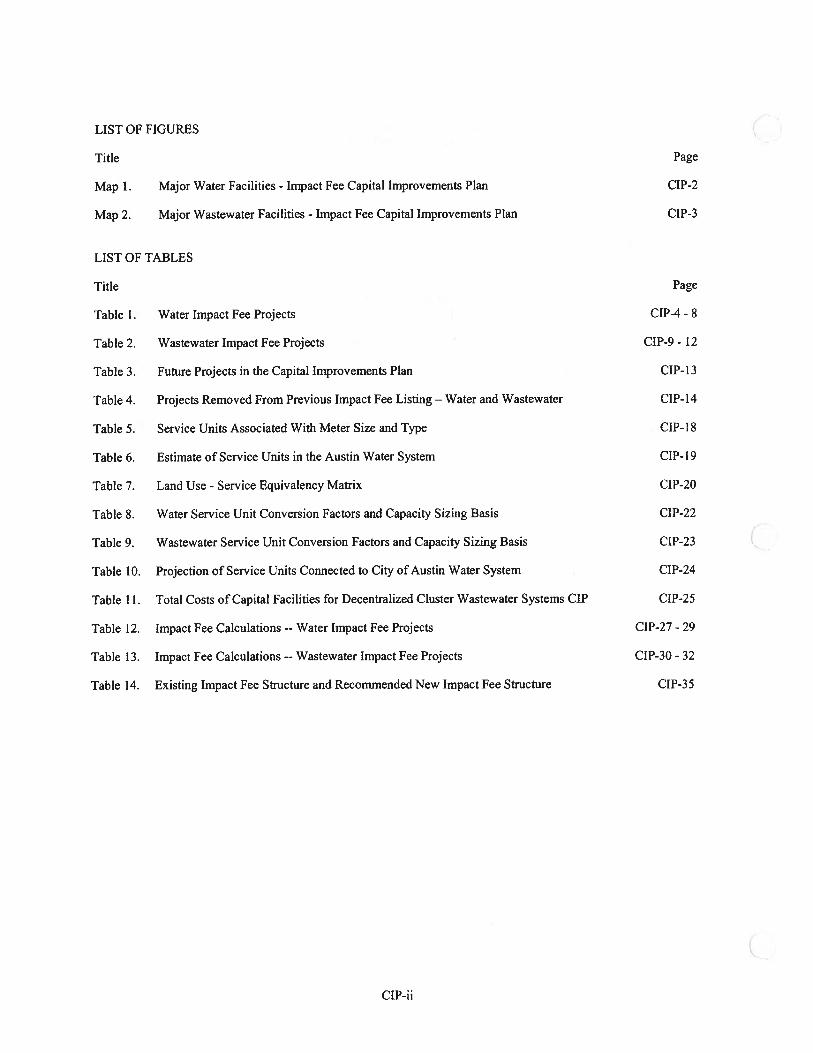
LIST OF FIGURES (Title Page
Map 1. Major Water Facilities - Impact Fee Capital Improvements Plan CIP-2
Map 2. Major Wastewater Facilities - Impact Fee Capital Improvements Plan CIP-3
LIST OF TABLES
Title Page
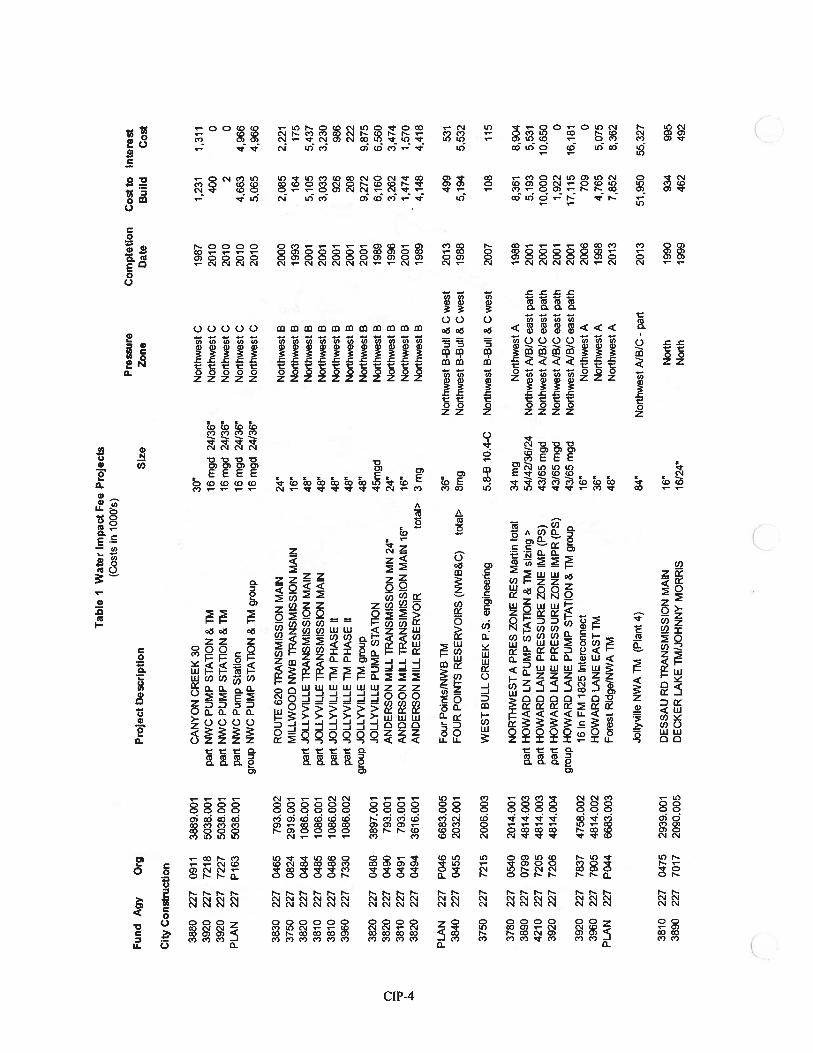
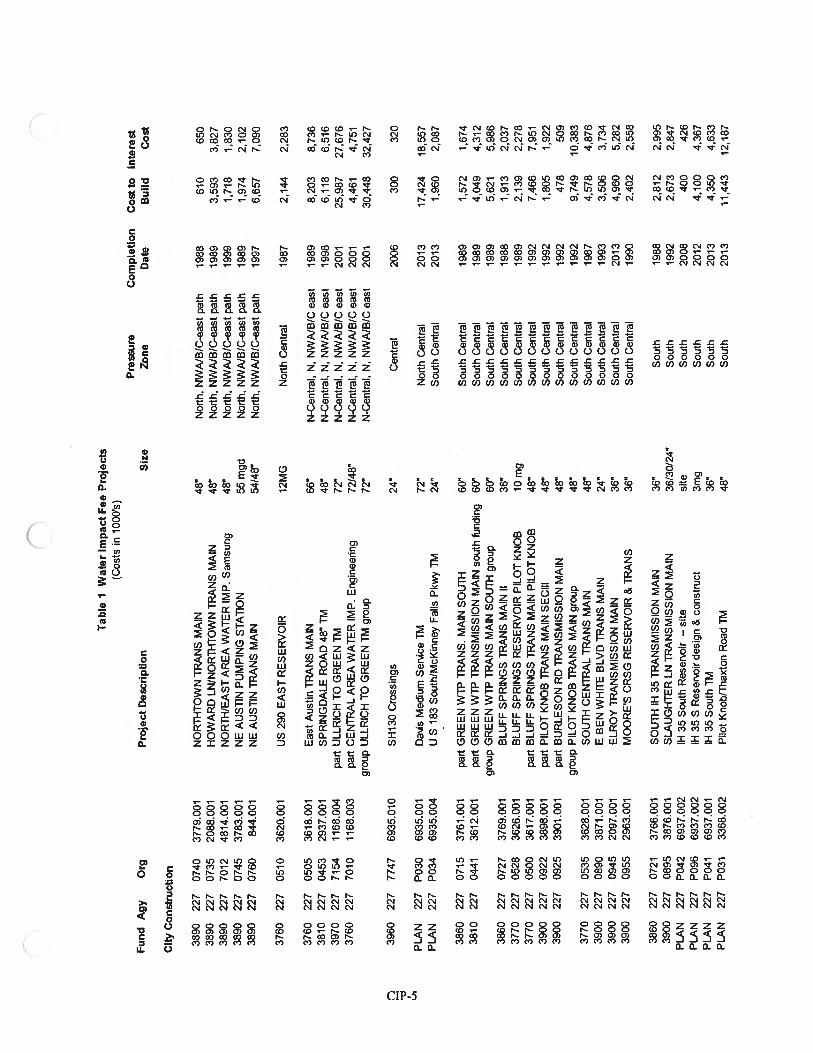
Table I. Water Impact Fee Projects CIP-4 - 8
Table 2. Wastewater Impact Fee Projects CIP-9 - 12
Table 3. Future Projects in the Capital Improvements Plan CIP- 13
Table 4. Projects Removed From Previous Impact Fee Listing — Water and Wastewater CIP- 14
TableS. Service Units Associated With Meter Size and Type CIP-18
Table 6. Estimate of Service Units in the Austin Water System CIP-l 9
Table 7. Land Use - Service Equivalency Matrix CIP-20
Table 8. Water Service Unit Conversion Factors and Capacity Sizing Basis CIP-22
Table 9. Wastewater Service Unit Conversion Factors and Capacity Sizing Basis CIP-23
Table 10. Projection of Service Units Connected to City of Austin Water System CIP-24
Table 11. Total Costs of Capital Facilities for Decentralized Cluster Wastewater Systems CIP CIP-25
Table 12. Impact Fee Calculations -- Water Impact Fee Projects CIP-27 - 29
Table 13. Impact Fee Calculations -- Wastewater Impact Fee Projects CIP-30 - 32
Table 14. Existing Impact Fee Structure and Recommended New Impact Fee Structure CIP-35
CIP-ii
I. INTRODUCTION
The Texas Impact Fee Act (Chapter 395 of the Texas Local Government Code) provides methods and procedures thatAustin must follow to continue to impose its water and wastewater capital recovery fees. This act requires thedetermination of the costs of capital improvements attributable to new growth for a specified period of time. Thesecosts are the principal building blocks on which the calculation of impact fees is based. The plan that identifies thecapital improvements or facility expansions for which impact fees may be assessed is termed the “capital improvementsplan”. In 1990, the City of Austin achieved compliance with the Texas Impact Fee Act by approving land useassumptions on April 5, 1990 and then approving the impact fee CIP and amendments to the ordinance on June 7,1990. In subsequent years, the City has maintained compliance with periodic updates. From 1990 to 2001, the TexasImpact Fee Act stipulated that the City is to update its land use assumptions and impact fee CIP at least every threeyears. Beginning September 1, 2001, the Texas Impact Fee Act stipulates that these updates are to be done at leastevery five years. The five-year period begins on the day the impact fee CIP is adopted. This document represents theupdate to the CIP. Both it and the land use assumptions can be adopted at the same time.
The law outlines a methodology for calculating the cost of particular facilities attributable to new growth based on adefmed planning period (not to exceed 10 years). The planning period establishes a time frame in which to evaluatecapacity made available for new growth as compared to the demand for that capacity represented by the land useassumptions. One of the keys to the methodology is the expression of both demand and capacity for a particularproject in terms of service units. By knowing the number of service units associated with the impact fee projects thatare expected to be used during the planning period, the capacity and cost attributable to new growth can readily bedetermined. Using this cost and the projected total number of new service units within the utility service boundaryduring the planning period, the “maximum fee per service unit” may be calculated as prescribed by the Jaw. Themethodology of the Capital Improvements Plan provides the framework for calculating the maximum allowable impactfee, which is simply the upper limit on the fee pursuant to the law.
The methodologies employed in this Impact Fee CIP comply with the provisions of the Texas Impact Fee Act. Thisupdate is as comprehensive as previous updates, extensively reworking the list of qualified CIP projects. It continuesto exclude projects that are predominately dedicated to existing users, or that may not be constructed within the ten-year planning period. And in cases where other participants contributed funds, only the City of Austin’s shares of thecosts were included. In addition, capacity, costs, and service areas were studied on a project by project basis.
The Impact Fee CIP process calculates the maximum allowable fee. This calculation conforms to the state requirementfor a credit equal to 50 percent of the total projected cost of implementing the capital improvements plan.
II. FACILITY PLANNING -- DEFINING THE EXISTING LEVEL OF CAPACITY USAGE AND RESERVECAPACITY NEEDS
Section 395.014 of the impact fee law as codified in the Texas Local Government Code speaks to a capitalimprovements plan that addresses:
(1) a description of the existing capital improvements within the service area and the costs to upgrade, update,improve, expand, or replace the improvements to meet existing needs and usage and stricter safety, efficiency, orenvironmental or regulatory standards.
(2) an analysis of the total capacity, the level of current usage, and commitments for usage of capacity of theexisting capital improvements.
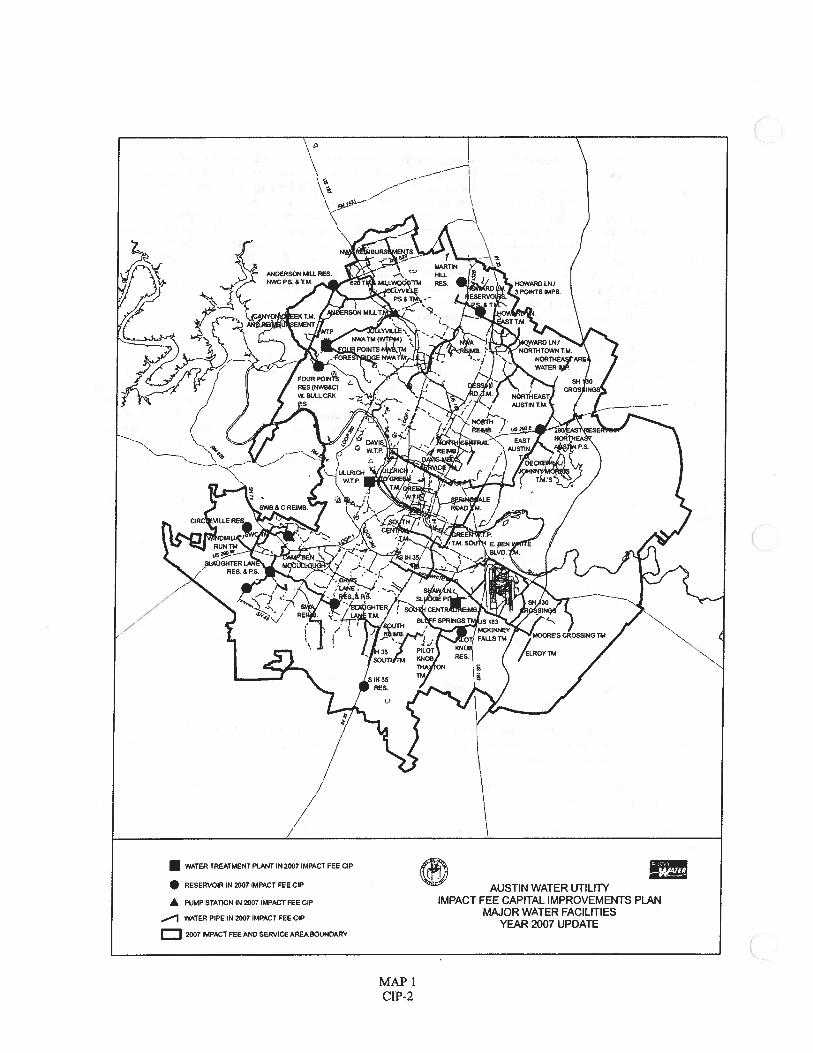
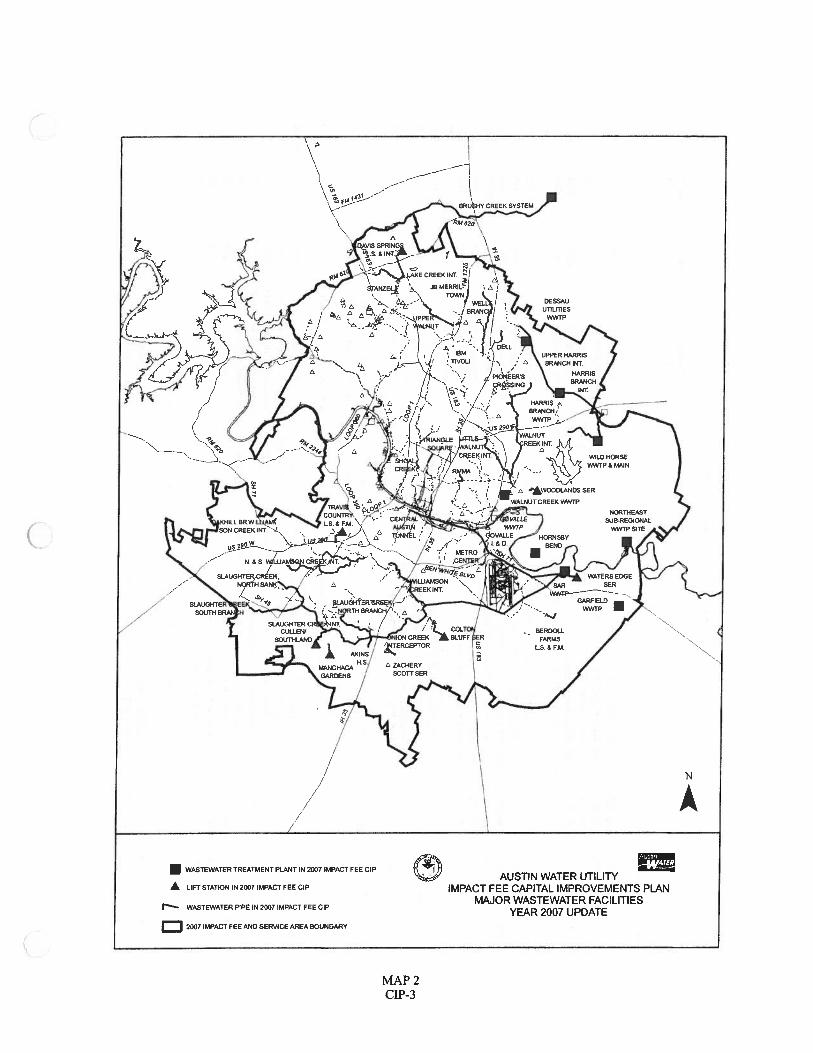
Major utility facilities are shown as Maps 1 and 2. These maps also illustrate the location of the Impact Fee CIPprojects.
CIP- 1
WATER TREATMENT PtANT IN 2007 IMPACT FEE CIP
• RESERVOIR IN 2007 IMPACT FEE CIP
A PUEIP STATION IN 2007 IMPACT FEE CIP
WATER PIPE IN 2007 IMPACT FEE CIP
2007 IMPACT FEEAND SERVICEAREABOUNDARV
AUSTIN WATER UTILITYIMPACT FEE CAPITAL IMPROVEMENTS PLAN
MAJOR WATER FACILITIESYEAR 2007 UPDATE
MAP 1CIP-2
MAP 2CEP-3
WASTEWATER TREATMENT PLART iN 2007 IMPACT FEE CIP
A LIFT STATION IN 2007 IMPACT FEE CIP
1- WASTEWATER PIPE IN 2007 IMPACT FEE CIP
2007 IMPACT FEE AND SEEWCE AREA BOUNDARY
AUSTIN WATER UTILITYIMPACT FEE CAPITAL IMPROVEMENTS PLAN
MAJOR WASTEWATER FACILITIESYEAR 2007 UPDATE
Fun
dA
gyO
rgP
roje
ctD
escr
ipti
on
Tab
leI
Wat
erIm
pac
tF
eeP
roje
cts
(Cos
tsin
100(
Ys)
Siz
eP
ress
ure
Com
ple
tion
Cos
tto
Inte
rest
Dat
eB
uild
Cos
t
City
Const
ruct
ion
Fou
rP
oint
s/N
WB
TM36
”FO
UR
POIN
TS
RE
SE
RV
OIR
S(N
WB
&C
)to
tal>
8mg
Nor
thw
est
B-B
ull
&C
wes
tN
ort
hw
est
B-B
ull
&C
wes
t
3750
227
7215
2006
.003
WE
ST
BU
LLC
RE
EK
P.S
.en
gine
erin
g5.
8-B
10.4
-CN
orth
wes
tB
-Bul
l&
Cw
est
2007
108
115
Joll
yiIl
eN
WA
TM(P
lant
4)84
”N
orth
wes
tA
/B/C
-pa
rt20
1351
,950
55,3
27
3810
227
0475
2939
.001
3890
227
7017
2090
.005
Zon
e
3830
3750
3820
3810
3810
3960
3820
c)38
2038
1038
20
227
227
227
227
227
227
227
227
227
227
3880
227
0911
3889
.001
CA
NY
ON
CR
EE
K30
30”
Nor
thw
est
C19
871,
231
1,31
139
2022
772
1850
38.0
01pa
rtN
WC
PUM
PST
AT
ION
&TM
16m
gd24
/36”
Nor
thw
est
C20
1040
00
3920
227
7227
5038
.001
part
NW
CPU
MP
STA
TIO
N&
TM16
mgd
24/3
6”N
orth
wes
tC
2010
20
PLA
N22
7P
163
5038
.001
part
NW
CP
ump
Sta
tion
16m
gd24
/36”
Nor
thw
est
C20
104,
663
4,96
6gr
oup
NW
CPU
MP
STA
TIO
N&
ml
grou
p16
mgd
24/3
6”N
orth
wes
tC
2010
5.06
54,
966
0465
793.
002
RO
UT
E62
0T
RA
NSM
ISSI
ON
MA
IN24
”N
orth
wes
tB
2000
2,08
52,
221
0824
2919
.001
MIL
LW
OO
DN
WB
TR
AN
SMIS
SIO
NM
AIN
16”
Nor
thw
est
B19
9316
417
504
8410
86.0
01pa
rtJO
LLY
VIL
LET
RA
NSM
ISSI
ON
MA
IN48
”N
orth
wes
tB
2001
5,10
55,
437
0485
1086
.001
part
JOLL
YV
ILLE
TR
AN
SMIS
SIO
NM
AIN
48”
Nor
thw
est
B20
013,
033
3,23
004
8610
86.0
02pa
rtJO
LLY
VIL
LETM
PH
AS
EII
48”
Nor
thw
est
B20
0192
698
673
3010
86.0
02pa
rtJO
LLY
VIL
LETM
PH
AS
EII
48”
Nor
thw
est
B20
0120
822
2gr
oup
JOLL
YV
ILLE
TMgr
oup
48”
Nor
thw
est
B20
019,
272
9,87
504
8038
97.0
01JO
LLY
VIL
LEPU
MP
STA
TIO
N45
mgd
Nor
thw
est
B19
896,
160
6,56
004
9079
3.00
1A
ND
ER
SON
MIL
LT
RA
NSM
ISSI
ON
MN
24”
24”
Nor
thw
est
819
963,
262
3,47
404
9179
3.00
1A
ND
ER
SON
MIL
LT
RA
NSI
MIS
SIO
NM
AIN
16”
16”
Nor
thw
est
B20
011,
474
1,57
004
9436
16.0
01A
ND
ER
SON
MIL
LR
ES
ER
VO
IRto
tal>
3m
gN
orth
wes
tB
1989
4,14
84,
418
PLA
N22
7P
046
6683
.005
2013
499
531
3840
227
0455
2032
.001
1988
5,19
45,
532
3780
227
0540
2014
.001
NO
RT
hWE
ST
AP
RE
SZ
ON
ER
ES
Mar
tinto
tal
34m
gN
orth
wes
tA
1988
8,36
18,
904
3890
227
0799
4814
.003
part
HO
WA
RD
LNPU
MP
STA
TIO
N&
TMsi
zing
>54
/42/
36/2
4N
orth
wes
tA
/B/C
east
path
2001
5193
5,53
142
1022
772
0548
14.0
03pa
rtH
OW
AR
DLA
NE
PR
ES
SU
RE
ZO
NE
IMP
(PS
)43
/65
mgd
Nor
thw
est
A/B
/Cea
stpa
th20
0110
,000
10,6
5039
2022
772
0648
14.0
04pa
rtH
OW
AR
DLA
NE
PR
ES
SU
RE
ZO
NE
IMPR
(PS
)43
/65
mgc
lN
orth
wes
tA
/B/C
east
path
2001
1,92
20
grou
pH
OW
AR
DLA
NE
PUM
PST
AT
ION
&TM
grou
p43
/65
mgd
Nor
thw
est
A/B
/Cea
stpa
th20
0117
,115
16,1
8139
2022
778
3747
58.0
0216
inFM
1825
Inte
rcon
nect
16”
Nor
thw
est
A20
0670
90
3960
227
7905
4814
.002
HO
WA
RD
LAN
EE
AST
TM36
”N
orth
wes
tA
1998
4,76
55,
075
PLA
N22
7P
044
6683
.003
For
est
Rid
ge/N
WA
TM48
”N
orth
wes
tA
2013
7,85
28362
Nor
th19
9093
499
5N
orth
1999
462
492
DE
SSA
UR
DT
RA
NSM
ISSI
ON
MA
IN16
”D
EC
KE
RLA
KE
TM
/JO
HN
NY
MO
RR
IS16
/24”
Fun
dA
gyO
rgP
roje
ctD
escr
ipti
on
Tab
leI
Wat
erIm
pac
tF
eeP
roje
cts
(Cos
tsin
1000
’s)
Siz
eP
ress
ure
Co
mp
leti
on
Cos
tto
Inte
rest
Dat
eB
uild
Cos
t
Cit
yC
on
stru
ctio
n
3760
227
0510
3620
.001
US
290
EA
ST
RE
SER
VO
IR12
MG
Nor
thC
entr
al19
872,
144
2,28
3
6935
.010
6935
.001
6935
.004
SH13
OC
ross
ings
Da’
,sM
ediu
mS
erA
ceTM
US
183
Sou
th/M
cKin
ney
Falls
Pkw
yTi
vi
Zon
e
3890
227
0740
3779
.001
NO
RT
HT
OW
NT
RA
NS
MA
IN48
”N
orth
,N
WA
/BIC
-eas
tpa
th19
8861
065
038
9022
707
3520
88.0
01H
OW
AR
DL
N)N
OR
TH
TO
WN
TR
AN
SM
AIN
48”
Nor
th,
NW
A/B
/C-e
ast
path
1989
3,59
33,
827
3890
227
7012
4814
.001
NO
RT
I-II
EA
STA
RE
AW
AT
ER
IMP.
Sam
surr
g48
”N
orth
,N
WA
IB/C
-eas
tpa
th19
99‘1
,718
1,83
038
9022
707
4537
83.0
01N
EA
UST
INPU
MPI
NG
STA
TIO
N55
mgd
Nor
th,
NW
A/B
/C-e
ast
path
1989
1,97
42,
102
3890
227
0760
844.
001
NE
AU
STIN
TR
AN
SM
AIN
54/4
8”N
orth
,N
WA
/B/C
-eas
tpa
th19
976,
657
7,09
0
3760
3810
3970
3760
227
227
227
227
0505
0453
7154
7010
3618
.001
2937
.001
1168
004
1168
.003
Eas
tA
usti
nT
RA
NS
MA
INSP
RIN
GD
AL
ER
OA
D48
”TM
part
ULL
RIC
HTO
GR
EE
NTM
part
CE
NT
RA
LA
RE
AW
AT
ER
IMP.
Eng
inee
ring
grou
pU
LLR
ICH
TO
GR
EE
NTM
grou
p
3960
227
7747
PLA
N22
7P
030
PLA
N22
7P
034
3860
227
0715
3810
227
0441
1989
1998
2001
2001
2001
8,20
36,
118
25,9
874,
461
30,4
48
8,73
66,
516
27,6
764,
751
32,4
27
227
0727
227
0528
227
0500
227
0922
227
0925
2006
300
320
3860
3770
3770
3900
3900
3770
3900
3900
3900
3860
3900
PLA
NPL
AN
PLA
NPL
AN
17,4
2418
,557
1,96
02,
087
3761
.001
3612
.001
3769
.001
3626
.001
3617
.001
3898
.001
3901
.001
3628
.001
3871
.001
2097
.001
2963
.001
3766
.001
3876
.001
6937
.002
6937
.002
6937
.001
3368
.002
66”
48”
72”
7214
8”72
”
24”
72”
24”
60”
60”
60”
36”
10m
g48
”48
”48
”48
”48
”24
”36
”36
”
36”
36/3
0/24
”si
te3m
g36
48”
N-C
entr
al,
N,
NW
NB
ICea
stN
-Cen
tral
,N
,N
WN
B/C
east
N-C
entr
al,
N,
NW
A/B
/Cea
stN
-Cen
tral
,N
,N
WN
BIC
east
N-C
entr
al,
N,
NW
AIB
ICea
st
Cen
tral
Nor
thC
entr
alS
outh
Cen
tral
Sou
thC
entr
alS
outh
Cen
tral
Sou
thC
entr
alS
outh
Cen
tral
Sou
thC
entr
alS
outh
Cen
tral
Sou
thC
entr
alS
outh
Cen
tral
Sou
thC
entr
alS
outh
Cen
tral
Sou
thC
entr
alS
outh
Cen
tral
Sou
thC
entr
al
Sou
thS
outh
Sou
thS
outh
Sou
thS
outh
227
227
227
227
227
227
227
227
227
227
part
GR
EE
NW
TP
TR
AN
S.M
AIN
SC
Ull
-Ipa
rtG
RE
EN
WT
PT
RA
NSM
ISSI
ON
MA
INso
uth
fund
ing
grou
pG
RE
EN
WT
PT
RA
NS
MA
INSO
UT
Hgr
oup
BL
UFF
SP
RIN
GS
TR
AN
SM
AIN
IIB
LU
FFS
PR
ING
SR
ESE
RV
OIR
PIL
OT
KN
OB
part
BL
UFF
SP
RIN
GS
TR
AN
SM
AIN
PIL
OT
KN
OB
part
PIL
OT
KN
OB
TR
AN
SM
AIN
SEC
III
part
BU
RL
ESO
NR
DT
RA
NSM
ISSI
ON
MA
INgr
oup
PIL
OT
KN
OB
TR
AN
SM
AIN
grou
pSO
UT
HC
EN
TR
AL
TR
AN
SM
AIN
EB
EN
WH
r1-E
BLV
DT
RA
NS
MA
INE
LR
OY
TR
AN
SMIS
SIO
NM
AIN
MO
OR
E’S
CR
SG
RE
SE
RV
OIR
&T
RA
NS
SOU
TH
IH35
TR
AN
SMIS
SIO
NM
AIN
SLA
UG
HT
ER
LNT
RA
NSM
ISSI
ON
MA
INIH
35S
outh
Res
eRoi
r—
site
IH35
$R
eser
voir
desi
gn&
cons
truc
tIN
35S
outh
TMPi
lot
Kno
b/T
haxt
onR
oad
TM
0535
0890
0945
0955
0721
0895
P04
2P
096
P041
P031
2013
2013
1989
1989
1989
1988
1989
1992
1992
1992
1992
1987
1993
2013
1990
1988
1992
2008
2012
2013
2013
1,57
24,
049
5,62
11,
913
2,13
97,
466
1,80
547
89,
749
4,57
83,
506
4,96
02,
402
2,81
22,
673
400
4,10
04,
350
11,4
43
1,67
44,
312
5,98
62,
037
2,27
87,
951
1,92
250
910
,383
4,87
63,
734
5,28
22,
558
2,99
52,
847
426
4,36
74,
633
12,1
87
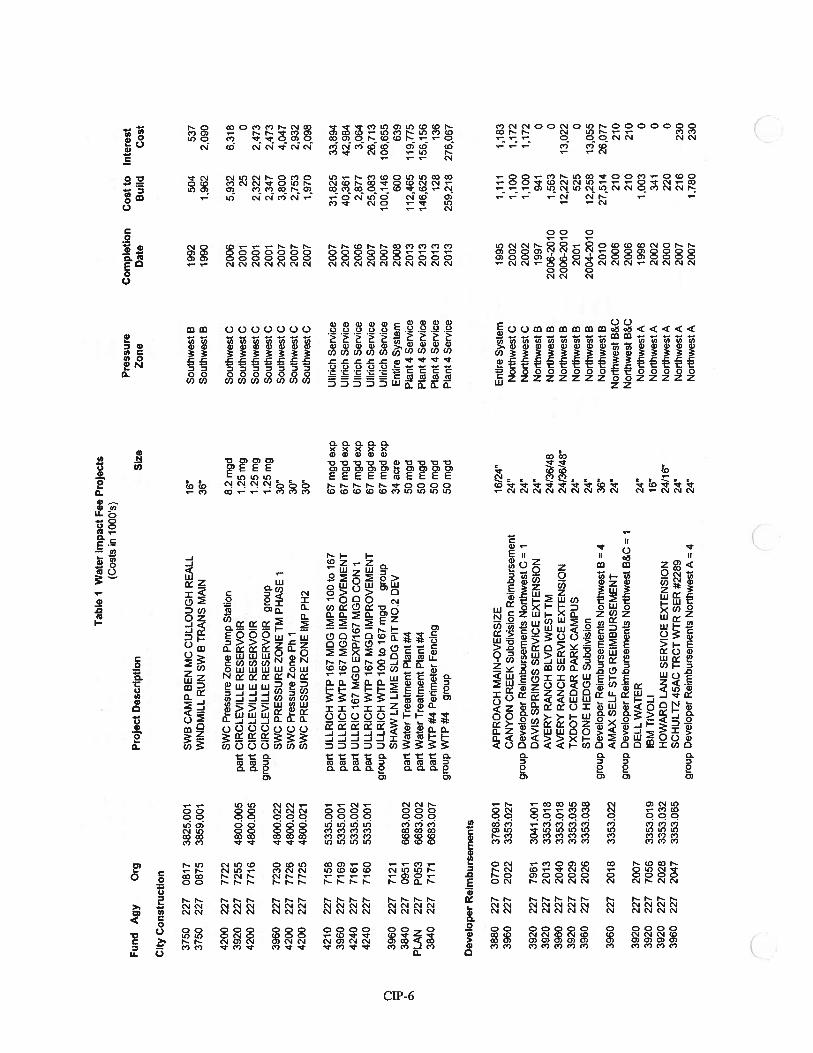
Tab
le1
Wat
erIm
pact
Fee
Pro
ject
s(C
osts
in10
00’s
)P
ress
ure
Co
mp
leti
on
Cost
toIn
tere
stF
und
Agy
Org
Pro
ject
Des
crip
tion
Siz
eZ
one
Dat
eB
uild
Co
st
Cit
yC
on
stru
ctio
n
3750
227
0817
3825
001
SWB
CA
MP
BE
NM
CC
UL
LO
UG
HR
EA
LL
16”
Sou
thw
est
B19
9250
453
737
5022
708
7538
59.0
01W
IND
MIL
LR
UN
SWB
TR
AN
SM
AIN
36”
Sou
thw
est
B19
901,
962
2090
4200
227
7722
SW
CP
ress
ure
Zon
eP
ump
Sta
tion
8.2
mgd
Sou
thw
est
C20
065,
932
6,31
839
2022
772
5548
00.0
05pa
rtC
IRC
LE
VIL
LE
RE
SE
RV
OIR
1.25
mg
Sou
thw
est
C20
0125
042
0022
777
1648
00.0
05pa
rtC
IRC
LE
VIL
LE
RE
SE
RV
OIR
1.25
mg
Sou
thw
estC
2001
2,32
22,
473
grou
pC
IRC
LE
VIL
LE
RE
SE
RV
OIR
grou
p1.
25m
gS
outh
wes
tC
2001
2,34
72,
473
3960
227
7230
4800
.022
SW
CP
RE
SS
UR
EZ
ON
ETM
PH
AS
E1
30”
Sou
thw
est
C20
073,
800
4,04
742
0022
777
2648
00.0
22S
WC
Pre
ssu
reZ
one
Ph1
30”
Sou
thw
est
C20
072,
753
2,93
242
0022
777
2548
00.0
21S
WC
PR
ES
SU
RE
ZO
NE
IMP
PH2
30”
Sou
thw
est
C20
071,
970
2,09
8
4210
227
7158
5335
.001
part
UL
LR
ICH
WT
P16
7M
DG
IMPS
100
to16
767
mgd
exp
Ullr
ich
Ser
vice
2007
31,8
2533
,894
3960
227
7169
5335
.001
part
UL
LR
ICH
WT
P16
7M
GD
IMPR
OV
EM
EN
T67
mgd
exp
Ullr
ich
Ser
vice
2007
40,3
6142
,984
4240
227
7161
5335
.002
part
UL
LR
IC16
7M
GD
EX
P/1
67M
GD
CO
N1
67m
gdex
pU
liric
hS
ervi
ce20
062,
877
3,06
442
4022
771
6053
35.0
01pa
rtU
LL
RIC
HW
TP
167
MG
DIM
PRO
VE
ME
NT
67m
gdex
pU
liric
hS
ervi
ce20
0725
,083
26,7
13gr
oup
UL
LR
ICH
WT
P10
0to
167
mgd
grou
p67
mgd
exp
Ulir
ich
Ser
vice
2007
100,
146
106,
655
3960
227
7121
SHA
WLN
LIM
ESL
DG
PIT
NO
.2D
EV
34ac
reE
ntir
eS
yste
m20
0860
063
938
4022
709
5166
83.0
02pa
rtW
ater
Tre
atm
ent
Pla
nt#
450
mgd
PIa
nt4
Ser
vice
2013
112,
465
119,
775
PLA
N22
7P
053
6683
.002
part
Wat
erT
reat
men
tP
lant
#450
mgd
Pla
nt4
Ser
vice
2013
146,
625
156,
156
3840
227
7171
6683
.007
part
WT
P#4
Per
imet
erF
enci
ng50
mgd
PIa
nt4
Ser
vice
2013
128
136
grou
pW
TP
#4gr
oup
50m
gd
PIa
nt4
Ser
vice
2013
259,
218
276,
067
Dev
eloper
Rei
mb
urs
emen
ts
3880
227
0770
3798
.001
AP
PR
OA
CH
MA
IN-O
VE
RSI
ZE
16/2
4”E
ntir
eS
yste
m19
951,
111
1,18
339
6022
720
2233
53.0
27C
AN
YO
NC
RE
EK
Sub
divi
sion
Rei
mbu
rsem
ent
24”
Nor
thw
est
C20
021,
100
1,17
2gr
oup
Dev
elop
erR
eim
burs
emen
tsN
orth
wes
tC
=1
24”
Nor
thw
est
C20
021,
100
1,17
239
2022
779
6130
41.0
01D
AV
ISS
PR
ING
SS
ER
VIC
EE
XT
EN
SIO
N24
”N
orth
wes
tB
1997
941
039
2022
720
1333
53.0
18A
VE
RY
RA
NC
HB
LVD
WE
ST
TM24
/36/
48N
orth
wes
tB
2006
-201
01,
563
039
6022
720
4033
53.0
18A
VE
RY
RA
NC
HS
ER
VIC
EE
XT
EN
SIO
N24
/36/
48”
Nor
thw
est
B20
06-2
010
12,2
2713
,022
3920
227
2029
3353
.035
TX
DO
TC
ED
AR
PAR
KC
AM
PUS
24”
Nor
thw
est
B20
0152
50
3960
227
2026
3353
.038
ST
ON
EH
ED
GE
Sub
divi
sion
24”
Nor
thw
est
B20
04-2
010
12,2
5813
,055
grou
pD
evel
oper
Rei
mbu
rsem
ents
Nor
thw
est
B=
436
”N
orth
wes
tB
2010
27,5
1426
,077
3960
227
2018
3353
.022
AM
AX
SE
LF
STG
RE
IMB
UR
SEM
EN
T24
”N
orth
wes
tB
&C
2006
210
210
grou
pD
evel
oper
Rei
mbu
rsem
ents
Nor
thw
est
B&
C=
1N
orth
wes
tB
&C
2006
210
210
3920
227
2007
DE
LL
WA
TE
R24
”N
orth
wes
tA
1998
1,00
30
3920
227
7056
3353
.019
IBM
TIV
OLI
16”
Nor
thw
estA
2002
341
039
2022
720
2833
53.0
32H
OW
AR
DL
AN
ES
ER
VIC
EE
XT
EN
SIO
N24
/16”
Nor
thw
est
A20
0022
00
3960
227
2047
3353
.065
SC
HU
LT
Z45
AC
TR
CT
WT
RS
ER
#228
924
”N
orth
wes
tA20
0721
623
0gr
oup
Dev
elop
erR
eim
burs
emen
tsN
orth
wes
tA
=4
24”
Nor
thw
est
A20
071,
780
230
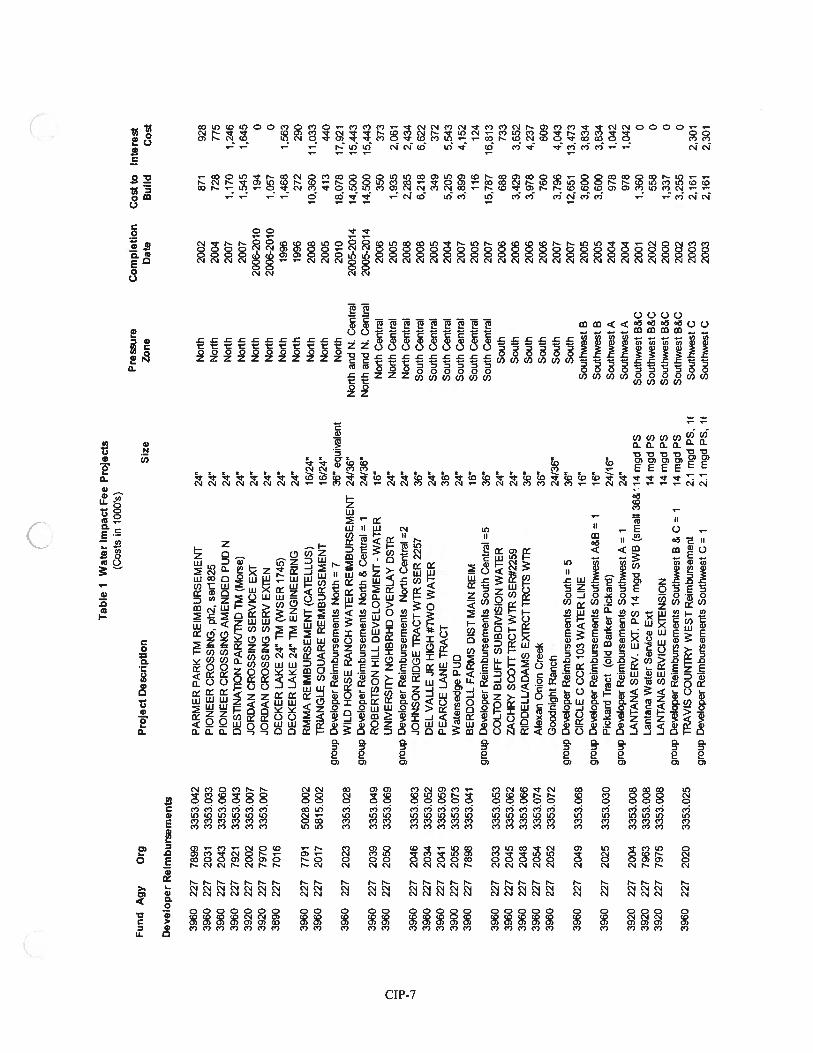
Tab
leI
Wat
erIm
pac
tF
eeP
roje
cts
(Cos
tsin
1000
’s)
Pre
swre
Com
ple
tion
Cos
tto
Inte
rest
Fund
Agy
Org
Pro
ject
Des
crip
tion
Siz
eZ
one
Dat
eB
uild
Co
st
Dev
eloper
Rei
mburs
emen
ts
3960
227
7899
3353
.042
PA
RM
ER
PAR
KTM
RE
IMB
UR
SEM
EN
T24
”N
orth
2002
871
928
3960
227
2031
3353
.033
PIO
NE
ER
CR
OS
SIN
G,
ph2,
ser1
825
24”
Nor
th20
0472
877
539
6022
720
4333
53.0
60P
ION
EE
RC
RO
SS
ING
AM
EN
DE
DPU
DN
24”
Nor
th20
071170
1,24
639
6022
779
2133
53.0
43D
EST
INA
11O
NPA
RK
JTN
DTM
(Mor
se)
24”
Nor
th20
071,
545
1,64
539
2022
720
0233
53.0
07JO
RD
AN
CR
OS
SIN
GS
ER
VIC
EEX
T24
’N
orth
2006
-201
019
40
3920
227
7970
3353
.007
JOR
DA
NC
RO
SS
ING
SE
RV
EX
IEN
24”
Nor
th20
06-2
010
1,05
70
3890
227
7016
DE
CK
ER
LA
KE
24”
TM(W
SE
R17
45)
24”
Nor
th19
961,
468
1,56
3D
EC
KE
RLA
KE
24”
TME
NG
INE
ER
ING
24”
Nor
th19
9627
229
039
6022
777
9150
28.0
02R
MM
AR
EIM
BU
RS
EM
EN
T(C
AT
EL
LU
S)16
124”
Nor
th20
0810
,360
11.0
3339
6022
720
1758
15.0
02T
RL
NG
LE
SQ
UA
RE
RE
IMB
UR
SEM
EN
T16
/24”
Nor
th20
0541
344
0gr
oup
Dev
alop
erR
eim
burs
emen
tsN
orth
=7
36”
equi
vale
ntN
orth
2010
18.0
7817
,921
3960
227
2023
3353
.028
WIL
DH
OR
SE
RA
NC
HW
AT
ER
RE
IMB
UR
SEM
EN
T24
/36”
Nor
than
dN
.C
entr
al20
05-2
014
14,5
0015
,443
grou
pD
eelo
per
Rei
mbu
rsem
ents
Nor
th&
Cen
tral
=1
24/3
6”N
orth
and
N.
Cen
tral
2005
-201
414
,500
15,4
4339
6022
720
3933
53.0
49R
OB
ER
TS
ON
HIL
LD
EV
EL
OP
ME
NT
-W
AT
ER
16”
Nor
thC
entr
al20
0635
037
339
6022
720
5033
53.0
69U
NIV
ER
SIT
YN
GH
BR
HD
OV
ER
LA
YD
STR
24”
Nor
thC
entr
al20
051,
935
2,06
1gr
oup
Dee
Ioper
Rei
mbu
rsem
ents
Nor
thC
entr
al=2
24”
Nor
thC
entr
al20
082,
285
2,43
439
6022
720
4633
53.0
63JO
HN
SO
NR
IDG
ET
RA
CT
WT
RS
ER
2257
36”
Sou
thC
entr
al20
086,
218
6,62
239
6022
720
3433
53.0
52D
EL
VA
LL
EJR
HIG
H#T
WO
WA
TE
R24
”S
outh
Cen
tral
2005
349
372
3960
227
2041
3353
.059
PE
AR
CE
LA
NE
TR
AC
T36
”S
outh
Cen
tral
2004
5,20
55,
543
3900
227
2055
3353
.073
Wat
erse
dg
ePU
D24
”S
outh
Cen
tral
2007
3,89
94,
152
3960
227
7898
3353
.041
BE
RD
OL
LFA
RM
SD
IST
MA
INR
EIM
16”
Sou
thC
entr
al20
0511
612
4gr
oup
Dee
Ioper
Rei
mbu
rsem
ents
Sou
thC
entr
al5
36”
Sou
thC
entr
al20
0715
,787
16,8
1339
6022
720
3333
53.0
53C
OL
TO
NB
LU
FFSU
BD
IVIS
ION
WA
TE
R24
”S
outh
2006
688
733
3960
227
2045
3353
.062
ZL
CH
RY
SC
OU
TR
CT
WT
RS
ER
#2259
24”
Sou
th20
063,
429
3,65
239
6022
720
4833
53.0
66R
IDD
EL
L/A
DA
MS
EX
1’R
CT
TR
CT
SW
TR
36”
Sou
th20
063,
978
4,23
739
6022
720
5433
53.0
74A
lexa
nO
nion
Cre
ek36
”S
outh
2006
760
809
3960
227
2052
3353
.072
Goo
dnig
htR
anch
24/3
6”S
outh
2007
3,79
64,
043
grou
pD
eval
oper
Rei
mbu
rsem
ents
Sou
th=
536
”S
outh
2007
12,6
5113
,473
3960
227
2049
3353
.068
CIR
CL
EC
CC
R10
3W
AT
ER
LIN
E16
”S
outh
wes
tB
2005
3,60
03,
834
grou
pD
eval
oper
Rei
mbu
rsem
ents
Sou
thw
est
A&
B=
116
”S
outh
wes
tB
2005
3,60
03,
834
3960
227
2025
3353
.030
Pic
kard
Tra
ct(o
ldB
arke
rP
icka
rd)
2411
6”S
outh
wes
tA
2004
978
1,04
2gr
oup
Dee
Ioper
Rei
mbu
rsem
ents
Sou
thw
est
A=
124
”S
outh
wes
tA
2004
978
1,04
239
2022
720
0433
53.0
08LA
NTA
NA
SE
RV
.EX
T.P
S14
mgd
SW
B(s
mal
l36
&1
14m
gdP
SS
outh
wes
tB
&C
2001
1,36
00
3920
227
7963
3353
.008
Lan
tana
Wat
erS
erc
eE
xt14
mgd
PS
Sou
thw
est
B&
C20
0255
80
3920
227
7975
3353
.008
LAN
TAN
AS
ER
VIC
EE
XT
EN
SIO
N14
mgd
PS
Sou
thw
est
B&
C20
001,
337
0gr
oup
Dev
alop
erR
eim
burs
emen
tsS
outh
wes
tB
&C
=1
14m
gdP
SS
outh
wes
tB
&C
2002
3,25
50
3960
227
2020
3353
.025
TR
AV
ISC
OU
NT
RY
WE
ST
Rei
mbu
rsem
ent
2.1
mgd
PS
,if
Sou
thw
est
C20
032,
161
2,30
1gr
oup
Dee
Ioper
Rei
mbu
rsem
ents
Sou
thw
est
C=
12.
1m
gdP
S,
11S
outh
wes
tC
2003
2,16
12,
301
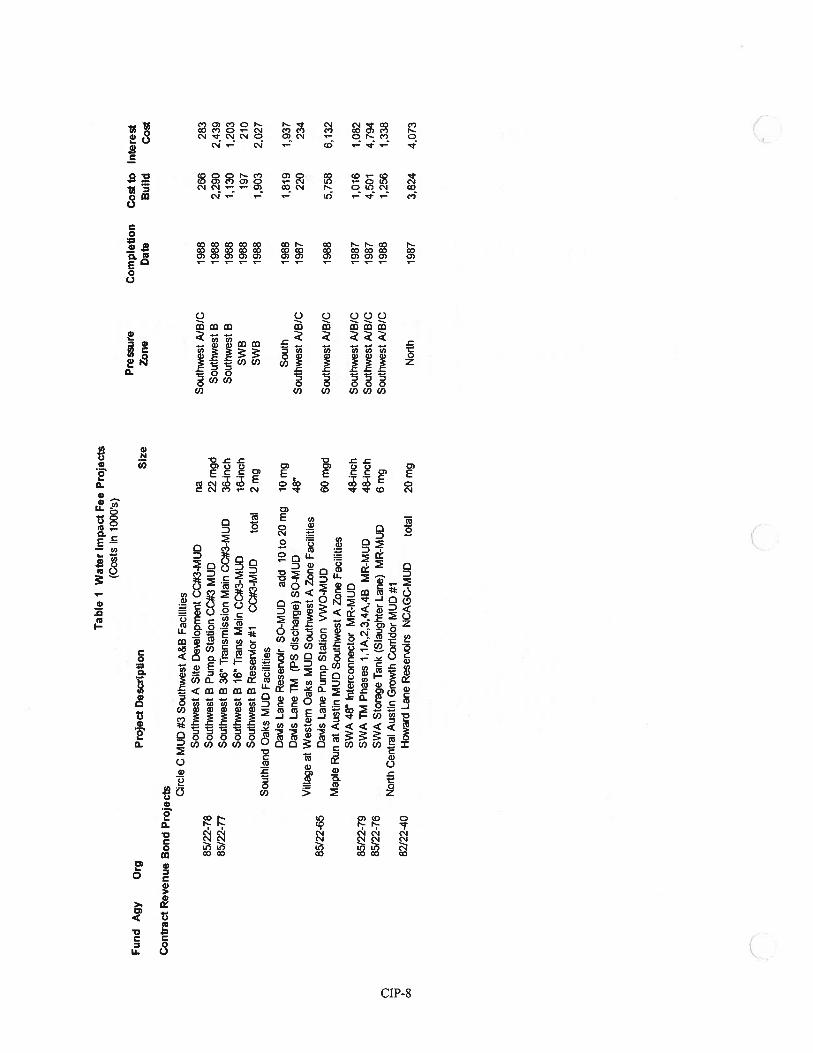
Tab
leI
Wat
erIm
pac
tF
eeP
roje
cts
(Cos
tsin
1000
’s)
Pre
ssure
Co
mp
leti
on
Cos
tto
Inte
rest
Fun
dA
gyO
rgP
roje
ctD
escr
ipti
on
Siz
eZ
one
Dat
eB
uild
Cos
t
Contr
act
Rev
enue
Bon
dP
roje
cts Cir
cle
CM
UD
#3S
outh
wes
tA
&B
Fac
Iiti
esS
outh
wes
tA
Sit
eD
eelo
pmen
tC
C#3
-MU
Dna
Sou
thw
est
A/B
/C19
8826
628
385
/22-
78S
outh
wes
tB
Pum
pS
tati
onC
C#3
MU
D22
mgd
Sou
thw
est
B19
882,
290
2,43
985
/22-
77S
outh
wes
tB
36”
Tra
nsm
issi
onM
ain
CC
#3-M
UD
36-i
nch
Sou
thw
est
B19
881,
130
1,20
3S
outh
wes
tB
16
Tra
nsM
ain
CC
#3-M
UD
16-i
nch
SW
B19
8819
721
0S
outh
wes
tB
Res
erio
r#1
CC
#3-M
UD
tota
l2m
gS
WB
1988
1,90
32,
027
Sou
thla
ndO
aks
MU
DF
acil
itie
sD
aAs
Lan
eR
eseR
oir
SO-M
UD
add
10to
20m
g10
mg
Sou
th19
881,
819
1,93
7D
as
Lan
eTM
(PS
disc
harg
e)SO
-MU
D48
”S
outh
wes
tA
/B/C
1987
220
234
Vill
age
atW
este
rnO
aks
MU
DS
outh
wes
tA
Zon
eF
acil
itie
s85
/22-
65D
aes
Lan
eP
ump
Sta
tion
VW
O-M
UD
60m
gdS
outh
wes
tA
/B/C
1988
5,75
86,
132
Map
leR
unat
Aus
tin
MU
DS
outh
wes
tA
Zon
eF
acil
itie
sS
WA
48”
Inte
rcon
nect
orM
R-M
UD
48-i
nch
Sou
thw
est
A/B
/C19
871,
016
1,08
285
/22-
79S
WA
TMP
has
es1,
1A,2
,3,4
A,4
BM
R-M
UD
48-i
nch
Sou
thw
est
A/B
/C19
874,
501
4,79
485
/22-
76S
WA
Sto
rage
Tan
k(S
laug
hter
Lan
e)M
R-M
UD
6m
gS
outh
wes
tA
/B/C
1988
1,25
61,
338
Nor
thC
entr
alA
usti
nG
row
thC
omdo
rM
UD
#18
2/2
24
0H
owar
dL
ane
Res
ervo
irs
NC
AG
C-M
UD
tota
l20
mg
Nor
th19
873,
824
4,07
3
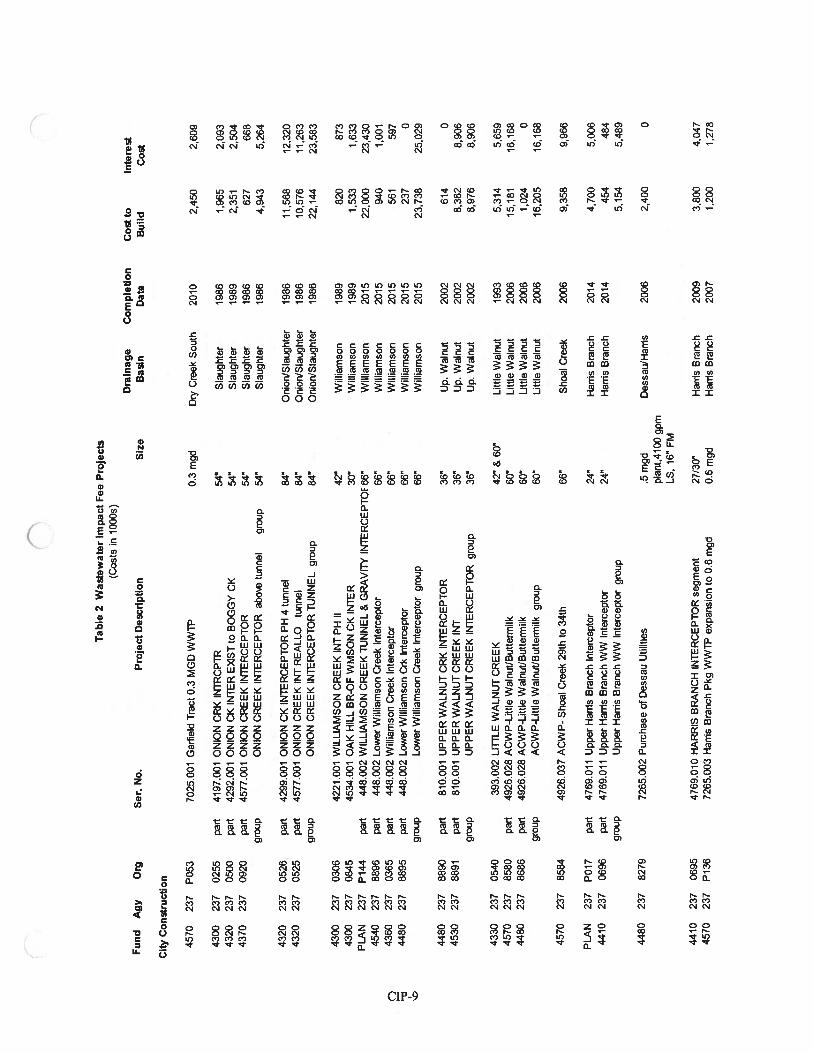
Fu
nd
Agy
Org
Ser
.N
o.
Tab
le2
Was
tew
ater
Impac
tF
eeP
roje
cts
(Cost
sin
bOO
s)
Pro
ject
Des
crip
tion
Siz
eD
rain
age
Co
mp
leti
on
Cost
toIn
tere
stB
asin
Dat
eB
uil
dC
ost
Cit
yC
on
stru
ctio
n
4570
237
P05
370
25.0
01G
arfi
eld
Tra
ct0.
3M
GD
WW
TP
Sla
ught
erS
laug
hter
Sla
ught
erS
laug
hter
2010
1986
1989
1986
1986
1,96
52,
351
627
4,94
3
2,09
32,
504
668
5,26
4
4570
237
8584
4926
.037
AC
WP-
Sho
alC
reek
29th
to34
th66
”S
hoal
Cre
ek20
069358
9,96
6
PLA
N23
7P
017
4410
237
0696
part
4769
.011
Upp
erH
ams
Bra
nch
Inte
rcep
tor
part
4769
.011
Upp
erH
ams
Bra
nch
WW
Inte
rcep
tor
grou
pU
pper
Ham
sB
ranc
hW
WIn
terc
epto
rgr
oup
Ham
sB
ranc
h20
14H
ams
Bra
nch
2014
4410
237
0695
4570
237
P13
6
.5m
gdD
essa
u/H
ams
2006
plan
t,410
0gp
mLS
,16
”FM
4300
237
0255
part
4320
237
0500
part
4370
237
0920
part
grou
p
4320
237
0526
4320
237
0525
0.3
mgd
4197
.001
ON
ION
CR
KIN
TR
CPT
R54
”42
92.0
01O
NIO
NC
KIN
TER
EXIS
Tto
SOG
GY
CK
54”
4577
.001
ON
ION
CR
EE
KIN
TE
RC
EPT
OR
54”
ON
ION
CR
EE
KIN
TE
RC
EPT
OR
abo
etu
nnel
grou
p54
”
Dry
Cre
ekS
outh
4300
4300
PLA
N45
4043
6044
80
2,45
0
237
0306
237
0845
237
P14
423
788
9623
703
6523
788
95C
2,60
9
4480
237
8890
4530
237
8891
4330
237
0540
4570
237
8580
4480
237
8686
part
4299
.001
ON
ION
CK
INT
ER
CE
PTO
RPH
4tu
nnel
84”
Oni
on/S
laug
hter
1986
11,5
6812
.320
part
4577
.001
ON
ION
CR
EE
KIN
TR
EA
LL
Otu
nnel
84”
Oni
on/S
laug
hter
1986
10,5
7611
,263
grou
pO
NIO
NC
RE
EK
INT
ER
CE
PTO
RTU
NN
ELgr
oup
84”
Oni
on/S
laug
hter
1986
22,1
4423
,583
4221
.001
WIL
LIA
MSO
NC
RE
EK
INT
PHII
42”
Will
iam
son
1989
820
873
4534
.001
OA
KH
ILL
BR
-OF
WM
SON
CK
INTE
R30
”W
illia
mso
n19
891,
533
1,63
3pa
rt44
8.00
2W
ILL
IAM
SON
CR
EE
KTU
NN
EL&
GR
AV
ITY
INT
ER
CE
PTO
F66”
Will
iam
son
2015
22,0
0023
,430
part
448.
002
Low
erW
illia
mso
nC
reek
Inte
rcep
tor
66”
Will
iam
son
2015
940
1,00
1pa
rt44
8.00
2W
illia
mso
nC
reek
Inte
rcep
tor
66”
Will
iam
son
2015
561
597
part
448.
002
Low
erW
illia
mso
nC
rkIn
terc
epto
r66
”W
illia
mso
n20
1523
70
grou
pL
ower
Will
iam
son
Cte
ekIn
terc
epto
rgr
oup
66”
Will
iam
son
2015
23,7
3825
,029
part
810.
001
UP
PE
RW
ALN
UT
CR
KIN
TE
RC
EPT
OR
36”
Up.
Wal
nut
2002
614
0pa
rt81
0.00
1U
PP
ER
WA
LN
UT
CR
EE
KIN
T36
”U
p.W
alnu
t20
028,
362
8,90
6gr
oup
UP
PE
RW
AL
NU
TC
RE
EK
INT
ER
CE
PTO
Rgr
oup
36”
Up.
Wal
nut
2002
8,97
68,
906
393.
002
LITT
LEW
AL
NU
TC
RE
EK
42”
&60
”L
ittle
Wal
nut
1993
5,31
45,
659
part
4926
.028
AC
WP-
Litt
leW
alnu
t/But
term
ilk60
”Li
ttle
Wal
nut
2006
15,1
8116
,168
part
4926
.028
AC
WP-
Litt
leW
alnu
t/But
term
ilk60
”Li
ttle
Wal
nut
2006
1,02
40
grou
pA
CW
P-L
ittle
Wal
nut/B
utte
rmilk
grou
p60
”L
ittle
Wal
nut
2006
16,2
0516
,168
4480
237
8279
7265
.002
Pur
chas
eof
Des
sau
Util
ities
24”
24”
4,70
045
45,
154
5,00
648
45,
489
2,40
00
Ham
sB
ranc
h20
09H
ams
Bra
nch
2007
3,80
01,
200
4,04
71,
278
4769
.010
HA
RR
ISB
RA
NC
HIN
TE
RC
EPT
OR
segm
ent
27/3
0”72
65.0
03H
ams
Bra
nch
Pkg
WW
TP
expa
nsio
nto
0.6
mgd
0.6
mgd
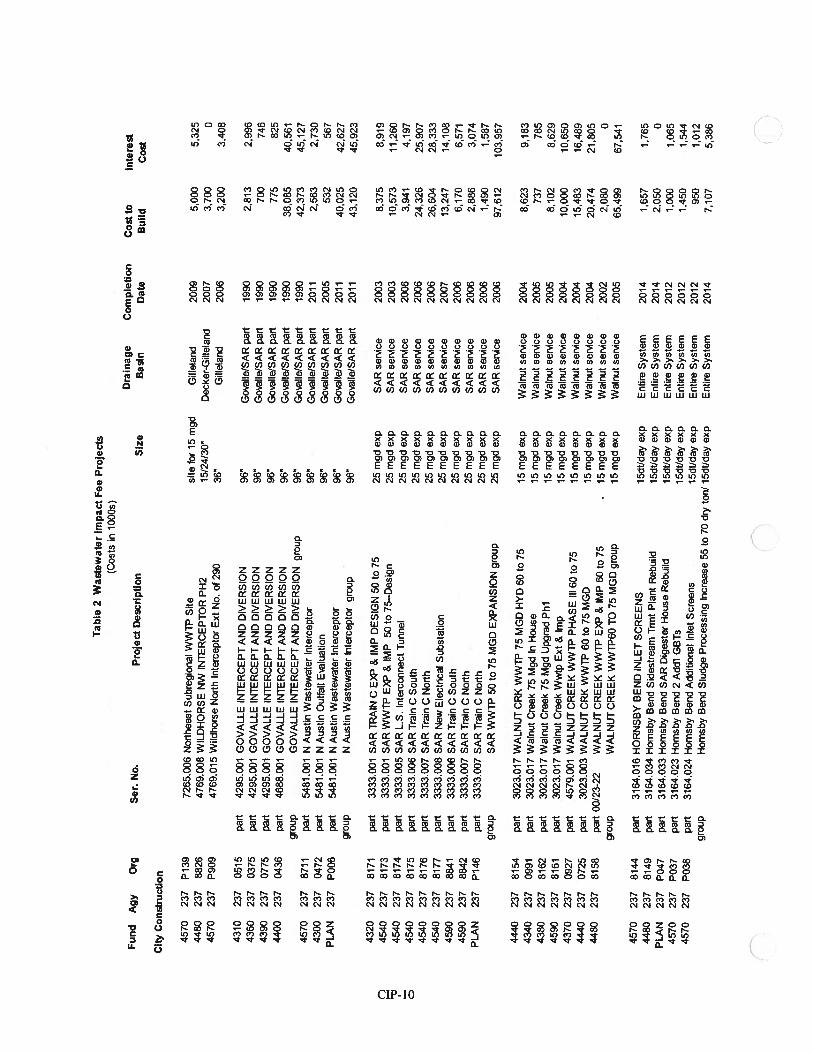
Cit
yC
onst
ruct
ion
Tab
le2
Was
tew
ater
Imp
act
Fee
Pro
ject
s(C
osts
inl0
00s)
Pro
ject
Des
crip
tio
nS
ize
Fu
nd
Agy
Org
Ser
.N
o.D
rain
age
Co
mp
leti
on
Co
stto
inte
rest
Bas
inD
ate
Bui
ldC
ost
4320
C)
4540
‘;e45
4045
4045
4045
4045
9045
90PL
AN
237
237
237
237
237
237
237
237
237
8171
8173
8174
8175
8176
8177
8841
8842
P14
6
4570
237
P13
972
65.0
06N
orth
east
Sub
regi
onal
WW
TP
Sit
esi
tefo
r15
mgd
Gil
lela
nd20
095,
000
5,32
544
8023
788
2647
69.0
08W
ILD
HO
RS
EN
WIN
TE
RC
EP
TO
RP
H2
15/2
4/30
”D
ecke
r-G
ilie
land
2007
3,70
00
4570
237
P90
947
69.0
15W
ildh
ose
Nor
thIn
terc
epto
rE
xtN
o.of
290
36”
Gil
lela
nd20
063,
200
3,40
8
4310
237
0515
part
4295
.001
GO
VA
LL
EIN
TE
RC
EP
TA
ND
DIV
ER
SIO
N96
”G
oval
le/S
AR
part
1990
2,81
32,
996
4360
237
0375
part
4295
.001
GO
VA
LL
EIN
TE
RC
EP
TA
ND
DIV
ER
SIO
N96
”G
oaI
le/S
AR
part
1990
700
746
4390
237
0775
part
4295
.001
GO
VA
LL
EIN
TE
RC
EP
TA
ND
DIV
ER
SIO
N96
”G
o’ia
lle/S
AR
part
1990
775
825
4400
237
0436
part
4688
.001
GO
VA
LL
EIN
TE
RC
EP
TA
ND
DIV
ER
SIO
N96
”G
o’aI
Ie1S
AR
part
1990
38.0
8540
,561
grou
pG
OV
AL
LE
INT
ER
CE
PT
AN
DD
IVE
RSI
ON
grou
p96
”G
oaI
Ie/S
AR
part
1990
42,3
7345
,127
4570
237
8711
part
5481
.001
NA
usti
nW
aste
wat
erIn
terc
epto
r96
”G
oal
Ie/S
AR
part
2011
2,56
32,
730
4300
237
0472
part
5481
.001
NA
usti
nO
utfa
llE
aIuat
ion
96”
Goal
le/S
AR
part
2005
532
567
PLA
N23
7P
006
part
5481
.001
NA
usti
nW
aste
wat
erIn
terc
epto
r96
”G
oaI
Ie/S
AR
part
2011
40,0
2542
,627
grou
pN
Aus
tin
Was
tew
ater
Inte
rcep
tor
grou
p96
”G
oaI
Ie/S
AR
part
2011
43,1
2045
.923
part
3333
.001
SA
RT
RA
INC
E)l
&IM
PD
ES
IGN
50to
7525
mgd
exp
SA
Rse
rice
2003
8,37
58,
919
part
3333
.001
SA
RW
WT
PE
)0’
&IM
P50
to75
—D
esig
n25
mgd
exp
SA
Rse
rMce
2003
10,5
7311
,260
part
3333
.005
SA
RL
.S.
Inte
rcon
nect
Tun
nel
25m
gdex
pS
AR
seri
ce
2006
3,94
14,
197
part
3333
.006
SA
RT
rain
CS
outh
25m
gdex
pS
AR
senA
ce20
0624
,326
25.9
07pa
rt33
33.0
07S
AR
Tra
inC
Nor
th25
mgd
exp
SA
Rse
r’ic
e20
0626
,604
28,3
33pa
rt33
33.0
08S
AR
New
Ele
ctri
cal
Su
bst
atio
n25
mgd
exp
SA
Rse
ruce
2007
13,2
4714
,108
part
3333
.006
SA
RT
rain
CS
outh
25m
gdex
pS
AR
serM
ce20
066,
170
6,57
1pa
rt33
33.0
07S
AR
Tra
inC
Nor
th25
mgd
exp
SA
Rse
ruce
2006
2,88
63,
074
part
3333
.007
SA
RT
rain
CN
orth
25m
gdex
pS
AR
seru
ce20
061,
490
1,58
7gr
oup
SA
RW
WT
P50
to75
MG
DE
)?A
NS
ION
grou
p25
mgd
exp
SA
Rse
n.ic
e20
0697
,612
103,
957
4440
237
8154
part
3023
.017
WA
LN
UT
CR
I<W
WT
P75
MG
DH
YD
60to
7515
mgd
exp
Wal
nut
serv
ice
2004
8,62
39,
183
4340
237
0991
part
3023
.017
Wal
nut
Cre
ek75
Mgd
InH
ouse
15m
gdex
pW
alnu
tse
r’A
ce20
0573
778
543
8023
781
62pa
rt30
23.0
17W
alnu
tC
reek
75M
gdU
pgra
dP
hi
15m
gdex
pW
alnu
tse
ruce
2005
8,10
28,
629
4590
237
8161
part
3023
.017
Wal
nut
Cre
ekW
wtp
Ext
&Im
p15
mgd
exp
Wal
nut
seru
ce20
0410
,000
10,6
5043
7023
709
27pa
rt45
79,0
01W
AL
NU
TC
RE
EK
WW
TP
PH
AS
EIII
60to
7515
mgd
exp
Wal
nut
seru
ce20
0415
,483
16,4
8944
4023
707
25pa
rt30
23.0
03W
AL
NU
TC
RK
WW
TP
60to
75M
GD
15m
gdex
pW
alnu
tse
ruce
2004
20.4
7421
,805
4480
237
8158
part
00/2
3-22
WA
LN
UT
CR
EE
KW
WT
PE
)P&
IMP
60to
75.
15m
gdex
pW
alnu
tse
ruce
2002
2,08
00
grou
pW
AL
NU
TC
RE
EK
WW
TP
6OT
O75
MG
Dgr
oup
15m
gdex
pW
alnu
tse
r’A
ce20
0565
,499
67,5
41
4570
237
8144
part
3164
.016
HO
RN
SB
YB
EN
DIN
LE
TS
CR
EE
NS
l5d
t/d
ayex
pE
ntir
eS
yst
em20
141,
657
1,76
544
8023
781
49pa
rt31
64.0
34H
omsb
yB
end
Sid
estr
eam
Tm
,tP
lant
Reb
uild
l5d
tld
ayex
pE
ntir
eS
yst
em20
142,
050
0PL
AN
237
P04
7pa
rt31
64.0
33H
omsb
yB
end
SA
RD
iges
ter
Hou
seR
ebui
ldl5
dtl
day
exp
Ent
ire
Syst
em20
121,
000
1,06
545
7023
7P
037
part
3164
.023
Hom
sby
Ben
d2
Add
’lG
BT
5lS
dt/
day
exp
Ent
ire
Syst
em20
121,
450
1,54
445
7023
7P
038
part
3164
.024
Hom
sby
Ben
dA
ddit
iona
lIn
let
Scr
een
sl5
dt/
day
exp
Ent
ire
Syst
em20
1295
01,
012
grou
pH
omsb
yB
end
Slu
dge
Pro
cess
ing
Incr
ease
55to
70dr
yto
nil5
dti
day
exp
Ent
ire
Syst
em20
147,
107
5,38
6
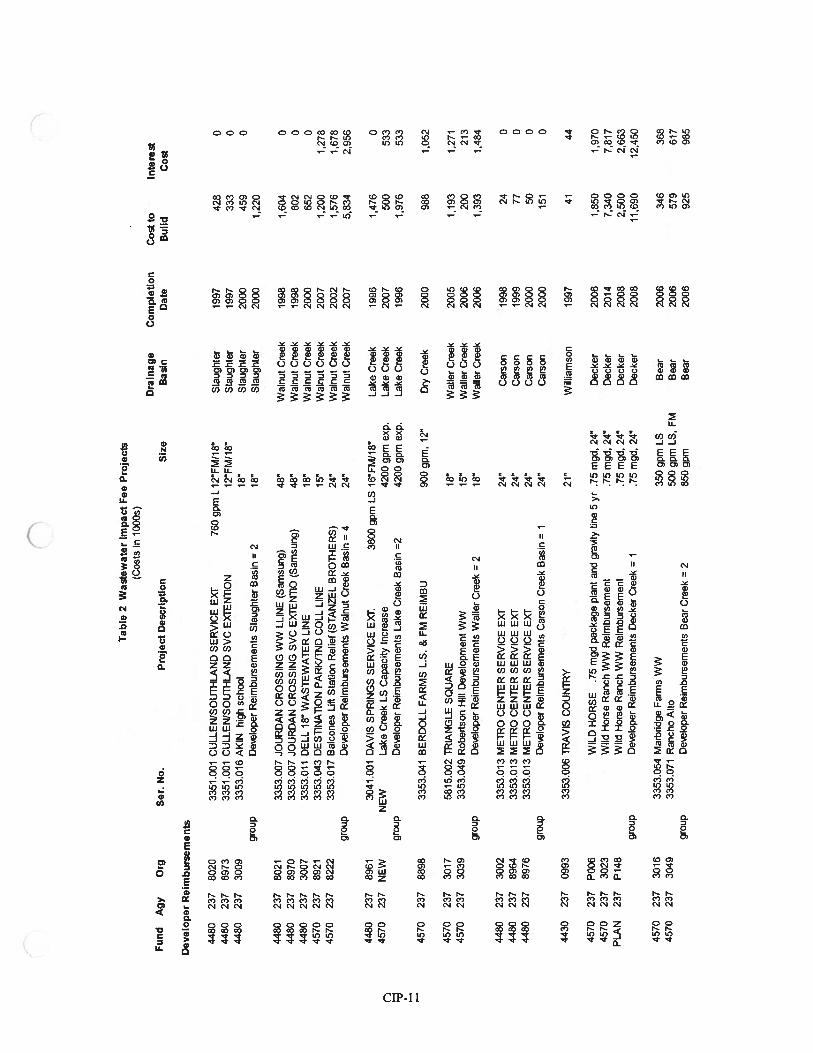
Tab
le2
Was
tew
ater
Imp
act
Fee
Pro
ject
s(C
osts
inl0
00
s)D
rain
age
Com
ple
tion
Cos
tto
Inte
rest
Fund
Agy
Org
Ser
.N
o.P
roje
ctD
escr
ipti
on
Siz
eB
asin
Dat
eB
uild
Co
st
Dev
elo
per
Rei
mb
urs
emen
ts
4480
237
8020
3351
.001
CU
LL
EN
ISO
UT
HL
AN
DS
ER
VIC
EEX
T76
0gp
mL
12”F
M/1
8”S
laug
hter
1997
428
044
8023
789
7333
51.0
01C
UL
LE
NIS
OU
TI-
ILA
ND
SV
CE
XT
EN
11O
N12
”FM
/18”
Sla
ught
er19
9733
30
4.4.
8023
730
0933
53.0
16A
KIN
high
scho
ol18
”S
laug
hter
2000
459
0gr
oup
DeI
op
erR
eim
burs
emen
tsS
laug
hter
Bas
in=
218
”S
laug
hter
2000
1,22
0
4480
237
8021
3353
.007
JOU
RD
AN
CR
OS
SIN
GW
WLL
INE
(Sam
sung
)48
”W
alnu
tC
reek
1998
1,60
40
4480
237
8970
3353
.007
JOU
RD
AN
CR
OS
SIN
GS
VC
EX
TE
NT
JO(S
amsu
ng)
48”
Wal
nut
Cre
ek19
9880
20
4480
237
3007
3353
.011
DE
LL
18”
WA
STE
WA
TE
RLI
NE
18”
Wal
nut
Cre
ek20
0065
20
4570
237
8921
3353
.043
DE
STIN
A11
ON
PA
RK
/IN
DC
OL
LLI
NE
15”
Wal
nut
Cre
ek20
071,
200
1,27
845
7023
782
2233
53.0
17B
alco
nes
Lift
Sta
tion
Rel
ief
(ST
AN
ZE
LB
RO
TH
ER
S)
24”
Wal
nut
Cre
ek20
021,
576
1,67
8gr
oup
Dee
Iop
erR
eim
burs
emen
tsW
alnu
tC
reek
Bas
in=
424
”W
alnu
tC
reek
2007
5,83
42,
956
4480
237
8961
3041
.001
DA
VIS
SP
RIN
GS
SE
RV
ICE
EXT.
3600
gpm
LS
16”F
M/1
8”L
ake
Cre
ek19
961,
476
045
7023
7N
EW
NE
WL
ake
Cre
ekL
SC
apac
ity
Incr
ease
4200
gpm
exp.
Lak
eC
reek
2007
500
533
grou
pD
eeIo
per
Rei
mburs
emen
tsL
ake
Cre
ekB
asin
“242
00gp
mex
p.L
ake
Cre
ek19
961,
976
533
—45
7023
788
9833
53.0
41B
ER
DO
LL
FAR
MS
L.S
.&
FMR
EIM
BU
900
gpm
,12
”D
ryC
reek
2000
988
10
52
4570
237
3017
5815
.002
TR
IAN
GL
ES
QU
AR
E18
”W
aIle
rC
reek
2005
1,19
31,
271
4570
237
3039
3353
.049
Rob
erts
onH
illD
eeIo
pm
ent
WW
15”
WaI
ler
Cre
ek20
0620
021
3gr
oup
Dee
lop
erR
eim
burs
emen
tsW
aile
rC
reek
=2
18”
WaI
ler
Cre
ek20
061,
393
1484
4480
237
3002
3353
.013
ME
TR
OC
EN
TE
RS
ER
VIC
EEX
T24
”C
arso
n19
9824
044
8023
789
6433
53.0
13M
ET
RO
CE
NT
ER
SE
RV
ICE
EXT
24°
Car
son
1999
770
4480
237
8976
3353
.013
ME
TR
OC
EN
TE
RS
ER
VIC
EE
Xt
24”
Car
son
2000
500
grou
pD
eeIo
per
Rei
mburs
emen
tsC
arso
nC
reek
Bas
in=
124
”C
arso
n20
0015
10
4430
237
0993
3353
.006
TRA
VIS
CO
UN
TR
Y21
”W
illi
amso
n19
9741
44
4570
237
P00
6W
ILD
HO
RS
E.7
5m
gdp
ack
age
plan
tan
dgr
a4ty
line
5yr
.75
mgd
,24
”D
ecke
r20
061.
850
1,97
045
7023
730
23W
ildH
orse
Ran
chW
WR
eim
burs
emen
t.7
5m
gd,
24”
Dec
ker
2014
7,34
07,
817
PLA
N23
7P
148
Wild
Hor
seR
anch
WW
Rei
mbu
rsem
ent
.75
mgd
,24
”D
ecke
r20
082,
500
2,66
3gr
oup
Dee
loper
Rei
mburs
emen
tsD
ecke
rC
reek
1.7
5m
gd,
24”
Dec
ker
2008
11,6
9012
,450
4570
237
3016
3353
.054
Mar
bndg
eF
arm
sW
W35
0gp
mL
SB
ear
2006
346
368
4570
237
3049
3353
.071
Ran
cho
Alto
500
gpm
LS,
FMB
ear
2006
579
617
grou
pD
eeIo
per
Rei
mburs
emen
tsB
ear
Cre
ek=
285
0gp
mB
ear
2006
925
985
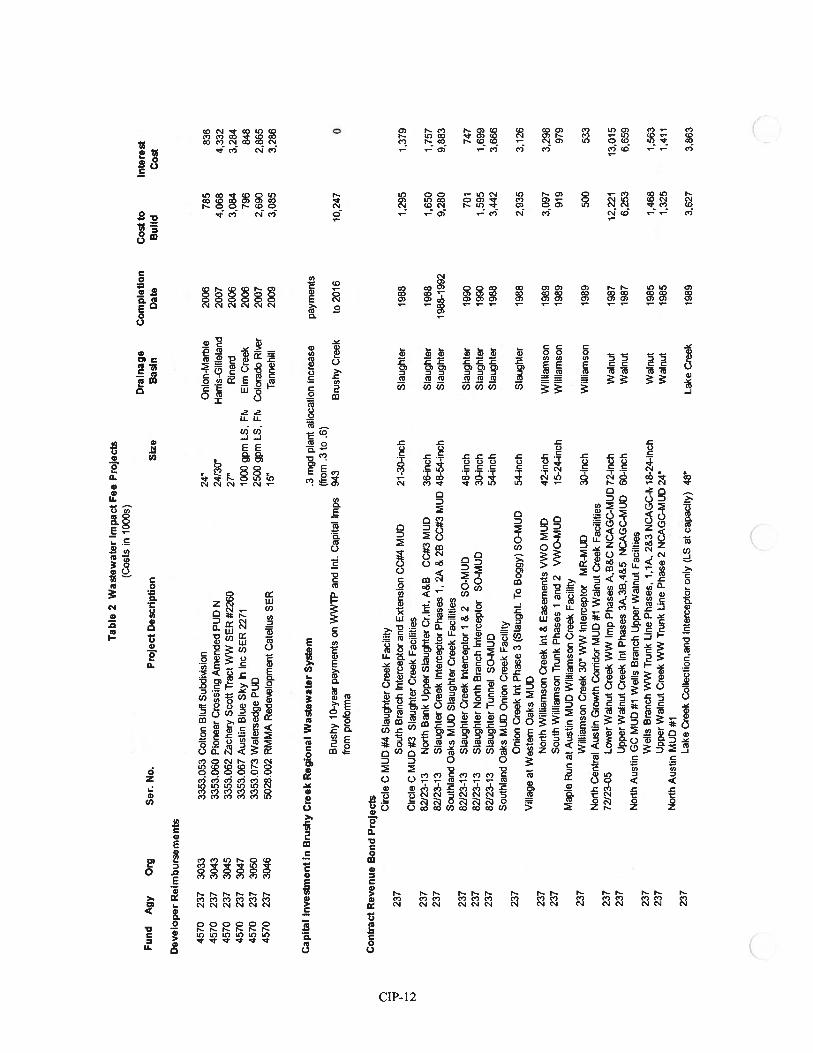
Tab
le2
Was
tew
ater
Impac
tF
eeP
roje
cts
(Cos
tsin
bOO
s)D
rain
age
Com
ple
tion
Cost
toIn
tere
stF
und
Agy
Org
Ser
.N
o.P
roje
ctD
escr
ipti
on
Siz
eB
asin
Dat
eB
uild
Co
st
Dev
eloper
Rei
mb
urs
emen
ts
4570
237
3033
3353
.053
Col
ton
Blu
ffSu
txliM
sion
24
Oni
on-M
arbl
e20
0678
583
645
7023
730
4333
53.0
60P
ione
erC
ross
ing
Am
ende
dP
UD
N2
4I3
0H
arri
s-G
illel
and
2007
4,06
84,
332
4570
237
3045
3353
.062
Zac
hery
Sco
ttT
ract
WW
SE
R#2
260
27’
Rin
ard
2006
3,08
43,
284
4570
237
3047
3353
.067
Aus
tin
Blu
eS
kyIn
Inc
SE
R22
7110
00gp
mL
S,F
kE
lmC
reek
2006
796
848
4570
237
3050
3353
.073
Wat
erse
dge
PUD
2500
gpm
LS,
Fk
Col
orad
oR
ier
2007
2,69
02,
865
4570
237
3046
5028
.002
RM
MA
Red
eelo
pm
ent
Cat
ellu
sS
ER
15
Tan
nehi
ll20
093.
085
3,28
6
Cap
ital
Inves
tmen
tin
Bru
shy
Cre
ekR
egio
nal
Was
tew
ater
Syst
em.3
mgd
plan
tal
loca
tion
incr
ease
pay
men
ts(f
rom
.3to
.6)
Bru
shy
10-y
ear
pay
men
tson
WW
TP
and
nt.
Cap
ital
Imps
943
Bru
shy
Cre
ekto
2016
10,2
470
from
prof
orm
a
Co
ntr
act
Rev
enue
Bond
Pro
ject
sC’
)C
ircl
eC
MU
D#4
Sla
ught
erC
reek
Fac
ilit
y23
7S
outh
Bra
nch
lnte
rcep
to4-
and
Ext
ensi
onC
C#4
MU
D21
-30-
inch
Sla
ught
er19
881,
295
1,37
9C
ircl
eC
MU
D#3
Sla
ught
erC
reek
Fac
ilit
ies
237
8212
3-13
Nor
thB
ank
Upp
erS
laug
hter
Cr.
lnt.
A&
BC
C#3
MU
D36
-inc
hS
laug
hter
1988
1650
1,75
723
782
123-
13S
laug
hter
Cre
ekIn
terc
epto
rP
has
es1,
2A&
2BC
C#3
MU
D48
-54-
inch
Sla
ught
er19
88-1
992
9280
9,88
3S
outh
land
Oak
sM
UD
Sla
ught
erC
reek
Fac
ilit
ies
237
8212
3-13
Sla
ught
erC
reek
Inte
rcep
tor
I&
2S
O-M
UD
48-i
nch
Sla
ught
er19
9070
174
723
782
123-
13S
laug
hter
Nor
thB
ranc
hIn
terc
epto
rS
O-M
UD
30-i
nch
Sla
ught
er19
901,
595
1.69
923
782
123-
13S
laug
hter
Tun
nel
SO-M
UD
54-i
nch
Sla
ught
er19
883,
4.42
3,66
6S
outh
land
Oak
sM
UD
Oni
onC
reek
Fac
ilit
y23
7O
nion
Cre
ekm
tP
has
e3
(Sla
ught
.To
Bog
gy)
SO-M
UD
54-i
nch
Sla
ught
er19
882,
935
3,12
6V
illa
geat
Wes
tern
Oak
sM
UD
237
Nor
thW
illi
amso
nC
reek
Int
&E
asem
ents
VW
OM
UD
42-i
nch
Wil
liam
son
1989
3,09
73,
298
237
Sou
thW
illi
amso
nT
runk
Phas
es1
and
2V
WO
-MU
D15
-24-
inch
Wil
liam
son
1989
919
979
Map
leR
unat
Aus
tin
MU
DW
illi
amso
nC
reek
Fac
ilit
y23
7W
illi
amso
nC
reek
30
WW
Inte
rcep
tor
MR
-MU
D30
-inc
hW
illi
amso
n19
8950
053
3N
orth
Cen
tral
Aus
tin
Gro
wth
Cor
rido
rM
UD
#1W
alnu
tC
reek
Fac
ilit
ies
237
72/2
3-05
Low
erW
alnu
tC
reek
WW
Imp
Phas
esA
,B&
CN
CA
GC
-MU
D72
-inc
hW
alnu
t19
8712
,221
13,0
1523
7U
pper
Wal
nut
Cre
ekln
tP
has
es3A
,38,
4&5
NC
AG
C-M
UD
60-i
nch
Wal
nut
1987
6,25
36,
659
Nor
thA
usti
nG
CM
UD
#1W
ells
Bra
nch
Upp
erW
alnu
tF
acil
ties
237
Wel
lsB
ranc
hW
WT
runk
Lin
eP
has
es,
1,1A
,2&
3N
CA
GC
-18
-24-
inch
Wal
nut
1985
1,46
81,
563
237
Upp
erW
alnu
tC
reek
WW
Tru
nkL
ine
Ph
ase
2N
CA
GC
-MU
D24
’W
alnu
t19
851,
325
1,41
1N
orth
Aus
tin
MU
D#1
237
Lak
eC
reek
Col
lect
ion,
and
Inte
rcep
tor
only
(LS
atca
pac
ity)
4&L
ake
Cre
ek19
893,
627
3,86
3
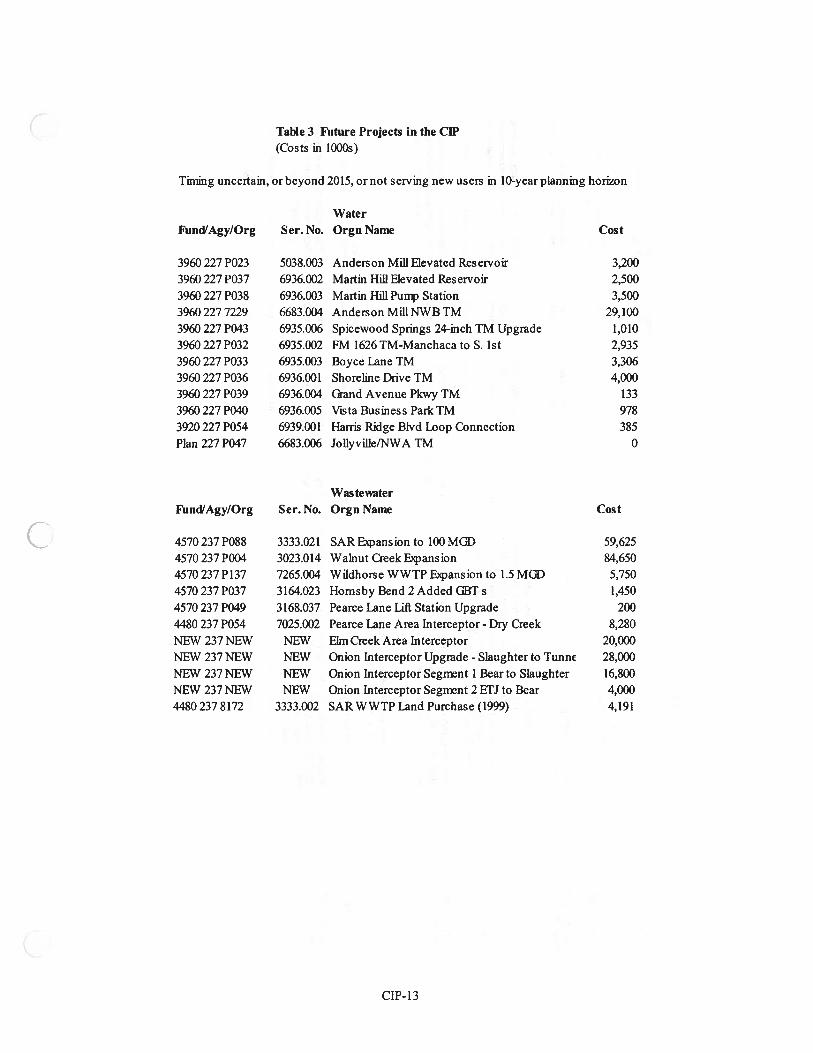
Table 3 Future Projects in the CIP(Costs in l000s)
Timing uncertain, or beyond 2015, or not serving new users in 10-year planning horizon
WaterFund/Agy/Org Ser. No. Orgn Name Cost
3960 227 P023 5038.003 Anderson Mill Elevated Reservoir 3,2003960 227 P037 6936.002 Martin Hill Elevated Reservoir 2,5003960 227 P038 6936,003 Martin Hill Pump Station 3,5003960 227 7229 6683.004 Anderson Mill NWI3 TM 29,1003960 227 P043 6935.006 Spicewood Springs 24-inch TM Upgrade 1,0103960 227 P032 6935.002 FM 1626 TM-Manchaca to S. 1st 2,9353960 227 P033 6935.003 Boyce I.ane TM 3,3063960 227 P036 6936.001 Shoreline Drive TM 4,0003960 227 P039 6936.004 Grand Avenue Pkwy TM 1333960 227 P040 6936.005 Vista Business Park TM 9783920 227 P054 6939.00 1 Hams Ridge Blvd Loop Connection 385Plan 227 P047 6683.006 Jollyville/NWA TM 0
Was testerFund/Agy/Org Ser. No. Orgn Name Cost
4570 237 P088 3333.021 SAR Expansion to 100 MGI) 59,6254570 237 P004 3023.0 14 Walnut Creek Expansion 84,6504570 237 P137 7265.004 Wildhorse WWTP Expansion to 1.5 MGI) 5,7504570 237 P037 3164.023 Homsby Bend 2 Added GBT s 1,4504570 237 P049 3 168.037 Pearce Lane Lift Station Upgrade 2004480 237 P054 7025.002 Pearce Lane Area Interceptor - Dry Creek 8,280NEW 237 NEW NEW Elm Creek Area Interceptor 20,000NEW 237 NEW NEW Onion Interceptor Upgrade - Slaughter to Tunn 28,000NEW 237 NEW NEW Onion Interceptor Segment I Bear to Slaughter 16,800NEW 237 NEW NEW Onion Interceptor Segment 2 FF3 to Bear 4,0004480 237 8172 3333.002 SAR WWTP Land Purchase (1999) 4,191
CIP- 13
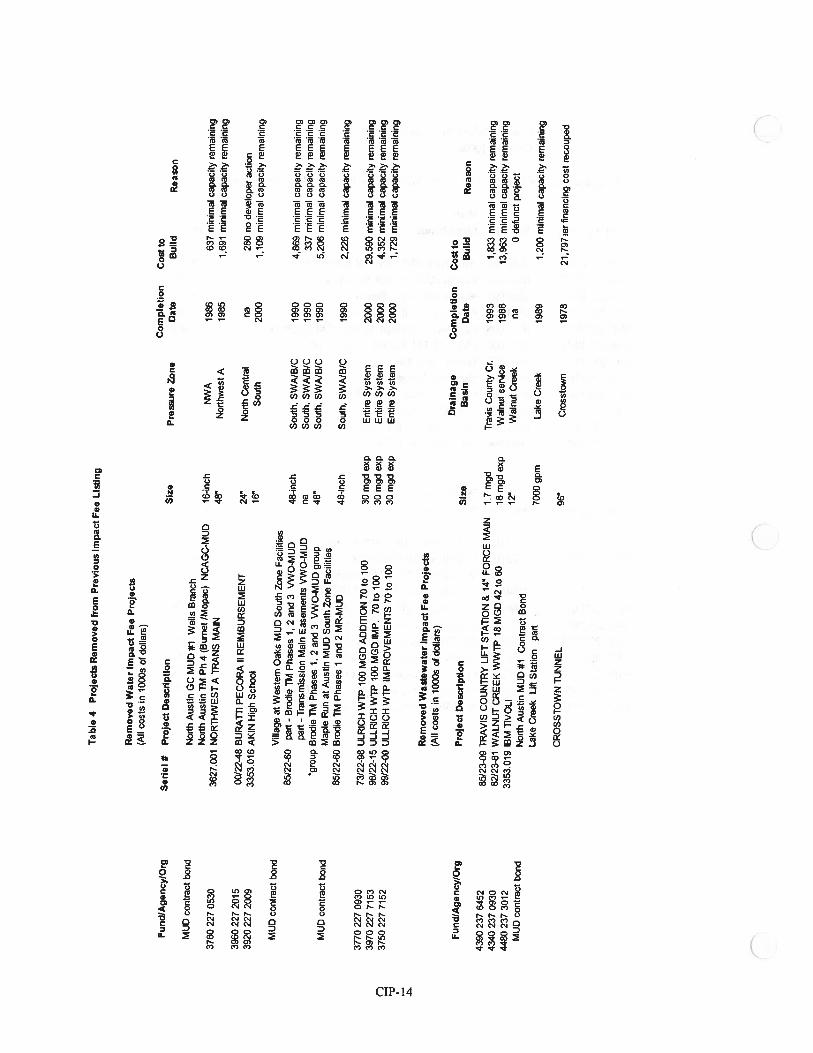
Tab
le4
Pro
ject
sR
emoved
from
Pre
vio
us
Impa
ctF
eeL
isti
ng
Rem
oved
Wat
erIm
pac
tF
eeP
roje
cts
(All
cost
sin
l000
sof
dolla
rs)
Com
plet
ion
Cos
t to
Fun
d/A
genc
ylO
rgS
erie
l#
Pro
ject
Des
crip
tion
Siz
eP
ress
ure
Zon
eD
ate
Bui
ldR
easo
nM
UD
cont
ract
bond
Nor
thA
ustin
GC
MU
D#1
Wel
lsB
ranc
hN
orth
Aus
tinTM
Ph
4(B
urne
tIM
opac
)N
CA
GC
-MU
D16
-inc
hN
WA
1986
637
min
imal
capa
city
rem
aini
ng37
8022
705
3036
27.0
01N
OR
TH
WE
STA
TR
AN
SM
AIN
48”
Nor
thw
est
A19
851.
691
min
imal
capa
city
rem
aini
ng39
6022
720
1500
/22-
48B
UR
AT
flPE
CO
RA
IIR
EIM
BU
RSE
ME
NT
24”
Nor
thC
entr
alna
280
node
.elo
per
acti
on39
2022
720
0933
53.0
16A
KIN
Hig
hSc
hool
16”
Sout
h20
001,
109
min
imal
capa
city
rem
aini
ngM
UD
cont
ract
bond
Vill
age
atW
este
rnO
aks
MU
DS
outh
Zon
eFa
cilit
ies
85/2
2-60
part
-B
rodi
eTM
Phas
es1,
2an
d3
\ñN
O-M
UD
48-i
nch
Sout
h,SW
A/B
/C19
904,
869
min
imal
capa
city
rem
aini
ngpa
rt-
Tra
nsm
issi
onM
ain
Eas
emen
tsV
WO
-MU
Dna
Sout
h,SW
A/B
/C19
9033
7m
inim
alca
paci
tyre
mai
ning
grou
pB
rodi
eTM
Ph
ases
1,2
and
3V
WO
-MU
Dgr
oup
48
Sout
h.SW
AIB
/C19
905,
206
min
imal
capa
city
rem
aini
ngM
UD
cont
ract
bond
Map
leR
unat
Aus
tinM
UD
Sou
thZ
one
Faci
litie
s85
/22-
60B
rodi
eTM
Ph
ases
1an
d2
MR
-MU
D48
-inc
hSo
uth,
SWA
/B/C
1990
2.22
6m
inim
alca
paci
tyre
mai
ning
3770
227
0930
73/2
2-98
ULR
ICH
Wi?
100
MG
DA
DD
ITIO
N70
to10
030
mgd
exp
Ent
ire
Sys
tem
2000
29,5
90m
inim
alca
paci
tyre
mai
ning
3970
227
7153
98/2
2-15
ULL
RIC
HW
i?10
0M
GD
IMP.
70to
100
30m
gdex
pE
ntir
eS
yste
m20
004,
352
min
imal
capa
city
rem
aini
ng37
5022
771
5299
/22-
00U
LLR
ICH
WT
PIM
PRO
VE
ME
NT
S70
to10
030
mgd
exp
Ent
ire
Sys
tem
2000
1,72
9m
inim
alca
paci
tyre
mai
ning
Rem
oved
Was
tew
ater
Impa
ctF
eeP
roje
cts
(All
cost
sin
l000
sof
dolla
rs)
Dra
inag
eC
ompl
etio
nC
ost
toF
und(
Age
ncyl
Org
Pro
ject
Des
crip
tion
Siz
eB
asin
Dat
eB
uild
Rea
son
4390
237
6452
85/2
3-09
TRA
VIS
CO
UN
TR
YLI
FTST
ATI
ON
&14
”FO
RC
EM
AIN
1.7
mgd
Tra’
As
Cou
nty
Cr.
1993
1,83
3m
inim
alca
paci
tyre
mai
ning
4340
237
0930
82/2
3-81
WA
LN
UT
CR
EE
KW
WT
P18
MG
D42
to60
18m
gdex
pW
alnu
tse
rice
1988
13,9
63m
inim
alca
paci
tyre
mai
ning
4480
237
3012
3353
.019
IBM
11V
OLI
12”
Wal
nut
Cre
ekna
0de
func
tpr
ojec
tM
UD
cont
ract
bond
Nor
thA
ustin
MU
D#1
Con
trac
tB
ond
Lak
eC
reek
Lift
Sta
tion
part
7000
gpm
Lak
eC
reek
1989
1,20
0m
inim
alca
paci
tyre
mai
ning
CR
OSS
TO
WN
TU
NN
EL
96”
Cro
ssto
wn
1978
21,7
97ar
fina
ncin
gco
stre
coup
ed
Using the methodology described later in this document, major facilities targeted to benefit new growth were identifiedand the portions of capacity serving existing and future users estimated. To provide an overall comparison of thecapacity and costs associated with new growth projects versus those associated with existing needs, the recent CapitalImprovements Program (CIP) projects of the Austin Water Utility have been divided into the three groups. AppendicesC and D include those projects from the FY 2006/2007 CIP built in prior years or scheduled to be built in the next fewyears that are targeted to benefit existing users and to meet stricter safety, efficiency, environmental or regulatorystandards. Tables 1 and 2 list those water and wastewater impact fee projects that have been built or plan to be built inthe future and that will largely benefit new Utility customers during the next ten years. Table 3 is composed of projects
that are anticipated to be built late in the ten-year planning period or beyond, and thus are not included in the group ofprojects on which impact fee calculations are based.
A comparison of the dollar value of projects in the Appendices and Tables 1, 2, and 3 gives an indication of the relativeinvestment in capacity to serve existing and future needs (as defined by the law) as a function of the CapitalImprovements Programs (CIPs) of 1 980s. Some of the projects in Appendices C and D will certainly benefit futureusers; however, in order to take a conservative approach to ensuring full compliance with the law, they will not beconsidered impact fee projects when they are made necessary by environmental and regulatory requirements. Otherprojects in Appendices C and D will also benefit future users as well as existing users (annexation areas, highwayutility relocations, and certain trunk lines internal to the system) but when their benefit to existing users outweighs thebenefit to future users, they are not included in with the impact fee projects in Tables I and 2.
Analysis of the level of existing usage of capacity in the case of water and wastewater treatment plants is astraightforward examination of flow data. Flow data for pipes in the water distribution system and wastewatercollection system is generally not available, so hydraulic models are used to help estimate utilization levels of pipesunder selected demand conditions (existing or future). The summary tables at the end of this document, Tables 12 and
13, include an estimate of the existing users and the total capacity of impact fee projects expressed in service units forwater pressure zones and wastewater collection areas. Inspection of these figures gives an indication of the level ofexisting capacity usage and the reserve capacity associated with the facilities.
In the January 1999 addendum the City extended the scope of the impact fees to cover decentralized cluster wastewatertreatment and disposal systems for which some funding is provided by the City. No such systems exist in 2006;therefore, existing capacity, use and commitments of such systems equals zero. All new facilities of this type will beused to serve new development.
In sizing and timing new facilities, both population projections (the Land Use Assumptions) and trending fromhistorical flow data regression are used in predicting demands (flows) associated with future growth. These demandsare then input into the computer models. Model simulations yield the necessary pipe capacity to meet pressure and
flow performance objectives. The Utility’s CIP planning employs cost-effectiveness analysis to identify the bestinfrastructure timing and sizing investment alternatives. The principle factors weighed in this analysis are:
* brainstorming of alternatives* capital costs* operation and maintenance costs* time value of money* economy of scale* environmental and other key non-pecuniary impacts
Note that occasionally development policy or political considerations run counter to the facility alternative derivedfrom cost-effectiveness analysis. In typical utility engineering practice the above factors result in a cost-beneficialrange of reserve capacity of ten to thirty years, depending on the type of facility. The Utility’s CIP, especially thegroup of impact fee projects, is the set of facilities that will satisfy needs for additional capacity in the next ten years asindicated by the Land Use Assumptions.
The Utility seeks to maintain a healthy, cost-effective amount of reserve capacity in the water and wastewater systemin order to carry out its mission of providing safe, reliable service. In this way, the commitments that the City makes toits customers in the form of tap sales, service extension requests, developer reimbursement contracts, and MUD andother district contracts, can be fulfilled in a manner that allows all parties in the development process to planefficiently. The impact fee methodology prescribed by state statute serves the function of quantifying the cost of thereserve capacity that constitutes the Utility’s plan for serving new customers for a ten-year planning horizon.
CIP-15
III. IMPACT FEE FACiLITIES AND FEE CALCULATION METHODOLOGY (The facilities that provide the bulk of water and wastewater capacity for new growth in Austin’s service area are listedin Table I and Table 2 (and again in Tables 12 and 13 in Section VI). They were selected from the complete list ofplanned projects, including the major facilities built with contract bonds and developer contract reimbursements,according to the following criteria:
(1) Has the predominant function of serving new growth rather than existing growth;(2) Does not provide repair, operation, or maintenance of existing facilities;(3) Does not upgrade, expand or replace existing facilities serving existing development in order to meet
stricter safety, environmental or regulatory standards.
These impact fee projects represent the individual projects that provide capacity necessitated by new developmentprojected to occur within the next ten years. As shown in Table I and Table 2, most are already built as part of theCity’s CIP program, with only a portion not yet constructed. Major impact fee facilities are shown graphically in MapI and Map 2. Projects removed from the project listing adopted in the 2001 Impact Fee CIP are shown on Table 4.
To detennine the costs of projects attributable to new growth, the Texas Impact Fee Act outlines a conceptually simple4-step process based on quantifying the demand versus capacity relationship for projects in service areas. The processcan be stated as follows:
(1) Determine capacity of project in service units, and cost per service unit;(2) Determine future demand (capacity used up) for project in service units for the ten-year planning
period;(3) Determine the project cost attributable to new growth, which is the cost per service unit (step I)
multiplied by the planning period demand (step 2).
To complete the impact fee calculation, the law calls for the calculation stated in step 4:
(4) The construction cost per service unit may not exceed the amount determined by dividing thesummation of the costs of the capital improvements (step 3) by the total number of projected serviceunits for the ten-year planning period from the Land Use Assumptions.
The difficult part of this methodology is step 2, determining the capacity that will be depleted in an individual projectduring the planning period. One might be tempted to simply add up the cost per service unit of each project to come upwith a fee. This would be invalid because each new user does not use a service unit of capacity in every new project,and would result in double counting. Instead, the spatial allocation of new users from the Land Use Assumptions mustbe used to estimate the actual usage of a given project. To carry out this approach in a manageable manner, the waterand wastewater service areas were divided up into subareas, pressure zones for water and drainage areas forwastewater. Sets of projects are assigned to each subarea, and the capacity addition to the subarea system is thendefined. The assumption is made that each new user in a subarea uses a service unit of the available capacityassociated with the selected set of impact fee projects in that subarea. The structure of Tables 12 and 13 illustrates this“subarea” methodology.
The resulting calculation for each subarea may be considered as a weighted average cost of impact fee facilities basedon project dollar values for improvements at the locations called upon for service to new growth.
Calculation of the impact fee is not sensitive to the length of the planning period or the number of new growth users aslong as all projects have more than enough capacity for growth (in excess of capacity serving existing users) in theplanning period, as is the case with the great majority of Austin’s impact fee improvements, because the number of newservice units occurs in both the numerator and the denominator of the fee calculation. The calculation is more sensitiveto the location of new users. If a large proporhon of new users are projected to locate in areas with high cost perservice unit for impact fee facilities, the calculated impact fee is correspondingly higher. If instead, more are projectedto locate in areas with few or inexpensive impact fee facilities, the calculated fee will be lower.
(CIP- 16
IV. SERVICE UNIT DEMAND AND CAPACITY RELATIONSHIPS
Calculation of the impact fee in accordance with Chapter 395 of the Local Government Code requires the use of a“service unit.” Within the definitions section of Chapter 395, “Service unit’ means a standardized measure ofconsumption, use, generation, or discharge attributable to an individual unit of development calculated in accordancewith generally accepted engineering or planning standards for a particular category of capital improvements or facilityexpansions.”
To use a simplified explanation, the number of projected new service units will be divided into the costs of capitalprojects allocated to this new growth in order to calculate the allowable impact fee (per service unit). A journal articleby Ray Farabee, et.al. states that the “Service unit’ is one of the most important, but conceptually difficult, elements ofthe (new) law.” This article also observes that “Cities may select their own standards for measuring service units, butany measure chosen must attempt to accurately reflect differences in service consumption between users.”
Austin’s capital recovery fee ordinances have for years used the service unit for this purpose, and it remains the mostappropriate choice for the “service unit” under the terms of Chapter 395. The service unit is based on the size of watermeter sold. Table 5 on the following page illustrates the relationship between service units and meter sizes. Theservice unit calculation depends on the relative differences between the various sizes and types of meters as determinedby their rated maximum flows and rated continuous flows. The same ratios apply in both cases since the ratedmaximum flow for each meter is twice its rated continuous flow.
The number of service units is determined by the size and type of the water meter purchased for the property and inaccordance with the schedule in Table 5.
Farabee, Ray, Lisa K. Anderson and Sara Swanson. “Impact Fees: The Intent Behind the New Law”. St. B. Tex.Envtl. L. J., Vol. 19; 1989; pp. 68-73.
CIP-17
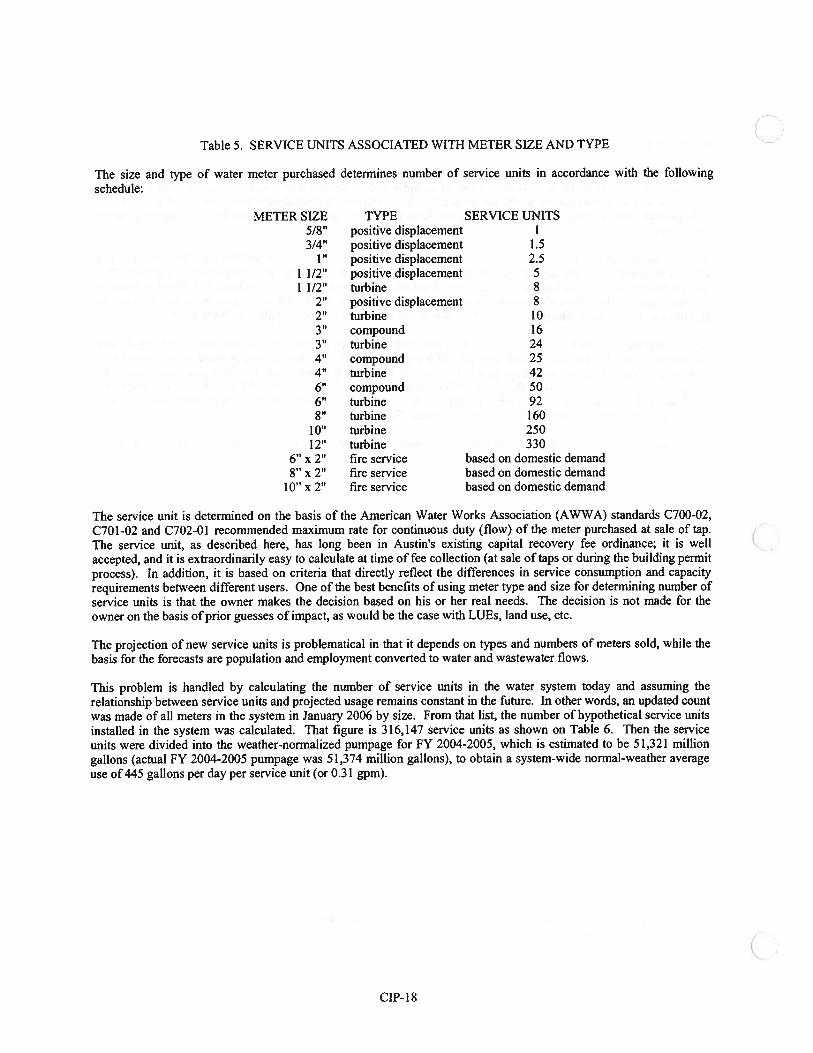
Table 5. SERVICE UNITS ASSOCIATED WITH METER SiZE AND TYPE
The size and type of water meter purchased determines number of service units in accordance with the followingschedule:
METER SIZE TYPE SERVICE UNITS5/8” positive displacement3/4” positive displacement 1.5
1” positive displacement 2.51 1/2” positive displacement 51 1/2” turbine 8
2’ positive displacement 82” turbine 103” compound 163” turbine 244” compound 254” turbine 426” compound 506” turbine 928” turbine 160
10” turbine 25012” turbine 330
6” x 2” fire service based on domestic demand8” x 2” fire service based on domestic demand
10” x 2’ fire service based on domestic demand
The service unit is determined on the basis of the American Water Works Association (AWWA) standards C700-02,C701-02 and C702-01 recommended maximum rate for continuous duty (flow) of the meter purchased at sale of tap.The service unit, as described here, has long been in Austin’s existing capital recovery fee ordinance; it is wellaccepted, and it is extraordinarily easy to calculate at time of fee collection (at sale of taps or during the building permitprocess). In addition, it is based on criteria that directly reflect the differences in service consumption and capacityrequirements between different users. One of the best benefits of using meter type and size for determining number ofservice units is that the owner makes the decision based on his or her real needs. The decision is not made for theowner on the basis of prior guesses of impact, as would be the case with LUBs, land use, etc.
The projection of new service units is problematical in that it depends on types and numbers of meters sold, while thebasis for the forecasts are population and employment converted to water and wastewater flows.
This problem is handled by calculating the number of service units in the water system today and assuming therelationship between service units and projected usage remains constant in the future. In other words, an updated countwas made of all meters in the system in January 2006 by size. From that list, the number of hypothetical service unitsinstalled in the system was calculated. That figure is 316,147 service units as shown on Table 6. Then the serviceunits were divided into the weather-normalized pumpage for FY 2004-2005, which is estimated to be 51,321 milliongallons (actual FY 2004-2005 pumpage was 51,374 million gallons), to obtain a system-wide normal-weather averageuse of 445 gallons per day per service unit (or 0.31 gpm).
CIP- 18
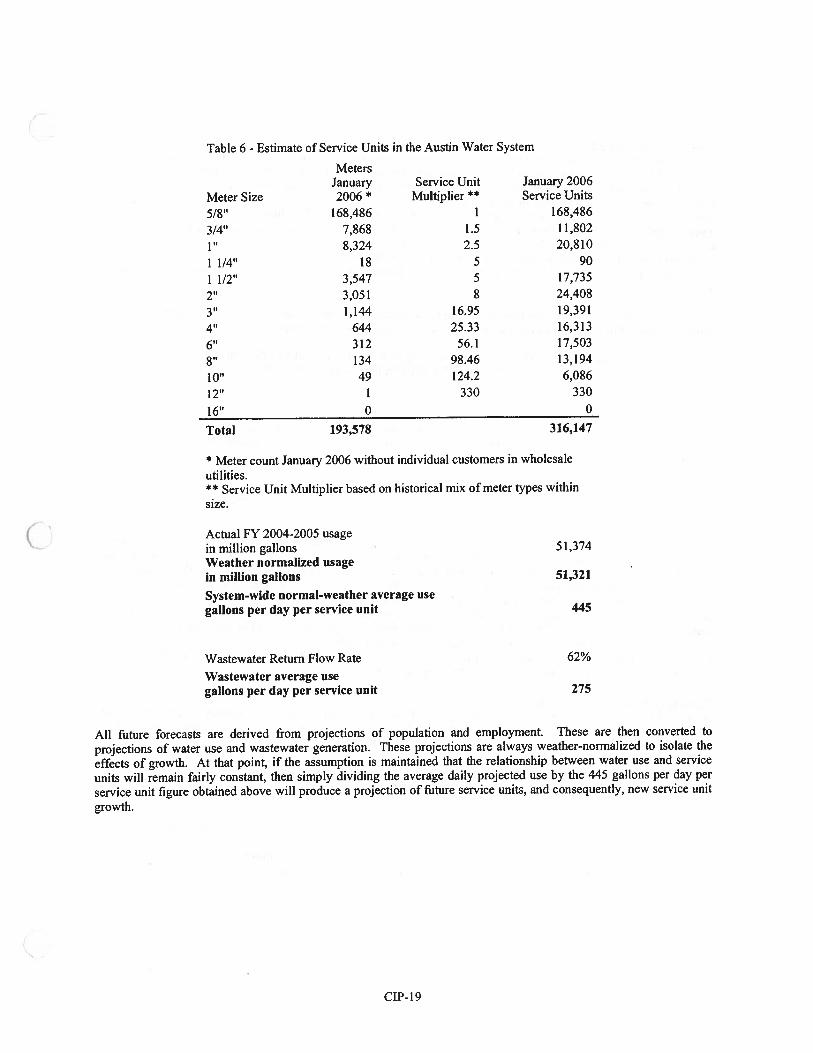
Table 6 - Estimate of Service Units in the Austin Water System
MetersJanuary Service Unit January 2006
Meter Size 2006 * Multiplier ** Service Units
5/8” 168,486 1 168,486
3/4” 7,868 1.5 11,802
1” 8,324 2.5 20,810
11/4” 18 5 90
1 1/2” 3,547 5 17,735
2’ 3,051 8 24,408
3” 1,144 16.95 19,391
4” 644 25.33 16,313
6’ 312 56.1 17,503
8” 134 98.46 13,194
10” 49 124.2 6,086
12” 1 330 330
16” 0 0
Total 193,578 316,147
* Meter count January 2006 without individual customers in wholesaleutilities.** Service Unit Multiplier based on historical mix of meter types withinsize.
Actual FY 2004-2005 usagein million gallons 51,374Weather normalized usagein million gallons 51,321
System-wide normal-weather average usegallons per day per service unit 445
Wastewater Return Flow Rate 62%
Wastewater average usegallons per day per service unit 275
All future forecasts are derived from projections of population and employment. These are then converted to
projections of water use and wastewater generation. These projections are always weather-normalized to isolate the
effects of growth. At that point, if the assumption is maintained that the relationship between water use and service
units will remain fairly constant, then simply dividing the average daily projected use by the 445 gallons per day perservice unit figure obtained above will produce a projection of future service units, and consequently, new service unit
growth.
CIP-l9
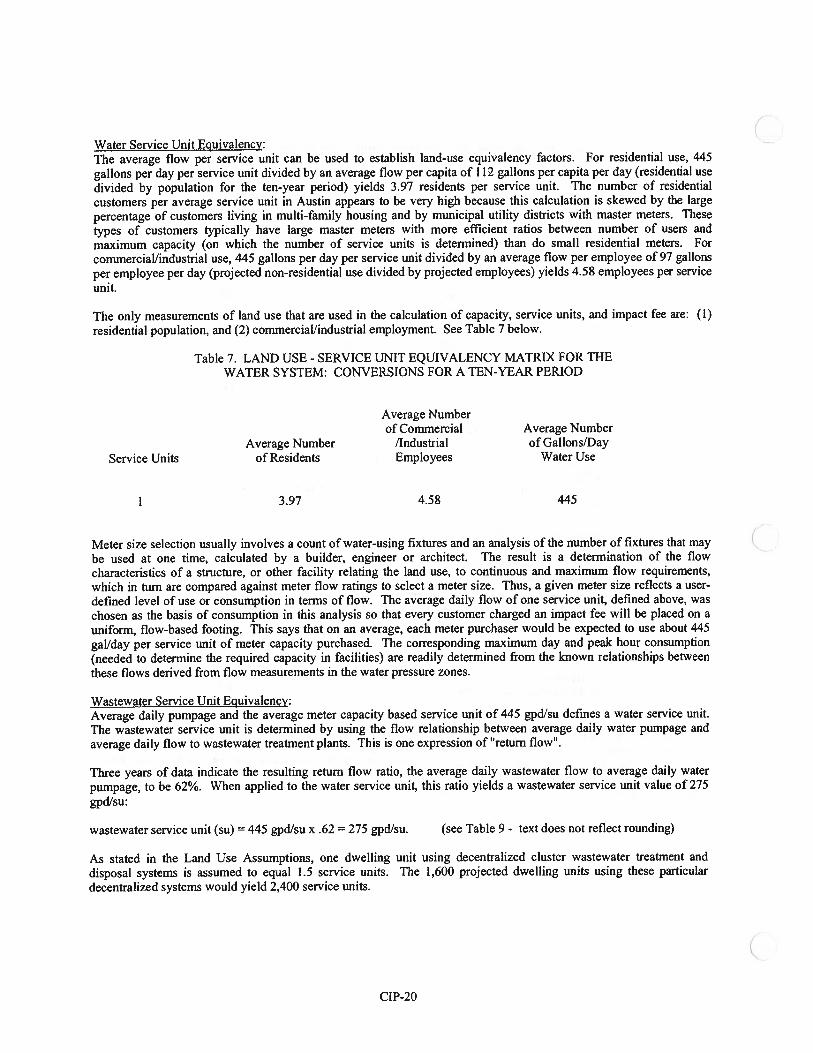
Water Service Unit Equivalency:The average flow per service unit can be used to establish land-use equivalency factors. For residential use, 445gallons per day per service unit divided by an average flow per capita of 112 gallons per capita per day (residential usedivided by population for the ten-year period) yields 3.97 residents per service unit. The number of residentialcustomers per average service unit in Austin appears to be very high because this calculation is skewed by the largepercentage of customers living in multi-family housing and by municipal utility districts with master meters. Thesetypes of customers typically have large master meters with more efficient ratios between number of users andmaximum capacity (on which the number of service units is determined) than do small residential meters. Forcommercial/industrial use, 445 gallons per day per service unit divided by an average flow per employee of 97 gallonsper employee per day (projected non-residential use divided by projected employees) yields 4.58 employees per serviceunit.
The only measurements of land use that are used in the calculation of capacity, service units, and impact fee are: (1)residential population, and (2) commercial/industrial employment. See Table 7 below.
Table 7. LAND USE - SERVICE UNIT EQUIVALENCY MATRIX FOR THEWATER SYSTEM: CONVERSIONS FOR A TEN-YEAR PERIOD
Average Numberof Commercial Average Number
Average Number /Industrial of Gallons/DayService Units of Residents Employees Water Use
3.97 4.58 445
Meter size selection usually involves a count of water-using fixtures and an analysis of the number of fixtures that maybe used at one time, calculated by a builder, engineer or architect. The result is a determination of the flowcharacteristics of a structure, or other facility relating the land use, to continuous and maximum flow requirements,which in turn are compared against meter flow ratings to select a meter size. Thus, a given meter size reflects a user-defined level of use or consumption in terms of flow. The average daily flow of one service unit, defined above, waschosen as the basis of consumption in this analysis so that every customer charged an impact fee will be placed on auniform, flow-based footing. This says that on an average, each meter purchaser would be expected to use about 445gal/day per service unit of meter capacity purchased. The corresponding maximum day and peak hour consumption(needed to determine the required capacity in facilities) are readily determined from the known relationships betweenthese flows derived from flow measurements in the water pressure zones.
Wastewater Service Unit Equivalency:Average daily pumpage and the average meter capacity based service unit of 445 gpdlsu defines a water service unit.The wastewater service unit is determined by using the flow relationship between average daily water pumpage andaverage daily flow to wastewater treatment plants. This is one expression of ‘return flow”.
Three years of data indicate the resulting return flow ratio, the average daily wastewater flow to average daily waterpumpage, to be 62%. When applied to the water service unit, this ratio yields a wastewater service unit value of 275gpdlsu:
wastewater service unit (su) = 445 gpd/su x .62 = 275 gpdlsu. (see Table 9 - text does not reflect rounding)
As stated in the Land Use Assumptions, one dwelling unit using decentralized cluster wastewater treatment anddisposal systems is assumed to equal 1.5 service units. The 1,600 projected dwelling units using these particulardecentralized systems would yield 2,400 service units.
CIP-20
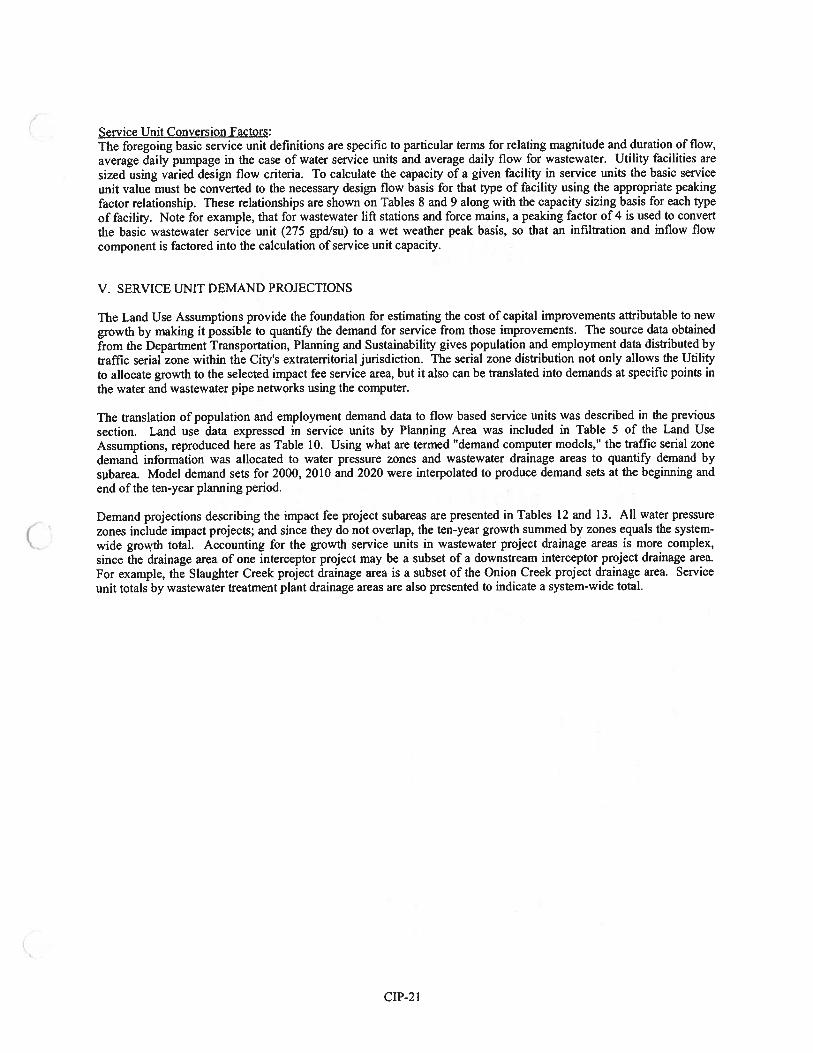
Service Unit Conversion Factors:The foregoing basic service unit definitions are specific to particular terms for relating magnitude and duration of flow,average daily pumpage in the case of water service units and average daily flow for wastewater. Utility facilities aresized using varied design flow criteria. To calculate the capacity of a given facility in service units the basic serviceunit value must be converted to the necessary design flow basis for that type of facility using the appropriate peakingfactor relationship. These relationships are shown on Tables 8 and 9 along with the capacity sizing basis for each typeof facility. Note for example, that for wastewater lift stations and force mains, a peaking factor of 4 is used to convertthe basic wastewater service unit (275 gpdlsu) to a wet weather peak basis, so that an infiltration and inflow flowcomponent is factored into the calculation of service unit capacity.
V. SERVICE UNIT DEMAND PROJECTIONS
The Land Use Assumptions provide the foundation for estimating the cost of capital improvements attributable to newgrowth by making it possible to quantify the demand for service from those improvements. The source data obtainedfrom the Department Transportation, Planning and Sustainability gives population and employment data distributed bytraffic serial zone within the City’s extraterritorial jurisdiction. The serial zone distribution not only allows the Utilityto allocate growth to the selected impact fee service area, but it also can be translated into demands at specific points inthe water and wastewater pipe networks using the computer.
The translation of population and employment demand data to flow based service units was described in the previoussection. Land use data expressed in service units by Planning Area was included in Table 5 of the Land UseAssumptions, reproduced here as Table 10. Using what are termed “demand computer models,” the traffic serial zonedemand information was allocated to water pressure zones and wastewater drainage areas to quantify demand bysubarea. Model demand sets for 2000, 2010 and 2020 were interpolated to produce demand sets at the beginning andend of the ten-year planning period.
Demand projections describing the impact fee project subareas are presented in Tables 12 and 13. All water pressurezones include impact projects; and since they do not overlap, the ten-year growth summed by zones equals the systemwide growth total. Accounting for the growth service units in wastewater project drainage areas is more complex,since the drainage area of one interceptor project may be a subset of a downstream interceptor project drainage area.For example, the Slaughter Creek project drainage area is a subset of the Onion Creek project drainage area. Serviceunit totals by wastewater treatment plant drainage areas are also presented to indicate a system-wide total.
CTP-2l
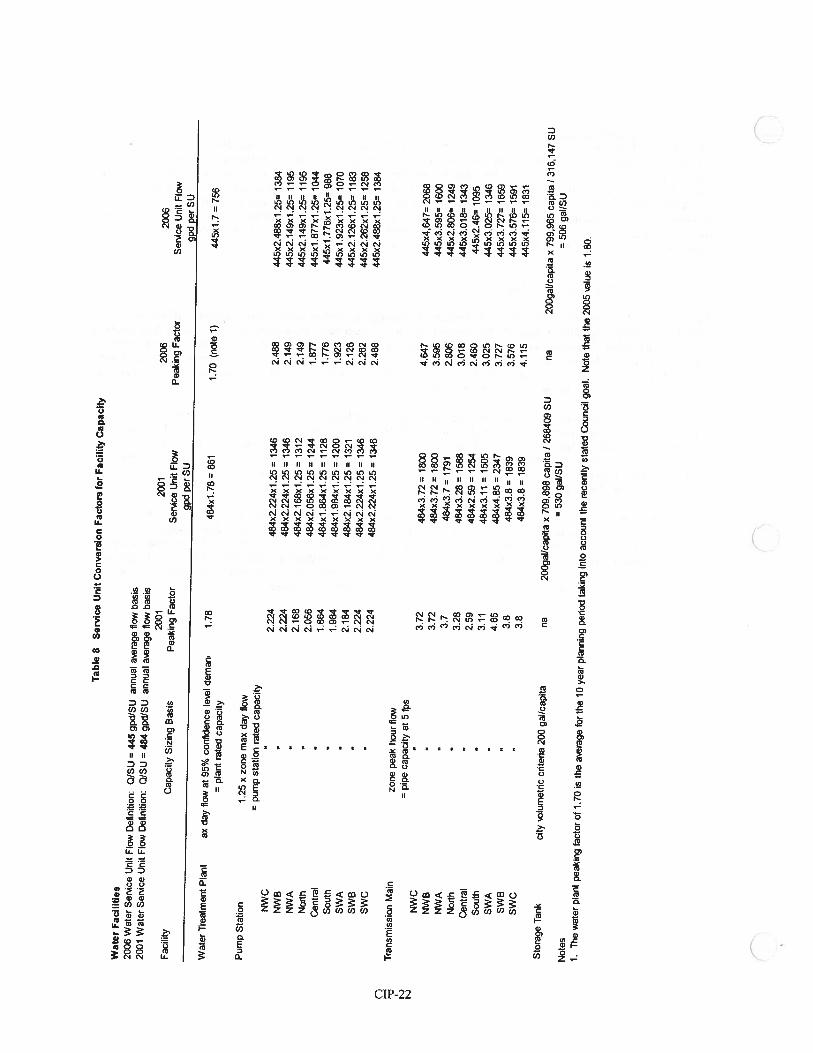
Tab
le8
Ser
vic
eU
nit
Con
vers
ion
Fac
tors
for
Fac
ilit
yC
apac
ity
Wat
erF
acil
itie
s20
06W
ater
Ser’
Ace
Uni
tFl
owD
efin
ition
:Q
JSU
=44
5gp
d/S
Uan
nual
aver
age
flow
basi
s20
01W
ater
Ser
vice
Uni
tFl
owD
efin
ition
:0/S
I)=
484
gpdI
SUan
nual
aera
geflo
wba
sis
2001
2001
2006
2006
Faci
lity
Cap
acit
ySi
zing
Bas
isP
eaki
ngF
acto
rSe
rMce
Uni
tFl
owP
eaki
ngF
acto
rS
erac
eU
nit
Flow
gpdper
SU
gpdper
SU
Wat
erT
reat
men
tP
lant
axda
yflo
wat
95%
conf
iden
cele
vel
dem
an’
1.78
484x
1.78
=86
11.
70(n
ote
1)44
5x1.
7=
756
=pl
ant
rate
dca
paci
ty
Pum
pS
tati
on1.
25x
zone
max
day
flow
pum
pst
atio
nra
ted
capa
city
NW
C2.
224
484x
2.22
4x1.
2513
462.
488
445x
2.48
8x1.
25=
1384
NW
B2.
224
484x
2.22
4x1.
25=
1346
2.14
94
45
x2
.14
9x
1.2
511
95N
WA
‘2,
168
484x
2.16
8x1.
25=
1312
2.14
944
5x2.
149x
1.25
4’11
95N
orth
‘.2.
056
484x
2.05
6x1.
25=
1244
1.87
744
5x1.
877x
1.25
=10
44C
entr
al1,
864
484x
1.86
4x1.
2511
281.
776
445x
1.77
6x1.
25=
988
Sou
th‘
1.98
448
4x1.
984x
1.25
=12
001.
923
445x
1.92
3x1.
25=
1070
SWA
2.18
448
4x2.
184x
1.25
=13
212.
126
445x
2.12
6x1,
25=
1183
SWB
2.22
448
4x2.
224x
1,25
=13
462.
262
445x
2.26
2x1.
25=
1258
SW
C“
2.22
448
4x2.
224x
1.25
=13
462.
488
445x
2.48
8x1.
25=
1384
cmT
rans
mis
sion
Mai
nzo
nepe
akho
urflo
wpi
peca
paci
tyat
5fp
sN
WC
“3,
7248
4x3.
72=
1800
4.64
744
5x4,
647
2068
NW
B3.
7248
4x3.
72=
1800
3.59
544
5x3.
595=
1600
NW
A“
3.7
484x
3.7
=17
912.
806
445x
2.80
6=12
49N
orth
“3.
2848
4x3.
2815
863.
018
445x
3.01
813
43C
entr
al2.
5948
4x2.
59=
1254
2.46
044
5x2.
46=
1095
Sou
th3.
1148
4x3.
1115
053.
025
445x
3.02
5=13
46SW
A‘
4.85
484x
4.85
2347
3.72
744
5x3.
727’
1659
SWB
3.8
484x
3,8
=18
393.
576
445x
3.57
6=15
91S
WC
3.8
484x
3.8
=18
394.
115
445x
4.11
5418
31S
tora
geT
ank
city
olu
met
nc
ente
ria
200
gal/
capi
tana
200g
aI/c
apit
ax
709,
898
capit
a/26
8409
SI)
na20
0gal
icap
ita
x79
9,96
5ca
pita
I31
6,14
7S
I)=
530
gal/
SU
=50
6ga
l/S
UN
otes
1.T
hew
ater
plan
tpe
akin
gfa
ctor
of1.
70is
the
a’.e
rage
for
the
10ye
arpl
anni
ngpe
riod
taki
ngin
toac
coun
tth
ere
cent
lyst
ated
Cou
ncil
goal
.N
ote
that
the
2005
alu
eis
1.80
.
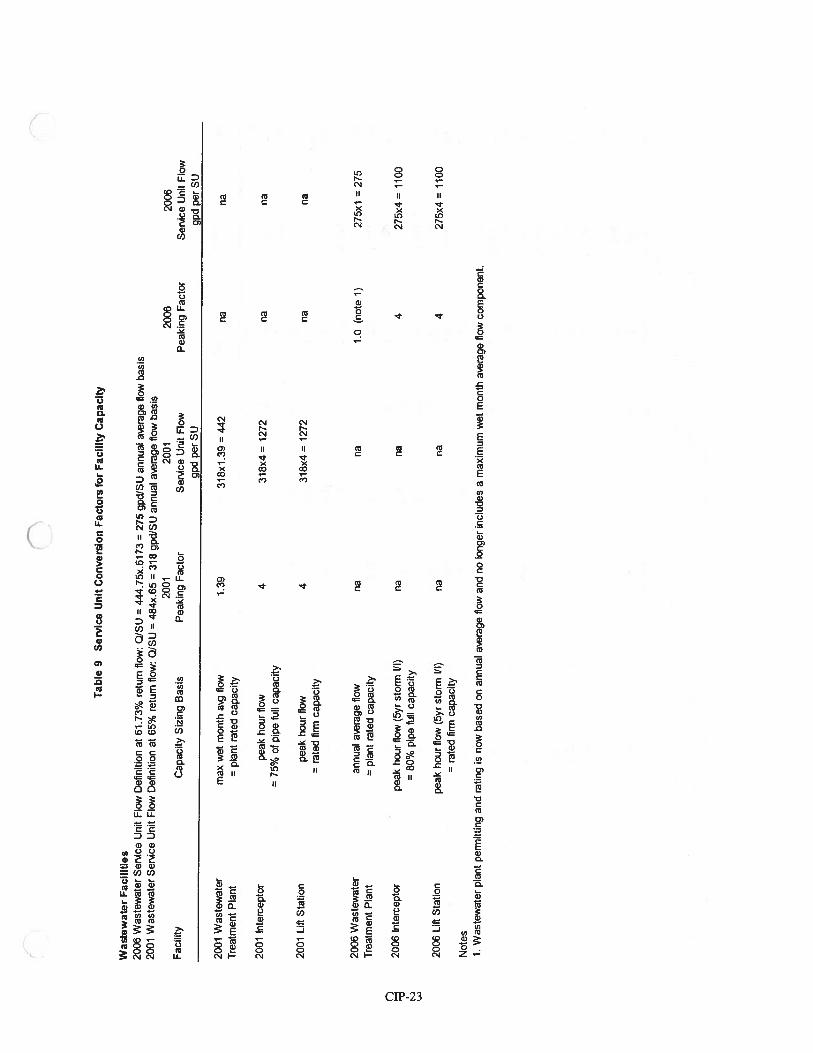
Tab
le9
Ser
vic
eU
nit
Conver
sion
Fac
tors
for
Fac
ilit
yC
apac
ity
Was
tew
ater
Fac
ilit
ies
2006
Was
tew
ater
Ser
ice
Uni
tFl
owD
efin
ition
at61
.73%
retu
rnflo
w:
Q/S
U=
444.
75x.
6173
=27
5gp
dISU
annu
alav
erag
eflo
wba
sis
2001
Was
tew
ater
Ser
Mce
Uni
tFl
owD
efin
ition
at65
%re
turn
110w
:Q
ISU
=48
4x.6
5=
318
gpd/
SU
annu
alaera
ge
flow
basi
s20
0120
0120
0620
06Fa
cilit
yC
apac
ity
Siz
ing
Bas
isP
eaki
ngF
acto
rS
erA
ceU
nit
Flow
Pea
king
Fac
tor
Ser
ice
Uni
tFl
owgpdper
SU
gp
dp
erS
U
2001
Was
tew
ater
max
wet
mon
thag
flow
1.39
318x
1.39
=44
2na
naT
reat
men
tP
lant
=pl
ant
rate
dca
paci
ty
2001
Inte
rcep
tor
peak
hour
flow
431
8x4
=12
72na
na75
%of
pipe
full
capa
city
2001
Lift
Sta
tion
peak
hour
flow
431
8x4
=12
72na
na=
rate
dfir
mca
paci
ty
2006
Was
tew
ater
annu
alae
rage
flow
nana
10
(not
e1)
275x
127
5T
reat
men
tP
lant
=pl
ant
rate
dca
paci
ty
2006
Inte
rcep
tor
peak
hour
flow
(5yr
stor
mI/I
)na
na4
275x
4=
1100
=80
%pi
pefu
llca
paci
ty
2006
Lift
Sta
tion
peak
hour
flow
(5yr
stor
mIll
)na
na4
275x
4=
1100
=ra
ted
firm
capa
city
Not
es1.
Was
tew
ater
plan
tpe
rmit
ting
and
ratin
gis
now
base
don
annu
alara
ge
flow
and
nolo
nger
incl
udes
am
axim
umw
etm
onth
aver
age
flow
com
pone
nt.
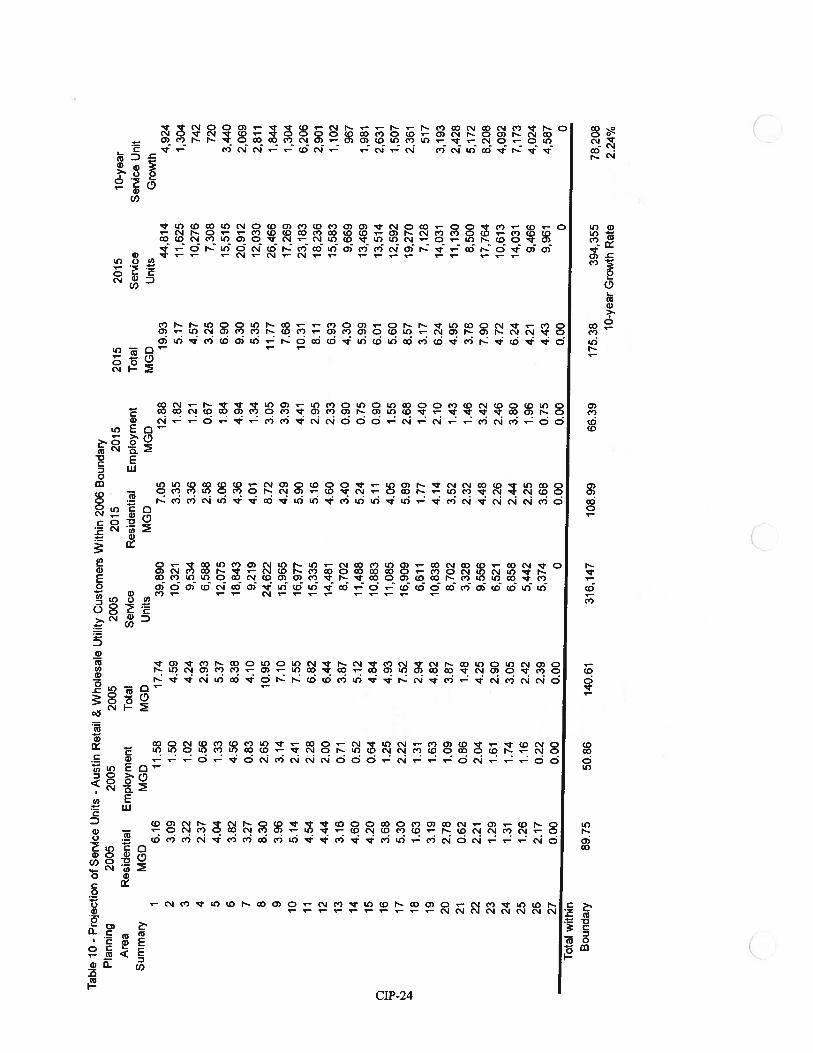
Tab
le10
-P
roje
ctio
nof
Ser
vice
Uni
ts-
Aus
tin
Ret
ail
&W
hole
sale
Util
ityC
usto
mer
sW
ithin
2006
Bou
ndar
yP
lann
ing
2005
2005
2005
2005
2015
2015
2015
2015
10-y
ear
Are
aR
esid
enti
alE
mpl
oym
ent
Tot
alS
ervi
ceR
esid
enti
alE
mpl
oym
ent
Tot
alS
erA
ceS
ervi
ceU
nit
Sum
mar
yM
GD
MG
DM
GD
Uni
tsM
GD
MG
DM
GD
Uni
tsG
row
th1
6.16
11.5
817
.74
39,8
907.
0512
.88
19.9
344
,814
4,92
42
3.09
1.50
4.59
10,3
213.
351.
825.
1711
,625
1,30
43
3.22
1.02
4.24
9,53
43.
361.
214.
5710
,276
742
42.
370.
562.
936,
588
2.58
0.67
3.25
7,30
872
05
4.04
1.33
5.37
12,0
755.
061.
846.
9015
,515
3,44
06
3.82
4.56
8.38
18,8
434.
364.
949.
3020
,912
2,06
97
3.27
0.83
4.10
9,21
94.
011.
345.
3512
,030
2,81
18
8.30
2.65
10.9
524
.622
8.72
3.05
11.7
726
,466
1,8.
449
3.96
3.14
7.10
15,9
654.
293.
397.
6817
,269
1,30
410
5.14
2.41
7.55
16,9
775.
904.
4110
.31
23,1
836,
206
ii4.
542.
286.
8215
,335
5.16
2.95
8.11
18,2
362,
901
124.
442.
006.
4414
,481
4.60
2.33
6.93
15,5
831,
102
133.
160.
713.
878,
702
3.40
0.90
4.30
9,66
996
714
4.60
0.52
5.12
11,4
885.
240.
755.
9913
,469
1,98
115
4.20
0.64
4.84
10,8
835.
110.
906.
0113
,514
2,63
116
3.68
1.25
4.93
11,0
854.
051.
555.
6012
,592
1,50
717
5.30
2.22
7.52
16,9
095.
892.
688.
5719
,270
2,36
118
1.63
1.31
2.94
6,61
11.
771.
403.
177,
128
517
193.
191.
634.
8210
,838
4.14
2.10
6.24
14,0
313,
193
202.
781.
093.
878,
702
3.52
1.43
4.95
11,1
302,
428
210.
620.
861.
483,
328
2.32
1.46
3.78
8,50
05,
172
222.
212.
044.
259,
556
4.48
3.42
7.90
17,7
648,
208
231.
291.
612.
906,
521
2.26
2.46
4.72
10,6
134,
092
241.
311.
743.
056,
858
2.44
3.80
6.24
14,0
317,
173
251.
261.
162.
425,
442
2.25
1.96
4.21
9,46
64,
024
262.
170.
222.
395,
374
3.68
0.75
4.43
9,96
14,
587
270.
000.
000.
000
0.00
0.00
0.00
00
Tot
alw
ithin
Bou
ndar
y89
.75
50.8
614
0.61
316,
147
108.
9966
.39
175.
3839
4,35
578
,208
10-y
ear
Gro
wth
Rat
e2.
24%
VI. CAPACITY AND COST ATTRIBUTABLE TO NEW GROWTH
Decentralized Wastewater CostsEstimates of the capital costs for the construction of decentralized cluster system treatment facilities and disposal fieldsrange from $15 per gallon for daily flow to $40/galJday depending on the complexity of the treatment facilities, thetelemetry equipment, and the nature of terrain and topography. These estimates assume the use of low pressure dosing(LPD) fields for disposal. For the purposes of this projection, the mid-range figure of $25/gallday was selected.Borrowing from State and local On-Site Sewage Facility rules, the daily flow of 360 gallons per dwelling unit isselected, which corresponds to large single family houses. Therefore, the estimated typical cost of these facilities is$9,000 per dwelling unit ($25 x 360). Since each of these houses is assumed to equal 1.5 service units, the cost perservice unit would equal $6,000 ($9,000/l.5). The costs stated below represent the entire service area and are notreflective of a specific development.
Table 11: Total Costs of Capital Facilities for Decentralized Cluster Wastewater Systems CIP
Cost per Service Unit Ten-year Projection Total Project CostsOf Service Units
S6,000 2,400 $14,400,000
Interest costs are not added to the total project costs because the decentralized cluster wastewater systems CIP projectis not anticipated to be financed with bonds. The total project costs shown in the previous table would overstate thetotal impact to the City of Austin, since the City is unlikely to fund or reimburse the full costs of the cluster treatmentand disposal facilities. Although no such system is present in the Capital Improvements Plan for the Year 2007 ImpactFee calculation, such a system would be an applicable candidate project for future impact fee assessments.
Central Water and Wastewater Capacity and CostsTables 12 and 13 present the capacity and cost attributable to new growth according to the impact fee methodologyoutlined in Section III. The cost used in the impact fee calculation is simply the cost per service unit multiplied by theten-year growth in service units derived from the land use assumptions for the subarea served by each set of facilities.
The following outline illustrates the methodology used to calculate the maximum impact fee allowed by law. Theletters of each item correspond to the lettered columns in Tables 12 and 13.
A. The reference table to the Impact Fee project listing tables.
B. Project description. Columns A and B are used to identif,’ the Impact CIP projects.
C. Unused (part of project description)
D. Project size. This is the design size of the facility.
E. Pressure zone or drainage area.
F. Completion date
G. Cost to build. The cost to build a given facility includes the cost to the City for land acquisition, engineering, andconstruction, along with related cost components. The cost is listed in thousands of dollars, and excludes interest.
H. Interest cost. The law allows interest cost to be added into the cost of a project if the impact fee will be used torepay both principal and interest. The amount of debt service assigned to each project was calculated by the Utilityusing the following assumptions: all bonds for the selected impact fee capital improvements projects were sold atthe same time, an interest rate of 6.0% was assumed and the term of the bonds was thirty years. The amount ofinterest cost is indicated in thousands of dollars.
1. Total cost to build (G plus H). Tables 12 and 13 provide price figures with and without interest to provide a costcomparison.
CIP-25
J. Design capacity of impact fee new facility or expansion. Capacity of the impact fee projects are expressed inservice units for the subarea as a whole. All of the projects in a subarea are evaluated as a group to determine thebest estimate of capacity added to the subarea by the facilities acting together. Typically one project “size” bestrepresents the capacity addition for the subarea as a whole. See Tables 8 and 9 for capacity equations.
K. Cost to build per service unit without interest (G divided by 1).
L. Cost to build per service unit with interest (I divided by 3).
M. Year 2005 land use assumptions. The population and land use level in a particular pressure zone or drainage area inthe year 2005, expressed in service units.
N. Year 2015 land use assumptions. The population and land use level in a particular pressure zone or drainage area inthe year 2015, expressed in service units.
0. Growth users (N minus M). The number of service units of new growth entering a particular pressure zone ordrainage area in the ten years between 2005 and 2015. Each service unit of new growth uses a service unit ofcapacity in the set of facilities making up the subarea.
P. Impact costs without interest (K times 0). The cost per service unit of the facilities multiplied by the number ofgrowth users in the specific pressure zone or drainage area, excluding interest.
Q. Impact costs with interest (L times 0). The cost per service unit of the facilities multiplied by the number of growthusers in the specific pressure zone or drainage area, including interest.
R. Existing users. The number of existing users (expressed in service units) whose service is enhanced by the additionof the facilities in the subarea; therefore, capacity attributable to existing needs.
S. Excess service units in the subarea (J minus R minus 0). The number of service units remaining unused in thesubarea impact fee facilities after the 10-year planning period.
Steps A through S define the costs of the impact fee projects attributable to new growth. The procedure for summingthese costs to calculate the maximum allowable impact fee is presented in the next section.
CCIP-26
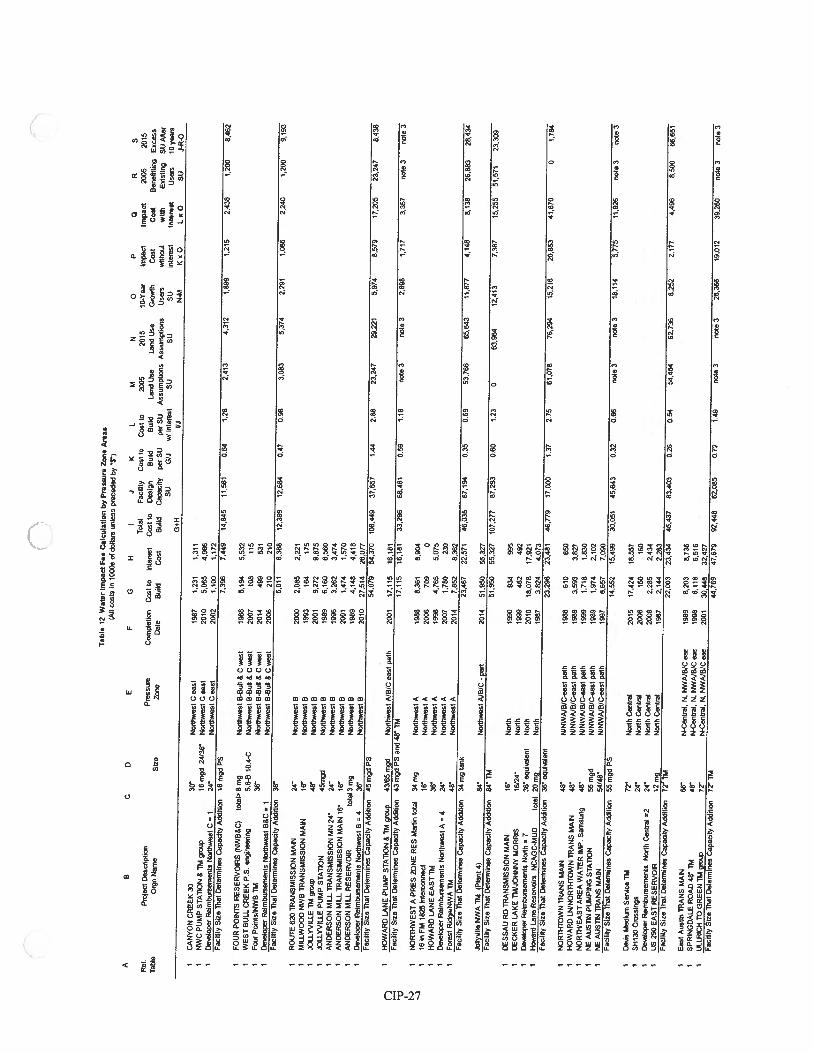
Tab
le12
Wat
ertm
p4ct
Fee
Cal
cula
tion
byP
resr
oire
Zon
eA
reas
(All
cost
sin
l000
sof
dolla
rsun
less
prec
eded
by“$
“l
EF
0H
IJ
KL
MN
0P
0R
ST
otal
Faci
lity
Coa
lto
Cos
tto
2005
2015
10-Y
ear
Impa
ctIm
pac
t20
0520
15P
ress
ure
Cor
nple
tisn
Coa
lIs
Inte
rest
Coa
lto
Des
ign
Bui
ldB
uild
Lan
dU
seL
and
Use
Gro
wth
Cos
tC
ost
Ben
ettl
rrrg
Exce
ssS
ize
Zon
eD
ate
Bui
ldC
ost
Bui
ldC
apac
ity
per
SUpe
rSO
Ass
umpt
ions
Ass
umpt
ions
Use
rsw
ithou
tw
ith
Exi
stin
gSU
Aft
erSO
G/J
WI
inte
resl
SUSO
SOin
tere
stIn
tere
stU
sers
1/)
year
sC
ON
tlJN
-NK
xO
LeO
SOJ-
R-O
CA
NY
ON
CR
EE
K3/
)30
”N
orth
wes
tC
east
1997
1,23
11,
311
IWC
PUM
PS
TA
tiO
N&
TMgr
oup
16nr
gd24
/36”
Nor
thw
est
Cea
st20
105,
065
4,66
6D
esel
sper
Rer
mbn
rsem
ents
Nor
thw
est
C1
24”
Nor
thw
est
Cea
st20
021,
100
1,17
2Fa
cilit
yS
ize
Tha
ID
eter
min
esC
apac
ity
Add
ition
16m
gdP
S7,
396
7,44
914
,845
11,5
610,
941.
282,
413
4,31
21,
099
1,21
52,
438
1.20
08,
462
FOU
RPO
INT
SR
ES
ER
VO
IRS
(PW
B&
C)
tota
ls8
mg
Nor
thw
est
B-B
all
&C
wes
t19
805.
194
5,53
2W
ES
TB
ULL
CR
EE
KP
.S.
engi
neer
ing
5.8-
810
.4-C
Nor
thw
est
8-B
ist
ftC
wes
t20
0710
611
5‘o
urPo
rnls
lNW
BTM
36”
Nor
Thw
est
B-B
ull
&C
wes
t20
1449
953
1D
esel
oper
Rei
mbu
rsem
ents
Nor
thw
est
B&
C=
IN
orth
wes
tB
-Bul
l&
Cw
est
2006
210
210
Faci
lity
Siz
eT
hat
Det
erm
ines
Cap
acit
yA
ddrt
ion
36”
6.01
16,
368
12.3
9912
,684
0.47
0.98
3,08
35,
374
2,29
11,
066
2.24
01,
200
9.19
3R
OU
TE62
1)‘T
RA
NSM
ISSI
ON
MA
IN24
”N
orth
wes
t8
2000
2,08
52.
221
MIL
LW
000
NW
BT
RA
NSM
ISSI
ON
MA
IN16
”N
orth
wes
t8
1993
164
175
JOLL
YV
ILLE
‘TN
grou
p48
”N
orth
wes
tB
2001
0,27
29,
875
JOLL
YV
ILLE
PUM
PST
ATI
ON
45m
gdN
orth
wes
tB
1989
6,16
06.
560
AN
DE
RSO
NM
ILL
TR
AN
SMIS
SIO
NM
N24
”24
”N
orth
wes
tB
1996
3,26
23,
474
AN
DE
RSO
NM
ILL
1RA
NSI
MIS
SIO
NM
AIN
16”
19”
Nor
thw
est
820
011,
474
1.57
0A
ND
ER
SON
MIL
LR
ESE
RV
OIR
tota
l3er
gN
orth
wes
t8
1969
4,14
84.
418
Des
elop
exR
eirn
burs
erni
errt
sN
orth
wes
tB
436
”N
orth
wes
tB
2010
27,5
1426
.077
Faci
trty
Siz
eT
hat
Del
errn
irre
sC
apac
ity
Add
ition
45m
gdP
S54
.079
54,3
7010
8.44
937
,657
1.44
2.88
23,2
4729
,221
5,97
48.
579
17,2
0523
,247
8,43
6H
OW
AR
DLA
NE
PUM
PST
AT
ION
&TM
grou
p43
/65
mgd
Nor
thw
est
9301
0ea
slpa
lh20
0117
,115
16.1
81Fa
cilit
yS
ize
Tha
tD
eter
min
esC
apac
ity
Add
ition
43m
gdP
San
d48
”TM
17.1
1516
.181
33.2
9668
.481
0.59
1.16
note
3no
te3
2,89
81,
717
3,35
7no
te3
note
3N
OR
TH
WE
STA
PR
ES
ZON
ER
ES
Mar
linto
tal
34m
gN
orth
wes
tA
1988
8.36
18,
904
16hr
FM18
25Ir
rlerc
orm
necl
16”
Nor
thw
est
A20
0670
90
HO
WA
RD
LA
NE
EA
ST
IN36
”N
omth
wes
lA19
984,
765
5.07
5D
esel
oper
Rei
robu
rsem
nerr
tsN
orth
wes
tA
=4
24”
Nor
thw
est
A20
071.
780
230
For
est
Rid
yedH
hVA
iN45
”N
orth
wes
TA
2014
7,85
28,
362
Faci
lity
Siz
eT
hat
Det
erm
ines
Cap
acit
yA
dditi
on34
mg
task
23.4
6722
.571
46,0
3867
.194
0.35
069
53,7
6665
,643
11,8
774.
148
8.13
826
,883
28.4
34..t
olly
’rIIe
I’56I
ATM
(Pla
nt4)
84”
Nor
thw
est
A/B
/C.p
art
2014
51,9
5055
.327
Faci
lity
Siz
eT
hat
Det
erm
ines
Cap
acIt
yA
dditi
on84
”TM
51,9
5055
,327
107.
277
87,2
930.
601.
230
63.9
8412
,413
7.38
715
,255
51,5
7123
.309
DE
SS
AU
RD
’TR
AN
SM
ISS
ION
MA
td16
”N
orth
1990
934
995
DE
CK
ER
LAK
ET
M/J
OH
NN
YM
OR
RIS
16/2
4”N
orth
1999
462
492
Des
elsp
ecR
eim
burs
emen
tsN
orth
736
”eq
aim
lent
Nor
th20
1018
,078
17,9
21H
owar
dL
ane
Res
erso
irs
NC
AG
C-M
UD
lota
l20
mg
Nor
th19
873,
024
4.07
3Fa
cilit
yS
ize
Tha
tD
eter
min
esC
apac
ity
Add
rtior
r36
”eq
uim
lent
23,2
9823
,481
46.7
7917
.000
1.37
2.75
61,0
7876
,294
15,2
1620
,853
41.8
700
1,78
4N
OR
T1-I
TOW
NT
RA
NS
MA
IN48
”N
/NW
A/B
/C-e
ast
path
1988
610
650
HO
WA
RD
1T4/
NO
RT
RT
OW
NT
RA
NS
MA
IN46
”N
/NW
A/B
1C-e
asl
path
1989
3.59
33.
827
NO
R’I
l-IJ
EA
STA
RE
AW
AT
ER
IMP.
Sam
sung
48”
NIN
WA
IB/C
-eas
lpa
th19
991.
718
1.83
0N
EA
UST
INPU
MPI
NG
STA
TIO
N55
mgd
N/N
WA
JB/C
-eas
tpa
th19
891,
874
2.10
2N
EA
UST
INT
RA
NS
MA
IN54
/48”
NIN
WA
/B/C
-eus
tpa
th19
976.
657
7,09
0Fa
cihl
yS
ize
Tha
tD
eter
min
esC
apac
ity
Add
ition
55m
gdP
514
,552
15.4
9930
,051
45,6
430.
32066
note
3no
te3
18,1
145.
775
11,9
26ro
le3
rroh
e3
Dirs
qsM
ettiU
rni
Ser
ace
TM72
’N
Orth
Cer
rlru
l20
1517
.424
18,5
57SH
I3O
Cro
ssin
gs24
”N
orth
Cen
tral
2006
151)
160
De’
relo
per
Rei
mbu
rsem
ents
Nor
thC
entr
al2
24”
Nor
thC
entr
al20
082,
285
2.43
4U
S29
0E
AS
TR
ES
ER
VO
IR12
mg
Nor
thC
entr
al19
t72.
144
2.28
3Fa
cilit
yS
ize
Tha
tD
eter
mnr
irres
Cap
acit
yA
dditi
on72
”TM
22,0
0323
.434
45.4
3783
,403
0.26
054
54,4
8462
,736
8.26
22,
177
4.49
68,
500
66,6
51E
ast
Aus
tinT
RA
NS
MA
IN66
”N
-Cen
Tral
.N
,N
WA
/81C
ear
1669
8,20
38,
736
SPR
ING
OA
LE
RO
AD
45”
TM48
”N
-Cen
tral
,N,
lW/A
/B/C
eat
1998
6,11
86,
516
ULL
RIC
HTO
GR
EE
Nli
dgr
oup
72”
N-C
entr
al,
N,N
WA
IBIC
ear
2001
30.4
4932
.427
Faci
lily
Siz
eT
hat
Det
erm
ines
Cap
acit
yA
dditi
on72
”TM
44,7
6947
.679
92,4
4862
.085
0.72
149
note
3no
te3
26,3
6619
,012
39.2
60co
le3
note
3
Ret
.T
able
B
Pro
tecl
Des
ctip
tion
Org
sN
ame
CD
fl =0
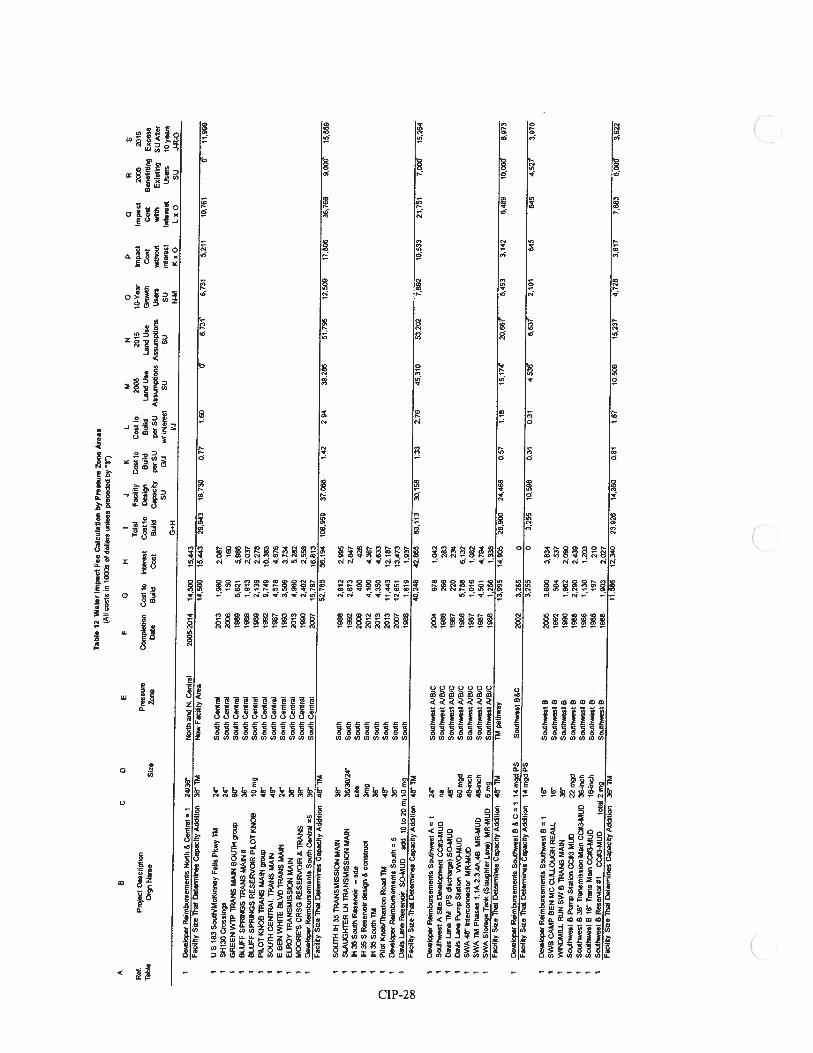
Tab
le12
Wal
erIm
pact
Fee
Cal
cula
tio
nby
Pre
ure
Zon
eA
reas
(AtI
cost
sin
bOO
sof
dolla
rsta
ltes
spr
eced
edby
1”)
C0
EF
0H
IJ
KL
NN
0T
otal
Faci
hty
Cos
tto
Cos
t10
2006
2015
10-Y
ear
Pre
ssu
reC
ompl
etio
nC
ost
toIn
tere
stC
ost
toD
esig
nB
uild
Bui
ldL
and
Use
Lan
dU
seG
row
thS
ize
Zon
eD
ate
Bui
ldC
ost
Bra
IdC
apac
ity
per
SU
per
SU
Ass
um
on
sA
ssia
nipt
iorr
sli
ners
SU0/
/iW
/in
tere
stSU
SUSU
GuN
Ti
N-N
ID
esel
oper
Rei
mbu
rsem
ents
Nor
th8
Cen
tral
124
/36
Nor
than
dN
.C
entr
al20
05-2
014
14,5
0015
.443
Faci
lity
Siz
eT
hat
Det
erm
ines
Cap
acit
yA
dditi
on36
’TM
Now
Faci
lity
Are
a14
,800
15,4
4329
.943
18.7
300
77
1.60
6.73
1’6,
731
5,21
110
.761
0’II
.998
IU
S19
3So
iitt’
ilMcK
inne
yF
alls
Pkvr
yTN
24”
Sout
hC
entr
al1
SH13
OC
ross
ings
24”
Sou
thC
entr
al1
GR
EE
NW
TP
‘TR
AN
SM
AIN
SOU
TH
grou
p50
’S
outh
Cen
tral
IB
LU
FFS
PR
ING
ST
RA
NS
MA
INII
36’
Sou
thC
entr
al1
BL
UFF
SP
89’I
GS
RE
SER
VO
IRP
LO
TK
NO
BtO
mg
Sou
thC
er61
al1
PIL
OT
KN
OB
TR
AN
SM
AIN
grou
p48
’S
outh
Cen
tral
ISO
IJT)
-(C
EN
TR
AL
TR
AN
SM
AIN
48”
Sou
thC
entr
alI
SB
EN
WH
[TE
BLV
DT
RA
NS
MA
IN24
”S
outh
Cen
lral
1E
LR
Oy
TR
AN
SMIS
SIO
NM
AIN
36’
Sou
thC
entr
alI
MO
OR
E’S
CR
SG
RE
SER
VO
IR&
‘TR
AN
S38
’S
outh
Cen
tral
ID
ewlo
per
R.m
burs
emen
tsS
outh
Cen
tral
536
’So
Uth
Cen
tral
Faci
lity
Siz
eT
hat
Det
erm
ines
Cap
acit
yA
dditi
on48
”TM
1SO
U11
’iIN
35T
RA
NSM
ISSI
ON
MA
IN36
”S
outh
1SL
AU
GH
TE
RLN
TR
AN
SMIS
SIO
NM
AIN
36/3
0/24
’S
outh
1IH
35S
outh
Res
erin
ir—
site
Ode
Sou
thI
IN35
SR
eser
stor
desi
gn&
cons
truc
l3m
gS
outh
1It-
I35
SOuI
ttTM
36’
Sou
th1
Pito
lK
nob/
Tha
xton
Roa
dTM
48”
Sou
th1
Des
elop
erR
eim
burs
emen
tsS
outh
536
’S
outh
1D
uos
Lan
eR
eser
ioir
SO-M
UD
add
10to
20m
ilO
mg
Sou
thFa
cilit
yS
ize
Tha
tD
eter
min
esC
apac
ity
Add
ition
48’
TM
1In
terl
oper
Rei
mbu
rsem
ents
Sou
thw
est
B&
C1
14m
gdP
SS
outh
wes
tB
AC
2002
3,25
5Fa
cilit
yS
ize
Tha
tD
eter
min
esC
apac
dyA
dditi
on14
mgd
PS
3,25
5-
-.
4,5
36,
631
2,10
164
964
54,
527”
3,97
0
Sou
thw
est
B20
053,
600
3,83
4S
outh
wes
t9
1992
504
537
Sou
thw
est
B19
901.
962
2,09
0S
outh
wes
tB
1988
2,29
02,
439
Sou
thw
est
B19
881,
130
1,20
3S
outh
wes
lB
1988
197
210
Sou
thw
est
B19
881.
903
2.02
7
Ref
.T
able
B
Prx
iect
Oes
cnp(
ion
Org
nN
ame
PQ
NS
b/p
act
Imp
act
2005
2015
Cos
tC
ost
Ben
efitl
ing
Exce
ssw
Itho
utw
ith
Exi
stin
gS
UA
fter
inte
resl
Inta
rest
Use
rsto
yn
ars
I<nC
)L
et)
SUi-
It-C
1D
eset
oper
Rer
mbu
iser
senr
lsS
outh
wes
tA
124
”1
Sou
thw
est
AS
ite
Dee
rlnp
men
tC
C93
-MU
Dna
1O
asis
Lan
eTM
(PS
disc
harg
e)SO
-MU
D48
”1
Oas
isL
ane
Pum
pS
tati
onV
WO
-MU
D60
mgd
1SW
A48
”hi
terc
onne
ctor
MR
-MU
D48
-inc
h1
SWA
Thi
Phas
es1,
IA,2
,3,4
A,4
BM
R-M
UD
48-i
nch
1SW
AS
tora
geT
ank
(Sla
ught
erIa
ne)
MR
-MU
D6
mg
Faci
lity
Siz
e‘T
haI
Det
erm
ines
Cap
acit
yA
dditi
on46
’TM
2013
t,96
02,
087
2006
150
16/3
1989
5,62
15,
986
1988
1,91
32.
037
1989
2.13
92.
278
1992
9.74
610
,383
1987
4,57
84,
876
1993
3,50
63,
734
2013
4,96
05,
282
1990
2,40
22,
558
2007
15,7
5716
,913
52,7
6556
.194
108,
959
37,0
681
42
2.94
39.2
8651
.795
12,5
0917
,806
36,7
699,
00/i’
15,5
59
1988
2,81
22,
995
1992
2,67
32,
847
2008
400
426
2012
4.10
04,
367
2013
4.35
04,
633
2013
11,4
4312
,187
2007
12,6
5113
.473
1988
1.81
91,
937
40,2
4942
,865
83,1
1335
,156
1.33
2.76
45,3
1053
,202
7,89
210
,533
21,7
517,
000’
15,2
64
2004
978
1.04
219
8826
628
319
8722
023
419
885,
758
6,13
219
871,
016
1,08
219
874,
501
4,79
419
681.
256
1,33
813
.995
14,9
0528
,900
24,4
66057
1.15
15.1
74’
20,6
67’”
5,49
33,
142
6,48
9io
,ooi
58973
Sou
thw
est
A/B
/CS
outh
wes
t!i
JB/C
Sou
thw
est
NB
/CS
outh
wes
tA
/B/C
Sou
thw
est
A/B
/CS
outh
wes
tA
/B/C
Sou
thw
est
A/B
/CTM
path
way
1O
euel
oper
Rei
mbu
rsem
entu
Sou
thw
est
B1
16’
1SW
BC
AM
PB
EN
MC
CIL
LO
IJG
HR
BA
LL16
”1
WIN
DM
LL
RU
NS
WB
TR
AN
SM
AIN
36’
1S
outh
wes
tB
Pum
pS
tati
onC
C83
ML
U22
mgd
1S
outh
wes
tB
36”
Tra
nsm
issi
onM
ain
CC
#3-M
UD
36-i
nch
IS
outh
wes
tB
16”
Tra
nsM
ain
CC
#3-M
UD
16-i
nch
1S
outh
wes
tB
Res
ersi
or#1
CO
O-M
UD
tota
l2m
gFa
citit
yS
ize
Tha
tD
eter
min
esC
apac
ity
Add
it,00
36”
114
/12,
225
io,s
uo
u.i
io
il
11,0
9912
,340
23,9
2914
,350
0.91
1.91
10,5
W1
5,2
21
4(2
02,
011
7.88
36,
00it”
3,62
2
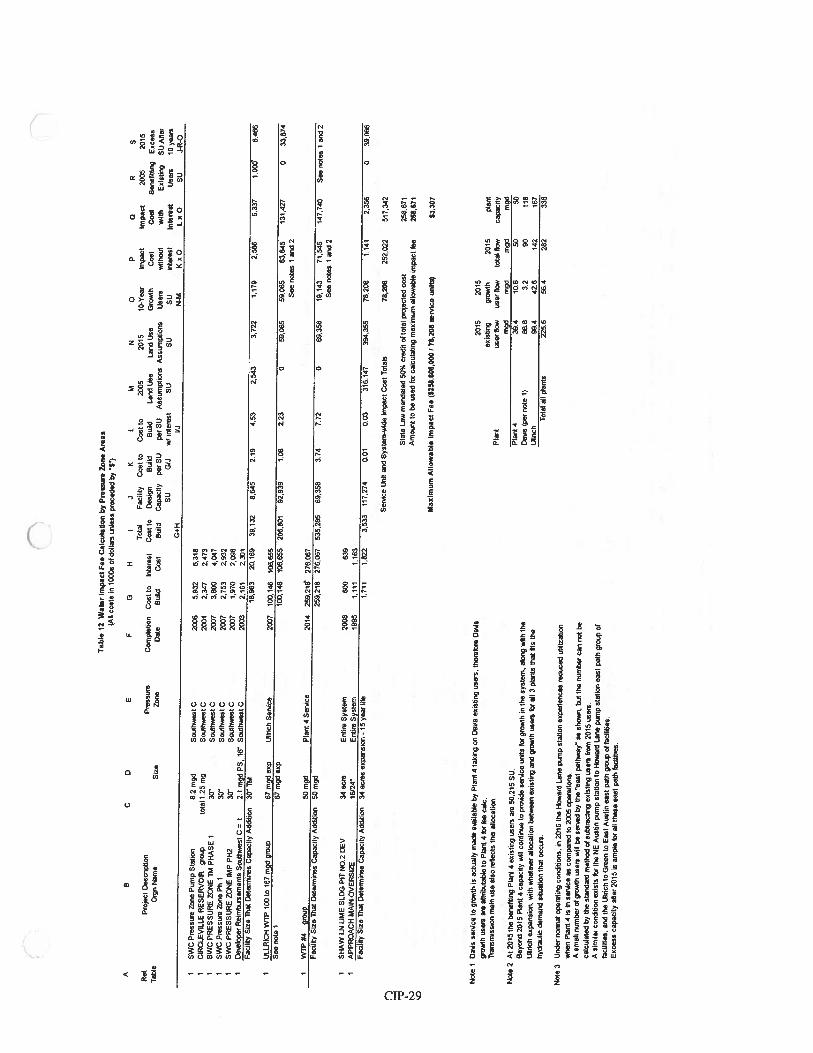
Tab
le12
Wal
erIm
pac
tF
eeC
alcu
lati
on
byP
ream
me
Zon
eA
reas
(All
cost
sin
l000
sof
dolla
rsix
dess
prec
eded
by“5
’)
CC)
EF
13H
IJ
KL
MN
0P
13N
ST
otal
Faci
lity
Cos
tto
Cos
tto
2005
2015
10-Y
ear
Impa
ctIm
pac
t20
0520
15P
ress
ure
Com
plet
ion
Cos
tto
Inte
rest
Cos
tto
Des
ign
Bui
ldB
uild
Lan
dU
seL
and
Use
Gro
wth
Cos
tC
oat
Ber
iefi
tting
Exce
ssS
ize
Zon
eD
ale
Bui
ldC
ost
Bui
ldC
apac
ity
per
So
per
SU
Ass
umpt
ions
Ass
umpt
ions
Use
rsre
ltio
utw
Ith
Exi
stin
gS
OA
Rer
SOG
/Jw
!iri
tere
stSU
SOSU
edef
eot
Inle
reat
Use
rslO
yem
sU
iN
-nt
KxO
LxO
EUJ-
R-O
1SI
-lA
WLN
LIM
ESL
DG
PIT
NO
.20E
V34
acre
Ent
ire
Sys
tem
1A
PP
RO
AC
HM
AIN
-OV
ER
SIZ
E16
/24
Ent
ire
Sys
tem
Faci
lity
Siz
eT
hat
Det
erm
ines
Cap
acit
yA
dditi
on34
acre
sex
pans
ion
-15
year
life
2008
600
639
1995
1,11
11,
183
1.71
11.
822
3,53
311
7.27
40
01
0.03
316,
147
394,
355
78,2
081,
141
2,35
60
39.0
06
Sem
sic
Und
mid
Syst
ems-
undo
Impa
ctC
ost
Tot
als
70,2
0825
2,02
251
7.34
2
Sta
teL
awm
anda
ted
50%
cred
it0(
1010
1pm
x1ec
ted
Cos
tA
mou
ntto
beus
edto
oca
lcul
atin
gm
axim
umal
low
able
impa
ctfe
e
Max
imum
All
ow
able
Imp
act
Fee
($25
8,60
8,06
0I
78,2
08ae
rvlc
eun
Its)
$3,3
07
Not
eI
Dau
isee
r,ic
eto
grow
this
actu
ally
mad
ea,
oila
ble
byP
lant
4ta
kin
ger
rD
eco
exis
ting
use
rs,
ther
efo
reO
asis
grow
thus
ers
are
attr
ibut
able
toP
lant
4fo
rte
eca
bT
rans
mis
sion
mai
nus
eal
som
itec
tsth
inal
loca
tion
.
Not
e2
At
2015
the
bene
fitin
gP
lant
4ex
isti
ngus
ers
are
50.2
15EU
.B
eyon
d20
15P
lant
4C
apac
ityw
illco
ntin
ueto
pmui
deae
r4ce
unit
sfc
cgr
owth
inth
esy
stem
,al
ong
with
the
tJlr
ich
enpa
nsio
ri,
with
wti
ates
eral
loca
tion
betw
een
exis
ting
and
gmw
lhus
ers
tsr
alt
3pl
ants
that
fits
the
hydr
Oul
icde
man
dsi
tuat
ion
that
occu
rs.
Hol
e3
Und
erno
rmal
oper
atin
gco
ndit
ions
,in
2015
tIne
How
ard
Lan
epu
mp
slat
ion
expe
rien
ces
redu
ced
utili
zatio
nw
ttett
Pla
nt4
isin
seos
ice
asco
mpa
red
tu20
05op
erst
ions
.A
smal
lnu
mbe
rof
grow
thus
ers
will
besc
ored
byth
e“e
anl
path
way
’as
show
n,bu
tth
enu
mbe
rca
nno
tbe
calc
ulat
edby
the
stan
dard
met
hod
ofsu
btra
ctin
gex
isti
ngus
ers
fran
,20
15us
ers.
Asi
mil
arco
rtdi
lion
exiS
tsfo
rO
reN
EA
usti
npu
mp
stat
icrn
ito
Hoa
ard
Lan
epu
mp
stat
ion
east
path
grp
ofta
cili
lies
.an
dth
eL
ttech
Icr G
reen
toE
ast
Aus
lin
east
patti
grou
p01
faci
litie
s.E
xce
ssca
paci
tyaf
ter
2015
isam
ple
frwal
lth
ese
east
path
faci
litie
s.
2015
2015
exis
ting
grow
th20
15P
lant
user
tow
user
flow
tota
lR
owni
gri
mgd
mgd
Pla
nt4
394
10.6
51)
Dau
islp
ernote
l)868
3.2
90U
ltric
h99
.4426
142
Tot
alal
tpl
ants
225.
656
.428
2
A
Ref
.T
able
B
Pro
ject
Des
crip
tion
Org
nN
ame
G+H
IS
WC
Pre
ssurc
zoneP
um
pE
tati
ori
8.2
rng
dS
uu
thw
estC
2006
5.93
26,
318
IC
IRC
LE
VIL
LE
RE
SER
VO
IRgr
oup
tota
tl.2
5m
gS
ou
thw
estC
2001
2,34
72
47
31
SW
CP
RE
SS
UR
EZ
ON
ETM
PHA
SE1
30’
Sou
thw
est
C20
073,
801)
4,04
71
SW
CP
ress
ure
Zon
eP
hi
30”
Sou
thw
est
C20
072,
753
Z93
2I
SW
CP
RE
SS
UR
EZ
ON
EIM
PP1
-12
30”
Sou
thw
est
C20
071,
970
2.08
8I
t)es
elc0
1er
Rei
mbu
rsem
ents
Sou
thw
est
Co
12
1m
cdP
S,
16’”
Sou
thw
est
C20
032,
161
2,30
1Fa
cilit
yS
izeT
hat
Det
emTr
iines
Cap
acit
yA
dditi
on30
’‘T
M18
,963
20,1
6939
,132
8,64
52.
194.
532.
543
3,72
21,
179
25
96
5,33
710
00’
64
66
1IJ
LLR
ICH
W’T
P10
0to
167
mgd
grou
p67
mgd
cop
UlI
nch
Ser
sice
2007
100,
146
106,
655
See
note
167
mgd
exp
100,
146
106,
655
206,
801
92.9
391.
082.
230
59.0
6559
,065
63,6
4513
1.42
70
33,8
74S
eeno
tes
1an
d2
1W
i?#4
grou
pSI
)m
Pla
nt4
Secu
ice
2014
259.
218’
276,
067
Faci
lity
Siz
eT
hat
Del
emm
ines
Cap
acit
yA
dditi
on50
mgd
259.
218
276.
067
536,
285
69.3
583.
747,
720
69.3
5819
.143
71,5
4514
7.74
0S
eeno
tes
1an
d2
I—)
See
note
s1
and
2
258,
671
268,
671
plan
tca
paci
tym
yd 50 118
167
335
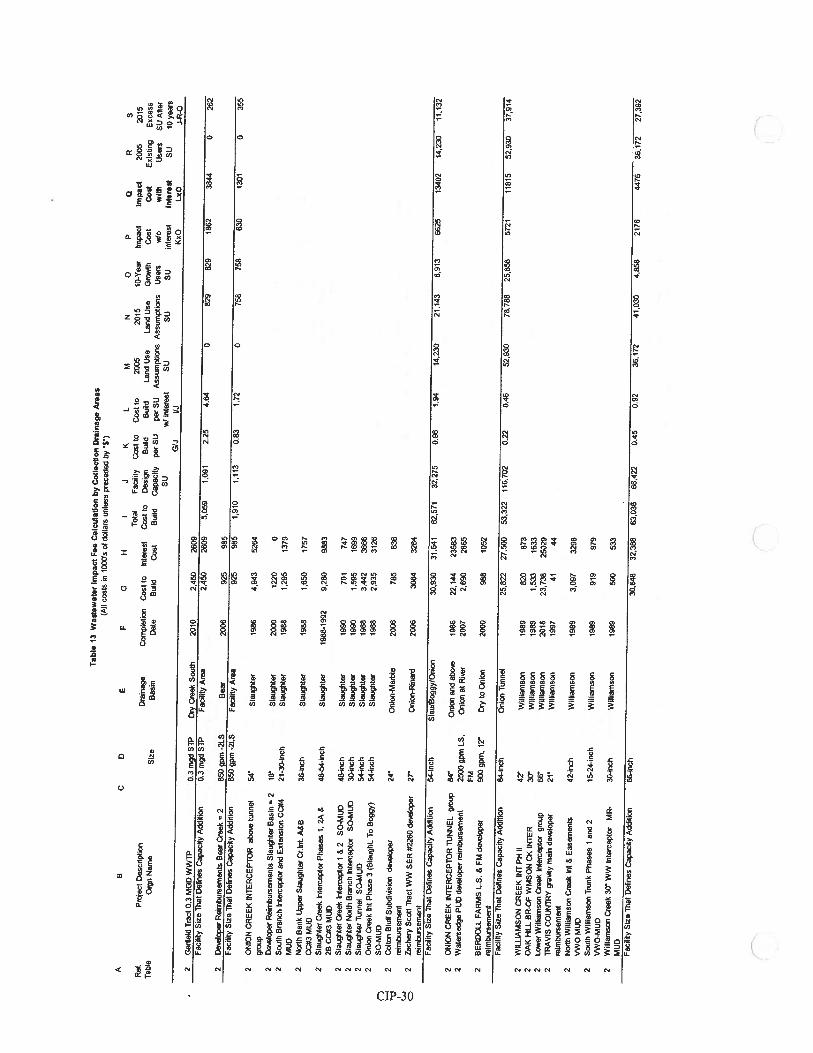
Tab
le13
Was
tew
ater
Imp
act
Fee
Cal
cula
tIon
byC
olle
ctio
nD
rain
age
Are
as(M
Ico
sts
ix10
00’s
otdo
llars
unle
sspr
eced
edby
‘“5’”)
EF
13H
1K
LM
N0
PQ
RS
Tot
alFa
cilit
yC
ost
toC
ost
to20
0520
1510
-Yea
rIm
pact
imp
act
2005
2015
Dra
inag
eC
ompl
etio
nC
ost
totn
tere
stC
ost
toD
esig
nB
uild
Bui
ldL
and
Use
Lan
dU
se(3
row
thC
ost
Cos
tE
xist
ing
Exc
ess
Dat
eB
uild
Cos
tB
uild
Cap
acit
yp
erS
Up
erS
UA
ssum
ptio
nsA
ssum
ptld
nsU
sers
wto
wit
hU
sers
SU
A6e
SUw
Iin
tere
stSU
SU
SUin
tere
stin
tere
stSU
10ye
ws
IIJK
xOL
xOJ-
R-O
Ret
.T
able
B
Pro
ject
Des
crip
tion
Org
nN
ame
C0
Siz
eB
asin
GdJ
2G
arte
ldT
ract
0.3
MG
DW
WT
P0,
3m
gdS
WD
ryC
reek
Sou
th20
102
45
026
09Fa
cilit
yS
ize
Tha
tD
efin
esC
apac
ity
Add
ition
0.3
mgd
SW
Faci
lity
Are
a2,
450
2609
5,05
91,
091
225
464
082
982
918
6238
440
262
2D
evel
oper
Rei
mbu
rsem
ents
Bea
rC
reek
285
0gp
m-2
LS
Bea
r20
0692
598
5Fa
cilit
yS
ize
Tha
tD
efin
esC
apac
ity
Add
itio
n85
0gp
m-2
LS
Faci
tity
Are
a92
598
51,
910
1,11
30.
831.
720
758
758
630
1301
035
52
ON
ION
CR
EE
KIN
TE
RC
EPT
OR
abos
etu
nnel
54”
Sla
ught
er19
8.6
4,94
352
64gr
oup
2D
evel
oper
Rei
mbu
rsem
ents
Sla
ught
erB
asin
=2
18”
Sla
ught
er20
0012
200
2S
outh
Bra
nch
Inte
rcep
tor
and
Est
ensi
orl
CC
#421
-30-
inch
Sla
ught
er19
881,
295
1379
MU
D2
Nor
thB
ank
Upp
erS
taug
hter
Cr.
Int.
A&
B36
-inc
hS
laug
hter
1988
1,55
017
57C
C*3
MU
D2
Sla
ught
erC
reek
Inte
rcep
tor
Phas
es1.
2A&
48-5
4-in
chS
laug
hter
1988
-199
29,
280
9883
2BC
C#3
MU
D2
Sla
ught
erC
reek
Inte
rcep
tor
I&
2SO
-MU
D48
-inc
hS
laug
hter
1990
701
747
2S
laug
hter
Nor
thB
ranc
hht
terc
epto
rSO
-MU
D30
-inc
hS
laug
hter
1990
1,59
516
992
Sla
ught
erT
unne
lSO
-MU
D54
-inc
hS
laug
hter
1988
3,44
236
662
Oni
onC
reek
mitP
has
e3
(Sla
ught
.To
Bug
gy)
54-i
nch
Sla
ught
er19
882,
935
3126
t)
SO-M
UD
2C
olto
nB
luff
Subd
isis
ion
deve
lope
r24
”O
nion
-Mar
ble
2006
785
836
reim
burs
emen
t2
Zac
hary
Sco
ttT
ract
WW
SE
R#2
260
deve
lope
r27
’”O
nion
-Rin
ard
2006
3(18
432
8.4
reim
burs
emen
tFa
cilit
yS
ize
Tha
tD
efin
esC
apac
ity
Add
ition
54-i
nch
Sla
ulB
oggy
lOni
on30
,930
31,6
4162
,571
32,2
750.
961.
9414
,230
21,1
436.
913
6625
1340
214
,230
11.1
322
ON
ION
CR
EE
KIN
TE
RC
EPT
OR
TUN
NEL
grou
p84
”O
nion
and
abov
e19
8622
,144
2358
32
Wat
erse
dge
PUt)
deve
lope
rre
imbu
rsem
ent
2500
gpm
LS,
Oni
onat
Riv
er20
072,
690
2865
FM2
BE
RO
OL
LFA
RM
SL
.S.
&FM
deve
lope
r90
6gp
m,
12”
Dry
toO
nion
2000
988
1052
reim
burs
emen
tFa
cilit
yS
ize
Tha
tD
efin
esC
apac
ity
Add
ition
84-i
nch
Oni
onT
unne
l25
,822
27,5
0053
,322
115,
702
0.22
0.46
52,9
3078
,788
25,8
6857
2111
815
52,9
3037
,914
2W
ILLI
AM
SON
CR
EE
KIN
TPH
II42
’”W
illia
mso
n19
8982
087
32
OA
KH
ILL
BR
-OF
WM
SON
CK
INTE
R30
’”W
illia
mso
n19
691.
533
1633
2L
ower
Will
iam
son
Cre
ekIn
terc
epto
rgr
oup
66’”
Will
iam
son
2016
23,7
3825
029
2TR
AV
ISC
OU
NT
RY
grau
tym
ain
deve
lope
r21
’”W
illia
mso
n19
9741
44re
imbu
rsem
ent
2N
orth
WiU
iarn
son
Cre
ektn
t8
Eas
emen
ts42
-inc
hW
illia
mso
n19
893,
097
3296
VW
OM
UD
2S
outh
wil
liam
son
Trun
imP
has
es1
and
215
-24-
inch
Will
iam
son
198.
991
997
9V
WO
-MU
D2
Will
Iam
son
Cre
ek30
”W
WIn
lerc
epto
rM
R-
30-i
nch
WIl
liam
son
1989
500
533
MU
DFa
cilit
yS
ize
Tha
tD
etne
sC
apac
ity
Add
ition
66-i
nch
30,6
4832
,388
63,0
3668
.422
0.45
0.92
36,1
7241
,030
4,85
821
7644
7636
,172
27.3
92
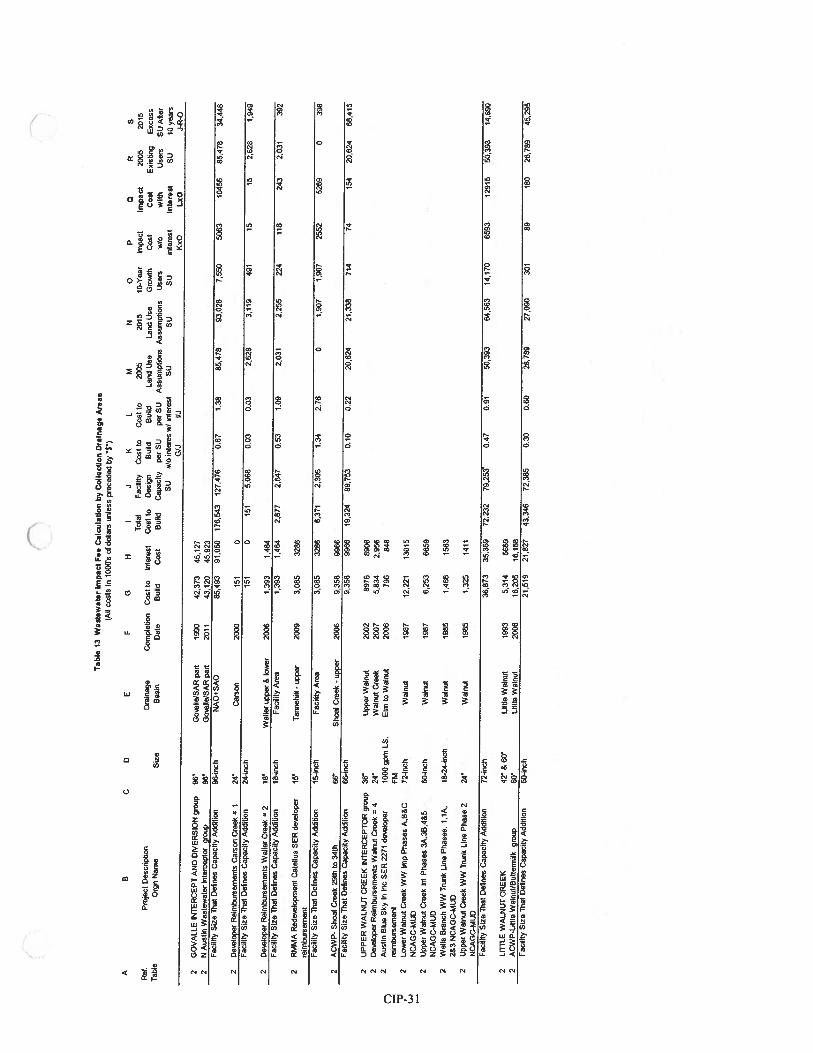
Tab
le13
Was
tew
ater
Impac
tF
eeC
alcu
lati
on
byC
olle
ctio
nD
rain
age
Are
as(A
llco
sts
in10
00’s
ofdo
llar
sun
less
prec
eded
by“5
”)
AC
00
FC
HI
JK
LM
No
PQ
RS
Tot
alFa
cilit
yC
ost
toC
ost
to20
0520
1510
-Yea
rhn
pact
Impac
t20
0520
15R
et.
Pro
eet
Des
crip
tion
Dra
inag
eC
ompl
etio
nC
ost
toln
tere
slC
osl
toD
esig
nB
uild
Bui
ldL
and
Use
Lan
dU
seG
row
thC
ost
Coa
tE
xist
ing
Exce
ssT
abte
Org
nN
ame
Siz
eB
asin
Dal
eB
uild
Cos
tB
uild
Cap
acity
per
SOpe
rSU
Ass
um
pti
ons
Ass
umpt
ions
Use
rser
iew
ith
Use
rsSO
Aft
erS
I)d
oin
lere
sw
Iin
tere
stSU
SUSO
inte
rest
Inte
reut
SU10
year
s
___________________
_
G/J
VJK
xOL
aOJ-
R-O
2G
OV
AL
LE
INT
ER
CE
PTA
ND
DIV
ER
SIO
Ngr
oup
96”
Gos
alle
/SA
Rpa
rt19
9042
,373
45,1
272
NA
ustin
Was
tew
ater
trit
erce
plor
grou
p96
”G
osll
eiS
AR
part
2011
43
12
045
923
Fac
ilit
yS
ize
Tha
tD
efin
esC
apac
ity
Add
ition
96-i
nch
NA
O+S
AO
85,4
9301
,050
176,
543
127,
476
0.67
1.38
85,4
7893
,028
7,55
050
6310
456
85A
7834
.448
2D
ewto
per
Rei
mbu
rsem
ents
Car
son
Cre
ek=
124
”C
arso
n20
0015
10
Faci
lity
Siz
eT
haI
Det
nes
Cap
acit
yA
ddit
ion
24-i
nch
1St
015
15,
066
0.03
0.03
2,62
83.
119
491
1515
2,62
81,
949
2D
eelo
per
Rei
mbu
rsem
ents
Wai
ler
Cre
ek2
18”
Wal
ter
uppe
r&
low
er20
061,
393
1,48
4Fa
cilit
yS
ize
Tha
tD
eitn
esC
apac
ity
Add
ition
18-i
nch
Faci
lity
Are
a1,
393
1.48
42,
877
2,64
70.
531.
092,
031
2.25
522
411
824
32,
031
392
2R
MM
AR
edes
elop
men
lC
atet
tus
SE
Rdee
loper
15”
Tan
nehi
ll-
uppe
r20
093.
085
3286
reim
burs
emen
tFa
cilit
yS
ize
Tha
tD
etne
sC
apac
ity
Add
ition
15-i
nch
Faci
lity
Are
a3,
085
3286
6,37
12,
305
1.34
2.76
01,
907
1,90
725
5282
690
396
2A
CW
P-S
heaf
Cre
ek29
thto
34th
66”
Shoa
lC
reek
-up
per
2006
9,35
899
66Fa
cilit
yS
ize
Tha
tD
etin
esC
apac
ity
Add
ition
66-i
nch
9,35
899
6619
.324
89.7
530.
100.
2220
,624
21,3
3871
474
154
20,6
2468
,415
2U
PP
ER
WA
LN
UT
CR
EE
KIN
1ER
CE
PTO
Rgr
oup
36”
tipper
Wal
nut
2002
8976
8906
2i3
ewlo
per
Rei
mb
urs
emen
tsW
alnu
tC
reek
424
”W
alnu
tC
reek
2007
5,83
42,
956
2A
usti
nB
lue
Sky
riIn
cS
ER
2271
dese
lope
r10
00gp
mL
S.E
lmto
Wal
nut
2006
796
848
—i
reim
bu
rsem
ent
FM2
Low
erW
alnu
tG
reek
WW
hop
Ph
ases
A.B
&C
72-i
nch
Wal
nut
1987
12,2
2113
015
NC
AG
C-M
UD
2U
pper
Wal
nut
Cre
ekit
Phas
es3A
,38,
4&5
60-i
nch
Wal
nut
1987
6,25
366
59N
CA
GC
-MU
D2
Wel
lsB
ranc
hW
WT
hink
One
Ph
ases
,1,
1A,
18-2
4-in
chW
alnu
t19
851,
468
1563
2&3
NC
AG
C-M
UD
2U
pper
Wal
nut
Cre
ekW
WT
wnk
Use
Ph
ase
224
”W
alnu
t19
851,
325
1411
NC
AG
C-M
UD
Faci
lity
Siz
eT
hat
Det
nes
Cap
acit
yA
dditl
or’r
72-i
nch
36,8
7335
,359
72,2
3279
,253
0.47
09
150
,393
64,5
6314
,170
6593
1291
550
,393
14,6
96
2L
IT1t
EW
AL
NU
TC
RE
EK
42”
&60
”L
ittte
Wal
nut
1993
5,31
456
592
AC
WP-
Utf
leW
atnu
tiBut
lerm
ilkgr
oup
60”
Utt
teW
alnu
t20
0616
,205
16,1
66F
acit
ity
Siz
eT
hat
Def
ines
Cap
acit
yA
ddit
ion
60-i
nch
21,5
1921
,827
43,3
4672
,385
0.30
0.60
26,7
8927
.090
301
6918
026
.789
45,2
95
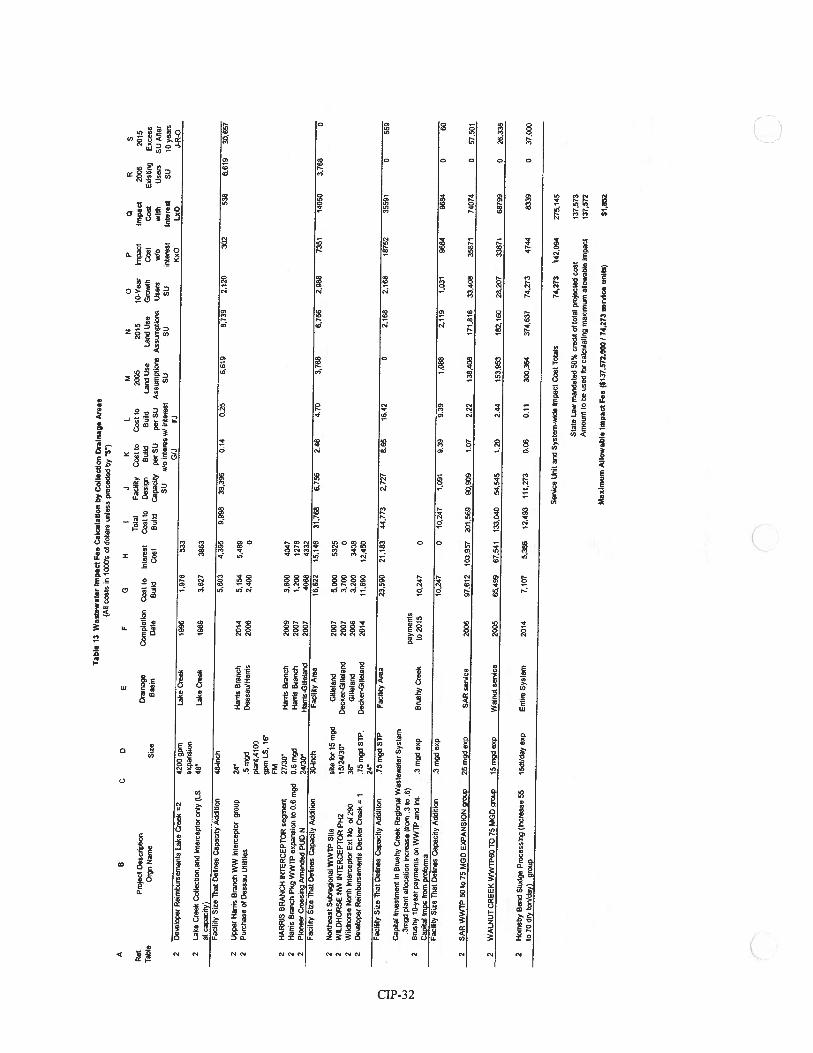
Tab
le13
Was
tew
ater
Impac
tF
eeC
alcu
lati
on
byC
oll
ecti
on
Dra
Inag
eA
reas
(All
cost
sin
1000
’sof
doll
ars
unle
sspr
eced
edby
“8”)
AB
C0
EF
GH
IJ
KL
0N
0P
(3R
ST
otal
Faci
lity
Cos
tto
Cos
tto
2005
2015
10-Y
ear
Impa
ctIm
pac
t20
0520
15R
ef.
Pro
ject
Des
crip
tion
Dra
inag
eC
ompl
etio
nC
ost
toIn
tere
stC
ost
toD
esig
nB
uild
Bui
ldL
and
line
Lan
dU
seG
row
thC
ost
Cos
tE
xist
ing
Ex
cess
Tab
leC
rgn
Nam
eS
ize
Bas
inD
ate
Bui
ldC
ost
Bui
ldC
apac
ity
per
SO
per
SUA
ssum
ptio
nsA
ssum
ptio
nsU
sers
w/o
will
sU
sers
SO8
8cr
SOdo
stem
sw
/in
tere
stSO
SOSO
tnte
rest
Inte
rest
SO10
year
sG
/JV
JK
xOL
eOJ-
R-O
2C
esel
oper
Rei
mbu
rsem
ents
Lak
eC
reek
242
00gp
eiL
ake
Cre
ek19
961,
976
533
expa
nsio
n2
Lak
eC
reek
Col
lect
ion,
and
Inte
rcep
tor
only
(LS
48’
Lak
eC
reek
1989
3,62
738
63at
capa
cily
)Fa
citit
yS
ize
Tha
iD
ehoe
sC
apac
ity
Add
ition
4-0-
inch
5,60
34,
395
9,99
839
.396
01
40
25
6,61
98,
739
2,12
030
253
86,
619
30,6
572
Upp
erH
ams
Bra
nch
WW
Inte
rcep
tor
grou
p24
”H
ams
Bra
nch
2014
5.15
45,
489
2P
urc
has
eof
Des
sau
Util
ities
.5m
gct
Des
sas/
Ham
s20
062.
400
0pt
arit
.410
0gp
rnL
S,
16”
FM2
HA
RR
ISB
RA
NC
HIN
TE
RC
EPT
OR
segm
ent
27/3
9”H
ams
Bra
nch
2009
3.80
040
472
Ham
sB
ranc
hP
kgW
WT
Pex
pans
ion
to0.
6rt
tgd
0.6
mgd
Ham
sB
ranc
h20
071,
200
1278
2P
ione
erC
ross
ing
Am
ende
dPU
DN
24/3
0”H
arri
s-G
iltet
and
2007
4068
4332
Fac
ilit
yS
ize
ibat
t)et
nes
Cap
acit
yA
dditi
on30
-inc
hFa
cilit
yA
rea
16,6
2215
,146
31,7
686,
756
2.46
4.70
3,76
86,
756
2.98
873
5114
050
3,76
80
2N
ceth
east
Sutir
egio
rrat
WW
TP
Sit
esi
tefo
r15
rrig
dO
ltle
tand
2007
5.00
053
252
WIL
OH
OR
SEN
WIN
TE
RC
EPT
OR
PH
215
/24/
30”
Dec
ker-
Gitt
etan
ct20
073,
700
02
Wit
dhor
seN
orth
Inte
rcep
tor
Etit
No.
of29
038
”G
itlet
and
2006
3,20
/)34
082
Des
etop
erR
eirr
ibur
sem
ertl
sD
ecke
rC
reek
=I
.75
rngd
SiP
.D
ecke
r-G
ille
land
2014
11,6
0012
,450
24F
acil
ity
Siz
eT
hat
Det
nes
Cap
acit
yA
dditi
on.7
5m
gdS
i?Fa
citit
yA
rea
23,5
9021
.183
44,7
732,
727
8.65
16.4
20
2,16
82.
168
1675
235
591
055
9C
apit
altn
surs
tmen
tin
Bru
shy
Cre
ekR
egio
nal
Was
tew
ater
Sy
stem
.3m
gdpl
ant
allo
cati
onin
crea
se(h
orn
.3to
.6)
paym
ents
2B
rtm
hy10
-yea
rpa
ymen
tson
WW
TP
arid
kit.
.3m
gdas
pB
rush
yC
reek
1020
1510
.247
0C
apit
alIm
psfr
ompr
ofor
ms
Fac
ilit
yS
ize
Tha
tD
ebne
sC
apac
ity
Add
ition
.3m
Od
asp
10.2
470
10.2
471.
091
9.39
9.39
1,08
82,
119
1.03
196
8496
840
60
2S
AR
WW
1P
51
)10
75
MO
DE
)G’A
NSI
ON
grou
p25
tngd
asp
SAR
5cr-
ace
2006
97.6
1210
3,95
720
1,56
990
,909
1.07
2.22
138.
408
171,
816
33.4
0835
871
7407
40
57.5
1)1
2W
AL
NU
TC
RE
EK
WW
TP6
OTO
75M
OD
grou
p15
mgd
exp
Wal
nut
sors
ice
2005
65.4
9967
,541
133,
040
54,5
451.
202.
4415
3,95
318
2.16
028
,207
3387
168
799
026
,338
2H
omsb
yB
end
Slu
dge
Pro
cess
ing
(Inc
reas
e55
ledt
Jday
eep
Ent
ire
Sys
tem
2014
7.10
75.
386
12,4
9311
1,27
30.
060.
1130
0,36
437
4.63
774
.273
474.
483
390
37.0
00to
70dr
yIo
n/da
y)gr
oup
5cr-
Ace
Uni
tan
dS
yste
m-w
ide
Impa
ctC
ost
Tot
als
74.2
7342,0
94
275,
145
Sta
teL
awm
anda
ted
50%
cred
itof
tota
lpr
c(ec
ted
cost
137,
573
Am
ount
tobe
used
for
catc
ulat
irig
max
imum
atow
ahie
impa
ct13
7,57
2
Max
imum
All
ow
able
Imp
act
Fee
($13
7,57
2,00
0I
74,2
73se
rvIc
eun
Its)
$1,6
52
VII. CALCULATION OF MAXIMUM ALLOWABLE IMPACT FEE
The total system-wide impact costs for all pressure zone and all drainage areas are determined by simply summing theimpact costs of the individual subareas. (Note that these summations can be found in columns P and Q in Tables 12and 13.)
The maximum allowable impact fee, as provided in Section 395.0 15 of the Texas Local Government Code, iscalculated by taking the system-wide impact costs per service unit, and applying the 50% credit required by State Lawbeginning September 1, 2001, then dividing the result by the service units. The resulting maximum allowable impactfees are stated below:
Water $3,307Wastewater $1,852
VIII. IMPACT FEE ASSESSMENT
The Texas Impact Fee Act (Section 395.016 of the Texas Local Government Code) provides that the impact fees mustbe assessed on all property no later than the time of subdivision, with certain exceptions where development occurswithout the need for subdivision. The City staff can, with existing improved computer databases, find the date when asubdivision plat is recorded. The scanned image of the recorded plat is available to personnel in the subdivision reviewand tap sales offices allowing them to inform customers in a timely fashion what the assessed fee is for a specific lot.
Since 1990 the Impact Fee update reports and ordinances have included an “assessed fee” separate from the maximumallowable and collected fees. The “assessed fees” have remained constant since 1990 at $1,700 for water per serviceunit and $1,300 for wastewater per service unit. With the new recommended fee structure the separate “assessed fee”is being dropped and from now on, the assessment will be the maximum allowable amount.
IX. COLLECTED FEES
The fees actually collected at the time of tap sale may be set by ordinance at any amount equal to or lower than themaximum allowable fees. On August 5, 1999, the City Council adopted an updated fee schedule for capital recoveryfees to be collected per service unit, The fees, as adopted in 1999, vary according to location as described below. Insubsequent years the adopted annual budget has included the 1999 fee structure. The existing collected fee schedulefrom the Fiscal Year 2006/2007 City-wide Rate Ordinance is attached as Appendix A.
Descriptions of the zones for the fees are found in the Land Development Code Chapter 25-1-21(26) and (30), Chapter25-8-2(D), Chapter 25-2-311, and Ordinance 990805-31 excerpted in Appendix B
The fees adopted as part of the Fiscal Year 2006/2007 City-wide Rate Ordinance are assessed in accordance with theTexas Impact Fee Act (Section 395.0 16 of the Texas Local Government Code) to all lots in subdivision plats recordedprior to the effective date of the following recommended fee structure.
The fee for lots recorded after the effective date of the recommended fee structure will be assessed according to thisrecommended fee schedule. Under the current state statute, if this recommended fee structure were to remain in placefor five years, for example, lots in plats recorded during those five years will pay this recommended fee. Subsequentfee structures will not increase or decrease the fee for lots platted during the five year period.
In order to provide more structure to the collected impact fees, this update of the Impact Fee Capital Improvement Planrecommends establishing a policy relationship between each of the fee zones and the maximum allowable fee. Since1990, the collected impact fee has been established at a rate lower than the maximum calculated fee. Since the currentfee zones were established in 1999, the fee for each zone has not had a formalized policy relationship to the maximumallowable fee. This update proposes establishing the following relationships for each fee zone to the maximumallowable fee for both water and wastewater fees, based on the historic relationships of the water fee zones, rounded tothe nearest $100 as shown in Table 14.
CIP-33
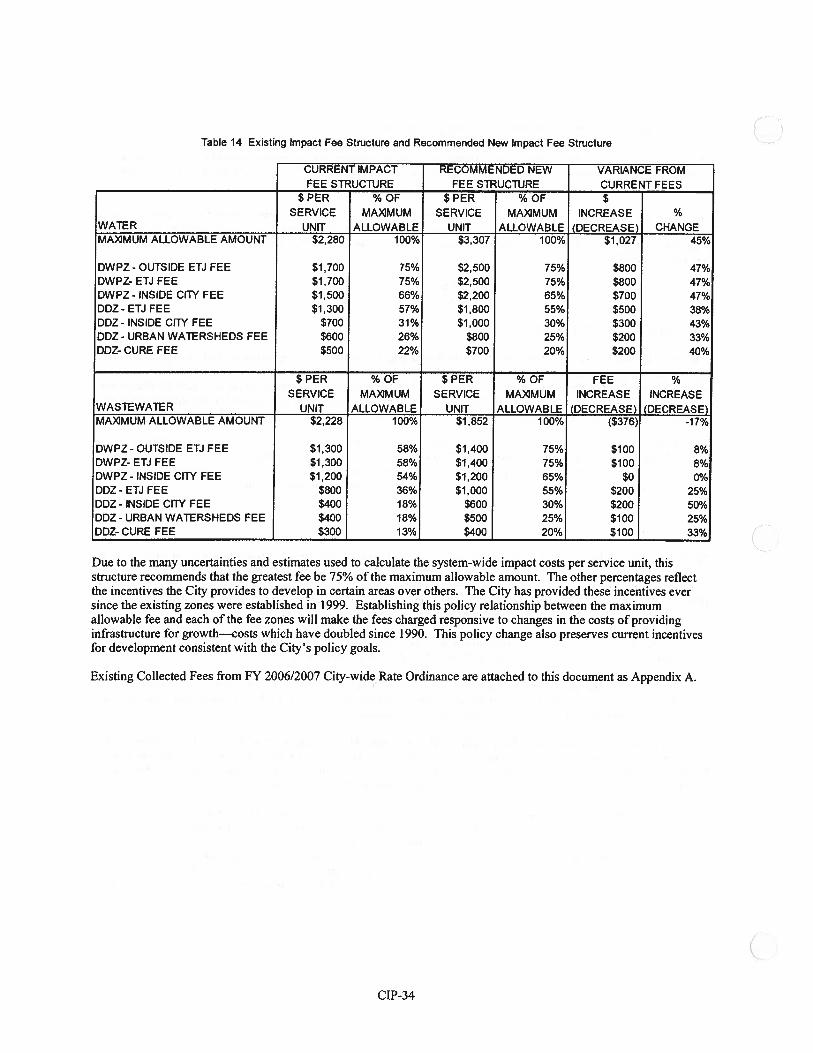
Table 14 Existing Impact Fee Structure and Recommended New Impact Fee Structure 0r’.r’.i’, IvIr,’. I
FEE STRUCTURERECOMMENDED NEW
FEE STRUCTUREVARIANCE FROMCURRENT FEES
Due to the many uncertainties and estimates used to calculate the system-wide impact costs per service unit, thisstructure recommends that the greatest fee be 75% of the maximum allowable amount. The other percentages reflectthe incentives the City provides to develop in certain areas over others. The City has provided these incentives eversince the existing zones were established in 1999. Establishing this policy relationship between the maximumallowable fee and each of the fee zones will make the fees charged responsive to changes in the costs of providinginfrastructure for growth—costs which have doubled since 1990. This policy change also preserves current incentivesfor development consistent with the City’s policy goals.
Existing Collected Fees from FY 2006/2007 City-wide Rate Ordinance are attached to this document as Appendix A.
$PER %OF $PER %OF $SERVICE MAXIMUM SERVICE MAXiMUM INCREASE %
WATER UNIT ALLOWABLE UNIT ALLOWABLE (DECREASE) CHANGEMAYJMUM ALLOWABLE AMOUNT $2,280 100% $3,307 100% $1,027 45%
DWPZ-OUTSIDE ETJ FEE $1,700 75% $2,500 75% $800 47%DWPZ- ETJ FEE $1,700 75% $2,500 75% $800 47%DWPZ- INSIDE CITY FEE $1,500 66% $2,200 65% $700 47%DDZ - ETJ FEE $1,300 57% $1,800 55% $500 38%DDZ- INSIDE CITY FEE $700 31% $1,000 30% $300 43%DDZ - URBAN WATERSHEDS FEE $600 26% $800 25% $200 33%DDZ- CURE FEE $500 22% $700 20% $200 40%
$PER %OF $PER %OF FEE %SERVICE MAXIMUM SERVICE MAXIMUM INCREASE INCREASE
WASTEWATER UNIT ALLOWABLE UNIT ALLOWABLE (DECREASE) (DECREASE)MAXIMUM ALLOWABLE AMOUNT $2,228 100% $1,852 100% ($376) -17%
DWPZ-OUTSIDEETJFEE $1,300 58% $1,400 75% $100 8%DWPZ- ETJ FEE $1,300 58% $1,400 75% $100 8%DWPZ- INSIDE CITY FEE $1,200 54% $1,200 65% $0 0%DDZ- ETJ FEE $800 36% $1,000 55% $200 25%DDZ - INSIDE CITY FEE $400 18% $600 30% $200 50%DDZ-URBANWATERSHEDSFEE $400 18% $500 25% $100 25%DDZ- CURE FEE $300 13% $400 20% $100 33%
CIP-34
Updated Report Preparation:
City of AustinAustin Water Utility
Tom Ellison, RE.Randall AlexisBob ButlerTom AlbinTeresa Lutes, RE.
City of AustinNeighborhood Planning and Zoning Department (NPZD)Ten McManus (1996, 2OlOand 2020 population and employment data)Ryan Robinson, City Demographer (2000 census data)
CJP-35
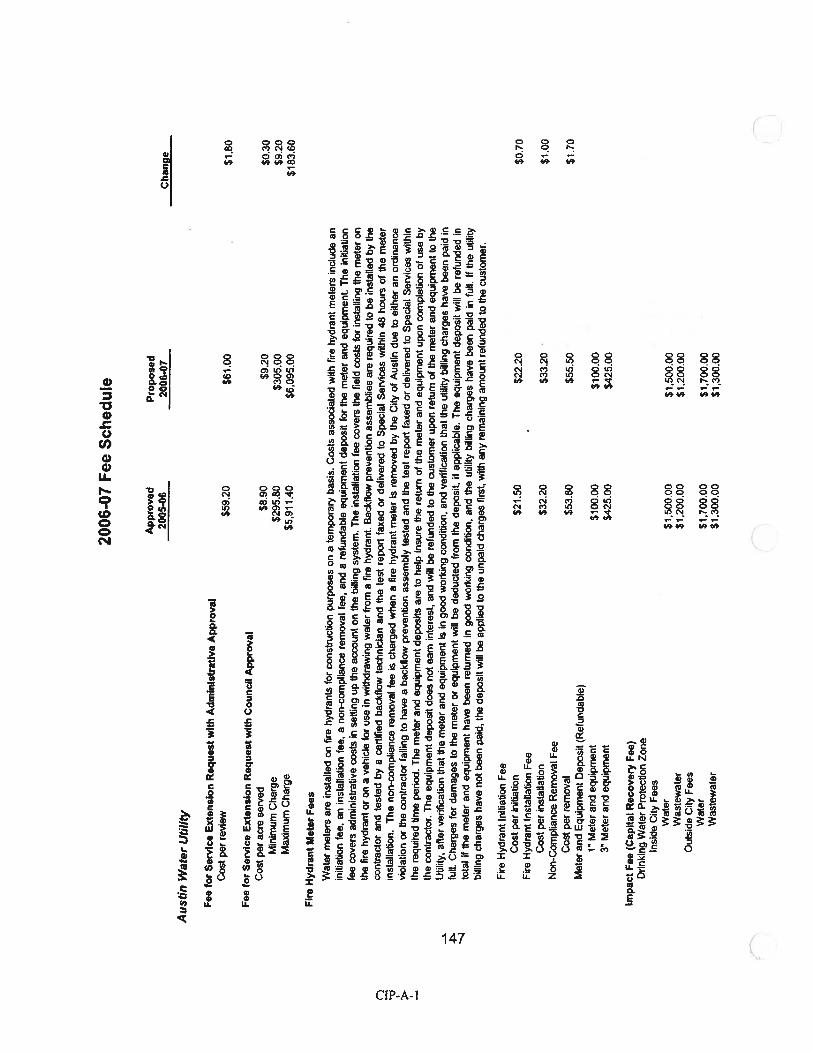
2006
-07
Fee
Sch
edule
App
rove
dP
rop
ose
d20
05-0
620
06-0
7C
han
ge
Aust
inW
ater
Uti
lity
Fee
for
Ser
vice
Exte
nsi
on
Req
ues
tw
ith
Adm
inis
trat
ive
App
rova
lC
ost
per
revi
ew$5
9.20
$61.
00$1
.80
Fee
for
Ser
vic
eE
xte
nsi
on
Req
ues
tw
ith
Cou
ncil
App
rova
lC
ost
per
acre
serv
ed$8
.90
$9.2
0$0
.30
Min
imum
Cha
rge
$295
.80
$305
.00
$9.2
0M
axim
umC
harg
e$5
,911
.40
$609
5.00
$183
.60
Fir
eH
ydra
ntM
eter
Fee
s
Wat
erm
eter
sar
ein
stal
led
onfi
rehy
dran
tsfo
rco
nstr
ucti
onpurp
ose
son
ate
mpo
rary
basi
s.C
osts
asso
ciat
edw
ithfi
rehy
dran
tm
eter
sin
clud
ean
initi
atio
nfe
e,an
inst
alla
tion
fee,
ano
n-co
mpl
ianc
ere
mov
alfe
ean
da
refu
ndab
leeq
uipm
ent
depo
sit
for
the
met
eran
deq
uipm
ent.
The
initi
atio
nfe
eco
vers
adm
inis
trat
ive
cost
sin
sell
ing
upth
eac
coun
ton
the
billi
ngsy
stem
.T
hein
stal
lati
onfe
eco
vers
the
fiel
dco
sts
for
inst
allin
gth
em
eter
onth
efi
rehy
dran
tor
ona
vehi
cle
for
use
inw
ithdr
awin
gw
ater
from
afi
rehy
dran
t.B
ackf
low
prev
enti
onas
sem
blie
sar
ere
quir
edto
bein
stal
led
byth
eco
ntra
ctor
and
test
edby
ace
rtif
ied
back
flow
tech
nic
ian
and
the
test
repo
rtfa
xed
orde
live
red
toS
peci
alS
erv
ices
with
in48
ho
urs
ofth
em
eter
inst
alla
tion.
The
non-
com
plia
nce
rem
oval
reeis
char
ged
whe
na
fire
hydr
ant
met
eris
rem
oved
byth
eC
ityof
Aus
tindu
eto
eith
eran
ordi
nanc
evi
olat
ion
orth
eco
ntra
ctor
falli
ngto
have
aba
ckfl
owpr
even
tion
asse
mbl
yte
sted
and
the
test
repo
rtfa
xed
orde
live
red
toS
peci
alS
ervi
ces
with
inth
ere
quir
edtim
epe
riod
.T
hem
eter
and
equi
pmen
td
epo
sits
are
tohe
lpin
sure
the
retu
rnof
the
met
eran
deq
uipm
ent
upon
com
plet
ion
ofu
seby
the
cont
ract
or.
The
equi
pmen
tde
posi
tdo
esno
tea
rnin
tere
st,
and
will
bere
fund
edto
the
cust
om
erup
onre
turn
ofth
em
eter
and
equi
pmen
tto
the
Util
ity,
afte
rve
rifi
catio
nth
atth
em
eter
and
equi
pmen
tis
ingo
odw
orki
ngco
nditi
on,
and
veri
fica
tion
that
the
utili
tybi
lling
char
ges
have
been
paid
inlu
ll.C
harg
esfo
rda
mag
esto
the
met
eror
equi
pmen
tw
illbe
dedu
cted
from
the
depo
sit,
ifap
plic
able
.T
heeq
uipm
ent
depo
sit
will
bere
fund
edin
tota
lif
the
met
eran
deq
uipm
ent
have
bee
nre
turn
edin
good
wor
king
cond
itio
n,an
dth
eut
ility
billi
ngch
arge
sha
vebee
npa
idin
full.
Ifth
eut
ility
billi
ngch
arge
sha
veno
tbee
npa
id,
the
depo
sit
will
beap
plie
dto
the
unpa
idch
arge
sfi
rst,
with
any
rem
aini
ngam
ount
refu
nded
toth
ecu
stom
er.
Fire
Hyd
rant
Initi
atio
nF
eeC
ost
per
initi
atio
n$2
1.50
$22.
20$0
.70
Fire
Hyd
rant
Inst
alla
tion
Fee
Cos
tper
inst
alla
tion
$32.
20$3
3.20
$1.0
0N
on-C
ompl
ianc
eR
emov
alF
eeC
ost
per
rem
oval
$53.
80$5
5.50
$1.7
0M
eter
and
Equ
ipm
ent
Dep
osit
(Ref
unda
ble)
1’M
eter
and
equi
pmen
t$1
00.0
0$1
00.0
03
Met
eran
deq
uip
men
t$4
25.0
0$4
25.0
0
Impa
ctF
ee(C
apit
alR
ecov
ery
Fee
)D
rink
ing
Wat
erP
rote
ctio
nZ
one
Insi
deC
ityF
ees
Wat
er$
15
00
.00
$1,5
00.0
0W
aste
wat
er$1
,200
.00
$1,2
00.0
0O
utsi
deC
ityF
ees
Wat
er$1
,700
.00
$1,7
00.0
0W
aste
wat
er$1
,300
.00
$1,3
00.0
0
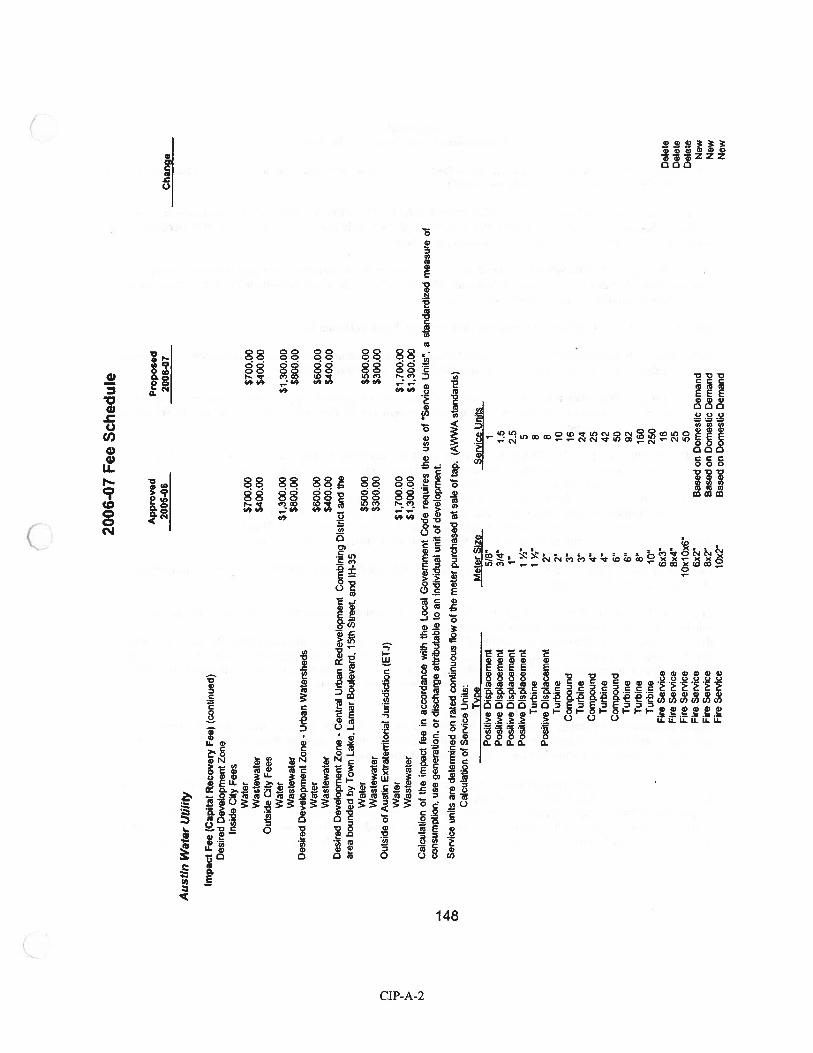
2006
-07
Fee
Sch
edule
Ap
pro
ved
Pro
pose
d20
05.0
620
06.0
7C
han
ge
Aust
inW
ater
Uti
lity
Impac
tF
ee(C
apit
alR
ecover
yF
ee)
(con
tinu
ed)
Des
ired
Dev
elop
men
tZ
one
Insi
deC
ityF
ees
Wat
er$7
00.0
0$7
00.0
0W
aste
wat
er$4
00.0
0$4
00.0
0O
utsi
deC
ityF
ees
Wat
er$1
,300
.00
$1,3
00.0
0W
asle
wat
er$8
00.0
0$8
00.0
0D
esir
edD
evel
opm
ent
Zon
e-
Urb
anW
ater
shed
sW
ater
$600
.00
$600
.00
Was
tew
ater
$400
.00
$400
.00
Des
ired
Dev
elop
men
tZ
one
.C
entr
alU
rban
Red
evel
opm
ent
Com
bini
ngD
istr
ict
and
the
area
boun
ded
byT
own
Lak
e,L
amar
Bou
leva
rd,
15th
Str
eet,
and
IH-3
5W
ater
$500
.00
$500
.00
Was
tew
ater
$300
.00
$300
.00
flO
utsi
deof
Aus
tin
Ext
rate
rrit
oria
lJu
risd
icti
on(E
TJ)
Wat
er$1
,700
.00
$1,7
00.0
0W
aste
wat
er$1
,300
.00
$1,3
00.0
0C
alcu
lati
onof
the
impa
ctfe
ein
acco
rdan
cew
ithth
eL
ocal
Gov
ernm
ent
Cod
ere
quir
esth
euse
of“S
ervi
ceU
nits
”,a
stan
dard
ized
mea
sure
ofco
nsum
ptio
n,use
gene
rati
on,
ord
isch
arge
attr
ibut
able
toan
indi
vidu
alun
itof
deve
lopm
ent.
Ser
vice
unit
sar
ede
term
ined
onra
ted
cont
inuo
usfl
owof
the
met
erp
urc
has
edat
sale
ofta
p.(A
WW
Ast
andar
ds)
Cal
cula
tion
ofS
ervi
ceU
nits
:T
ypo
Met
erS
ize
Ser
vice
Uni
tsP
osit
ive
Dis
plac
emen
t5/
8”1
Pos
itiv
eD
ispl
acem
ent
3/4”
1.5
Pos
itiv
eD
ispl
acem
ent
1”2.
5P
osit
ive
Dis
plac
emen
tI
W’
5T
urbi
neI
Y”
8P
osit
ive
Dis
plac
emen
t2”
8T
urbi
ne2”
10C
ompo
und
3”16
Tur
bine
3’24
Com
poun
d4”
25T
urbi
ne4”
42C
ompo
und
6”50
Tur
bine
6”92
Tur
bine
8”16
0T
urbi
ne10
”25
0Fi
reS
ervi
ce6x
3”16
Del
ete
Fir
eS
ervi
ce8x
4”25
Del
ete
Fir
eS
ervi
celO
xlO
x6”
50D
elet
eFi
reS
ervi
ce6x
2”B
ased
onD
omes
tic
Dem
and
New
Fir
eS
ervi
ce8x
2”B
ased
onD
omes
tic
Dem
and
New
Fire
Ser
vice
1 0x2
”B
ased
onD
omes
tic
Dem
and
New
Appendix BDescriptions of the Zones for the Fees
Descriptions of the zones for the fees are found in the Land Development Code Chapter 25-1-21(26) and (30), Chapter25-8-2(D), Chapter 25-2-31 1, and Ordinance 990805-31 excerpted below.
Land Development Code Chapter 25-1-21 (30) DRINKING WATER PROTECTION ZONE means the areas withinthe Barton Springs Zone, the Barton Creek Watershed, all Water Supply Rural Watersheds, and all Water SupplySuburban Watersheds that are in the City’s planning jurisdiction.
LDC 25-8-2(D): BARTON SPRINGS ZONE means all watersheds that contribute recharge to Barton Springs,including those portions of the Barton, Williamson, Slaughter, Onion, Bear and Little Bear Creek watershed located inthe Edwards Aquifer recharge or contributmg zones.
BARTON CREEK WATERSHED means the land area that drains to Barton Creek.
EDWARDS AQUIFER CONTRIBUTING ZONE means all land generally to the west and upstream of the EdwardsAquifer recharge zone that provides drainage into the Edwards Aquifer recharge zone.
EDWARDS AQUIFER RECHARGE ZONE means all land over the Edwards Aquifer that recharges the aquifer, asdetermined by the surface exposure of the geologic units comprising the Edwards Aquifer, including the areas overlainwith quaternary terrace deposits.
WATER SUPPLY RURAL WATERSHEDS include the Lake Travis watershed and Lake Austin watershed, excludingthe Bull Creek watershed and the area to the south of Bull Creek and the east of Lake Austin.WATER SUPPLY SUBURBAN WATERSHEDS include:Bull, Eanes, North Dry, Taylor Slough, and West Bull creek watersheds;Town Lake watershed on the south side of Town Lake from Barton Creek to Tom Miller Dam;Town Lake watershed on the north side of Town Lake from Johnson Creek to Tom Miller Dam; andTown Lake watershed on the east side of Lake Austin from Tom Miller Dam to Bull Creek. CLand Development Code Chapter 25-1-21 (26) DESIRED DEVELOPMENTZONE means the area not within theDrinking Water Protection Zone.
LDC 25-8-2(D): SUBURBAN WATERSHEDS include all watersheds not otherwise classified as urban, water supplysuburban, or water supply rural watersheds, and include:Brushy, Carson, Cedar, Cottonmouth, Country Club, Decker, East Dry, Elm, Gilleland, Harris Branch, Lake, Maha,Marble, North Fork, Rattan, Rinard, South Boggy, South Dry, Walnut, and Wilbarger creek watersheds, ColoradoRiver watershed downstream of U.S. 183; andthose portions of the Onion, Bear, Little Bear, Slaughter, and Williamsoncreek watersheds not located in the Edwards Aquifer recharge or contributing zones.
LDC 25-8-2(D): URBAN WATERSHEDS include:Blunn, Buttermilk, East Boggy, East Bouldin, Fort, Harper Branch, Johnson, Little Walnut, Shoal, Tannehill, Wailer,and West Bouldin creek watersheds; the north side of the Colorado River watershed from Johnson Creek to U.S. 183;and the south side of the Colorado River watershed from Barton Creek to U.S. 183.
LDC 25-2-311(A): CURE means central urban redevelopment (CURE) combining district which is property located inthe central urban area shown on the map adopted by Ordinance No. 001130-110, which is on file with theNeighborhood Planning and Zoning Department. This definition is used in the impact fee ordinance 990805-31 withan addition phrase expanding the fee zone to include the area bounded by Town Lake, Lamar Boulevard, 15th Street,and IH-35. (For the Impact Fee, Ordinance 9908-05-31 added “and area bounded by Town Lake, Lamar Blvd., I 5th
Street and IH-35”)
C.CIP-B- I
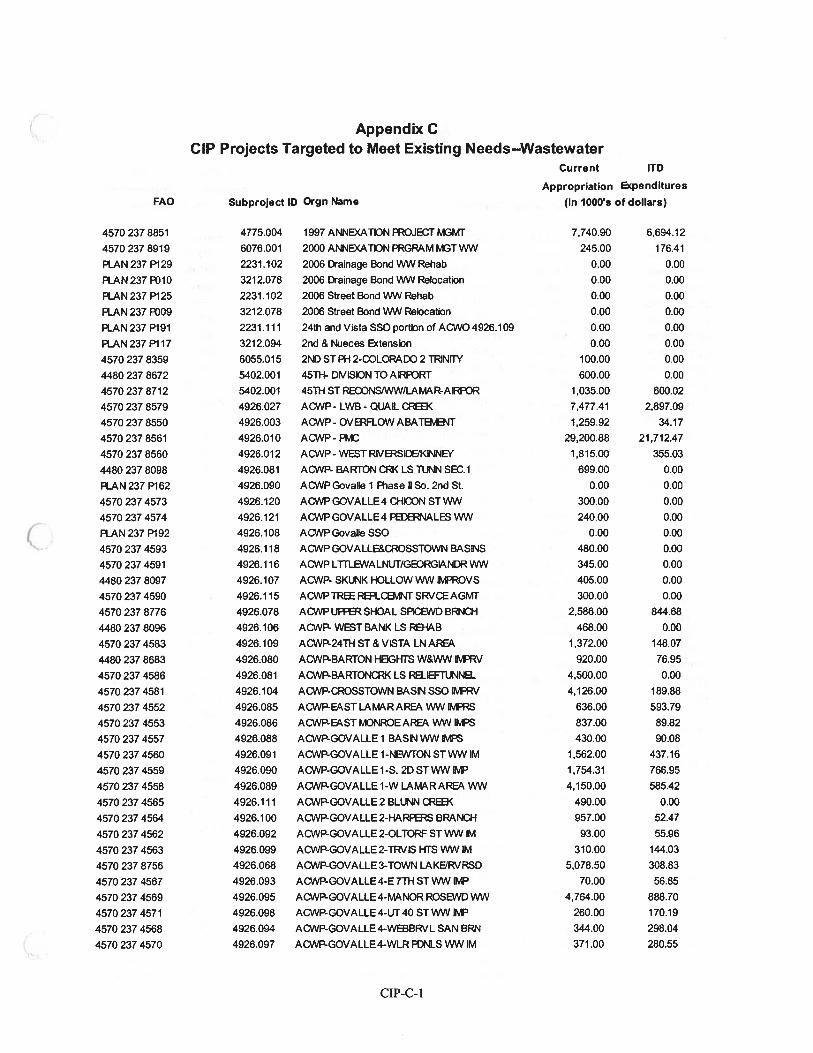
Appendix CCIP Projects Targeted to Meet Existing Needs--Wastewater
Current lTD
Appropriation Expenditures
Subproject ID Orgn Name (in 1000’s of dollars)FAO
4570 237 8851 4775.004 1997 ANNB(A]10N FROJECT MGMT 7740.90 6,694.12
4570 237 8919 6076.001 2000 ANNEXATiON PRGRAM MGT WN 245.00 176.41
R.AN 237 P129 2231.102 2006 Drainage Bond WWRehab 0.00 0.00
RAN 237 10 3212.078 2006 Drainage Bond \MN Relocation 0.00 0.00
F1AN237P125 2231.102 2006StreetBondMNRehab 0.00 0.00
RAN 237 R)09 3212.078 2006 Street Bond WN Relocation 0.00 0.00
RAN 237 P191 2231.111 24th and Vista SSO portion of ACWO 4926.109 0.00 0.00
F1AN237P117 3212.094 2nd&Nueces Extension 0.00 0.00
4570 237 8359 6055.015 2ND ST PH 2-COLORADO 2 TRINITY 100.00 0.00
4480 237 8672 5402.001 45TH- DIVISiON TO ARRORT 600.00 0.00
4570 237 8712 5402.001 45TH STRECONS/’MN/LAMAR-AIRPOR 1,035.00 600.02
4570 237 8579 4926.027 ACWP- LWB - QUAIL CREEK 7,477.41 2,897.09
4570 237 8550 4926.003 ACWP - OVFLOW ABATBvENT 1,259.92 34.17
45702378561 4926.010 AGWP- PMC 29,200.88 21,712.47
4570 237 8560 4926.012 ACWP- WEST RWEISIDE/KINNEY 1,815.00 355.03
4480 237 8098 4926.081 ACWP- BARTON DRK LS TIJNN SEC.1 699.00 0.00
FtAN 237 P162 4926.090 ACWPGovaIIe 1 IThase ilSo. 2nd St. 0.00 0.00
4570 237 4573 4926.120 ACvVPGOVALLE4 CHICON STWW 300.00 0.00
4570 237 4574 4926.121 ACWPGOVALLE4 NALES W) 240.00 0.00
RAN237P192 4926.108 AGWPGovaIIeSSO 0.00 0.00
4570 237 4593 4926.118 ACWP GOVALLE&CROSSTOWN BASINS 480.00 0.00
4570 2374591 4926.116 ACWPLTEALNUT/GEORGLNDRWN 345.00 0.00
4480 237 8097 4926.107 ACWP- SKUNK HOLLOW WW IvFROVS 405.00 0.00
4570 237 4590 4926.115 ACViP TR REFLIDBvt4T SRVE AGMT 300.00 0.00
4570 237 8776 4926.078 ACNP UFi SHOAL SPIEWD BRNH 2,586.00 844.68
4480 237 8096 4926.106 ACWP- WEST BANK LS REHAB 468.00 0.00
45702374583 4926.109 ACWP-24THST& VISTA LNAREA 1,372.00 148.07
4480 237 8683 4926.080 ACWP- BARTON HEIGHTS W&WW tvFRV 920.00 76.95
4570 237 4586 4926.08 1 ACWP-BARr0NcRK LS REJEFTUNNB 4,500.00 0.00
4570 237 4581 4926.104 ACNP-GROSSTOWN BASIN SSO lPvRV 4126.00 189.88
4570 237 4552 4926.085 ACWP-EAST LAMAR AREA WW ItFS 636.00 593.79
4570 237 4553 4926.086 AP-EASTONROEAREA WW MS 837.00 89.82
4570 237 4557 4926.088 ACNP-GOVALLE 1 BASIN WW rvPS 430.00 90.08
4570 237 4560 4926.091 ACNP-GOVALLE 1-NE’NTON ST VW’1 IM 1,562.00 437.16
4570 237 4559 4926.090 AQNP-GOVALLE 1-S. 2D ST VvW IP 1,754.31 766.95
4570 237 4558 4926.089 ACWP-GOVALLE1-W LAMAR AREA WA’ 4,150.00 585.42
4570 237 4565 4926.111 ACWP-GOVALLE2 BLUNN CREEK 490.00 0.00
4570 237 4564 4926,100 ACM/P-GOVALLE2-HARFS BRANCH 957.00 52.47
4570 237 4562 4926.092 ACWP-GOVALLE2-OLTORF STWW 1 93.00 55.96
45702374563 4926.099 ACWP-GOVALLE2-TRVISHTSWWIM 310.00 144.03
4570 237 8756 4926.068 ACNP-GOVALLE 3-TOWN LAKE/RVRSD 5,078.50 308.83
4570 237 4567 4926,093 ACWP-GOVALLE4-E7THSTW’W IrvF 70.00 56.85
4570 237 4569 4926.095 ACWP-GOVALLE 4-MANOR ROSEWD WA! 4,764.00 888.70
4570 237 4571 4926.098 ACA’P-GOVALLE 4-UT 40 ST WN WvID 260.00 170.19
4570 237 4568 4926.094 ACWP-GOVALLE4-WBBRVL SAN BRN 344.00 298.04
4570 237 4570 4926.097 AOiVP-GOVALLE4-WLRRJNLS WW IM 371.00 280.55
CIP-C- 1
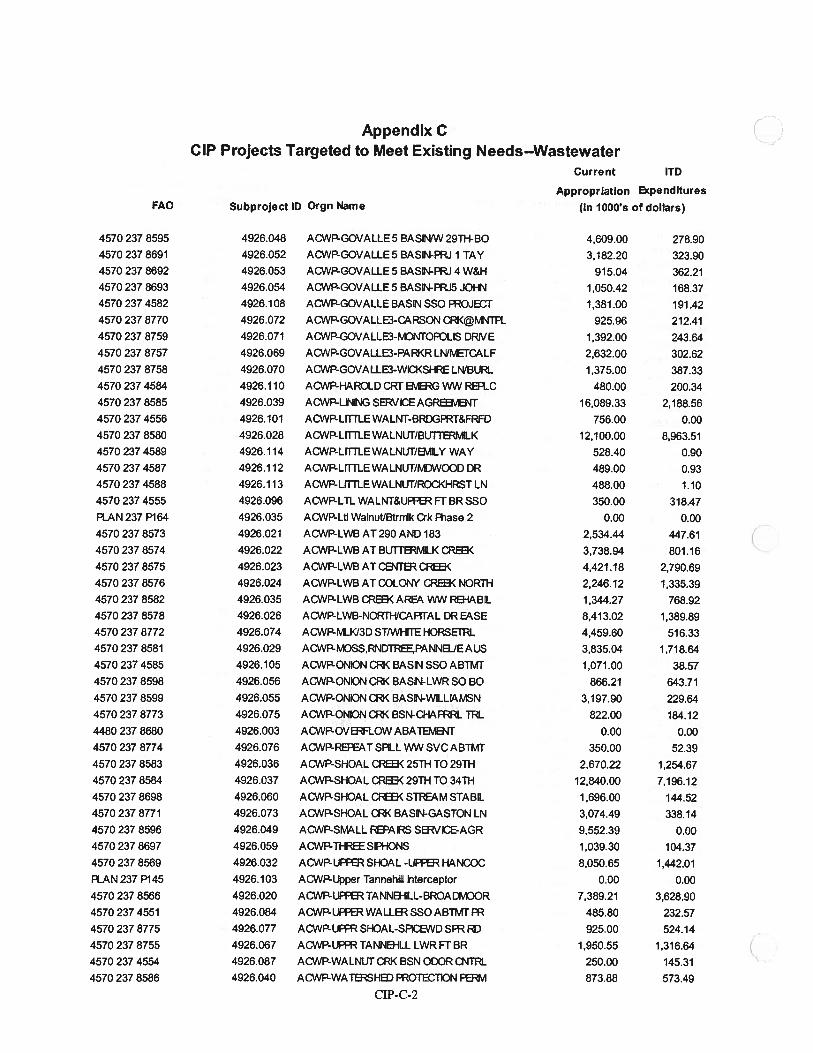
Appendix CCIP Projects Targeted to Meet Existing Needs—Wastewater
Current lTD
Appropriation Expenditures
FAO Subproject ID Orgn Name (in 1000’s of dollars)
4570 237 8595 4926.048 ACWRGOVALLE 5 BASINAN 29TH-BC 4,609.00 278.904570 237 8691 4926.052 AcWP-GOVALLE5 BASIN-FRi 1 TAY 3,182.20 323.904570 237 8692 4926.053 ACWP-GOVALLE5 BASIN-FRi 4 W&H 91504 362.214570 237 8693 4926.054 ACWP-GOVALLE5 BASN-FRJ5 JOI-N 1,050.42 168.374570 237 4582 4926.108 ACWP-GOVALLE BASIN SSO PROJECT 1,381.00 191.42
4570 237 8770 4926.072 AQNP-GOVALLE3-CARSON CR<@NTF1 925.96 212.41
4570 237 8759 4926.071 ACWP-GOVALLE3-MONTOPDLIS DRIVE 1,392.00 243.64
4570 237 8757 4926.069 AcWP-GOVALLE3-PARKR LN/IVETCALF 2,632.00 302.62
4570 237 8758 4926.070 ACWP-GOVALLE3-WKDKSHRE LN/BURI.. 1,375.00 387.33
4570 237 4584 4926.110 ACWP-HAROLD CRT vG VWl REFIC 480.00 200.34
4570 237 8585 4926.039 ACWP-LINNG SER/kDEAGREv’4T 16,089.33 2,188.56
4570 237 4556 4926.101 ACNP-LrfltEWALNT-BRDGFRT&FRFO 756.00 0.0045702378580 4926.028 ADWP-LITTLEWALNUT/BUTTERMLK 12,100.00 8,963.51
4570 237 4589 4926.114 ACWP-L1TTLEWALNUT/1LY WAY 528.40 0.90
4570 237 4587 4926.112 ACWP-LITThEWALNUT/FvDW000 DR 489.00 0.934570 237 4588 4926.113 ACWP-LITTLEWALNUT/ROcKHRST LN 488.00 1.10
4570 237 4555 4926.096 ACWP-LTL WALNT&UFFR FT BR SSO 350.00 318.47
RAN 237 P164 4926.035 ACWP-Ltl WaInutJBtrnk Crk Rase 2 0.00 0.00
4570 237 8573 4926.021 ACWP-LWB AT 290 AND 183 2,534.44 447.61
4570 237 8574 4926.022 ACWP-LWB ATBUTTERMLK REE< 3,738.94 801.16
4570 237 8575 4926.023 AcWP-LWB AT CENT tDREEK 4,421.18 2,790.69
4570 237 8576 4926.024 ACWP-LWB AT COLONY CREEK NORTh 2,246.12 1,335.39
4570 237 8582 4926.035 ACWP-LWB CREEK AREA WW REJ-IABL 1,344.27 768.92
4570 237 8578 4926.026 ACWP-LWB-NORT1-VCAFITAL DR EASE 8,413.02 1,389.89
4570 237 8772 4926.074 AcWP4.&KI3D ST/WHITE HORSETRL 4,459.60 516.33
4570 237 8581 4926.029 ACWP-MOSS,RNDTREE,PANNEIJEAUS 3,835.04 1,718.64
4570 237 4585 4926.105 ACWP-ONION CRK BASIN SSO ABTMT 1,071.00 38.57
4570 237 8598 4926.056 ACWP-ONKN CRK BASN-LWR SO BC 866.21 643.71
4570 237 8599 4926.055 ACWP-ONION CRK BASIN-WLLL4MSN 3,197.90 229.64
4570 237 8773 4926.075 ACWP-ONION CPK BSN-CHAPRRL TRL 822.00 184.12
44802378680 4926.003 ACWP-OVFLOWABA1EMENT 0.00 0.00
4570 237 8774 4926.076 ACWP-REFEAT SPLL WW SVC ABTMT 350.00 52.39
4570 237 8583 4926.036 ACjNP-SHOAL CREEK 25TH TO 29Th 2,670.22 1.25467
4570 237 8584 4926.037 ACWP-SHOAL CREEK 29Th TO 34TH 12,840.00 7,196.12
4570 237 8698 4926.060 ACNP-SHOAL CREEK STREAM STABIL 1,696.00 14.4.524570 237 8771 4926.073 ACWP-SHOAL RI< BASIN-GASTON LN 3,074.49 338.14
4570 237 8596 4926.049 ACWP-SMALL REPAIRS SERVICE-AGR 9,552.39 0.00
4570 237 8697 4926.059 ACVP-THREESlF1-fONS 1,039.30 104.37
4570 237 8569 4926.032 ACWP-UFcER SHOAL -UFER HANCOC 8,050.65 1,442.01
RAN 237 P145 4926.103 ACM/P-Upper Tannehill hterceptor 0.00 0.00
4570 237 8566 4926.020 ACWP-UFFERTANNEHLL-BROADMOOR 7389.21 3,628.90
4570 237 4551 4926.084 ADWP-UFFER WALLER SSO ABTMT FR 485.80 232,57
4570 237 8775 4926.077 AGWP-UFFR SHOAL-SFIcEWD SFR RD 925.00 524.14
4570 237 8755 4926.067 ACbNP-LFfRTANNEHLLLWRFTBR 1,950.55 1,316.64 (4570 237 4554 4926.087 ACWP-WALNUT RK BSN ODOR NTRL 250.00 145.31
4570 237 8586 4926.040 AOJP-WATSH PROTECTiON PEf 873.88 573.49
CIP-C-2
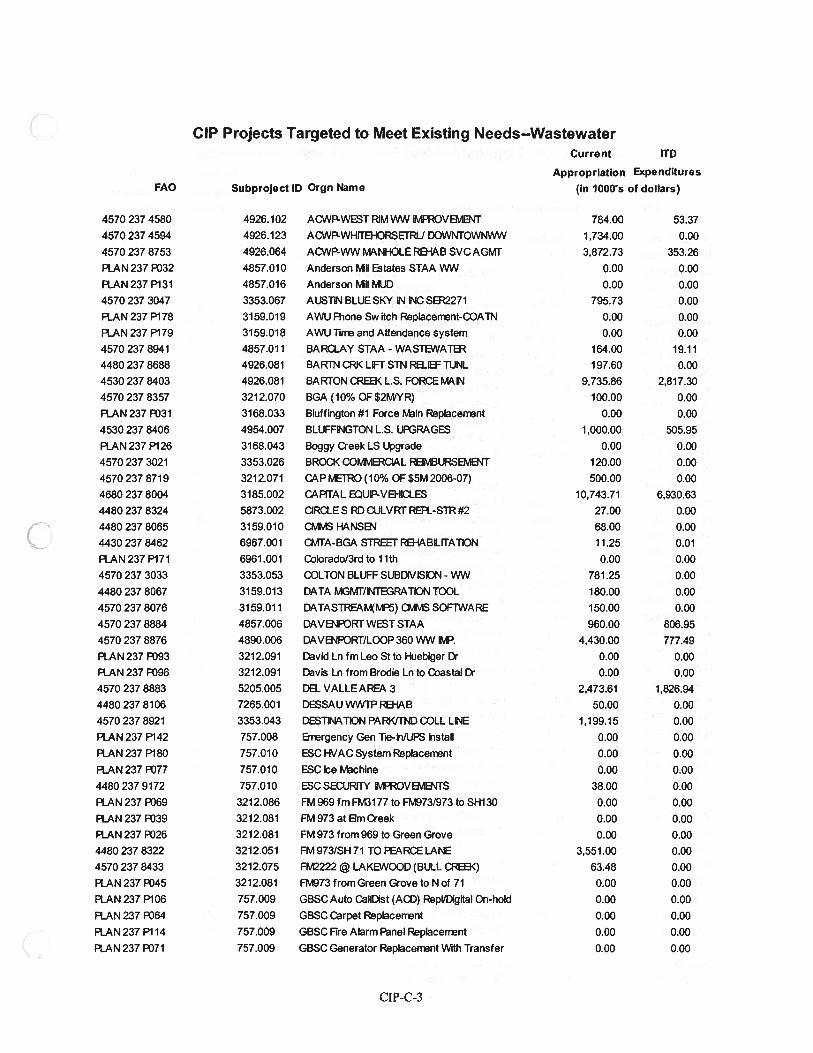
CIP Projects Targeted to Meet Existing Needs--WastewaterCurrent lTD
FAO Subproject ID Orgn NameApproprIation Expenditures
(in 1000s of dollars)
4570 237 4580 4926.102 ACWP-WEST RIM WA! vFROVB’.4BlT 784.00 53.37
4570 237 4594 4926.123 ACwP-WHrr&IORSEIRu DOWNTOWF’M/W 1734.00 0.00
4570 237 8753 4926.064 ACINP-VVW MNHOLEREHAB SVCAGMT 3872.73 353.26
RAN 237 F032 4857.010 Anderson Mu states STAA WN 0.00 0.00
R.AN 237 P131 4857.016 Anderson Mu TvJD 0.00 0.00
4570 237 3047 3353.067 AUSTIN BLUE SKY IN NC SER2271 795.73 0.00
RAN 237 P178 3159.019 AWU Rione Sw ftch Replacerrent-COATN 0.00 0.00
RAN237P179 3159.018 AWUTirrieandAttendancesystem 0.00 0.00
45702378941 4857.011 BARCLAY STAA-WASTEWATER 164.00 19.11
4480 237 8688 4926.081 BARTN CRK LIFT STh RELIEF TIJNL 197.60 0.00
4530 237 8403 4926.081 BARTON CREEK L.S. FORCE MN 9,735.86 2,817.30
4570 237 8357 3212.070 BGA (10% OF $2M’YR) 100.00 0.00
RAN 237 P031 3168.033 Bluff ington #1 Force Main Replacenient 0.00 0.00
4530 237 8406 4954.007 BLUFFINGTON L.S, UFGRAGES 1000.00 505.95
RAN 237 P126 3168.043 Baggy Creek LS grade 0.00 0.00
4570 237 3021 3353.026 BROIDK COtTv1ERClAL REJURSEMENT 120.00 0.00
45702378719 3212.071 CAPtETRO(10% OF$5M2006-07) 500.00 0.00
4680 237 8004 3185.002 CAPITAL EQUP-VEHKDLES 10,743.71 6,930.63
4480 237 8324 5873.002 CIRCLE S RD CULVRT REFI-STR #2 27.00 0.00
4480 237 8065 3159.010 lDtvtvlS HANSB’ 68.00 0.00
4430 237 8462 6967.001 CMTA-BGA STREET RE-IABLIfATION 11.25 0.01
F1AN237P171 6961.001 Colorado/3rdto 11th 0.00 0.00
4570 237 3033 3353.053 COLTON BLUFF SUBDIVISKDN- WW 781.25 0.00
4480 237 8067 3159.013 DATA MGIVTr/NTEGRATION TOOL 180.00 0.00
4570 237 8076 31 59.011 DATASTREAM(F5) CMv1S SOFTWARE 150.00 0.00
4570 237 8884 4857.006 DAVB\JFORr WEST STAA 960.00 806.95
4570 237 8876 4890.006 DAVR’JPORT/LOOP 360 WW vP. 4,430.00 777.49
RAN 237 P393 3212.091 Evid Ln fm Leo St to Huebiger Dr 0.00 0.00
RAN 237 P396 3212.091 Davis Ln from Brodie Ln to Coastal 1) 0.00 0.00
4570 237 8883 5205.005 DII VALLE AREA. 3 2,473.61 1,826.94
44802378106 7265,001 DESSAUWWTPREI-IAB 50.00 0.00
4570 237 8921 3353.043 DESTINATION PARK/TND COLL LINE 1,199.15 0.00
RAN 237 P142 757.008 Enrgency Gen Tie-h/UPS hstall 0.00 0.00
RAN 237 P180 757.010 ESC HVAC System RepLacenent 0.00 0.00
PLAN 237 P077 757.010 ESC Ice chine 0.00 0.00
44802379172 757.010 ESC SECURITY vFROVEk1H’1TS 38.00 0.00
RAN237P069 3212.086 Ffvl969fmFM3l77to FM973/973toSH130 0.00 0.00
RAN 237 F039 3212.081 FM 973 at Em Creek 0.00 0.00
PLAN 237 P326 3212.081 FM 973 from 969 to Green Grove 0.00 0.00
44802378322 3212.051 FM973/SH71 TO PEARCE LANE 3,551.00 0.00
4570 237 8433 3212.075 FM2222 @ LAKEWOOD (BULL CREEK) 63.48 0.00
RAN 237 P345 3212.081 F73 from Green Grove to N of 71 0.00 0.00
RAN 237 P106 757.009 GBSC Auto CalDst (ADD) Repi/Digital On-hold 0.00 0.00
PlAN 237 R)64 757.009 GBSC Carpet Replacerrient 0.00 0.00
PlAN 237 P114 757.009 GBSC Fire ALarm Panel Replacerrent 0.00 0.00
RAN 237 P371 757.009 GBSC Generator Replacerrent With Transfer 0.00 0.00
CIP-C-3
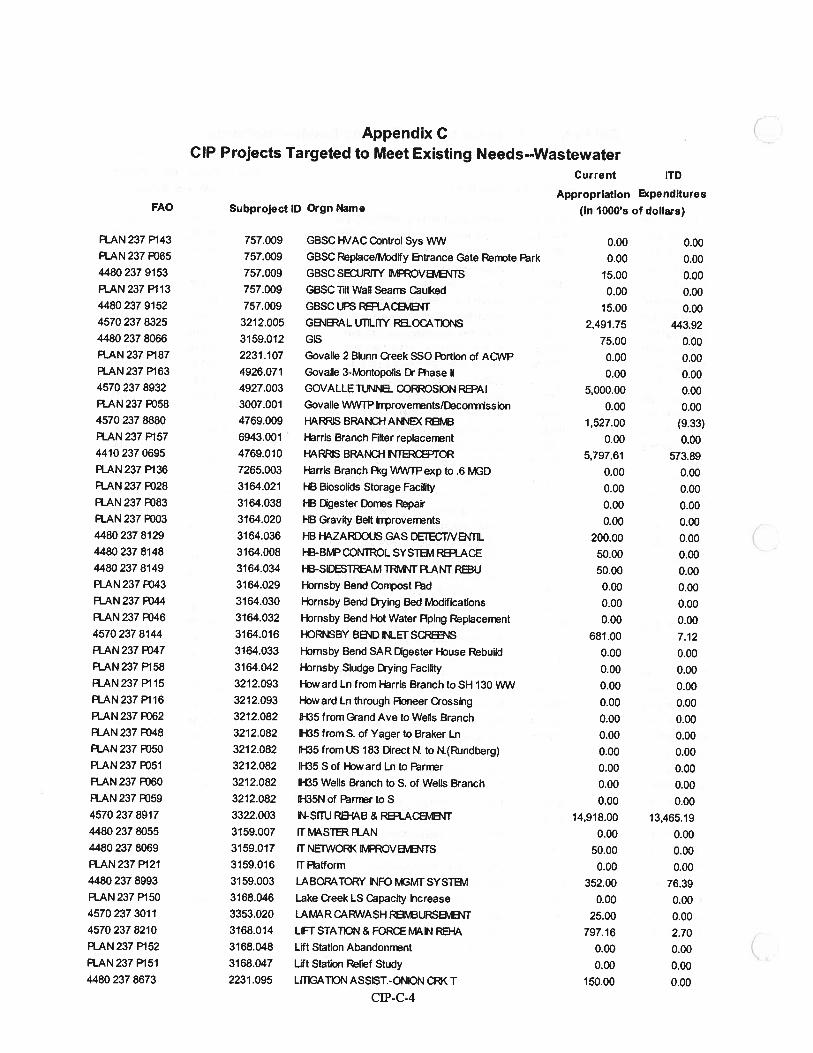
Appendix CCIP Projects Targeted to Meet Existing Needs--Wastewater
Current lTD
Appropriation ExpendituresSubproject ID Orgn Name (in 1000s of dollars)FAO
RAN 237 P143 757.009 GBSC l-WAC Control Sys WW 0.00 0.00FL8,N 237 F065 757.009 GBSC Replace/Mdify Gitrance Gate Rermte Park 0.00 0.004480 237 9153 757.009 GBSC SEOJRITY IMPROV2vB’JTS 15.00 0.00RAN 237 P1 13 757.009 GBSC lilt Wall Searr Caulked 0.00 0.0044802379152 757009 GBSCUPSREaACaE4T 15.00 0.004570 237 8325 3212.005 G’JERAL UTiLITY ROCAT1ONS 2,491.75 443.9244802378066 3159.012 GIS 75.00 0.00FLAN 237 P187 2231.107 Govalle 2 BIunri Creek SSO Fbrtion of ACNP 0.00 0.00RAN 237 P163 4926.071 Govalle 3-MDntopolis Dr Riase II 0.00 0.004570 237 8932 4927.003 GOVALLE TUNNEL CORROSION REPAI 5,000.00 0.00R.AN 237 R)58 3007.001 Govalle WNTP Inprovennts/Decon-nission 0.00 0.004570 237 8880 4769.009 HARRIS BRANCH ANNEX REIfvE 1,527.00 (9.33)RAN 237 P157 6943.001 Harris Branch Filter repIacennt 0.00 0.0(14410 237 0695 4769.010 HARRIS BRANCH NTERCEPTOR 5,797.61 573.89PLAN 237 P136 7265.003 Harris Branch Fcg WWrPexp to .6 MGD 0.00 0.00PLAN 237 R)28 3164.021 H8 Biosolids Storage Facility 0.00 0.00RAN 237 P083 3164.038 HB f)gester Dorrs Repair 0.00 0.00PLAN 237 P003 31 64.020 HB Gravity Belt hrproverrnts 0.00 0.004480 237 8129 3164.036 HB HAZARDOUS GAS DErECT/VENTL 200.00 0.0044802378148 3164.008 HBBMDCONTROLSYSTEMREFLACE 50.00 0.004480 237 8149 3164.034 HB-SIDESTPEAM TRM’JT RANT REBU 50.00 0.00PLAN 237 R)43 3164.029 l-brnsby Bend Conpost Pad 0.00 0.00PLAN 237 P044 3164.030 Hornsby Bend Drying Bed bdifications 0.00 0.00PLAN 237 P046 3164.032 Hornsby Bend Hot Water flping Replacennt 0.00 0.0045702378144 3164.016 HORNSBY BB’iDNLETStDR’JS 681.00 7.12PLAN 237 P047 3164.033 Hornsby Bend SAR gester 1-buse Rebuild 0.00 0.00RAN 237 P158 3164.042 Hornsby Sludge Drying Facility 0.00 0.00R.AN 237 P115 3212.093 Howard Ln from Harris Branch to SH 130 W’dV 0.00 0.00F-LAN 237 P116 3212.093 Howard Ln through Pioneer Crossing 0.00 0.00PLAN 237 P062 3212.082 0-135 from Grand Ave to Wells Branch 0.00 0.00RAN 237 R)48 3212.082 11-135 from S. of Yager to Braker Ln 0.00 0.00PLAN 237 P050 3212.082 0-135 from US 183 Crect N. to N.(Rundberg) 0.00 0.00RAN 237 P051 321 2.082 0-135 S of Howard Ln to Parnr 0.00 0.00PLAN 237 P060 321 2.082 0-135 Wells Branch to S. of Wells Branch 0.00 0.00PLAN 237 P059 3212.082 lH35Nof Parrrrto S 0.00 0.004570 237 8917 3322.003 N-SITU RB-lAB & REFi..AC8v1T 14,918.00 13,465.194480 237 8055 3159.007 IT MASTER RAN 0.00 0.0044802378069 3159.017 ITNEflNORKIFFROVBENTS 50.00 0.00PLAN237P121 3159.016 ITFiatform 0.00 0.004480 237 8993 3159.003 LABORATORY INFO MGM SYSTB1 352.00 76.39RAN 237 P150 3168.046 Lake Creek LS Capacity hcrease 0.00 0.004570 237 3011 3353.020 t.AMAR CARWASH REI’UURSB’E’JT 25.00 0.004570 237 8210 3168.014 LIFT STATION & FORCE MAN RB-tA 797.16 2.70PLAN 237 P152 3168.048 Lift Station Abandonrrnt 0.00 0.00PLAN 237 P151 3168.047 Lift Station Relief Study 0.00 0.0044802378673 2231.095 Lfl1GAT1ONASSIST.-ONIONcRKT 150.00 0.00
C
CIP-C-4
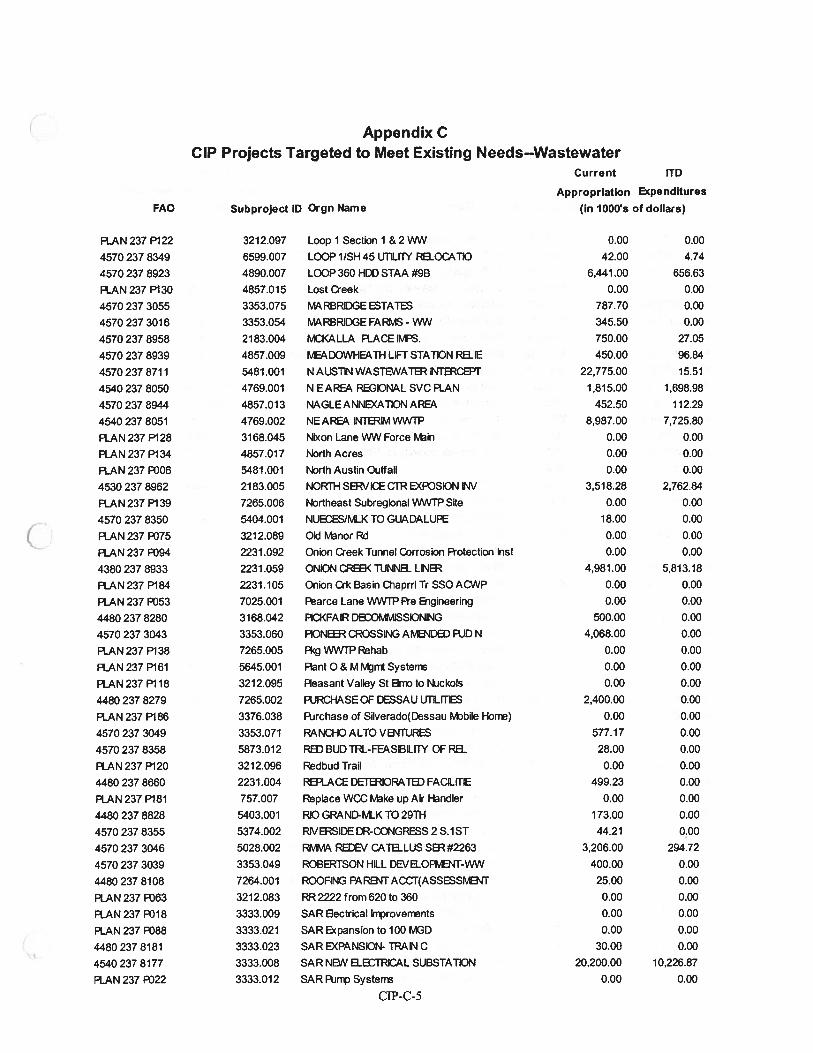
Appendix CCIP Projects Targeted to Meet Existing Needs—Wastewater
Current lTD
Appropriation Expenditures
Subproject ID Orgn Name (in 1000’s of dollars)FAO
PlAN 237 P122 3212.097 Loop 1 Section 1 & 2 WW 0.00 0.00
4570 237 8349 6599.007 LOOP 1/SH 45 UTILrrY RBOCATKD 42.00 4.74
4570 237 8923 4890.007 LOOP 360 HDD STAA #9B 6,441.00 656.63
R.AN237P130 4857.015 Lost Creek 0.00 0.00
4570 237 3055 3353.075 RBRIDGE ESTATES 787.70 0.00
4570 237 3016 3353.054 MARBPJDGE FARMS - WW 345.50 0.00
45702378958 2183.004 MKALLA F1ACEIIFS. 750.00 27.05
4570 237 8939 4857.009 IiEDOWHEATH LIFT STATION RBJE 450.00 96.84
4570 237 8711 5481 .001 N AUSTN WASTEWATER INTERCEPT 22,775.00 15.51
4540 237 8050 4769.001 N E AREA REGIONAL SVC PLAN 1,815.00 1,698.98
45702378944 4857.013 NAGLE ANNEXATION AREA 452.50 112.29
4540 237 8051 4769.002 NE AREA INTERIM WvVTP 8,987.00 7,725.80
RAN 237 P128 3168.045 Nixon Lane WW Force Vain 0.00 000
RAN 237 P134 4857.017 North Acres 0.00 0.00
RAN 237 P006 5481.001 North Austin Outfall 0.00 0.00
4530 237 8962 2183.005 NORTH SERVICE CTR EXFOSION IsW 3,518.28 2,762.84
PLAN 237 P139 7265.006 Northeast Subregional WNTP Site 0.00 0.00
4570 237 8350 5404.001 NUECES/LK TO GUADALUPE 18.00 0.00
PlAN 237 P075 3212.089 Old rvlanor Rd 0.00 0.00
RAN 237 P094 2231.092 Onion Creek Tunnel Corrosion Rotection W’ist 0.00 0.00
43802378933 2231.059 ONION CREEK T1JNNE. LINER 4,981.00 5,813.18
PlAN 237 P184 2231.105 OnionCrkBasinChaprrlTrSSOACWP 0.00 0.00
RAN 237 P053 7025.001 Farce Lane VvWTP Re Eigineering 0.00 0.00
4480 237 8280 3168.042 PICKFAIR DECOFvfv’,ISSIONING 500.00 0.00
4570 237 3043 3353.060 F1ONE2 CROSS t’JG AE’4DtD RID N 4,068.00 0.00
RAN 237 P138 7265.005 F3cgWWTPRehab 0.00 0.00
PLAN 237 P161 5645.001 Rant 0 & M Mjn Systens 0.00 0.00
PLAN 237 P118 3212.095 Peasant Valley St Bnx to Nockols 0.00 0.00
4480 237 8279 7265.002 RIRCHASEOF DESSAU UTLES 2,400.00 0.00
PLAN 237 P186 3376.038 Rirchase of Silverado(Dessau MDbile Horr) 0.00 0.00
45702373049 3353.071 PANCHO ALTO V8’JTURES 577.17 0.00
4570 237 8358 5873.012 RB] BUD TRL-FEAsLrrY OF RB.. 28.00 0.00
RAN237P120 3212.096 Redbud Trail 0.00 0.00
4480 237 8660 2231.004 REPIAGE DETERIORATED FACILITIE 499.23 0.00
RAN 237 P181 757.007 Replace WCC vke up Air Handler 0.00 0.00
44802378828 5403.001 RIOGRAND-rvLKTO29TH 173.00 0.00
4570 237 8355 5374.002 RWERSIDE DR-CONGRESS 2 S.IST 44.21 0.00
4570 237 3046 5028.002 RIVMA REDEV CATLUS SER #2263 3,206.00 294.72
4570 237 3039 3353.049 ROBERTSON HILL DEVBOP?vENT-WW 400.00 0.00
4480 237 8108 7264.001 ROOFING PARB\JTACCT(ASSESSIV”JT 25.00 0.00
RAN 237 P063 3212.083 RR2222 from 620 to 360 0.00 0.00
RAN 237 P018 3333.009 SAR Sectrical hrprovennts 0,00 0.00
RAN 237 P088 3333.021 SAR Expansion to 100 MGD 0.00 0.00
44802378181 3333.023 SAREXPANSION-TRAINC 30.00 0.00
4540 237 8177 3333.008 SAR NEW ECTRICAL SUBSTATION 20,200.00 10,226.87
PlAN 237 P022 3333.012 SAR Rirrp Systen 0.00 0.00
CIP-C-5
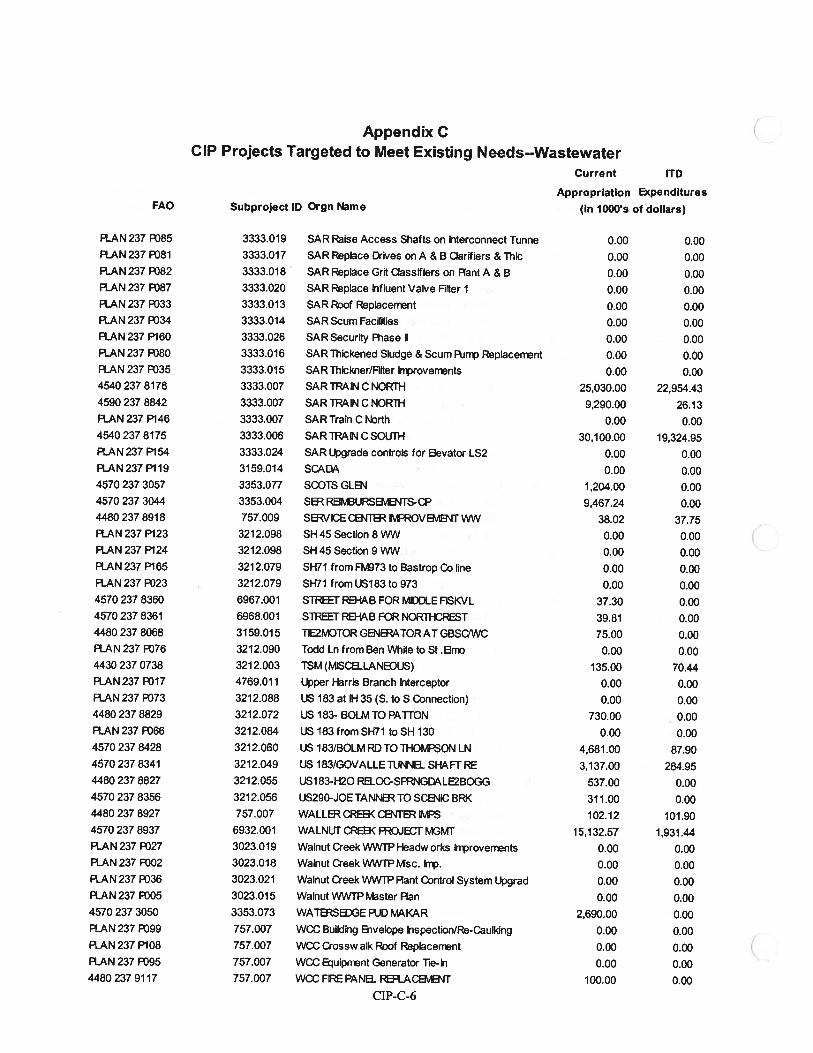
Appendix CCIP Projects Targeted to Meet Existing Needs--Wastewater
Current lTD
Appropriation ExpendituresSubproject ID Orgn Name (in 1000’s of dollars)FAO
RAN 237 F085 3333.019 SAR Raise Access Shafts on h’iterconnect Tunne 0.00 0.00FIAN 237 F081 3333.017 SAR Replace 1ves on A & B Clarifiers & Thic 0.00 0.00FI..AN 237 RJ82 3333.018 SAR Replace Grit Classifiers on Rant A & B 0.00 0.00RAN 237 R187 3333.020 SAR Replace Uifluent Valve Fitter 1 0.00 0.00RAN 237 F033 3333.013 SAR Roof Replacerrent 0.00 0.00RAN 237 F034 3333.014 SAR Scum Facilities 0.00 0.00RAN 237 P160 3333.026 SAR Security Fliase 0.00 0.00RAN 237 F080 3333,016 SAR Thickened Sludge & Scum R,np Replacerrent 0.00 0.00RAN 237 F035 3333.015 SARThickner/Filter kTproverrunts 0.00 0.004540 237 8176 3333.007 SAR TRAIN C NORTH 25,030.00 22,954,434590 237 8842 3333.007 SAR TRAIN C NORTH 9,290.00 26.13PlAN 237 P146 3333.007 SAR Train C North 0.00 0.0045402378175 3333.006 SARTRANCSOUTH 30,100.00 19,324.95RAN 237 P154 3333.024 SAR Upgrade controls for Bevator LS2 0.00 0.00RAN 237 P119 3159.014 SCADA 0.00 0.004570 237 3057 3353.077 SCOTS GLB”J 1,204.00 0.004570 237 3044 3353.004 SER REIIvUURSBvU’4TS-CP 9,467.24 0.0044802378918 757.009 SJIDECB’4TERHvFROVBvlBJTWW 38.02 37.75RAN 237 P123 3212.098 SH 45 Section 8 ‘MN 0.00 0.00F1AN237P124 3212.098 SH45Section9WW 0.00 0.00RAN 237 P165 3212.079 3H71 from F?v73 to Bastrop Co line 0.00 0.00R..AN237R23 3212.079 SH71 fromUSl83 to 973 0.00 0.004570 237 8360 6967.001 STREET R-IAB FOR MUOI..E FISKVL 37.30 0.004570 237 8361 6968.001 STREET Fe-tAB FOR NORTHCREST 39.81 0.004480 237 8068 3159.015 TJE2MOTORGB’IERATORATGBSQWC 75.00 0.00RAN 237 P)76 3212.090 Todd Ln from Ben White to St .Brro 0.00 0.004430 237 0738 3212.003 TSM (MISCLANEOUS) 135.00 70.44R..AN 237 R117 4769.011 Upper Harris Branch hterceptor 0.00 0.00PLAN 237 P073 3212.088 US 183 at IH 35 (S. to S Connection) 0.00 0.004480 237 8829 3212.072 US 183- BOLMTO PATTON 730.00 0.00PlAN 237 F066 3212.084 US 183 fromSH7l toSH 130 0.00 0.0045702378428 3212.060 US 183IBOLMRDTOTHOtvONLN 4,681.00 87.9045702378341 3212.049 US 183/GOVALLETUNN SHAFT RE 3,137.00 284.954480 237 8827 3212.055 US183-H20 RELOC-SFRNGDALE2BOGG 537.00 0.004570 237 8356 3212.056 US290-JOE TANNER TO SCB”JIC BRI< 311.00 0.0044802378927 757.007 WALLERCREB<CR’JTERIMFS 102.12 101.9045702378937 6932.001 WALNUTREB<FROJECT3M 15132.57 1931.44RAN 237 P027 3023.019 Walnut Creek WJTP Headw orks kWrovements 0.00 0.00RAN 237 P002 3023.018 Walnut Creek WWTP Msc. rp. 0.00 0.00RAN 237 P036 3023.021 Walnut Creek WWTP Rant Control System Upgrad 0.00 0.00PlAN 237 P005 3023.015 Walnut WWTP ster Ran 0.00 0.004570 237 3050 3353.073 WATERSEGE RJD MAKAR 2,690.00 0.00RAN 237 RJ99 757.007 WCC Building Bivelope hspection/Re-Caulking 0.00 0.00PlAN 237 P108 757.007 WCC Crosswalk Roof Replacerrent 0.00 0.00PlAN 237 P095 757.007 WCC Buiprrent Generator Tie-h 0.00 0.004480 237 9117 757.007 WcC FiRE PANE RERACBvE’IT 100.00 0.00
CIP-C-6
C.
(.
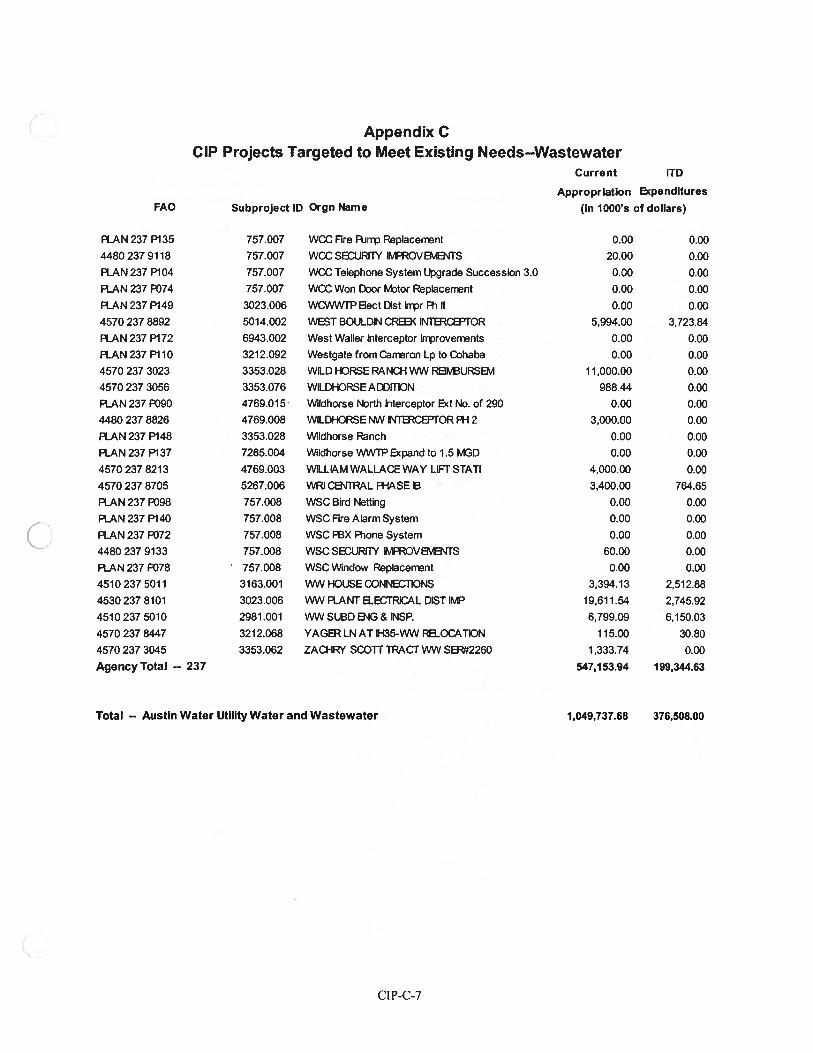
Appendix CCIP Projects Targeted to Meet Existing Needs--Wastewater
Current ITO
Appropriation Expenditures
Subproject ID Orgn Name (in 1000’s of dollars)FAO
PlAN 237 P135 757007 WCC Fire Rirrp RepIacennt 0.00 0.0044802379118 757.007 WCCSECIJRITY ltvFROVBE”JTS 20.00 0.00
RAN 237 P104 757.007 WCC Telephone System Upgrade Succession 3.0 0.00 0.00
PlAN 237 P074 757.007 WCC Won Door Ftor Replacerrent 0.00 0.00
RAN 237 P149 3023.006 WCVVWTP Sect 1)1st hrpr A, II 0.00 0.00
4570 237 8892 5014.002 WEST BOULDIN CREEK INTERCEPTOR 5994.00 3,723.84
RAN 237 P172 6943.002 West WaIler hterceptor lrrproverrents 0.00 0.00
R.AN 237 P110 3212.092 Westgate from Carreron Lp to Cohaba 0.00 0.00
4570 237 3023 3353.028 WILD HORSE RANCH WiN REJFURSEM 11,000.00 0.00
4570 237 3056 3353.076 WILDHORSE ADDITION 988.44 0.00
RAN 237 R)90 4769.015 Wildhorse North hterceptor Ext No. of 290 0.00 0.00
4480 237 8826 4769.008 WLDHORSE NW INTERCEPTOR Fl-I 2 3,000.00 0.00
RAN 237 P148 3353.028 Wildhorse Ranch 0.00 0.00
RAN 237 P137 7265.004 Wildhorse WINTP Expand to 1.5 MGD 0.00 0.00
4570 237 8213 4769.003 WLLLAM WALLACE WAY LIFT STATI 4,000.00 0.00
4570 237 8705 5267.006 WRI Cs’JTRAL FI-IASE 8 3,400.00 764.85
PlAN 237 P098 757.008 WSC Bird Netting 0.00 0.00
RAN 237 P140 757.008 WSC Fire Alarm System 0.00 0.00
RAN 237 P072 757.008 WSC F8X P1one System 0.00 0.00
4480 237 9133 757.008 WSC SECURITY’ VFROVE?vE”JTS 60.00 0.00
PlAN 237 P078 757.008 WSC Window RepIacennt 0.00 0.00
45102375011 3163.001 WiN HOUSECONNECTIONS 3,394.13 2,512.88
4530 237 8101 3023.006 WiN PLANT SECTRICAL DIST IMP 19,611.54 2,745.92
45102375010 2981.001 WiN SUBDS%IG&INSP. 6,799.09 6,150.03
45702378447 3212.068 YAGER LN AT 1H35-WW RS..OCATION 115.00 30.80
4570 237 3045 3353.062 ZACHR’( SCOTT TRACT WW SS2260 1,333.74 0,00
Agency Total -- 237 547,153.94 199,344.63
Total -- Austin Water Utility Water and Wastewater 1,049,737.68 376,508.00
CIP-C-7
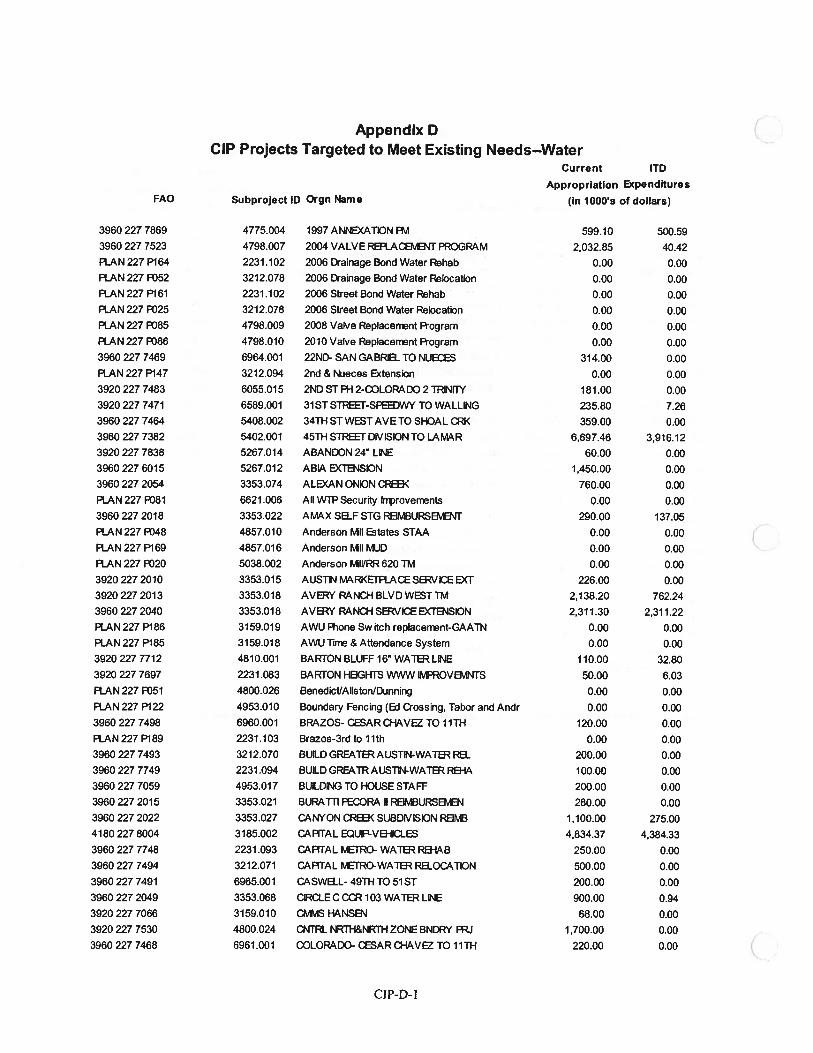
AppendixDCIP Projects Targeted to Meet Existing Needs—Water
FAO Subproject ID Orgn Name
Current lTD
Appropriation Expenditures
(in 1000s of dollars)
3960 227 7869 4775.004 1997 ANNEXATION PM 599.10 500.593960 227 7523 4798.007 2004 VALVE RBR..ADE1vE’JT PROGRAM 2,032.85 40.42PLAN 227 P164 2231.102 2006 Drainage Bond Water Rehab 0.00 0.00PLAN 227 R)52 3212.078 2006 Drainage Bond Water Relocation 0.00 0.00R.AN 227 P161 2231.102 2006 Street Bond Water Rehab 0.00 0.00PLAN 227 P025 3212.078 2006 Street Bond Water Relocation 0.00 0.00PLAN 227 P085 4798.009 2008 Valve Replacenent Rogram 0.00 0.00PLAN 227 P086 4798.010 2010 Valve Replacerrent Rogram 0.00 0.003960 227 7469 6964.00 1 22ND- SAN GABRB. TO NUEES 314.00 0.00PLAN 227 P147 3212.094 2nd & Nueces Extension 0.00 0.003920 227 7483 6055.015 2ND ST B-I 2-COLORADO 2 TRINITY 181.00 0.003920 227 7471 6589.001 31STSTREEI-SPEEDWY TO WALLG 235.80 7.263960 227 7464 5408.002 34TH ST WEST AVE TO SHOAL CRK 359.00 0.003960 227 7382 5402.001 45TH STREEI DIVISION TO LAMAR 6,697.46 3,916.12
3920 227 7838 5267.014 ABANDON 24 Lil\IE 60.00 0.003960 227 6015 5267.012 ABLA EXTENSION 1,450.00 0.003960 227 2054 3353.074 ALEXAN ONION CREEI< 760.00 0.00
PLAN 227 P081 6621.006 All WTP Security ln’provenents 0.00 0.00
3960 227 2018 3353.022 AMAX SB..F STG REIMBURSBvENT 290.00 137.05
PLAN 227 P048 4857.010 Anderson MIl tates STAA 0.00 0.00
PLAN 227 P169 4857.016 Anderson Mil MUD 0.00 0.00
PLAN 227 P020 5038.002 Anderson Mll/RR62OTM 0.00 0.00
3920 227 2010 3353.015 AUSTN MARKEIFLACESERVKDED(T 226.00 0.00
3920 227 2013 3353.018 AVERY RANCH BLVD WEST TM 2,138.20 762.24
39602272040 3353.018 AVERY RANCH SERVICEEXTENSION 2,311.30 2,311.22
PLAN 227 P186 3159.019 AWU Rone Switch replacerrent-GAATN 0.00 0.00PLAN 227 P185 3159.018 AWU line & Attendance System 0.00 0.003920 227 7712 4810.001 BARTON BLUFF 16 WATERLINE 110.00 32.80
3920 227 7697 2231 .083 BARTON HEIGHTS WV.RN ItvFROVBvT’JTS 50.00 6.03
PLAN 227 P351 4800.026 Benedict/AllstonfWnning 0.00 0.00
PLAN 227 P122 4953.010 Boundary Fencing (B.1 Crossing, Tabor and Andr 0.00 0.00
3960 227 7498 6960.001 BRAZOS- CESAR CHAVEZ TO 11TH 120.00 0.00PLAN 227 P189 2231.103 Brazos-3rd to 11th 0.00 0.003960227 7493 3212.070 BUILDGREATERAUSTIN-WATERRa 200.00 0.00
3960 227 7749 2231.094 BUILD GREATR AUS11’J-WATER REt-LA 100.00 0.00
3960 227 7059 4953.017 BUILDING TO HOUSE STAFF 200.00 0.00
3960 227 2015 3353.021 BURATTI PECORA II REINURSETEN 280.00 0.003960 227 2022 3353.027 CANYON CREEK SUBDFIIS)ON RBvB 1,100.00 275.004180 227 8004 31 85.002 CAPITAL EQUIP-VEHICLES 4,834.37 4,384.33
3960 227 7748 2231 .093 CAPITAL (vErRO- WATER RE}-LAB 250.00 0.00
3960 227 7494 321 2.071 CAPITAL tEfRO-WATER RELOCATiON 500.00 0.00
3960 227 7491 6965.001 CASWELL- 49TH TO 51 ST 200.00 0.00
3960 227 2049 3353.068 CIRCLE C CCR 103 WATER LINE 900.00 0.94
3920 227 7066 3159.010 CtvT4S HANSEN 68.00 0.00
3920 227 7530 4800.024 NTRL NRTH&NRTH ZONE BNDRY PRJ 1,700.00 0.00
3960 227 7468 6961 .001 COLORADO- CESAR CHAVEZ TO 11TH 220.00 0.00
CIP-D- I
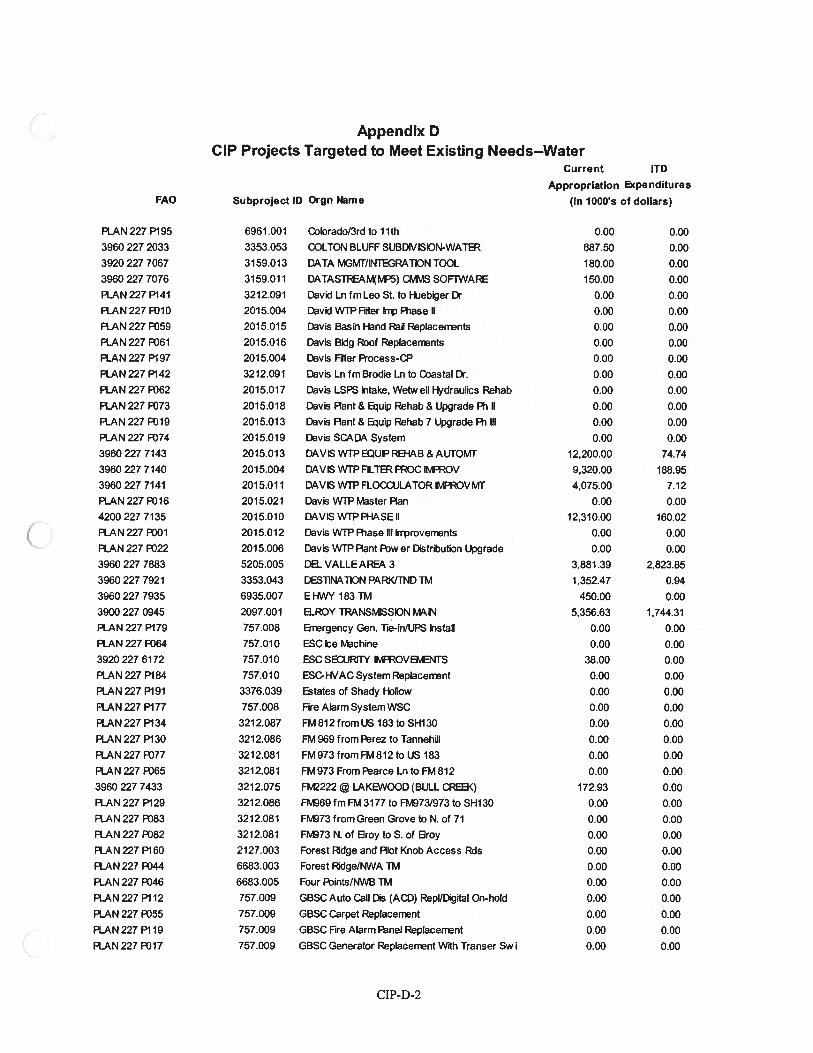
FAO
Appendix 0CIP Projects Targeted to Meet Existing Needs--Water
Subproject ID Orgn Name
Current lTD
Appropriation Expenditures
(in 1000s of dollars)
PLAN 227 P195 6961.001 Colorado/3rd to 11th 0.00 0.003960 227 2033 3353.053 COLTON BLUFF SUBDIVISION-WATER 687.50 0.00
3920 227 7067 3159.013 DATA MGMI7INTEGRATON TOOL 180.00 0.00
3960 227 7076 3159.011 DATASTREA.jvF5) GMlS SOF1WARE 150.00 0.00
PLAN 227 P141 3212.091 David Lii fm Leo St. to F-kiebiger 1) 0.00 0.00
PLAN227P110 2015.004 DavidwrPFterrpRiaselI 0.00 0.00
RAN 227 R)59 2015.015 Davis Basin Hand Rail ReplacerTients 0.00 0.00PLAN 227 P161 2015.016 Davis Bldg Raof Replacerrients 0.00 0.00
PLAN 227 P197 2015.004 Davis Filter Rocess-CP 0.00 0.00
PLAN 227 P142 3212.091 Davis Ln fm Brodie Ln to Coastal Dr. 0.00 0.00
PLAN 227 P162 2015.017 Davis LSPS Intake, Wetwell Hydraulics Rehab 0.00 0.00
PlAN 227 P073 2015.018 Davis Rant & 6uip Rehab & Upgrade Ri II 0.00 0.00
PLAN 227 P119 2015.013 Davis IRant& Equip Rehab 7 Upgrade Ri III 0.00 0.00
RAN 227 P174 2015.019 Davis SCADA System 0.00 0.00
39602277143 2015.013 DAVIS WTPEQUPREI-IAB&AUTOMT 12,200.00 74.74
3960 227 7140 2015.004 DAVIS WTP FILTER PROC lvFROV 9,320.00 188.95
39602277141 2015.011 DAVIS WTPFLOCULAT0R IIFDVMT 4,075.00 7.12
PLAN 227 P116 2015.021 Davis WTP Master Ran 0.00 0.00
4200 227 7135 2015.010 DAVIS WtP PHASE II 12,310.00 160.02
PLAN 227 RIOl 2015.012 Davis WTPRiase Ill Inproverrmnts 0.00 0.00
RAN 227 P122 2015.006 Davis WTP Rant P1w er Distribution Upgrade 0.00 0.00
3950 227 7883 5205.005 DEL VALLE AREA 3 3,881.39 2,823.85
3960 227 7921 3353.043 DEST1NA11ON PARK/TND TM 1,352.47 0.94
3960 227 7935 6935.007 E I-rvVY 183 TM 450.00 0.00
3900 227 0945 2097.001 ELROY TRANSSSION MAIN 5,356.63 1,744.31
PLAN 227 P179 757.008 rgency Gen. Tie-in/UPS Install 0.00 0.00
PLAN227F064 757.010 ESCioeMachine 0.00 0.00
3920 227 6172 757.010 ESCSBDIJR1Pi’ INROVE1vB’JTS 38.00 0.00
PLAN 227 P184 757.010 ESC-HVAC System Replacenent 0.00 0.00
PLAN 227 P191 3376.039 Estates of Shady Hallow 0.00 0.00
PLAN 227 P177 757.008 Fire Alarm System WSC 0.00 0.00
PLAN 227 P134 3212.087 FM 812 from US 183 to SH13O 0.00 0.00
PLAN 227 P130 3212.086 FM 969 from Rirez to Tannehill 0.00 0.00
RAN227F077 3212.081 FM973fromFM8l2toUSl83 0.00 0.00
RAN 227 P165 3212.081 FM 973 From Farce Ln to FM 812 0.00 0.00
3960 227 7433 3212.075 FM2222 @ LAKEWOOD (BULL RK) 172.93 0.00
PLAN 227 P129 3212.086 F?v69 fm FM 3177 to FFv73/973 to SH1 30 0.00 0.00
PLAN227R183 3212.081 Rv73fromGreenGrovetoN.of71 0.00 0.00
RAN 227 P182 3212.081 FPv73 N. of Elroy to S. of Broy 0.00 0.00
PLAN 227 P160 2127.003 Forest Ridge and RIot Knob Access Rds 0.00 0.00
RAN 227 P144 6683.003 Forest Ridge/NINA TM 0.00 0.00
PLAN 227 P146 6683.005 Four P1ints/NIB TM 0.00 0.00
PLAN 227 P112 757.009 GBSC Auto Call Dis (AcO) RepllDigital On-hold 0.00 0.00
PLAN 227 P155 757. 009 GBSC Carpet Replacenent 0.00 0.00
PLAN 227 P119 757.009 GBSC Fire Alarm Ranel Replacenent 0.00 0.00
PLAN 227 P117 757.009 GBSC Generator Repcenent With Transer Sw i 0.00 0.00
CIP-D-2
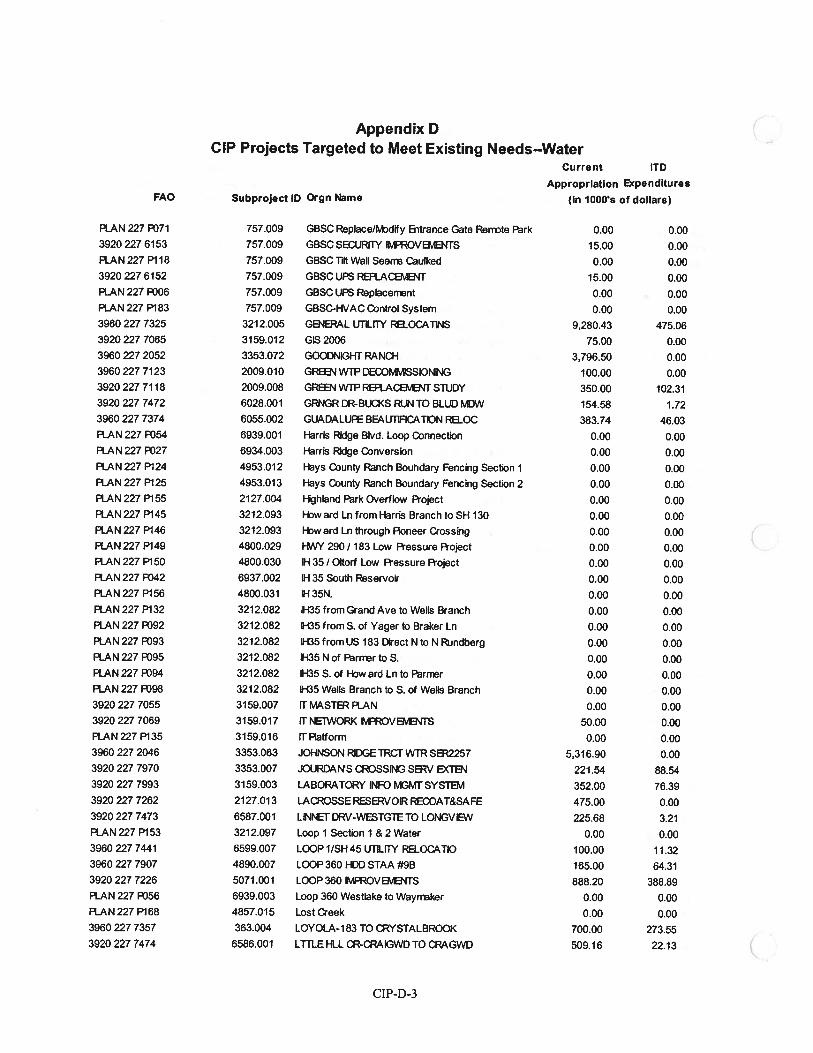
Appendix DCIP Projects Targeted to Meet Existing Needs—Water
FAO Subproject ID Orgn Name
Current lTD
Appropriation Expenditures
(in 1000s of dollars)
F1..AN 227 P071 757.009 GBSC Replace/ivbdify Entrance Gate RemDte Park 0.00 0.003920 227 6153 757.009 GBSCSEGURWY ltvFROVvENTS 15.00 0.00PLAN227 P118 757.009 GBSCTdt Wall Sean Caulked 0.00 0.003920 227 6152 757.009 GBSC UPS RER.AtDEYvU4T 15.00 0.00FLAN 227 P006 757.009 GBSC UPS Replacennt 0.00 0.00R.AN 227 P183 757.009 GBSC-HVAC Control System 0.00 0.003960 227 7325 3212.005 GENERAL UTlLrry’ ROCATNS 9,280.43 475.063920 227 7065 31 59.012 GIS 2006 75.00 0.003960 227 2052 3353.072 G000NIGHT RANCH 3,796.50 0.003960 227 7123 2009.010 GREEN WTP DECOF?v1lSSlONNG 100.00 0.0039202277118 2009.008 GREEN WTPRBAOE1vU’JTS11JDY 350.00 102.313920 227 7472 6028.001 GRNGR DR-BUCKS RUN TO BLUD vUW 154.58 1.723960 227 7374 6055.002 GUADALUPE BEAUTIFICATION RELOC 383.74 46.03PLAN 227 P054 6939.00 1 Harris Ridge Blvd. Loop Connection 0.00 0.00PLAN 227 P027 6934.003 Harris Ridge Conversion 0.00 0.00PLAN 227 P124 4953.012 Hays County Ranch Boundary Fencing Section 1 0.00 0.00PLAN 227 P125 4953.013 Hays County Ranch Boundary Fencing Section 2 0.00 0.00PLAN 227 P155 2127.004 i-kghland Park Overflow oject 0.00 0.00RAN 227 P145 3212.093 l-bw ard Ln from Harris Branch to SH 130 0.00 0.00PLAN 227 P146 3212.093 Haward Ln through Fioneer Crossing 0.00 0.00PLAN 227 P149 4800.029 l-fvW 290 / 183 Low Ressure Roject 0.00 0.00PLAN 227 P150 4800.030 H 35 / Oltorf Low Ressure Roject 0.00 0.00RAN 227 P042 6937.002 H-I 35 South Reservoir 0.00 0.00PLAN 227 P156 4800.031 H35N. 0.00 0.00PLAN 227 P132 3212.082 1H35 from Grand Ave to Wells Branch 0.00 0.00PLAN 227 P092 3212.082 lH35 from S. of Yager to Braker Ln 0.00 0.00PLAN 227 P093 3212.082 1-135 from US 183 [Yrect N to N Rundberg 0.00 0.00RAN 227 P095 3212.082 1-135 N of Parner to S. 0.00 0.00PLAN 227 P094 3212.082 lH35 S. of l-bw ard Ln to Parrrr 0.00 0.00RAN 227 P098 3212.082 K35 Wells Branch to S. of Wells Branch 0.00 0.003920 227 7055 3159.007 rr MASTB RAN 0.00 0.003920 227 7069 3159.017 IT NETWORK vFROVE1vENTS 50.00 0.00P1AN227P135 3159.016 lTFatform 0.00 0.003960 227 2046 3353.063 JOHNSON RUGE TRCT WTR S82257 5,316.90 0.003920 227 7970 3353.007 JOURDAF’IS CROSSING SV EXTB’i 221.54 88.543920 227 7993 3159.003 LABORATORY INFO MGMT SYSTEM 352.00 76.393920 227 7262 2127.013 LA’DROSSE RESERVOIR RECOAT&SAFE 475.00 0.003920 227 7473 6587.001 LINNErDRV-WESTGTETO LONGVIEW 225.68 3.21PlAN 227 P153 321 2.097 Loop I Section 1 & 2 Water 0.00 0.0039602277441 6599.007 LOOP1JSH45U1]LY RELOCATIO 100.00 11.323960 227 7907 4890.007 LOOP 360 HDD STAA #9B 165.00 64.313920 227 7226 5071 .001 LOOP 360 IMFROVE7vE’4TS 888.20 388.89FIAN 227 P056 6939.003 Loop 360 Westlake to Wayn-ker 0.00 0.00PLAN 227 P168 4857.015 Lost Creek 0.00 0.003960 227 7357 363.004 LOYOLA-183 TO tDRYSTALBROOK 700.00 273.553920 227 7474 6586.001 LTTLE HLL CR-tDRA)GWD TO IDRAGWD 509.16 22.13 (
CIP-D-3
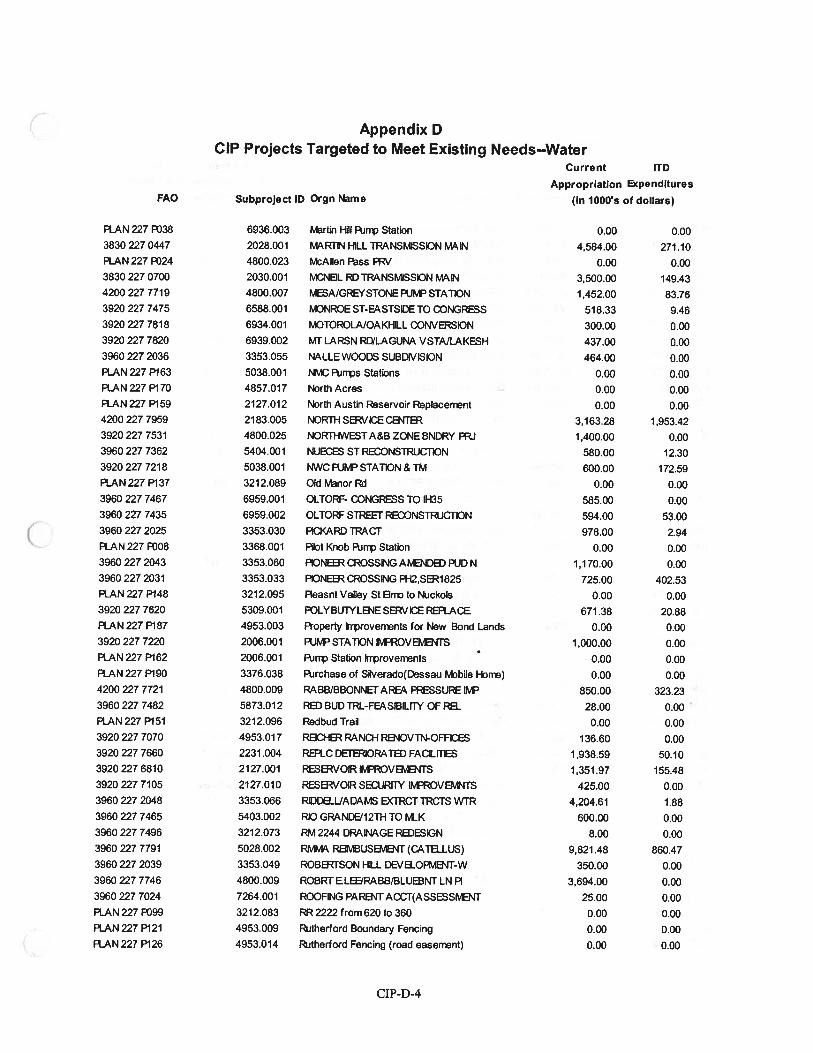
Appendix DCIP Projects Targeted to Meet Existing Needs--Water
Current ITO
Appropriation ExpendituresFAO Subproject ID Orgn Name (in 1000s of dollars)
R.AN 227 P038 6936.003 Martin Hill Rin-p Station 0.00 0.0038302270447 2028.001 MAR 4HILLTRANSMISSONMAIN 4,584.00 271.10RAN 227 P024 4800.023 Allen Fuss P1W 0.00 0.003830 227 0700 2030.001 DNBL RD TRANSMISSION MAIN 3,500.00 149.434200227 7719 4800.007 ESA/GREYSTONERJIPSTA11ON 1,452.00 83.763920 227 7475 6588.001 NGNROEST-EASTSIDETO CONGRESS 518.33 9.463920 227 7818 6934.001 DTOROLA/OAKHILL CONVERSION 300.00 0.003920 227 7820 6939.002 MT LARSN REVLAGUNA VSTA/LAKESH 437.00 0.003960 227 2036 3353.055 NALLE WOODS SUBDIVISION 464.00 0.00PLAN 227 P163 5038.001 NMC RinVs Stations 0.00 0.00FtAN227P17O 4857.017 NorthAcres 0.00 0.00RAN 227 P159 2127.012 North Austin Reservoir Replacerrent 0.00 0.004200 227 7959 2183.005 NORTH SERVICE CENTER 3,163.28 1953.423920 227 7531 4800025 NORTHNEST A&B ZONE BNDRY FR) 1,400.00 0.003960 227 7362 5404.001 NUECES ST RECONSTRUCTION 580.00 12.3039202277218 5038.001 NWCRJMPSTATION&TM 600.00 172.59ftAN227P137 3212.089 Old Manor Rd 0.00 0.003960 227 7467 6959.001 OLTORF- CONGRESS TO 1H35 585.00 0.003960 227 7435 6959.002 OLTORF STREET RECONSTRUCTION 594.00 53.003960 227 2025 3353.030 PICKARD TRACT 978.00 2.94RAN 227 P008 3368.001 PIlot Knob Purrp Station 0.00 0.0039602272043 3353.060 F1ONEERDROSSINGAFvENDHDRJDN 1170.00 0.003960 227 2031 3353.033 PIONEER CROSSING A-12,SER1 825 725.00 402.53PLAN 227 P148 3212.095 Reasnt Valley St no to Nuckols 0.00 0.003920227 7620 5309.001 ROLYBUTYLENESERVKDEREPLAtDE 671.38 20.88PLAN 227 P187 4953.003 Roperty hproverrents for New Bond Lands 0.00 0.003920 227 7220 2006.00 1 PUMP STATION IIFROVBvNTS 1,000.00 0.00PLAN 227 P162 2006.001 Rirrp Station lirproverrents 0.00 0.00PLAN 227 P190 3376.038 PUrchase of Silverado(Dessau Iviobile Hone) 0.00 0.004200 227 7721 4800.009 RABB/BBONNET AREA, FRESSURE IMP 850.00 323.233960 227 7482 5873.012 RH BUD TRL-FEASIBILIry’ OF REL 28.00 0.00FLAN227P151 3212.096 Redbud Trail 0.00 0.003920 227 7070 4953.017 REICHER RANCH RENOVTN-OFFICES 136.60 0.003920 227 7660 2231.004 REPLC DE[ERIORATSJ FACILITIES 1,938.59 50.1039202276810 2127.001 RESERVOIRIMPROVvNTS 1,351.97 155.483920 227 7105 2127.010 RESERVOIR SECtJRITh’ ItvFROVEIVINTS 425.00 0.003960 227 2048 3353.066 RDDELL/ADAMS EXTRCTTRCTS WTR 4,204.61 1.883960 227 7465 5403.002 RIO GRANDE/12Th TO MK 600.00 0.003960 227 7496 3212.073 RM2244 DRAINAGE RH)ESIGN 8.00 0.003960 227 7791 5028.002 RMv1 REThdIEUSv’4T(CATELLUS) 9,821.48 860.473960 227 2039 3353.049 ROBERTSON HLL DE’JELOPMB’JT-W 350.00 0.003960 227 7746 4800.009 ROBRT ELEE/RABB/BLUEBNT LN Pt 3,694.00 0.0039602277024 7264.001 ROOFING PARB’ITACCT(ASSESStE’1T 25.00 0.00RAN 227 P099 3212.083 RR 2222 from 620 to 360 0.00 0.00R.AN 227 P121 4953.009 Rutherford Boundary Fencing 0.00 0.00PLAN 227 P126 4953.014 Rutherford Fencing (road easennt) 0.00 0.00
CIP-D-4
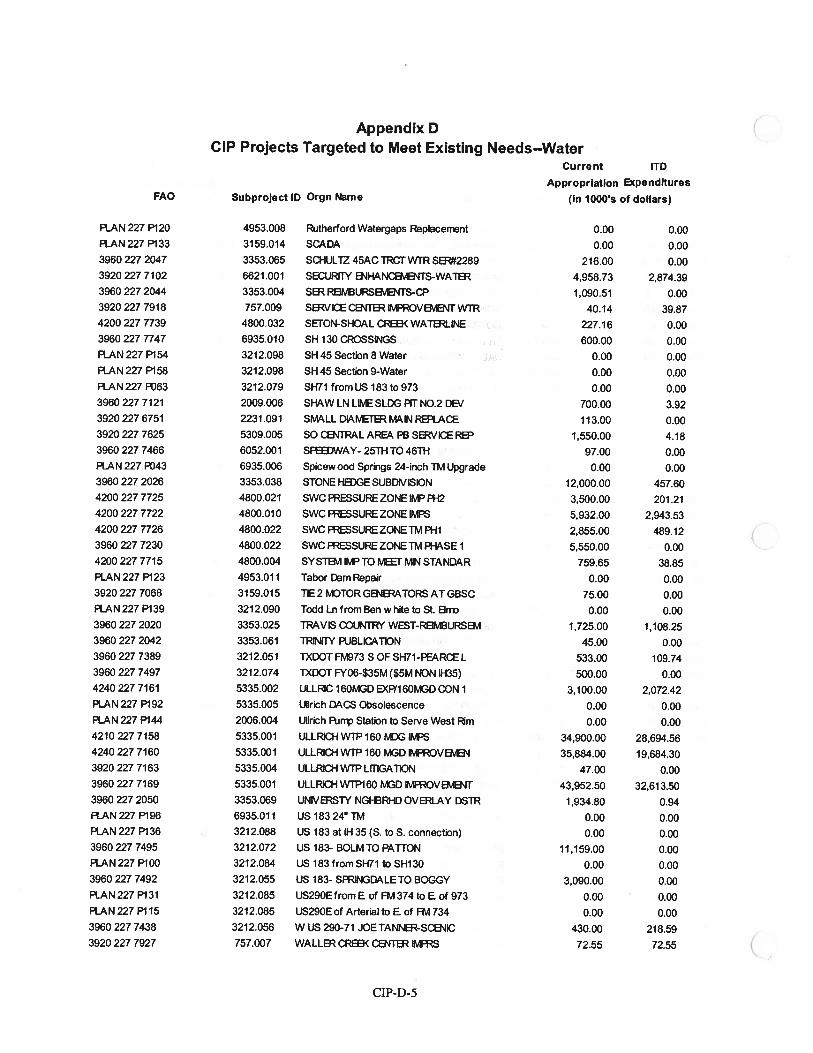
FAO
Appendix DCIP Projects Targeted to Meet Existing Needs—Water
Subproject ID Orgn Name
Current lTD
Appropriation Expenditures
(in 1000s of dollars)
RAN 227 P120 4953.008 Rutherford Watergaps Replacerrent 0.00 0.00RAN 227 P133 3159.014 SCDA 0.00 0003960 227 2047 3353.065 SCHULTZ 45AC TRCT WTR SEf2289 216.00 0.003920 227 7102 6621 .001 SDURfr’ BJHANc2IG’TS-WATER 4,958.73 2,874.393960 227 2044 3353.004 SER RE1MBURSv’lTS-CP 1,090.51 0.0039202277918 757.009 SERVKDEB%lTERMR0VErvENTWTR 40.14 39.874200 227 7739 4800.032 SETON-SHOAL CRKWATERLll\E ,. 227.16 0.003960 227 7747 6935.010 SN 130 CROSSINGS , 600.00 0.00FtAN 227 P154 3212.098 SH45 Section 8 Water 0.00 0.00RAN227P158 3212.098 SH45 Section 9-Water 0.00 0.00RAN 227 FI63 3212,079 SH71 from US 183 to 973 0.00 0.003960 227 7121 2009.006 SI-lAW LN LIME SLDG FIT NO.2 DEV 700.00 3.9239202276751 2231.091 SMALLOLAMETERMAINRRACE 113.00 0.003920 227 7625 5309.005 SO IDE?’ffRAL AREA PB SERVIER 1,550.00 4.183960 227 7466 6052.001 SPDWAY- 25TH TO 46Th 97.00 0.00PLAN 227 P343 6935.006 Spicew ood Springs 24-inch TM Upgrade 0.00 0.003960 227 2026 3353.038 STONE Hs:x3E SUBDIVISION 12,000.00 457.604200 227 7725 4800.021 SWC FESSUREZONE IliF FI-12 3,500.00 201.214200 227 7722 4800.010 SWC FRESSURE ZONE IIvFS 5,932.00 2,943.534200 227 7726 4800.022 SWC F1ESSUREZOF’ETM PHi 2,855.00 489.123960 227 7230 4800.022 SWC PRESSUREZONETM Pi-LASE 1 5,550.00 0.004200 227 7715 4800.004 SYSTBA ltFTOr ivUN STANDAR 759.65 38.85PLAN 227 P123 4953.011 Tabor Dam Repair 0.00 0.003920 227 7068 3159.015 TIE 2 MOTOR Ga4ERATORS AT GBSC 75.00 0.00PLAN 227 P139 3212.090 Todd Ln from Ben w hite to St. 6nx 0.00 0.003960 227 2020 3353.025 TRAVIS COUNTI?’ WEST-REJMEURSBv1 1,725.00 1,108.253960 227 2042 3353.061 TRINITY R)BLICATION 45.00 0.003960 227 7389 3212.051 TXDOT Frv73 S OF SH71-FEARDE L 533.00 109.743960 227 7497 3212.074 TXDOT FYO6-$35M ($5M NON 0-135) 500.00 0.004240227 7161 5335.002 ULLRIC 16OMGD (P/160lvIGD CON 1 3,100.00 2,072.42RAN 227 P192 5335.005 Ullrich DACS Obsolescence 0.00 0.00PLAN 227 P144 2006.004 UlIrich Rinç Station to Serve West Rim 0.00 0.0042102277158 5335.001 ULLRICHWTP160GrvFS 34,900.00 28,694.564240 227 7160 5335.001 ULLRKDH WTP 160 MGD vOVBvE1 35,884.00 19,684.303920 227 7163 5335.004 ULLRICH WTP LITIGATION 47.00 0.003960 227 7169 5335.001 ULLRICHWTP16O MOD ItvFOVBENT 43,952.50 32,613.503960 227 2050 3353.069 UNIVERSTY NGHBRHO OVERLAY DSTR 1,934.80 0.94RAN227P196 6935.011 US18324TM 0.00 0.00PlAN 227 P136 ,. 3212.088 US 183 at IH 35 (S. to S. connection) 0.00 0.003960 227 7495 3212.072 US 183- BOLM TO PATTON 11,159.00 0.00PLAN 227 P100 3212.084 US 183 from SH7I to SH13O 0.00 0.003960 227 7492 3212.055 US 183- SPRINGDALETO BOGGY 3,090.00 0.00PLAN 227 P131 3212.085 US29OE from E of FM 374 to E of 973 0.00 0.00RAN 227 P115 3212.085 US29OE of Arterial to E. of FM 734 0.00 0.003960 227 7438 3212.056 W US 290-71 JOE TANNER-SDGJIC 430.00 218.593920 227 7927 757.007 WALLER cDR< CB\ITER WvS 72.55 72.55
CIP-D-5
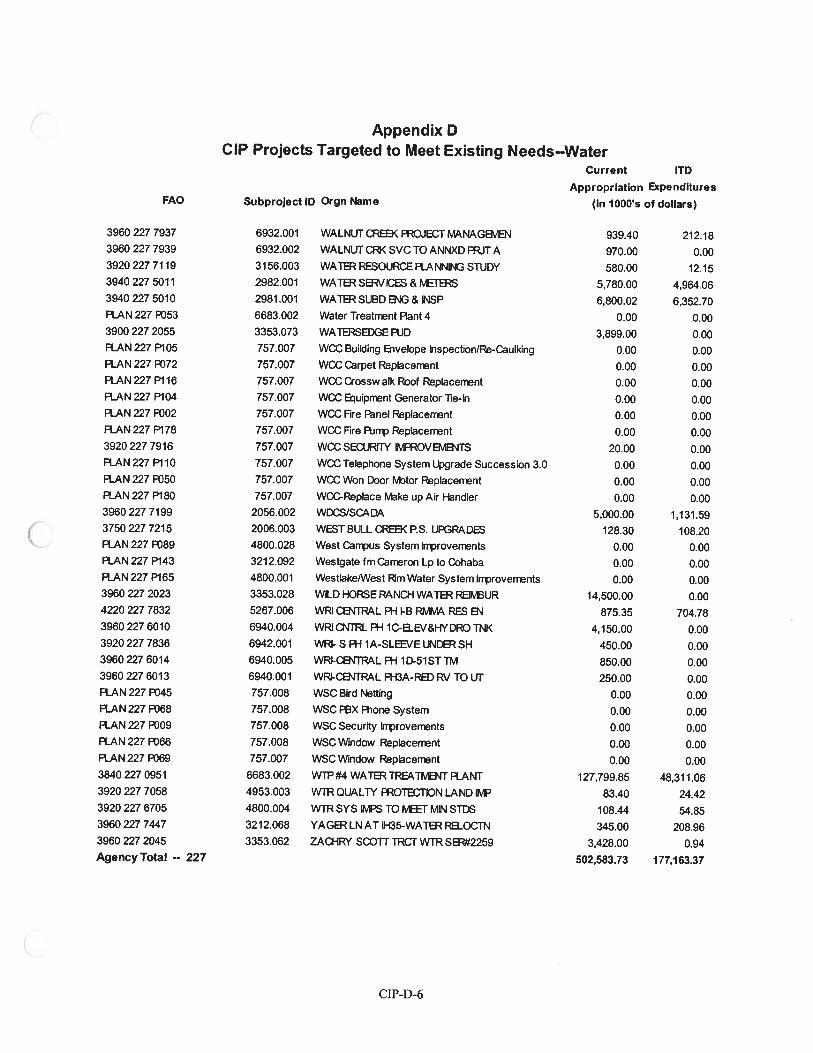
Appendix DCIP Projects Targeted to Meet Existing Needs--Water
FAO Subproject ID Orgn Name
Current lTD
Appropriation Expenditures
(in 1000’s of dollars)
39602277937 6932.001 WALNUT cRE KFROJECTMANAGE1’EN 939.40 212.183960 227 7939 6932.002 WALNUT RJ< SVC TO ANNXD FRJT A 970.00 0.0039202277119 3156.003 WATERRESOURCER.ANNING STUDY 580.00 12.153940 227 5011 2982.001 WATER SERVKDES & IETERS 5,780.00 4,964.0639402275010 2981.001 WATERSUBDENG&INSP 6,800.02 6,352.70RAN 227 RJ53 6683.002 Water Treatrrent Rant 4 0.00 0.003900 227 2055 3353.073 WATERSEDGE RiD 3,899.00 0.00FIAN 227 P105 757.007 WCC Building velope Inspection/Re-Caulking 0.00 0.00RAN 227 R72 757.007 WCC Carpet Replacerrnt 0.00 0.00RAN 227 P1 16 757.007 WCC Cossw alk Roof Replacerrnt 0.00 0.00RAN 227 P104 757.007 WCC uipirnt Generator Tie-In 0.00 0.00RAN 227 F002 757.007 WCC Fire Fnel RepIacerTnt 0.00 0.00RAN 227 P178 757.007 WCC Fire Purrp Replacennt 0.00 0.0039202277916 757.007 WCCSEIJRITY fvFROVBvU’ffS 20.00 0.00RAN 227 Fl 10 757.007 WCC Telephone System Upgrade Succession 3.0 0.00 0.00RAN 227 R)50 757.007 WCC Won [or Mtor Replacerrnt 0.00 0.00FIAN 227 P180 757.007 WCC-Replace tvke up Air FndIer 0.00 0.0039602277199 2056.002 WD’DSISCADA 5,000.00 1,131.593750 227 7215 2006.003 WEST BULL CREEK P.S. UR3RADES 128.30 108.20RAN 227 R189 4800.028 West Carrçus System lnproverrnts 0.00 0.00RAN 227 P143 3212.092 Westgate fm Canron Lp to Cohaba 0.00 0.00RAN 227 P165 4800.001 Westlake/West Rim Water System krprovenents 0.00 0.003960 227 2023 3353.028 WLD HOE RANCH WATER REIFvEUR 14,500.00 0.004220 227 7832 5267.006 WRI CENTRAL R-I I-B RMVIA RES EN 875.35 704.7839602276010 6940.004 WRlCHTRLFH1C-E.EV&KYDTNK 4,150.00 0.003920 227 7836 6942.001 WRI- S Fl-I lA-SLEEVE UNDER SH 450.00 0.003960 227 6014 6940.005 WRI-c8JTRAL Fl-I iD-Si ST TM 850.00 0,003960 227 6013 6940.001 WRI-cENTRAL R-l3A-RED RI TO UT 250.00 0.00RAN 227 Rt45 757.008 WSC Bird Netting 0.00 0.00RAN 227 R68 757.008 WSC FX Rione System 0.00 0.00RAN 227 09 757.008 WSC Security krproverrents 0.00 0.00R.AN 227 FV66 757.008 WSC Window Reptacerrnt 0.00 0.00RAN 227 R69 757.007 WSC Window Replacerrent 0.00 0.0038402270951 6683.002 WTP#4WATERTRE4.T?vENTR.ANT 127,799.85 48,311.063920 227 7058 4953.003 WTR QUA LTY FROTECTION LAND IP 83.40 24.423920 227 6705 4800.004 WTR SYS lFvPS TO IVEET M’J STDS 108.44 54.853960 227 7447 3212.068 YAGER LN AT 1H35-WATER RELOCTN 345.00 208.963960 227 2045 3353.062 ZAHFy’ SO1T TRCT WTR SEf2259 3,428.00 0.94Agency Total •- 227 502,583.73 177,163.37
CIP—D-6
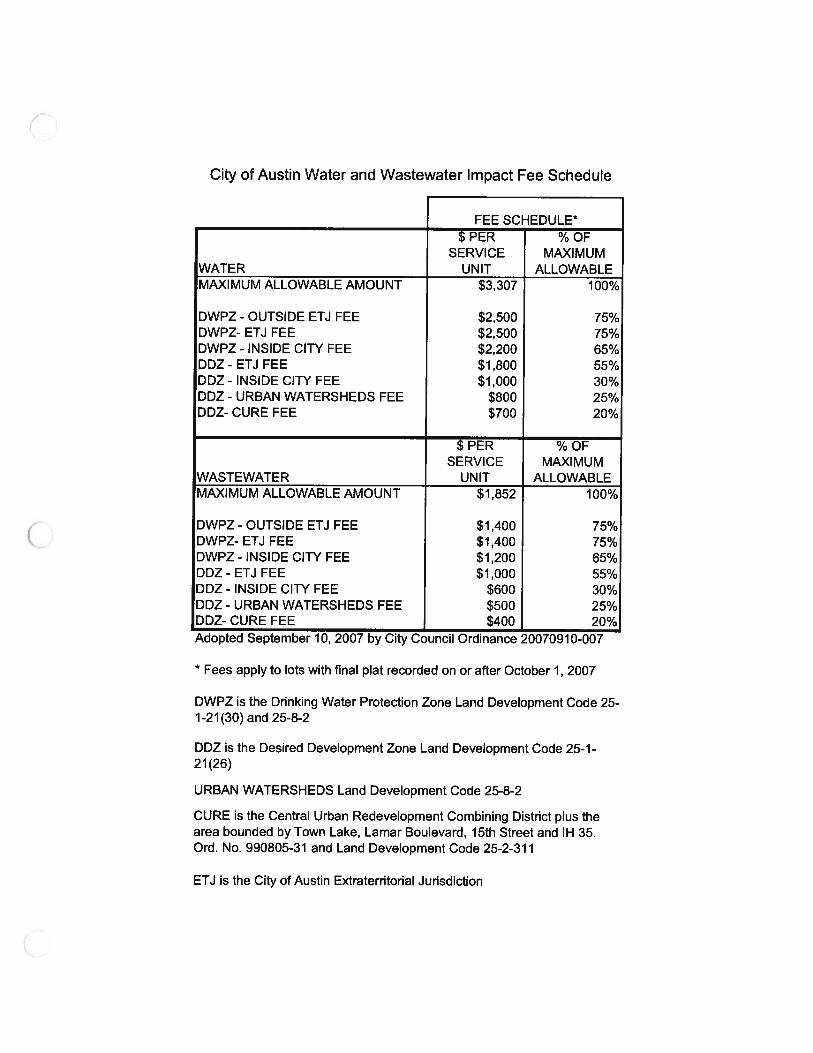
City of Austin Water and Wastewater Impact Fee Schedule
FEE SCHEDULE*
$PER %OFSERVICE MAXIMUM
WATER UNIT ALLOWABLEMAXIMUM ALLOWABLE AMOUNT $3,307 100%
DWPZ - OUTSIDE ETJ FEE $2,500 75%DWPZ- ETJ FEE $2,500 75%DWPZ - INS IDE CITY FEE $2,200 65%DDZ - ETJ FEE $1,800 55%DDZ - INSIDE CITY FEE $1,000 30%DDZ - URBAN WATERSHEDS FEE $800 25%DDZ- CURE FEE $700 20%
$PER %OFSERVICE MAXIMUM
WASTEWATER UNIT ALLOWABLEMAXIMUMALLOWABLEAMOUNT $1,852 100%
DWPZ - OUTSIDE ETJ FEE $1,400 75%DWPZ- ETJ FEE $1,400 75%DWPZ-INSIDECITYFEE $1,200 65%DDZ - ETJ FEE $1,000 55%DDZ - INSIDE CITY FEE $600 30%DDZ - URBAN WATERSHEDS FEE $500 25%DDZ- CURE FEE $400 20%Adopted September 10, 2007 by City Council Ordinance 2007091 0-007
* Fees apply to lots with final plat recorded on or after October 1, 2007
DWPZ is the Drinking Water Protection Zone Land Development Code 25-1-21(30) and 25-8-2
DDZ is the Desired Development Zone Land Development Code 25-1-21(26)
URBAN WATERSHEDS Land Development Code 25-8-2
CURE is the Central Urban Redevelopment Combining District plus thearea bounded by Town Lake, Lamar Boulevard, 15th Street and IH 35.Ord. No. 990805-31 and Land Development Code 25-2-31 1
ETJ is the City of Austin Extraterritorial Jurisdiction
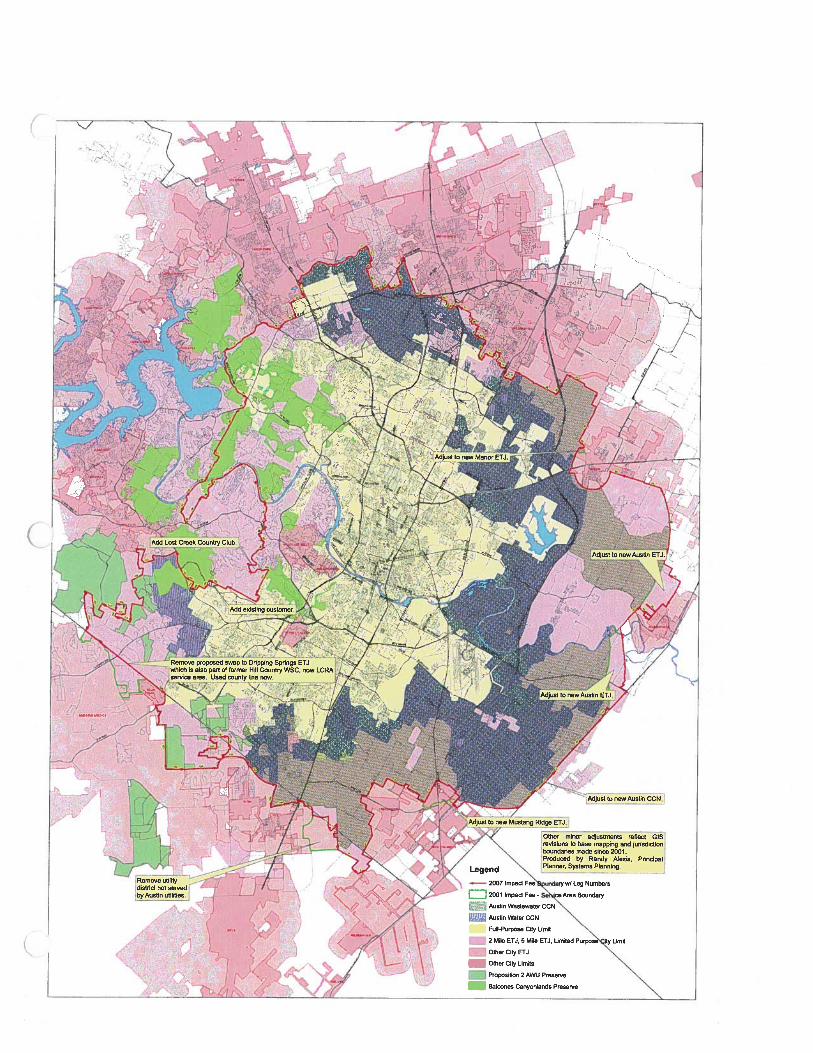
S / 4,
Remove proposed SWAP to Drippmg Springs ETJ /which is siso part of former I-tilt Country WSC, now LCRbservice area. Used county tine now. If r(. 90
— rnt
--
/I ty
I
ibyAvotie utilities.
NJ
7 \à ‘\
- c 5:-’
.-—I
7:s7$
7 N’
F7-’
r
r
Mjust to new Austin CGN
Adjust to new Mustang Ridge ETJ.
• :1,,,-‘ Other mverr adjustments reflect GISi
I •-‘‘ / revisions to base mapping and junsdictron
)<. / N boundaries made since 2001
A / ‘N Produced by Randy Alevis, Principal—“N
v Legend ‘N Planner. Systems Planeing.
-- ‘N 2007 Impact Fe’Bpuedary WI Leg Numbers
-cr” /‘ 2001 Impact Fee- ceArea Boundary
Itt Wt
CCN
/ -. 2 Mae ETJ, S Mite ETJ, Limeed Poepo’city Umit/ -
• Orison City ETJ ‘N.-.
Other City Limits “N-
- Proyositioo 2 AWU PreserveS -
‘• Butcoees Cenynrdarids Preservej !—• ‘-
--MN:
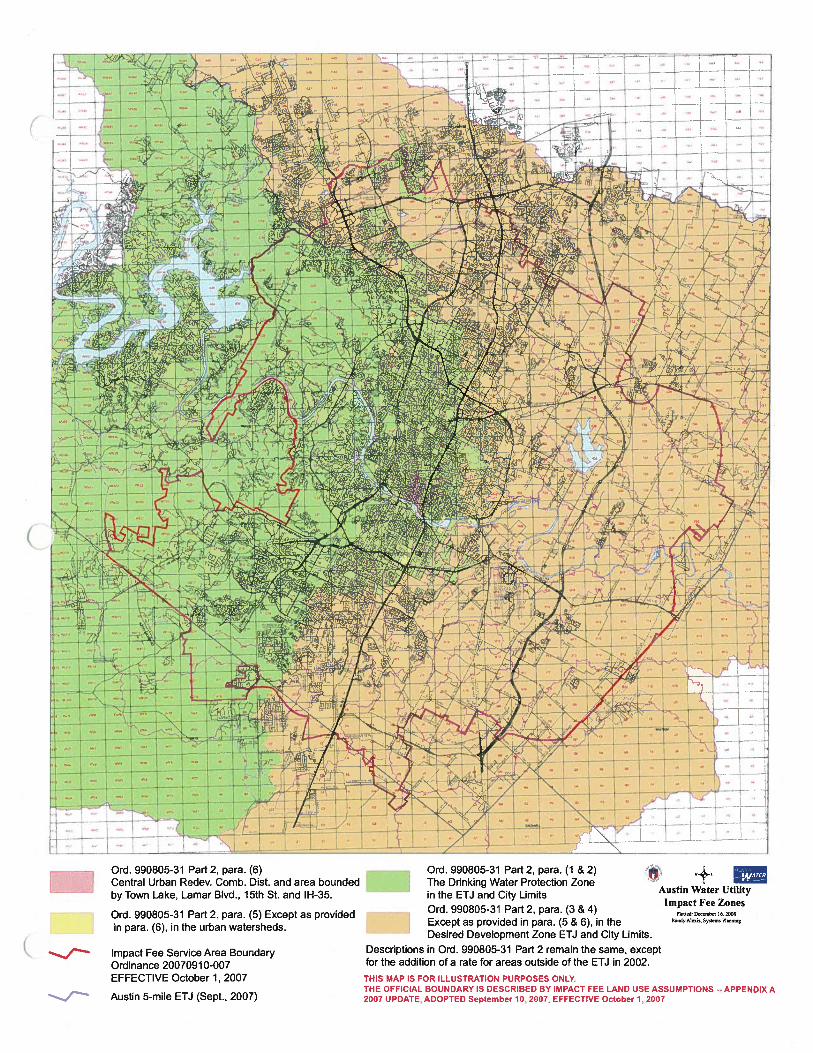
r,ri --
:
- —- : .:
________
Ord. 990805-31 Part 2, para. (6) . . . Ord. 990805-31 Part 2, para. (1 & 2) 0.
______________
Central Urban Redev. Comb. Dist. and area bounded The Drinking Water Protection Zoneby Town Lake, Lamar Blvd., 15th St. and IH-35. in the ETJ and City Limits Austin Water Utility
Ord.
990805-31 Part 2, para. (5) Except as provided
________
Ord. 990805-31 Part 2, para. (3 & 4)Impact Fee Zones
in pam. (6), in the urban watersheds. Except as provided in para. (5 & 6), in theDesired Development Zone ETJ and City Limits.
-_/‘ Impact Fee Service Area Boundary Descriptions in Ord. 990805-31 Part 2 remain the same, except
Ordinance 20070910-007 for the addition of a rate for areas outside of the ETJ in 2002.
EFFECTIVE October 1, 2007
. I
ii;(
LzJ
THIS MAP IS FOR ILLuSTRATION PURPOSES ONLY.THE OFFICIAL BOUNDARY IS DESCRIBED BY IMPACT FEE LAND USE ASSUMPTIONS - APPENDIX A2007 UPDATE, ADOPTED September 10, 2007, EFFECTIVE October 1,2007/‘ Austin 5-mile ETJ (Sept., 2007)
Recommended