Redmond Housing Needs AssessmentAugust 26, 2020
• Provide an overview of current and future housing needs in Redmond
• Provide a community profile of Redmond
• Review Key Findings & Policy Implications
Purpose
2
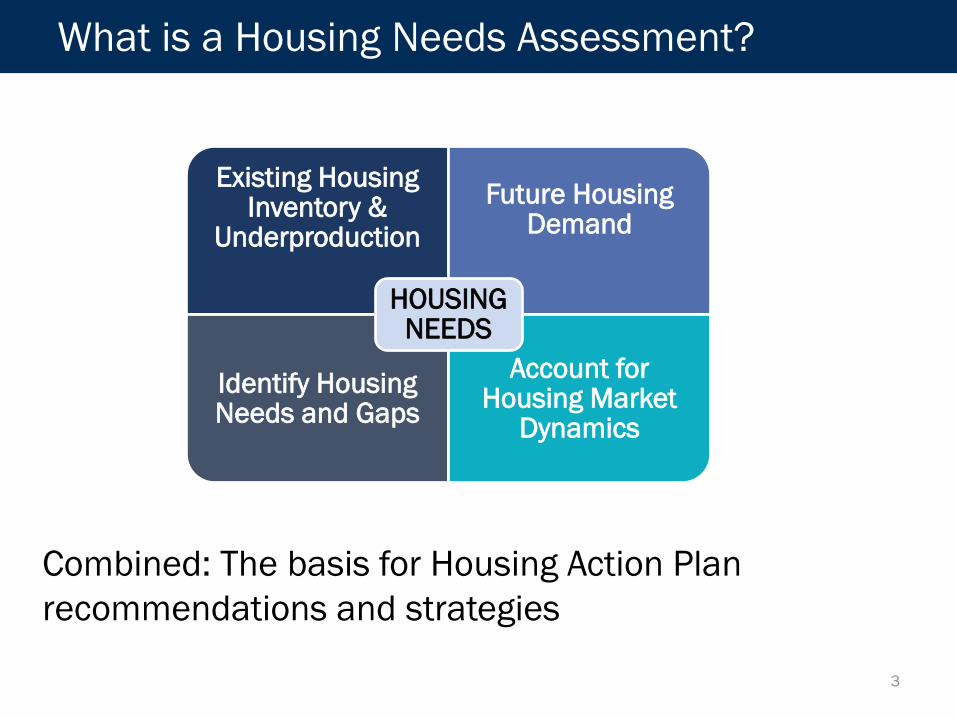
What is a Housing Needs Assessment?
3
Existing Housing Inventory &
UnderproductionFuture Housing
Demand
Identify Housing Needs and Gaps
Account for Housing Market
Dynamics
HOUSINGNEEDS
Combined: The basis for Housing Action Plan recommendations and strategies

Housing Action Plan Goals and Timeline
4
Assess Housing Needs
COMPLETED
Community Involvement SUMMER 2020
Policy Analysis and Draft Actions
FALL 2020
Adopt Housing
Action PlanSPRING 2021
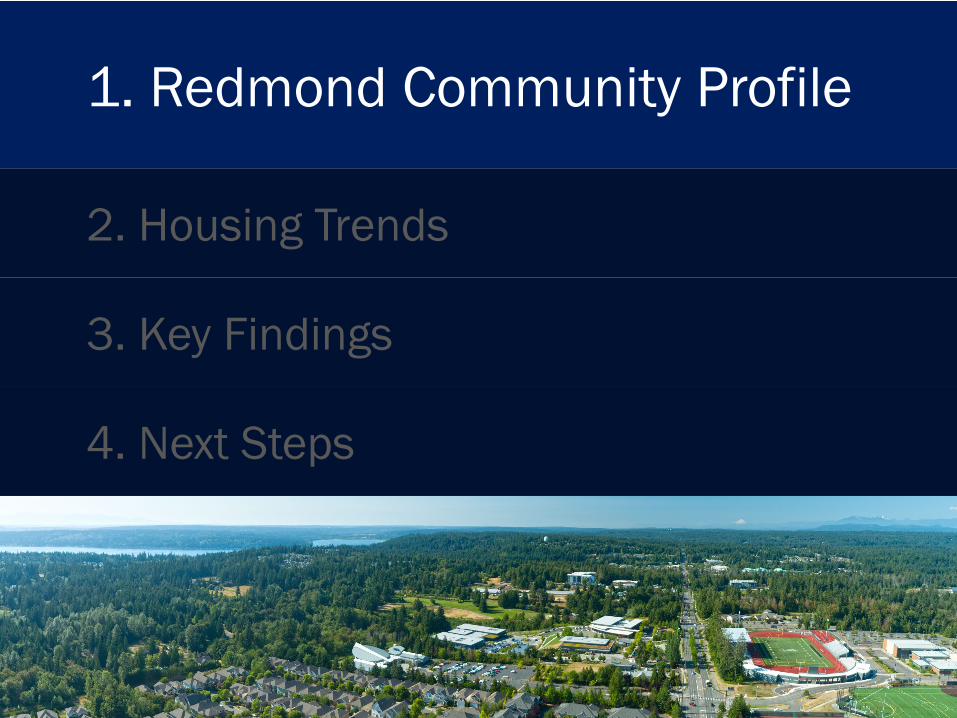
1. Redmond Community Profile
2. Housing Trends
3. Key Findings
4. Next Steps
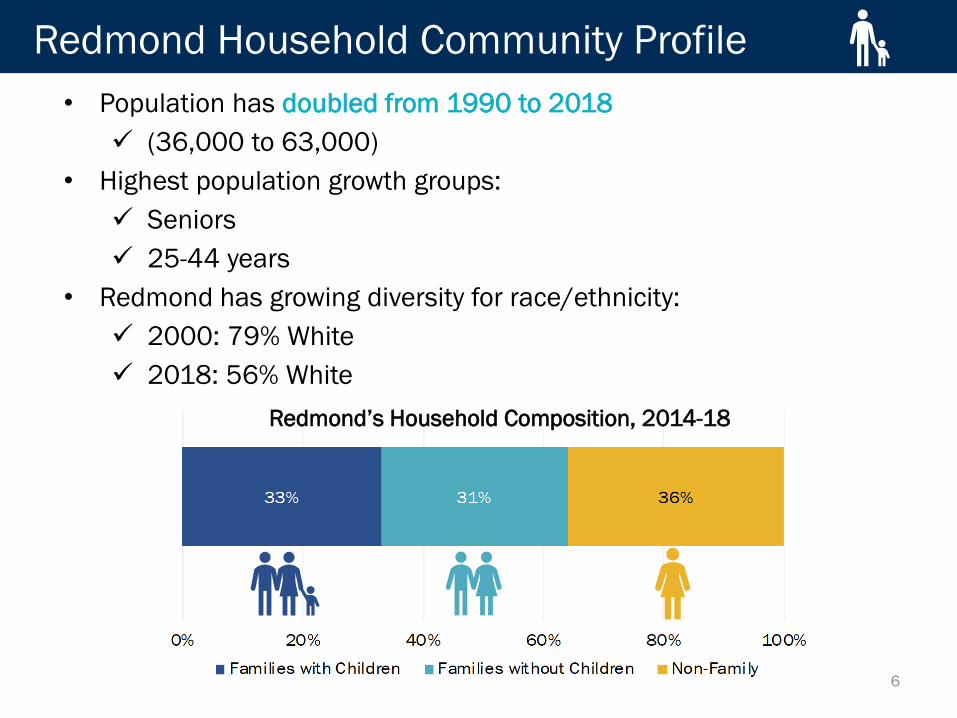
Redmond Household Community Profile
6
• Population has doubled from 1990 to 2018 (36,000 to 63,000)
• Highest population growth groups: Seniors 25-44 years
• Redmond has growing diversity for race/ethnicity: 2000: 79% White 2018: 56% White
Redmond’s Household Composition, 2014-18
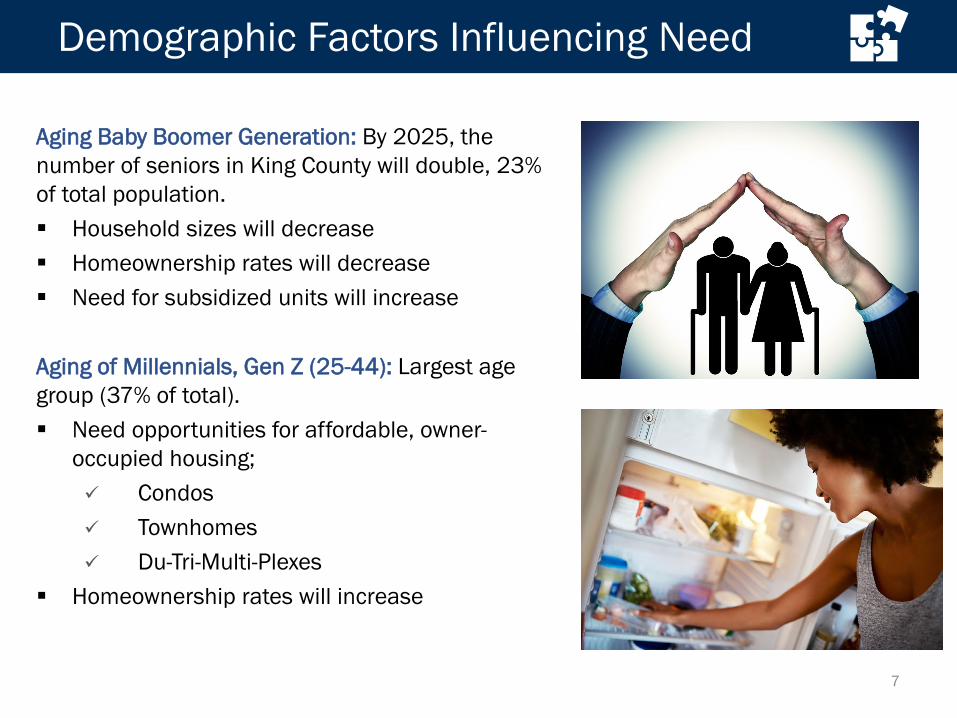
Aging Baby Boomer Generation: By 2025, the number of seniors in King County will double, 23% of total population. Household sizes will decrease Homeownership rates will decrease Need for subsidized units will increase
Aging of Millennials, Gen Z (25-44): Largest age group (37% of total). Need opportunities for affordable, owner-
occupied housing; Condos Townhomes Du-Tri-Multi-Plexes
Homeownership rates will increase
Demographic Factors Influencing Need
7
Redmond Household Community Profile
8
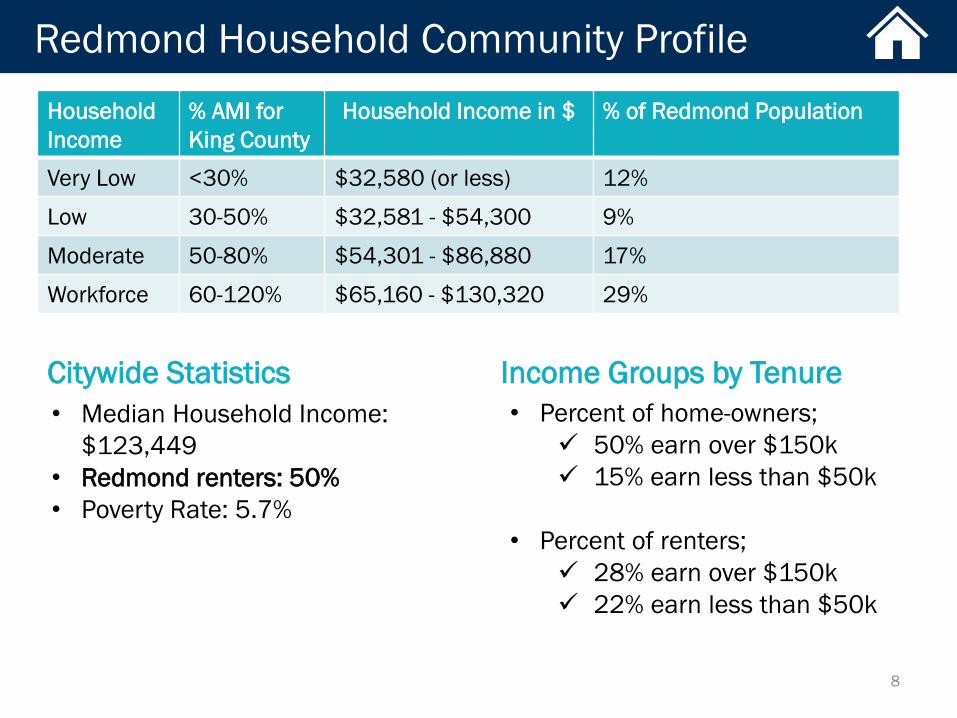
Household Income
% AMI for King County
Household Income in $ % of Redmond Population
Very Low <30% $32,580 (or less) 12%
Low 30-50% $32,581 - $54,300 9%
Moderate 50-80% $54,301 - $86,880 17%
Workforce 60-120% $65,160 - $130,320 29%
• Median Household Income: $123,449
• Redmond renters: 50%• Poverty Rate: 5.7%
• Percent of home-owners; 50% earn over $150k 15% earn less than $50k
• Percent of renters; 28% earn over $150k 22% earn less than $50k
Citywide Statistics Income Groups by Tenure
Workforce & Commuting Profile
9
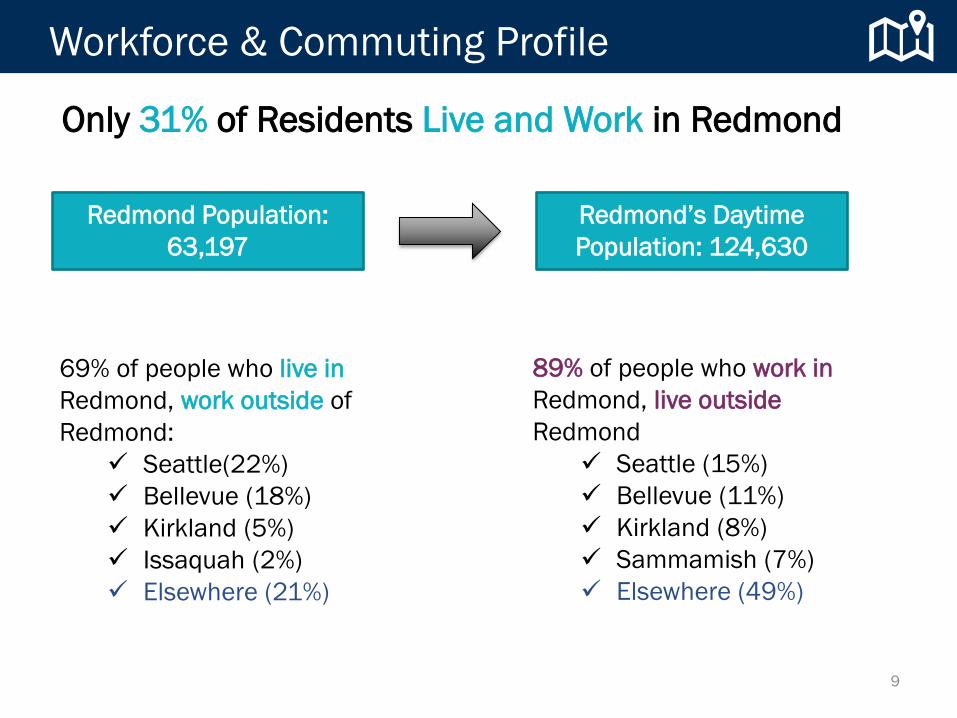
69% of people who live inRedmond, work outside of Redmond:
Seattle(22%) Bellevue (18%) Kirkland (5%) Issaquah (2%) Elsewhere (21%)
Redmond’s Daytime Population: 124,630
Redmond Population: 63,197
89% of people who work inRedmond, live outsideRedmond
Seattle (15%) Bellevue (11%) Kirkland (8%) Sammamish (7%) Elsewhere (49%)
Only 31% of Residents Live and Work in Redmond
Workforce & Commuting Profile
10
00.5
11.5
22.5
33.5
4
2000 2005 2010 2015 2018
Jobs
to H
ousi
ng R
atio
Year
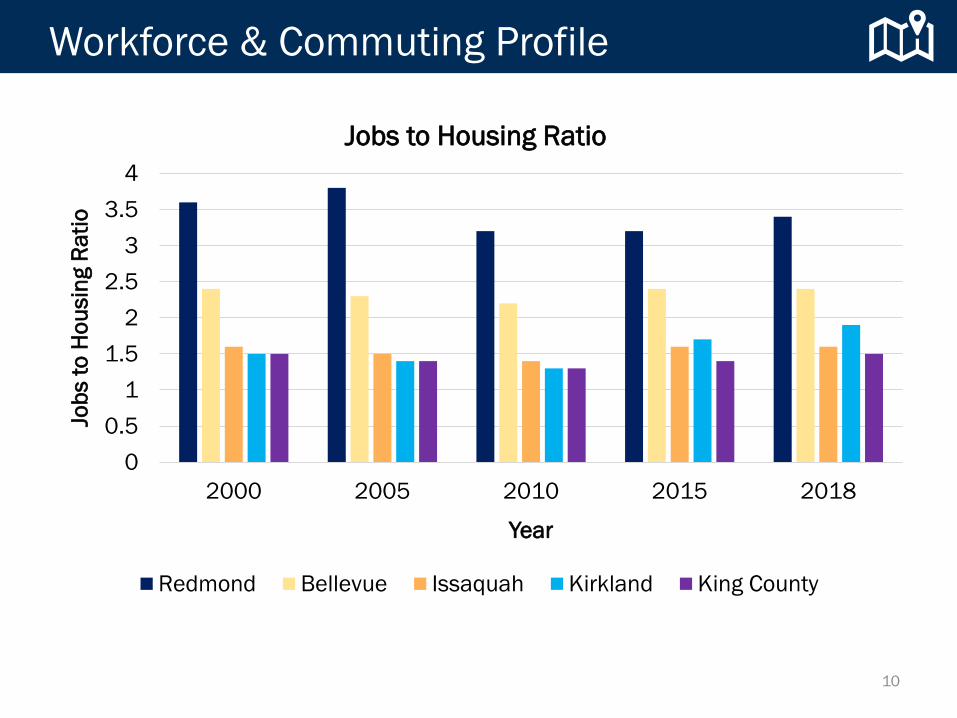
Jobs to Housing Ratio
Redmond Bellevue Issaquah Kirkland King County

Workforce & Commuting Profile
Projections by 2040 Population: 78,409 Jobs: 118,659
Targets (2006-2031): Total Housing and Employment: The 2006-2031 targets for total housing
and employment is 10,200 Housing Units (408 per year) and 23,000 Employees (920 per year). Countywide Planning Policies require that zoning and infrastructure
plans align with these targets. Affordable Housing: 24 percent of local growth should include housing
affordable to low-income households and 16 percent should include housing affordable to moderate-income households.
Redmond's Targets:
*The targets are expected to be updated in February 2021.
2. Housing Trends
1. Redmond Community Profile
3. Key Findings
4. Next Steps
Trends: Housing & Housing Costs
13
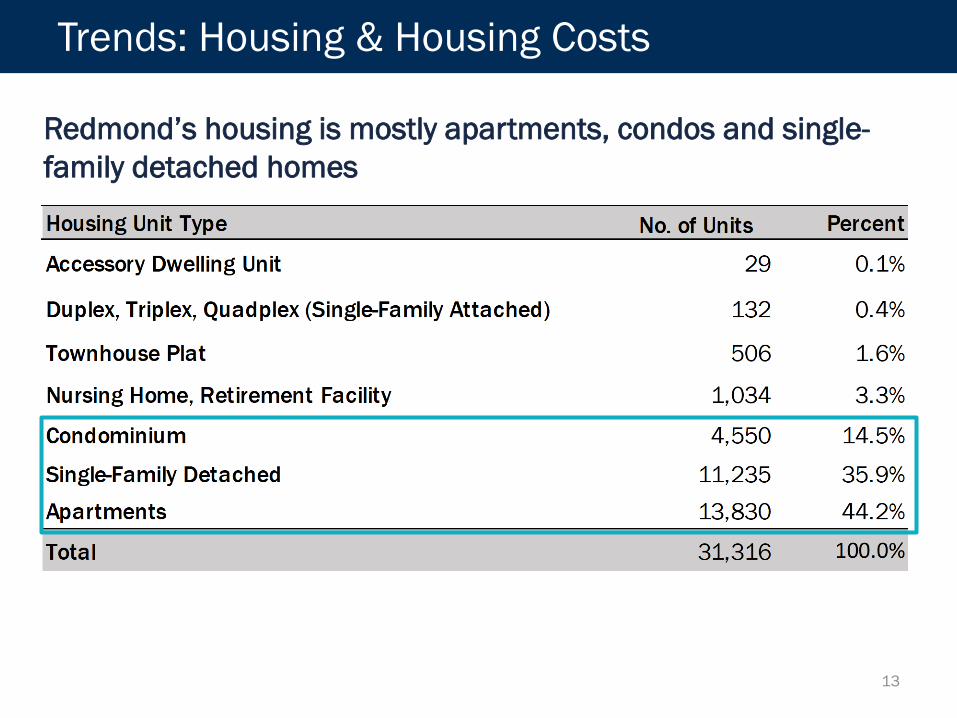
Redmond’s housing is mostly apartments, condos and single-family detached homes
Trends: Housing & Housing Costs
14
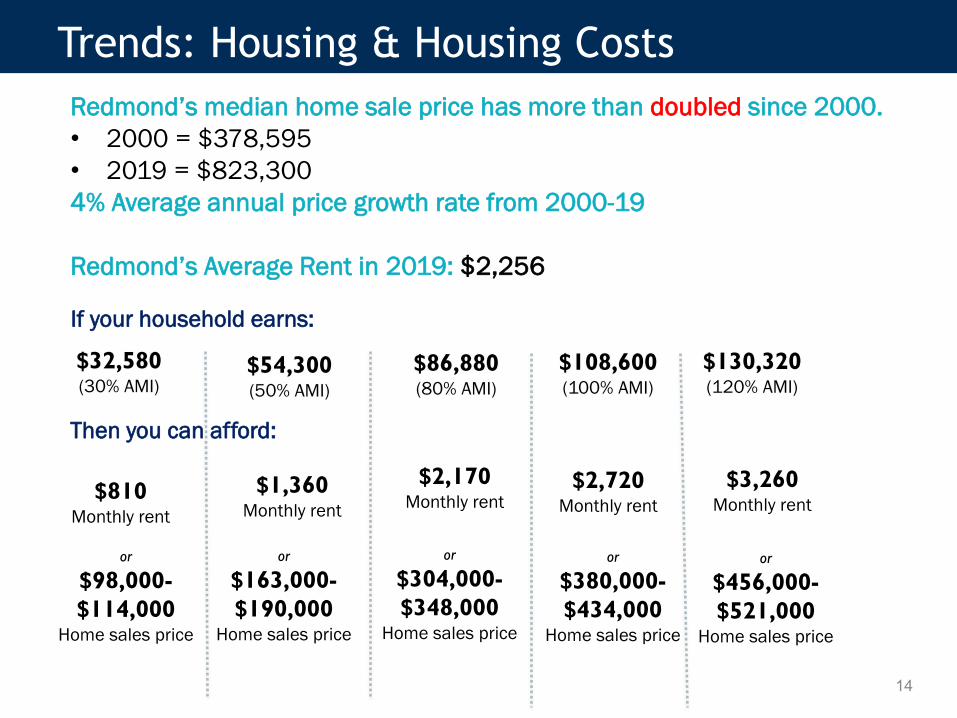
If your household earns:
$32,580(30% AMI)
$810Monthly rent
$54,300(50% AMI)
$1,360Monthly rent
$86,880(80% AMI)
$2,170Monthly rent
$108,600(100% AMI)
$2,720Monthly rent
$130,320(120% AMI)
$3,260Monthly rent
or
$304,000-$348,000
Home sales price
or
$380,000-$434,000
Home sales price
or
$456,000-$521,000
Home sales price
or
$163,000-$190,000
Home sales price
or
$98,000-$114,000
Home sales price
Then you can afford:
Redmond’s median home sale price has more than doubled since 2000. • 2000 = $378,595• 2019 = $823,3004% Average annual price growth rate from 2000-19
Redmond’s Average Rent in 2019: $2,256

Trends: Housing & Housing Costs
15
For Sale
REDMOND - RENTERCost Burdened Severely Cost Burdened
13.8% 6.5%
REDMOND - HOMEOWNERCost Burdened Severely Cost Burdened
9.8% 3.4%
*Cost burden: Paying more than 30% of household income for housing (rent or mortgage, plus utilities).
*Severe cost burden: Paying more than 50% of household income for housing (rent or mortgage, plus utilities).
Age groups of renters that are most Cost-Burdened:
• Over 65: 62%• Under 24: 61%
Duplex in Education Hill single family neighborhood
Trends: Housing & Housing Costs
16
For Sale
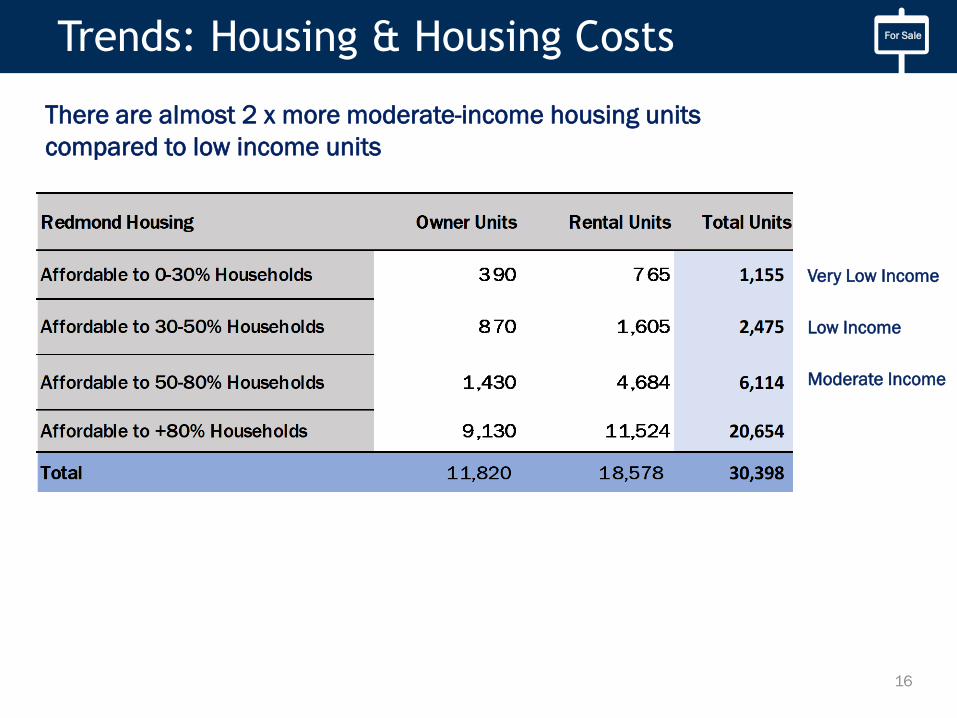
Moderate Income
Very Low Income
Low Income
There are almost 2 x more moderate-income housing units compared to low income units
Trends: Housing & Housing Costs
17
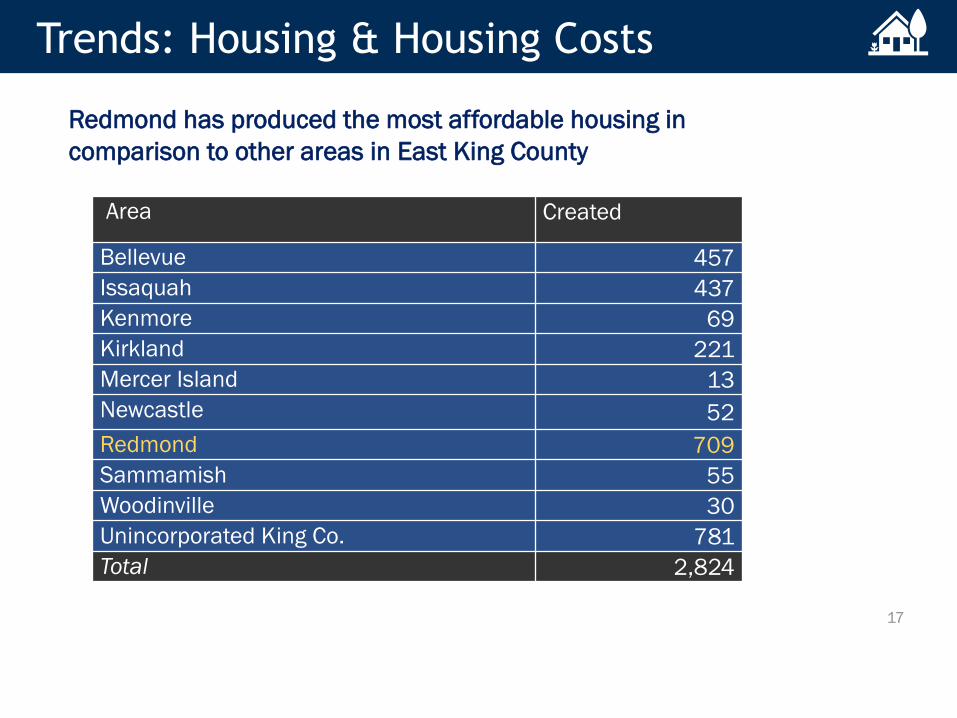
Area Created
Bellevue 457Issaquah 437Kenmore 69Kirkland 221Mercer Island 13Newcastle 52Redmond 709Sammamish 55Woodinville 30Unincorporated King Co. 781Total 2,824
Redmond has produced the most affordable housing in comparison to other areas in East King County
3. Key Findings
1. Redmond Community Profile
2. Housing Trends
4. Next Steps
Gap Analysis: Housing Need Scenarios
19
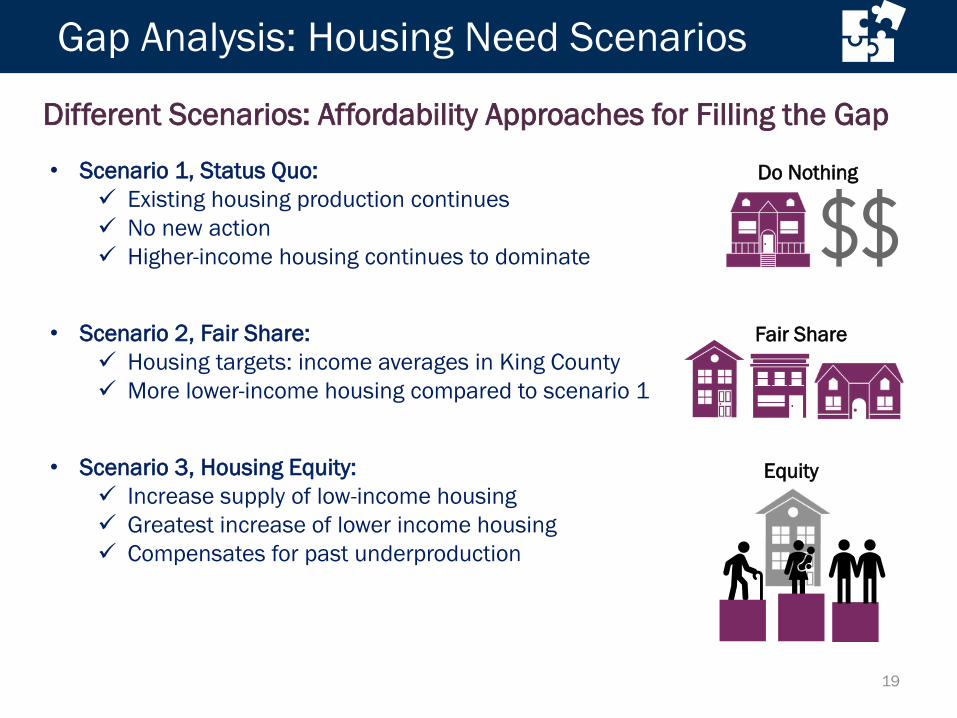
• Scenario 1, Status Quo: Existing housing production continues No new action Higher-income housing continues to dominate
• Scenario 2, Fair Share: Housing targets: income averages in King County More lower-income housing compared to scenario 1
• Scenario 3, Housing Equity: Increase supply of low-income housing Greatest increase of lower income housing Compensates for past underproduction
Different Scenarios: Affordability Approaches for Filling the Gap
Do Nothing
Fair Share
Equity

Housing Needs Gap Analysis
20
Gap Analysis for Redmond in Comparison to Bellevue and Kirkland
Source: Washington Office of Financial Management, 2019; PSRC, 2019.
Gap Analysis Results: Redmond needs an absolute minimumof 8,897 additional housing units built by 2040.
Past Future Total
Gap Analysis: Housing Need Scenarios
21
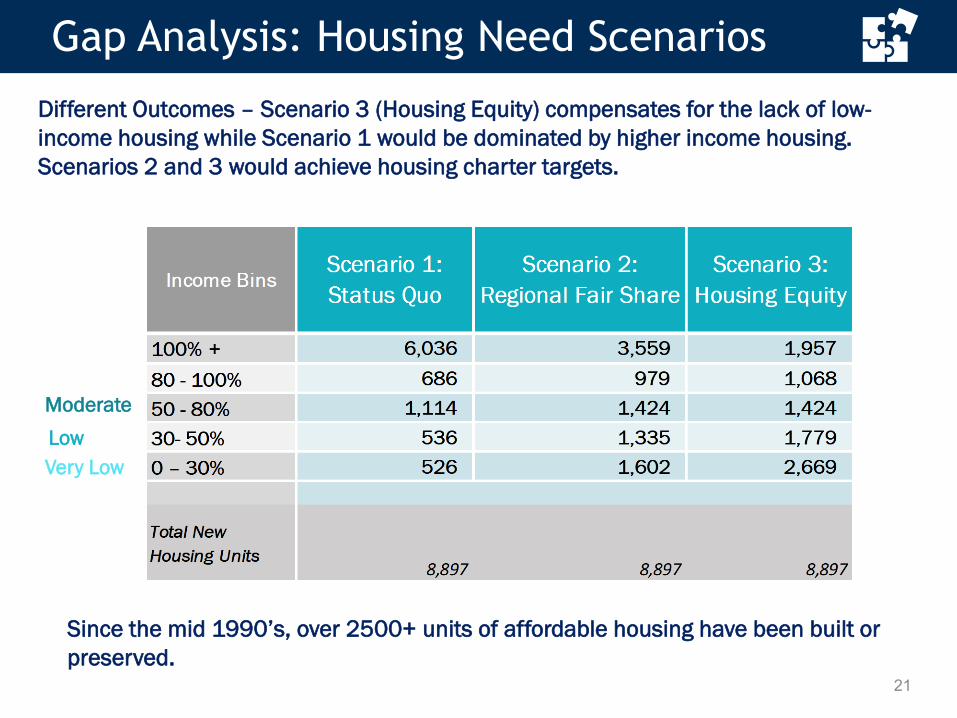
ModerateLowVery Low
Different Outcomes – Scenario 3 (Housing Equity) compensates for the lack of low-income housing while Scenario 1 would be dominated by higher income housing. Scenarios 2 and 3 would achieve housing charter targets.
Since the mid 1990’s, over 2500+ units of affordable housing have been built or preserved.
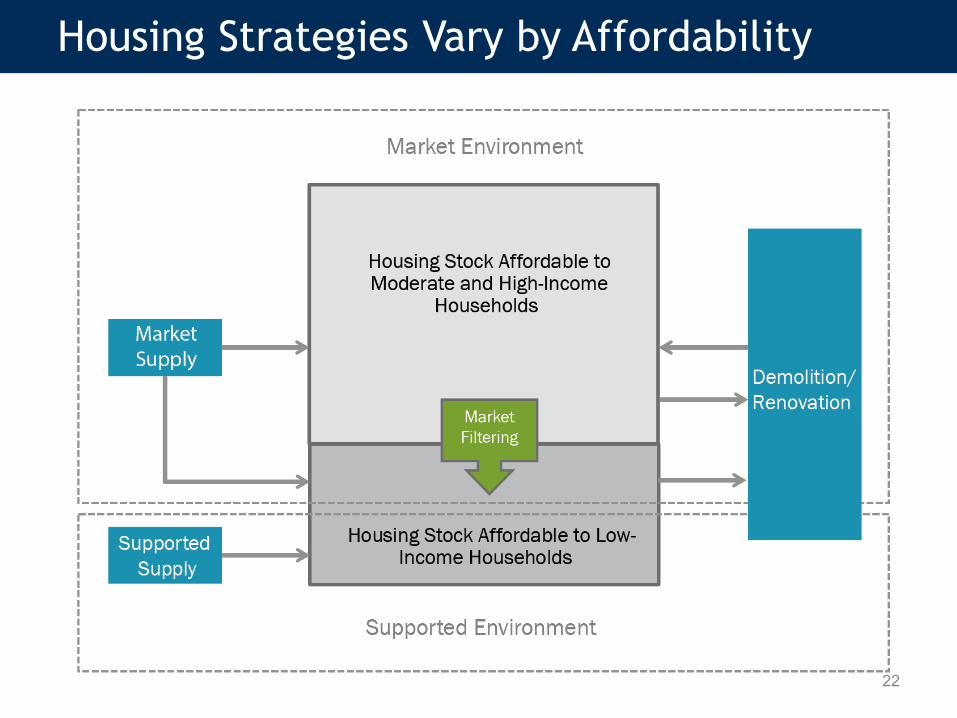
Housing Strategies Vary by Affordability
22

Housing Strategies Vary by Affordability
23

Gap Analysis: Housing Need Scenarios
24
Strategies Needed for Different Levels of Affordable Housing
Leve
l of S
uppo
rt
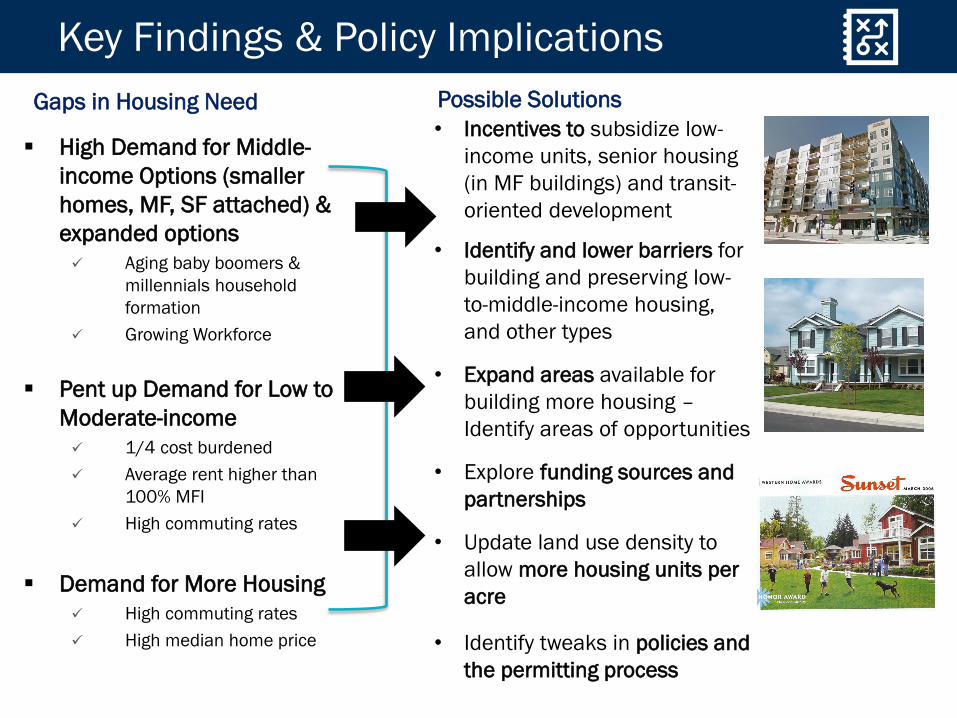
High Demand for Middle-income Options (smaller homes, MF, SF attached) & expanded options Aging baby boomers &
millennials household formation
Growing Workforce
Pent up Demand for Low to Moderate-income 1/4 cost burdened Average rent higher than
100% MFI High commuting rates
Demand for More Housing High commuting rates High median home price
Key Findings & Policy Implications
• Incentives to subsidize low-income units, senior housing (in MF buildings) and transit-oriented development
• Identify and lower barriers for building and preserving low-to-middle-income housing, and other types
• Expand areas available for building more housing –Identify areas of opportunities
• Explore funding sources and partnerships
• Update land use density to allow more housing units per acre
• Identify tweaks in policies and the permitting process
Gaps in Housing Need Possible Solutions

4. Next Steps
1. Redmond Community Profile
2. Housing Trends
3. Key Findings

Public Involvement Report Policy Analysis Draft and Final Housing
Action Plan Implementation Plan
Next Steps
27
Develop Approach and Methods
Assess Housing and Identify Unmet
Needs
Learn about Community Needs -Public Involvement
Policy Analysis, Action Plan,
Recommendations
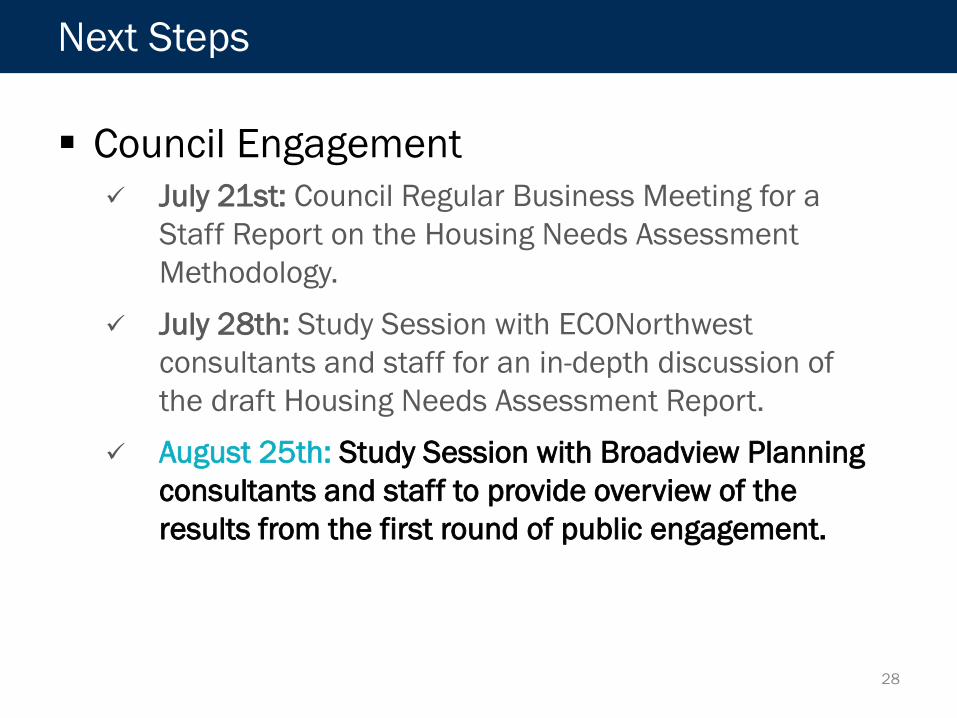
Council Engagement July 21st: Council Regular Business Meeting for a
Staff Report on the Housing Needs Assessment Methodology.
July 28th: Study Session with ECONorthwestconsultants and staff for an in-depth discussion of the draft Housing Needs Assessment Report.
August 25th: Study Session with Broadview Planning consultants and staff to provide overview of the results from the first round of public engagement.
Next Steps
28
Recommended