doi:10.1006/jmbi.2001.5201 available online at http://www.idealibrary.com on J. Mol. Biol. (2001) 314, 1245±1255
Recognition Templates for Predicting Adenylate-binding Sites in Proteins
Shanrong Zhao, Garrett M. Morris, Arthur J. Olsonand David S. Goodsell*
Department of MolecularBiology, The Scripps ResearchInstitute, La JollaCA 92037, USA
Present address: S. Zhao, Egea BDiego, CA 92121, USA.
E-mail address of the [email protected]
0022-2836/01/051245±11 $35.00/0
Recognition templates encapsulate the structural and energetic featuresfor the speci®c recognition of a given ligand by a protein active site.These templates identify the major interactions used for speci®c recog-nition and may be used to ®nd speci®c binding sites in proteins ofunknown function. We present a grid-based method for deriving recog-nition templates for adenylate groups from a set of diverse nucleotide-binding proteins. The templates reveal the basis of speci®c binding ofadenylate, including tight shape complementarity, speci®c hydrogenbonds, and underscoring the importance of a key steric contact forexcluding guanylate from adenylate-speci®c sites. We demonstrate theutility of recognition templates in identifying speci®c adenylate-bindingsites in a diverse set of dinucleotide-binding proteins.
# 2001 Academic Press
Keywords: molecular recognition; protein function prediction; protein-ligand docking; nucleotide recognition; nucleotide-binding proteins*Corresponding author
Introduction
High-throughput crystallography and structuralgenomics are providing a wealth of structural datafor new proteins. Many of these structures do nothave known functions. Prediction of the functionof a new protein structure is a challenging task.For an enzyme, prediction requires identi®cation ofspeci®c binding for a given ligand or collection ofligands, followed by prediction of chemical trans-formations that may be catalyzed, and ®nallyevaluation of interaction with the products.
As a ®rst step towards this ambitious goal, wehave developed a method for deriving a three-dimensional ``recognition template'' that describesthe binding of a given ligand to protein activesites. Recognition templates encapsulate the con-served structural and energetic features that areimportant for speci®c recognition and binding of agiven ligand. We may then use this template tosearch for these same features in proteins ofunknown function to identify speci®c bindingsites.
Speci®c binding sites for some ligands may beidenti®ed at the sequence level. For instance, con-
ioscience Inc., San
ing author:
sensus protein sequences for zinc ®ngers are avail-able and are quite robust for prediction of ion-binding sites.1 For other ligands, however, differentproteins may use entirely different structuralapproaches for binding, so sequence informationmay not be suf®cient. Adenine-binding sites are agood example. A wide range of sequence motifsare involved in binding, with little sequence (oreven structural) conservation.
Attempts to derive recognition templates havefocused on structural features of the proteins.These methods seek to identify an ensemble of con-served amino acid residues arrayed around theligand. With this method, Altman and co-workers2
have shown signi®cant success in predicting metal-binding sites, presumably aided by the tight geo-metry of coordination around metal ions. Skolnickand co-workers3,4 have used a similar approach tode®ne ``fuzzy functional forms'' that describe theconstellation of conserved residues around a givenactive site. Studies on adenine recognition tem-plates have also used this approach, looking forconserved features within the protein structurethat are used for recognition.5 ± 7 Studies on adenyl-ate have shown that there are no universally con-served residues, so the results are dif®cult tosummarize into a single consensus sequence orstructural template for use in prediction. A fewgeneral concepts have been reported, including asandwich-like structure above and below the ade-
# 2001 Academic Press
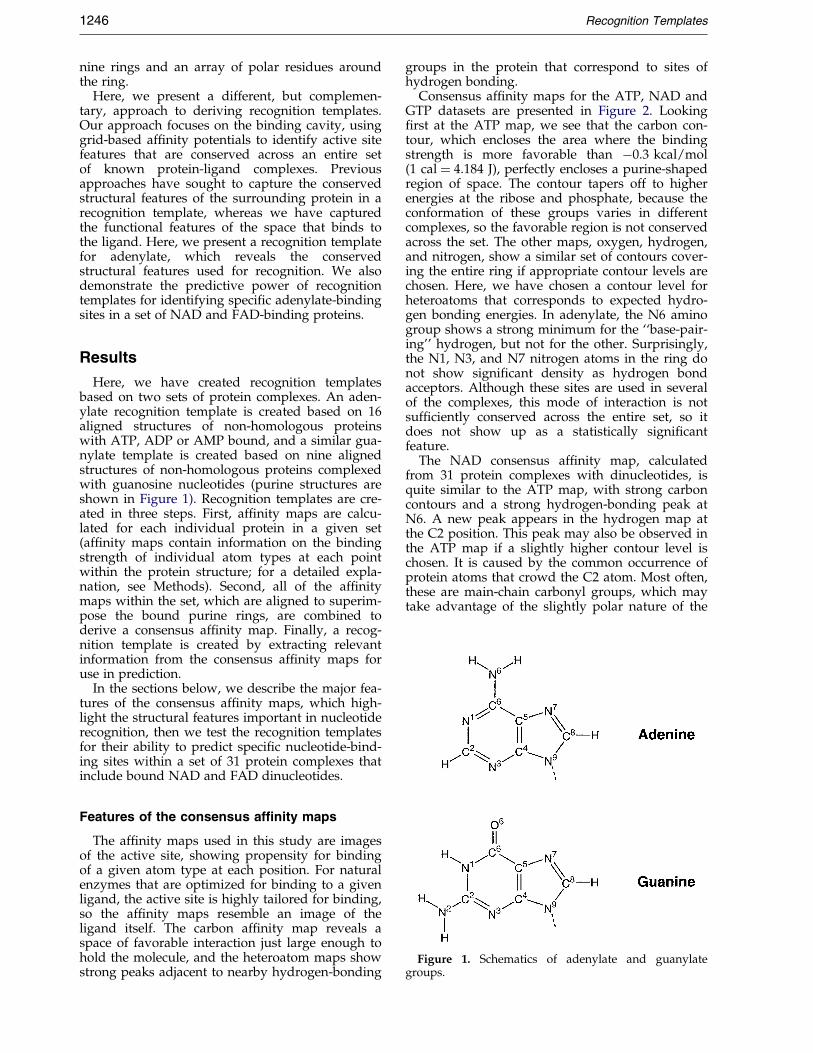
Figure 1. Schematics of adenylate and guanylategroups.
1246 Recognition Templates
nine rings and an array of polar residues aroundthe ring.
Here, we present a different, but complemen-tary, approach to deriving recognition templates.Our approach focuses on the binding cavity, usinggrid-based af®nity potentials to identify active sitefeatures that are conserved across an entire setof known protein-ligand complexes. Previousapproaches have sought to capture the conservedstructural features of the surrounding protein in arecognition template, whereas we have capturedthe functional features of the space that binds tothe ligand. Here, we present a recognition templatefor adenylate, which reveals the conservedstructural features used for recognition. We alsodemonstrate the predictive power of recognitiontemplates for identifying speci®c adenylate-bindingsites in a set of NAD and FAD-binding proteins.
Results
Here, we have created recognition templatesbased on two sets of protein complexes. An aden-ylate recognition template is created based on 16aligned structures of non-homologous proteinswith ATP, ADP or AMP bound, and a similar gua-nylate template is created based on nine alignedstructures of non-homologous proteins complexedwith guanosine nucleotides (purine structures areshown in Figure 1). Recognition templates are cre-ated in three steps. First, af®nity maps are calcu-lated for each individual protein in a given set(af®nity maps contain information on the bindingstrength of individual atom types at each pointwithin the protein structure; for a detailed expla-nation, see Methods). Second, all of the af®nitymaps within the set, which are aligned to superim-pose the bound purine rings, are combined toderive a consensus af®nity map. Finally, a recog-nition template is created by extracting relevantinformation from the consensus af®nity maps foruse in prediction.
In the sections below, we describe the major fea-tures of the consensus af®nity maps, which high-light the structural features important in nucleotiderecognition, then we test the recognition templatesfor their ability to predict speci®c nucleotide-bind-ing sites within a set of 31 protein complexes thatinclude bound NAD and FAD dinucleotides.
Features of the consensus affinity maps
The af®nity maps used in this study are imagesof the active site, showing propensity for bindingof a given atom type at each position. For naturalenzymes that are optimized for binding to a givenligand, the active site is highly tailored for binding,so the af®nity maps resemble an image of theligand itself. The carbon af®nity map reveals aspace of favorable interaction just large enough tohold the molecule, and the heteroatom maps showstrong peaks adjacent to nearby hydrogen-bonding
groups in the protein that correspond to sites ofhydrogen bonding.
Consensus af®nity maps for the ATP, NAD andGTP datasets are presented in Figure 2. Looking®rst at the ATP map, we see that the carbon con-tour, which encloses the area where the bindingstrength is more favorable than ÿ0.3 kcal/mol(1 cal � 4.184 J), perfectly encloses a purine-shapedregion of space. The contour tapers off to higherenergies at the ribose and phosphate, because theconformation of these groups varies in differentcomplexes, so the favorable region is not conservedacross the set. The other maps, oxygen, hydrogen,and nitrogen, show a similar set of contours cover-ing the entire ring if appropriate contour levels arechosen. Here, we have chosen a contour level forheteroatoms that corresponds to expected hydro-gen bonding energies. In adenylate, the N6 aminogroup shows a strong minimum for the ``base-pair-ing'' hydrogen, but not for the other. Surprisingly,the N1, N3, and N7 nitrogen atoms in the ring donot show signi®cant density as hydrogen bondacceptors. Although these sites are used in severalof the complexes, this mode of interaction is notsuf®ciently conserved across the entire set, so itdoes not show up as a statistically signi®cantfeature.
The NAD consensus af®nity map, calculatedfrom 31 protein complexes with dinucleotides, isquite similar to the ATP map, with strong carboncontours and a strong hydrogen-bonding peak atN6. A new peak appears in the hydrogen map atthe C2 position. This peak may also be observed inthe ATP map if a slightly higher contour level ischosen. It is caused by the common occurrence ofprotein atoms that crowd the C2 atom. Most often,these are main-chain carbonyl groups, which maytake advantage of the slightly polar nature of the
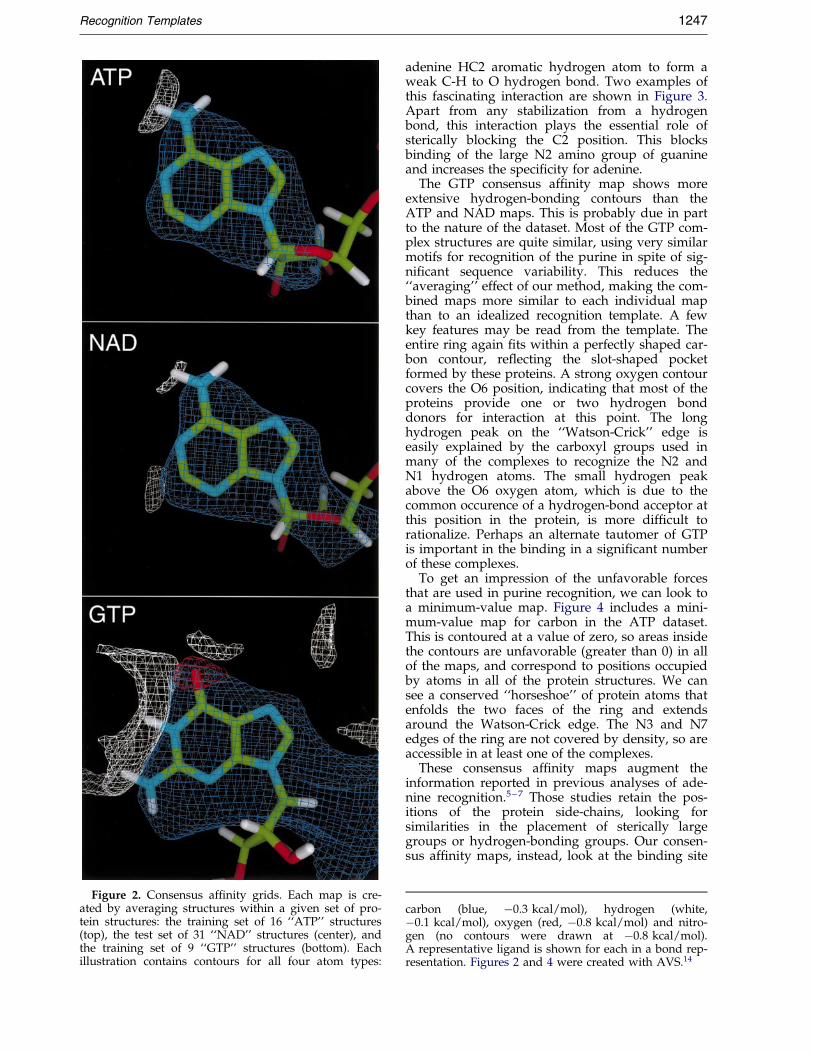
Figure 2. Consensus af®nity grids. Each map is cre-ated by averaging structures within a given set of pro-tein structures: the training set of 16 ``ATP'' structures(top), the test set of 31 ``NAD'' structures (center), andthe training set of 9 ``GTP'' structures (bottom). Eachillustration contains contours for all four atom types:
Recognition Templates 1247
adenine HC2 aromatic hydrogen atom to form aweak C-H to O hydrogen bond. Two examples ofthis fascinating interaction are shown in Figure 3.Apart from any stabilization from a hydrogenbond, this interaction plays the essential role ofsterically blocking the C2 position. This blocksbinding of the large N2 amino group of guanineand increases the speci®city for adenine.
The GTP consensus af®nity map shows moreextensive hydrogen-bonding contours than theATP and NAD maps. This is probably due in partto the nature of the dataset. Most of the GTP com-plex structures are quite similar, using very similarmotifs for recognition of the purine in spite of sig-ni®cant sequence variability. This reduces the``averaging'' effect of our method, making the com-bined maps more similar to each individual mapthan to an idealized recognition template. A fewkey features may be read from the template. Theentire ring again ®ts within a perfectly shaped car-bon contour, re¯ecting the slot-shaped pocketformed by these proteins. A strong oxygen contourcovers the O6 position, indicating that most of theproteins provide one or two hydrogen bonddonors for interaction at this point. The longhydrogen peak on the ``Watson-Crick'' edge iseasily explained by the carboxyl groups used inmany of the complexes to recognize the N2 andN1 hydrogen atoms. The small hydrogen peakabove the O6 oxygen atom, which is due to thecommon occurence of a hydrogen-bond acceptor atthis position in the protein, is more dif®cult torationalize. Perhaps an alternate tautomer of GTPis important in the binding in a signi®cant numberof these complexes.
To get an impression of the unfavorable forcesthat are used in purine recognition, we can look toa minimum-value map. Figure 4 includes a mini-mum-value map for carbon in the ATP dataset.This is contoured at a value of zero, so areas insidethe contours are unfavorable (greater than 0) in allof the maps, and correspond to positions occupiedby atoms in all of the protein structures. We cansee a conserved ``horseshoe'' of protein atoms thatenfolds the two faces of the ring and extendsaround the Watson-Crick edge. The N3 and N7edges of the ring are not covered by density, so areaccessible in at least one of the complexes.
These consensus af®nity maps augment theinformation reported in previous analyses of ade-nine recognition.5 ± 7 Those studies retain the pos-itions of the protein side-chains, looking forsimilarities in the placement of sterically largegroups or hydrogen-bonding groups. Our consen-sus af®nity maps, instead, look at the binding site
carbon (blue, ÿ0.3 kcal/mol), hydrogen (white,ÿ0.1 kcal/mol), oxygen (red, ÿ0.8 kcal/mol) and nitro-gen (no contours were drawn at ÿ0.8 kcal/mol).A representative ligand is shown for each in a bond rep-resentation. Figures 2 and 4 were created with AVS.14
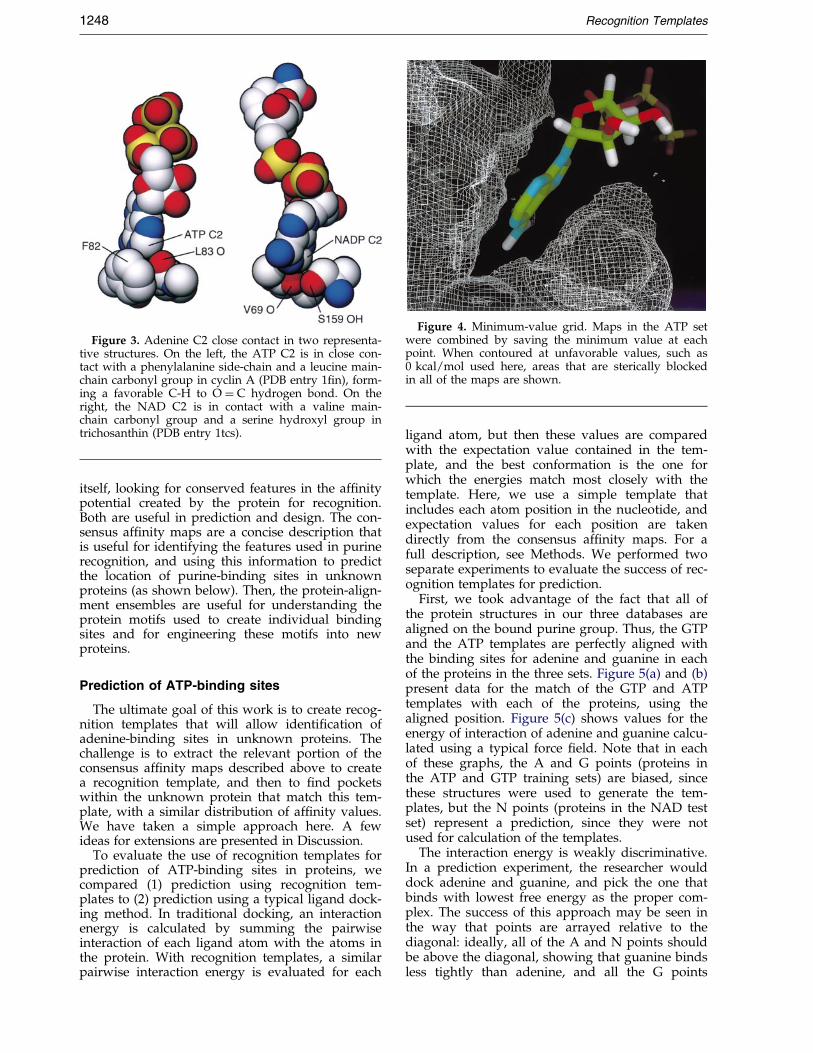
Figure 3. Adenine C2 close contact in two representa-tive structures. On the left, the ATP C2 is in close con-tact with a phenylalanine side-chain and a leucine main-chain carbonyl group in cyclin A (PDB entry 1®n), form-ing a favorable C-H to O � C hydrogen bond. On theright, the NAD C2 is in contact with a valine main-chain carbonyl group and a serine hydroxyl group intrichosanthin (PDB entry 1tcs).
Figure 4. Minimum-value grid. Maps in the ATP setwere combined by saving the minimum value at eachpoint. When contoured at unfavorable values, such as0 kcal/mol used here, areas that are sterically blockedin all of the maps are shown.
1248 Recognition Templates
itself, looking for conserved features in the af®nitypotential created by the protein for recognition.Both are useful in prediction and design. The con-sensus af®nity maps are a concise description thatis useful for identifying the features used in purinerecognition, and using this information to predictthe location of purine-binding sites in unknownproteins (as shown below). Then, the protein-align-ment ensembles are useful for understanding theprotein motifs used to create individual bindingsites and for engineering these motifs into newproteins.
Prediction of ATP-binding sites
The ultimate goal of this work is to create recog-nition templates that will allow identi®cation ofadenine-binding sites in unknown proteins. Thechallenge is to extract the relevant portion of theconsensus af®nity maps described above to createa recognition template, and then to ®nd pocketswithin the unknown protein that match this tem-plate, with a similar distribution of af®nity values.We have taken a simple approach here. A fewideas for extensions are presented in Discussion.
To evaluate the use of recognition templates forprediction of ATP-binding sites in proteins, wecompared (1) prediction using recognition tem-plates to (2) prediction using a typical ligand dock-ing method. In traditional docking, an interactionenergy is calculated by summing the pairwiseinteraction of each ligand atom with the atoms inthe protein. With recognition templates, a similarpairwise interaction energy is evaluated for each
ligand atom, but then these values are comparedwith the expectation value contained in the tem-plate, and the best conformation is the one forwhich the energies match most closely with thetemplate. Here, we use a simple template thatincludes each atom position in the nucleotide, andexpectation values for each position are takendirectly from the consensus af®nity maps. For afull description, see Methods. We performed twoseparate experiments to evaluate the success of rec-ognition templates for prediction.
First, we took advantage of the fact that all ofthe protein structures in our three databases arealigned on the bound purine group. Thus, the GTPand the ATP templates are perfectly aligned withthe binding sites for adenine and guanine in eachof the proteins in the three sets. Figure 5(a) and (b)present data for the match of the GTP and ATPtemplates with each of the proteins, using thealigned position. Figure 5(c) shows values for theenergy of interaction of adenine and guanine calcu-lated using a typical force ®eld. Note that in eachof these graphs, the A and G points (proteins inthe ATP and GTP training sets) are biased, sincethese structures were used to generate the tem-plates, but the N points (proteins in the NAD testset) represent a prediction, since they were notused for calculation of the templates.
The interaction energy is weakly discriminative.In a prediction experiment, the researcher woulddock adenine and guanine, and pick the one thatbinds with lowest free energy as the proper com-plex. The success of this approach may be seen inthe way that points are arrayed relative to thediagonal: ideally, all of the A and N points shouldbe above the diagonal, showing that guanine bindsless tightly than adenine, and all the G points
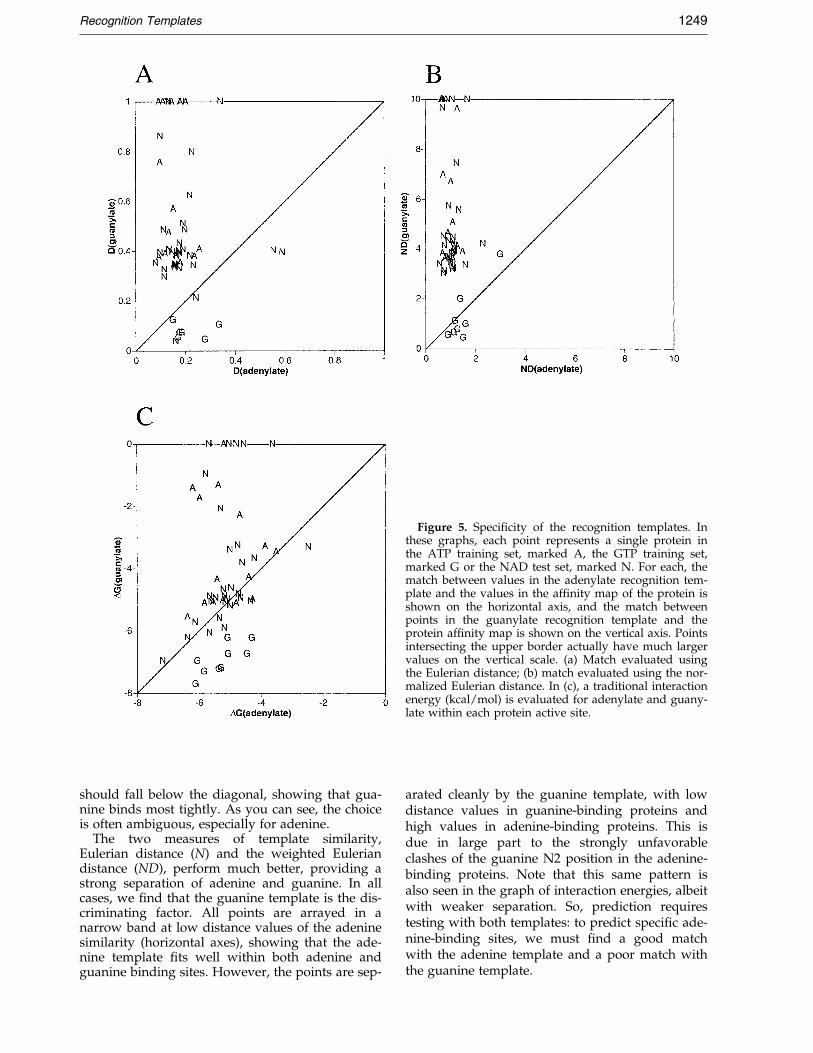
Figure 5. Speci®city of the recognition templates. Inthese graphs, each point represents a single protein inthe ATP training set, marked A, the GTP training set,marked G or the NAD test set, marked N. For each, thematch between values in the adenylate recognition tem-plate and the values in the af®nity map of the protein isshown on the horizontal axis, and the match betweenpoints in the guanylate recognition template and theprotein af®nity map is shown on the vertical axis. Pointsintersecting the upper border actually have much largervalues on the vertical scale. (a) Match evaluated usingthe Eulerian distance; (b) match evaluated using the nor-malized Eulerian distance. In (c), a traditional interactionenergy (kcal/mol) is evaluated for adenylate and guany-late within each protein active site.
Recognition Templates 1249
should fall below the diagonal, showing that gua-nine binds most tightly. As you can see, the choiceis often ambiguous, especially for adenine.
The two measures of template similarity,Eulerian distance (N) and the weighted Euleriandistance (ND), perform much better, providing astrong separation of adenine and guanine. In allcases, we ®nd that the guanine template is the dis-criminating factor. All points are arrayed in anarrow band at low distance values of the adeninesimilarity (horizontal axes), showing that the ade-nine template ®ts well within both adenine andguanine binding sites. However, the points are sep-
arated cleanly by the guanine template, with lowdistance values in guanine-binding proteins andhigh values in adenine-binding proteins. This isdue in large part to the strongly unfavorableclashes of the guanine N2 position in the adenine-binding proteins. Note that this same pattern isalso seen in the graph of interaction energies, albeitwith weaker separation. So, prediction requirestesting with both templates: to predict speci®c ade-nine-binding sites, we must ®nd a good matchwith the adenine template and a poor match withthe guanine template.
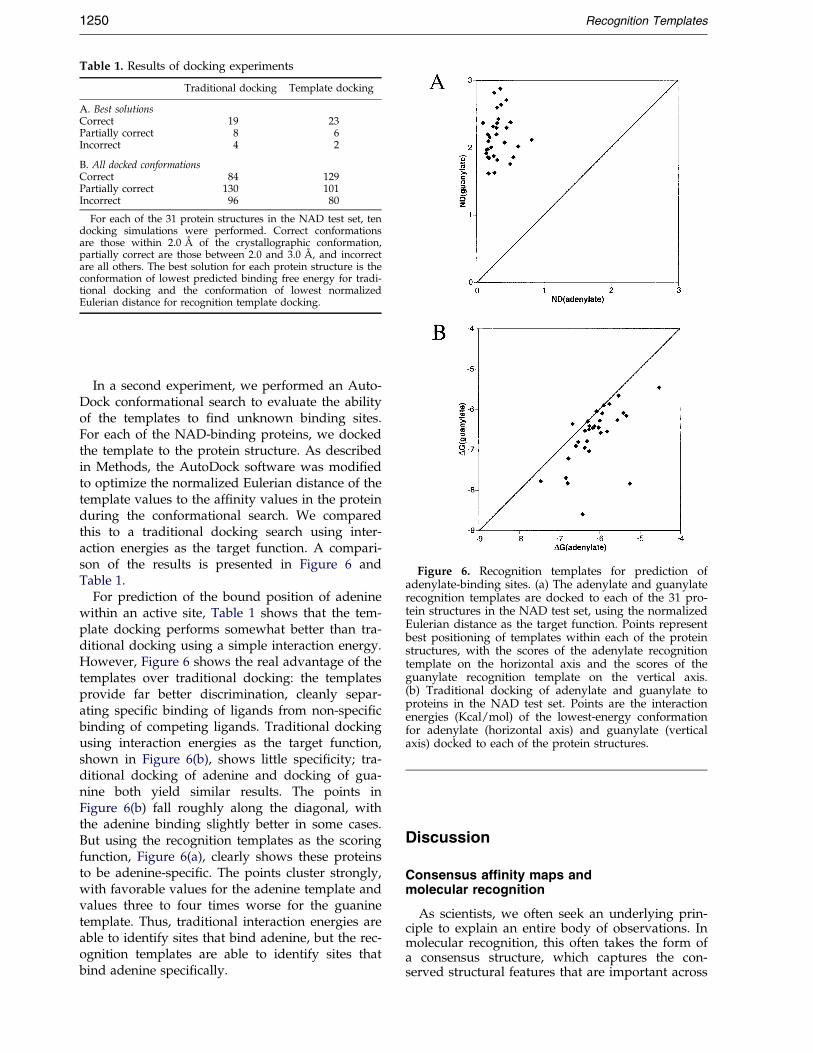
Table 1. Results of docking experiments
Traditional docking Template docking
A. Best solutionsCorrect 19 23Partially correct 8 6Incorrect 4 2
B. All docked conformationsCorrect 84 129Partially correct 130 101Incorrect 96 80
For each of the 31 protein structures in the NAD test set, tendocking simulations were performed. Correct conformationsare those within 2.0 AÊ of the crystallographic conformation,partially correct are those between 2.0 and 3.0 AÊ , and incorrectare all others. The best solution for each protein structure is theconformation of lowest predicted binding free energy for tradi-tional docking and the conformation of lowest normalizedEulerian distance for recognition template docking.
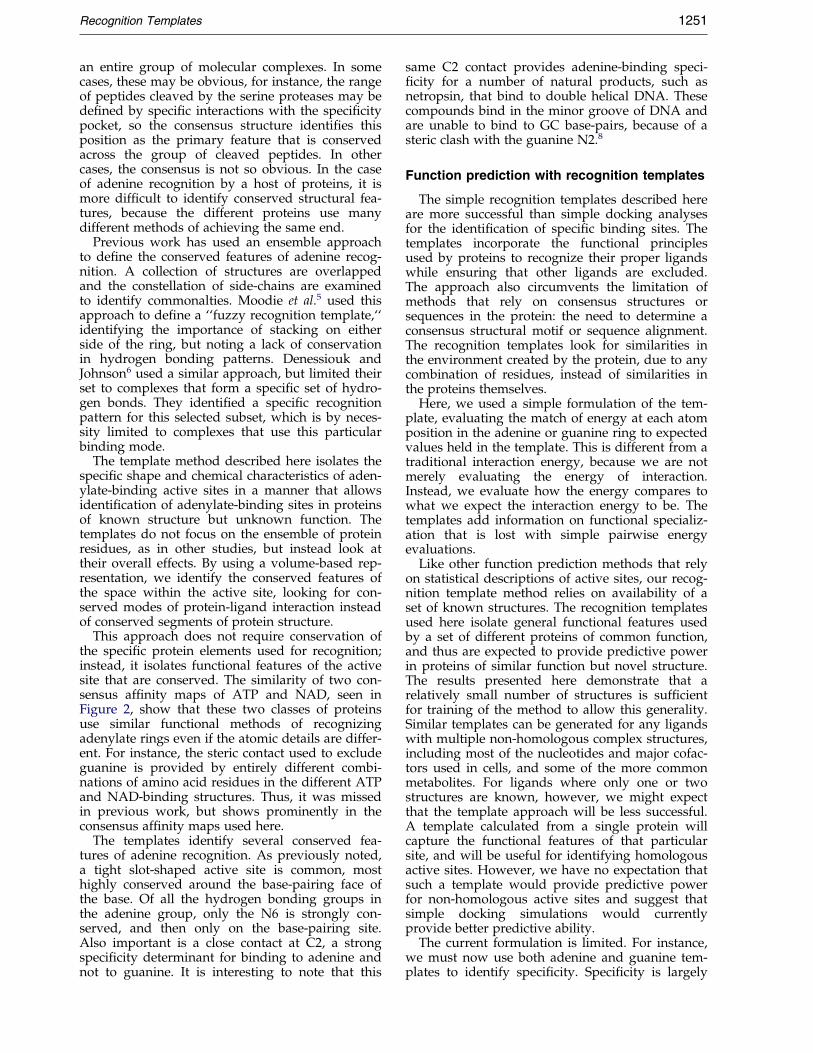
Figure 6. Recognition templates for prediction ofadenylate-binding sites. (a) The adenylate and guanylaterecognition templates are docked to each of the 31 pro-tein structures in the NAD test set, using the normalizedEulerian distance as the target function. Points representbest positioning of templates within each of the proteinstructures, with the scores of the adenylate recognitiontemplate on the horizontal axis and the scores of theguanylate recognition template on the vertical axis.(b) Traditional docking of adenylate and guanylate toproteins in the NAD test set. Points are the interactionenergies (Kcal/mol) of the lowest-energy conformationfor adenylate (horizontal axis) and guanylate (verticalaxis) docked to each of the protein structures.
1250 Recognition Templates
In a second experiment, we performed an Auto-Dock conformational search to evaluate the abilityof the templates to ®nd unknown binding sites.For each of the NAD-binding proteins, we dockedthe template to the protein structure. As describedin Methods, the AutoDock software was modi®edto optimize the normalized Eulerian distance of thetemplate values to the af®nity values in the proteinduring the conformational search. We comparedthis to a traditional docking search using inter-action energies as the target function. A compari-son of the results is presented in Figure 6 andTable 1.
For prediction of the bound position of adeninewithin an active site, Table 1 shows that the tem-plate docking performs somewhat better than tra-ditional docking using a simple interaction energy.However, Figure 6 shows the real advantage of thetemplates over traditional docking: the templatesprovide far better discrimination, cleanly separ-ating speci®c binding of ligands from non-speci®cbinding of competing ligands. Traditional dockingusing interaction energies as the target function,shown in Figure 6(b), shows little speci®city; tra-ditional docking of adenine and docking of gua-nine both yield similar results. The points inFigure 6(b) fall roughly along the diagonal, withthe adenine binding slightly better in some cases.But using the recognition templates as the scoringfunction, Figure 6(a), clearly shows these proteinsto be adenine-speci®c. The points cluster strongly,with favorable values for the adenine template andvalues three to four times worse for the guaninetemplate. Thus, traditional interaction energies areable to identify sites that bind adenine, but the rec-ognition templates are able to identify sites thatbind adenine speci®cally.
Discussion
Consensus affinity maps andmolecular recognition
As scientists, we often seek an underlying prin-ciple to explain an entire body of observations. Inmolecular recognition, this often takes the form ofa consensus structure, which captures the con-served structural features that are important across
Recognition Templates 1251
an entire group of molecular complexes. In somecases, these may be obvious, for instance, the rangeof peptides cleaved by the serine proteases may bede®ned by speci®c interactions with the speci®citypocket, so the consensus structure identi®es thisposition as the primary feature that is conservedacross the group of cleaved peptides. In othercases, the consensus is not so obvious. In the caseof adenine recognition by a host of proteins, it ismore dif®cult to identify conserved structural fea-tures, because the different proteins use manydifferent methods of achieving the same end.
Previous work has used an ensemble approachto de®ne the conserved features of adenine recog-nition. A collection of structures are overlappedand the constellation of side-chains are examinedto identify commonalties. Moodie et al.5 used thisapproach to de®ne a ``fuzzy recognition template,``identifying the importance of stacking on eitherside of the ring, but noting a lack of conservationin hydrogen bonding patterns. Denessiouk andJohnson6 used a similar approach, but limited theirset to complexes that form a speci®c set of hydro-gen bonds. They identi®ed a speci®c recognitionpattern for this selected subset, which is by neces-sity limited to complexes that use this particularbinding mode.
The template method described here isolates thespeci®c shape and chemical characteristics of aden-ylate-binding active sites in a manner that allowsidenti®cation of adenylate-binding sites in proteinsof known structure but unknown function. Thetemplates do not focus on the ensemble of proteinresidues, as in other studies, but instead look attheir overall effects. By using a volume-based rep-resentation, we identify the conserved features ofthe space within the active site, looking for con-served modes of protein-ligand interaction insteadof conserved segments of protein structure.
This approach does not require conservation ofthe speci®c protein elements used for recognition;instead, it isolates functional features of the activesite that are conserved. The similarity of two con-sensus af®nity maps of ATP and NAD, seen inFigure 2, show that these two classes of proteinsuse similar functional methods of recognizingadenylate rings even if the atomic details are differ-ent. For instance, the steric contact used to excludeguanine is provided by entirely different combi-nations of amino acid residues in the different ATPand NAD-binding structures. Thus, it was missedin previous work, but shows prominently in theconsensus af®nity maps used here.
The templates identify several conserved fea-tures of adenine recognition. As previously noted,a tight slot-shaped active site is common, mosthighly conserved around the base-pairing face ofthe base. Of all the hydrogen bonding groups inthe adenine group, only the N6 is strongly con-served, and then only on the base-pairing site.Also important is a close contact at C2, a strongspeci®city determinant for binding to adenine andnot to guanine. It is interesting to note that this
same C2 contact provides adenine-binding speci-®city for a number of natural products, such asnetropsin, that bind to double helical DNA. Thesecompounds bind in the minor groove of DNA andare unable to bind to GC base-pairs, because of asteric clash with the guanine N2.8
Function prediction with recognition templates
The simple recognition templates described hereare more successful than simple docking analysesfor the identi®cation of speci®c binding sites. Thetemplates incorporate the functional principlesused by proteins to recognize their proper ligandswhile ensuring that other ligands are excluded.The approach also circumvents the limitation ofmethods that rely on consensus structures orsequences in the protein: the need to determine aconsensus structural motif or sequence alignment.The recognition templates look for similarities inthe environment created by the protein, due to anycombination of residues, instead of similarities inthe proteins themselves.
Here, we used a simple formulation of the tem-plate, evaluating the match of energy at each atomposition in the adenine or guanine ring to expectedvalues held in the template. This is different from atraditional interaction energy, because we are notmerely evaluating the energy of interaction.Instead, we evaluate how the energy compares towhat we expect the interaction energy to be. Thetemplates add information on functional specializ-ation that is lost with simple pairwise energyevaluations.
Like other function prediction methods that relyon statistical descriptions of active sites, our recog-nition template method relies on availability of aset of known structures. The recognition templatesused here isolate general functional features usedby a set of different proteins of common function,and thus are expected to provide predictive powerin proteins of similar function but novel structure.The results presented here demonstrate that arelatively small number of structures is suf®cientfor training of the method to allow this generality.Similar templates can be generated for any ligandswith multiple non-homologous complex structures,including most of the nucleotides and major cofac-tors used in cells, and some of the more commonmetabolites. For ligands where only one or twostructures are known, however, we might expectthat the template approach will be less successful.A template calculated from a single protein willcapture the functional features of that particularsite, and will be useful for identifying homologousactive sites. However, we have no expectation thatsuch a template would provide predictive powerfor non-homologous active sites and suggest thatsimple docking simulations would currentlyprovide better predictive ability.
The current formulation is limited. For instance,we must now use both adenine and guanine tem-plates to identify speci®city. Speci®city is largely
1252 Recognition Templates
determined by the tight steric contacts at the C2position. This is not included in our current ade-nine template, but is seen when the guanine tem-plate is docked to adenine-binding sites. Thetemplates could be markedly improved by includ-ing portions that surround the adenine ring. Anideal template would include both the region con-taining the adenine atoms and the region thatincludes the surrounding protein. Thus, instead ofjust requiring the atom positions to have theexpected values, we would also require that theprotein surrounds the ring in the proper, conservedareas. This would remove the need for use of bothadenine and guanine templates for proper predic-tion, because all of the speci®city informationwould be captured in the adenine template.
Preliminary experiments using extended tem-plates have shown that there are signi®cant dif®-culties to overcome. We have performed a numberof experiments using a selection of points sur-rounding the ligand. A simple approach is to useall points within 3 AÊ of any ligand atom. A moresophisticated approach is to use all points withsmall standard deviations in the consensus af®nitymaps, isolating those regions with features that arestrongly conserved across the maps. Unfortunately,these experiments have yielded poor results in pre-diction experiments (data not shown).
The poor performance is a consequence of theenergy functions used for evaluation of the inter-action energy. The dispersion/repulsion energyhas very high values at distances close to proteinatoms, which rise very steeply with small changesin distance. Thus, the energies of the surroundingpoints in an extended template can have widelydifferent values, all large and positive. The actualvalues of these points are really of little import-ance, only the fact that they are unfavorable is rel-evant. But, when the comparison is made duringdocking experiments with these extendedtemplates, the large differences in these valuesdominate the evaluation function, swamping outthe more important, but smaller, effects in thefavorable regions.
Future work will focus on developing other for-mulations of the template to deal with this pro-blem. Clamped versions of the map, with all largevalues clamped or scaled to low values, may pro-vide a viable approach. Minimum and maximumfunctions, such as that used to create Figure 4,may also provide better matching properties.A template that includes the minimum value ateach point, when contoured at a high value of10 kcal/mol or so, will identify regions that arealways unfavorable, and might be used to identifyconserved regions of protein steric contact, suchas the conserved protein contact at adenine C2.A maximum map, when contoured at a low value,
{ Available online at http://www.pdb.org{ Available online at http://www.ncbi.nlm.nih.gov/
BLAST
will identify regions that are always favorable,identifying features such as hydrogen bonds thatare always present. By careful combination of thesedifferent features within a recognition template,robust prediction will become a reality.
Methods
Generation of the non-homologous dataset
We created three separate databases of non-homolo-gous structures based on structures from the ProteinData Bank{ released before September 2000. Two train-ing sets were created, one containing complexes withadenosine nucleotides and the other containing guano-sine nucleotides. A test set was also created, includingcomplexes with NAD and FAD dinucleotides and theirderivatives.
Initial screening of structures identi®ed entries withligands of interest, including residue labels AMP, ADPand ATP for the adenine training set; GMP, GDP, GTP,GNP and GSP for the guanine training set; and FAD,NAD, NDP and NAP for the dinucleotide test set.A small number of structures with several differentadenine or guanine nucleotides, such as 1mab whichcontains both ADP and ATP, were omitted at this initialstep. We included structures with other additionalligands if the ligands were greater than 10 AÊ from anyatom in the purine ring. This ensures that the recognitiontemplates correspond to protein recognition and notligand-ligand interaction.
We next ®ltered the database to obtain a set ofhigh-quality structures. Entries were omitted that con-tain: any chain with unknown sequence; any con¯ictsbetween SEQRES and ATOM records; DNA com-plexes; resolution lower than 2.8 AÊ ; any chain withnon-standard residues or missing residues; or chainswith only alpha carbon atoms or with greater than5 % of atom coordinates missing. About half of theentries were removed at this step.
We then ®ltered the database to determine the ligandto be used for analysis. In many cases, the structureswere oligomeric, with several identical binding sites. Weuniformly chose the ®rst ligand in the ®le for furtheranalysis. We omitted structures with binding sites thatplace two or more purine rings in contact, using thesame criterion of 10 AÊ used above. We also omittedstructures with only weak contact between protein andpurine ring, by counting the number of protein residuesin contact with the ring. If any atom in a given aminoacid was within 4 AÊ of any purine atom, the residue wasconsidered to be in contact with the ring. Complexeswith three or less residues in contact were omitted.
Finally, we screened the database for structural hom-ology, using the BLAST sequence database search pro-gram{. For entries with greater than 30% structuralhomology, the structure of highest resolution wasretained for analysis. The ®nal database, shown inTable 2, includes 16 complexes with adenosine nucleo-tides (``ATP'' set), nine complexes with guanosinenucleotides (``GTP'' set), and 31 structures in the dinu-cleotide test set (``NAD'' set).
Calculation of consensus affinity maps
To calculate the af®nity grid for a single protein, weembed the active site within a three-dimensional gridand then place a probe atom successively at each grid
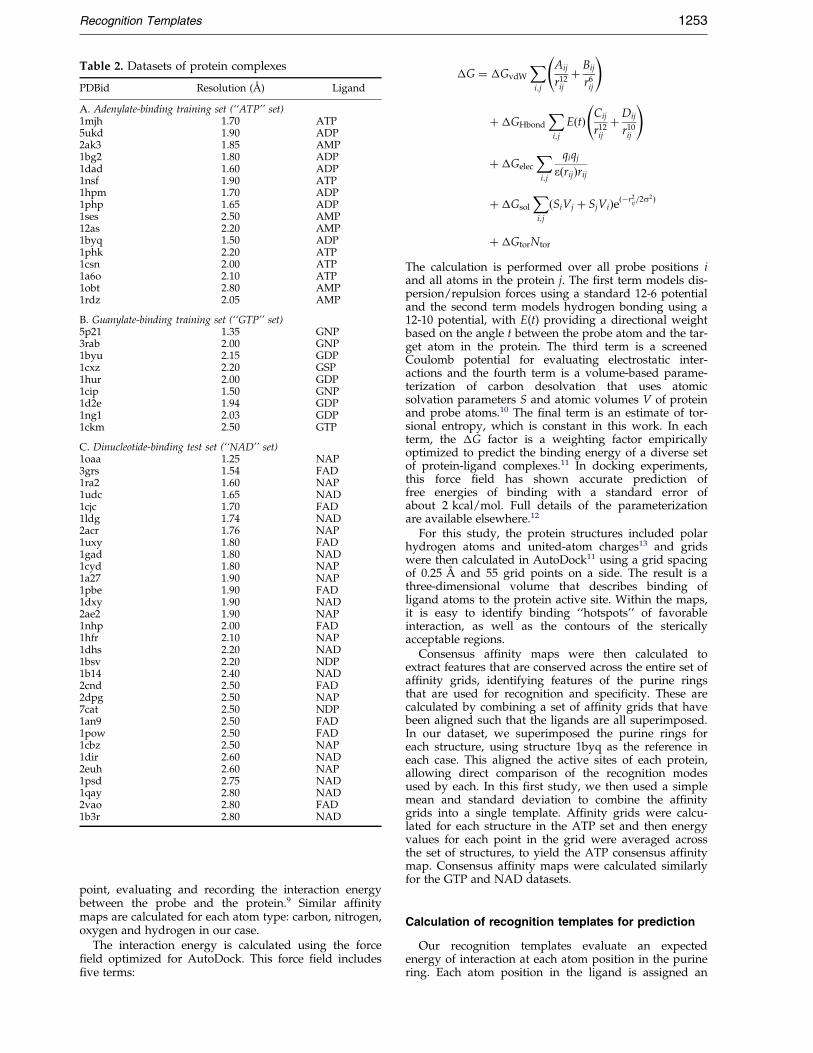
Table 2. Datasets of protein complexes
PDBid Resolution (AÊ ) Ligand
A. Adenylate-binding training set (``ATP'' set)1mjh 1.70 ATP5ukd 1.90 ADP2ak3 1.85 AMP1bg2 1.80 ADP1dad 1.60 ADP1nsf 1.90 ATP1hpm 1.70 ADP1php 1.65 ADP1ses 2.50 AMP12as 2.20 AMP1byq 1.50 ADP1phk 2.20 ATP1csn 2.00 ATP1a6o 2.10 ATP1obt 2.80 AMP1rdz 2.05 AMP
B. Guanylate-binding training set (``GTP'' set)5p21 1.35 GNP3rab 2.00 GNP1byu 2.15 GDP1cxz 2.20 GSP1hur 2.00 GDP1cip 1.50 GNP1d2e 1.94 GDP1ng1 2.03 GDP1ckm 2.50 GTP
C. Dinucleotide-binding test set (``NAD'' set)1oaa 1.25 NAP3grs 1.54 FAD1ra2 1.60 NAP1udc 1.65 NAD1cjc 1.70 FAD1ldg 1.74 NAD2acr 1.76 NAP1uxy 1.80 FAD1gad 1.80 NAD1cyd 1.80 NAP1a27 1.90 NAP1pbe 1.90 FAD1dxy 1.90 NAD2ae2 1.90 NAP1nhp 2.00 FAD1hfr 2.10 NAP1dhs 2.20 NAD1bsv 2.20 NDP1b14 2.40 NAD2cnd 2.50 FAD2dpg 2.50 NAP7cat 2.50 NDP1an9 2.50 FAD1pow 2.50 FAD1cbz 2.50 NAP1dir 2.60 NAD2euh 2.60 NAP1psd 2.75 NAD1qay 2.80 NAD2vao 2.80 FAD1b3r 2.80 NAD
Recognition Templates 1253
point, evaluating and recording the interaction energybetween the probe and the protein.9 Similar af®nitymaps are calculated for each atom type: carbon, nitrogen,oxygen and hydrogen in our case.
The interaction energy is calculated using the force®eld optimized for AutoDock. This force ®eld includes®ve terms:
�G � �GvdW
Xi;j
Aij
r12ij
� Bij
r6ij
!
��GHbond
Xi;j
E�t� Cij
r12ij
�Dij
r10ij
!
��Gelec
Xi;j
qiqj
e�rij�rij
��Gsol
Xi;j
�SiVj � SjVi�e�ÿr2ij=2s2�
��GtorNtor
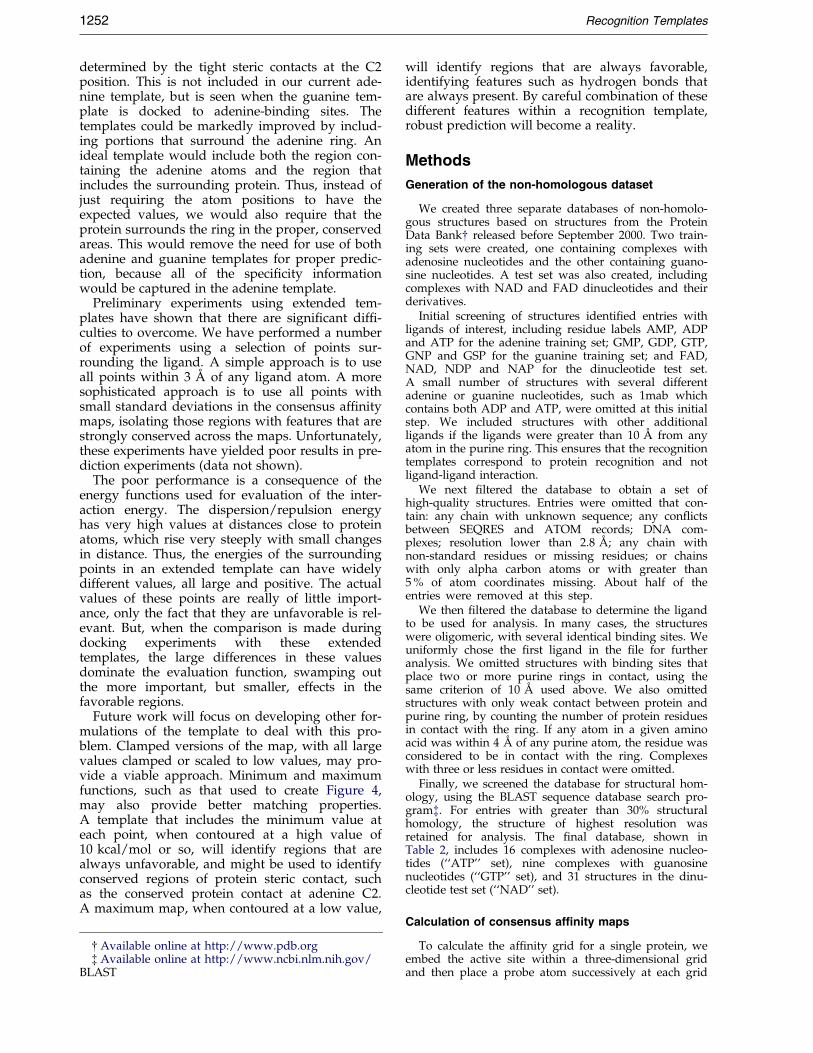
The calculation is performed over all probe positions iand all atoms in the protein j. The ®rst term models dis-persion/repulsion forces using a standard 12-6 potentialand the second term models hydrogen bonding using a12-10 potential, with E(t) providing a directional weightbased on the angle t between the probe atom and the tar-get atom in the protein. The third term is a screenedCoulomb potential for evaluating electrostatic inter-actions and the fourth term is a volume-based parame-terization of carbon desolvation that uses atomicsolvation parameters S and atomic volumes V of proteinand probe atoms.10 The ®nal term is an estimate of tor-sional entropy, which is constant in this work. In eachterm, the �G factor is a weighting factor empiricallyoptimized to predict the binding energy of a diverse setof protein-ligand complexes.11 In docking experiments,this force ®eld has shown accurate prediction offree energies of binding with a standard error ofabout 2 kcal/mol. Full details of the parameterizationare available elsewhere.12
For this study, the protein structures included polarhydrogen atoms and united-atom charges13 and gridswere then calculated in AutoDock11 using a grid spacingof 0.25 AÊ and 55 grid points on a side. The result is athree-dimensional volume that describes binding ofligand atoms to the protein active site. Within the maps,it is easy to identify binding ``hotspots'' of favorableinteraction, as well as the contours of the stericallyacceptable regions.
Consensus af®nity maps were then calculated toextract features that are conserved across the entire set ofaf®nity grids, identifying features of the purine ringsthat are used for recognition and speci®city. These arecalculated by combining a set of af®nity grids that havebeen aligned such that the ligands are all superimposed.In our dataset, we superimposed the purine rings foreach structure, using structure 1byq as the reference ineach case. This aligned the active sites of each protein,allowing direct comparison of the recognition modesused by each. In this ®rst study, we then used a simplemean and standard deviation to combine the af®nitygrids into a single template. Af®nity grids were calcu-lated for each structure in the ATP set and then energyvalues for each point in the grid were averaged acrossthe set of structures, to yield the ATP consensus af®nitymap. Consensus af®nity maps were calculated similarlyfor the GTP and NAD datasets.
Calculation of recognition templates for prediction
Our recognition templates evaluate an expectedenergy of interaction at each atom position in the purinering. Each atom position in the ligand is assigned an
1254 Recognition Templates
expected energy equal to the local value of the energy inthe consensus af®nity grids described. Twelve atomicpositions are included in the adenylate template and 14atomic positions are included in the guanylate template,including all heavy atoms and all polar hydrogen atoms(note: non-polar C8 hydrogen atoms and adenineHC2 are shown in Figure 1, but are not included in thetemplate).
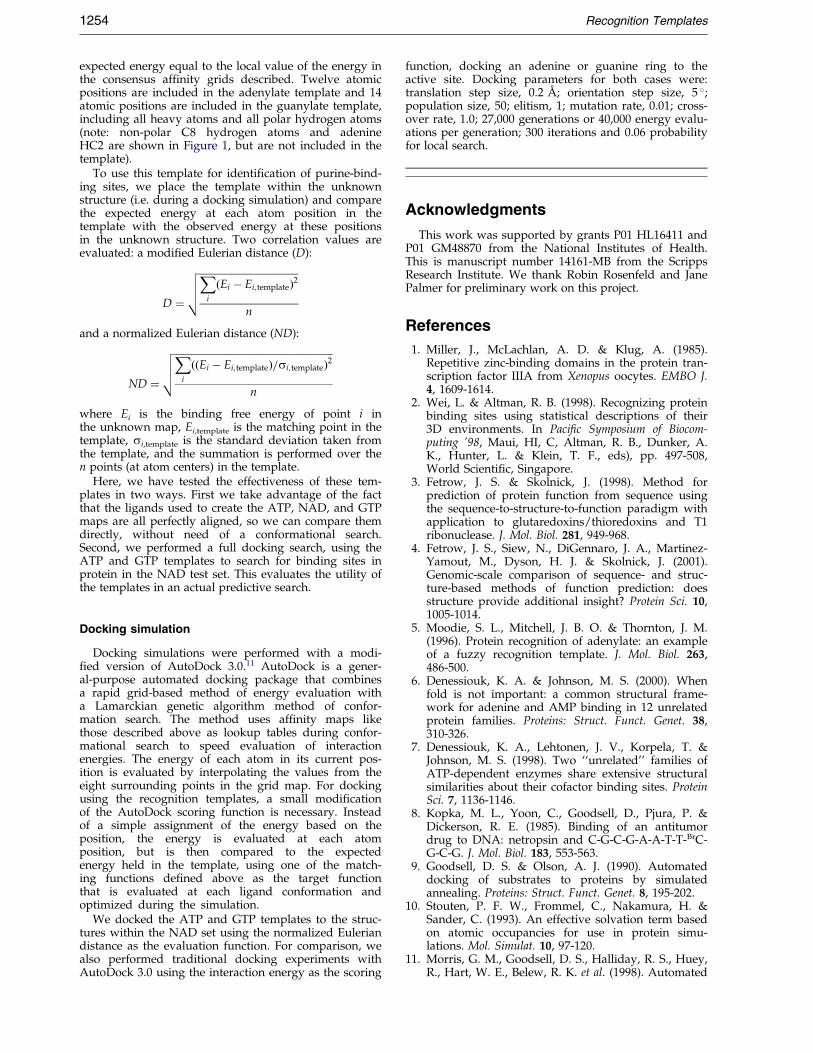
To use this template for identi®cation of purine-bind-ing sites, we place the template within the unknownstructure (i.e. during a docking simulation) and comparethe expected energy at each atom position in thetemplate with the observed energy at these positionsin the unknown structure. Two correlation values areevaluated: a modi®ed Eulerian distance (D):
D �
����������������������������������������Xi
�Ei ÿ Ei;template�2
n
vuutand a normalized Eulerian distance (ND):
ND �
����������������������������������������������������������������Xi
��Ei ÿ Ei;template�=si;template�2
n
vuutwhere Ei is the binding free energy of point i inthe unknown map, Ei,template is the matching point in thetemplate, si,template is the standard deviation taken fromthe template, and the summation is performed over then points (at atom centers) in the template.
Here, we have tested the effectiveness of these tem-plates in two ways. First we take advantage of the factthat the ligands used to create the ATP, NAD, and GTPmaps are all perfectly aligned, so we can compare themdirectly, without need of a conformational search.Second, we performed a full docking search, using theATP and GTP templates to search for binding sites inprotein in the NAD test set. This evaluates the utility ofthe templates in an actual predictive search.
Docking simulation
Docking simulations were performed with a modi-®ed version of AutoDock 3.0.11 AutoDock is a gener-al-purpose automated docking package that combinesa rapid grid-based method of energy evaluation witha Lamarckian genetic algorithm method of confor-mation search. The method uses af®nity maps likethose described above as lookup tables during confor-mational search to speed evaluation of interactionenergies. The energy of each atom in its current pos-ition is evaluated by interpolating the values from theeight surrounding points in the grid map. For dockingusing the recognition templates, a small modi®cationof the AutoDock scoring function is necessary. Insteadof a simple assignment of the energy based on theposition, the energy is evaluated at each atomposition, but is then compared to the expectedenergy held in the template, using one of the match-ing functions de®ned above as the target functionthat is evaluated at each ligand conformation andoptimized during the simulation.
We docked the ATP and GTP templates to the struc-tures within the NAD set using the normalized Euleriandistance as the evaluation function. For comparison, wealso performed traditional docking experiments withAutoDock 3.0 using the interaction energy as the scoring
function, docking an adenine or guanine ring to theactive site. Docking parameters for both cases were:translation step size, 0.2 AÊ ; orientation step size, 5 �;population size, 50; elitism, 1; mutation rate, 0.01; cross-over rate, 1.0; 27,000 generations or 40,000 energy evalu-ations per generation; 300 iterations and 0.06 probabilityfor local search.
Acknowledgments
This work was supported by grants P01 HL16411 andP01 GM48870 from the National Institutes of Health.This is manuscript number 14161-MB from the ScrippsResearch Institute. We thank Robin Rosenfeld and JanePalmer for preliminary work on this project.
References
1. Miller, J., McLachlan, A. D. & Klug, A. (1985).Repetitive zinc-binding domains in the protein tran-scription factor IIIA from Xenopus oocytes. EMBO J.4, 1609-1614.
2. Wei, L. & Altman, R. B. (1998). Recognizing proteinbinding sites using statistical descriptions of their3D environments. In Paci®c Symposium of Biocom-puting '98, Maui, HI, C, Altman, R. B., Dunker, A.K., Hunter, L. & Klein, T. F., eds), pp. 497-508,World Scienti®c, Singapore.
3. Fetrow, J. S. & Skolnick, J. (1998). Method forprediction of protein function from sequence usingthe sequence-to-structure-to-function paradigm withapplication to glutaredoxins/thioredoxins and T1ribonuclease. J. Mol. Biol. 281, 949-968.
4. Fetrow, J. S., Siew, N., DiGennaro, J. A., Martinez-Yamout, M., Dyson, H. J. & Skolnick, J. (2001).Genomic-scale comparison of sequence- and struc-ture-based methods of function prediction: doesstructure provide additional insight? Protein Sci. 10,1005-1014.
5. Moodie, S. L., Mitchell, J. B. O. & Thornton, J. M.(1996). Protein recognition of adenylate: an exampleof a fuzzy recognition template. J. Mol. Biol. 263,486-500.
6. Denessiouk, K. A. & Johnson, M. S. (2000). Whenfold is not important: a common structural frame-work for adenine and AMP binding in 12 unrelatedprotein families. Proteins: Struct. Funct. Genet. 38,310-326.
7. Denessiouk, K. A., Lehtonen, J. V., Korpela, T. &Johnson, M. S. (1998). Two ``unrelated'' families ofATP-dependent enzymes share extensive structuralsimilarities about their cofactor binding sites. ProteinSci. 7, 1136-1146.
8. Kopka, M. L., Yoon, C., Goodsell, D., Pjura, P. &Dickerson, R. E. (1985). Binding of an antitumordrug to DNA: netropsin and C-G-C-G-A-A-T-T-BrC-G-C-G. J. Mol. Biol. 183, 553-563.
9. Goodsell, D. S. & Olson, A. J. (1990). Automateddocking of substrates to proteins by simulatedannealing. Proteins: Struct. Funct. Genet. 8, 195-202.
10. Stouten, P. F. W., Frommel, C., Nakamura, H. &Sander, C. (1993). An effective solvation term basedon atomic occupancies for use in protein simu-lations. Mol. Simulat. 10, 97-120.
11. Morris, G. M., Goodsell, D. S., Halliday, R. S., Huey,R., Hart, W. E., Belew, R. K. et al. (1998). Automated
Recognition Templates 1255
docking using a Lamarckian genetic algorithm andan empirical binding free energy function. J. Comput.Chem. 19, 1639-1662.
12. Morris, G. M., Goodsell, D. S., Huey, R. & Olson,A. J. (1996). Distributed automated docking of ¯ex-ible ligands to proteins: parallel applications ofAutoDock 2.4. J. Comput. Aided Mol. Des., 10, 293-304.
13. Weiner, S. J., Kollman, P. A., Case, D. A., Singh,U. C., Ghio, C., Alagona, G. et al (1984). A new
force ®eld for molecular mechanical simulation of
nucleic acids and proteins. J. Am. Chem. Soc. 106,
765-784.
14. Upson, C., Faulhaber, T. J., Kamins, D., Laidlaw, D.,
Schlegel, D., Vroom, J. et al (1989). The application
visualization System: a computational environment
for scienti®c visualization. IEEE Comput. Graph.
Appl. 9, 30-42.
Edited by G. van Heijne
(Received 18 July 2001; received in revised form 22 October 2001; accepted 23 October 2001)
Recommended