Recent Trends in Unemployment Duration
Tracy Shaleen, Economist
The Great Recession’s severity is clearly reflected in two of New Mexico’s most prominent economic indicators:
seasonally adjusted nonfarm payroll employment, which tumbled 6.0 percent from a series-high 850,200 in April 2008 to
a 68-month low 799,500 in September 2010, and the seasonally adjusted unemployment rate, which swelled 135
percent from a series-low 3.4 percent for March through May 2007 to a more than 23-year high 8.0 percent for June
through October 2010. As the economy stalled and job losses mounted, displaced workers faced increased competition
for fewer employment opportunities. Not surprisingly, unemployment duration—the number of weeks individuals are
classified as unemployed—increased sharply over the past several years and has only recently shown signs of finally
peaking and beginning to drift slowly downward. This article, which updates and expands on analysis presented in the
July 2011 Labor Market Review, describes recent trends in unemployment duration data using estimates from the
Bureau of Labor Statistics’ Current Population Survey (CPS). The data are presented as annual averages to increase the
reliability of estimates and eliminate the effects of seasonality.
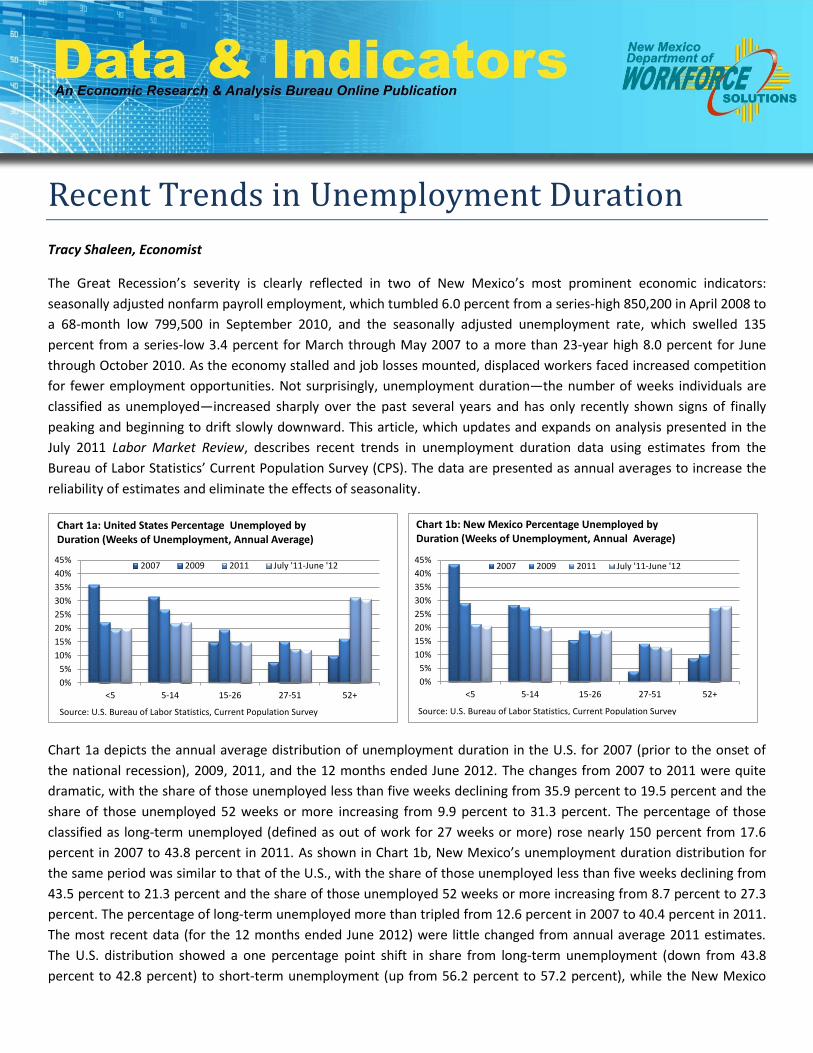
Chart 1a depicts the annual average distribution of unemployment duration in the U.S. for 2007 (prior to the onset of
the national recession), 2009, 2011, and the 12 months ended June 2012. The changes from 2007 to 2011 were quite
dramatic, with the share of those unemployed less than five weeks declining from 35.9 percent to 19.5 percent and the
share of those unemployed 52 weeks or more increasing from 9.9 percent to 31.3 percent. The percentage of those
classified as long-term unemployed (defined as out of work for 27 weeks or more) rose nearly 150 percent from 17.6
percent in 2007 to 43.8 percent in 2011. As shown in Chart 1b, New Mexico’s unemployment duration distribution for
the same period was similar to that of the U.S., with the share of those unemployed less than five weeks declining from
43.5 percent to 21.3 percent and the share of those unemployed 52 weeks or more increasing from 8.7 percent to 27.3
percent. The percentage of long-term unemployed more than tripled from 12.6 percent in 2007 to 40.4 percent in 2011.
The most recent data (for the 12 months ended June 2012) were little changed from annual average 2011 estimates.
The U.S. distribution showed a one percentage point shift in share from long-term unemployment (down from 43.8
percent to 42.8 percent) to short-term unemployment (up from 56.2 percent to 57.2 percent), while the New Mexico
0%
5%
10%
15%
20%
25%
30%
35%
40%
45%
<5 5-14 15-26 27-51 52+
Chart 1a: United States Percentage Unemployed by Duration (Weeks of Unemployment, Annual Average)
2007 2009 2011 July '11-June '12
Source: U.S. Bureau of Labor Statistics, Current Population Survey
0%
5%
10%
15%
20%
25%
30%
35%
40%
45%
<5 5-14 15-26 27-51 52+
Chart 1b: New Mexico Percentage Unemployed by Duration (Weeks of Unemployment, Annual Average)
2007 2009 2011 July '11-June '12
Source: U.S. Bureau of Labor Statistics, Current Population Survey
2
distribution shifted just one-tenth of a point in the opposite direction, from short-term unemployment (down from 59.6
percent to 59.5 percent) to long-term unemployment (up from 40.4 percent to 40.5 percent).
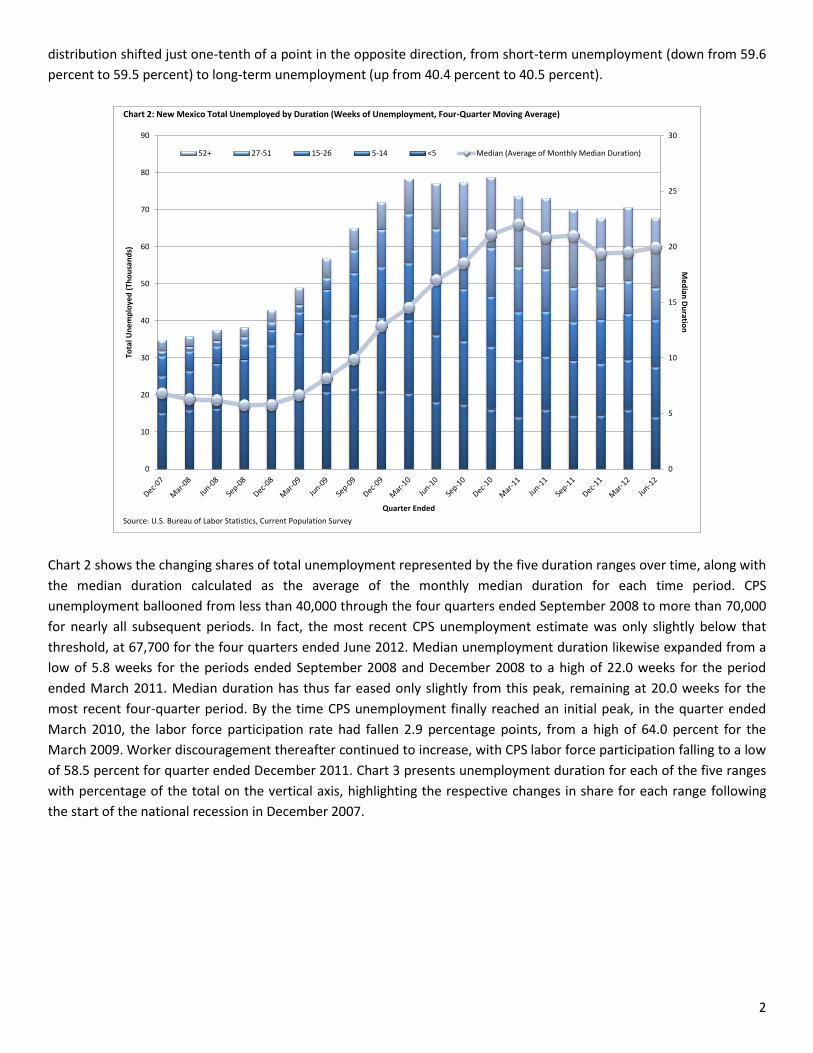
Chart 2 shows the changing shares of total unemployment represented by the five duration ranges over time, along with
the median duration calculated as the average of the monthly median duration for each time period. CPS
unemployment ballooned from less than 40,000 through the four quarters ended September 2008 to more than 70,000
for nearly all subsequent periods. In fact, the most recent CPS unemployment estimate was only slightly below that
threshold, at 67,700 for the four quarters ended June 2012. Median unemployment duration likewise expanded from a
low of 5.8 weeks for the periods ended September 2008 and December 2008 to a high of 22.0 weeks for the period
ended March 2011. Median duration has thus far eased only slightly from this peak, remaining at 20.0 weeks for the
most recent four-quarter period. By the time CPS unemployment finally reached an initial peak, in the quarter ended
March 2010, the labor force participation rate had fallen 2.9 percentage points, from a high of 64.0 percent for the
March 2009. Worker discouragement thereafter continued to increase, with CPS labor force participation falling to a low
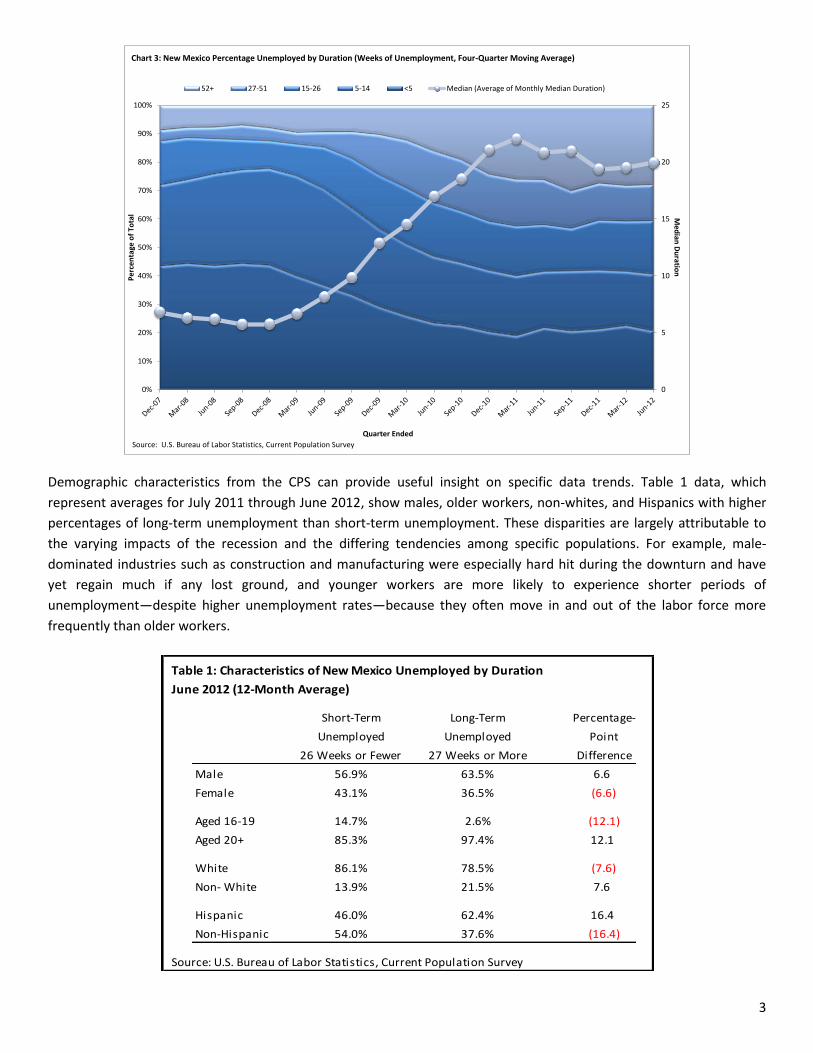
of 58.5 percent for quarter ended December 2011. Chart 3 presents unemployment duration for each of the five ranges
with percentage of the total on the vertical axis, highlighting the respective changes in share for each range following
the start of the national recession in December 2007.
0
5
10
15
20
25
30
0
10
20
30
40
50
60
70
80
90M
ed
ian D
uratio
nTo
tal U
ne
mp
loye
d (
Tho
usa
nd
s)
Quarter Ended
Chart 2: New Mexico Total Unemployed by Duration (Weeks of Unemployment, Four-Quarter Moving Average)
52+ 27-51 15-26 5-14 <5 Median (Average of Monthly Median Duration)
Source: U.S. Bureau of Labor Statistics, Current Population Survey
3
Demographic characteristics from the CPS can provide useful insight on specific data trends. Table 1 data, which
represent averages for July 2011 through June 2012, show males, older workers, non-whites, and Hispanics with higher
percentages of long-term unemployment than short-term unemployment. These disparities are largely attributable to
the varying impacts of the recession and the differing tendencies among specific populations. For example, male-
dominated industries such as construction and manufacturing were especially hard hit during the downturn and have
yet regain much if any lost ground, and younger workers are more likely to experience shorter periods of
unemployment—despite higher unemployment rates—because they often move in and out of the labor force more
frequently than older workers.
0
5
10
15
20
25
0%
10%
20%
30%
40%
50%
60%
70%
80%
90%
100%
Me
dian
Du
ration
Pe
rce
nta
ge o
f To
tal
Quarter Ended
Chart 3: New Mexico Percentage Unemployed by Duration (Weeks of Unemployment, Four-Quarter Moving Average)
52+ 27-51 15-26 5-14 <5 Median (Average of Monthly Median Duration)
Source: U.S. Bureau of Labor Statistics, Current Population Survey
Table 1: Characteristics of New Mexico Unemployed by Duration
June 2012 (12-Month Average)
Short-Term Long-Term Percentage-
Unemployed Unemployed Point
26 Weeks or Fewer 27 Weeks or More Difference
Male 56.9% 63.5% 6.6
Female 43.1% 36.5% (6.6)
Aged 16-19 14.7% 2.6% (12.1)
Aged 20+ 85.3% 97.4% 12.1
White 86.1% 78.5% (7.6)
Non- White 13.9% 21.5% 7.6
Hispanic 46.0% 62.4% 16.4
Non-Hispanic 54.0% 37.6% (16.4)
Source: U.S. Bureau of Labor Statistics, Current Population Survey
4
Unemployment duration in New Mexico remains significantly elevated three full years after the national recession
officially ended, reflecting the state’s massive job loss and so-far muted recovery. As the pace of expansion increases,
job growth will return to more typical levels, and labor market conditions will improve for job seekers. The long-term
unemployed, however, will likely continue facing hardships the short-term unemployed do not. Some may have
experienced skills erosion, making it difficult to compete in the ever-changing job market, and even otherwise qualified
candidates may struggle to overcome the stigma some prospective employers associate with prolonged joblessness.
Because high unemployment duration has persisted so long (more at the national level than in New Mexico), economists
are debating the extent to which its causes are structural (prompted primarily by the skills mismatch mentioned above)
versus cyclical (resulting from the business cycle). The relative impact of these factors will become clearer as the
economy gains strength, and the Economic Research and Analysis Bureau (ER&A) will continue to monitor available data
on unemployment duration and report on evolving trends.
Recommended