Real Estate UpdatePortfolio Presentation for IAC
November 16, 2016

AgendaI. U.S. Real Estate Market Conditions
II. Fundamental Investment Approach
III. Real Estate Allocation Overview
IV. Non-Core Real Estate Non-Core Thesis Performance
V. Core Real Estate Core Thesis Private Core Performance REITs Performance Core Transition Plan
VI. Leverage
VII. Fees
VIII. Discussion Topics Investing Within Statutory Allocation Limits International Exposure

U.S. Real Estate Market Conditions• Fundamentals are healthy despite lackluster U.S. growth• Pricing remains strong and cap rates are flattening out in most sectors/markets• Capital inflows to real estate are robust, but investors are moving cautiously• Regulatory changes and debt market conditions are limiting the availability of credit
• Supply is a headwind, but vacancy remains lowMultifamily• Tech driven demand; absorption/rent respectable despite decelerating job growthOffice• Experiential and needs-based performing well; low-quality malls/strip centers struggling Retail• E-commerce demand is a boon for rents and valuations, particularly infill and last mile Industrial• Dealing with CBD supply indigestion; fundamentals and values market-specificHotel

Fundamental Investment Approach
• Downside protection• Eye toward current income for core or speed to income for opportunistic strategies• Moderate leverage levels
Stay the course with our investment strategy…do not
reach for yield
• Stabilize Core portfolio• Diversify by strategy, property sector and location• Balance asset risk and market risk by insisting on the highest asset quality and location• Target specific submarkets and streets
Use thoughtful & deliberate portfolio construction
• Better terms & fees• More transparency and control• Ability to move quickly to capitalize on opportunities & dislocations• Be the founding investor for new strategies
Leverage the size of our plan & skill set of our team
• Separate accounts• Multiple strategies with single manager• Fee benefits
Invest meaningful amounts with fewer best-in-class
managers
• Be involved, be nimble and follow through• Deliver results• Be a leader among LPs
Take a long-term view toward investments and manager relationships
Real Estate Allocation Overview
Strategic policy transition to 5% Core achieved, while maintaining tactical overweight to Non-Core.
4.3%
2.7%
1.0%
0.6%
4.9%4.2%
0.7%
0.0%
1.0%
2.0%
3.0%
4.0%
5.0%
6.0%
7.0%
8.0%
9.0%
10.0%
1 2 3 4
% o
f Pla
n
REITs
Private Core
SpecialSituations
Value Add
Opportunistic
Legislative Cap for RE as % of Total Plan: 10.0%
Policy Target as % of Total Plan: 8.0%
SubstrategyStrategy
Core
Non-Core
Valuation as of 9/30/16
4.4% 4.3% 4.0%
3.5%4.6% 5.6%
7.9%
8.9%
9.6%
0.0%
1.0%
2.0%
3.0%
4.0%
5.0%
6.0%
7.0%
8.0%
9.0%
10.0%
11.0%
4Q14 4Q15 4Q16
Historical Forecast
% o
f Pla
n
Core Non-Core

Non-Core Thesis“To achieve attractive risk-adjusted net returns through appreciation and income from a diversified portfolio, planning for strategic exit optionality”
OfficeChicago, IL
HotelMiami Beach, FL
ApartmentJersey City, NJ
Mixed-useBrooklyn, NY
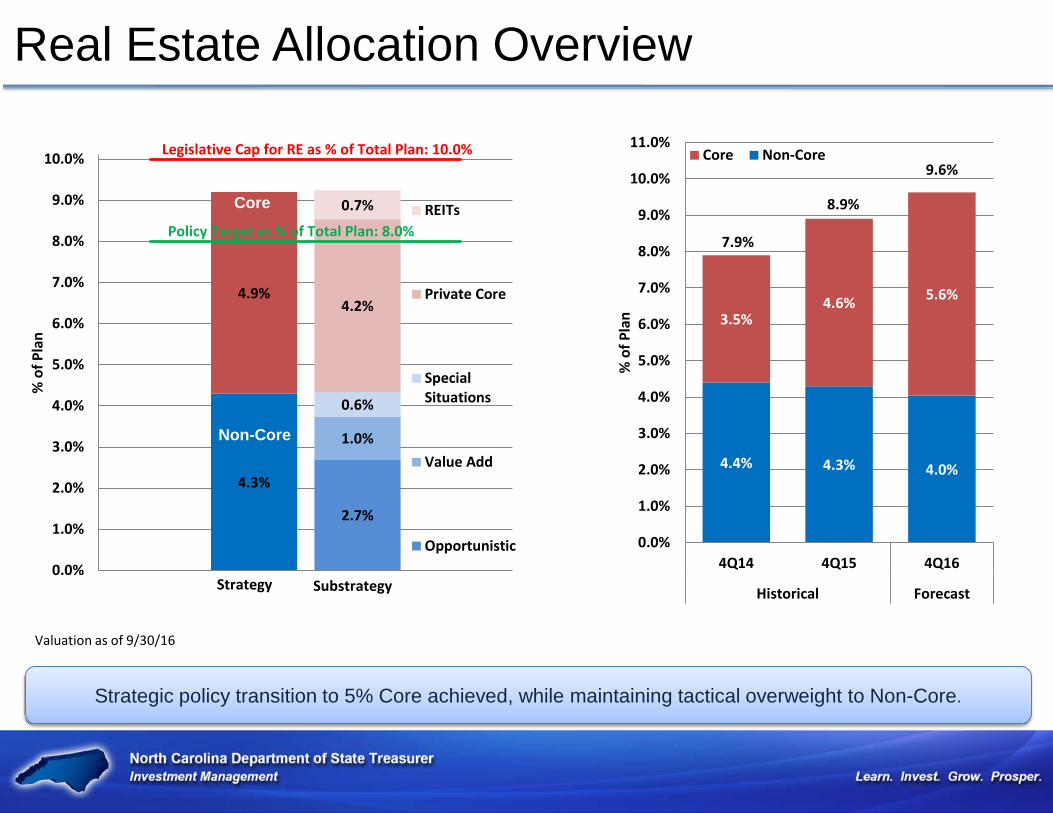
Non-Core RE Performance
Non-core outperformance achieved through concentration with high conviction managers utilizing lower than average leverage and risk compared to the overall industry.
Non-Core Contribution to Return3 Yr Contribution
Opportunistic 9.6 Value Add 6.4Total Non-Core 16.0
Major Drivers VintageO NorthCreek 2011 1.9 V NorthRock II 2012 1.4 O BREP VII 2011 1.2 O Lone Star II 2010 1.0 O BREP VI 2007 1.0
5 Yr Contribution Opportunistic 7.4 Value Add 5.7 Total Non-Core 13.1
Major Drivers VintageO NorthCreek 2011 1.3 V KTR II 2008 1.0O BREP VII 2011 1.0 O BREP VI 2007 0.9 O Lone Star II 2010 0.8
NCRS data through 9/30/16O = Opportunistic, V = Value Add
12.6%
16.0%
13.1%
10.5%
3.7%3.8%
8.7% 8.9%
7.7%
2.4%
0.0%
2.0%
4.0%
6.0%
8.0%
10.0%
12.0%
14.0%
16.0%
18.0%
1 Yr 3 Yr 5 Yr 7 Yr 10 Yr
TWR
Net
Ret
urns
Non-Core Benchmark

Core Thesis“To generate durable income and stable returns through strategic investments, with prudent use of leverage, in assets with long-term fundamental drivers that will endure for generations”
ResidentialLondon, UK
OfficeNew York, NY
OfficeSunnyvale, CA
Mixed-useFairfax, VA

Core Real Estate Performance
Generating solid absolute returns from an evolving Core portfolio against a mature benchmark.
Core Contribution to Return3 Yr Contribution
Private Core RE 6.7REITs 1.7Total Core 8.4
Major Drivers VintagePC NorthRock Core 2008 1.9PC JP Morgan SPF 1989 1.8PC Blackstone Edens 2013 0.8
5 Yr Contribution Private Core RE 7.5REITs 2.9Total Core 10.4
Major Drivers VintagePC NorthRock Core 2008 2.5PC JP Morgan SPF 1989 2.1PC UBS TPF 1984 0.9
NCRS data through 9/30/16
PC = Private Core Real Estate
8.7%8.4%
10.4%
9.1%
4.6%
12.1%11.4%
12.1%
10.1%
5.2%
0.0%
2.0%
4.0%
6.0%
8.0%
10.0%
12.0%
14.0%
1 Yr 3 Yr 5 Yr 7 Yr 10 Yr
TWR
Net
Ret
urns
Core Benchmark

Private Core Performance
We expect core returns to converge with, and eventually outperform, the benchmark as recent commitments move through the J-curve.
Source: NCRS data through 9/30/16
0
500
1,000
1,500
2,000
2,500
3,000
3,500
4,000
0.0%
2.0%
4.0%
6.0%
8.0%
10.0%
12.0%
14.0%
16.0%
1 Year 3 Years 5 Years 7 Years 10 Years
Com
mitm
ents
($M
)
TWR
Net
Ret
urns
Private Equity Core Real EstateCustom NCREIF ODCE NetCumulative Commitments ($M)
• Committed $2.9B in Core over the past 3 yearso $1,040M in separate accountso $940M in commingled fundso $890M in club deals
• Producing 8% returns even while going through the J-curve
• Strong current income will support returns even during periods of low appreciation

REIT Performance
Source: NCRS data through 9/30/16
0.0%
2.0%
4.0%
6.0%
8.0%
10.0%
12.0%
14.0%
16.0%
18.0%
1 Year 3 Years 5 Years 7 Years
TWR
Net
Ret
urns
Public Equity Real Estate
FTSE/EPRA/NAREIT Global Securities • Completed consolidation to a new REIT manager in April to enhance performance and significantly lower fees
• Moved from 100% active to 50% active and 50% passive
• 1-Year returns impacted by transition period and negative performance of a large single stock position we sold during the year. Performance of that position overall was strong, but it underperformed the benchmark in the last 12 months.

REITs ODCE
SMAs Debt
Core Transition Plan
• Consolidated managers and moved to a blend of active and passive
• $300M to a core industrial separate account
• Other opportunities under review
• Exercised redemptions to reduce ODCE exposure by approximately 50%
• Committed $200M to an open-ended debt fund
• Additional club debt fund is in process

Leverage
Maintaining prudent levels of leverage and retaining ability to adjust through our Separate Accounts.
31%
35% 34%
40%
49%
43%
38%
0%
10%
20%
30%
40%
50%
60%
Private Core REITs Total Core Opportunistic Value Total Non-Core Total Real Estate
2016
Source: Courtland Partners NCRS 2Q PMR

Fees
Leveraging our size and increasing separate accounts have generated more favorable fees. Incentive fees have been driven by outperformance from a handful of top-tier managers.
70
73
75
78
80
83
85
0.8%
0.9%
1.0%
1.1%
1.2%
1.3%
1.4%
2012 2013 2014 2015
Man
agem
ent F
ee ($
M)
Perc
ent o
f Mar
ket V
alue
Management Fee
Management Fee Rate
-6.0%
-3.0%
0.0%
3.0%
6.0%
9.0%
12.0%
15.0%
2012 2013 2014 20150
20
40
60
80
100
120
140
Net
Ret
urn
Ince
ntiv
e Fe
e ($
M)
Incentive Fee (2 Highest Funds)
Incentive Fees (Rest of Portfolio)
Total RE 5yr Return at YE
Source: NCRS data through 12/31/15

Topics for Discussion
• We maintain a robust, bottoms-up Cash Flow Model that guides us to invest within allocation boundaries
• Allocation constraint risks going-forward:• Loss of future fee breaks by skipping a fund with a high-conviction manager• Vintage year diversification risk• Inability to create additional separate accounts, which require a significant
amount of seed capital
Investing Within Statutory Allocation Limits

Topics for Discussion
• Foreign exposure totals $1.3B (approx. 15% of real estate portfolio)• Additional diversification across markets and sectors• Exposure to both large international funds and niche investments• Investing abroad does not come without risks
• Uncertainty and volatility (Brexit, Chinese growth, geopolitical, etc.)• Currency impact on returns can be significant
International Exposure
UKEurope(ex UK)
Asia Latin America
$417M5.2%
$352M4.1%
$345M4.0%
$78M1.0%
Source: Courtland Partners NCRS 2Q PMR
Thank You!
Together we can build and maintain a fiscally strong and prosperous North Carolina.
www.NCTreasurer.com
Recommended