
Real Estate MarketsIntroduction
Economic Determinants of New Construction
Economic Analysis1. What is a Real Estate Market?2. Static Equilibrium3. Property and Capital Market Linkages4. Dynamic Adjustment: Real Estate Cycles
A Tale of Two Cities: Dallas and Philadelphia1. The Past2. The Present3. The Future

Real Estate Markets:Economic Determinants of New Construction
Determinants of the Market Demand for Real Estate
1.
2.
3.
4.
How would you rank them?

Real Estate Markets:Economic Determinants of New Construction
Source of Real Estate Supply
1.
2.
3.

Real Estate Markets Economic Analysis
Real Estate: land and its attached improvements--a capital good thatproduces a flow of services over time.
Real estate prices:
1. Rental rate: the service price--the price per unit of servicesfor a specified time period--determined in the marketfor real estate space, the property market.
2. Market value: the asset price--the present value of the service flowover the asset’s economic life--determined in capitalmarkets.
Real estate market (or submarket): the geographic area where the per unitprice of real estate services is constant; the area includes allproperty influenced by the same economic conditions.

Real Estate Markets Economic Analysis
Characteristics of Real Estate Markets
Durable capital that depreciates over time1. long economic life2. essentially immobile
The real estate market is composed of:1. the market for space—the property market2. the market for (debt and equity) capital
Property market characteristics1. information costly to obtain2. illiquid asset with infrequent trading
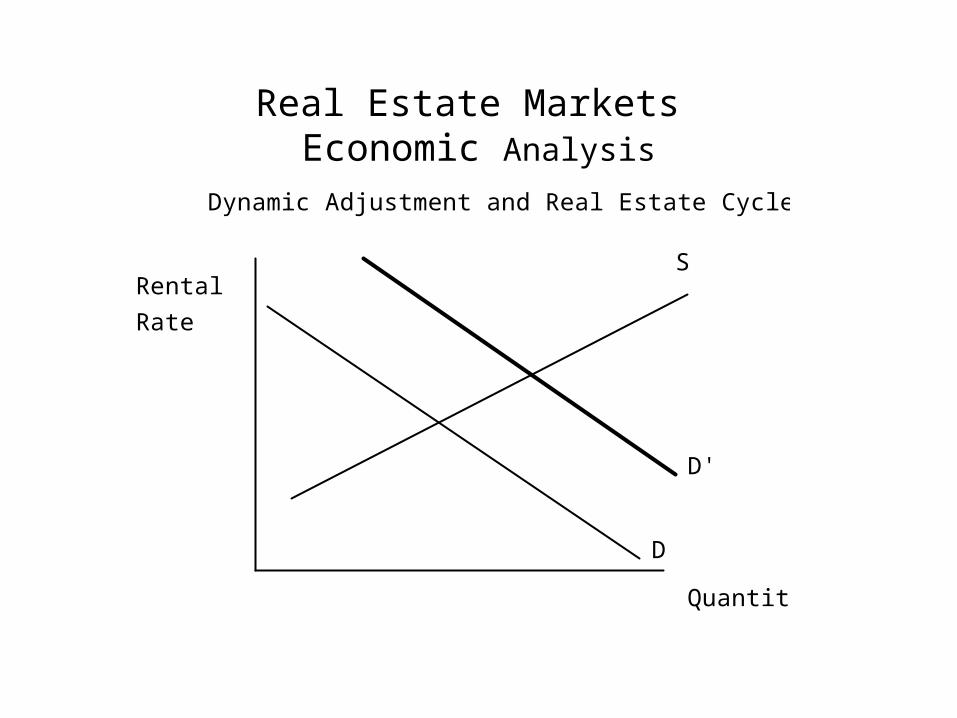
Real Estate Markets Economic Analysis
Rental
Rate
Quantity
D
Dynamic Adjustment and Real Estate Cycles
S
D'
P1
excessdemand
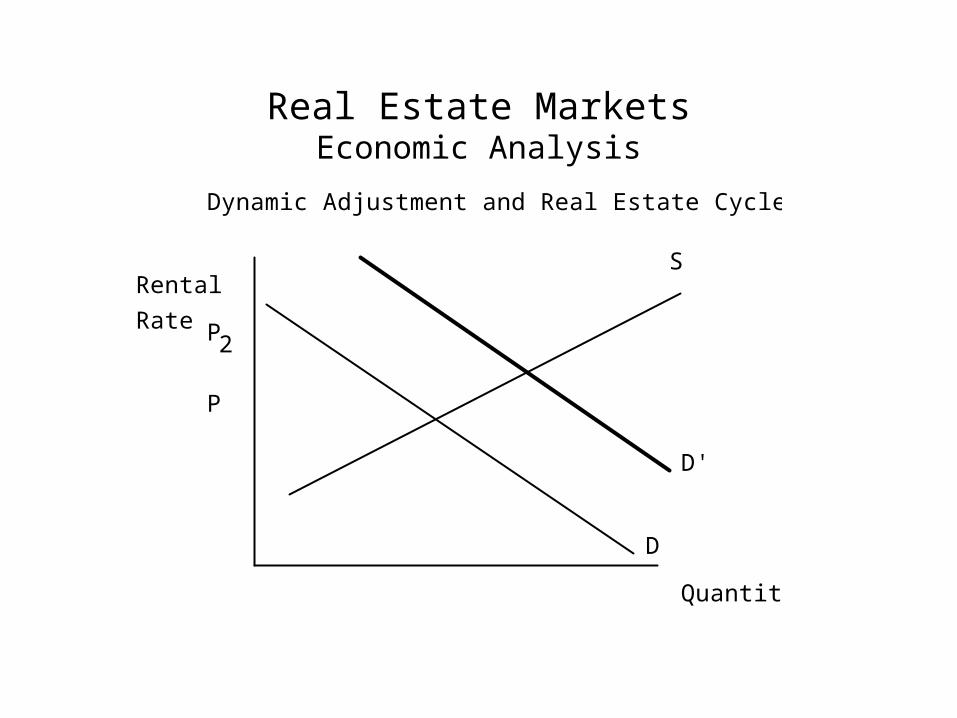
Real Estate MarketsEconomic Analysis
Rental
Rate
Quantity
D
Dynamic Adjustment and Real Estate Cycles
S
D'
P
P2
excessdemand
3
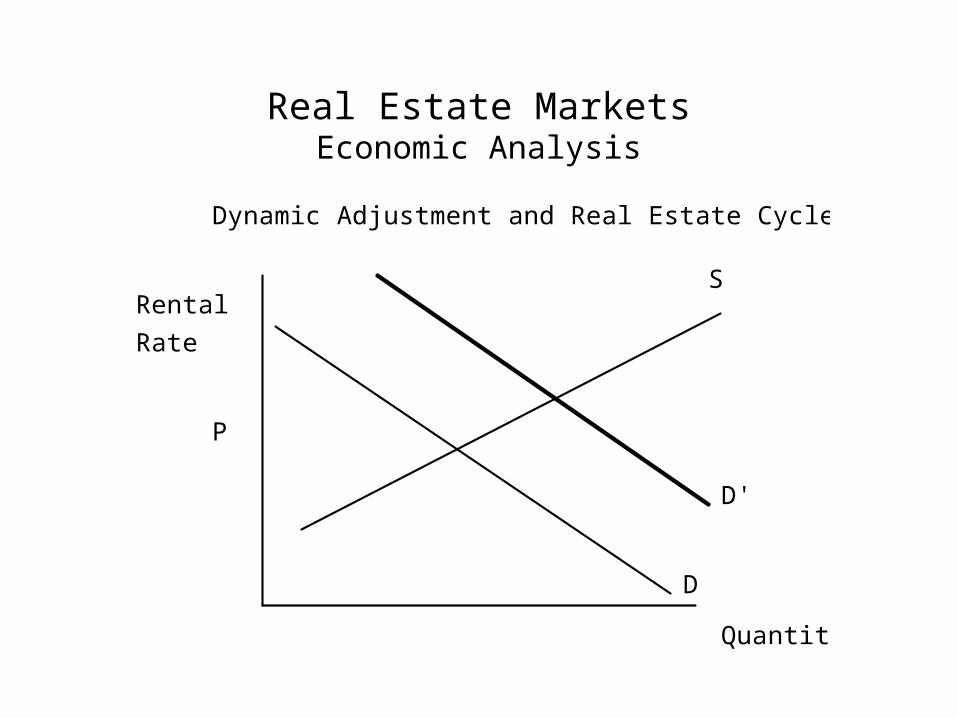
Real Estate MarketsEconomic Analysis
Rental
Rate
Quantity
D
Dynamic Adjustment and Real Estate Cycles
S
D'
P3

Real Estate MarketsEconomic Analysis
Property and Asset Market Linkages
Property Market: the (consumers) market for space
Asset Market: the (investors) capital market
Property and Asset Market Linkages:
(1) rents are capitalized into property values
(2) level of new construction influences rents(a) overbuilding creates excess supply, lowering rents(b) new construction incorporates latest technology/
consumer preferences and commands premium rents

Real Estate MarketsEconomic Analysis
Property and Asset Market Linkages
When does new construction occur?
New construction can only occur when the market rent for new space canjustify the construction cost--when the market value of the new propertyexceeds total construction costs.
Rents are determined in property markets.
Values are determined in capital markets.
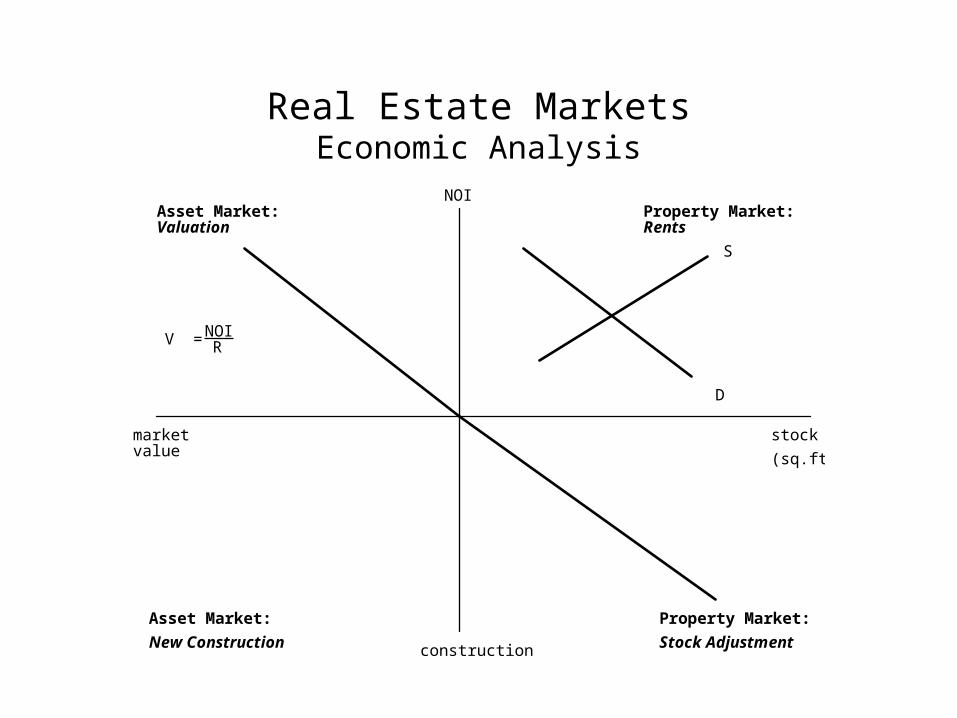
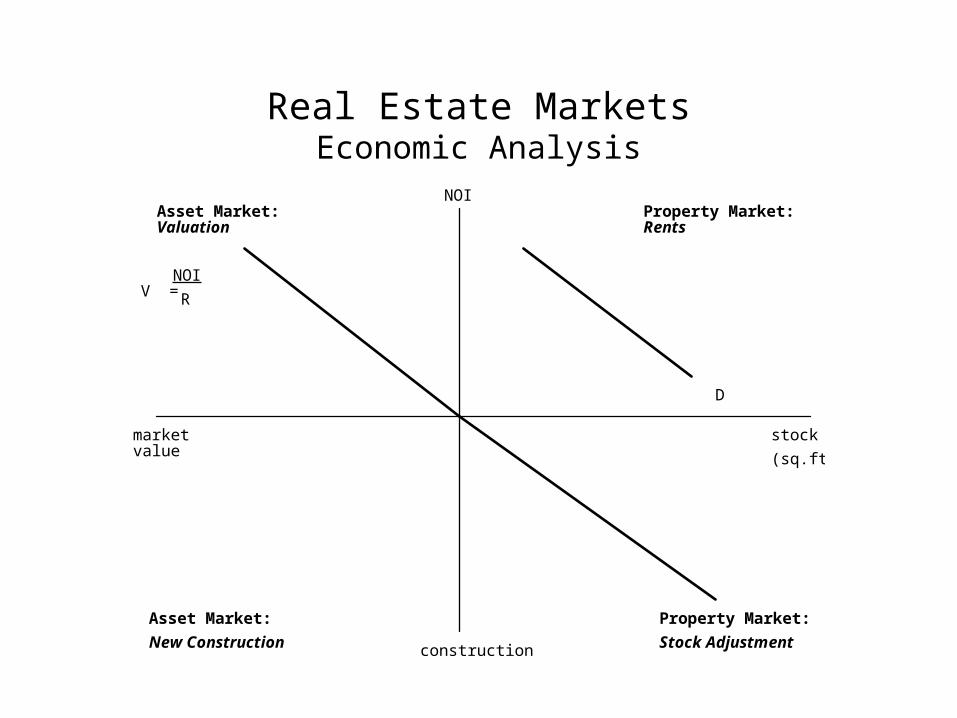
Real Estate MarketsEconomic Analysis
stock
(sq.ft.)
construction
NOI
marketvalue
Property Market:Asset Market:
Asset Market: Property Market:
RentsValuation
New Construction Stock Adjustment
D
S
V = NOIR
V = f(C)
S = D

Real Estate MarketsEconomic Analysis
stock
(sq.ft.)
construction
NOI
marketvalue
Property Market:Asset Market:
Asset Market: Property Market:
RentsValuation
New Construction Stock Adjustment
D
S
V = NOIR
V = f(C)
D'
Real Estate MarketsEconomic Analysis
stock
(sq.ft.)
construction
NOI
marketvalue
Property Market:Asset Market:
Asset Market: Property Market:
RentsValuation
New Construction Stock Adjustment
D
V = NOI
R
V = f(C)
Cap rate fall S
S'

Real Estate MarketsReal Estate Cycles
What is Cyclical?
1.
2.
3.
4.
5.
Real Estate MarketsReal Estate Cycles
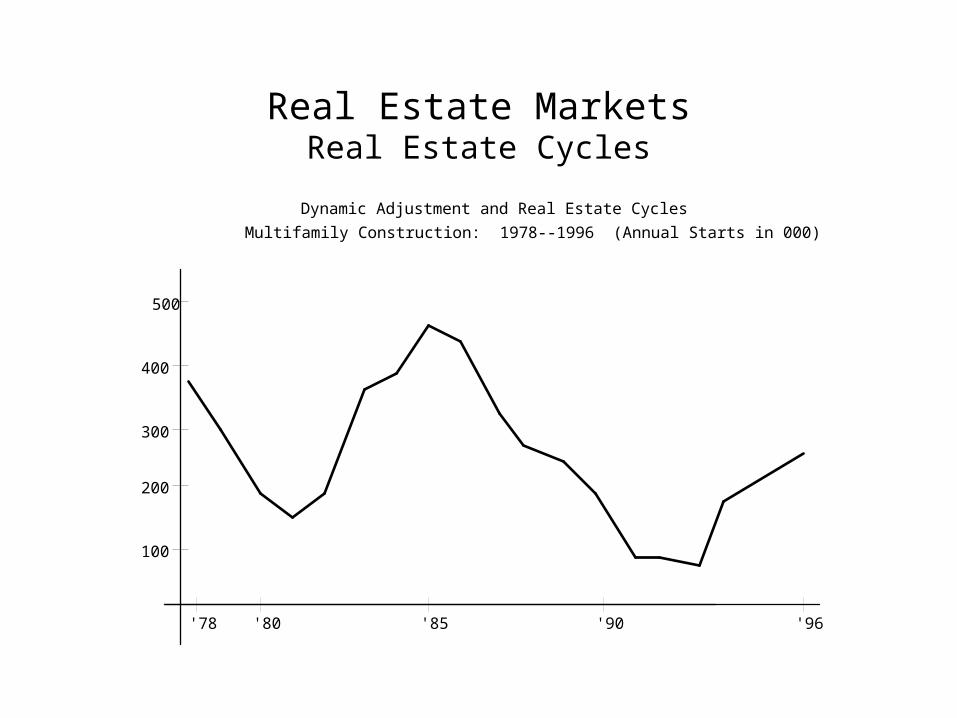
Dynamic Adjustment and Real Estate Cycles
Multifamily Construction: 1978--1996 (Annual Starts in 000)
'78 '80 '85 '90 '96
100
200
300
400
500

Real Estate MarketsReal Estate Cycles
Market Cycle Analysis
1. Phase I: Market Oversupply
2. Phase II: Demand Growth
3. Phase III: Supply Growth > Demand Growth
4. Phase IV: Real Estate Recession
5. Back to Phase I
Long-term vacancy rate is defined as the vacancyrate where changes in rent equal the inflation rate.
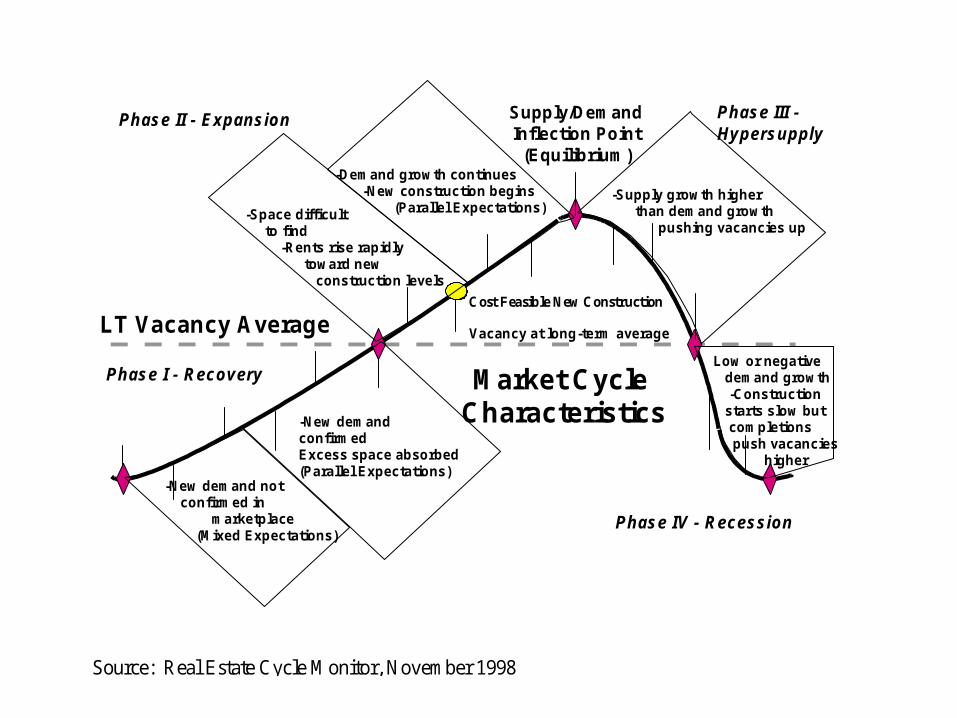
LT Vacancy Average
Market CycleCharacteristics
Supply/DemandInflection Point
(Equilibrium)
Vacancy at long-term average
Cost Feasible New Construction
Phase I - Recovery
Phase II - Expansion Phase III -Hypersupply
Phase IV - Recession
-Demand growth continues -New construction begins (Parallel Expectations)
-Supply growth higher than demand growth pushing vacancies up
-Low or negative demand growth -Construction starts slow but completions push vacancies higher
-New demand not confirmed in marketplace (Mixed Expectations)
-New demandconfirmedExcess space absorbed(Parallel Expectations)
-Space difficult to find -Rents rise rapidly toward new construction levels
Source: Real Estate Cycle Monitor, November 1998
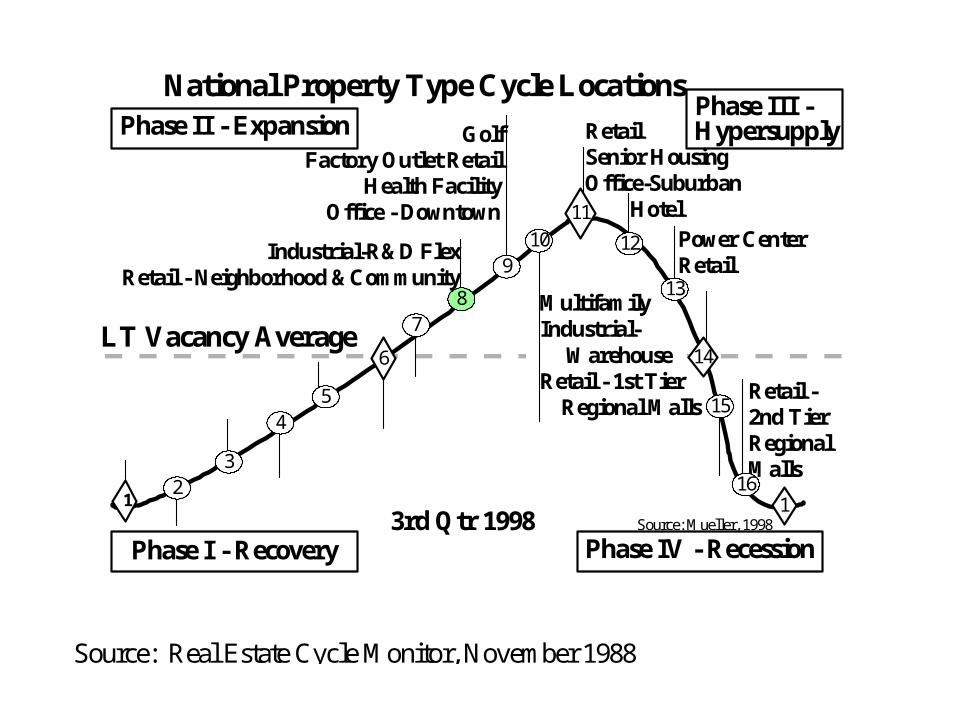
Industrial-R&D FlexRetail - Neighborhood &Community
Power CenterRetail
Retail - 2nd Tier RegionalMalls
National Property Type Cycle Locations
MultifamilyIndustrial- WarehouseRetail - 1st Tier Regional Malls
3rd Qtr 1998
LT Vacancy Average
Source: Mueller, 1998
Phase II - Expansion
Phase I - Recovery
Phase III -Hypersupply
Phase IV - Recession
Factory Outlet Retail Health Facility Office - Downtown
Golf
2
54
3
8
9
7
10
16
15
13
1
6
11
14
1
12
Hotel
RetailSenior HousingOffice-Suburban
Source: Real Estate Cycle Monitor, November 1988
Real Estate MarketsReal Estate Cycles
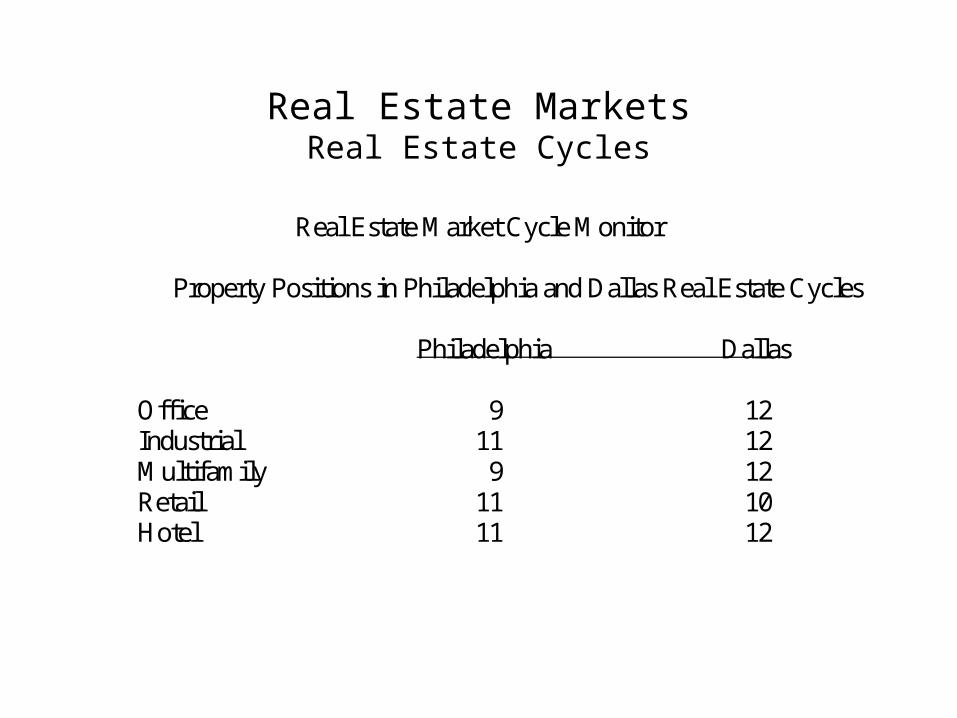
Real Estate Market Cycle Monitor
Property Positions in Philadelphia and Dallas Real Estate Cycles
Philadelphia Dallas
Office 9 12Industrial 11 12Multifamily 9 12Retail 11 10Hotel 11 12

Real Estate MarketsReal Estate Cycles
Real Estate Market Cycles Vary
1. by property type
2. by metropolitan market
WHY?
1.
2.
3.
4.
Real Estate MarketsThe Dallas Office Market: 1985-1990
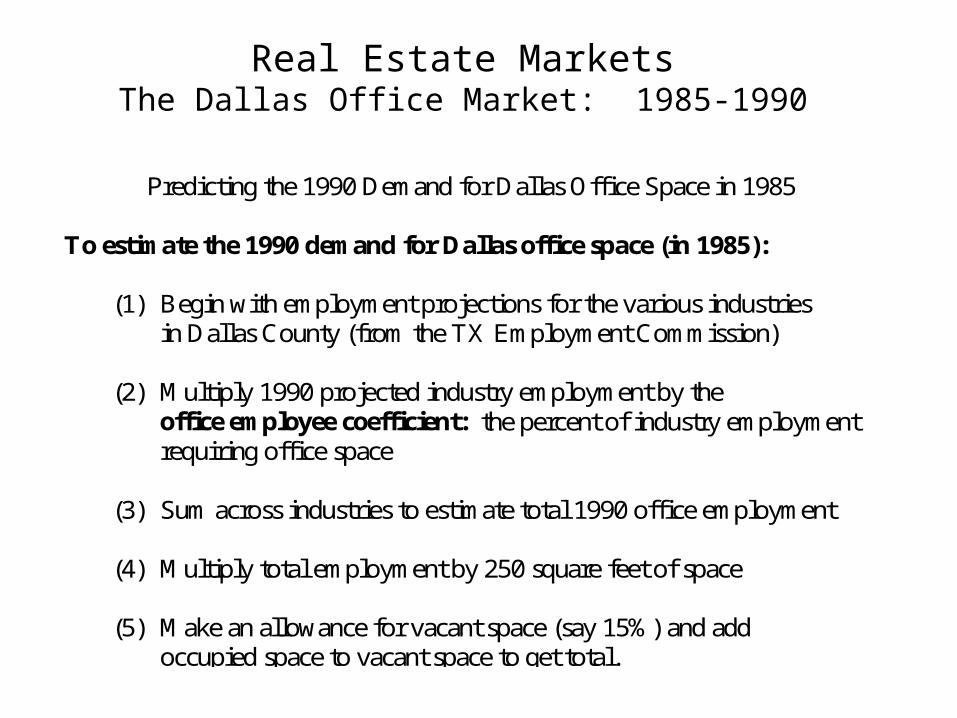
Predicting the 1990 Demand for Dallas Office Space in 1985
To estimate the 1990 demand for Dallas office space (in 1985):
(1) Begin with employment projections for the various industriesin Dallas County (from the TX Employment Commission)
(2) Multiply 1990 projected industry employment by theoffice employee coefficient: the percent of industry employmentrequiring office space
(3) Sum across industries to estimate total 1990 office employment
(4) Multiply total employment by 250 square feet of space
(5) Make an allowance for vacant space (say 15%) and addoccupied space to vacant space to get total.
Real Estate MarketsExample: The Dallas Office Market 1985-1990
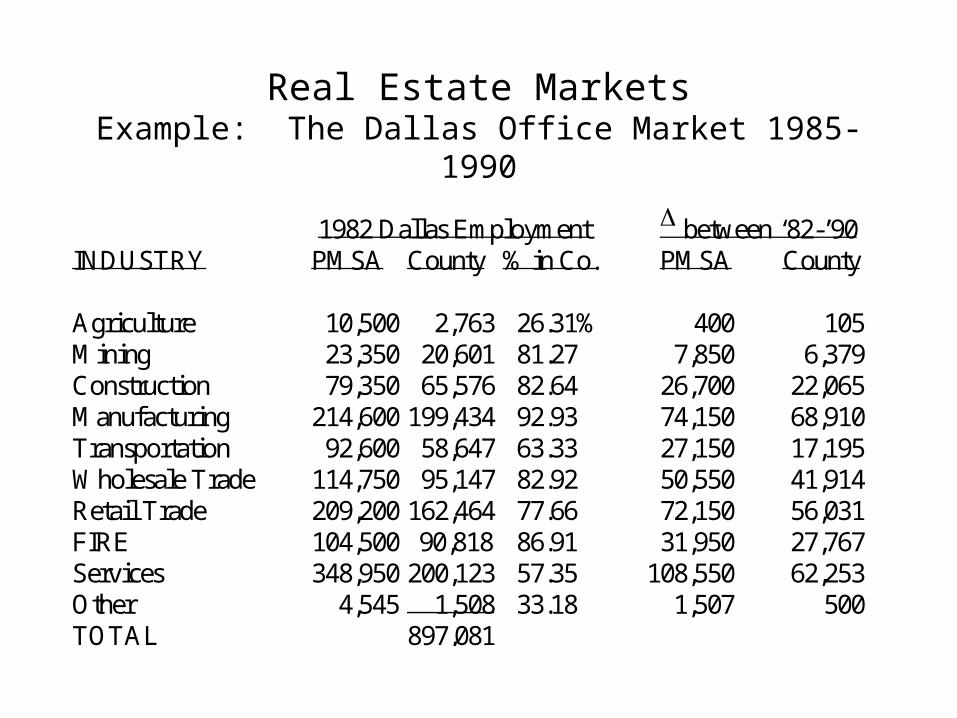
1982 Dallas Employment between ‘82-’90INDUSTRY PMSA County % in Co. PMSA County
Agriculture 10,500 2,763 26.31% 400 105Mining 23,350 20,601 81.27 7,850 6,379Construction 79,350 65,576 82.64 26,700 22,065Manufacturing 214,600 199,434 92.93 74,150 68,910Transportation 92,600 58,647 63.33 27,150 17,195Wholesale Trade 114,750 95,147 82.92 50,550 41,914Retail Trade 209,200 162,464 77.66 72,150 56,031FIRE 104,500 90,818 86.91 31,950 27,767Services 348,950 200,123 57.35 108,550 62,253Other 4,545 1,508 33.18 1,507 500TOTAL 897,081
Real Estate MarketsExample: The Dallas Office Market 1985-1990
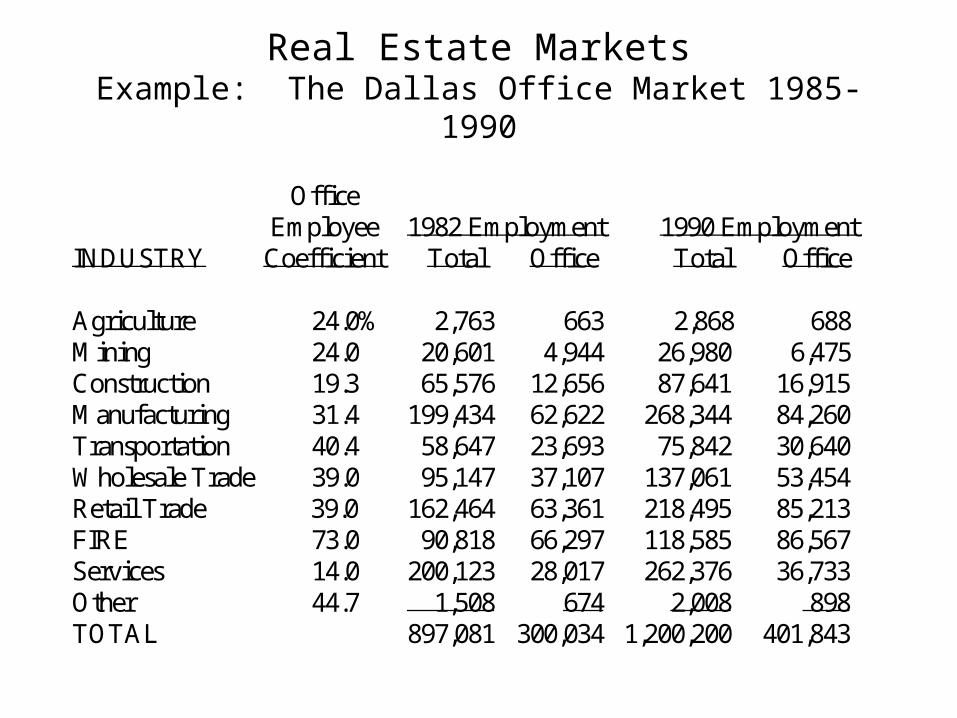
Office Employee 1982 Employment 1990 Employment
INDUSTRY Coefficient Total Office Total Office
Agriculture 24.0% 2,763 663 2,868 688Mining 24.0 20,601 4,944 26,980 6,475Construction 19.3 65,576 12,656 87,641 16,915Manufacturing 31.4 199,434 62,622 268,344 84,260Transportation 40.4 58,647 23,693 75,842 30,640Wholesale Trade 39.0 95,147 37,107 137,061 53,454Retail Trade 39.0 162,464 63,361 218,495 85,213FIRE 73.0 90,818 66,297 118,585 86,567Services 14.0 200,123 28,017 262,376 36,733Other 44.7 1,508 674 2,008 898TOTAL 897,081 300,034 1,200,200 401,843
Real Estate MarketsExample: The Dallas Office Market 1985-1990
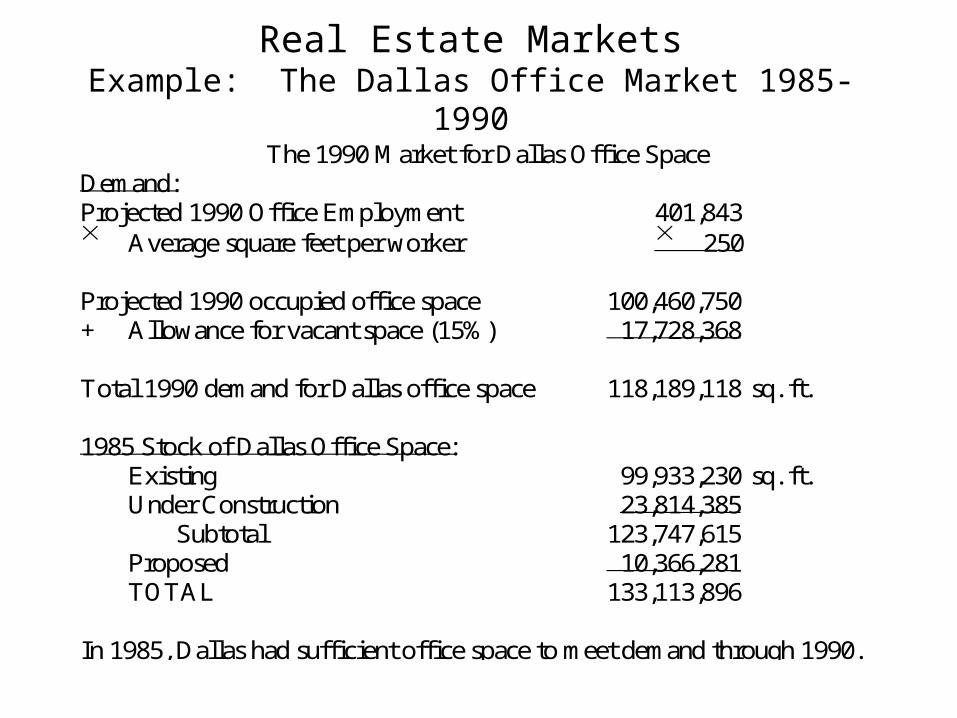
The 1990 Market for Dallas Office SpaceDemand:Projected 1990 Office Employment 401,843 Average square feet per worker 250
Projected 1990 occupied office space 100,460,750+ Allowance for vacant space (15%) 17,728,368
Total 1990 demand for Dallas office space 118,189,118 sq. ft.
1985 Stock of Dallas Office Space:Existing 99,933,230 sq. ft.Under Construction 23,814,385
Subtotal 123,747,615Proposed 10,366,281TOTAL 133,113,896
In 1985, Dallas had sufficient office space to meet demand through 1990.
Real Estate MarketsExample: The Dallas Office Market 1985-1990
The 1990 Market for Dallas Office Space
References
1. 1985 Office Market Study, Real Search Dallas2. “Projecting the Demand for Office Space in Dallas,” by James A.
Runnels, The Appraisal Journal, January 1986.3. “Office Space: Calculating the Demand,” by Charles Detoy and
Sol L. Rabin, Urban Land, June 19724. The Office Industry: Patterns of Growth and Location, by Regina
Armstrong, the MIT Press, 1972.5. Area Job Outlook, 1990 Texas Employment Commission6. 1982 County Business Patterns for Texas, U.S. Dept. of Commerce
Real Estate MarketsDallas Commercial Property Prices
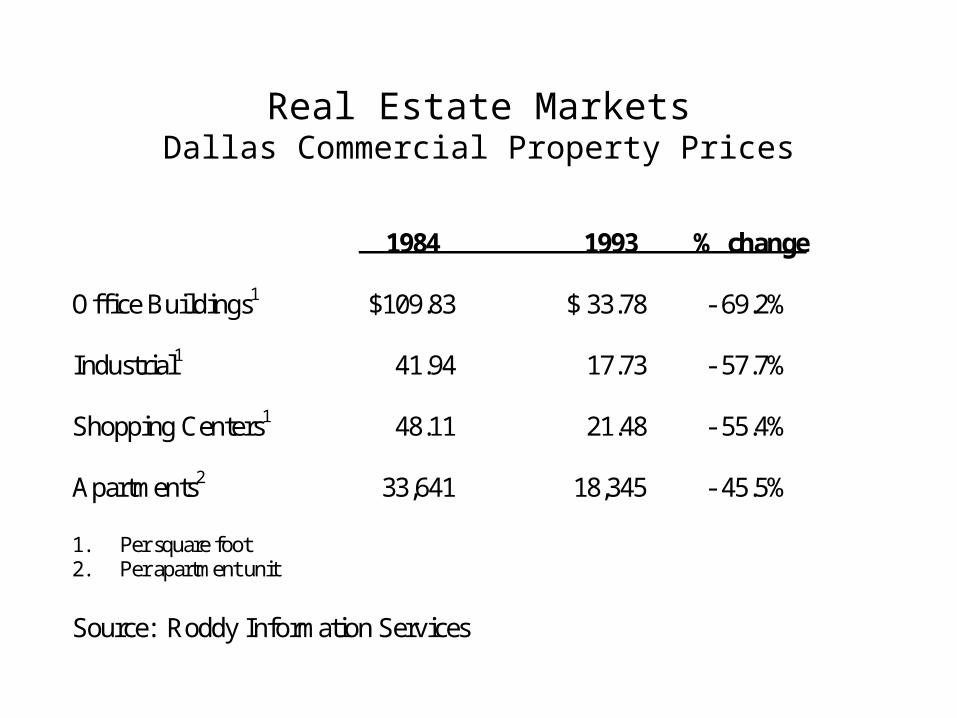
1984 1993 % change
Office Buildings1 $109.83 $ 33.78 - 69.2%
Industrial1 41.94 17.73 - 57.7%
Shopping Centers1 48.11 21.48 - 55.4%
Apartments2 33,641 18,345 - 45.5%
1. Per square foot2. Per apartment unit
Source: Roddy Information Services

Real Estate MarketsDallas and Philadelphia: The Present
Dallas PMSA Philadelphia PMSA
Collin Co. Burlington Co.Dallas Co. Camden Co.Denton Co. Glouchester Co.Ellis Co. Salem Co.Henderson Co. Bucks Co.Hunt Co. Chester Co.Kaufman Co. Delaware Co.Rockwall Co. Montgomery Co.
Philadelphia Co.
Real Estate Markets Dallas and Philadelphia: The Present
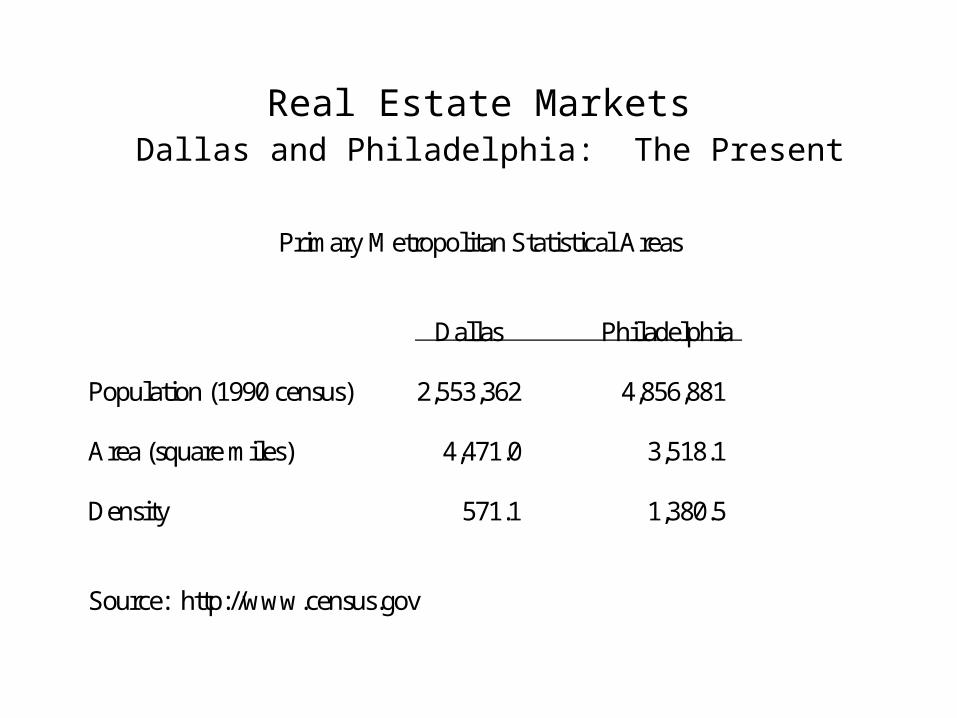
Primary Metropolitan Statistical Areas
Dallas Philadelphia
Population (1990 census) 2,553,362 4,856,881
Area (square miles) 4,471.0 3,518.1
Density 571.1 1,380.5
Source: http://www.census.gov
Real Estate Markets Dallas and Philadelphia: The Present
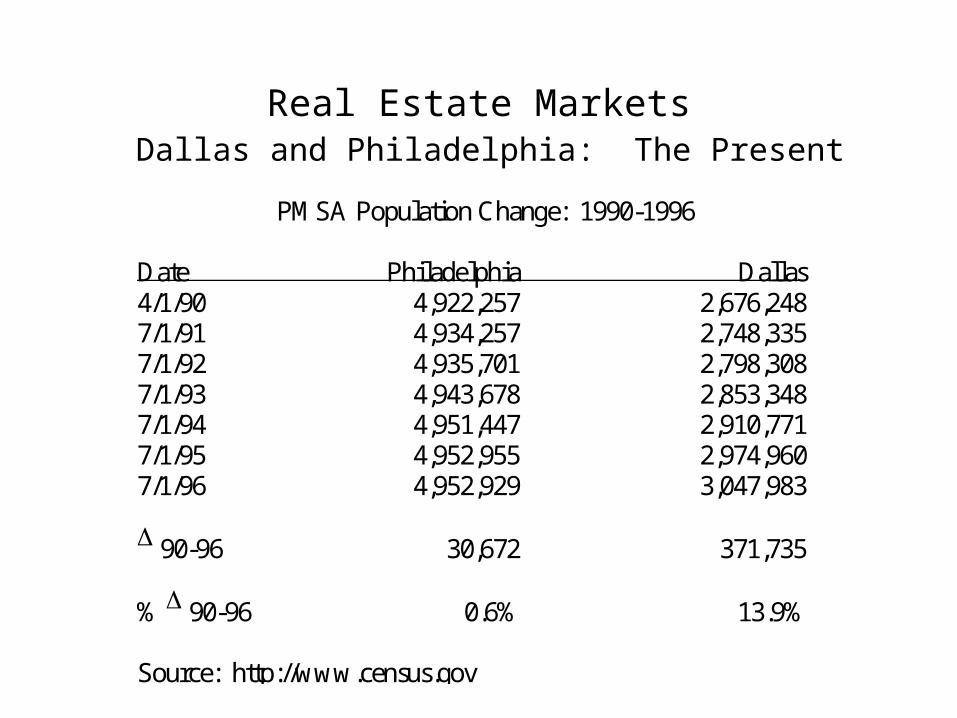
PMSA Population Change: 1990-1996
Date Philadelphia Dallas4/1/90 4,922,257 2,676,2487/1/91 4,934,257 2,748,3357/1/92 4,935,701 2,798,3087/1/93 4,943,678 2,853,3487/1/94 4,951,447 2,910,7717/1/95 4,952,955 2,974,9607/1/96 4,952,929 3,047,983
90-96 30,672 371,735
% 90-96 0.6% 13.9%
Source: http://www.census.gov
Real Estate Markets Dallas and Philadelphia: The Present
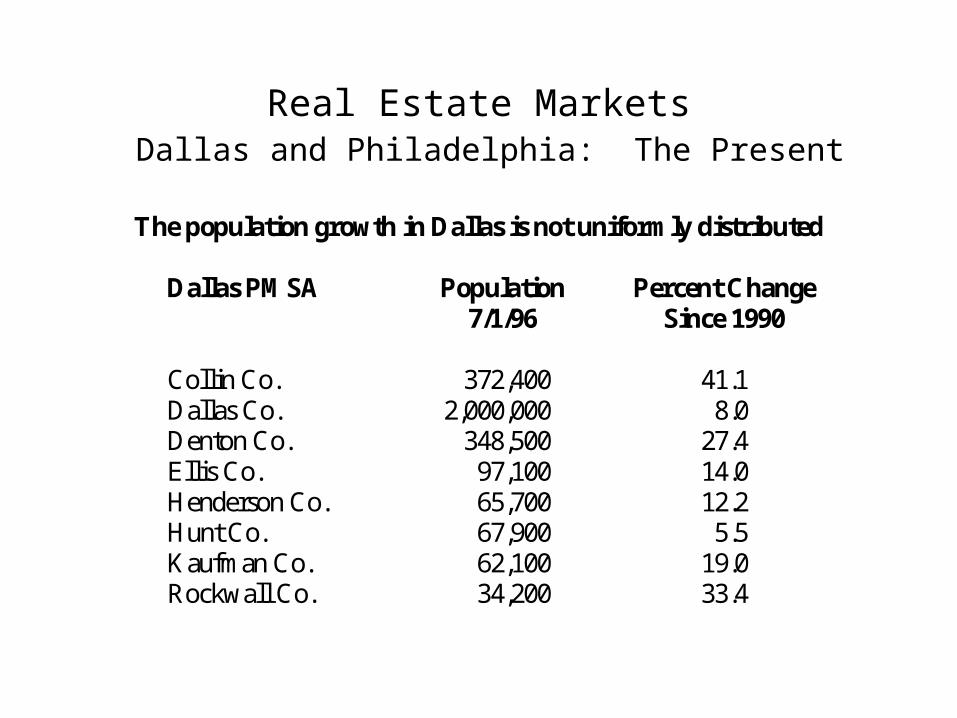
The population growth in Dallas is not uniformly distributed
Dallas PMSA Population Percent Change7/1/96 Since 1990
Collin Co. 372,400 41.1Dallas Co. 2,000,000 8.0Denton Co. 348,500 27.4Ellis Co. 97,100 14.0Henderson Co. 65,700 12.2Hunt Co. 67,900 5.5Kaufman Co. 62,100 19.0Rockwall Co. 34,200 33.4
Real Estate Markets Dallas and Philadelphia: The Present
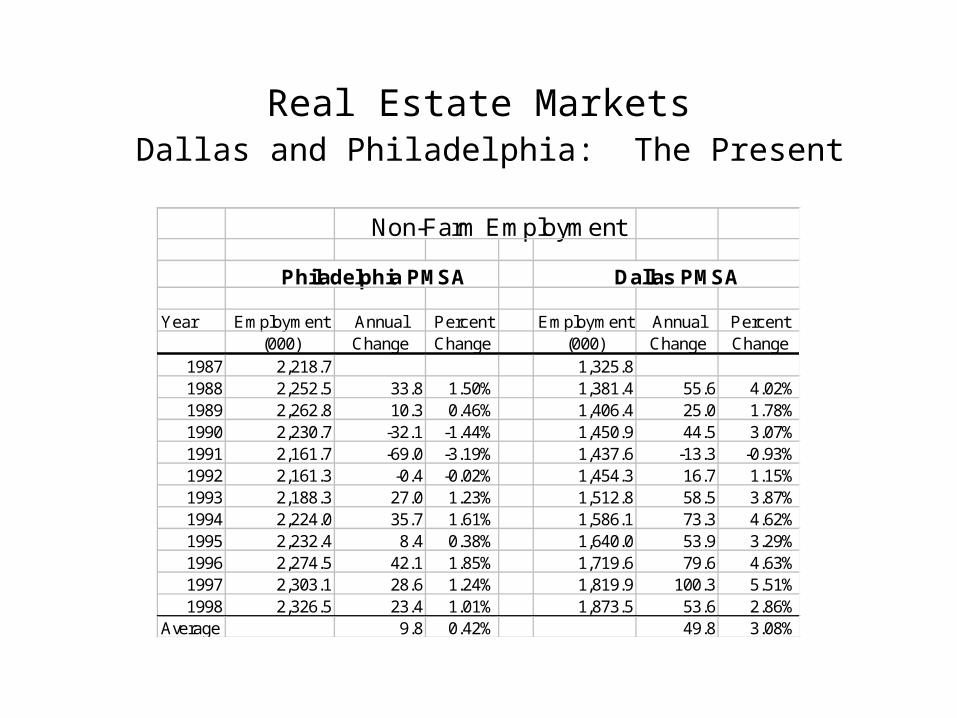
Non-Farm Employment
Philadelphia PMSA Dallas PMSA
Year Employment Annual Percent Employment Annual Percent(000) Change Change (000) Change Change
1987 2,218.7 1,325.81988 2,252.5 33.8 1.50% 1,381.4 55.6 4.02%1989 2,262.8 10.3 0.46% 1,406.4 25.0 1.78%1990 2,230.7 -32.1 -1.44% 1,450.9 44.5 3.07%1991 2,161.7 -69.0 -3.19% 1,437.6 -13.3 -0.93%1992 2,161.3 -0.4 -0.02% 1,454.3 16.7 1.15%1993 2,188.3 27.0 1.23% 1,512.8 58.5 3.87%1994 2,224.0 35.7 1.61% 1,586.1 73.3 4.62%1995 2,232.4 8.4 0.38% 1,640.0 53.9 3.29%1996 2,274.5 42.1 1.85% 1,719.6 79.6 4.63%1997 2,303.1 28.6 1.24% 1,819.9 100.3 5.51%1998 2,326.5 23.4 1.01% 1,873.5 53.6 2.86%
Average 9.8 0.42% 49.8 3.08%
Real Estate Markets Dallas and Philadelphia: The Present
Non-Farm Employment
Philadelphia PMSA Dallas PMSA
Year Employment Annual Percent Employment Annual Percent Cumulative(000) Change Change (000) Change Change Philadelphia Dallas
1987 2,218.7 1,325.8 100.00% 100.00%1988 2,252.5 33.8 1.50% 1,381.4 55.6 4.02% 1.50% 4.02%1989 2,262.8 10.3 0.46% 1,406.4 25.0 1.78% 1.96% 5.87%1990 2,230.7 -32.1 -1.44% 1,450.9 44.5 3.07% 0.50% 9.12%1991 2,161.7 -69.0 -3.19% 1,437.6 -13.3 -0.93% -2.71% 8.11%1992 2,161.3 -0.4 -0.02% 1,454.3 16.7 1.15% -2.73% 9.35%1993 2,188.3 27.0 1.23% 1,512.8 58.5 3.87% -1.53% 13.58%1994 2,224.0 35.7 1.61% 1,586.1 73.3 4.62% 0.05% 18.83%1995 2,232.4 8.4 0.38% 1,640.0 53.9 3.29% 0.43% 22.74%1996 2,274.5 42.1 1.85% 1,719.6 79.6 4.63% 2.29% 28.42%1997 2,303.1 28.6 1.24% 1,819.9 100.3 5.51% 3.56% 35.50%1998 2,326.5 23.4 1.01% 1,873.5 53.6 2.86% 4.60% 39.37%
Average 9.8 0.42% 49.8 3.08%
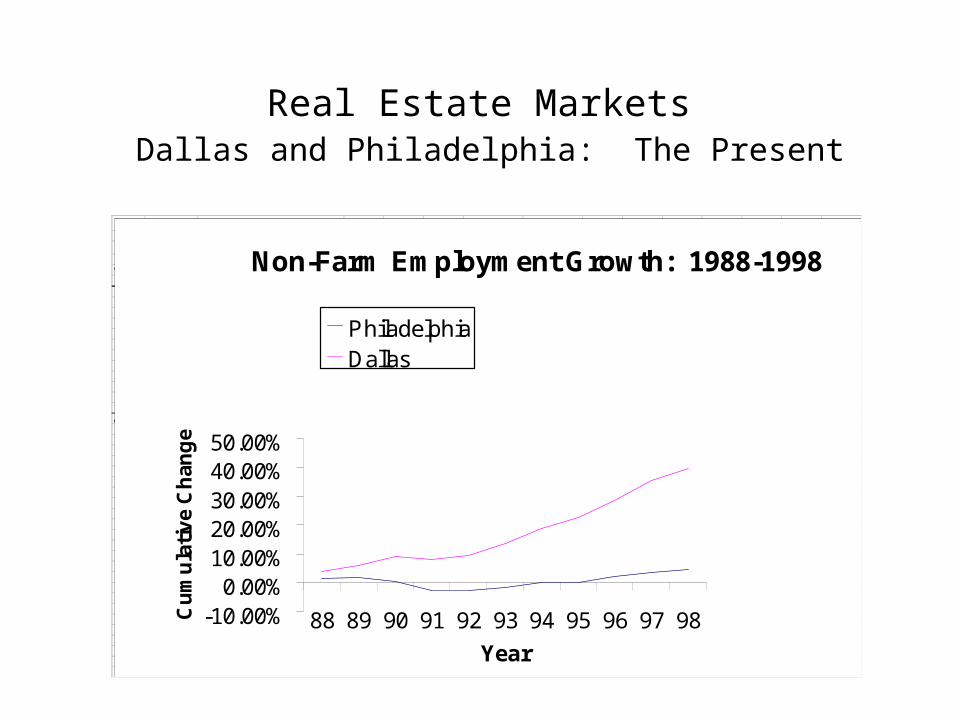
Non-Farm Employment Growth: 1988-1998
-10.00%0.00%
10.00%20.00%30.00%40.00%50.00%
88 89 90 91 92 93 94 95 96 97 98
Year
Cu
mu
lati
ve
Ch
ang
e
PhiladelphiaDallas
Real Estate Markets Dallas and Philadelphia: The Present
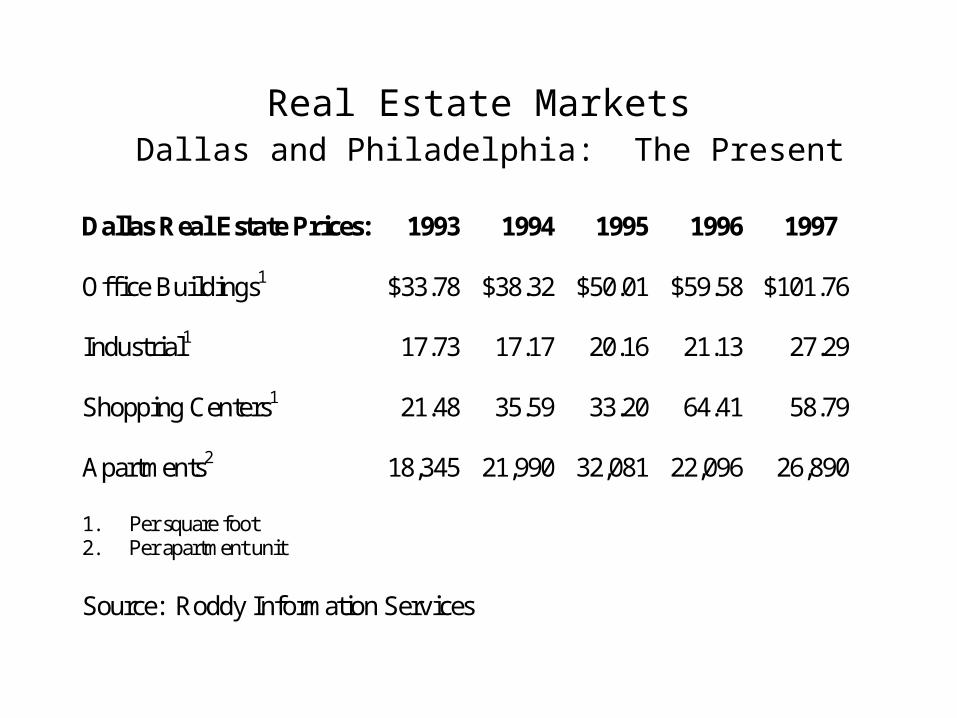
Dallas Real Estate Prices: 1993 1994 1995 1996 1997
Office Buildings1 $33.78 $38.32 $50.01 $59.58 $101.76
Industrial1 17.73 17.17 20.16 21.13 27.29
Shopping Centers1 21.48 35.59 33.20 64.41 58.79
Apartments2 18,345 21,990 32,081 22,096 26,890
1. Per square foot2. Per apartment unit
Source: Roddy Information Services
Real Estate Markets Dallas and Philadelphia: The Present
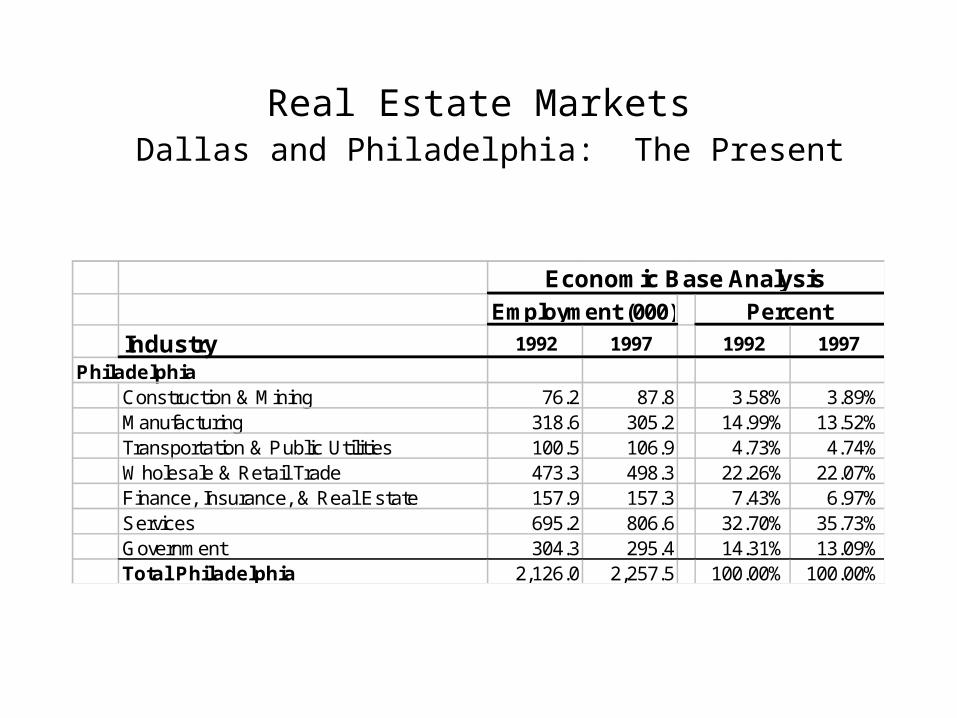
Economic Base AnalysisEmployment (000) Percent
Industry 1992 1997 1992 1997
PhiladelphiaConstruction & Mining 76.2 87.8 3.58% 3.89%Manufacturing 318.6 305.2 14.99% 13.52%Transportation & Public Utilities 100.5 106.9 4.73% 4.74%Wholesale & Retail Trade 473.3 498.3 22.26% 22.07%Finance, Insurance, & Real Estate 157.9 157.3 7.43% 6.97%Services 695.2 806.6 32.70% 35.73%Government 304.3 295.4 14.31% 13.09%Total Philadelphia 2,126.0 2,257.5 100.00% 100.00%
Real Estate Markets Dallas and Philadelphia: The Present
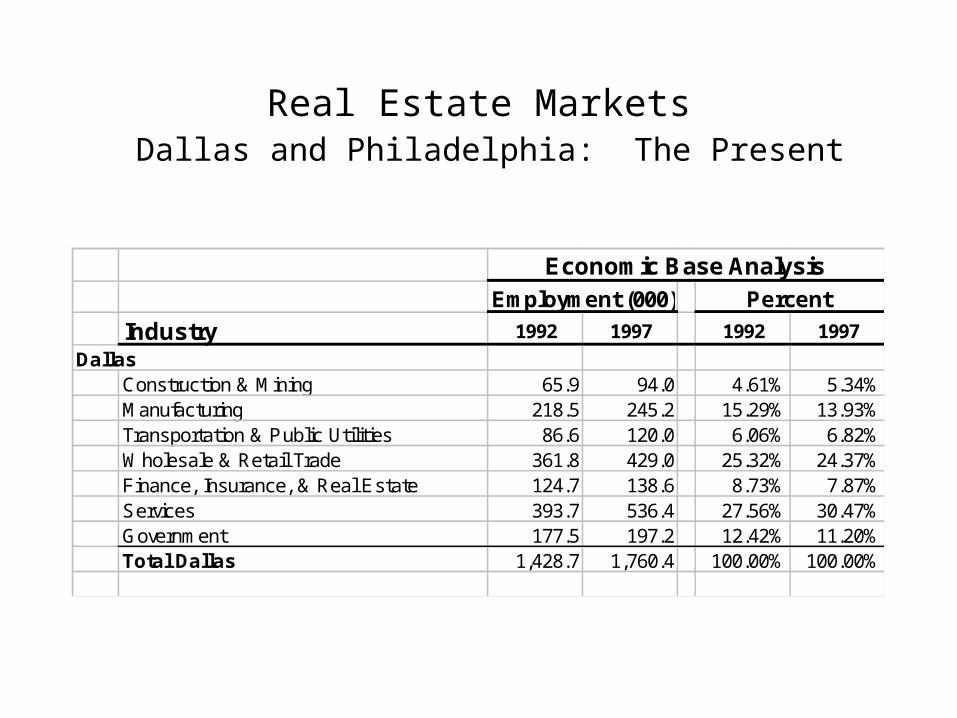
Economic Base AnalysisEmployment (000) Percent
Industry 1992 1997 1992 1997
DallasConstruction & Mining 65.9 94.0 4.61% 5.34%Manufacturing 218.5 245.2 15.29% 13.93%Transportation & Public Utilities 86.6 120.0 6.06% 6.82%Wholesale & Retail Trade 361.8 429.0 25.32% 24.37%Finance, Insurance, & Real Estate 124.7 138.6 8.73% 7.87%Services 393.7 536.4 27.56% 30.47%Government 177.5 197.2 12.42% 11.20%Total Dallas 1,428.7 1,760.4 100.00% 100.00%
Real Estate Markets Dallas and Philadelphia: The Present
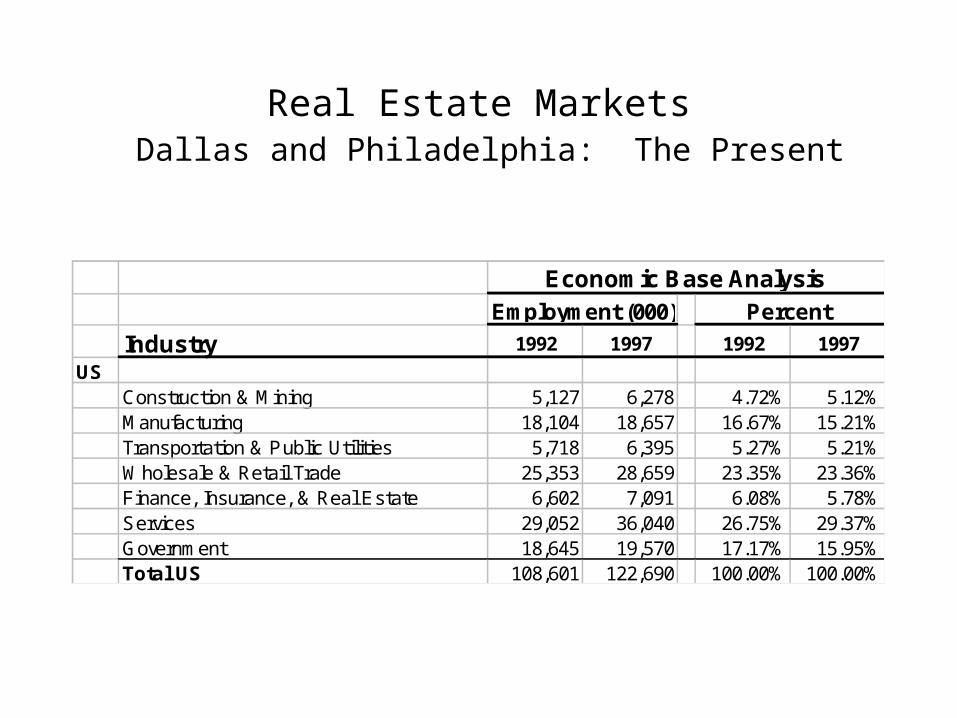
Economic Base AnalysisEmployment (000) Percent
Industry 1992 1997 1992 1997
USConstruction & Mining 5,127 6,278 4.72% 5.12%Manufacturing 18,104 18,657 16.67% 15.21%Transportation & Public Utilities 5,718 6,395 5.27% 5.21%Wholesale & Retail Trade 25,353 28,659 23.35% 23.36%Finance, Insurance, & Real Estate 6,602 7,091 6.08% 5.78%Services 29,052 36,040 26.75% 29.37%Government 18,645 19,570 17.17% 15.95%Total US 108,601 122,690 100.00% 100.00%
Real Estate Markets Dallas and Philadelphia: The Present
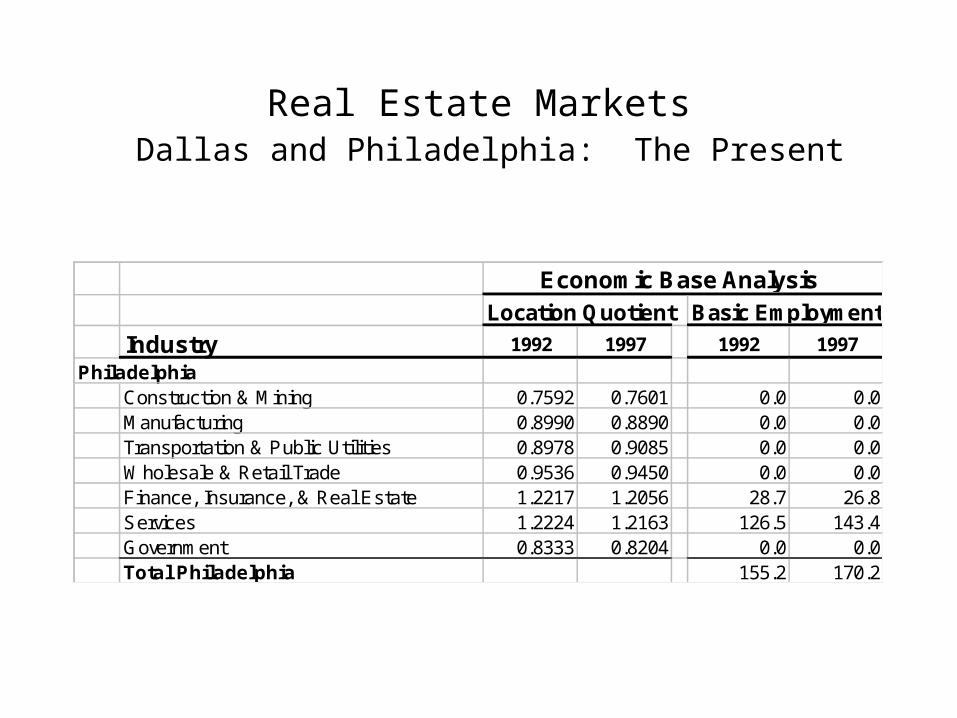
Economic Base AnalysisLocation Quotient Basic Employment
Industry 1992 1997 1992 1997
PhiladelphiaConstruction & Mining 0.7592 0.7601 0.0 0.0Manufacturing 0.8990 0.8890 0.0 0.0Transportation & Public Utilities 0.8978 0.9085 0.0 0.0Wholesale & Retail Trade 0.9536 0.9450 0.0 0.0Finance, Insurance, & Real Estate 1.2217 1.2056 28.7 26.8Services 1.2224 1.2163 126.5 143.4Government 0.8333 0.8204 0.0 0.0Total Philadelphia 155.2 170.2
Real Estate Markets Dallas and Philadelphia: The Present
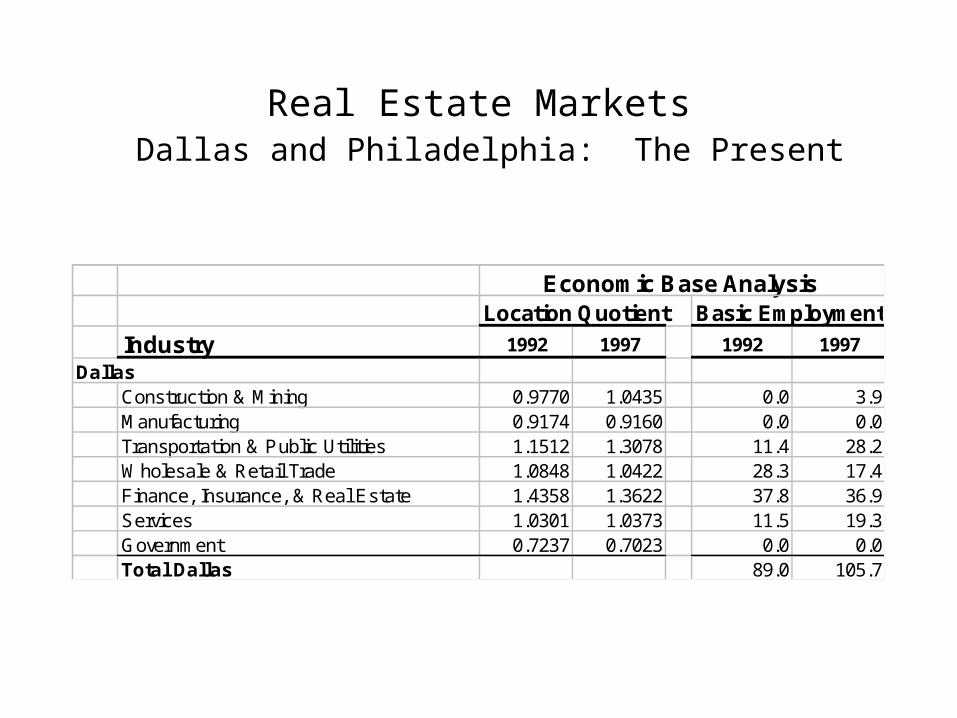
Economic Base AnalysisLocation Quotient Basic Employment
Industry 1992 1997 1992 1997
DallasConstruction & Mining 0.9770 1.0435 0.0 3.9Manufacturing 0.9174 0.9160 0.0 0.0Transportation & Public Utilities 1.1512 1.3078 11.4 28.2Wholesale & Retail Trade 1.0848 1.0422 28.3 17.4Finance, Insurance, & Real Estate 1.4358 1.3622 37.8 36.9Services 1.0301 1.0373 11.5 19.3Government 0.7237 0.7023 0.0 0.0Total Dallas 89.0 105.7

Real Estate Markets Dallas and Philadelphia: The Future
Wharton Econometric Forecasting Associates
WEFA operates throughout NorthAmerica and Europe, with affiliates inLatin America and Asia. Its broad range of capabilities derives from the1987 merger of two international consulting firms, Wharton EconometricForecasting Associates (WEFA) and Chase Econometrics.
Founded in 1963 by Lawrence R. Klein, the Nobel laureate, WEFApioneered and, over the years, perfected the most innovative ways offorecasting economic and industry trends. Today, WEFA is the largestprivately held repository of economic data and intelligence in the world.
Source: http://www.wefa.com/

Real Estate Markets Dallas and Philadelphia: The Future
Dismal Sciences, Inc.(formerly Regional Financial Associates, Inc.)
RFA provides analysis of the U.S. economy to institutional, corporate, andgovernment clients in the U.S., Canada, and Europe. Our economic researchhas many dimensions: the macroeconomy; financial markets; industrialmarkets; and regional markets, including states, metropolitan areas, andcounties. RFA's services include publications, historical and forecastdatabases, and contract consulting.
The Dismal Scientist® (www.dismal.com), the Web's most popular site foreconomics. Since its founding in 1990, Dismal Sciences has become thefastest-growing economic research organization in the U.S. Headquarteredoutside of Philadelphia in Pennsylvania's Brandywine Valley, DismalSciences is an employee-owned company.
Source: http://www.rfa.com/
Real Estate Markets Dallas and Philadelphia: The Future
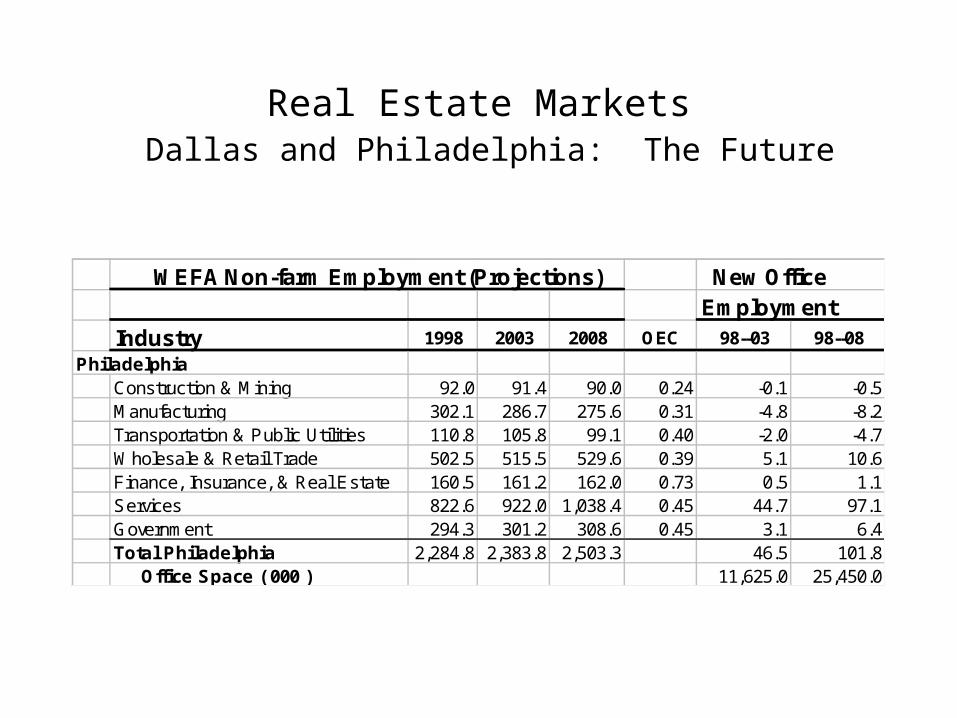
WEFA Non-farm Employment (Projections) New Office Employment
Industry 1998 2003 2008 OEC 98--03 98--08
PhiladelphiaConstruction & Mining 92.0 91.4 90.0 0.24 -0.1 -0.5Manufacturing 302.1 286.7 275.6 0.31 -4.8 -8.2Transportation & Public Utilities 110.8 105.8 99.1 0.40 -2.0 -4.7Wholesale & Retail Trade 502.5 515.5 529.6 0.39 5.1 10.6Finance, Insurance, & Real Estate 160.5 161.2 162.0 0.73 0.5 1.1Services 822.6 922.0 1,038.4 0.45 44.7 97.1Government 294.3 301.2 308.6 0.45 3.1 6.4Total Philadelphia 2,284.8 2,383.8 2,503.3 46.5 101.8 Office Space ( 000 ) 11,625.0 25,450.0
Real Estate Markets Dallas and Philadelphia: The Future
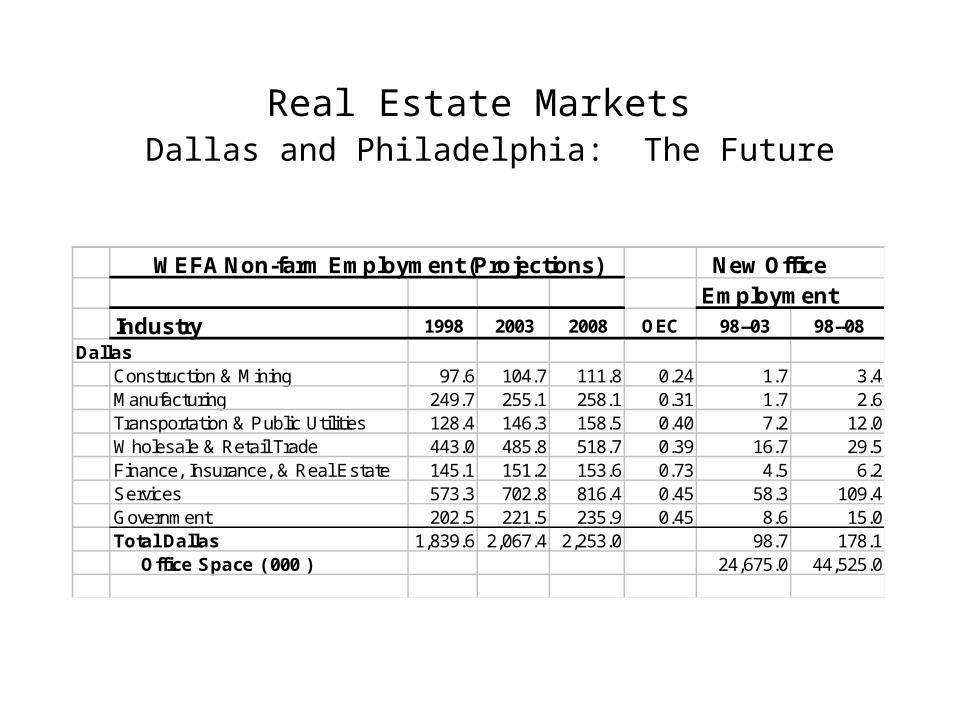
WEFA Non-farm Employment (Projections) New Office Employment
Industry 1998 2003 2008 OEC 98--03 98--08
DallasConstruction & Mining 97.6 104.7 111.8 0.24 1.7 3.4Manufacturing 249.7 255.1 258.1 0.31 1.7 2.6Transportation & Public Utilities 128.4 146.3 158.5 0.40 7.2 12.0Wholesale & Retail Trade 443.0 485.8 518.7 0.39 16.7 29.5Finance, Insurance, & Real Estate 145.1 151.2 153.6 0.73 4.5 6.2Services 573.3 702.8 816.4 0.45 58.3 109.4Government 202.5 221.5 235.9 0.45 8.6 15.0Total Dallas 1,839.6 2,067.4 2,253.0 98.7 178.1 Office Space ( 000 ) 24,675.0 44,525.0
Real Estate Markets Dallas and Philadelphia: The Future
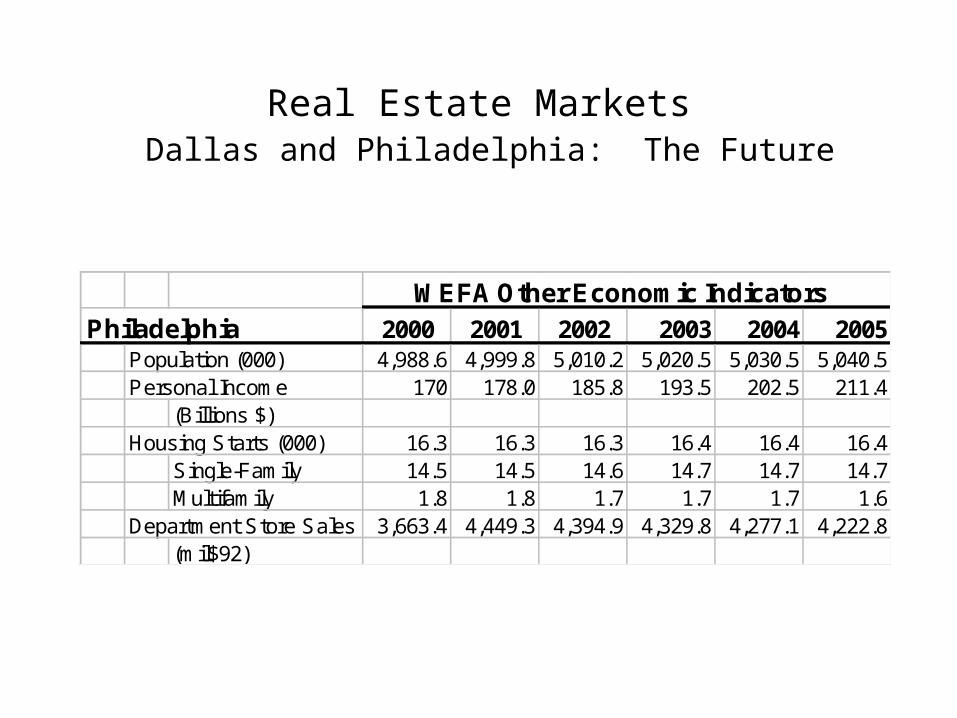
WEFA Other Economic IndicatorsPhiladelphia 2000 2001 2002 2003 2004 2005
Population (000) 4,988.6 4,999.8 5,010.2 5,020.5 5,030.5 5,040.5Personal Income 170 178.0 185.8 193.5 202.5 211.4
(Billions $)Housing Starts (000) 16.3 16.3 16.3 16.4 16.4 16.4
Single-Family 14.5 14.5 14.6 14.7 14.7 14.7Multifamily 1.8 1.8 1.7 1.7 1.7 1.6
Department Store Sales 3,663.4 4,449.3 4,394.9 4,329.8 4,277.1 4,222.8(mil$92)
Real Estate Markets Dallas and Philadelphia: The Future
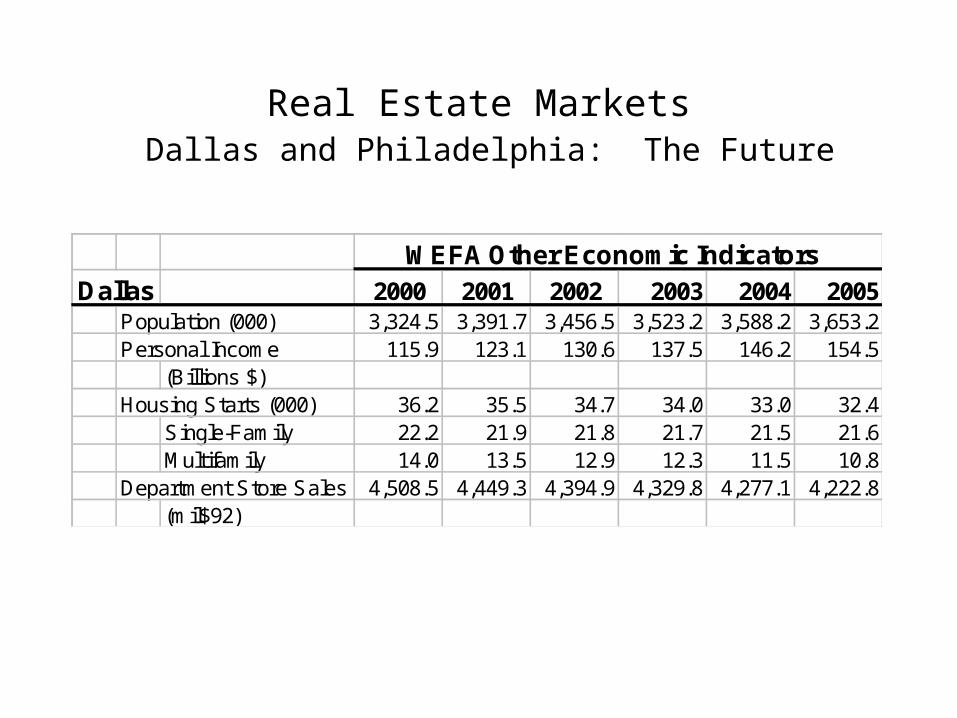
WEFA Other Economic IndicatorsDallas 2000 2001 2002 2003 2004 2005
Population (000) 3,324.5 3,391.7 3,456.5 3,523.2 3,588.2 3,653.2Personal Income 115.9 123.1 130.6 137.5 146.2 154.5
(Billions $)Housing Starts (000) 36.2 35.5 34.7 34.0 33.0 32.4
Single-Family 22.2 21.9 21.8 21.7 21.5 21.6Multifamily 14.0 13.5 12.9 12.3 11.5 10.8
Department Store Sales 4,508.5 4,449.3 4,394.9 4,329.8 4,277.1 4,222.8(mil$92)
Recommended