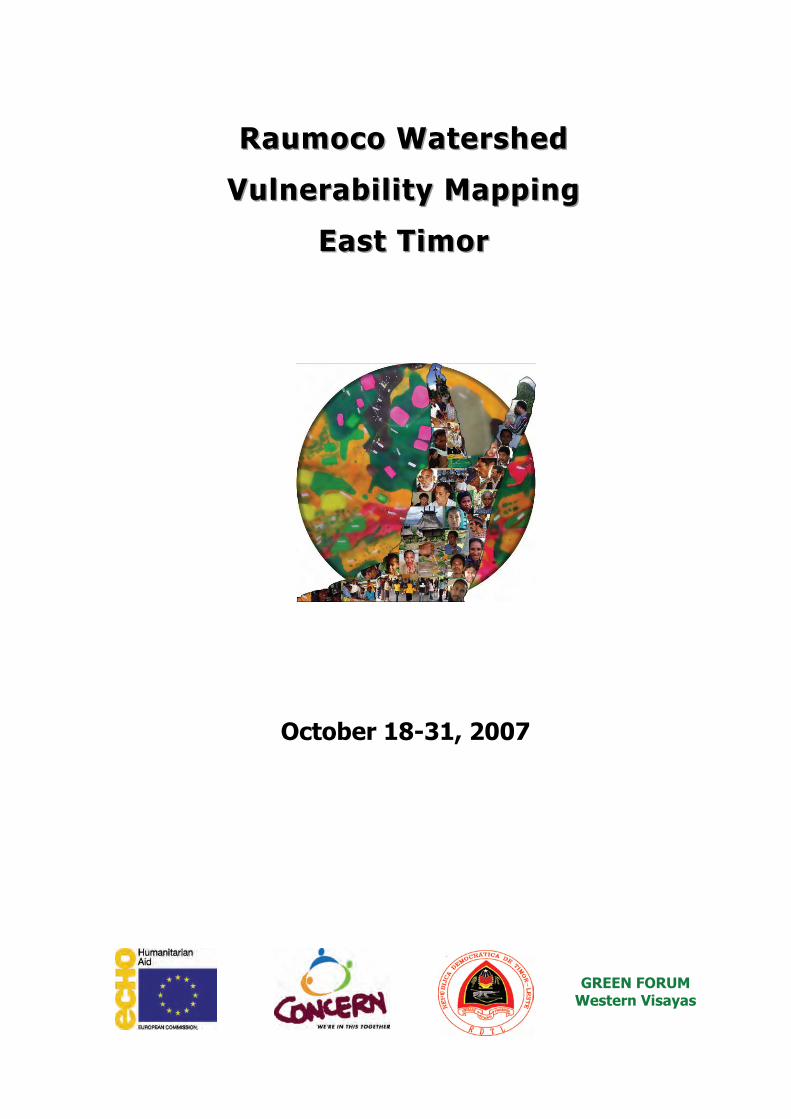
RRRaaauuummmooocccooo WWWaaattteeerrrssshhheeeddd
VVVuuulllnnneeerrraaabbbiiilll iiitttyyy MMMaaappppppiiinnnggg
EEEaaasssttt TTTiiimmmooorrr
October 18-31, 2007
GREEN FORUM Western Visayas
Raumoco Watershed Vulnerability Mapping, East Timor
2
Contents
Executive Summary 3
Background 4
Disaster Management Basic Concepts and Terminologies 5
PGIS Refresher Course and Database Infrastructure Building 7
Community Vulnerability Mapping Activities 8
Hazard Assessment 10
Vulnerability Assessment 15
Capacity Assessment 17
Recommendations 18
Annexes
1. Review Materials for Digitizing and ArcGIS Operations 19
2. Schedule of Activities. Participatory Vulnerability Mapping 24
3. List of Participants 25
Raumoco Watershed Vulnerability Mapping, East Timor
3
Executive Summary
“Hadomi Rekursu Natureza . . . Hanesan Ita Nia an Rasik!”
Lautem District Planning and Development Officer Lino Pereira aptly suggested adopting
the slogan above in the closing program of the Raumoco Watershed Vulnerability Mapping
calling all stakeholders to “love our natural resources as we love ourselves.” He said that
if they do not take care of their forests and rivers then they will also suffer the
consequences.
Mr. Pereira represented Lautem District Administrator Olavio D. Jesus Monteiro in the
Stakeholders Presentation of the results of the Vulnerability Mapping on October 31,
2007. The mapping activities were conducted from October 18 to 31, 2007 with
representatives of the Sub-District Disaster Management Councils, local government
units, the National Disaster Management Office (NDMO), partner local NGOs and
Concern Timor Leste Staff. It was a direct application of the capacity building training
on Participatory 3-Dimensional Modeling (P3DM) and Participatory Geographic
Information System (PGIS) made last August 2007.
The mapping activities have been characterized with active people’s participation
providing opportunities for collective data sharing and analysis on identifying hazards,
elements at risks, factors or causes why these elements are at risk and the
communities’ capacities to respond to disasters.
A smaller group, tagged as the PGIS Team (Participatory Geographic Information
System), trained on how to digitize the information shared in the 3-dimesional model.
Thematic maps on community resource-use, location of houses, infrastructures, and
the hazards were produced. By overlaying the thematic maps, analysis were made on
the extent of the impacts of these hazards.
The exercises linked the indigenous knowledge systems of the villages in the
Raumoco Watershed with the ‘cutting-edge technology’ of the GIS.
This report gives a background on the vulnerability mapping activities, highlights of the
community consultations, particularly on hazard, vulnerability, and capacity assessments.
Raumoco Watershed Vulnerability Mapping, East Timor
4
Background
The Raumoco Watershed Vulnerabil i ty Mapping is a fol low-up and
actual appl ication of the the Part ic ipatory 3-Dimensional Model ing
(P3DM) and Part icipatory Geographic Information System (PGIS)
conducted last August 2007 in Lospalos, Lautem Distr ict. P3DM was
introduced as a tool for partner communit ies and other key
stakeholders to understand better the physical and biological
characterist ics of their watershed and how hazards l ike f looding and
drought impact their l ivel ihoods and l iving condit ions.
This is part of Concern Worldwide’s Coordinated Actions for Disaster
Risk Reduction Empowerment (CADRE) Programme. CADRE that is a 15-
month project funded by DIPECHO under its 5th Action Plan for
Southeast Asia. Earl ier trainings on Capacity Building for Disaster Risk
Reduction Programme in Lautem Distr ict were implemented from
February 2005 to Apri l 2006 under DIPECHO’s 4th Action Plan.
CADRE aims to contribute in reducing the vulnerabi l i t ies of
communit ies from disasters caused by floods and droughts through the
development of sustainable, repl icable, and coordinated preparedness
and mit igation actions at the local, national and regional levels.
Specif ical ly, i t works on improving the capacit ies and strategies of poor
and vulnerable sectors and other key stakeholders for disaster r isk
reduction.
The Programme is currently focused in the Raumoco Watershed that is
under the administrative jurisdict ion of two sub-distr icts, namely Luro
and Muro. The Watershed Divide covers nine (9) vi l lages: Afabubo,
Baricafa, Kotamuto, Lakawa, Luro, and Wairoke in Luro Sub-Distr ict;
and Daudere, Maina II and Serelau in Muro Sub-Distr ict. Afabubo,
Daudere, and part of Kotamuto suffer the brunt of annual incidents of
f lashfloods and al l nine vi l lages suffer food shortages caused by
drought and the changing weather patterns.
Raumoco Watershed Vulnerability Mapping, East Timor
5
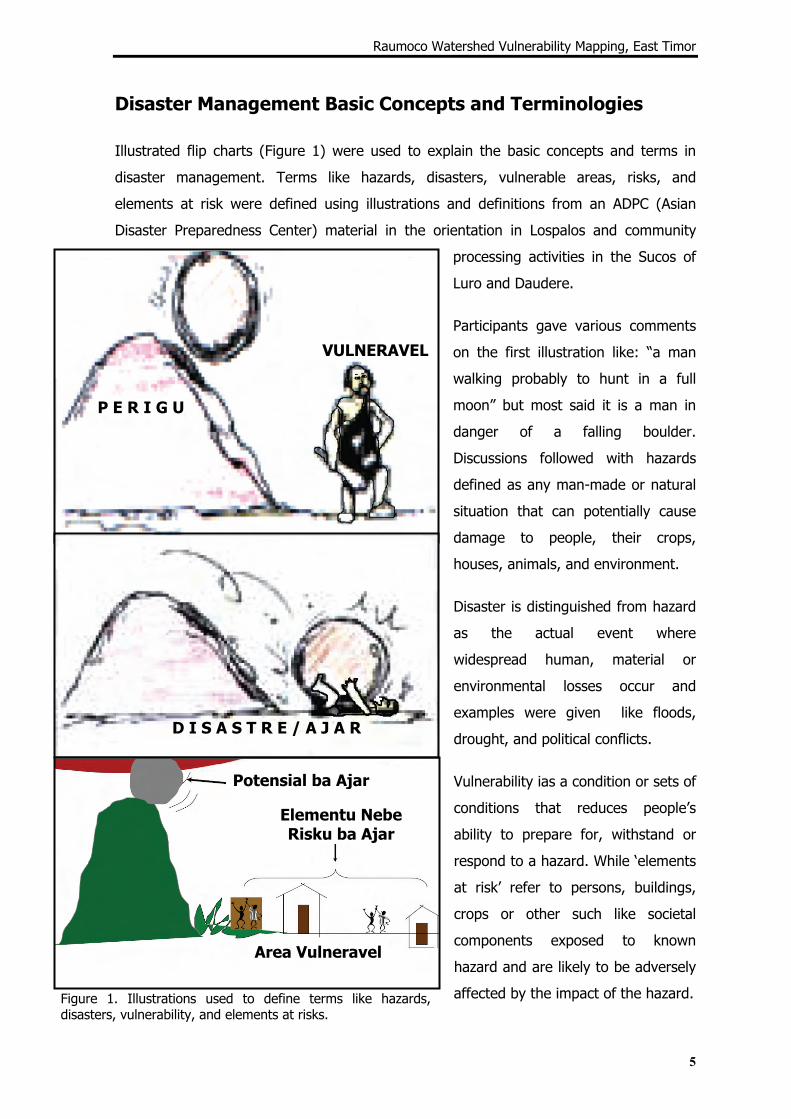
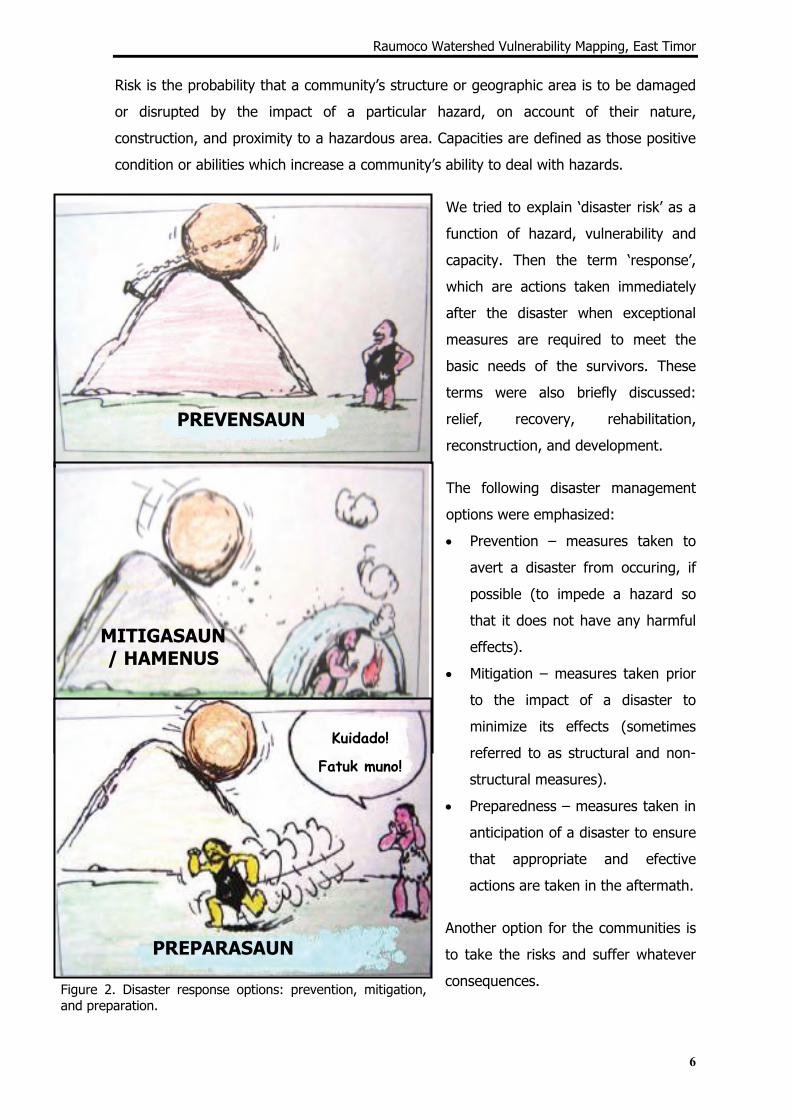
Figure 1. Illustrations used to define terms like hazards, disasters, vulnerability, and elements at risks.
P E R I G U
D I S A S T R E / A J A R
Potensial ba Ajar
Elementu Nebe Risku ba Ajar
Area Vulneravel
VULNERAVEL
Disaster Management Basic Concepts and Terminologies
Illustrated flip charts (Figure 1) were used to explain the basic concepts and terms in
disaster management. Terms like hazards, disasters, vulnerable areas, risks, and
elements at risk were defined using illustrations and definitions from an ADPC (Asian
Disaster Preparedness Center) material in the orientation in Lospalos and community
processing activities in the Sucos of
Luro and Daudere.
Participants gave various comments
on the first illustration like: “a man
walking probably to hunt in a full
moon” but most said it is a man in
danger of a falling boulder.
Discussions followed with hazards
defined as any man-made or natural
situation that can potentially cause
damage to people, their crops,
houses, animals, and environment.
Disaster is distinguished from hazard
as the actual event where
widespread human, material or
environmental losses occur and
examples were given like floods,
drought, and political conflicts.
Vulnerability ias a condition or sets of
conditions that reduces people’s
ability to prepare for, withstand or
respond to a hazard. While ‘elements
at risk’ refer to persons, buildings,
crops or other such like societal
components exposed to known
hazard and are likely to be adversely
affected by the impact of the hazard.
Raumoco Watershed Vulnerability Mapping, East Timor
6
Figure 2. Disaster response options: prevention, mitigation, and preparation.
PREVENSAUN
MITIGASAUN / HAMENUS
PREPARASAUN
Kuidado!
Fatuk muno!
Risk is the probability that a community’s structure or geographic area is to be damaged
or disrupted by the impact of a particular hazard, on account of their nature,
construction, and proximity to a hazardous area. Capacities are defined as those positive
condition or abilities which increase a community’s ability to deal with hazards.
We tried to explain ‘disaster risk’ as a
function of hazard, vulnerability and
capacity. Then the term ‘response’,
which are actions taken immediately
after the disaster when exceptional
measures are required to meet the
basic needs of the survivors. These
terms were also briefly discussed:
relief, recovery, rehabilitation,
reconstruction, and development.
The following disaster management
options were emphasized:
• Prevention – measures taken to
avert a disaster from occuring, if
possible (to impede a hazard so
that it does not have any harmful
effects).
• Mitigation – measures taken prior
to the impact of a disaster to
minimize its effects (sometimes
referred to as structural and non-
structural measures).
• Preparedness – measures taken in
anticipation of a disaster to ensure
that appropriate and efective
actions are taken in the aftermath.
Another option for the communities is
to take the risks and suffer whatever
consequences.
Raumoco Watershed Vulnerability Mapping, East Timor
7
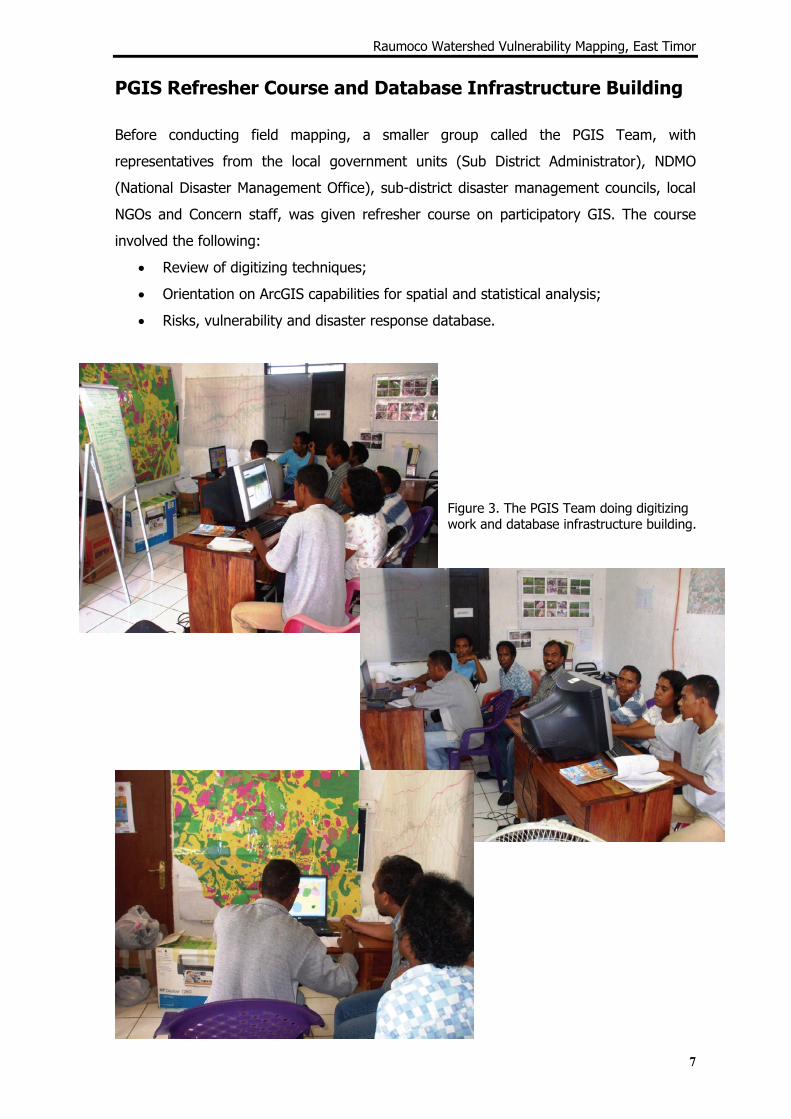
PGIS Refresher Course and Database Infrastructure Building
Before conducting field mapping, a smaller group called the PGIS Team, with
representatives from the local government units (Sub District Administrator), NDMO
(National Disaster Management Office), sub-district disaster management councils, local
NGOs and Concern staff, was given refresher course on participatory GIS. The course
involved the following:
• Review of digitizing techniques;
• Orientation on ArcGIS capabilities for spatial and statistical analysis;
• Risks, vulnerability and disaster response database.
Figure 3. The PGIS Team doing digitizing work and database infrastructure building.
Raumoco Watershed Vulnerability Mapping, East Timor
8
Community Vulnerability Mapping Activities
The P3D model measuring 1.95 meters wide by 2.81 meters long was brought by truck
from Lospalos to the upland village of Luro and later to Daudere. Representatives of the
upland villages of the Raumoco Watershed namely: Baricafa, Luro Lakawa, Wairoke,
Kutamoto and Afabubo gathered at the Sub-District Administration Office in Suco Luro on
October 23-24. While the representatives of downstream villages of Daudere, Serelau,
Maina 1 and Maina 2 gathered at the Village Office in Suco Daudere on October 25-26.
Participants raised the following objectives:
• To learn and share information about the possible hazards of their villages;
• To use the P3D model in identifying disaster risks and pass the information to
their villages;
• To learn technologies and experiences on animal husbandry;
• To learn technologies on protection of springs and water systems;
• To know how international NGOs like Concern, local and national government
agencies and the villages can collaborate in disaster preparedness and response.
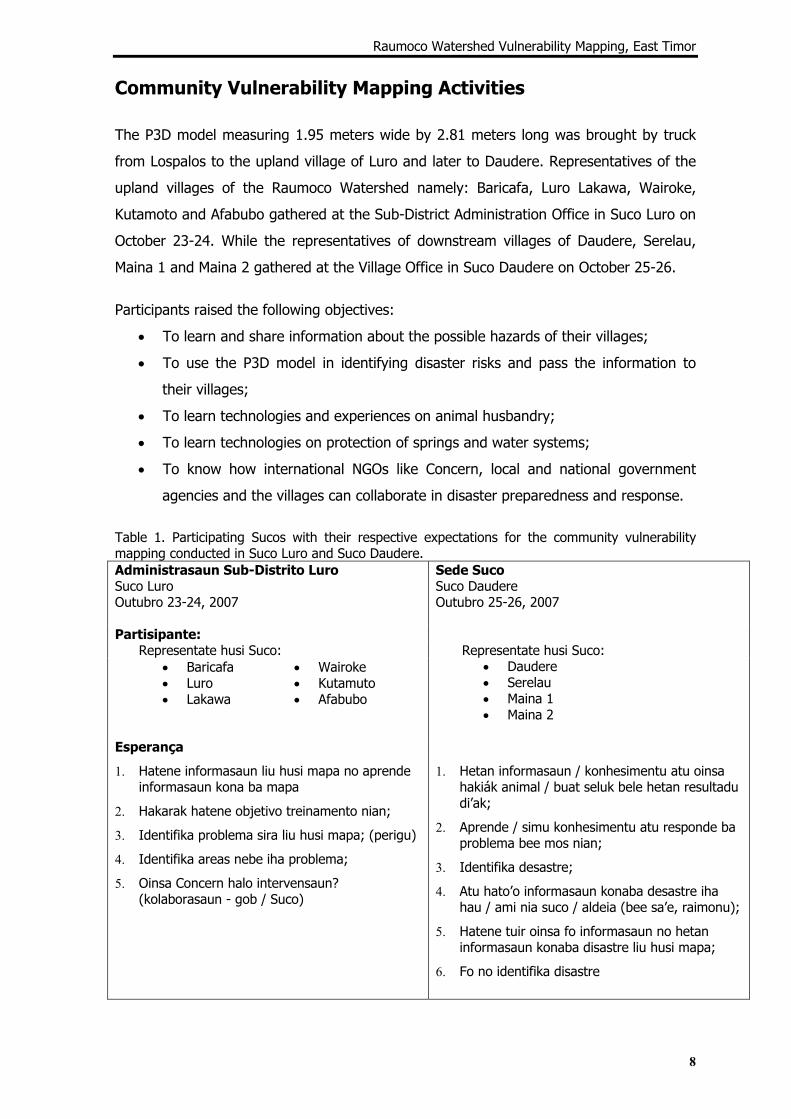
Table 1. Participating Sucos with their respective expectations for the community vulnerability mapping conducted in Suco Luro and Suco Daudere. Administrasaun Sub-Distrito Luro Suco Luro Outubro 23-24, 2007
Sede Suco Suco Daudere Outubro 25-26, 2007
Partisipante: Representate husi Suco:
• Baricafa • Luro • Lakawa
• Wairoke • Kutamuto • Afabubo
Representate husi Suco: • Daudere • Serelau • Maina 1 • Maina 2
Esperança
1. Hatene informasaun liu husi mapa no aprende informasaun kona ba mapa
2. Hakarak hatene objetivo treinamento nian;
3. Identifika problema sira liu husi mapa; (perigu)
4. Identifika areas nebe iha problema;
5. Oinsa Concern halo intervensaun? (kolaborasaun - gob / Suco)
1. Hetan informasaun / konhesimentu atu oinsa hakiák animal / buat seluk bele hetan resultadu di’ak;
2. Aprende / simu konhesimentu atu responde ba problema bee mos nian;
3. Identifika desastre;
4. Atu hato’o informasaun konaba desastre iha hau / ami nia suco / aldeia (bee sa’e, raimonu);
5. Hatene tuir oinsa fo informasaun no hetan informasaun konaba disastre liu husi mapa;
6. Fo no identifika disastre
Raumoco Watershed Vulnerability Mapping, East Timor
9
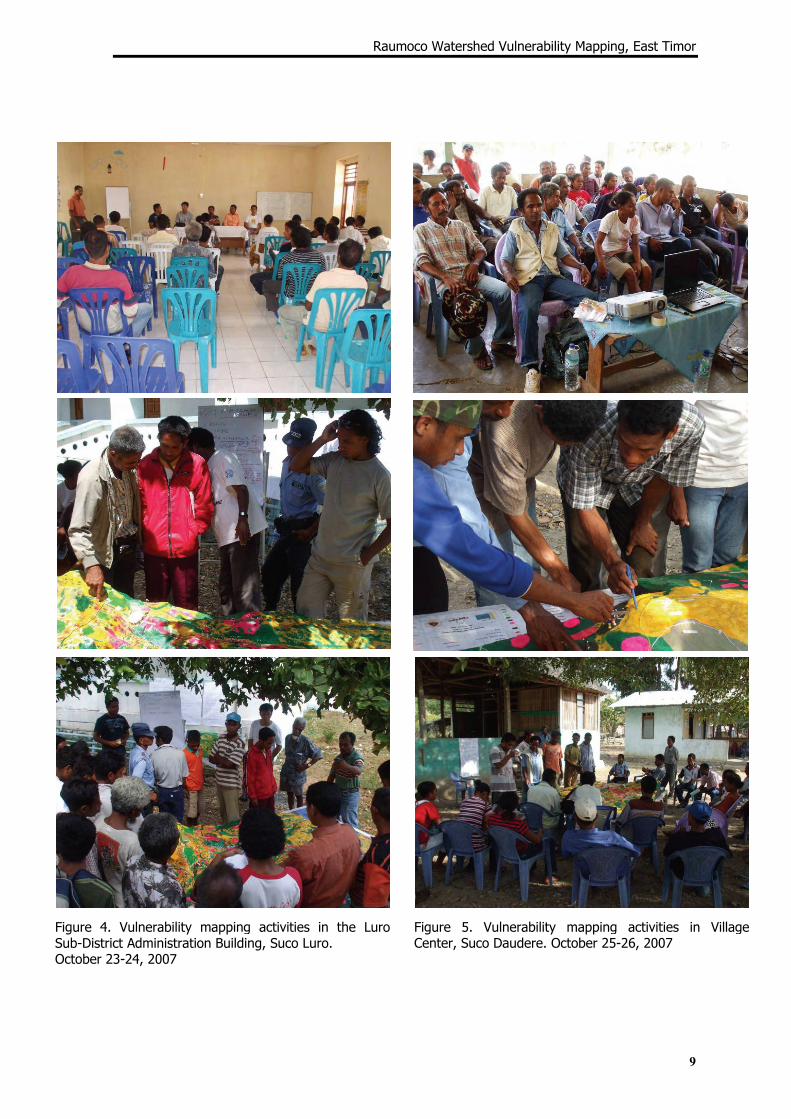
Figure 4. Vulnerability mapping activities in the LuroSub-District Administration Building, Suco Luro. October 23-24, 2007
Figure 5. Vulnerability mapping activities in Village Center, Suco Daudere. October 25-26, 2007
Raumoco Watershed Vulnerability Mapping, East Timor
10
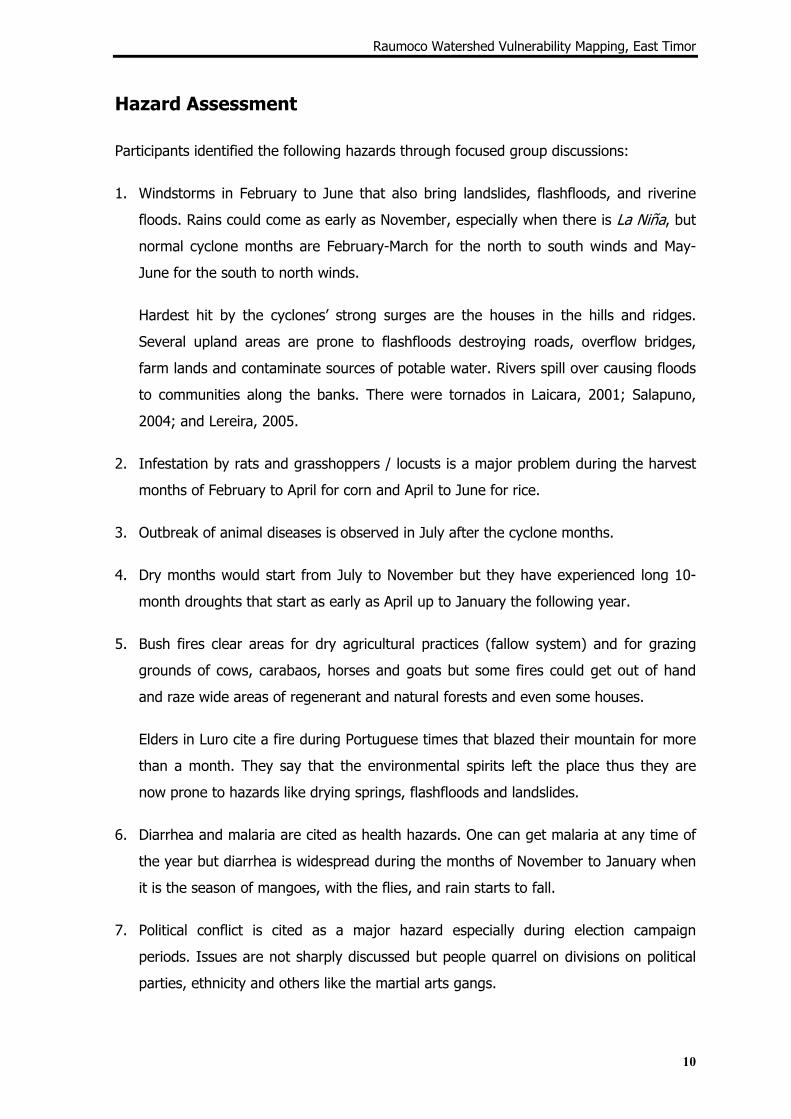
Hazard Assessment
Participants identified the following hazards through focused group discussions:
1. Windstorms in February to June that also bring landslides, flashfloods, and riverine
floods. Rains could come as early as November, especially when there is La Niña, but
normal cyclone months are February-March for the north to south winds and May-
June for the south to north winds.
Hardest hit by the cyclones’ strong surges are the houses in the hills and ridges.
Several upland areas are prone to flashfloods destroying roads, overflow bridges,
farm lands and contaminate sources of potable water. Rivers spill over causing floods
to communities along the banks. There were tornados in Laicara, 2001; Salapuno,
2004; and Lereira, 2005.
2. Infestation by rats and grasshoppers / locusts is a major problem during the harvest
months of February to April for corn and April to June for rice.
3. Outbreak of animal diseases is observed in July after the cyclone months.
4. Dry months would start from July to November but they have experienced long 10-
month droughts that start as early as April up to January the following year.
5. Bush fires clear areas for dry agricultural practices (fallow system) and for grazing
grounds of cows, carabaos, horses and goats but some fires could get out of hand
and raze wide areas of regenerant and natural forests and even some houses.
Elders in Luro cite a fire during Portuguese times that blazed their mountain for more
than a month. They say that the environmental spirits left the place thus they are
now prone to hazards like drying springs, flashfloods and landslides.
6. Diarrhea and malaria are cited as health hazards. One can get malaria at any time of
the year but diarrhea is widespread during the months of November to January when
it is the season of mangoes, with the flies, and rain starts to fall.
7. Political conflict is cited as a major hazard especially during election campaign
periods. Issues are not sharply discussed but people quarrel on divisions on political
parties, ethnicity and others like the martial arts gangs.
Raumoco Watershed Vulnerability Mapping, East Timor
11
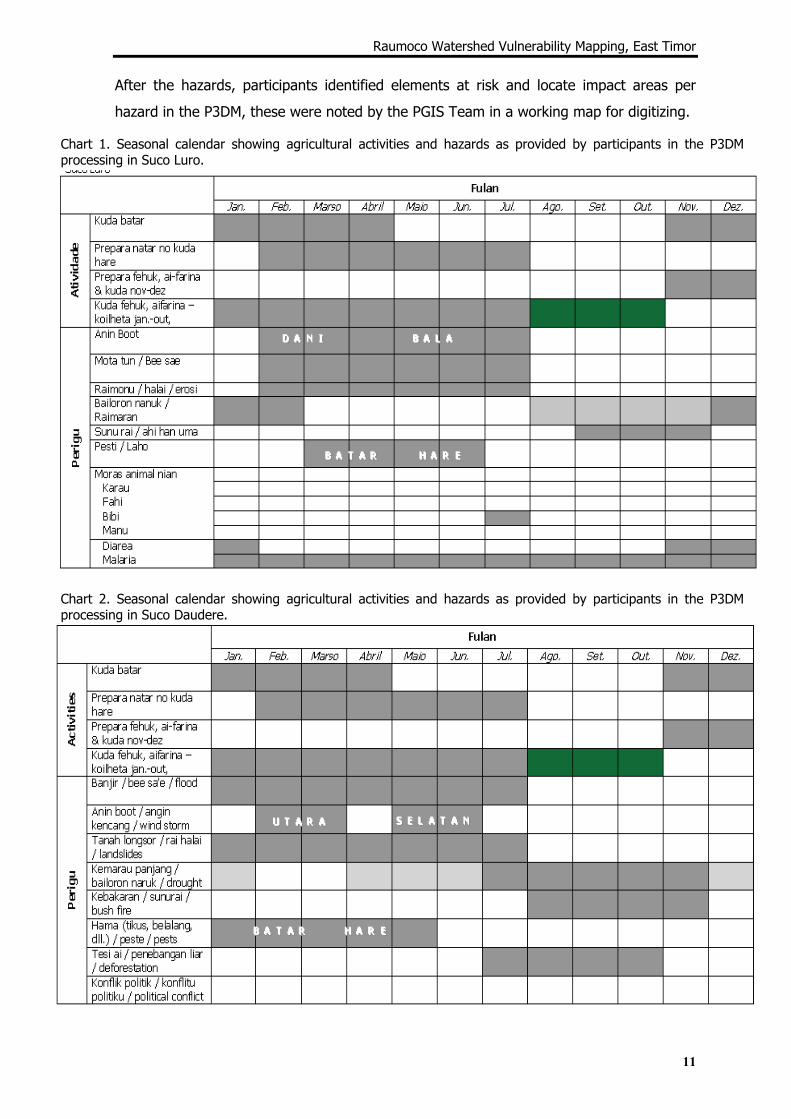
Chart 1. Seasonal calendar showing agricultural activities and hazards as provided by participants in the P3DM processing in Suco Luro.
Chart 2. Seasonal calendar showing agricultural activities and hazards as provided by participants in the P3DM processing in Suco Daudere.
After the hazards, participants identified elements at risk and locate impact areas per
hazard in the P3DM, these were noted by the PGIS Team in a working map for digitizing.
Raumoco Watershed Vulnerability Mapping, East Timor
12
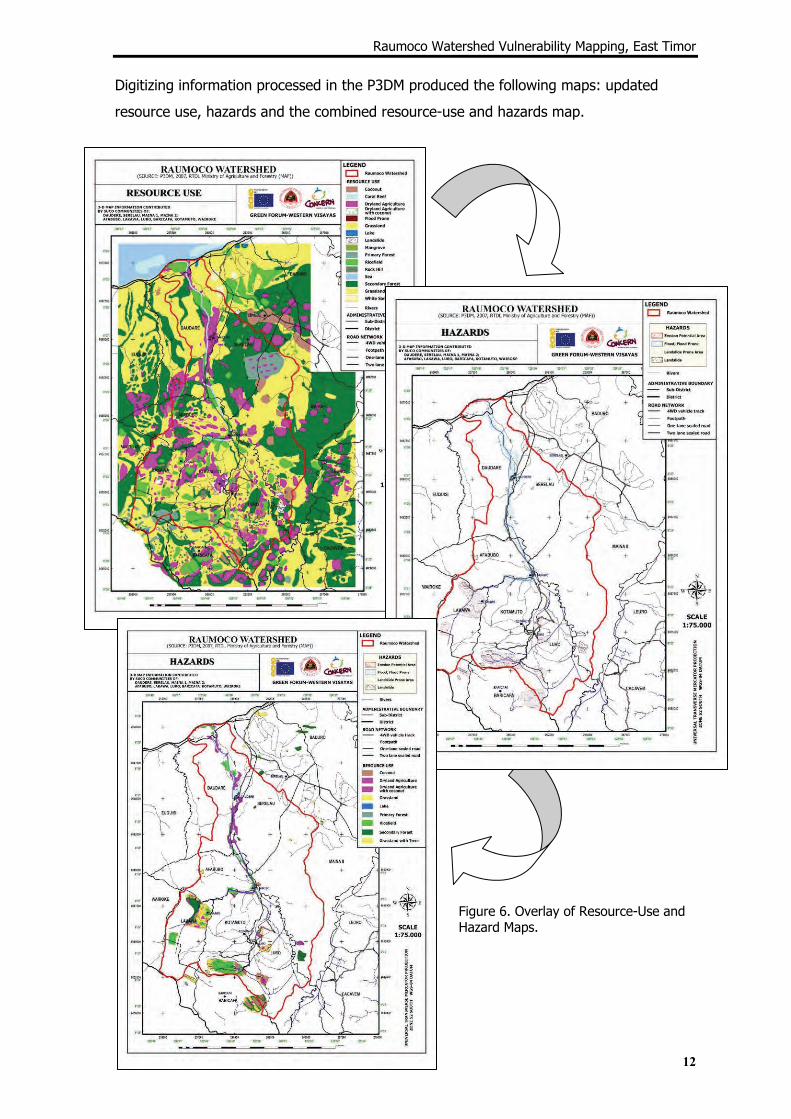
Digitizing information processed in the P3DM produced the following maps: updated
resource use, hazards and the combined resource-use and hazards map.
Figure 6. Overlay of Resource-Use and Hazard Maps.
Raumoco Watershed Vulnerability Mapping, East Timor
13
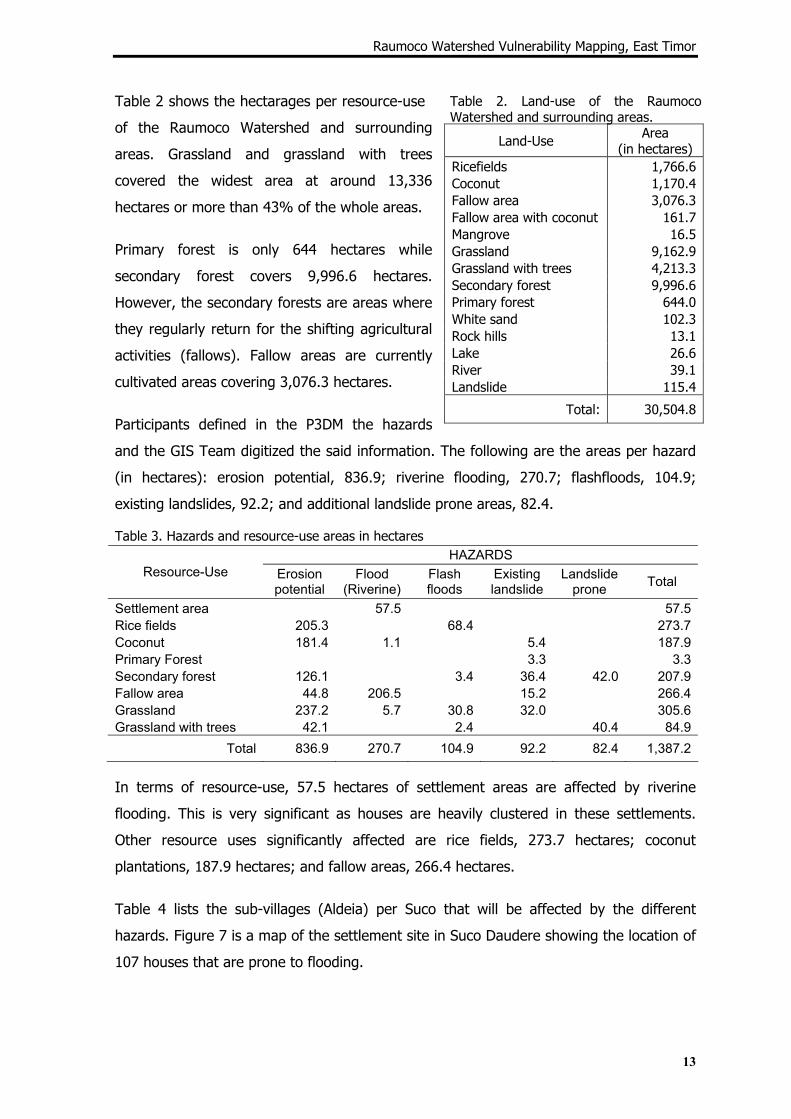
Table 2. Land-use of the Raumoco Watershed and surrounding areas.
Table 3. Hazards and resource-use areas in hectares
Table 2 shows the hectarages per resource-use
of the Raumoco Watershed and surrounding
areas. Grassland and grassland with trees
covered the widest area at around 13,336
hectares or more than 43% of the whole areas.
Primary forest is only 644 hectares while
secondary forest covers 9,996.6 hectares.
However, the secondary forests are areas where
they regularly return for the shifting agricultural
activities (fallows). Fallow areas are currently
cultivated areas covering 3,076.3 hectares.
Participants defined in the P3DM the hazards
and the GIS Team digitized the said information. The following are the areas per hazard
(in hectares): erosion potential, 836.9; riverine flooding, 270.7; flashfloods, 104.9;
existing landslides, 92.2; and additional landslide prone areas, 82.4.
In terms of resource-use, 57.5 hectares of settlement areas are affected by riverine
flooding. This is very significant as houses are heavily clustered in these settlements.
Other resource uses significantly affected are rice fields, 273.7 hectares; coconut
plantations, 187.9 hectares; and fallow areas, 266.4 hectares.
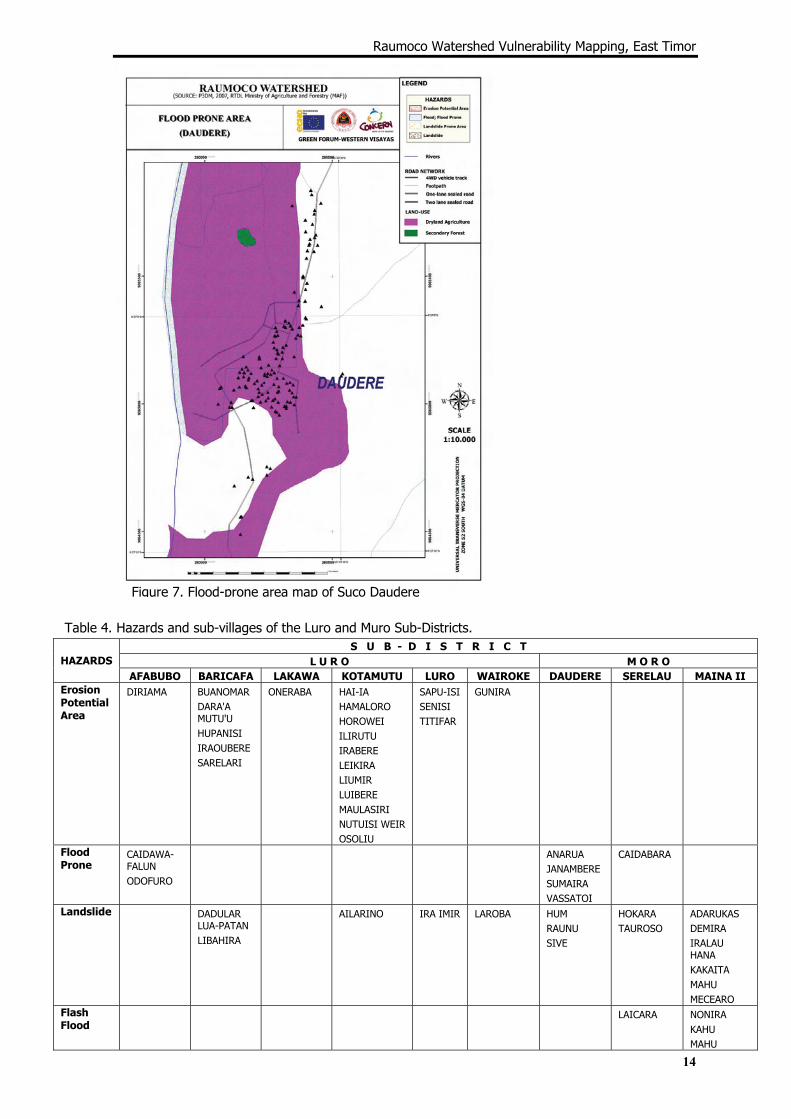
Table 4 lists the sub-villages (Aldeia) per Suco that will be affected by the different
hazards. Figure 7 is a map of the settlement site in Suco Daudere showing the location of
107 houses that are prone to flooding.
Land-Use Area (in hectares)
Ricefields 1,766.6Coconut 1,170.4Fallow area 3,076.3Fallow area with coconut 161.7Mangrove 16.5Grassland 9,162.9Grassland with trees 4,213.3Secondary forest 9,996.6Primary forest 644.0White sand 102.3Rock hills 13.1Lake 26.6River 39.1Landslide 115.4
Total: 30,504.8
HAZARDS Resource-Use Erosion
potential Flood
(Riverine)Flash floods
Existing landslide
Landslide prone Total
Settlement area 57.5 57.5Rice fields 205.3 68.4 273.7Coconut 181.4 1.1 5.4 187.9Primary Forest 3.3 3.3Secondary forest 126.1 3.4 36.4 42.0 207.9Fallow area 44.8 206.5 15.2 266.4Grassland 237.2 5.7 30.8 32.0 305.6Grassland with trees 42.1 2.4 40.4 84.9
Total 836.9 270.7 104.9 92.2 82.4 1,387.2
Raumoco Watershed Vulnerability Mapping, East Timor
14
Figure 7. Flood-prone area map of Suco Daudere
S U B - D I S T R I C T L U R O M O R O HAZARDS
AFABUBO BARICAFA LAKAWA KOTAMUTU LURO WAIROKE DAUDERE SERELAU MAINA II Erosion Potential Area
DIRIAMA BUANOMAR DARA'A MUTU'U HUPANISI IRAOUBERE SARELARI
ONERABA HAI-IA HAMALORO HOROWEI ILIRUTU IRABERE LEIKIRA LIUMIR LUIBERE MAULASIRI NUTUISI WEIR OSOLIU
SAPU-ISI SENISI TITIFAR
GUNIRA
Flood Prone
CAIDAWA-FALUN ODOFURO
ANARUA JANAMBERE SUMAIRA VASSATOI
CAIDABARA
Landslide
DADULAR LUA-PATAN LIBAHIRA
AILARINO
IRA IMIR
LAROBA
HUM RAUNU SIVE
HOKARA TAUROSO
ADARUKAS DEMIRA IRALAU HANA KAKAITA MAHU MECEARO
Flash Flood
LAICARA NONIRA KAHU MAHU
Table 4. Hazards and sub-villages of the Luro and Muro Sub-Districts.
Raumoco Watershed Vulnerability Mapping, East Timor
15
Vulnerability Assessment
Factors that contribute to vulnerabilities for windstorms and floodings are geo-physical,
biological and man-made causes. The geo-physical structure of the watershed is like a
funnel - wide basin (13,393 hectares rain catchments) with a very narrow outlet (less
than 100 meters wide). Biologically, there is only about 644 hectares of remaining mossy
forest in the headwaters or 4.8% of the watershed area has natural vegetation that could
absorb heavy precipitation and mitigate run-off.
Denuded hills and ridges expose houses and animals to storm surges / lack of trees as
natural windbreaks. Location of communities and the materials and quality of house
constructions are also important factors.
Portions of the roads are destroyed because there is no drainage, substandard
workmanship, built along natural waterways or in a confluence of creeks and rivers.
Bridges are destroyed because the ‘landings’ are not properly ripraped. Landslides are
caused by combinations of steep slopes, denuded hills and mountains, clay soil type, and
heavy downpours. Water systems are dirtied when flashfloods inundate spring sources.
There is strong recognition that the annual burning of bush, grasslands and forests
hinders regeneration of natural forest and aggravated by the cutting of trees for fuel
wood and housing materials. Springs that never dry up before even with long droughts
are now drying. Habitat destruction is also linked to infestation of rats and grasshoppers
as the natural predators of these pests are almost gone.
They see that if the trend continues then things will go worse for their children and
grandchildren but their poverty situation and the absence of alternative agro-forestry and
sylvo-pastoral technologies press them to continue with the burning of grassland, bush,
and the remaining secondary and primary forests.
Their animals get prone to sickness after the typhoon months which they attribute to the
season and poor immunization program. However, several elders say that they have
experiences before when more animals died because others were vaccinated (virus could
have been brought by vaccinated animals).
Contaminated water source and poor sanitation are seen to contribute to diarrhea
outbreaks. Malaria is attributed to the carrier mosquitoes but they consider also poor
nutrition as a factor that reduces their bodies’ immune system.
Raumoco Watershed Vulnerability Mapping, East Timor
16
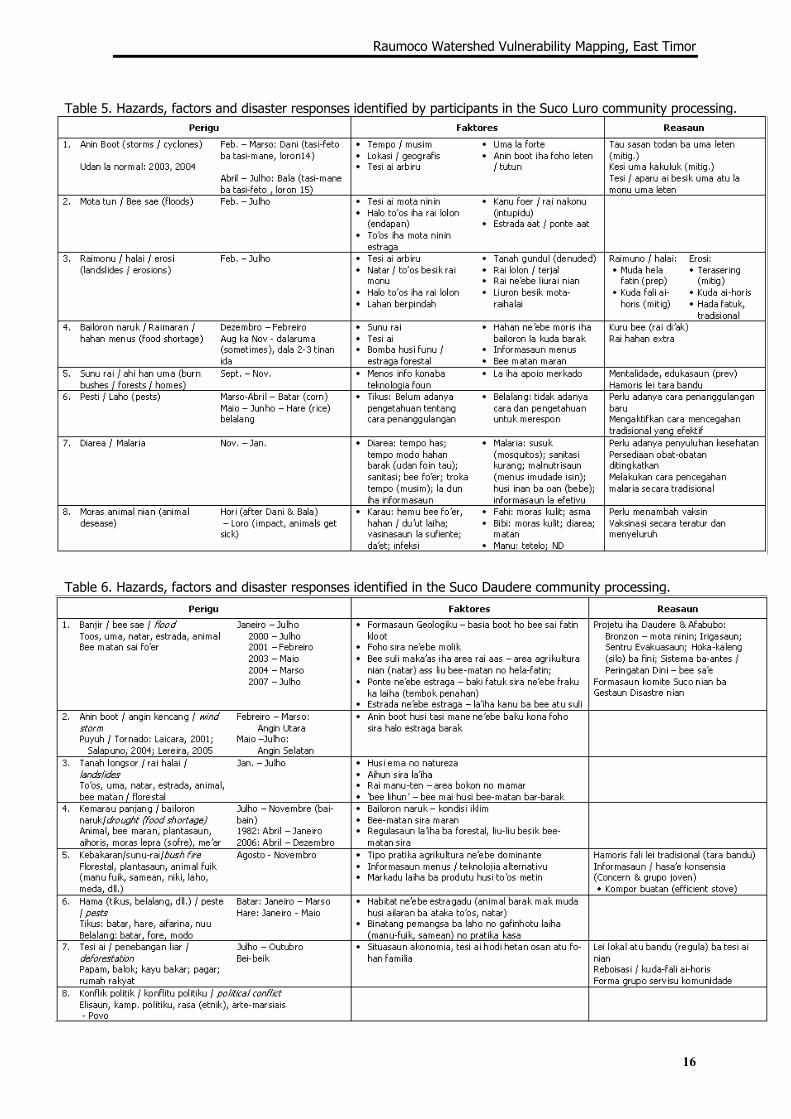
Table 5. Hazards, factors and disaster responses identified by participants in the Suco Luro community processing.
Table 6. Hazards, factors and disaster responses identified in the Suco Daudere community processing.
Raumoco Watershed Vulnerability Mapping, East Timor
17
Capacity Assessment
Several villages have organized their Suco (village) disaster management councils and
implemented mitigation and preparedness measures like the construction of gabions for
riverbank stabilization and irrigation systems, flood early warning system, evacuation
centers, and seed silos. There are, however, several Sucos (Serelau, Maina 1, and Maina
2) that have just started to join Concern’s program and have yet to organize their village
disaster management councils.
They recognize the value of maintaining the balance of the watershed ecosystem and the
grave impact of the economic pressures that force families to continue burning the
bushes and forests, cutting of trees, and destroying wildlife habitats.
The traditional systems of the ‘tara bandu’ that prohibits the use of certain places as
sacred areas should be revived. Colonial occupations and conflicts changed their
settlement patterns and cleared forests of the indigenous sandalwood trees. They
recognize that the degradation of their natural resource base has been deeply rooted to
centuries of colonialism but they need to reverse the trend.
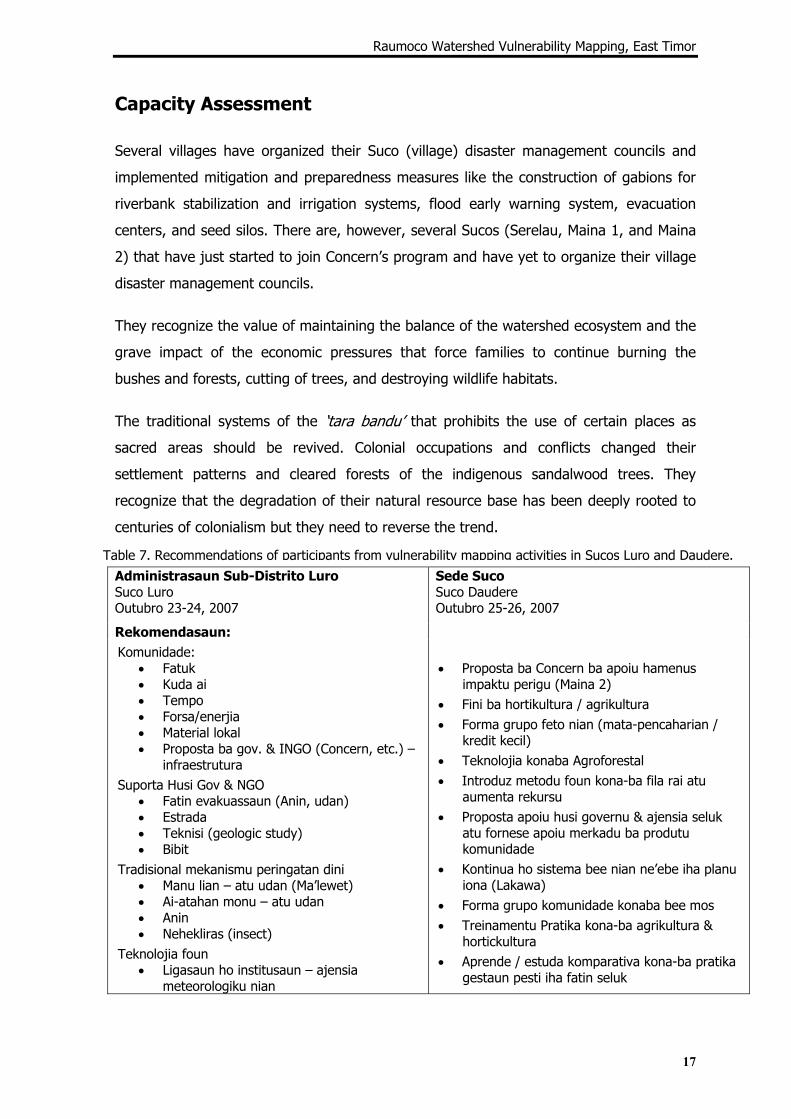
Administrasaun Sub-Distrito Luro Suco Luro Outubro 23-24, 2007
Sede Suco Suco Daudere Outubro 25-26, 2007
Rekomendasaun: Komunidade:
• Fatuk • Kuda ai • Tempo • Forsa/enerjia • Material lokal • Proposta ba gov. & INGO (Concern, etc.) –
infraestrutura Suporta Husi Gov & NGO
• Fatin evakuassaun (Anin, udan) • Estrada • Teknisi (geologic study) • Bibit
Tradisional mekanismu peringatan dini • Manu lian – atu udan (Ma’lewet) • Ai-atahan monu – atu udan • Anin • Nehekliras (insect)
Teknolojia foun • Ligasaun ho institusaun – ajensia
meteorologiku nian
• Proposta ba Concern ba apoiu hamenus
impaktu perigu (Maina 2) • Fini ba hortikultura / agrikultura • Forma grupo feto nian (mata-pencaharian /
kredit kecil) • Teknolojia konaba Agroforestal • Introduz metodu foun kona-ba fila rai atu
aumenta rekursu • Proposta apoiu husi governu & ajensia seluk
atu fornese apoiu merkadu ba produtu komunidade
• Kontinua ho sistema bee nian ne’ebe iha planu iona (Lakawa)
• Forma grupo komunidade konaba bee mos • Treinamentu Pratika kona-ba agrikultura &
hortickultura • Aprende / estuda komparativa kona-ba pratika
gestaun pesti iha fatin seluk
Table 7. Recommendations of participants from vulnerability mapping activities in Sucos Luro and Daudere.
Raumoco Watershed Vulnerability Mapping, East Timor
18
For reforestation and other mitigation measures, the communities volunteer their time,
energies and local materials but they need farm tools and implements, alternative
appropriate technologies, and markets for their produce. They need exposure to
community-based agroforestry, sylvopastoral and integrated watershed management
sites. This should be complemented with ‘social marketing’ through community education
and information campaigns.
They suggested the formation of sectoral organizations like women and youth to
implement community programs on livelihood, education and information dissemination.
Government is called to repair the roads and bridges and provide heavy earth-moving
equipments for civil works on riverbank stabilization.
Recommendations
Participatory land-use planning should be undertaken to define the strategic economic
development and ecological protection strategies for the whole watershed divide. The
remaining natural forests should immediately be protected with the mother trees, critical
habitats and water spring sources mapped out and communities trained on participatory
biodiversity assessment and monitoring.
Detailed geo-morphologic study should be undertaken to define the geo-hazard areas
and prepare the resettlements for those affected by these hazards. Early warning
systems should be developed with basic community traditional and technical hydro-
meteorological monitoring tools. There should be close linkages with meteorological
agencies at the district, national, and international levels with mechanisms for data
sharing and analysis.
Local government units, national agencies and communities should develop protocols for
immediate disaster responses per hazard with simulation exercises in schools and
communities. Standards for constructions of houses, schools and other buildings should
be established.
GIS capabilities of Government Agencies, LGUs and NGOs should be further developed
with support for computer software and hardware.
Raumoco Watershed Vulnerability Mapping, East Timor
19
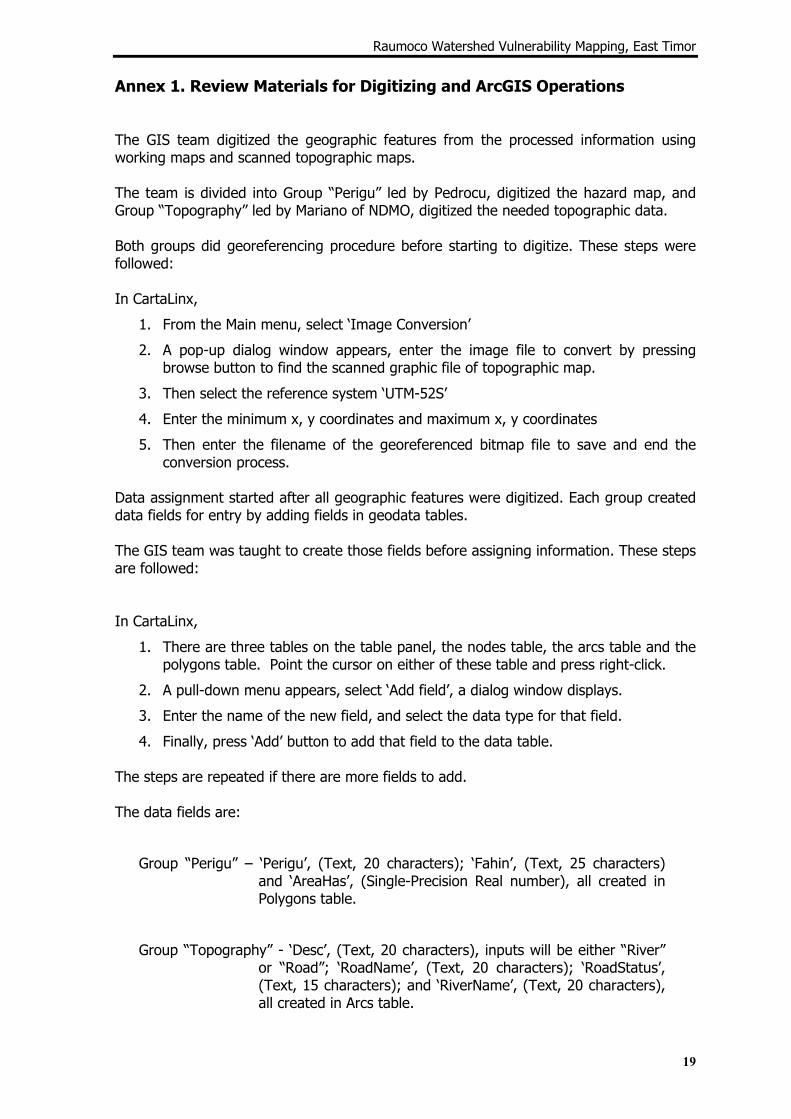
Annex 1. Review Materials for Digitizing and ArcGIS Operations The GIS team digitized the geographic features from the processed information using working maps and scanned topographic maps. The team is divided into Group “Perigu” led by Pedrocu, digitized the hazard map, and Group “Topography” led by Mariano of NDMO, digitized the needed topographic data. Both groups did georeferencing procedure before starting to digitize. These steps were followed: In CartaLinx,
1. From the Main menu, select ‘Image Conversion’
2. A pop-up dialog window appears, enter the image file to convert by pressing browse button to find the scanned graphic file of topographic map.
3. Then select the reference system ‘UTM-52S’
4. Enter the minimum x, y coordinates and maximum x, y coordinates
5. Then enter the filename of the georeferenced bitmap file to save and end the conversion process.
Data assignment started after all geographic features were digitized. Each group created data fields for entry by adding fields in geodata tables. The GIS team was taught to create those fields before assigning information. These steps are followed: In CartaLinx,
1. There are three tables on the table panel, the nodes table, the arcs table and the polygons table. Point the cursor on either of these table and press right-click.
2. A pull-down menu appears, select ‘Add field’, a dialog window displays.
3. Enter the name of the new field, and select the data type for that field.
4. Finally, press ‘Add’ button to add that field to the data table. The steps are repeated if there are more fields to add. The data fields are:
Group “Perigu” – ‘Perigu’, (Text, 20 characters); ‘Fahin’, (Text, 25 characters) and ‘AreaHas’, (Single-Precision Real number), all created in Polygons table.
Group “Topography” - ‘Desc’, (Text, 20 characters), inputs will be either “River” or “Road”; ‘RoadName’, (Text, 20 characters); ‘RoadStatus’, (Text, 15 characters); and ‘RiverName’, (Text, 20 characters), all created in Arcs table.
Raumoco Watershed Vulnerability Mapping, East Timor
20
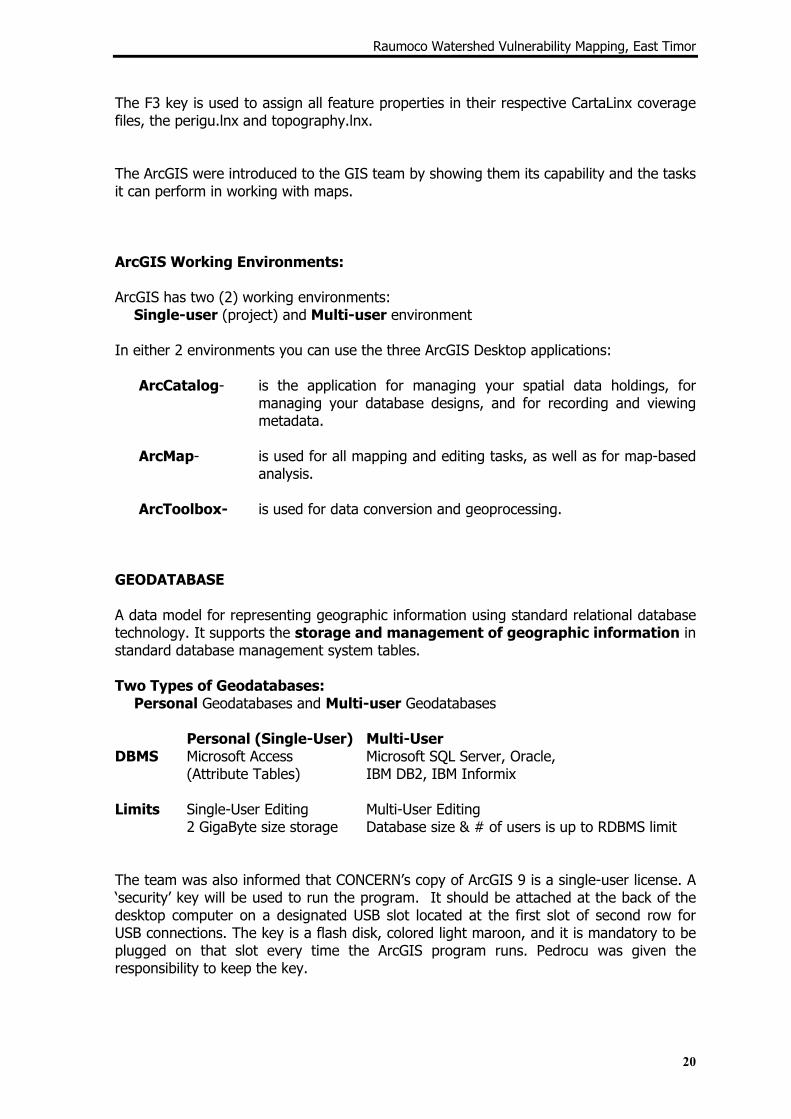
The F3 key is used to assign all feature properties in their respective CartaLinx coverage files, the perigu.lnx and topography.lnx. The ArcGIS were introduced to the GIS team by showing them its capability and the tasks it can perform in working with maps. ArcGIS Working Environments: ArcGIS has two (2) working environments: Single-user (project) and Multi-user environment In either 2 environments you can use the three ArcGIS Desktop applications:
ArcCatalog- is the application for managing your spatial data holdings, for managing your database designs, and for recording and viewing metadata.
ArcMap- is used for all mapping and editing tasks, as well as for map-based
analysis. ArcToolbox- is used for data conversion and geoprocessing.
GEODATABASE A data model for representing geographic information using standard relational database technology. It supports the storage and management of geographic information in standard database management system tables. Two Types of Geodatabases: Personal Geodatabases and Multi-user Geodatabases Personal (Single-User) Multi-User DBMS Microsoft Access Microsoft SQL Server, Oracle, (Attribute Tables) IBM DB2, IBM Informix Limits Single-User Editing Multi-User Editing 2 GigaByte size storage Database size & # of users is up to RDBMS limit The team was also informed that CONCERN’s copy of ArcGIS 9 is a single-user license. A ‘security’ key will be used to run the program. It should be attached at the back of the desktop computer on a designated USB slot located at the first slot of second row for USB connections. The key is a flash disk, colored light maroon, and it is mandatory to be plugged on that slot every time the ArcGIS program runs. Pedrocu was given the responsibility to keep the key.
Raumoco Watershed Vulnerability Mapping, East Timor
21
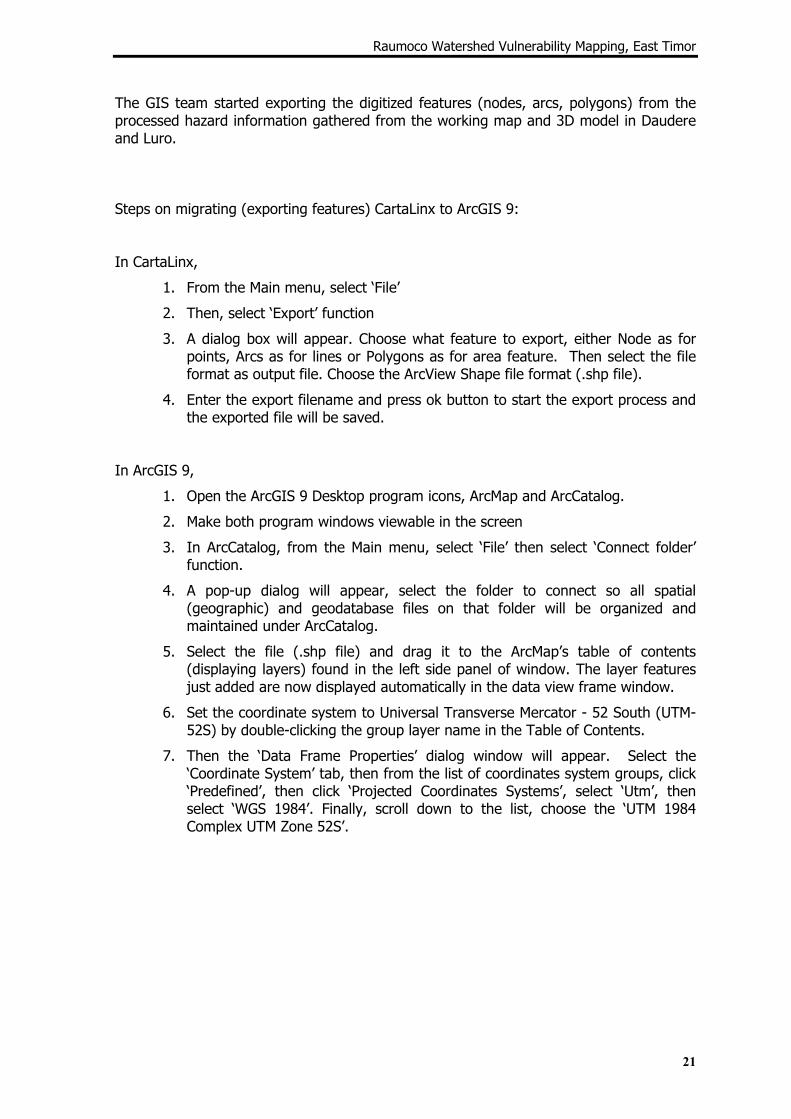
The GIS team started exporting the digitized features (nodes, arcs, polygons) from the processed hazard information gathered from the working map and 3D model in Daudere and Luro. Steps on migrating (exporting features) CartaLinx to ArcGIS 9: In CartaLinx,
1. From the Main menu, select ‘File’
2. Then, select ‘Export’ function
3. A dialog box will appear. Choose what feature to export, either Node as for points, Arcs as for lines or Polygons as for area feature. Then select the file format as output file. Choose the ArcView Shape file format (.shp file).
4. Enter the export filename and press ok button to start the export process and the exported file will be saved.
In ArcGIS 9,
1. Open the ArcGIS 9 Desktop program icons, ArcMap and ArcCatalog.
2. Make both program windows viewable in the screen
3. In ArcCatalog, from the Main menu, select ‘File’ then select ‘Connect folder’ function.
4. A pop-up dialog will appear, select the folder to connect so all spatial (geographic) and geodatabase files on that folder will be organized and maintained under ArcCatalog.
5. Select the file (.shp file) and drag it to the ArcMap’s table of contents (displaying layers) found in the left side panel of window. The layer features just added are now displayed automatically in the data view frame window.
6. Set the coordinate system to Universal Transverse Mercator - 52 South (UTM-52S) by double-clicking the group layer name in the Table of Contents.
7. Then the ‘Data Frame Properties’ dialog window will appear. Select the ‘Coordinate System’ tab, then from the list of coordinates system groups, click ‘Predefined’, then click ‘Projected Coordinates Systems’, select ‘Utm’, then select ‘WGS 1984’. Finally, scroll down to the list, choose the ‘UTM 1984 Complex UTM Zone 52S’.
Raumoco Watershed Vulnerability Mapping, East Timor
22
Designing the Map (Lay-outing) The GIS team were shown how to make map layouts beginning on what map elements to put and overlaying sequences of layers. Map elements needed are as follows:
• Map Title
• Scalebar
• Legend
• North arrow
• Logo
• Map reference information – Universal Transverse Mercator Zone 52 South
• Source information – from the 3D Model, topographic map and data from MAF office
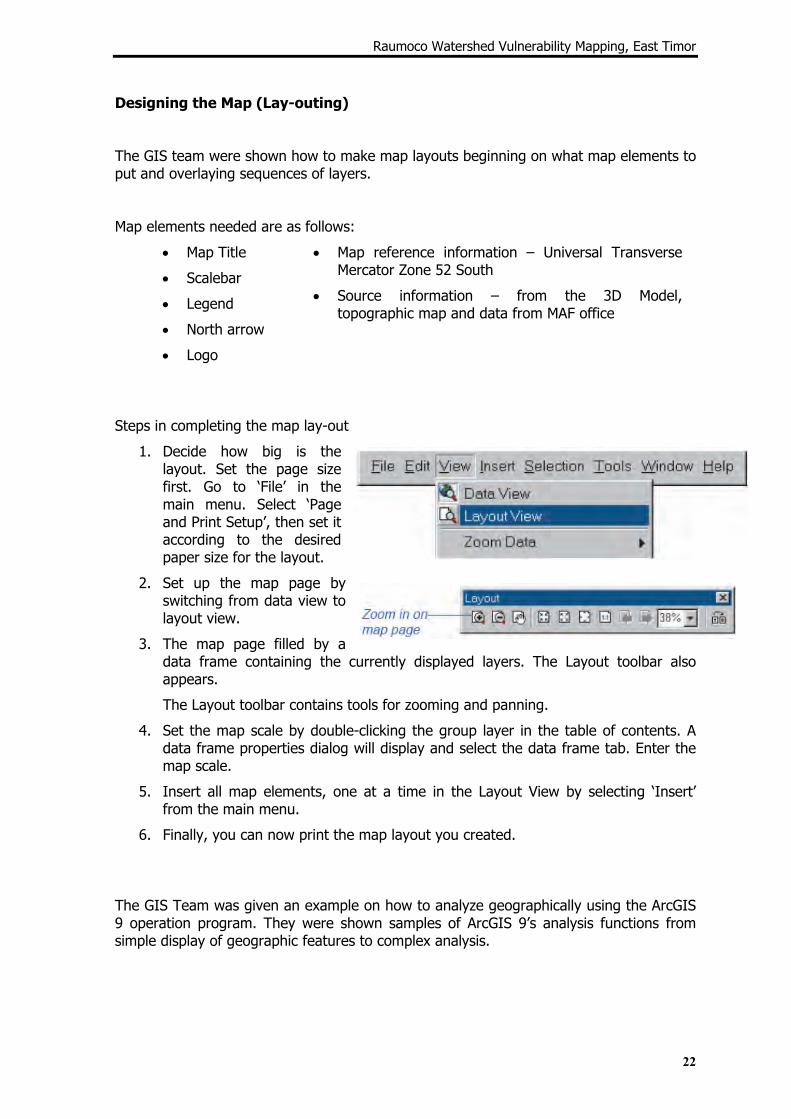
Steps in completing the map lay-out
1. Decide how big is the layout. Set the page size first. Go to ‘File’ in the main menu. Select ‘Page and Print Setup’, then set it according to the desired paper size for the layout.
2. Set up the map page by switching from data view to layout view.
3. The map page filled by a data frame containing the currently displayed layers. The Layout toolbar also appears.
The Layout toolbar contains tools for zooming and panning.
4. Set the map scale by double-clicking the group layer in the table of contents. A data frame properties dialog will display and select the data frame tab. Enter the map scale.
5. Insert all map elements, one at a time in the Layout View by selecting ‘Insert’ from the main menu.
6. Finally, you can now print the map layout you created. The GIS Team was given an example on how to analyze geographically using the ArcGIS 9 operation program. They were shown samples of ArcGIS 9’s analysis functions from simple display of geographic features to complex analysis.
Raumoco Watershed Vulnerability Mapping, East Timor
23
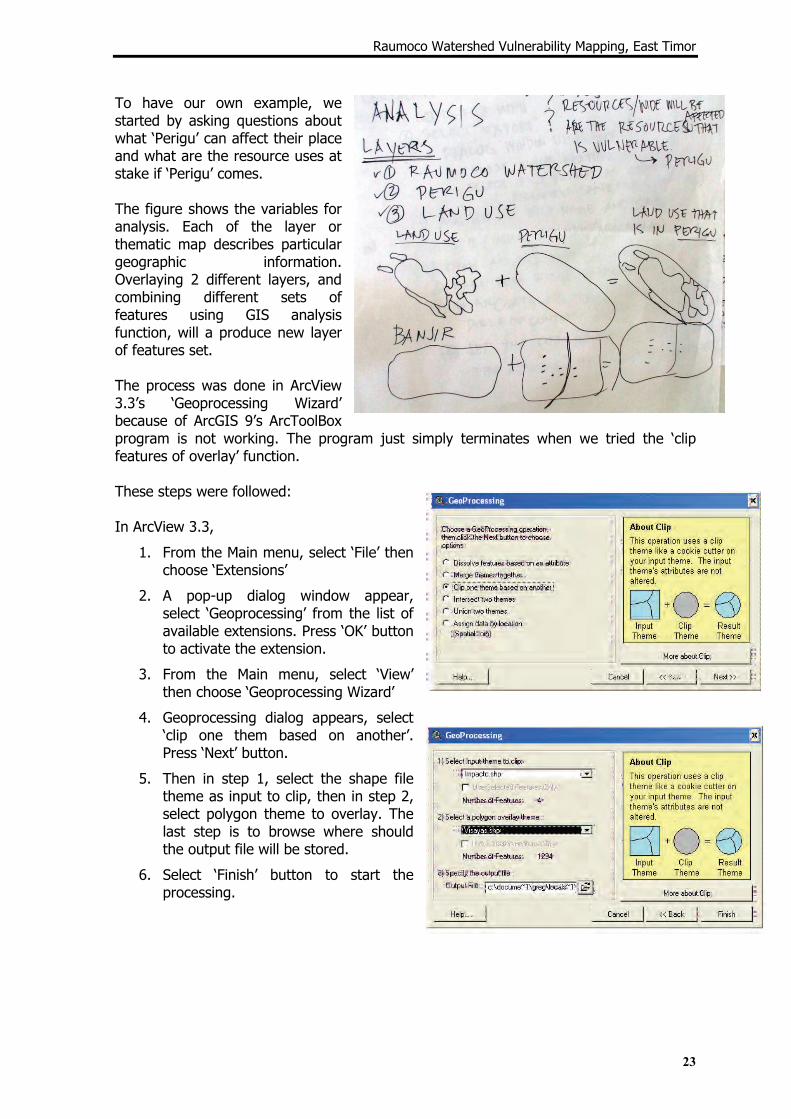
To have our own example, we started by asking questions about what ‘Perigu’ can affect their place and what are the resource uses at stake if ‘Perigu’ comes. The figure shows the variables for analysis. Each of the layer or thematic map describes particular geographic information. Overlaying 2 different layers, and combining different sets of features using GIS analysis function, will a produce new layer of features set. The process was done in ArcView 3.3’s ‘Geoprocessing Wizard’ because of ArcGIS 9’s ArcToolBox program is not working. The program just simply terminates when we tried the ‘clip features of overlay’ function. These steps were followed: In ArcView 3.3,
1. From the Main menu, select ‘File’ then choose ‘Extensions’
2. A pop-up dialog window appear, select ‘Geoprocessing’ from the list of available extensions. Press ‘OK’ button to activate the extension.
3. From the Main menu, select ‘View’ then choose ‘Geoprocessing Wizard’
4. Geoprocessing dialog appears, select ‘clip one them based on another’. Press ‘Next’ button.
5. Then in step 1, select the shape file theme as input to clip, then in step 2, select polygon theme to overlay. The last step is to browse where should the output file will be stored.
6. Select ‘Finish’ button to start the processing.
Raumoco Watershed Vulnerability Mapping, East Timor
24
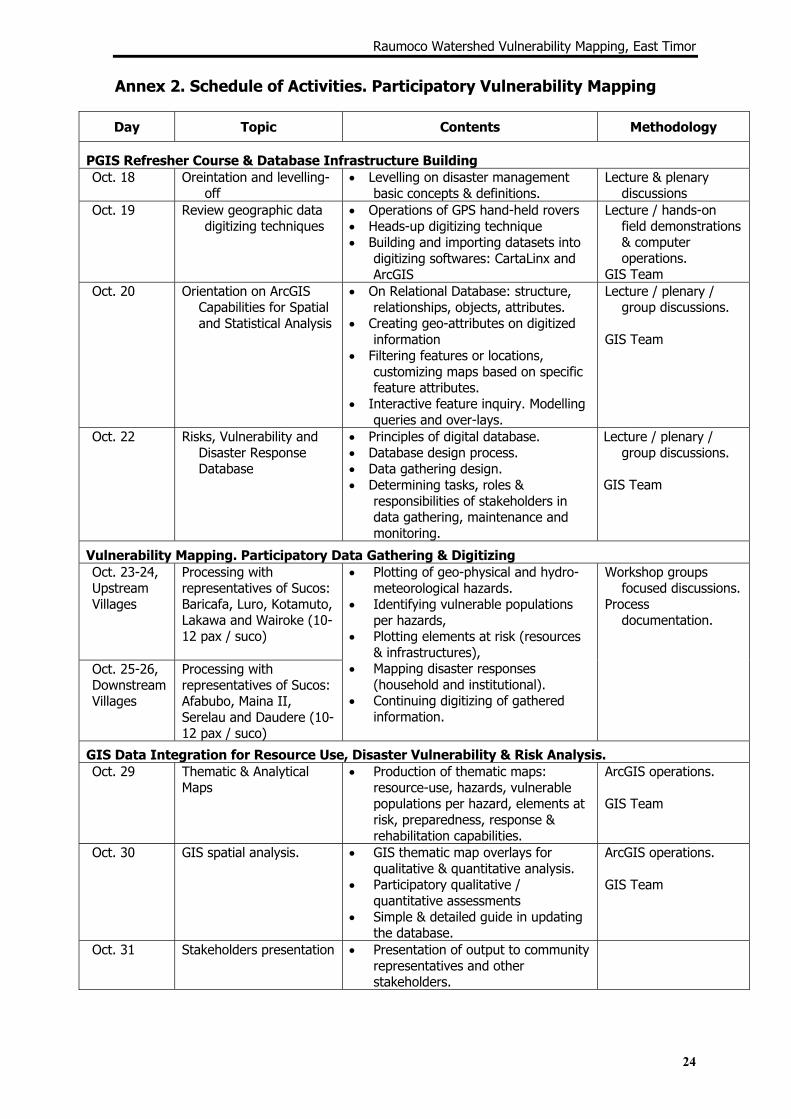
Annex 2. Schedule of Activities. Participatory Vulnerability Mapping
Day Topic Contents Methodology
PGIS Refresher Course & Database Infrastructure Building Oct. 18 Oreintation and levelling-
off • Levelling on disaster management
basic concepts & definitions. Lecture & plenary
discussions Oct. 19 Review geographic data
digitizing techniques • Operations of GPS hand-held rovers • Heads-up digitizing technique • Building and importing datasets into
digitizing softwares: CartaLinx and ArcGIS
Lecture / hands-on field demonstrations & computer operations.
GIS Team Oct. 20 Orientation on ArcGIS
Capabilities for Spatial and Statistical Analysis
• On Relational Database: structure, relationships, objects, attributes.
• Creating geo-attributes on digitized information
• Filtering features or locations, customizing maps based on specific feature attributes.
• Interactive feature inquiry. Modelling queries and over-lays.
Lecture / plenary / group discussions.
GIS Team
Oct. 22 Risks, Vulnerability and Disaster Response Database
• Principles of digital database. • Database design process. • Data gathering design. • Determining tasks, roles &
responsibilities of stakeholders in data gathering, maintenance and monitoring.
Lecture / plenary / group discussions.
GIS Team
Vulnerability Mapping. Participatory Data Gathering & Digitizing Oct. 23-24, Upstream Villages
Processing with representatives of Sucos: Baricafa, Luro, Kotamuto, Lakawa and Wairoke (10-12 pax / suco)
Oct. 25-26, Downstream Villages
Processing with representatives of Sucos: Afabubo, Maina II, Serelau and Daudere (10-12 pax / suco)
• Plotting of geo-physical and hydro-meteorological hazards.
• Identifying vulnerable populations per hazards,
• Plotting elements at risk (resources & infrastructures),
• Mapping disaster responses (household and institutional).
• Continuing digitizing of gathered information.
Workshop groups focused discussions.
Process documentation.
GIS Data Integration for Resource Use, Disaster Vulnerability & Risk Analysis. Oct. 29
Thematic & Analytical Maps
• Production of thematic maps: resource-use, hazards, vulnerable populations per hazard, elements at risk, preparedness, response & rehabilitation capabilities.
ArcGIS operations. GIS Team
Oct. 30 GIS spatial analysis. • GIS thematic map overlays for qualitative & quantitative analysis.
• Participatory qualitative / quantitative assessments
• Simple & detailed guide in updating the database.
ArcGIS operations. GIS Team
Oct. 31 Stakeholders presentation • Presentation of output to community representatives and other stakeholders.
Raumoco Watershed Vulnerability Mapping, East Timor
25
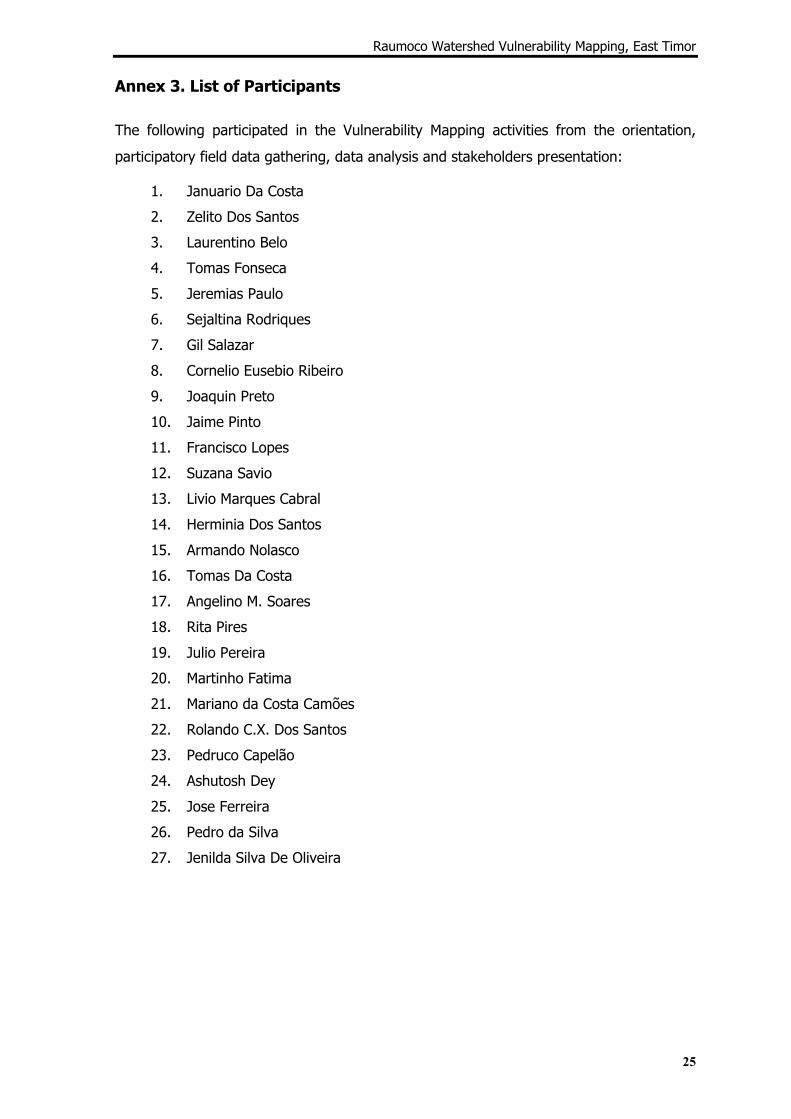
Annex 3. List of Participants
The following participated in the Vulnerability Mapping activities from the orientation,
participatory field data gathering, data analysis and stakeholders presentation:
1. Januario Da Costa
2. Zelito Dos Santos
3. Laurentino Belo
4. Tomas Fonseca
5. Jeremias Paulo
6. Sejaltina Rodriques
7. Gil Salazar
8. Cornelio Eusebio Ribeiro
9. Joaquin Preto
10. Jaime Pinto
11. Francisco Lopes
12. Suzana Savio
13. Livio Marques Cabral
14. Herminia Dos Santos
15. Armando Nolasco
16. Tomas Da Costa
17. Angelino M. Soares
18. Rita Pires
19. Julio Pereira
20. Martinho Fatima
21. Mariano da Costa Camões
22. Rolando C.X. Dos Santos
23. Pedruco Capelão
24. Ashutosh Dey
25. Jose Ferreira
26. Pedro da Silva
27. Jenilda Silva De Oliveira
Recommended