Rationale for the Report
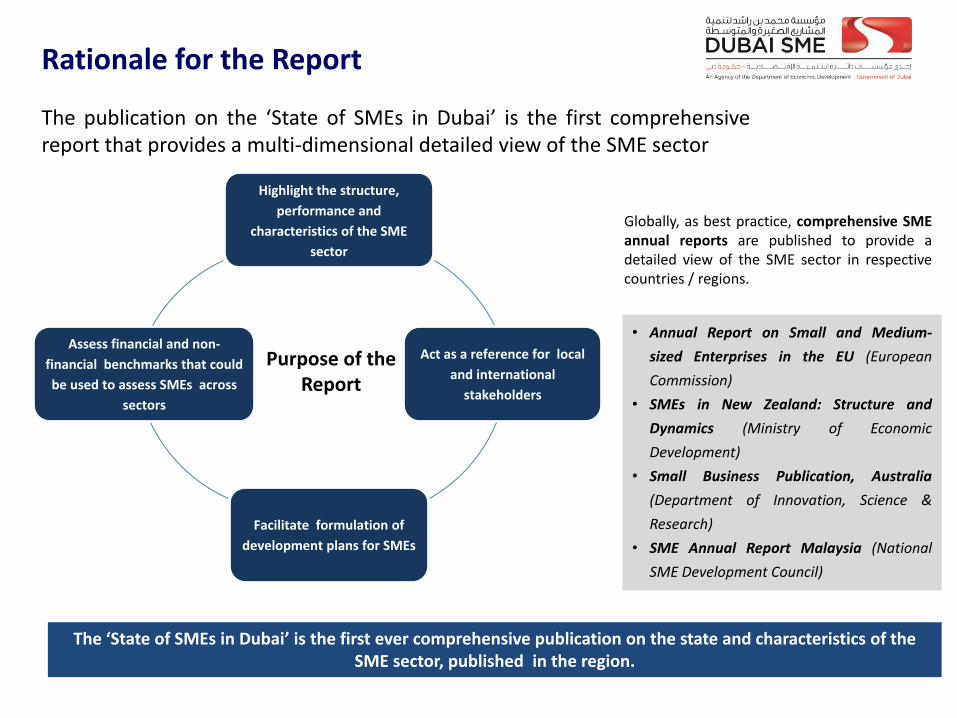
The publication on the ‘State of SMEs in Dubai’ is the first comprehensive report that provides a multi-dimensional detailed view of the SME sector
Highlight the structure,
performance and
characteristics of the SME
sector
Act as a reference for local
and international
stakeholders
Facilitate formulation of
development plans for SMEs
Assess financial and non-
financial benchmarks that could
be used to assess SMEs across
sectors
Purpose of the Report
Globally, as best practice, comprehensive SME annual reports are published to provide a detailed view of the SME sector in respective countries / regions.
• Annual Report on Small and Medium-
sized Enterprises in the EU (European
Commission)
• SMEs in New Zealand: Structure and
Dynamics (Ministry of Economic
Development)
• Small Business Publication, Australia
(Department of Innovation, Science &
Research)
• SME Annual Report Malaysia (National
SME Development Council)
The ‘State of SMEs in Dubai’ is the first ever comprehensive publication on the state and characteristics of the SME sector, published in the region.
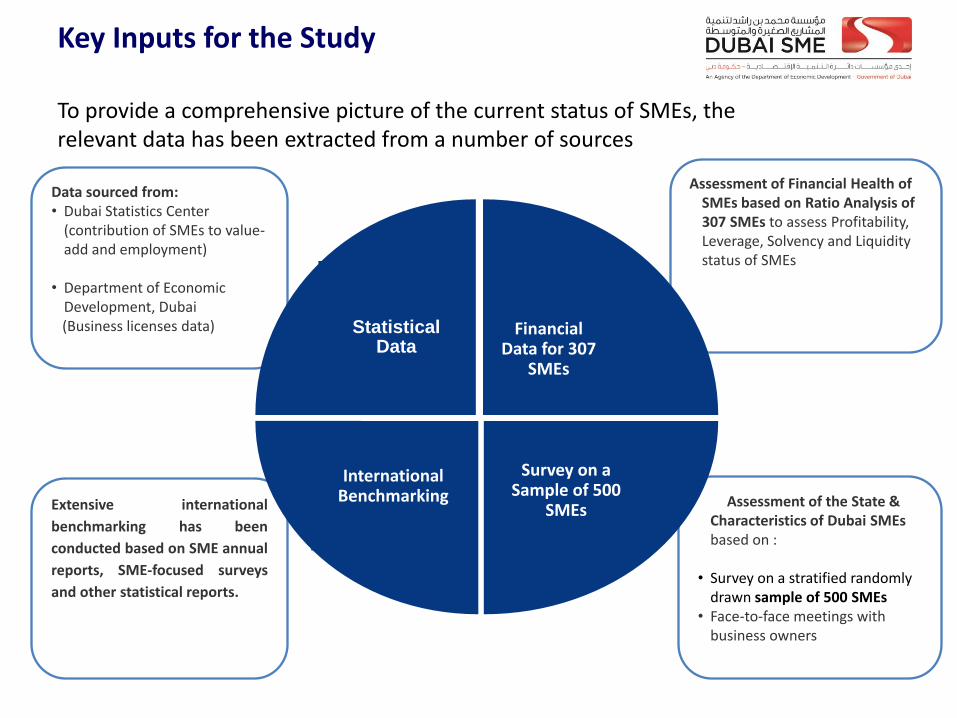
Extensive international
benchmarking has been
conducted based on SME annual
reports, SME-focused surveys
and other statistical reports.
Assessment of the State & Characteristics of Dubai SMEs based on :
• Survey on a stratified randomly
drawn sample of 500 SMEs • Face-to-face meetings with
business owners
Assessment of Financial Health of SMEs based on Ratio Analysis of 307 SMEs to assess Profitability, Leverage, Solvency and Liquidity status of SMEs
Data sourced from: • Dubai Statistics Center
(contribution of SMEs to value-add and employment)
• Department of Economic
Development, Dubai (Business licenses data)
Statistical Data
Financial Data for 307
SMEs
Survey on a Sample of 500
SMEs
International Benchmarking
Key Inputs for the Study
To provide a comprehensive picture of the current status of SMEs, the relevant data has been extracted from a number of sources
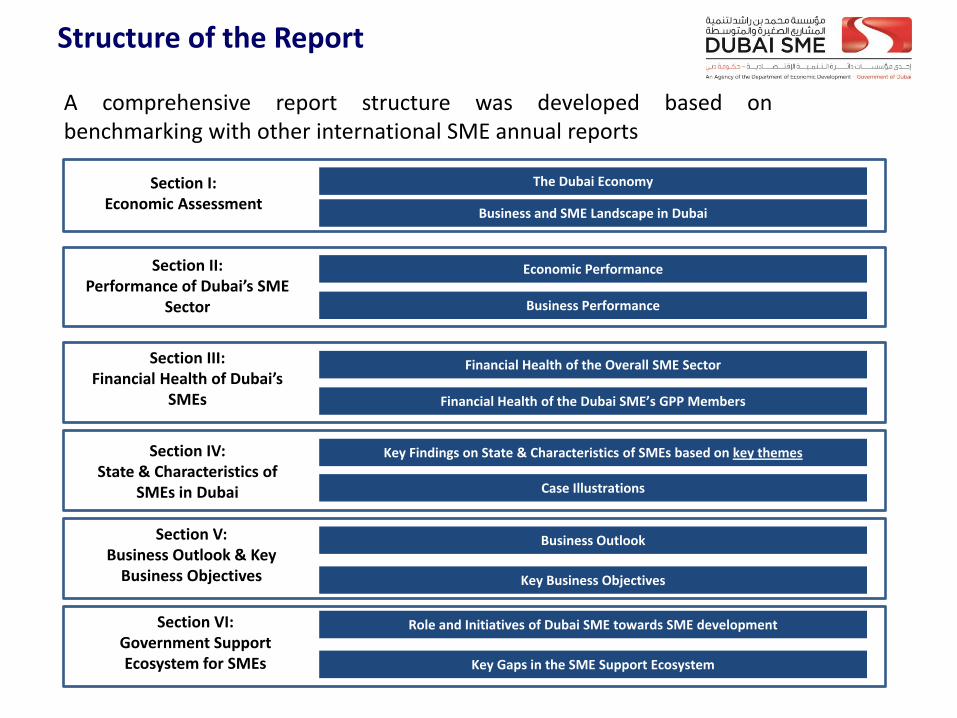
The Dubai Economy
Business and SME Landscape in Dubai
Business Outlook
Key Findings on State & Characteristics of SMEs based on key themes
Role and Initiatives of Dubai SME towards SME development
Economic Performance
Business Performance
Section I: Economic Assessment
Section II: Performance of Dubai’s SME
Sector
Section IV: State & Characteristics of
SMEs in Dubai Case Illustrations
Financial Health of the Overall SME Sector Section III: Financial Health of Dubai’s
SMEs
Section VI: Government Support Ecosystem for SMEs
Key Business Objectives
Structure of the Report
A comprehensive report structure was developed based on benchmarking with other international SME annual reports
Key Gaps in the SME Support Ecosystem
Section V: Business Outlook & Key
Business Objectives
Financial Health of the Dubai SME’s GPP Members
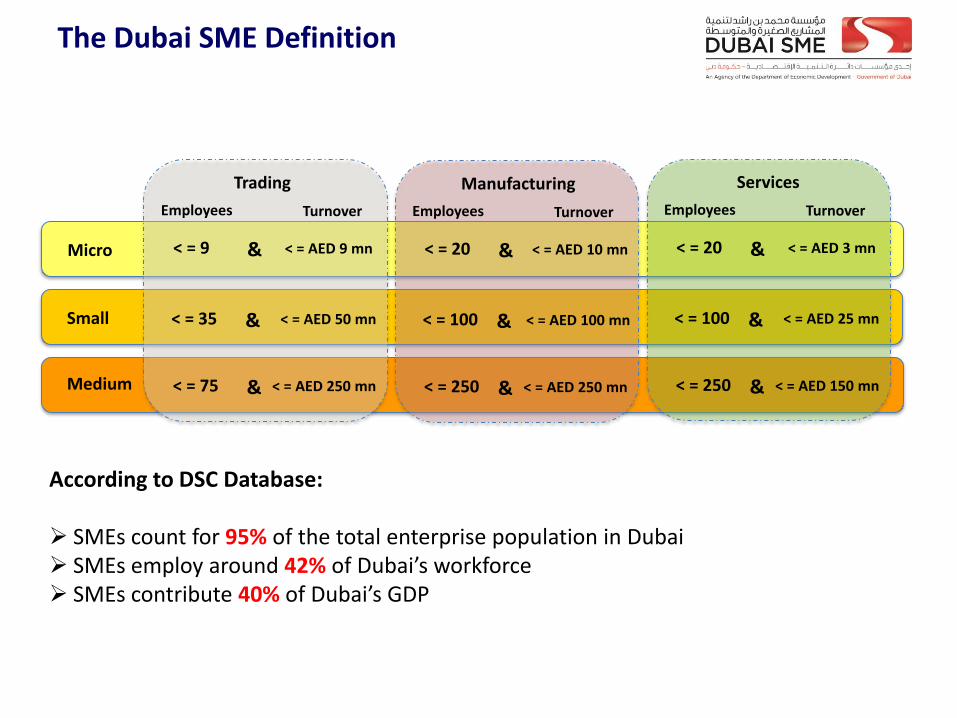
Micro
Small
Medium
Trading
< = 9
Employees Turnover
< = AED 9 mn &
< = 35 < = AED 50 mn &
< = 75 < = AED 250 mn &
Manufacturing
< = 20
Employees Turnover
< = AED 10 mn &
< = 100 < = AED 100 mn &
< = 250 < = AED 250 mn &
Services
< = 20
Employees Turnover
< = AED 3 mn &
< = 100 < = AED 25 mn &
< = 250 < = AED 150 mn &
According to DSC Database: SMEs count for 95% of the total enterprise population in Dubai SMEs employ around 42% of Dubai’s workforce SMEs contribute 40% of Dubai’s GDP
The Dubai SME Definition
Section I: Business and SME Landscape in Dubai - Number of Establishments - Sectoral Distribution
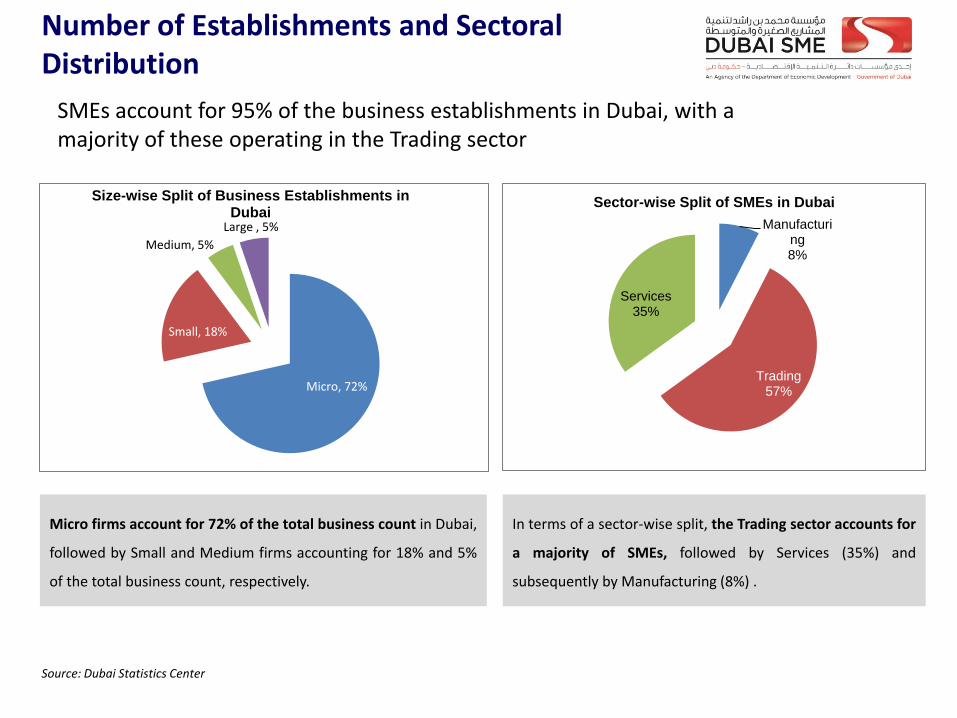
Number of Establishments and Sectoral Distribution
SMEs account for 95% of the business establishments in Dubai, with a majority of these operating in the Trading sector
Micro firms account for 72% of the total business count in Dubai,
followed by Small and Medium firms accounting for 18% and 5%
of the total business count, respectively.
Manufacturing 8%
Trading 57%
Services 35%
Sector-wise Split of SMEs in Dubai
Micro, 72%
Small, 18%
Medium, 5%
Large , 5%
Size-wise Split of Business Establishments in Dubai
In terms of a sector-wise split, the Trading sector accounts for
a majority of SMEs, followed by Services (35%) and
subsequently by Manufacturing (8%) .
Source: Dubai Statistics Center
Section II: Performance of Dubai’s SME Sector - Gross Domestic Product (GDP) & Employment Distribution - Productivity
GDP Contribution and Employment Distribution of SMEs
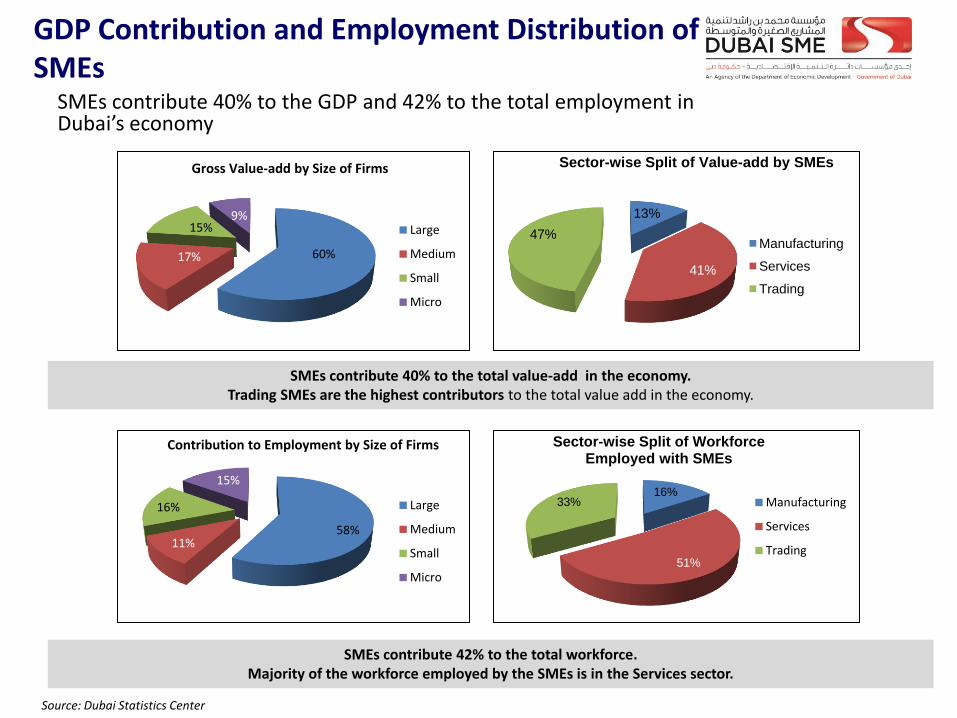
SMEs contribute 40% to the GDP and 42% to the total employment in Dubai’s economy
60% 17%
15% 9%
Gross Value-add by Size of Firms
Large
Medium
Small
Micro
58% 11%
16%
15%
Contribution to Employment by Size of Firms
Large
Medium
Small
Micro
13%
41%
47%
Sector-wise Split of Value-add by SMEs
Manufacturing
Services
Trading
16%
51%
33%
Sector-wise Split of Workforce Employed with SMEs
Manufacturing
Services
Trading
SMEs contribute 40% to the total value-add in the economy. Trading SMEs are the highest contributors to the total value add in the economy.
Source: Dubai Statistics Center
SMEs contribute 42% to the total workforce. Majority of the workforce employed by the SMEs is in the Services sector.
Productivity of Dubai’s SMEs
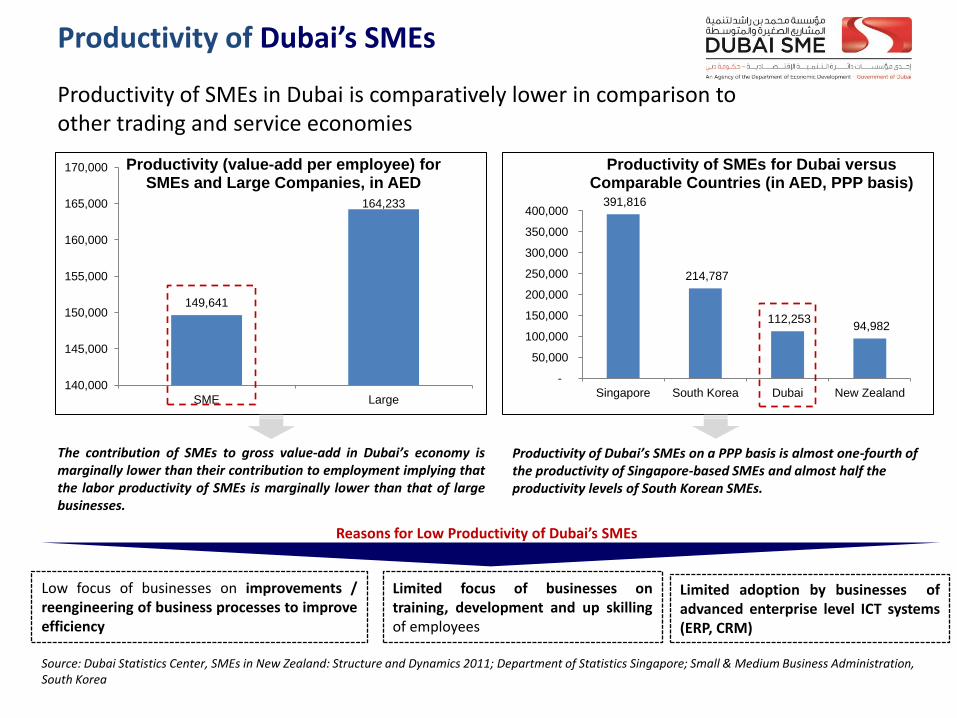
Productivity of SMEs in Dubai is comparatively lower in comparison to other trading and service economies
391,816
214,787
112,253 94,982
-
50,000
100,000
150,000
200,000
250,000
300,000
350,000
400,000
Singapore South Korea Dubai New Zealand
Productivity of SMEs for Dubai versus Comparable Countries (in AED, PPP basis)
149,641
164,233
140,000
145,000
150,000
155,000
160,000
165,000
170,000
SME Large
Productivity (value-add per employee) for SMEs and Large Companies, in AED
Productivity of Dubai’s SMEs on a PPP basis is almost one-fourth of the productivity of Singapore-based SMEs and almost half the productivity levels of South Korean SMEs.
Low focus of businesses on improvements / reengineering of business processes to improve efficiency
Limited focus of businesses on training, development and up skilling of employees
The contribution of SMEs to gross value-add in Dubai’s economy is marginally lower than their contribution to employment implying that the labor productivity of SMEs is marginally lower than that of large businesses.
Limited adoption by businesses of advanced enterprise level ICT systems (ERP, CRM)
Reasons for Low Productivity of Dubai’s SMEs
Source: Dubai Statistics Center, SMEs in New Zealand: Structure and Dynamics 2011; Department of Statistics Singapore; Small & Medium Business Administration, South Korea
Section III: Financial Health of Dubai’s SMEs Based on financial data of 307 SMEs across Manufacturing, Services and Trading sectors with representation of firms across enterprise sizes
Profitability Analysis – Net Margins
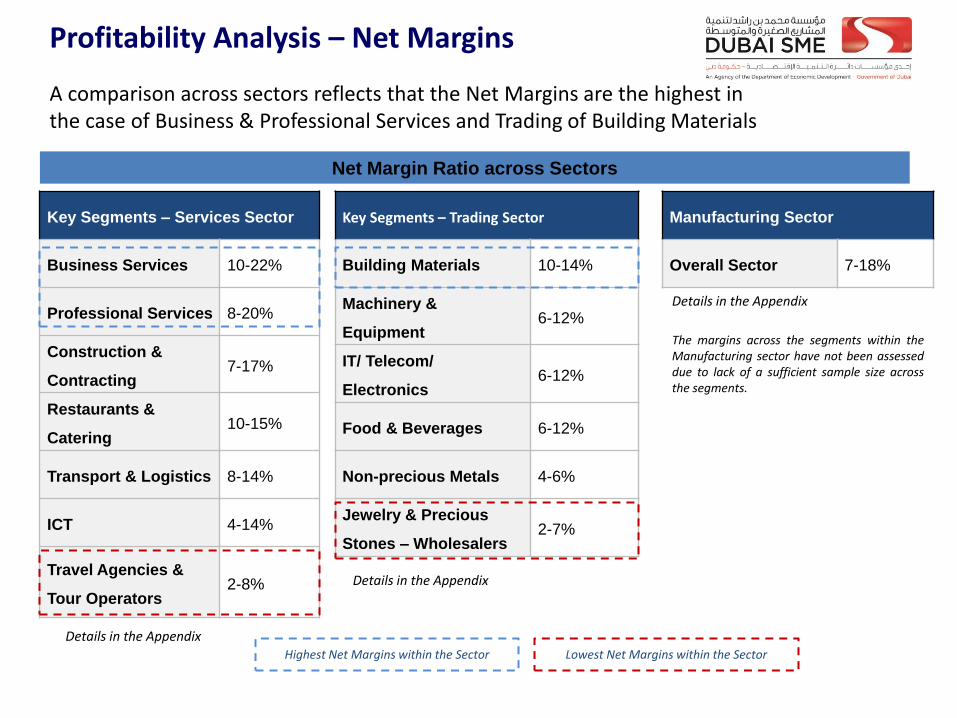
A comparison across sectors reflects that the Net Margins are the highest in the case of Business & Professional Services and Trading of Building Materials
Key Segments – Services Sector
Business Services 10-22%
Professional Services 8-20%
Construction &
Contracting 7-17%
Restaurants &
Catering 10-15%
Transport & Logistics 8-14%
ICT 4-14%
Travel Agencies &
Tour Operators 2-8%
Net Margin Ratio across Sectors
Key Segments – Trading Sector
Building Materials 10-14%
Machinery &
Equipment 6-12%
IT/ Telecom/
Electronics 6-12%
Food & Beverages 6-12%
Non-precious Metals 4-6%
Jewelry & Precious
Stones – Wholesalers 2-7%
Manufacturing Sector
Overall Sector 7-18%
Details in the Appendix
Details in the Appendix
Details in the Appendix
Highest Net Margins within the Sector Lowest Net Margins within the Sector
The margins across the segments within the Manufacturing sector have not been assessed due to lack of a sufficient sample size across the segments.
Section IV: State and Characteristics of Dubai’s SMEs
• Based on a detailed survey with 500 SMEs with representation of SMEs from Manufacturing, Services and Trading sectors across the three enterprise size classes (Micro, Small and Medium)
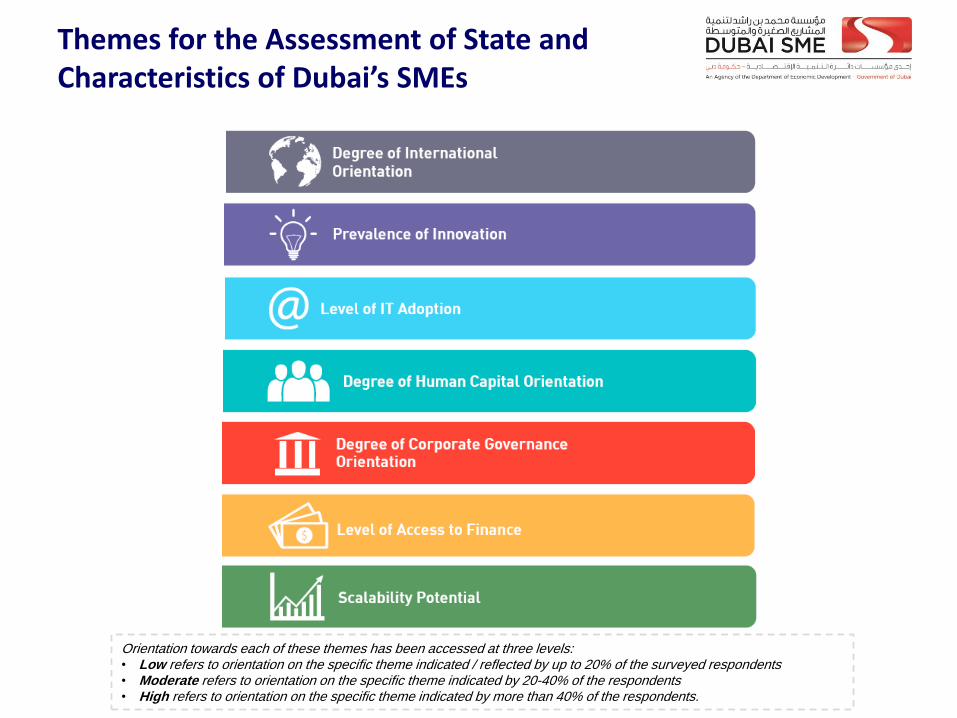
Themes for the Assessment of State and Characteristics of Dubai’s SMEs
Orientation towards each of these themes has been accessed at three levels: • Low refers to orientation on the specific theme indicated / reflected by up to 20% of the surveyed respondents • Moderate refers to orientation on the specific theme indicated by 20-40% of the respondents • High refers to orientation on the specific theme indicated by more than 40% of the respondents.
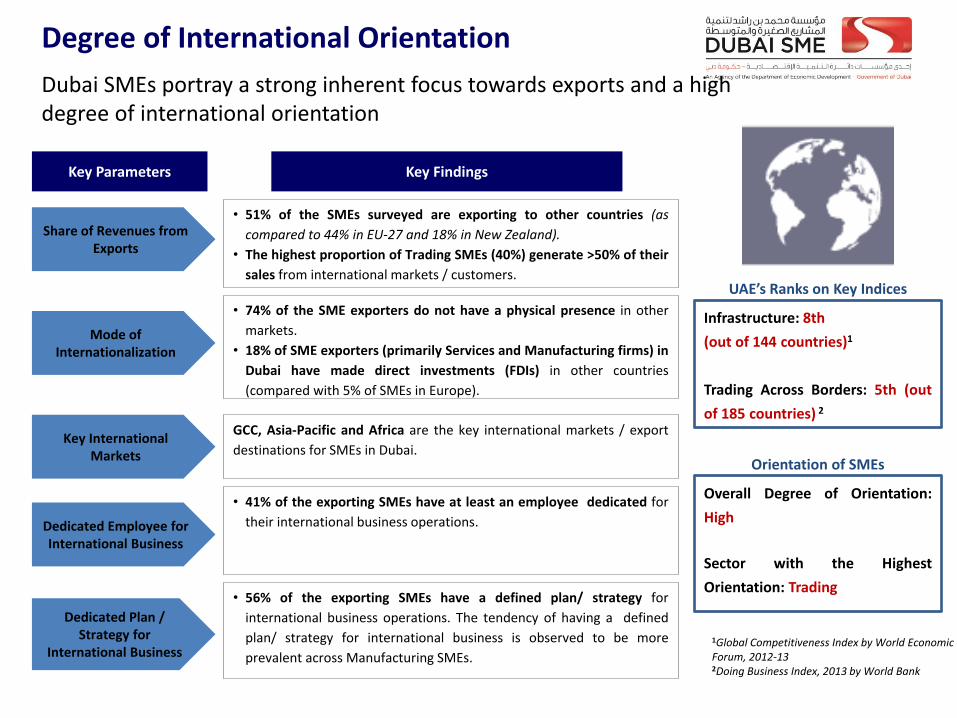
Degree of International Orientation
Dubai SMEs portray a strong inherent focus towards exports and a high degree of international orientation
Key Parameters Key Findings
Share of Revenues from Exports
Key International Markets
Dedicated Employee for International Business
Dedicated Plan / Strategy for
International Business
• 51% of the SMEs surveyed are exporting to other countries (as
compared to 44% in EU-27 and 18% in New Zealand).
• The highest proportion of Trading SMEs (40%) generate >50% of their
sales from international markets / customers.
GCC, Asia-Pacific and Africa are the key international markets / export
destinations for SMEs in Dubai.
Mode of Internationalization
Overall Degree of Orientation:
High
Sector with the Highest
Orientation: Trading
• 74% of the SME exporters do not have a physical presence in other
markets.
• 18% of SME exporters (primarily Services and Manufacturing firms) in
Dubai have made direct investments (FDIs) in other countries
(compared with 5% of SMEs in Europe).
• 41% of the exporting SMEs have at least an employee dedicated for
their international business operations.
• 56% of the exporting SMEs have a defined plan/ strategy for
international business operations. The tendency of having a defined
plan/ strategy for international business is observed to be more
prevalent across Manufacturing SMEs.
Infrastructure: 8th
(out of 144 countries)1
Trading Across Borders: 5th (out
of 185 countries) 2
UAE’s Ranks on Key Indices
Orientation of SMEs
1Global Competitiveness Index by World Economic Forum, 2012-13 2Doing Business Index, 2013 by World Bank
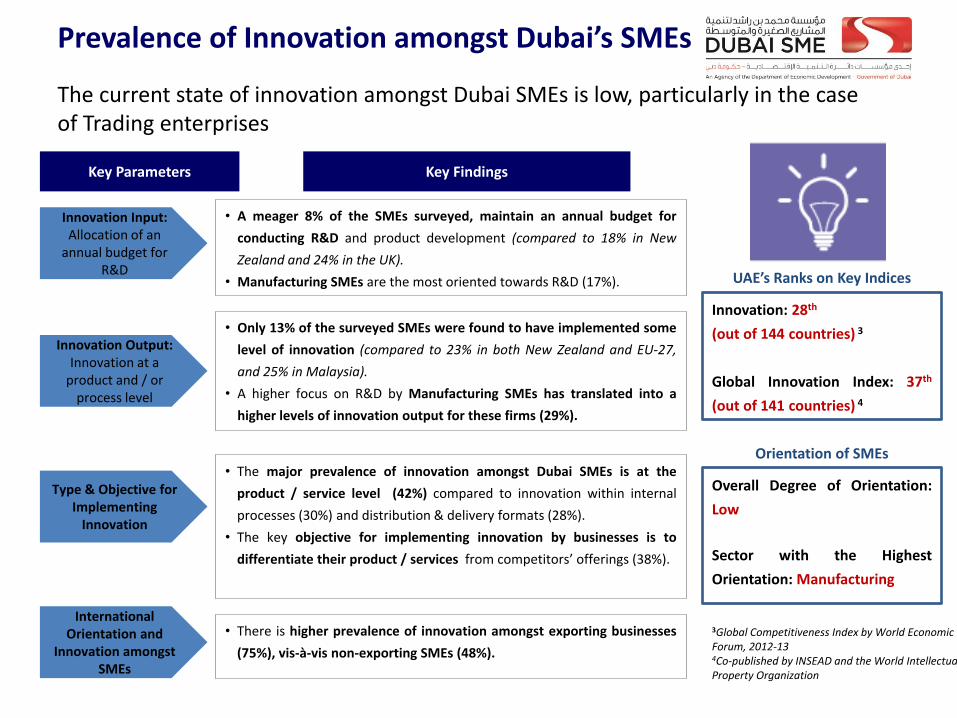
Prevalence of Innovation amongst Dubai’s SMEs
The current state of innovation amongst Dubai SMEs is low, particularly in the case of Trading enterprises
Key Parameters Key Findings
Innovation Input: Allocation of an
annual budget for R&D
Type & Objective for Implementing
Innovation
• A meager 8% of the SMEs surveyed, maintain an annual budget for
conducting R&D and product development (compared to 18% in New
Zealand and 24% in the UK).
• Manufacturing SMEs are the most oriented towards R&D (17%).
• The major prevalence of innovation amongst Dubai SMEs is at the
product / service level (42%) compared to innovation within internal
processes (30%) and distribution & delivery formats (28%).
• The key objective for implementing innovation by businesses is to
differentiate their product / services from competitors’ offerings (38%).
Innovation Output:
Innovation at a product and / or
process level
• Only 13% of the surveyed SMEs were found to have implemented some
level of innovation (compared to 23% in both New Zealand and EU-27,
and 25% in Malaysia).
• A higher focus on R&D by Manufacturing SMEs has translated into a
higher levels of innovation output for these firms (29%).
Overall Degree of Orientation:
Low
Sector with the Highest
Orientation: Manufacturing
Innovation: 28th
(out of 144 countries) 3
Global Innovation Index: 37th
(out of 141 countries) 4
UAE’s Ranks on Key Indices
Orientation of SMEs
3Global Competitiveness Index by World Economic Forum, 2012-13 4Co-published by INSEAD and the World Intellectual Property Organization
International Orientation and
Innovation amongst SMEs
• There is higher prevalence of innovation amongst exporting businesses
(75%), vis-à-vis non-exporting SMEs (48%).
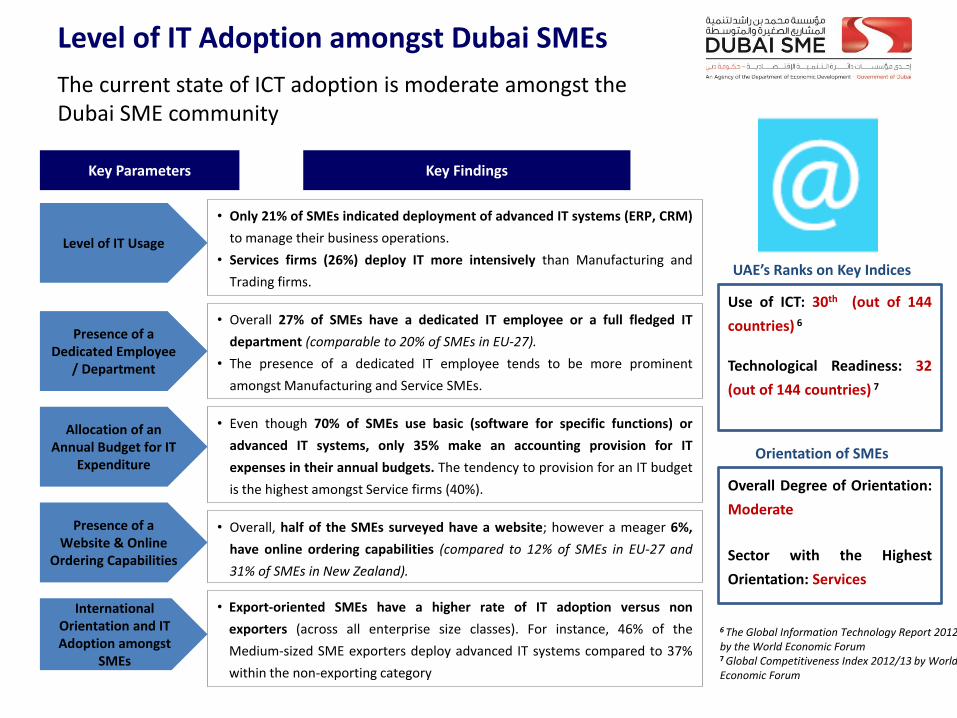
Level of IT Adoption amongst Dubai SMEs
The current state of ICT adoption is moderate amongst the Dubai SME community
Key Parameters Key Findings
Level of IT Usage
Allocation of an Annual Budget for IT
Expenditure
Presence of a Website & Online
Ordering Capabilities
• Only 21% of SMEs indicated deployment of advanced IT systems (ERP, CRM)
to manage their business operations.
• Services firms (26%) deploy IT more intensively than Manufacturing and
Trading firms.
Presence of a Dedicated Employee
/ Department
• Overall 27% of SMEs have a dedicated IT employee or a full fledged IT
department (comparable to 20% of SMEs in EU-27).
• The presence of a dedicated IT employee tends to be more prominent
amongst Manufacturing and Service SMEs.
• Even though 70% of SMEs use basic (software for specific functions) or
advanced IT systems, only 35% make an accounting provision for IT
expenses in their annual budgets. The tendency to provision for an IT budget
is the highest amongst Service firms (40%).
• Overall, half of the SMEs surveyed have a website; however a meager 6%,
have online ordering capabilities (compared to 12% of SMEs in EU-27 and
31% of SMEs in New Zealand).
Overall Degree of Orientation:
Moderate
Sector with the Highest
Orientation: Services
Orientation of SMEs
Use of ICT: 30th (out of 144
countries) 6
Technological Readiness: 32
(out of 144 countries) 7
UAE’s Ranks on Key Indices
6 The Global Information Technology Report 2012, by the World Economic Forum 7 Global Competitiveness Index 2012/13 by World Economic Forum
International Orientation and IT Adoption amongst
SMEs
• Export-oriented SMEs have a higher rate of IT adoption versus non
exporters (across all enterprise size classes). For instance, 46% of the
Medium-sized SME exporters deploy advanced IT systems compared to 37%
within the non-exporting category
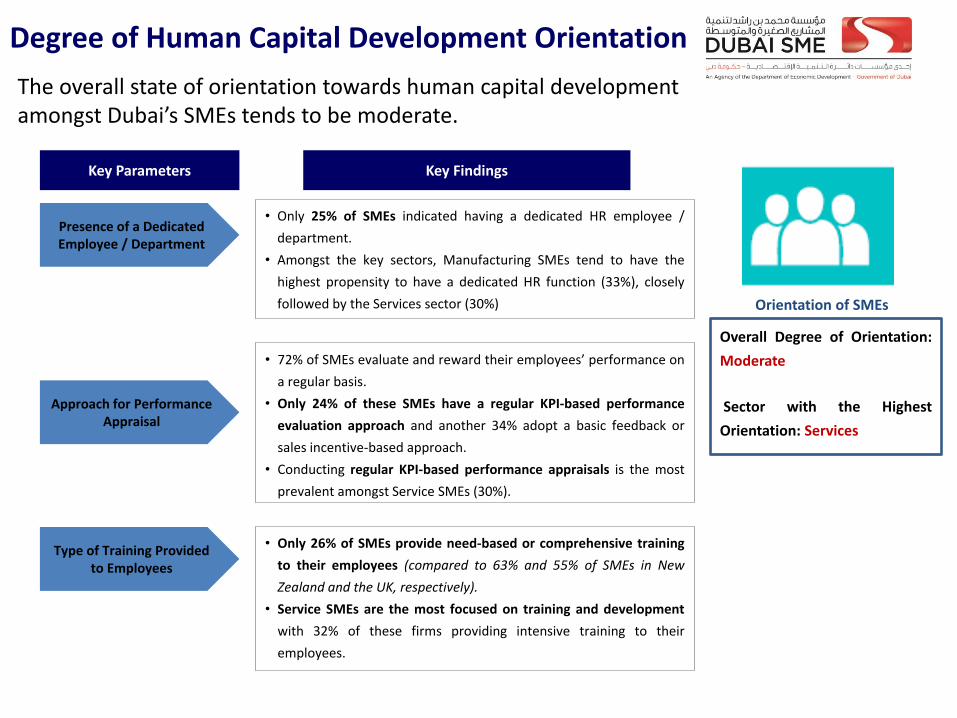
Degree of Human Capital Development Orientation
The overall state of orientation towards human capital development amongst Dubai’s SMEs tends to be moderate.
Key Parameters Key Findings
Presence of a Dedicated Employee / Department
Type of Training Provided to Employees
• Only 25% of SMEs indicated having a dedicated HR employee /
department.
• Amongst the key sectors, Manufacturing SMEs tend to have the
highest propensity to have a dedicated HR function (33%), closely
followed by the Services sector (30%)
Approach for Performance Appraisal
• 72% of SMEs evaluate and reward their employees’ performance on
a regular basis.
• Only 24% of these SMEs have a regular KPI-based performance
evaluation approach and another 34% adopt a basic feedback or
sales incentive-based approach.
• Conducting regular KPI-based performance appraisals is the most
prevalent amongst Service SMEs (30%).
• Only 26% of SMEs provide need-based or comprehensive training
to their employees (compared to 63% and 55% of SMEs in New
Zealand and the UK, respectively).
• Service SMEs are the most focused on training and development
with 32% of these firms providing intensive training to their
employees.
Orientation of SMEs
Overall Degree of Orientation:
Moderate
Sector with the Highest
Orientation: Services
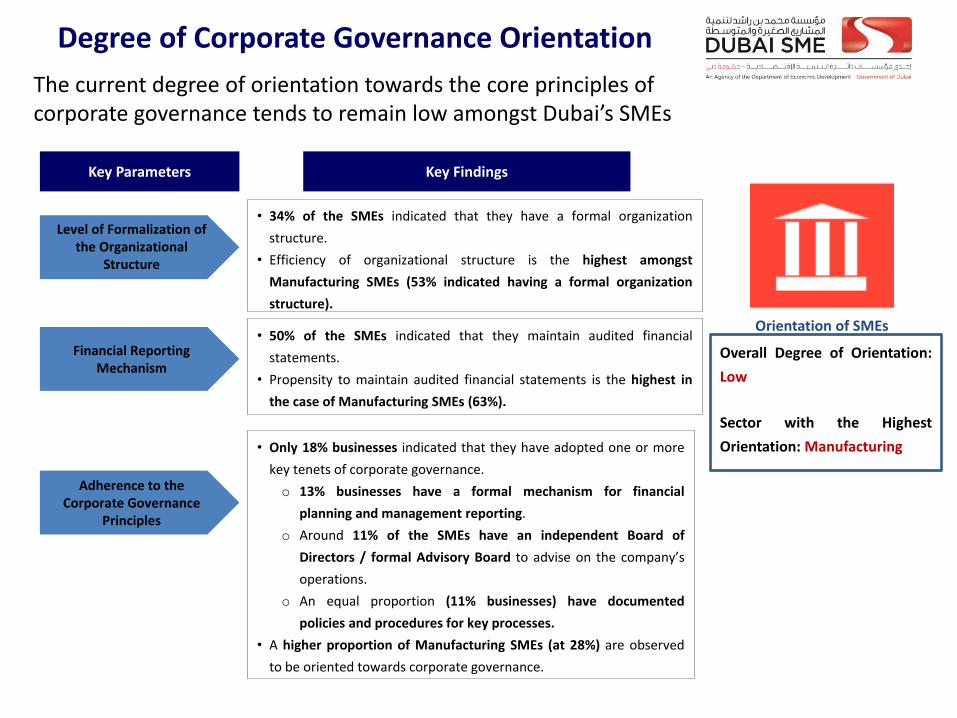
Degree of Corporate Governance Orientation
The current degree of orientation towards the core principles of corporate governance tends to remain low amongst Dubai’s SMEs
Key Parameters Key Findings
Level of Formalization of the Organizational
Structure
Adherence to the Corporate Governance
Principles
• 34% of the SMEs indicated that they have a formal organization
structure.
• Efficiency of organizational structure is the highest amongst
Manufacturing SMEs (53% indicated having a formal organization
structure).
• Only 18% businesses indicated that they have adopted one or more
key tenets of corporate governance.
o 13% businesses have a formal mechanism for financial
planning and management reporting.
o Around 11% of the SMEs have an independent Board of
Directors / formal Advisory Board to advise on the company’s
operations.
o An equal proportion (11% businesses) have documented
policies and procedures for key processes.
• A higher proportion of Manufacturing SMEs (at 28%) are observed
to be oriented towards corporate governance.
Financial Reporting Mechanism
• 50% of the SMEs indicated that they maintain audited financial
statements.
• Propensity to maintain audited financial statements is the highest in
the case of Manufacturing SMEs (63%).
Orientation of SMEs
Overall Degree of Orientation:
Low
Sector with the Highest
Orientation: Manufacturing
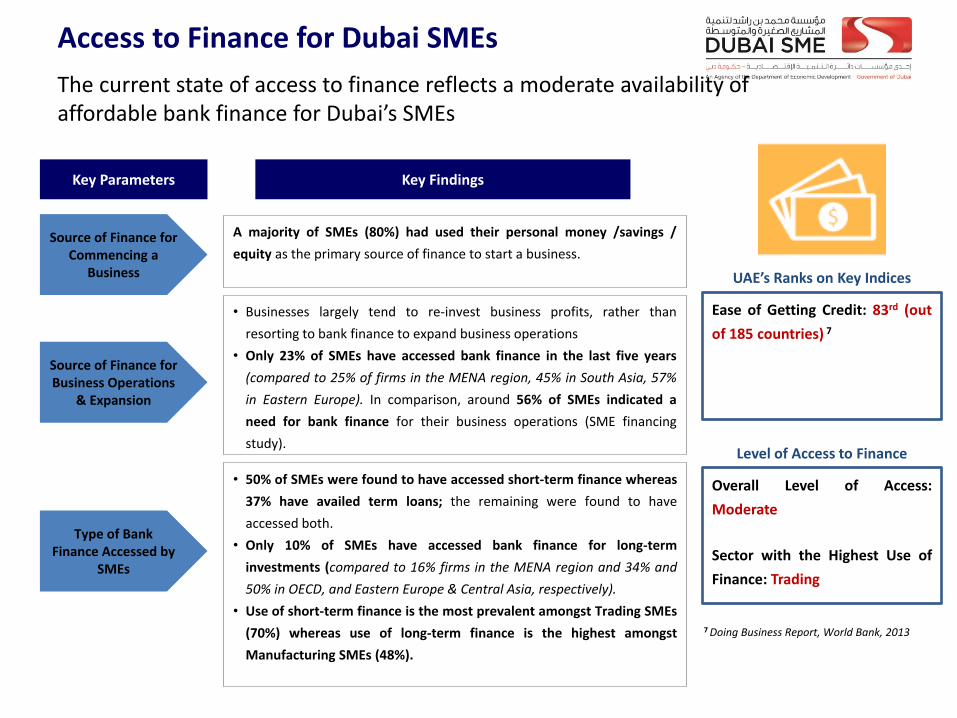
Access to Finance for Dubai SMEs
The current state of access to finance reflects a moderate availability of affordable bank finance for Dubai’s SMEs
Key Parameters Key Findings
Source of Finance for Commencing a
Business
Type of Bank Finance Accessed by
SMEs
A majority of SMEs (80%) had used their personal money /savings /
equity as the primary source of finance to start a business.
Source of Finance for Business Operations
& Expansion
• Businesses largely tend to re-invest business profits, rather than
resorting to bank finance to expand business operations
• Only 23% of SMEs have accessed bank finance in the last five years
(compared to 25% of firms in the MENA region, 45% in South Asia, 57%
in Eastern Europe). In comparison, around 56% of SMEs indicated a
need for bank finance for their business operations (SME financing
study).
• 50% of SMEs were found to have accessed short-term finance whereas
37% have availed term loans; the remaining were found to have
accessed both.
• Only 10% of SMEs have accessed bank finance for long-term
investments (compared to 16% firms in the MENA region and 34% and
50% in OECD, and Eastern Europe & Central Asia, respectively).
• Use of short-term finance is the most prevalent amongst Trading SMEs
(70%) whereas use of long-term finance is the highest amongst
Manufacturing SMEs (48%).
Overall Level of Access:
Moderate
Sector with the Highest Use of
Finance: Trading
Ease of Getting Credit: 83rd (out
of 185 countries) 7
UAE’s Ranks on Key Indices
Level of Access to Finance
7 Doing Business Report, World Bank, 2013
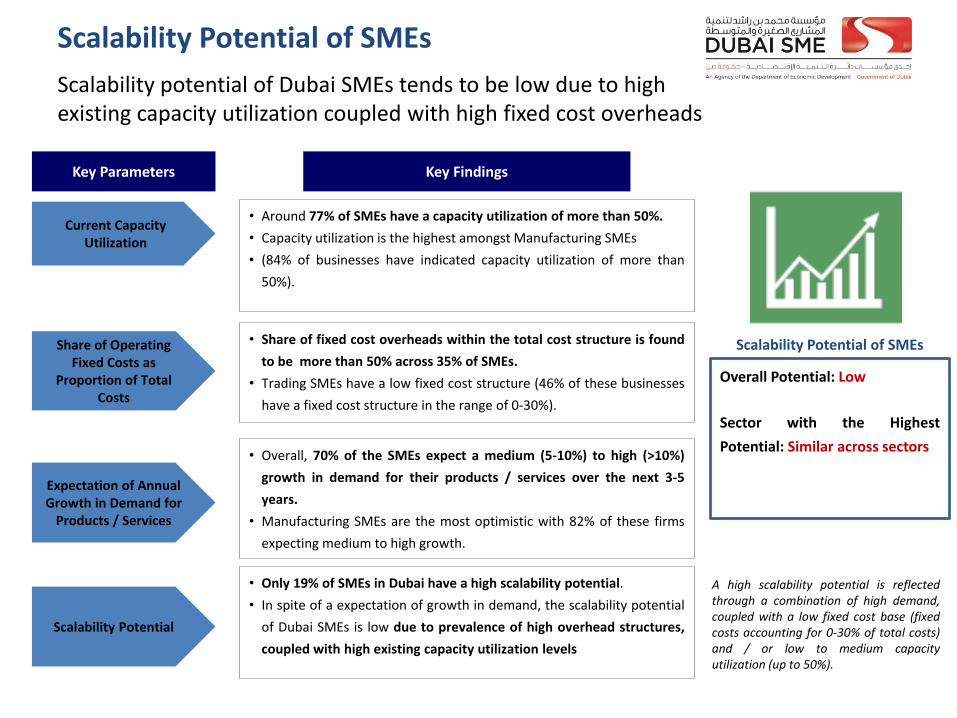
Scalability Potential of SMEs
Scalability potential of Dubai SMEs tends to be low due to high existing capacity utilization coupled with high fixed cost overheads
Key Parameters Key Findings
Share of Operating Fixed Costs as
Proportion of Total Costs
Current Capacity Utilization
Expectation of Annual Growth in Demand for
Products / Services
• Around 77% of SMEs have a capacity utilization of more than 50%.
• Capacity utilization is the highest amongst Manufacturing SMEs
• (84% of businesses have indicated capacity utilization of more than
50%).
• Share of fixed cost overheads within the total cost structure is found
to be more than 50% across 35% of SMEs.
• Trading SMEs have a low fixed cost structure (46% of these businesses
have a fixed cost structure in the range of 0-30%).
• Overall, 70% of the SMEs expect a medium (5-10%) to high (>10%)
growth in demand for their products / services over the next 3-5
years.
• Manufacturing SMEs are the most optimistic with 82% of these firms
expecting medium to high growth.
Scalability Potential
• Only 19% of SMEs in Dubai have a high scalability potential.
• In spite of a expectation of growth in demand, the scalability potential
of Dubai SMEs is low due to prevalence of high overhead structures,
coupled with high existing capacity utilization levels
Overall Potential: Low
Sector with the Highest
Potential: Similar across sectors
Scalability Potential of SMEs
A high scalability potential is reflected through a combination of high demand, coupled with a low fixed cost base (fixed costs accounting for 0-30% of total costs) and / or low to medium capacity utilization (up to 50%).
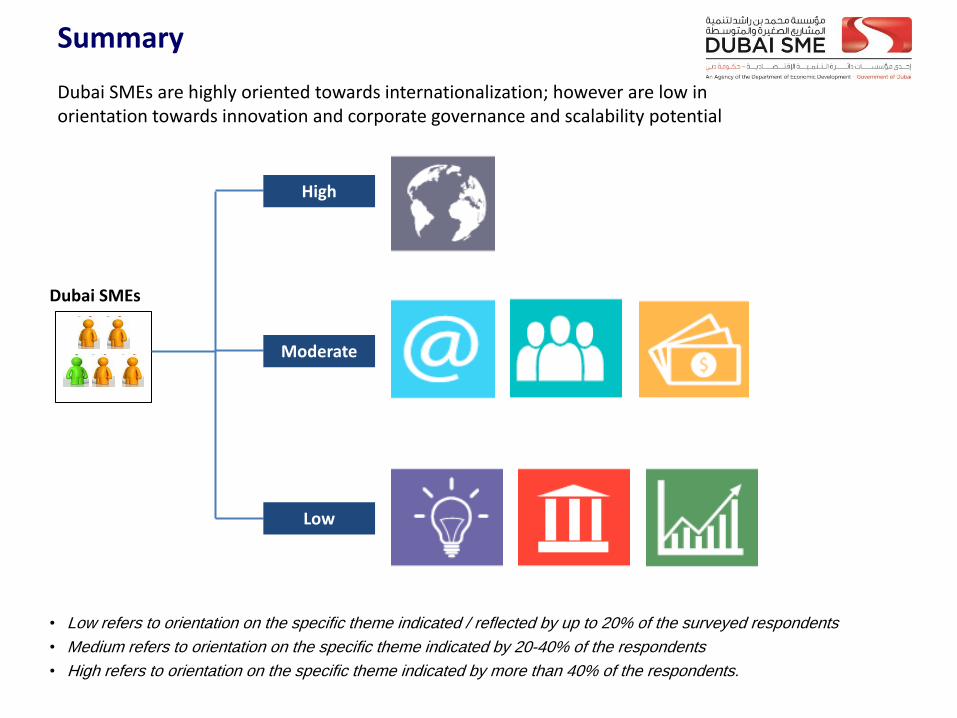
Summary
Dubai SMEs are highly oriented towards internationalization; however are low in orientation towards innovation and corporate governance and scalability potential
• Low refers to orientation on the specific theme indicated / reflected by up to 20% of the surveyed respondents
• Medium refers to orientation on the specific theme indicated by 20-40% of the respondents
• High refers to orientation on the specific theme indicated by more than 40% of the respondents.
Dubai SMEs
High
Moderate
Low
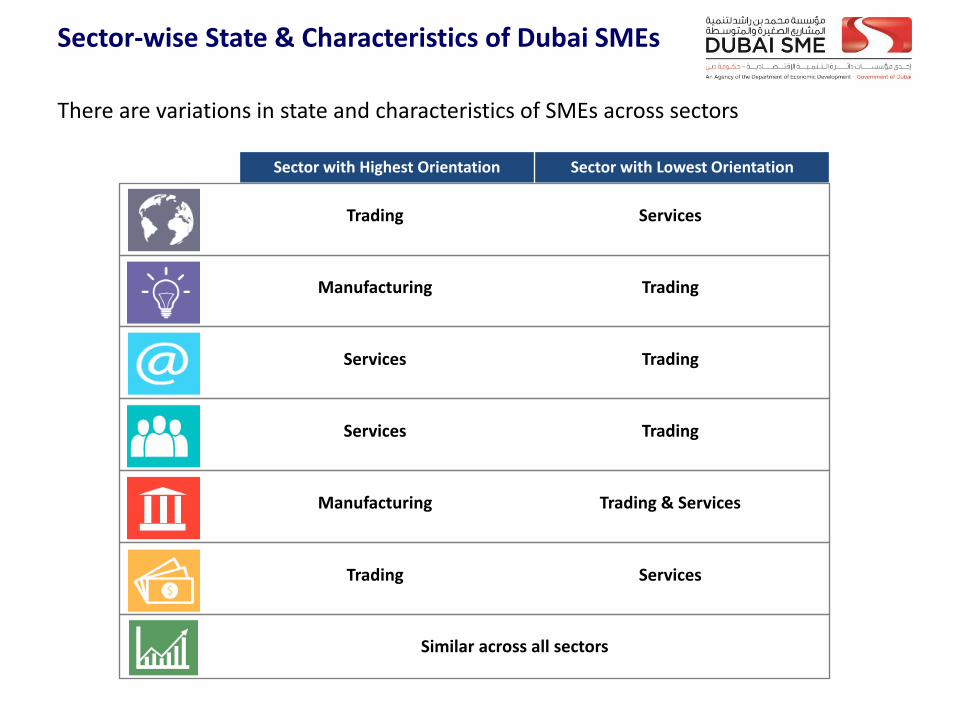
Sector-wise State & Characteristics of Dubai SMEs
There are variations in state and characteristics of SMEs across sectors
Sector with Highest Orientation Sector with Lowest Orientation
Trading Services
Manufacturing Trading
Services Trading
Services Trading
Manufacturing Trading & Services
Trading Services
Similar across all sectors
Recommended