Rates and causes of tropical deforestation
Presented by Frédéric Achard
With contributions from H. Eva, Ph. Mayaux, HJ Stibig & others

Content of the presentation
1. Rates of deforestation in the Tropics
2. Main drivers of deforestation
3. Rationale for future monitoring
From Global Forest Resources Assessment 2005FAO (Food and Agriculture Organisation)
Net global change in forest area:
- 8.9 million hectares per year for 1990–2000- 7.3 million hectares per year for 2000–2005
Total net loss for countries with a negative change:
13.1 million hectares per year for 1990–2000 12.9 million hectares per year for 2000–2005
Rates of Deforestation
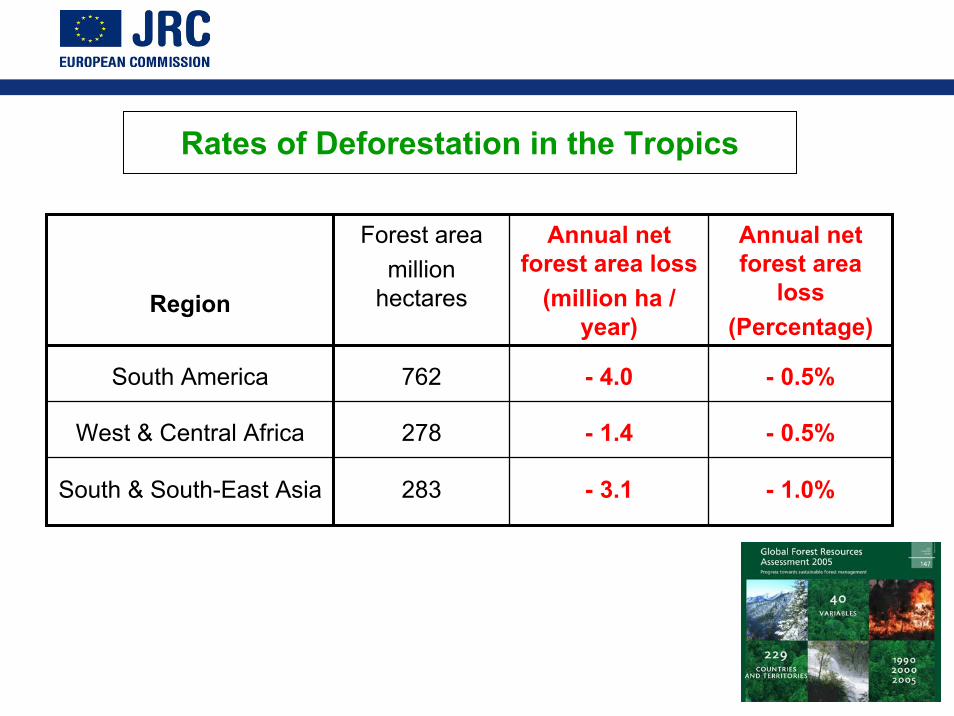
Rates of Deforestation in the Tropics
Region
Forest areamillion
hectares
Annual net forest area loss
(million ha / year)
Annual net forest area
loss (Percentage)
South America 762 - 4.0
- 1.4
- 3.1
- 0.5%
West & Central Africa 278 - 0.5%
South & South-East Asia 283 - 1.0%
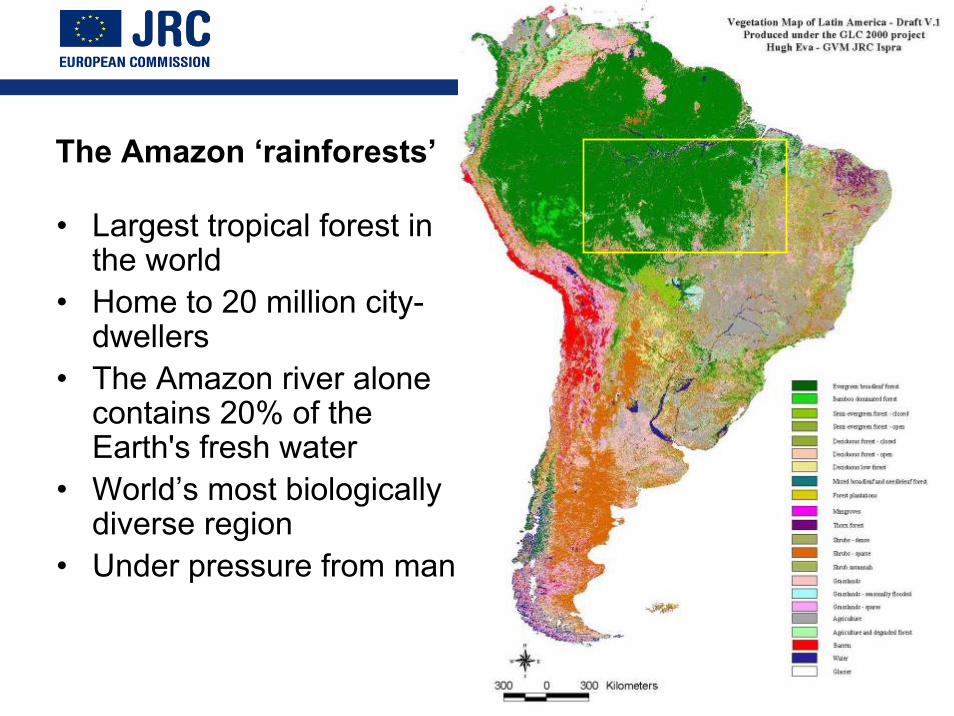
The Amazon ‘rainforests’
• Largest tropical forest in the world
• Home to 20 million city-dwellers
• The Amazon river alone contains 20% of the Earth's fresh water
• World’s most biologically diverse region
• Under pressure from man
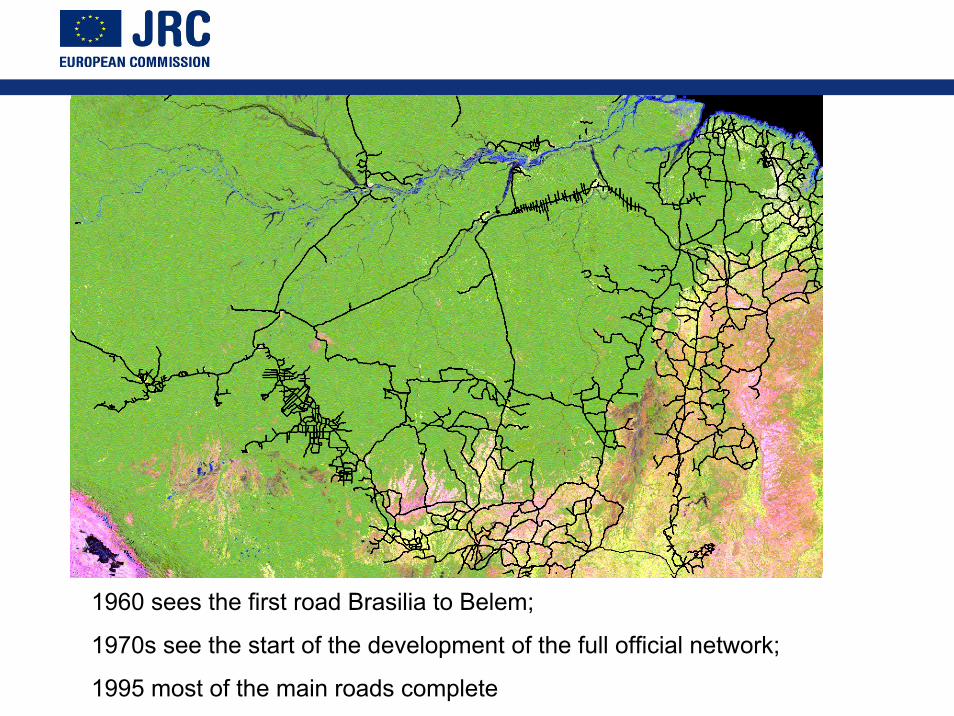
1960 sees the first road Brasilia to Belem;
1970s see the start of the development of the full official network;
1995 most of the main roads complete
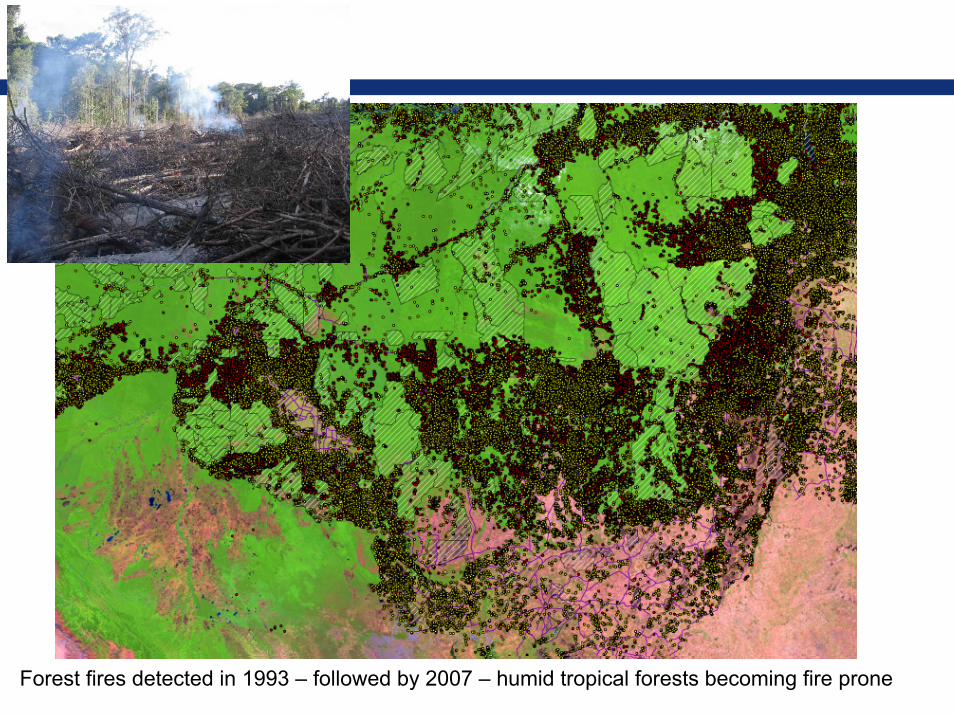
Forest fires detected in 1993 – followed by 2007 – humid tropical forests becoming fire prone
Main drivers in Amazonia
1. Conversion of forest to cash crop plantations and pastureIn the south of the Amazon (Mato Grosso): soya / cattleIn the east (Pará): cattle / other cash crops
2. Impact of urbanisation and infra-structure (roads) improvementsUrban population of Amazonia: from 3 million in 1970 to 13 millionThe road network has grown from nothing in 1970 to thousands of km’s$40 billion investment from 2000 to 2007 in highways and infrastructure
3. Concession logging and illegal loggingPrimarily in northern Pará – now moving south as stocks are depleted1 hectare of forest costs 10 times less than a hectare of pasture
4. Future factors: effect of biofuelThe possible leakage effect of biofuel production in the south of Brazil
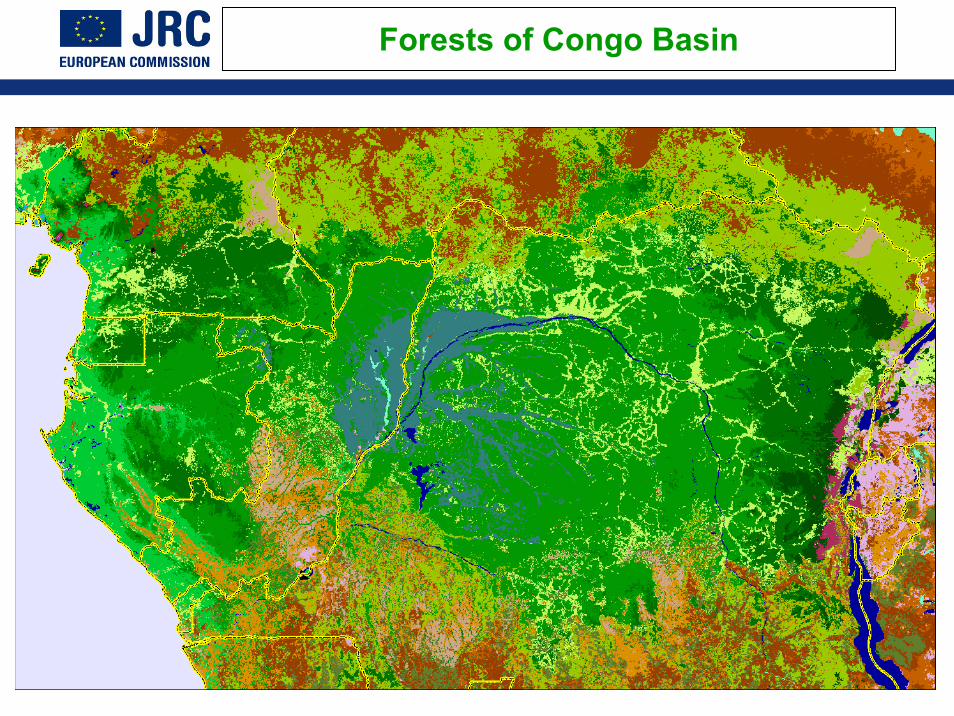
Forests of Congo Basin
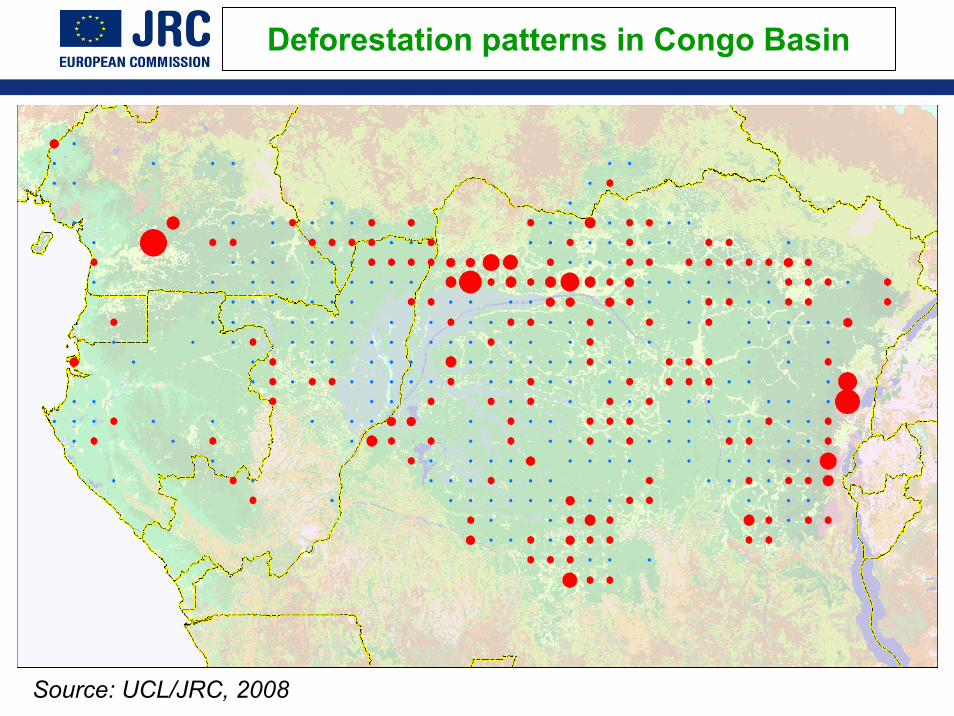
Source: UCL/JRC, 2008
Deforestation patterns in Congo Basin
Main drivers in Congo Basin
1. Deforestation is linked to increase in population, demand for land and improvement of access roads
2. Demand for timber in external markets is high (e.g. China) but:Sustainable development objectives are increasingly considered in
national forestry plans on Central African countries Sustainable logging does not necessarily cause long-term degradation
of the forest cover in the current conditions
3. Domestic fuel wood demand is still high in urban centresKinshasa needs 35,000 ha of forest/year leading to circa 100,000 ha per
year of degradation (long distance impact)
4. Future potential factor: biofuelBecause of proximity to Europe, biofuel issues may have an impact
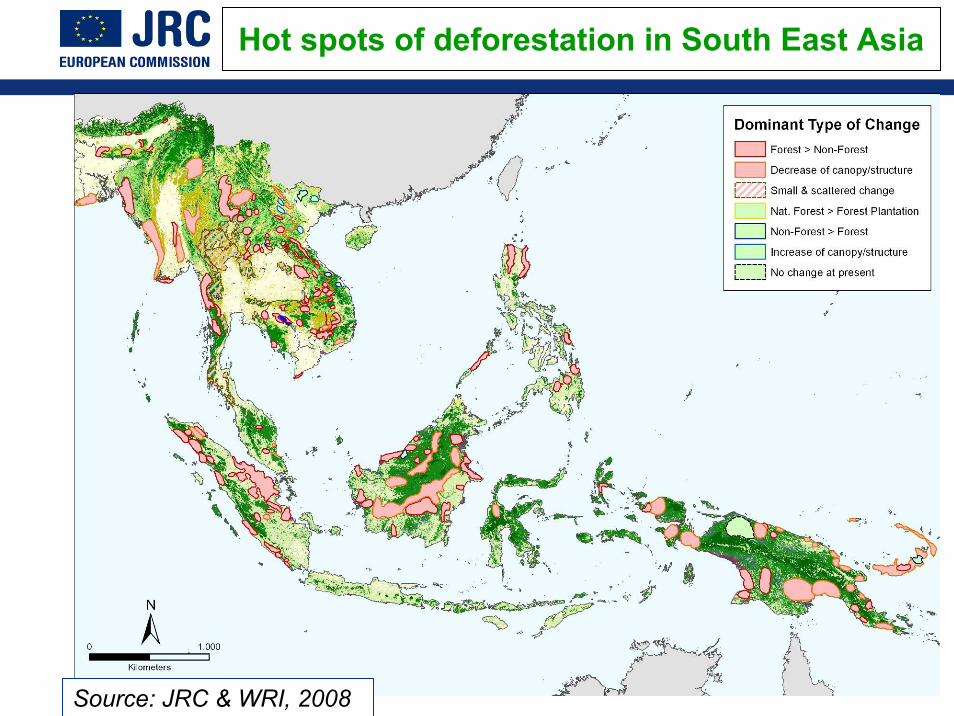
Hot spots of deforestation in South East Asia
Source: JRC & WRI, 2008
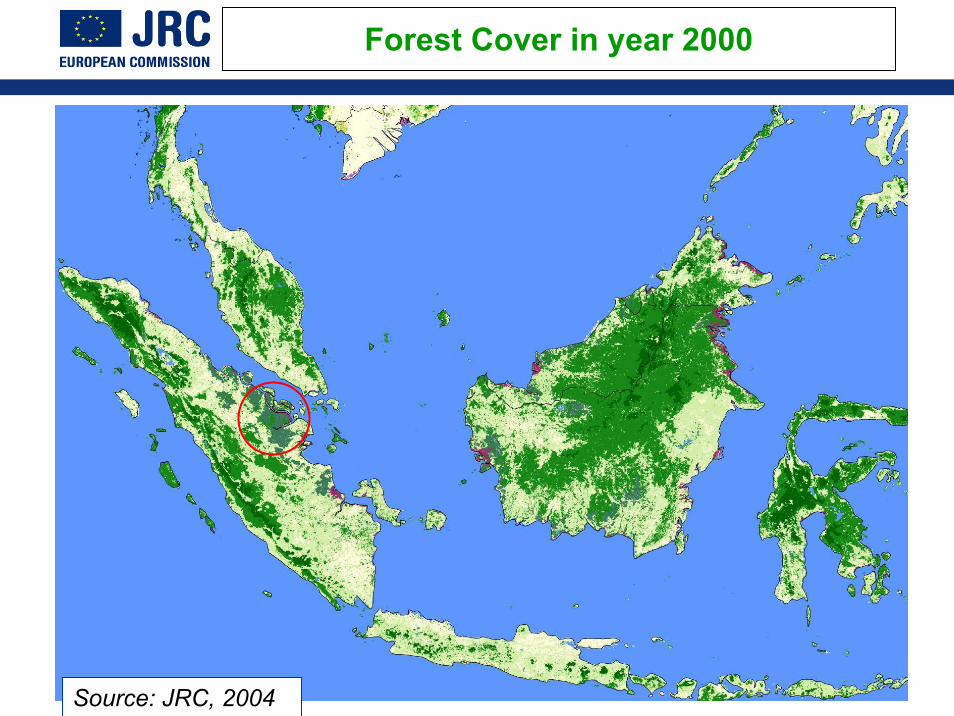
Forest Cover in year 2000
Source: JRC, 2004
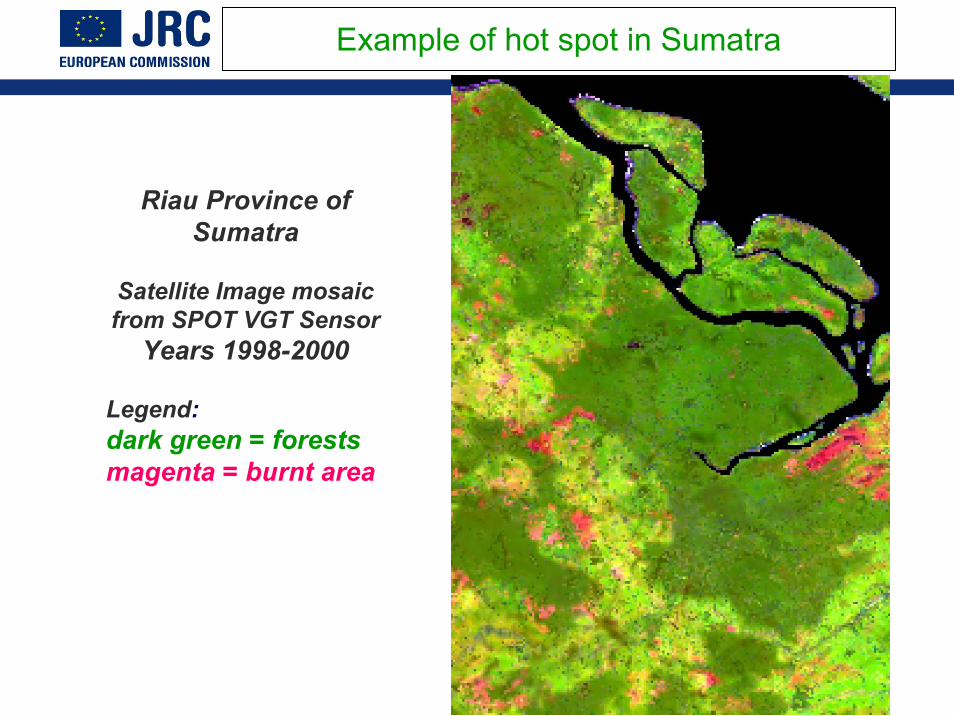
Riau Province of Sumatra
Satellite Image mosaic from SPOT VGT Sensor
Years 1998-2000
Legend:dark green = forestsmagenta = burnt area
Example of hot spot in Sumatra
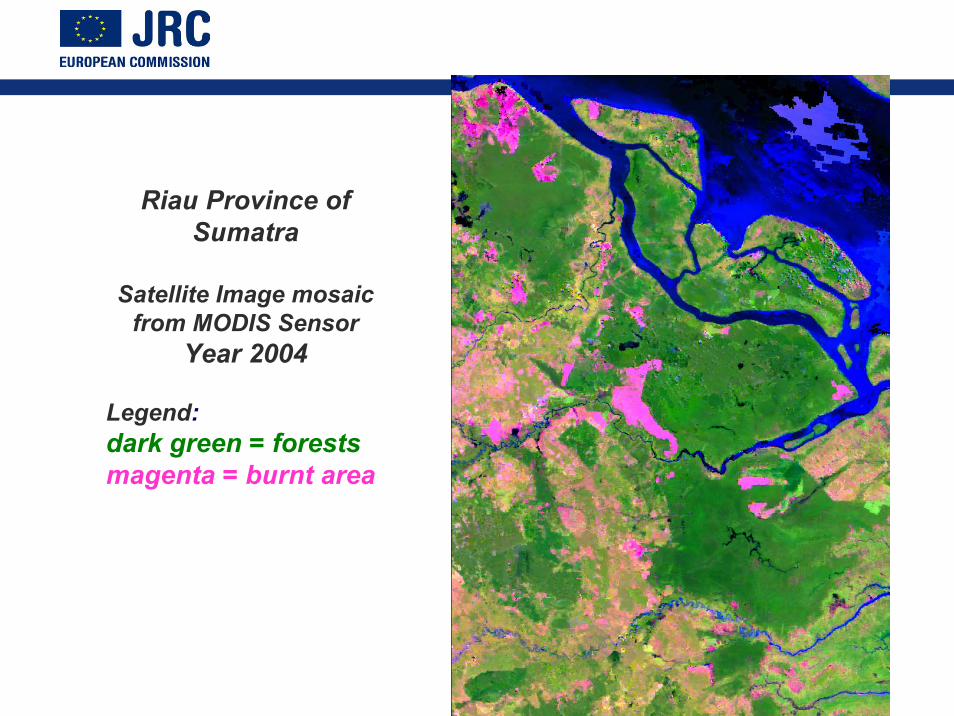
Riau Province of Sumatra
Satellite Image mosaic from MODIS Sensor
Year 2004
Legend:dark green = forestsmagenta = burnt area
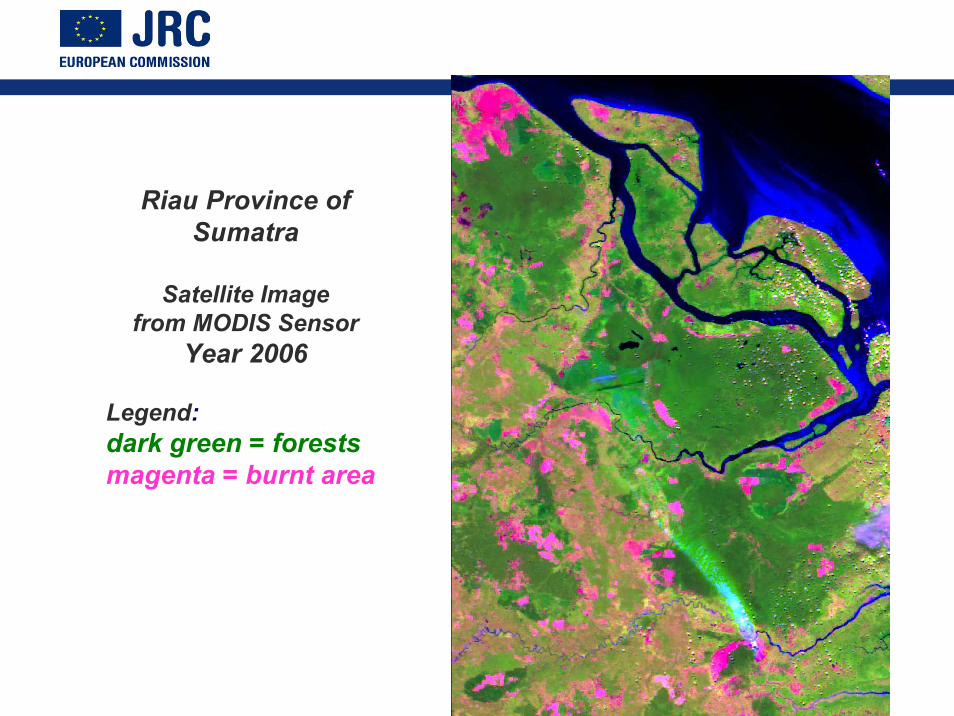
Riau Province of Sumatra
Satellite Image from MODIS Sensor
Year 2006
Legend:dark green = forestsmagenta = burnt area
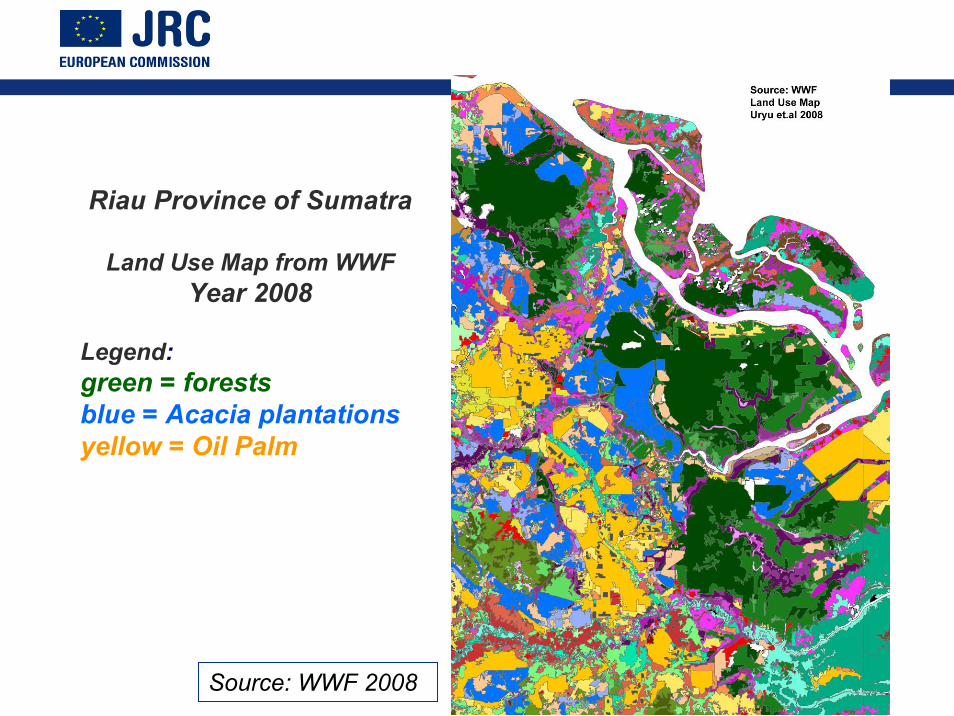
Source: WWF 2008
Riau Province of Sumatra
Land Use Map from WWFYear 2008
Legend:green = forestsblue = Acacia plantationsyellow = Oil Palm
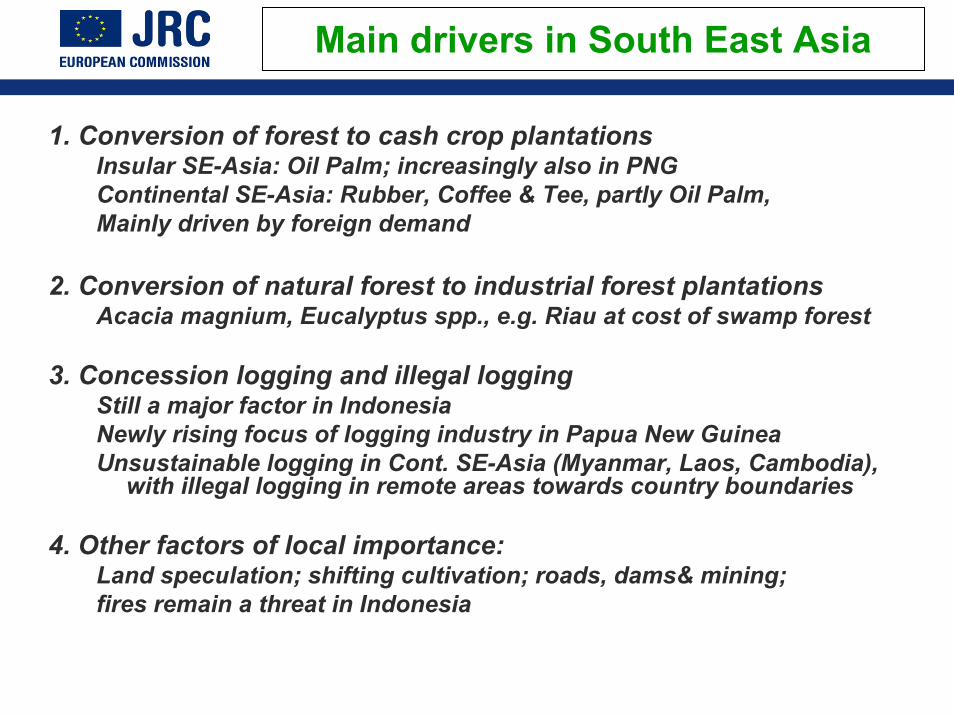
Main drivers in South East Asia
1. Conversion of forest to cash crop plantationsInsular SE-Asia: Oil Palm; increasingly also in PNGContinental SE-Asia: Rubber, Coffee & Tee, partly Oil Palm,Mainly driven by foreign demand
2. Conversion of natural forest to industrial forest plantationsAcacia magnium, Eucalyptus spp., e.g. Riau at cost of swamp forest
3. Concession logging and illegal loggingStill a major factor in Indonesia Newly rising focus of logging industry in Papua New GuineaUnsustainable logging in Cont. SE-Asia (Myanmar, Laos, Cambodia),
with illegal logging in remote areas towards country boundaries
4. Other factors of local importance:Land speculation; shifting cultivation; roads, dams& mining; fires remain a threat in Indonesia
Content of the presentation
1. Rates of deforestation in the Tropics
2. Main drivers of deforestation
3. Rationale for future monitoring
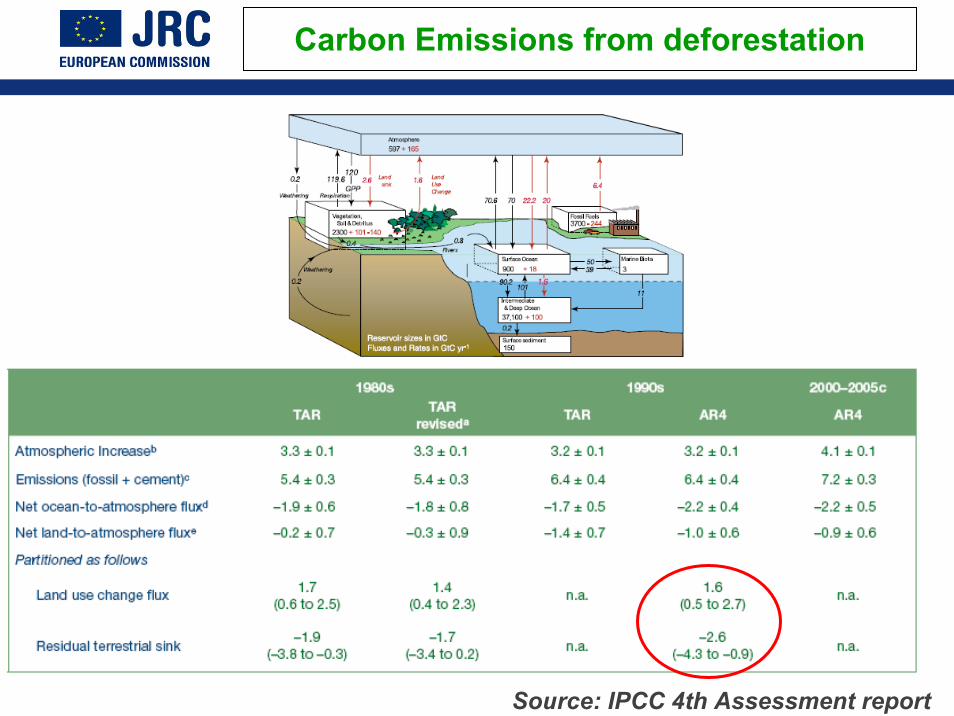
Carbon Emissions from deforestation
Source: IPCC 4th Assessment report

Political dimension in the UNFCCC frameworkDiscussions initiated at COP-11 in December 2005 on a
potential new mechanism (post-Kyoto) called “REDD” (Reducing
Emission from Deforestation and Degradation in Developing
Countries)
A key element in the Global GHG budget
Estimated CO2 emissions in 1990’s associated with land use change (mainly deforestation in Tropics) were 1.6 GtC yr–1 (0.5 to 2.7 GtC yr–1),
to be compared to 6.4 GtC.yr-1 from anthropogenic emissions, i.e.
Emissions from deforestation = 15% - 25% of anthropogenic emissions
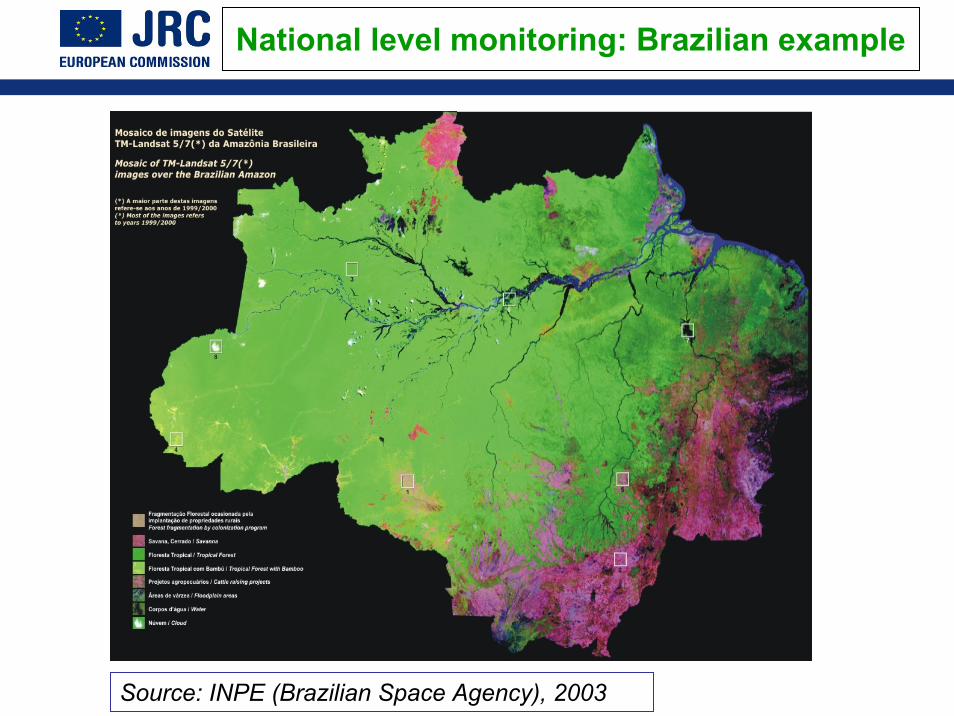
Source: INPE (Brazilian Space Agency), 2003
National level monitoring: Brazilian example
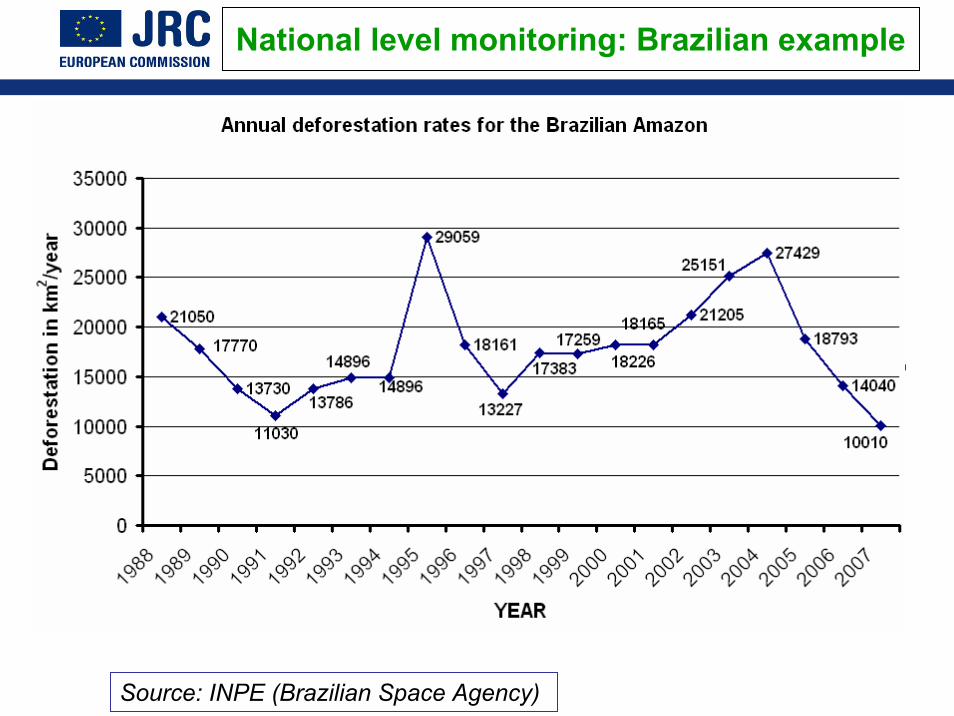
National level monitoring: Brazilian example
Source: INPE (Brazilian Space Agency)
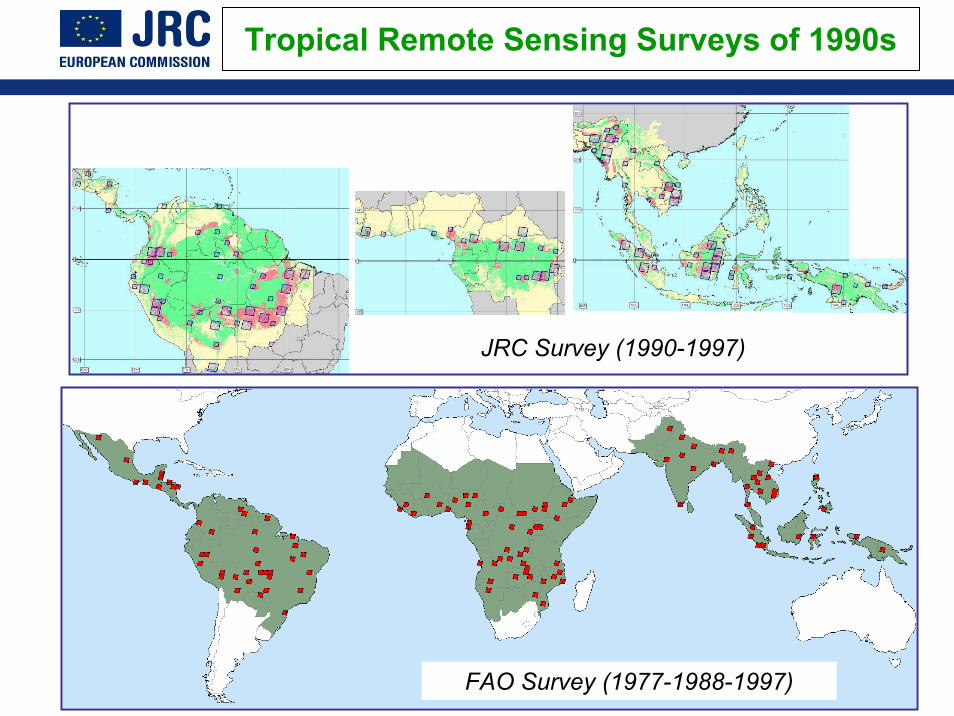
Tropical Remote Sensing Surveys of 1990s
JRC Survey (1990-1997)
FAO Survey (1977-1988-1997)
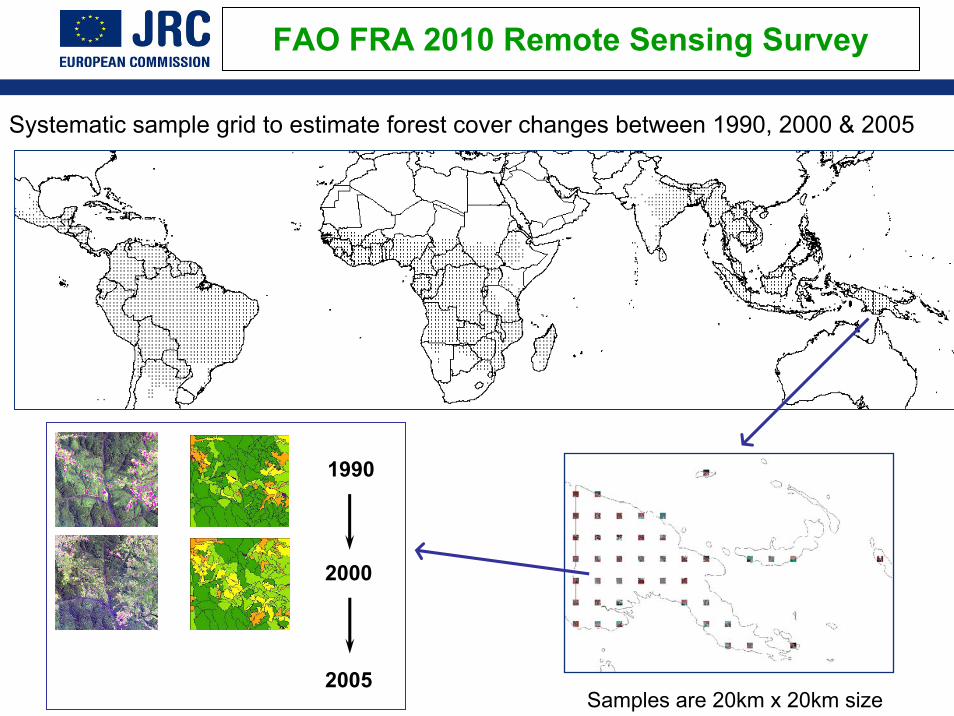
FAO FRA 2010 Remote Sensing Survey
1990
2000
2005
Systematic sample grid to estimate forest cover changes between 1990, 2000 & 2005
Samples are 20km x 20km size
Conclusions / key messages
A regular assessment of the state and conditions of tropical forests is needed:
• “Show and tell” approach is influential in raising awareness of size of the deforestation problem
– using visual products – based on credible analytical methods
• Continuity of observation is critical and relies on:– Technology (Satellite remote sensing)– Development of expertise (Forestry, RS)– Dissemination of data & results
Both deforestation and degradation need to be measured
Deforestation: from forest cover (land) to non-forest cover (land)
definition of forest cover (% tree cover)or definition of forest land (land use definition)importance of mapping unit size
Degradation : alteration of forest ecosystem
remaining cover (< 70%, >30%), biomass (C) ratio, biodiversity index
Parameters to be measured
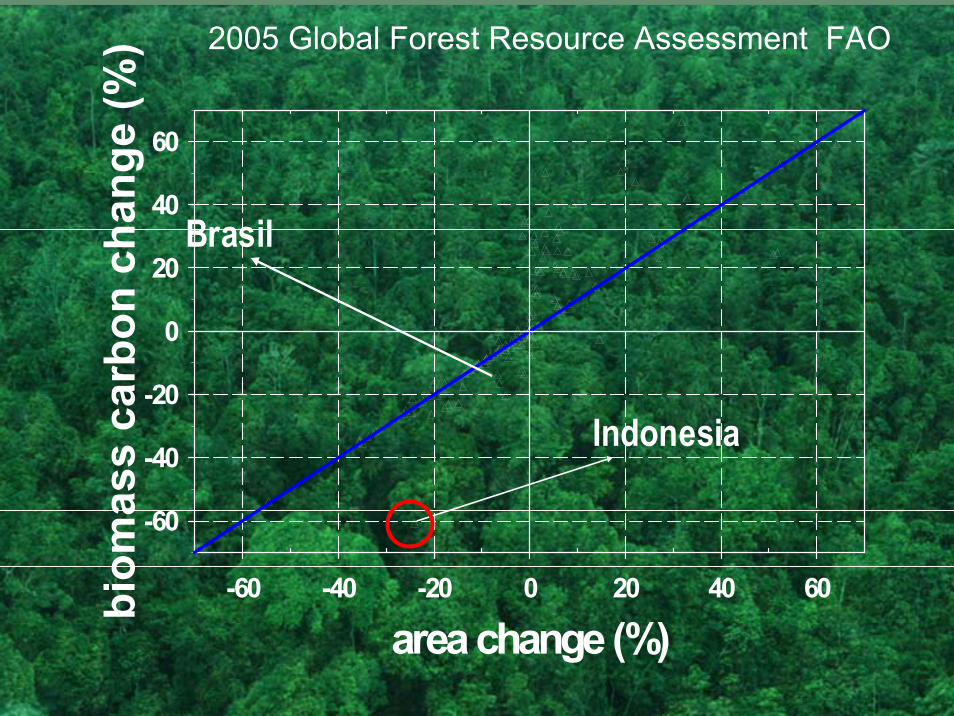
area change (%)-60 -40 -20 0 20 40 60bi
omas
s ca
rbon
cha
nge
(%)
-60
-40
-20
0
20
40
60
Indonesia
Brasil
2005 Global Forest Resource Assessment FAO
• Net Deforestation rate: 0.19% per year• Net Degradation rate: 0.10% per year
– Rate is less than half of Amazon and a quarter of SE Asia
• National patterns– Democratic Republic of Congo has highest rate– Congo, Gabon and Central African republic have very low rates
• Local patterns– Fringes of the Basin are more affected – ‘Landscapes’ are well protected (rates are half than out of
landscapes)
Rates in Congo Basin
Recommended