October 2008Jason B.K. Pang Kyle P. SteuckLaila CohagenJohn F. StantonMarc O Eberhard
WA-RD 684.2
Office of Research & Library Services
WSDOT Research Report
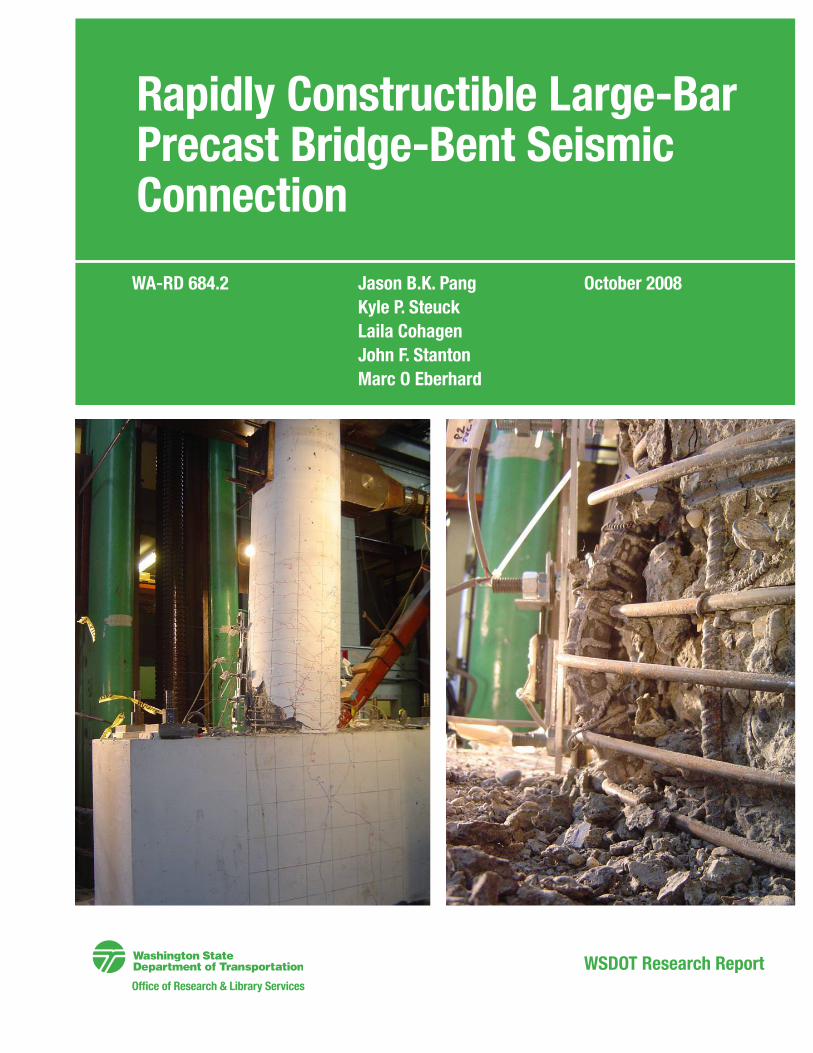
Rapidly Constructible Large-Bar Precast Bridge-Bent Seismic Connection
RESEARCH REPORT Agreement T4118, Task 05
Rapid Construction
RAPIDLY CONSTRUCTIBLE LARGE-BAR PRECAST BRIDGE-BENT SEISMIC CONNECTION
by
Jason B.K. Pang Kyle P. Steuck Graduate Research Assistant Design Engineer, Degenkolb Engineers
Laila Cohagen John F. Stanton Marc O Eberhard Graduate Research Assistant Professor Professor
Department of Civil and Environmental Engineering University of Washington, Box 352700
Seattle, Washington 98195
Washington State Transportation Center (TRAC) University of Washington, Box 354802
1107NE 45th Street, Suite 535 Seattle, Washington 98105-4631
Washington State Department of Transportation Technical Monitor Jugesh Kapur, State Bridge Engineer
Prepared for Washington State Transportation Commission
Department of Transportation and in cooperation with
U.S. Department of Transportation Federal Highway Administration
October 2008
1. REPORT NO.
WA-RD 684.2 2. GOVERNMENT ACCESSION NO. 3. RECIPIENT’S CATALOG NO.
4. TITLE AND SUBTITLE
RAPIDLY CONSTRUCTIBLE LARGE-BAR PRECAST BRIDGE-BENT CONNECTION
5. REPORT DATE
October 2008 6. PERFORMING ORGANIZATION CODE
7. AUTHORS
Jason B.K. Pang, Kyle P. Steuck, Laila Cohagen Marc O. Eberhard, John F. Stanton
8. PERFORMING ORGANIZATION CODE
9. PERFORMING ORGANIZATION NAME AND ADDRESS
Washington State Transportation Center University of Washington, Box 354802 University District Building, 1107 NE 45th Street, Suite 535 Seattle, Washington (98105-7370)
10. WORK UNIT NO.
11. CONTRACT OR GRANT NUMBER
T4118, Task 05
12. SPONSORING AGENCY NAME AND ADDRESS
Research Office Washington State Department of Transportation Transportation Building, MS 47372 Olympia, Washington 98504-7372 Project Manager: Kim Willoughby, 360-705-7978
13. TYPE OF REPORT AND PERIOD COVERED
Research Report
14. SPONSORING AGENCY CODE
15. SUPPLIMENTARY NOTES
16. ABSTRACT
The use of precast components in bridge bents can accelerate bridge construction, but their use in seismic systems is challenging. Such systems must have connections that are both easy to assemble on site, and have sufficient strength and ductility during earthquakes. A precast bridge bent beam-column connection that is suitable for rapid construction in seismic regions has been developed and tested. The connection features a small number of large (#18) vertical column bars grouted into large corrugated ducts embedded in the cap-beam. This combination provides speed and simplicity of erection, as well as generous construction tolerances. Lateral-load tests on the system showed that it has strength and ductility similar to those of a comparable cast-in-place connection, and that deliberate debonding of a short length of the bars has little effect on its seismic performance.
17. KEY WORDS
Precast concrete, bridge substructures, bents, bridge column, accelerated bridge construction, anchorage, ducts
18. DISTRIBUTION STATEMENT
19. SECURITY CLASSIF. (of this report) 20. SECURITY CLASSIF. (of this page) 21. NO. OF PAGES 22. PRICE

DISCLAIMER
The contents of this report reflect the views of the authors, who are responsible for the
facts and the accuracy of the data presented herein. The contents do not necessarily
reflect the official views or policies of the Washington State Transportation Commission,
Washington State Department of Transportation, or Federal Highway Administration.
This report does not constitute a standard, specification, or regulation.
iii

iv
TABLE OF CONTENTS Executive Summary....................................................................................................... xiii
Objectives ..................................................................................................................... xiii Background................................................................................................................... xiii Results ..................................................................................................................... xiv Conclusions................................................................................................................... xiv
1 Introduction........................................................................................................... 1
1.1 Rapid Construction in Seismic Regions ........................................................ 1 1.2 Design Considerations for Seismic Regions.................................................. 3 1.3 Previous WSDOT Research at the University of Washington ...................... 5 1.4 Objectives and Scope of This Research....................................................... 11
2 Previous Use of Precast Components in Bridge Substructures ...................... 12
2.1 SH 66 over Lake Ray Hubbard - Texas ....................................................... 12 2.2 SH 36 over Lake Belton – Texas ................................................................. 14 2.3 San Mateo Hayward Bridge - California ..................................................... 15 2.4 SR 520 West Lake Sammamish Parkway to SR 202 – Washington ........... 17
3 Experimental Program....................................................................................... 21
3.1 Overview...................................................................................................... 21 3.2 Design of Subassembly Specimens ............................................................. 22 3.3 Test Setup..................................................................................................... 27 3.4 Lateral-Load Displacement History............................................................. 29 3.5 Instrumentation ............................................................................................ 31
3.5.1 Applied Loads and Displacements............................................................... 31 3.5.2 Column Displacements ................................................................................ 33 3.5.3 Cap-Beam/Diaphragm Deflections.............................................................. 34 3.5.4 Column Curvatures ...................................................................................... 35 3.5.5 Reinforcement Strains.................................................................................. 36
4 Observed Subassembly Response...................................................................... 40
4.1 Nomenclature............................................................................................... 40 4.2 Specimen DB5-RE....................................................................................... 43 4.3 Specimen LB8-FB ....................................................................................... 53 4.4 Specimen LB8-D1 ....................................................................................... 65 4.5 Specimen LB8-D2 ....................................................................................... 77 4.6 Comparison of Observed Damage ............................................................... 91
5 Measured Subassembly Response ..................................................................... 94
5.1 Friction Correction....................................................................................... 94 5.2 Effective Force-Drift Response ................................................................... 94 5.3 Average Column Curvatures........................................................................ 99 5.4 Axial Shortening and Lengthening ............................................................ 105 5.5 Cap-Beam Flexural Behavior .................................................................... 107 5.6 Column Longitudinal Reinforcement Strains ............................................ 111 5.7 Column Longitudinal Reinforcement Curvatures...................................... 115
v
5.8 Spiral Reinforcement Strains ..................................................................... 119 6 Analysis Of The Measured Response.............................................................. 125
6.1 Strength Degradation ................................................................................. 125 6.2 Stiffness Reduction .................................................................................... 128 6.3 Energy Dissipation..................................................................................... 130 6.4 Concentrations of Column Deformations .................................................. 135 6.5 Effectiveness of Intentional Debonding..................................................... 136 6.6 Effects of Intentional Debonding............................................................... 137 6.7 Performance of Bond in Grouted Ducts..................................................... 139
7 Comparison with Analytical Models............................................................... 144
7.1 Damage Progression Models ..................................................................... 144 7.2 Force-Deformation Models........................................................................ 145 7.3 Comparison with ACI Nominal Flexural Strength .................................... 150
8 Implementation Considerations ...................................................................... 151
8.1 Evaluation of Design Methods................................................................... 151 8.1.1 Flexural Strength........................................................................................ 151 8.1.2 Stiffness...................................................................................................... 151 8.1.3 Force-Reduction Factor ............................................................................. 152 8.1.4 Sliding Shear at the Beam-Column Interface ............................................ 152 8.1.5 Anchorage Length...................................................................................... 152 8.1.6 Debonded Length....................................................................................... 153 8.1.7 Joint Shear.................................................................................................. 156
8.2 Design Recommendations ......................................................................... 157 8.2.1 Strength, Stiffness and Ductility ................................................................ 157 8.2.2 Bond and Anchorage.................................................................................. 157 8.2.3 Interface and Joint Shear............................................................................ 158 8.2.4 Corrosion and Durability ........................................................................... 158 8.2.5 Footing Connnection.................................................................................. 159
8.3 Field Implementation Recommendations .................................................. 159 8.3.1 Bar placement ............................................................................................ 159 8.3.2 Grout. ......................................................................................................... 160
9 Summary and Conclusions............................................................................... 161
9.1 Summary .................................................................................................... 161 9.2 Conclusions................................................................................................ 162
9.2.1 Column Subassembly Tests ....................................................................... 162 9.2.2 Bar Pullout Test ......................................................................................... 163
9.3 Recommendations for Further Research.................................................... 164 Acknowledgements ....................................................................................................... 165
References...................................................................................................................... 166
Appendix A Candidate Systems................................................................................ A-1 Appendix B Experimental Methods ..........................................................................B-1 Appendix C Estimation of Friction........................................................................... C-1 Appendix D Anchorage Pullout Tests....................................................................... D-1
vi
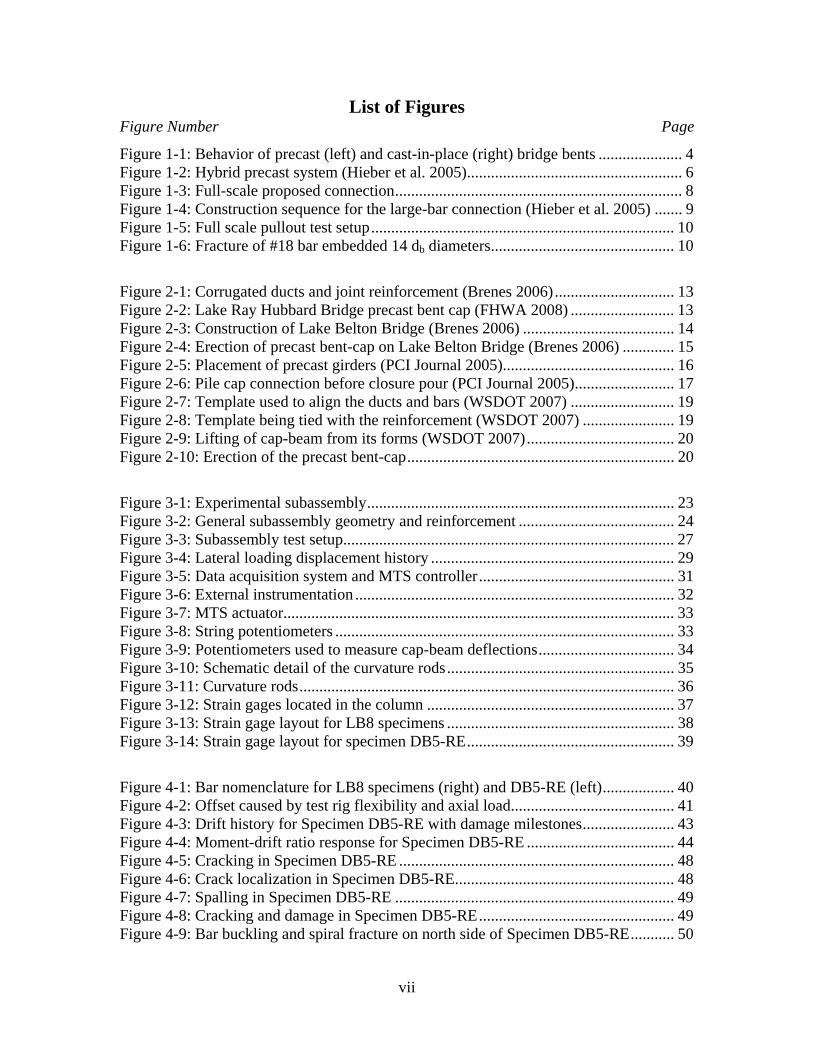
List of Figures Figure Number Page
Figure 1-1: Behavior of precast (left) and cast-in-place (right) bridge bents ..................... 4 Figure 1-2: Hybrid precast system (Hieber et al. 2005)...................................................... 6 Figure 1-3: Full-scale proposed connection........................................................................ 8 Figure 1-4: Construction sequence for the large-bar connection (Hieber et al. 2005) ....... 9 Figure 1-5: Full scale pullout test setup............................................................................ 10 Figure 1-6: Fracture of #18 bar embedded 14 db diameters.............................................. 10
Figure 2-1: Corrugated ducts and joint reinforcement (Brenes 2006).............................. 13 Figure 2-2: Lake Ray Hubbard Bridge precast bent cap (FHWA 2008) .......................... 13 Figure 2-3: Construction of Lake Belton Bridge (Brenes 2006) ...................................... 14 Figure 2-4: Erection of precast bent-cap on Lake Belton Bridge (Brenes 2006) ............. 15 Figure 2-5: Placement of precast girders (PCI Journal 2005)........................................... 16 Figure 2-6: Pile cap connection before closure pour (PCI Journal 2005)......................... 17 Figure 2-7: Template used to align the ducts and bars (WSDOT 2007) .......................... 19 Figure 2-8: Template being tied with the reinforcement (WSDOT 2007) ....................... 19 Figure 2-9: Lifting of cap-beam from its forms (WSDOT 2007)..................................... 20 Figure 2-10: Erection of the precast bent-cap................................................................... 20
Figure 3-1: Experimental subassembly............................................................................. 23 Figure 3-2: General subassembly geometry and reinforcement ....................................... 24 Figure 3-3: Subassembly test setup................................................................................... 27 Figure 3-4: Lateral loading displacement history ............................................................. 29 Figure 3-5: Data acquisition system and MTS controller................................................. 31 Figure 3-6: External instrumentation ................................................................................ 32 Figure 3-7: MTS actuator.................................................................................................. 33 Figure 3-8: String potentiometers ..................................................................................... 33 Figure 3-9: Potentiometers used to measure cap-beam deflections.................................. 34 Figure 3-10: Schematic detail of the curvature rods......................................................... 35 Figure 3-11: Curvature rods.............................................................................................. 36 Figure 3-12: Strain gages located in the column .............................................................. 37 Figure 3-13: Strain gage layout for LB8 specimens ......................................................... 38 Figure 3-14: Strain gage layout for specimen DB5-RE.................................................... 39
Figure 4-1: Bar nomenclature for LB8 specimens (right) and DB5-RE (left).................. 40 Figure 4-2: Offset caused by test rig flexibility and axial load......................................... 41 Figure 4-3: Drift history for Specimen DB5-RE with damage milestones....................... 43 Figure 4-4: Moment-drift ratio response for Specimen DB5-RE ..................................... 44 Figure 4-5: Cracking in Specimen DB5-RE ..................................................................... 48 Figure 4-6: Crack localization in Specimen DB5-RE....................................................... 48 Figure 4-7: Spalling in Specimen DB5-RE ...................................................................... 49 Figure 4-8: Cracking and damage in Specimen DB5-RE................................................. 49 Figure 4-9: Bar buckling and spiral fracture on north side of Specimen DB5-RE........... 50
vii
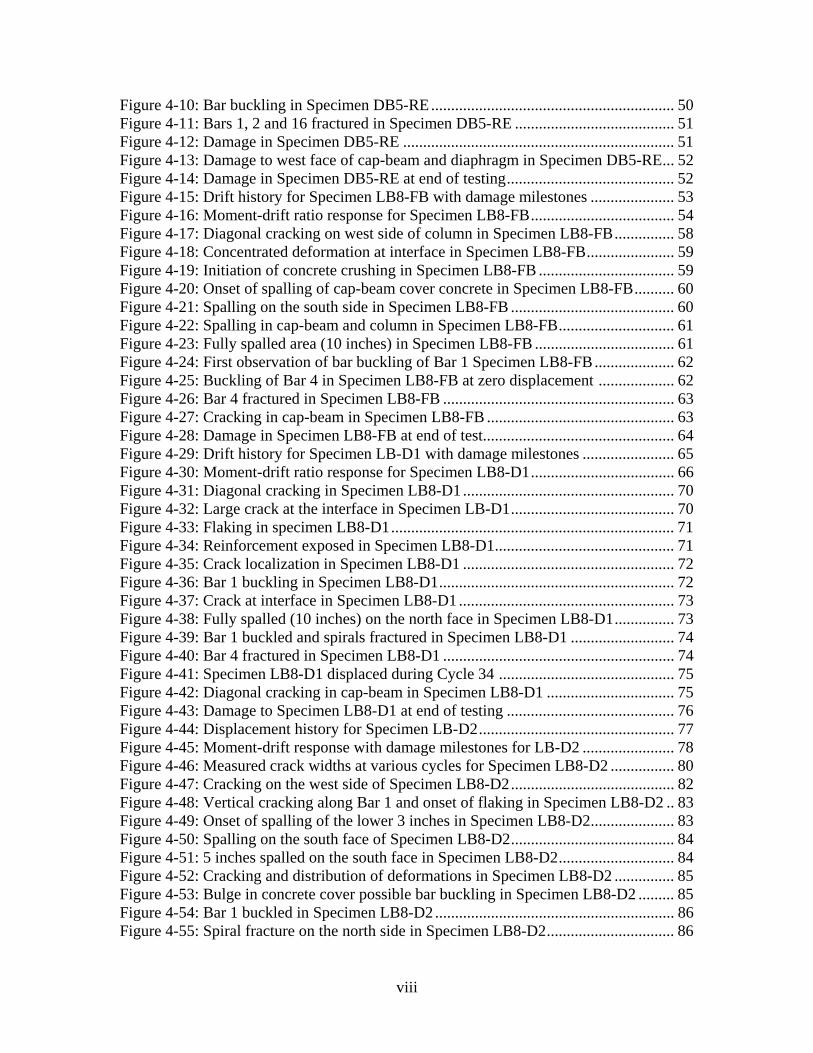
Figure 4-10: Bar buckling in Specimen DB5-RE............................................................. 50 Figure 4-11: Bars 1, 2 and 16 fractured in Specimen DB5-RE ........................................ 51 Figure 4-12: Damage in Specimen DB5-RE .................................................................... 51 Figure 4-13: Damage to west face of cap-beam and diaphragm in Specimen DB5-RE... 52 Figure 4-14: Damage in Specimen DB5-RE at end of testing.......................................... 52 Figure 4-15: Drift history for Specimen LB8-FB with damage milestones ..................... 53 Figure 4-16: Moment-drift ratio response for Specimen LB8-FB.................................... 54 Figure 4-17: Diagonal cracking on west side of column in Specimen LB8-FB............... 58 Figure 4-18: Concentrated deformation at interface in Specimen LB8-FB...................... 59 Figure 4-19: Initiation of concrete crushing in Specimen LB8-FB .................................. 59 Figure 4-20: Onset of spalling of cap-beam cover concrete in Specimen LB8-FB.......... 60 Figure 4-21: Spalling on the south side in Specimen LB8-FB ......................................... 60 Figure 4-22: Spalling in cap-beam and column in Specimen LB8-FB............................. 61 Figure 4-23: Fully spalled area (10 inches) in Specimen LB8-FB ................................... 61 Figure 4-24: First observation of bar buckling of Bar 1 Specimen LB8-FB.................... 62 Figure 4-25: Buckling of Bar 4 in Specimen LB8-FB at zero displacement ................... 62 Figure 4-26: Bar 4 fractured in Specimen LB8-FB .......................................................... 63 Figure 4-27: Cracking in cap-beam in Specimen LB8-FB ............................................... 63 Figure 4-28: Damage in Specimen LB8-FB at end of test................................................ 64 Figure 4-29: Drift history for Specimen LB-D1 with damage milestones ....................... 65 Figure 4-30: Moment-drift ratio response for Specimen LB8-D1.................................... 66 Figure 4-31: Diagonal cracking in Specimen LB8-D1 ..................................................... 70 Figure 4-32: Large crack at the interface in Specimen LB-D1......................................... 70 Figure 4-33: Flaking in specimen LB8-D1....................................................................... 71 Figure 4-34: Reinforcement exposed in Specimen LB8-D1............................................. 71 Figure 4-35: Crack localization in Specimen LB8-D1 ..................................................... 72 Figure 4-36: Bar 1 buckling in Specimen LB8-D1........................................................... 72 Figure 4-37: Crack at interface in Specimen LB8-D1 ...................................................... 73 Figure 4-38: Fully spalled (10 inches) on the north face in Specimen LB8-D1............... 73 Figure 4-39: Bar 1 buckled and spirals fractured in Specimen LB8-D1 .......................... 74 Figure 4-40: Bar 4 fractured in Specimen LB8-D1 .......................................................... 74 Figure 4-41: Specimen LB8-D1 displaced during Cycle 34 ............................................ 75 Figure 4-42: Diagonal cracking in cap-beam in Specimen LB8-D1 ................................ 75 Figure 4-43: Damage to Specimen LB8-D1 at end of testing .......................................... 76 Figure 4-44: Displacement history for Specimen LB-D2................................................. 77 Figure 4-45: Moment-drift response with damage milestones for LB-D2 ....................... 78 Figure 4-46: Measured crack widths at various cycles for Specimen LB8-D2 ................ 80 Figure 4-47: Cracking on the west side of Specimen LB8-D2......................................... 82 Figure 4-48: Vertical cracking along Bar 1 and onset of flaking in Specimen LB8-D2 .. 83 Figure 4-49: Onset of spalling of the lower 3 inches in Specimen LB8-D2..................... 83 Figure 4-50: Spalling on the south face of Specimen LB8-D2......................................... 84 Figure 4-51: 5 inches spalled on the south face in Specimen LB8-D2............................. 84 Figure 4-52: Cracking and distribution of deformations in Specimen LB8-D2 ............... 85 Figure 4-53: Bulge in concrete cover possible bar buckling in Specimen LB8-D2 ......... 85 Figure 4-54: Bar 1 buckled in Specimen LB8-D2............................................................ 86 Figure 4-55: Spiral fracture on the north side in Specimen LB8-D2................................ 86
viii
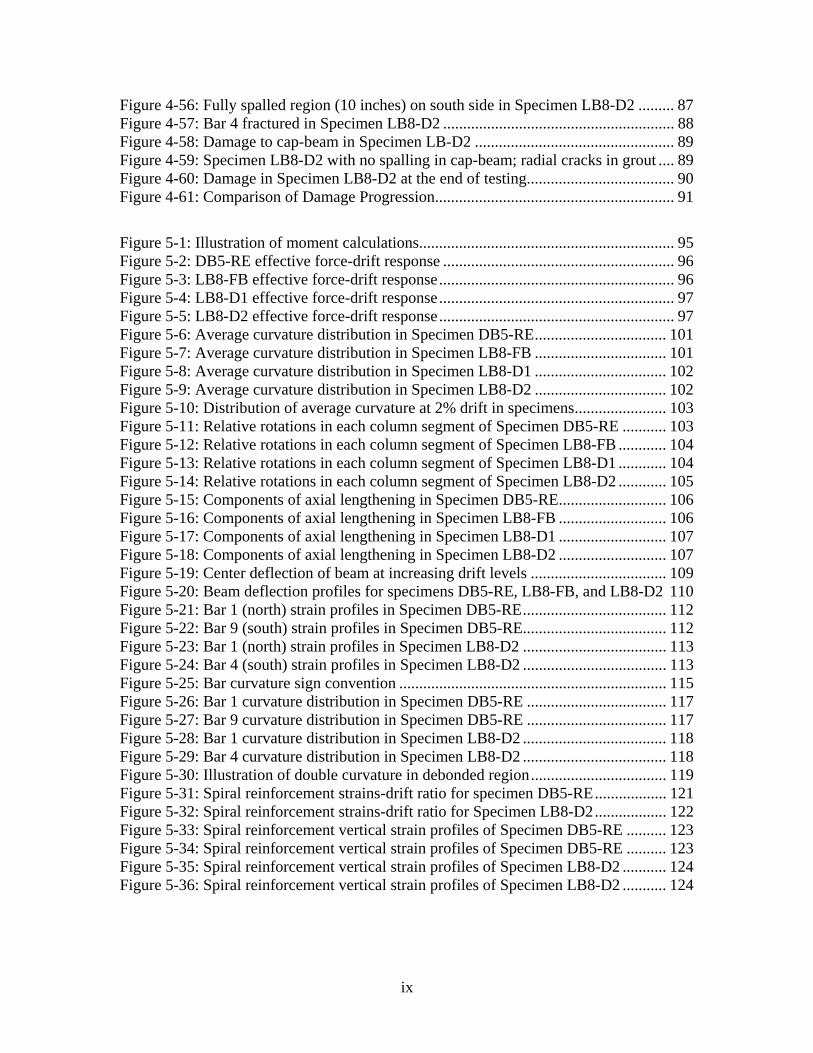
Figure 4-56: Fully spalled region (10 inches) on south side in Specimen LB8-D2 ......... 87 Figure 4-57: Bar 4 fractured in Specimen LB8-D2 .......................................................... 88 Figure 4-58: Damage to cap-beam in Specimen LB-D2 .................................................. 89 Figure 4-59: Specimen LB8-D2 with no spalling in cap-beam; radial cracks in grout .... 89 Figure 4-60: Damage in Specimen LB8-D2 at the end of testing..................................... 90 Figure 4-61: Comparison of Damage Progression............................................................ 91
Figure 5-1: Illustration of moment calculations................................................................ 95 Figure 5-2: DB5-RE effective force-drift response .......................................................... 96 Figure 5-3: LB8-FB effective force-drift response........................................................... 96 Figure 5-4: LB8-D1 effective force-drift response........................................................... 97 Figure 5-5: LB8-D2 effective force-drift response........................................................... 97 Figure 5-6: Average curvature distribution in Specimen DB5-RE................................. 101 Figure 5-7: Average curvature distribution in Specimen LB8-FB ................................. 101 Figure 5-8: Average curvature distribution in Specimen LB8-D1 ................................. 102 Figure 5-9: Average curvature distribution in Specimen LB8-D2 ................................. 102 Figure 5-10: Distribution of average curvature at 2% drift in specimens....................... 103 Figure 5-11: Relative rotations in each column segment of Specimen DB5-RE ........... 103 Figure 5-12: Relative rotations in each column segment of Specimen LB8-FB ............ 104 Figure 5-13: Relative rotations in each column segment of Specimen LB8-D1 ............ 104 Figure 5-14: Relative rotations in each column segment of Specimen LB8-D2 ............ 105 Figure 5-15: Components of axial lengthening in Specimen DB5-RE........................... 106 Figure 5-16: Components of axial lengthening in Specimen LB8-FB ........................... 106 Figure 5-17: Components of axial lengthening in Specimen LB8-D1 ........................... 107 Figure 5-18: Components of axial lengthening in Specimen LB8-D2 ........................... 107 Figure 5-19: Center deflection of beam at increasing drift levels .................................. 109 Figure 5-20: Beam deflection profiles for specimens DB5-RE, LB8-FB, and LB8-D2 110 Figure 5-21: Bar 1 (north) strain profiles in Specimen DB5-RE.................................... 112 Figure 5-22: Bar 9 (south) strain profiles in Specimen DB5-RE.................................... 112 Figure 5-23: Bar 1 (north) strain profiles in Specimen LB8-D2 .................................... 113 Figure 5-24: Bar 4 (south) strain profiles in Specimen LB8-D2 .................................... 113 Figure 5-25: Bar curvature sign convention ................................................................... 115 Figure 5-26: Bar 1 curvature distribution in Specimen DB5-RE ................................... 117 Figure 5-27: Bar 9 curvature distribution in Specimen DB5-RE ................................... 117 Figure 5-28: Bar 1 curvature distribution in Specimen LB8-D2 .................................... 118 Figure 5-29: Bar 4 curvature distribution in Specimen LB8-D2 .................................... 118 Figure 5-30: Illustration of double curvature in debonded region.................................. 119 Figure 5-31: Spiral reinforcement strains-drift ratio for specimen DB5-RE.................. 121 Figure 5-32: Spiral reinforcement strains-drift ratio for Specimen LB8-D2.................. 122 Figure 5-33: Spiral reinforcement vertical strain profiles of Specimen DB5-RE .......... 123 Figure 5-34: Spiral reinforcement vertical strain profiles of Specimen DB5-RE .......... 123 Figure 5-35: Spiral reinforcement vertical strain profiles of Specimen LB8-D2 ........... 124 Figure 5-36: Spiral reinforcement vertical strain profiles of Specimen LB8-D2 ........... 124
ix

Figure 6-1: Effective force-drift envelope curves........................................................... 125 Figure 6-2: Normalized effective force vs. drift ............................................................. 126 Figure 6-3: Effective force resistance decrease from the first to second cycle .............. 127 Figure 6-4: Illustration of method for computing secant stiffness.................................. 128 Figure 6-5: Secant stiffness............................................................................................. 129 Figure 6-6: Stiffness degradation and damage comparison for Specimen LB8-D2. ...... 130 Figure 6-7: Illustration of methodology use to compute energy dissipation .................. 130 Figure 6-8: Energy dissipated per cycle.......................................................................... 131 Figure 6-9: Cumulative energy dissipated at each cycle ................................................ 132 Figure 6-10: Illustration of methodology used to normalize energy dissipation ............ 132 Figure 6-11: Normalized energy dissipation................................................................... 133 Figure 6-12: Illustration of methodology use to compute equivalent damping.............. 134 Figure 6-13: Equivalent damping ratio at increasing drift levels ................................... 135 Figure 6-14: Relative rotation over D/10 (0 to 2 inch segment)..................................... 136 Figure 6-15: Illustration of equilibrium of bar pullout (Steuck 2007)............................ 140 Figure 6-16: Strain profiles at bar stresses 20 and 60 ksi ............................................... 142
Figure 7-1: Specimen DB5-RE force-displacement envelopes ...................................... 149 Figure 7-2: Specimen LB8-FB force-displacement envelopes....................................... 149 Figure 7-3: Specimen LB8-D1 force-displacement envelopes....................................... 150 Figure 7-4: Specimen LB8-D2 force-displacement envelopes....................................... 150 Figure 8-1: Method to determine debonded length needed ............................................ 156 Figure 8-2: Design and measured bar strains versus drift ratio ...................................... 157
x
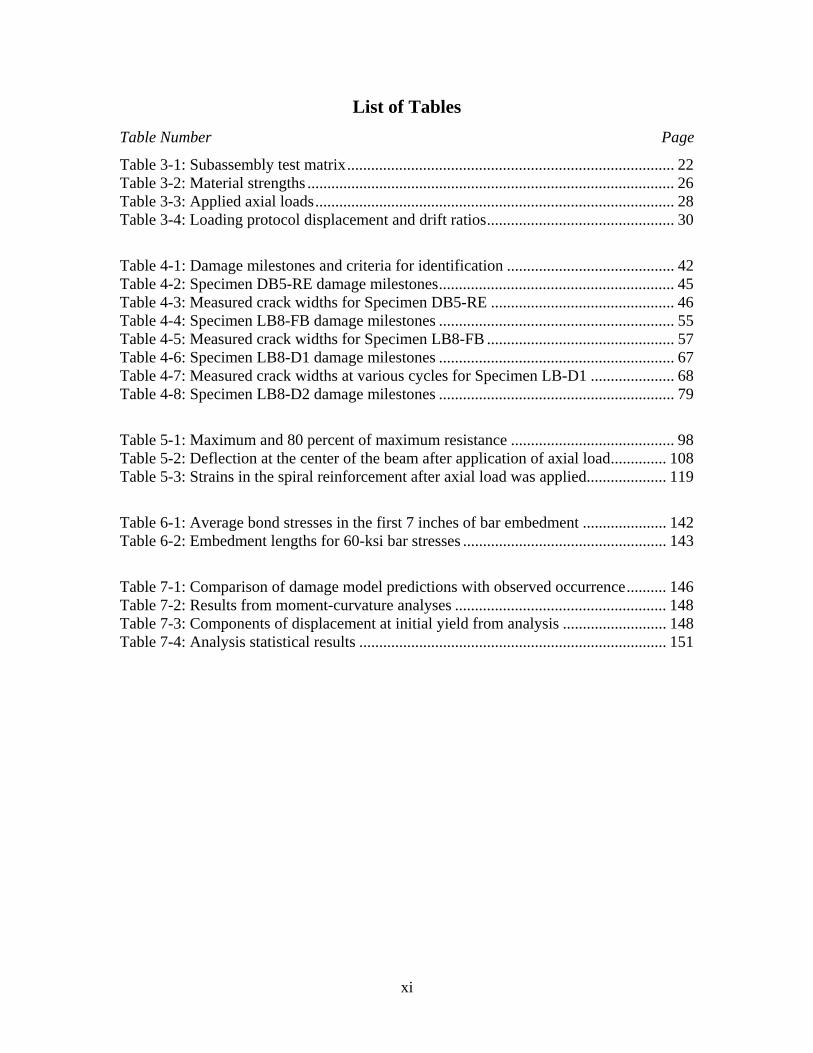
List of Tables Table Number Page
Table 3-1: Subassembly test matrix.................................................................................. 22 Table 3-2: Material strengths ............................................................................................ 26 Table 3-3: Applied axial loads.......................................................................................... 28 Table 3-4: Loading protocol displacement and drift ratios............................................... 30
Table 4-1: Damage milestones and criteria for identification .......................................... 42 Table 4-2: Specimen DB5-RE damage milestones........................................................... 45 Table 4-3: Measured crack widths for Specimen DB5-RE .............................................. 46 Table 4-4: Specimen LB8-FB damage milestones ........................................................... 55 Table 4-5: Measured crack widths for Specimen LB8-FB ............................................... 57 Table 4-6: Specimen LB8-D1 damage milestones ........................................................... 67 Table 4-7: Measured crack widths at various cycles for Specimen LB-D1 ..................... 68 Table 4-8: Specimen LB8-D2 damage milestones ........................................................... 79
Table 5-1: Maximum and 80 percent of maximum resistance ......................................... 98 Table 5-2: Deflection at the center of the beam after application of axial load.............. 108 Table 5-3: Strains in the spiral reinforcement after axial load was applied.................... 119
Table 6-1: Average bond stresses in the first 7 inches of bar embedment ..................... 142 Table 6-2: Embedment lengths for 60-ksi bar stresses ................................................... 143
Table 7-1: Comparison of damage model predictions with observed occurrence.......... 146 Table 7-2: Results from moment-curvature analyses ..................................................... 148 Table 7-3: Components of displacement at initial yield from analysis .......................... 148 Table 7-4: Analysis statistical results ............................................................................. 151
xi

xii
EXECUTIVE SUMMARY
Objectives
A precast, column-to-cap-beam connection, designed to accelerate the
construction of bridge bents in seismic regions, was developed, tested, and evaluated. The
connection’s features include speed and simplicity of erection, as well as generous
construction tolerances. The primary objective of the research was to evaluate the seismic
response of the proposed system in comparison with the response of a typical cast-in-
place system. The secondary objective was to investigate the impact of deliberately
debonding the longitudinal bars over a short length near the beam-column interface.
Background
The proposed precast beam-column connection consists of six large, vertical bars
that project from the column and that are inserted into ducts embedded in the precast
concrete cap beam. The bars are then grouted integrally in the ducts. The column bars
are #18 (2.25-inch diameter), and the ducts are corrugated metal with a diameter of 8.5
inches. The use of few bars is the feature that simplifies construction.
The structural integrity of the connection depends on the anchorage of the bars in
the ducts. One issue is that the length typically available in the cap-beam is less than the
development length required by the AASHTO Load and Resistance Factor Design
(LRFD) Specifications. However, previous full-scale, monotonic, pull-out tests and
analytical modeling of large bars grouted into corrugated ducts confirmed that the #18
bars could be fully anchored in a length significantly shorter than the depth of the cap-
beam (Steuck et al. 2007).
Four column subassembly lateral-load tests and three monotonic pullout tests
were conducted to evaluate the seismic response of the proposed system. They were all at
approximately 40 percent scale. The first subassembly represented a typical cast-in-place
bridge column and provided a baseline for evaluating the proposed, large-bar precast
connection. The remaining three were possible variations of the proposed system; they
consisted of one fully bonded specimen and two with different methods of local
xiii
debonding. The purpose of the debonding was to reduce the strain concentration in the
bars at the interface.
Three monotonic pullout tests on bars replicating the anchorage in the
subassembly of the proposed system were also conducted to more closely study the
anchorage conditions and distribution of bond along the bars.
Results
The force-displacement responses and levels of damage were nearly identical for
all four subassemblies. All the specimens maintained 80 percent of their peak lateral
resistances out to a drift ratio of approximately 5.5 percent. All failed as a result of bar
buckling and bar fracture, which occurred at nearly the same drifts in each specimen.
Deformations in the precast subassemblies were concentrated at a large crack opening at
the interface, but they were more evenly distributed in the cast-in-place subassembly.
Measured strains along the bars in the pullout tests indicated that both methods of
debonding were effective and that there was no measurable difference between them.
Considerable surface displacement of the grout, duct, and concrete were measured in the
fully bonded subassemblies and pullout specimens. These displacements led to radial
cracking and minor surface spalling around the bar. In contrast, no cracks were observed
in the debonded specimens, and surface displacements were negligible.
Conclusions
The expected seismic performance of the proposed precast connection is in most
respects similar to that of a typical cast-in-place system. The proposed system is expected
to perform well out to a drift of 5.5 percent and has a drift capacity that far exceeds the
drift demand of even large earthquakes.
Deliberate debonding of the longitudinal bars over a short length in the cap-beam
had little effect on the overall hysteretic performance because cyclic loading debonds the
bars in the column, which reduces the strain concentration at the interface. Debonding
did, however, reduce the demand on the cover concrete by anchoring the bar deeper in
the cap-beam, where better confinement and higher bond stresses exist.
xiv
1 INTRODUCTION
The United States suffers from having an aging infrastructure, including a high
percentage of bridges that are either functionally or structurally obsolete (FHWA 2006).
At the same time, increasing traffic congestion is straining the nation’s transportation
facilities because construction of new highway infrastructure has not kept pace with
increasing demands. Replacing obsolete bridges in increasingly congested urban areas to
meet demands represents an enormous challenge. Concerns about traffic delays,
economic losses during construction, and work-zone safety have drastically increased as
well. These concerns and other adverse impacts associated with bridge construction are
being addressed by the development of methods to construct bridges more rapidly. As
part of this effort, this report focuses on the development and experimental testing of a
precast bridge bent system for use in seismic regions, such as Western Washington State.
1.1 Rapid Construction in Seismic Regions
Typical highway bridges in Washington State consist of a cast-in-place reinforced
concrete substructure, precast-prestressed concrete or steel girders, and a cast-in-place
deck. Although this type of construction produces durable and earthquake-resistant
bridges, cast-in-place construction is frequently slow (Wacker et al. 2005). Cast-in-place
construction requires numerous, time-consuming on-site activities, including erection of
formwork and shoring, assembling reinforcement, placing concrete, and waiting for the
concrete to cure before proceeding to the next steps in construction. The primary problem
lies in the time needed for these on-site activities, which are the ones that most likely
affect traffic. Accelerating this sequence and minimizing the time required on-site are
vital to the reduction of the negative impacts caused by bridge construction.
Fabricating precast concrete components off-site and erecting them on-site has
tremendous potential for accelerating the construction process. The use of precast
components can reduce traffic disruptions and environmental impacts, improve
constructability and work-zone safety, increase quality and durability, and lower life-
cycle costs (Wacker et al. 2005). By using precast components, time-consuming
sequential activities can be performed in parallel and moved off-site, away from high-
1
speed traffic. Workers can shift many dangerous tasks, such as working at high elevations
or near moving traffic, to safer locations. These shifts lower their exposure to many
hazardous conditions. Accelerating construction also reduces lane closures and dangerous
traffic merges or detours, minimizing delays while increasing safety for motorists.
Precast elements are also typically more durable and of higher quality than cast-in-place
components because the controlled fabrication environment is more favorable to strict
quality control measures. It also lessens the impact to the environment by decreasing the
use of site-cast concrete (Hieber et al. 2005a). The risk of concrete contamination to
watersheds and the need for clearing large staging areas in virgin areas can also be
reduced.
The Washington State Department of Transportation (WSDOT) has used precast
concrete components in some applications for many years. For example, prestressed
girders and slab panels have been used in the superstructure. However, contractors have
only recently begun using precast columns with cast-in-place bent-caps in order to
accelerate construction (Khaleghi 2005).
Even greater potential for speed and economy is anticipated by utilizing precast
components to rapidly construct bridge substructures. Methods for rapid construction
using precast components in the bridge substructure have already been successfully
developed and implemented in non-seismic regions (Billington et al. 2001, Matsumoto et
al. 2001). Such systems use connections located at the beam-column interface to facilitate
fabrication and transportation of the pieces. Precast bent-cap connections, such as mild
steel anchored in grouted ducts or post-tension anchors, have been effectively used in
these regions.
Little is known of how to detail the connections to perform well in earthquakes.
The use of precast systems in seismic regions requires connections that are both easy and
quick to assemble and that have the necessary strength and ductility to resist seismic
deformations. Meeting these two requirements simultaneously presents particular
difficulties because, ironically, most of the techniques that offer faster bridge
construction also lead to poor seismic resistance. Limited knowledge about the seismic
performance of these connections has deterred the use of these rapid construction
techniques in seismically active regions.
2

1.2 Design Considerations for Seismic Regions
Modern design philosophy in the U.S. is to design structures to yield in a
controlled manner under earthquake loading. In buildings, beams are typically chosen to
be the yielding elements, so that columns do not sustain high levels of damage and can
continue to carry gravity loads, thus preventing collapse. That philosophy also avoids a
soft first-story mechanism, which has been shown to be disastrous in multi-story
buildings.
In contrast, this type of behavior is usually undesirable or not achievable in
bridges because allowing damage to occur at the ends of long spans increases the
likelihood of collapse. Furthermore, a well-confined bridge column, which usually carries
a low level of axial load, can continue to carry axial load even after hinging and severe
damage has occurred. Lastly, hinging and damage in the foundations is undesirable
because inspection is difficult. Therefore, the design approach in the U.S. is for the
superstructure and foundation to remain elastic while the substructure experiences the
majority of inelastic action in the form of flexural deformations and plastic hinging in the
columns (Wacker et al. 2005).
Design of the bridge superstructure is similar for seismic and non-seismic regions
because it remains essentially elastic. For this reason precast components used in non-
seismic regions, such as girders and decking, are abundantly used throughout Western
Washington to accelerate construction. Unlike the superstructure, however, most bridge
substructures are currently constructed of cast-in-place reinforced concrete because, up
until now, monolithic action between the superstructure and substructure has been viewed
as the key to seismic resistance (Khaleghi 2005). In multi-column bents, a moment
connection is needed at the beam-column joint to reduce the moment demand on the
foundation and at the base of the column.
The seismic performance of the substructure relies heavily on the moment
connection that can be created at the beam-column joint. But this is where the largest
moment and shear forces and inelastic deformations occur. A cast-in-place beam-column
connection can be made strong and ductile with standard seismic detailing. Typically, the
connection is made stronger than the members so that deformation and yielding are
forced to spread over the length of the plastic hinge region in the column. In contrast, it is
3
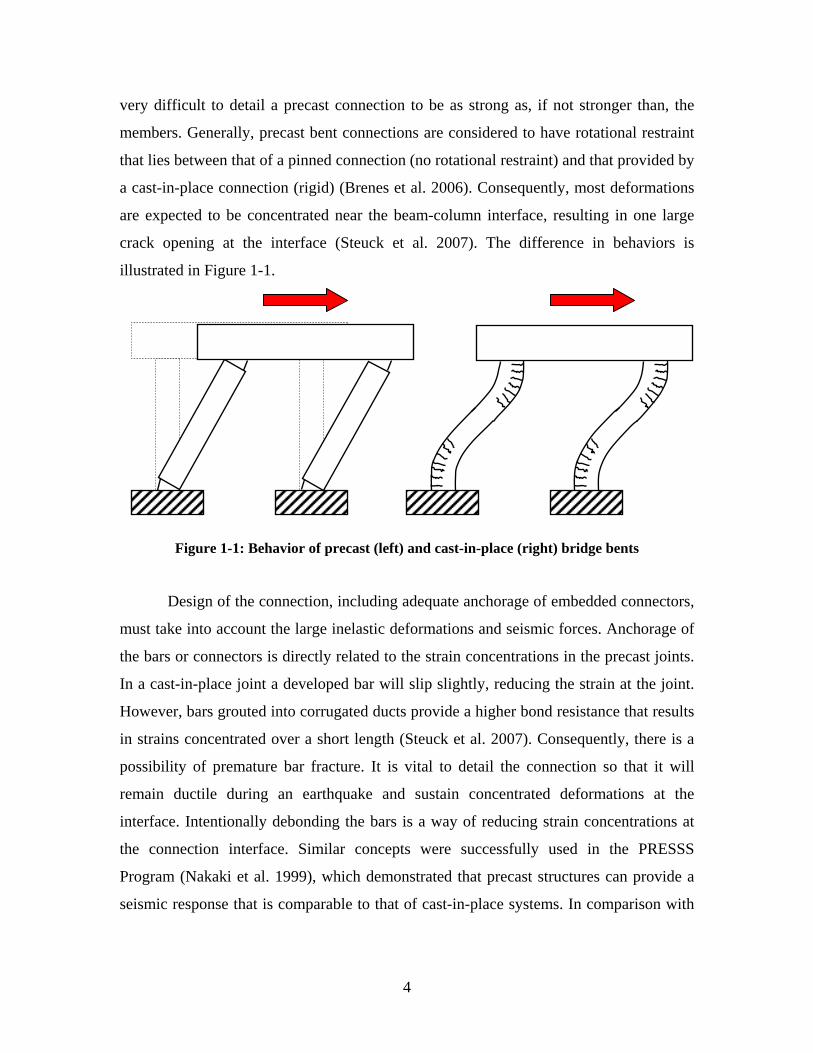
very difficult to detail a precast connection to be as strong as, if not stronger than, the
members. Generally, precast bent connections are considered to have rotational restraint
that lies between that of a pinned connection (no rotational restraint) and that provided by
a cast-in-place connection (rigid) (Brenes et al. 2006). Consequently, most deformations
are expected to be concentrated near the beam-column interface, resulting in one large
crack opening at the interface (Steuck et al. 2007). The difference in behaviors is
illustrated in Figure 1-1.
Figure 1-1: Behavior of precast (left) and cast-in-place (right) bridge bents
Design of the connection, including adequate anchorage of embedded connectors,
must take into account the large inelastic deformations and seismic forces. Anchorage of
the bars or connectors is directly related to the strain concentrations in the precast joints.
In a cast-in-place joint a developed bar will slip slightly, reducing the strain at the joint.
However, bars grouted into corrugated ducts provide a higher bond resistance that results
in strains concentrated over a short length (Steuck et al. 2007). Consequently, there is a
possibility of premature bar fracture. It is vital to detail the connection so that it will
remain ductile during an earthquake and sustain concentrated deformations at the
interface. Intentionally debonding the bars is a way of reducing strain concentrations at
the connection interface. Similar concepts were successfully used in the PRESSS
Program (Nakaki et al. 1999), which demonstrated that precast structures can provide a
seismic response that is comparable to that of cast-in-place systems. In comparison with
4
precast connections used in non-seismic regions, limited research has been conducted in
the area of seismic detailing for precast bridge components.
1.3 Previous WSDOT Research at the University of Washington
The Washington State Department of Transportation (WSDOT) and researchers at
the University of Washington (UW) initiated a research effort to identify and develop
precast systems suitable for rapid construction of bridges in seismic regions of
Washington. A team of UW researchers, WSDOT bridge engineers, local engineers,
contractors, and precast fabricators was formed to provide expertise in order to address
the design, research, implementation, and construction of rapidly constructible systems.
The initial steps involved identifying precast alternatives that could be used to
replace cast-in-place components in order to speed construction. An extensive review of
precast technologies used outside of Washington State was conducted. Hieber et al.
(2005a) identified precast components for both the bridge superstructure and
substructure. Four types of precast superstructure systems were identified as potentially
having acceptable seismic behavior while allowing for rapid construction: full depth and
partial depth concrete panels, prestressed multi-beam superstructures, and preconstructed
composite units.
Precast substructure components have seldom been used in seismic regions.
However, two general categories of substructure systems with promising potential were
found: match-cast precast pieces that have epoxy-filled joints connected with post-
tensioning, and spliced mild steel bars grouted in corrugated ducts. These systems, which
have been used in areas of low seismic activity, showed promise for adaptation to meet
seismic performance requirements.
The research effort focused on developing a precast bridge substructure by using
concepts similar to those used in non-seismic regions. The team selected two precast
systems to explore: a cast-in-place emulation system and a hybrid pier system. These
systems used precast columns and a precast cap-beam that would be joined on-site at the
beam-column interface. Hieber et al. (2005a) examined the anticipated seismic
performance of the systems, assessed the prospects for rapid construction, and developed
5
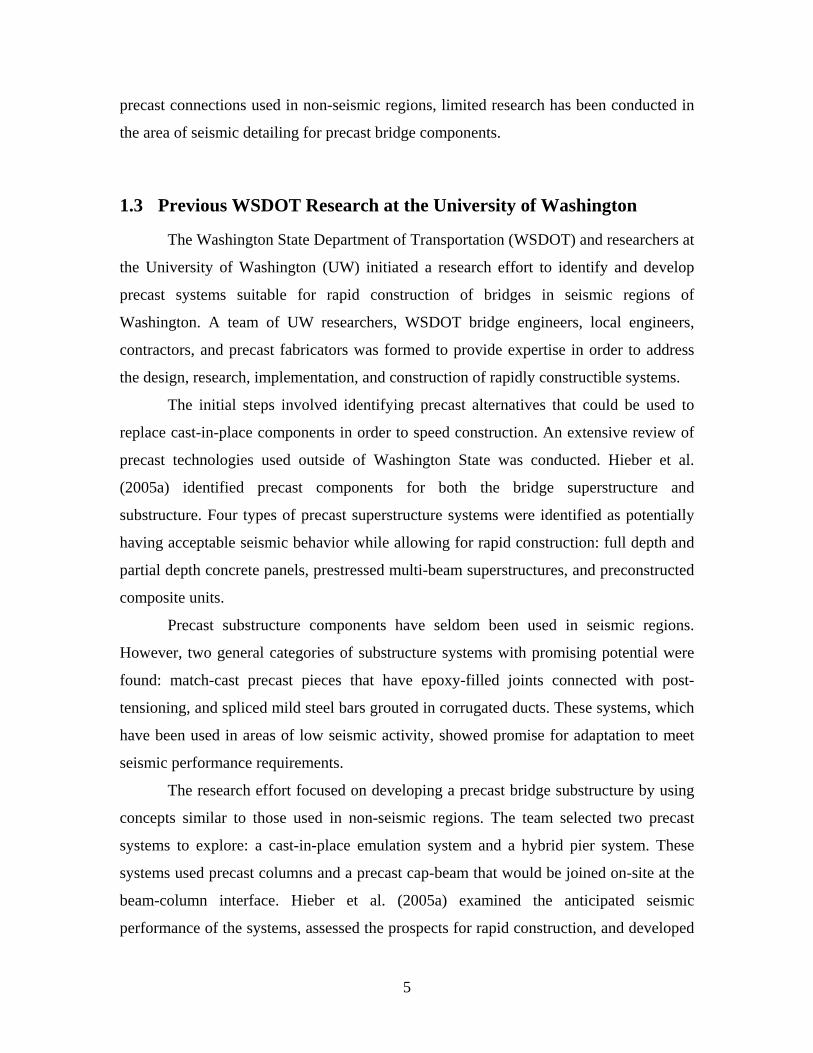
preliminary details for possible connections. The cast-in-place emulation used mild steel
bars grouted into corrugated metal ducts or openings to connect the precast pieces. The
hybrid pier system, which is shown in Figure 1-2, used a combination of unbonded post-
tensioning and mild steel bars grouted into ducts in the connection. A nonlinear finite-
element parametric study found that these two systems have potential for good seismic
performance.
Figure 1-2: Hybrid precast system (Hieber et al. 2005b)
Wacker et al. (2005) conducted a parallel study to create design procedures for
precast bridge bents. Two design procedures, a force-based one and a displacement-based
one, were developed for the cast-in-place emulation and hybrid precast bent systems.
Both methods eliminated the need for nonlinear analysis and provided practical design
procedures for engineers. Those methods were found to produce bridge bent designs that
would experience acceptable amounts of damage in design level earthquakes.
The team evaluated a suite of systems and preliminary connection details on the
basis of whether they could be fabricated and erected quickly, allowed for generous
construction tolerances, were durable, and performed well seismically. A summary of
these systems and their evaluation are provided in Appendix A. From the suite of
alternatives, one system was selected for further research.
6
The system selected for further experimental study was a cast-in-place emulation
with connections located at the beam-column interface. Details of the connection are
shown in Figure 1-3, and the construction sequence is shown in Figure 1-4. The
connection consists of six #18 mild steel bars (the largest available), grouted into large
8.5-inch corrugated metal ducts. High-strength, non-shrink grout is used to anchor the
#18 bars in the ducts. The #18 bars continue up into the cast-in-place diaphragm. The
column is also reinforced with 12 #9 bars spaced evenly between the #18 bars in order to
meet AASHTO spacing requirements between longitudinal bars.
The small number of large bars would simplify site assembly by reducing the
number of bar-duct alignments required. The use of large ducts, made possible by their
small number, would provide generous construction tolerances and good constructability.
Locating the connection at the beam-column interface would also allow for simplified
fabrication and manageable transportation because the precast pieces would be straight
segments.
Although previous analytical research (Hieber et al. 2005b, Wacker et al. 2005)
has demonstrated that the system would have good seismic performance, experimental
testing was needed to validate the system and to investigate two main design
considerations. First, concentrated reinforcement would place large anchorage demands
on each bar and thus require long development lengths or special means of anchorage.
Second, the additional discontinuous #9 bars needed in the column would force most
deformations to occur at the beam-column interface.
7
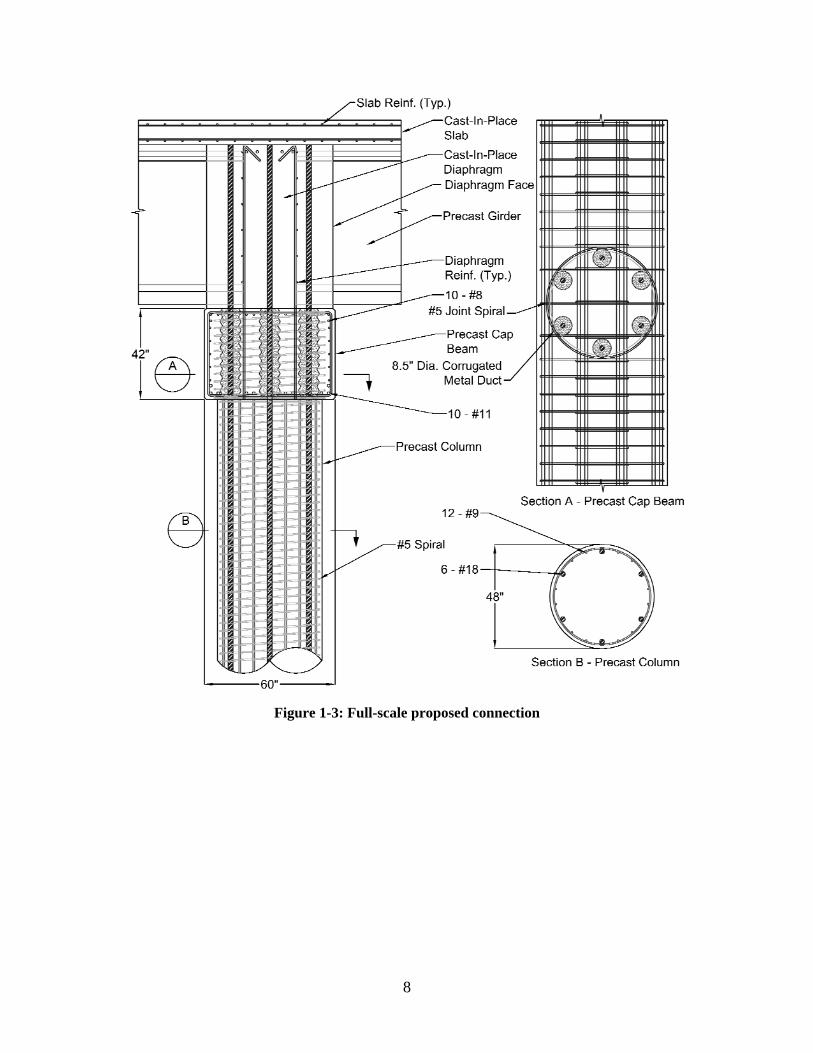
Figure 1-3: Full-scale proposed connection
8
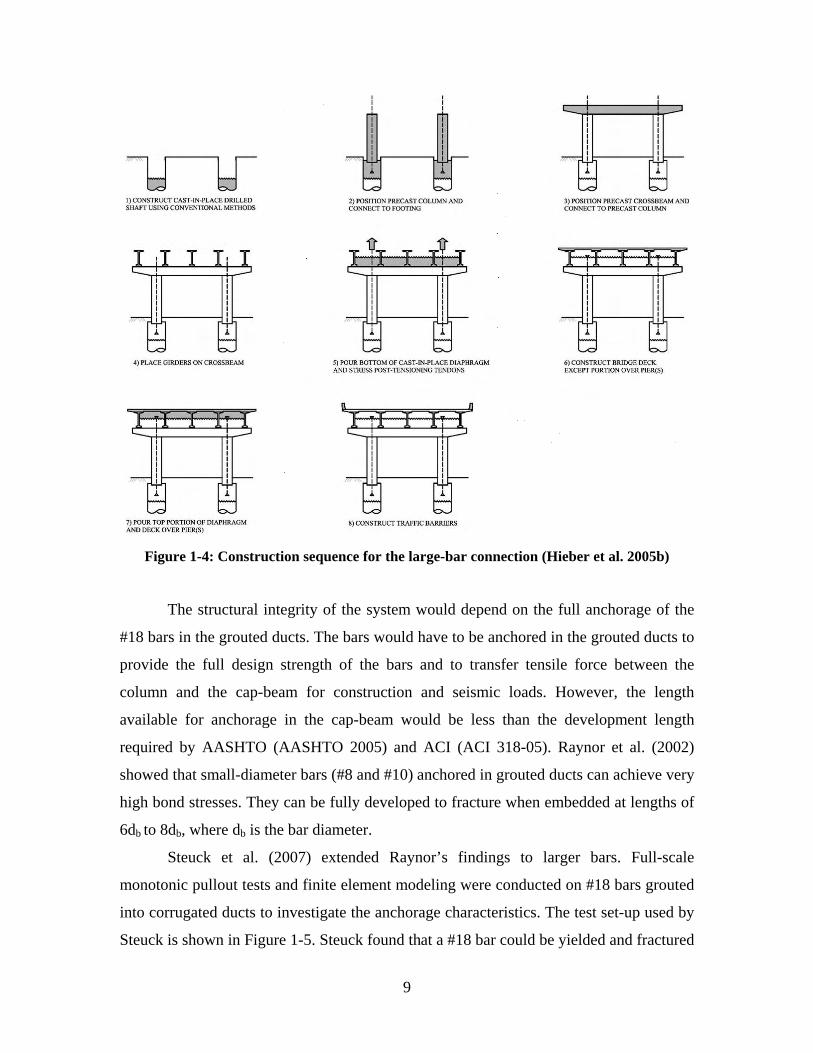
Figure 1-4: Construction sequence for the large-bar connection (Hieber et al. 2005b)
The structural integrity of the system would depend on the full anchorage of the
#18 bars in the grouted ducts. The bars would have to be anchored in the grouted ducts to
provide the full design strength of the bars and to transfer tensile force between the
column and the cap-beam for construction and seismic loads. However, the length
available for anchorage in the cap-beam would be less than the development length
required by AASHTO (AASHTO 2005) and ACI (ACI 318-05). Raynor et al. (2002)
showed that small-diameter bars (#8 and #10) anchored in grouted ducts can achieve very
high bond stresses. They can be fully developed to fracture when embedded at lengths of
6db to 8db, where db is the bar diameter.
Steuck et al. (2007) extended Raynor’s findings to larger bars. Full-scale
monotonic pullout tests and finite element modeling were conducted on #18 bars grouted
into corrugated ducts to investigate the anchorage characteristics. The test set-up used by
Steuck is shown in Figure 1-5. Steuck found that a #18 bar could be yielded and fractured
9
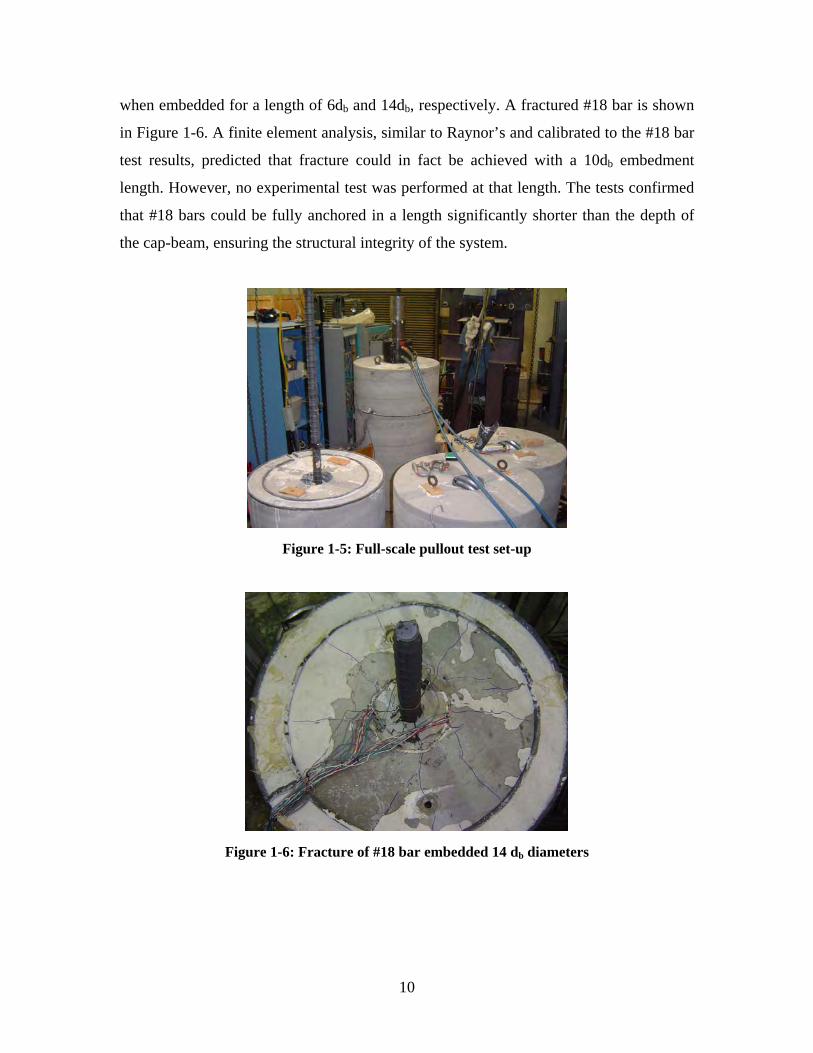
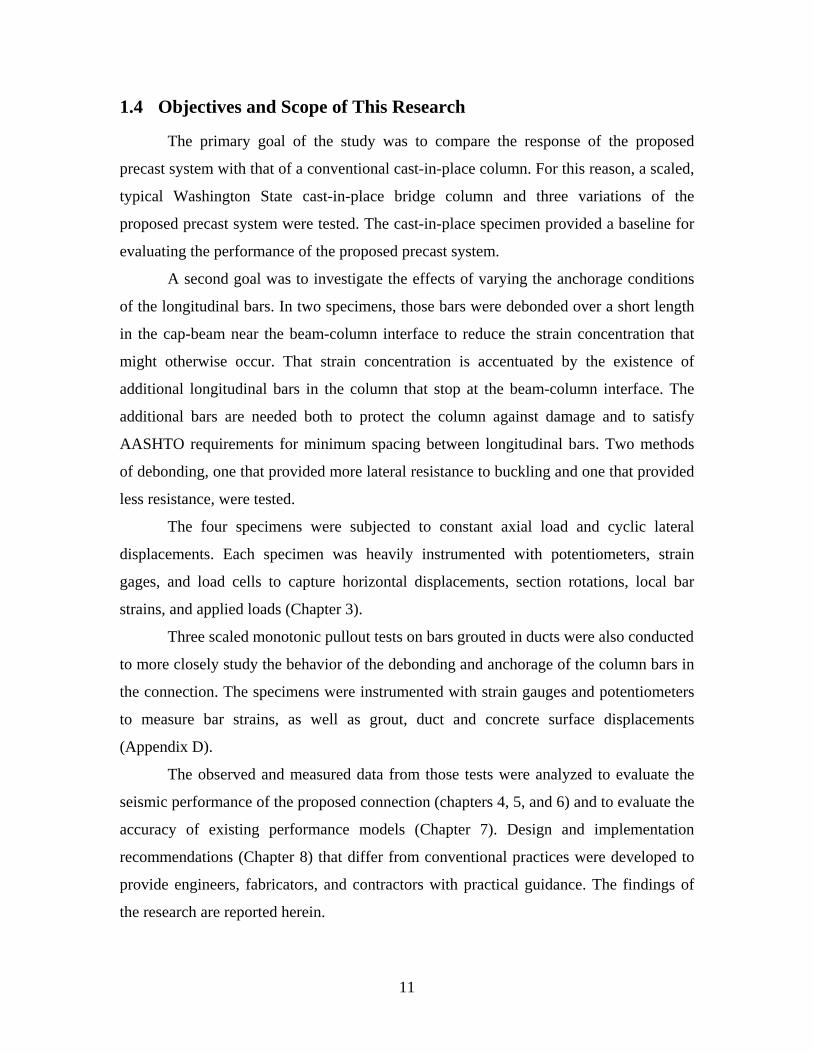
when embedded for a length of 6db and 14db, respectively. A fractured #18 bar is shown
in Figure 1-6. A finite element analysis, similar to Raynor’s and calibrated to the #18 bar
test results, predicted that fracture could in fact be achieved with a 10db embedment
length. However, no experimental test was performed at that length. The tests confirmed
that #18 bars could be fully anchored in a length significantly shorter than the depth of
the cap-beam, ensuring the structural integrity of the system.
Figure 1-5: Full-scale pullout test set-up
Figure 1-6: Fracture of #18 bar embedded 14 db diameters
10
1.4 Objectives and Scope of This Research
The primary goal of the study was to compare the response of the proposed
precast system with that of a conventional cast-in-place column. For this reason, a scaled,
typical Washington State cast-in-place bridge column and three variations of the
proposed precast system were tested. The cast-in-place specimen provided a baseline for
evaluating the performance of the proposed precast system.
A second goal was to investigate the effects of varying the anchorage conditions
of the longitudinal bars. In two specimens, those bars were debonded over a short length
in the cap-beam near the beam-column interface to reduce the strain concentration that
might otherwise occur. That strain concentration is accentuated by the existence of
additional longitudinal bars in the column that stop at the beam-column interface. The
additional bars are needed both to protect the column against damage and to satisfy
AASHTO requirements for minimum spacing between longitudinal bars. Two methods
of debonding, one that provided more lateral resistance to buckling and one that provided
less resistance, were tested.
The four specimens were subjected to constant axial load and cyclic lateral
displacements. Each specimen was heavily instrumented with potentiometers, strain
gages, and load cells to capture horizontal displacements, section rotations, local bar
strains, and applied loads (Chapter 3).
Three scaled monotonic pullout tests on bars grouted in ducts were also conducted
to more closely study the behavior of the debonding and anchorage of the column bars in
the connection. The specimens were instrumented with strain gauges and potentiometers
to measure bar strains, as well as grout, duct and concrete surface displacements
(Appendix D).
The observed and measured data from those tests were analyzed to evaluate the
seismic performance of the proposed connection (chapters 4, 5, and 6) and to evaluate the
accuracy of existing performance models (Chapter 7). Design and implementation
recommendations (Chapter 8) that differ from conventional practices were developed to
provide engineers, fabricators, and contractors with practical guidance. The findings of
the research are reported herein.
11
2 PREVIOUS USE OF PRECAST COMPONENTS IN BRIDGE SUBSTRUCTURES
State agencies in regions with low seismicity have successfully used precast
substructure components to rapidly construct bridges. The Texas Department of
Transportation (TxDOT) has constructed several bridges, such as the Lake Ray Hubbard
Bridge and Lake Belton Bridge, by using precast bent-caps as part of the substructure.
Only recently have states in seismic areas, such as California and Washington, begun
using precast components to construct bridge substructures. The following projects
demonstrate the benefits of rapid construction and highlight the design challenges
encountered with implementing those new techniques in earthquake-prone regions.
2.1 SH 66 over Lake Ray Hubbard—Texas
Replacement of the 40-year-old, two-lane Lake Ray Hubbard Bridge on SH 66
began in 2000. The bridge needed replacement because it had become outdated and
congested for commuters traveling east of Dallas (FHWA 2008). Two conventional,
prestressed, I-girder bridges with multi-column bents were to be constructed in its place.
The bridges had typical spans of 100-feet, and were 10,280-feet and 4,360-feet long for
the west- and eastbound structures. The design featured three-column, cast-in-place bents
supported on drilled-shaft foundations. Over 40 identical bents needed to be constructed,
so the contractor asked to use precast bent-caps in order to accelerate construction, avoid
the difficulties of handling formwork and materials over water, and to minimize exposure
of the workers to power lines located close to the site.
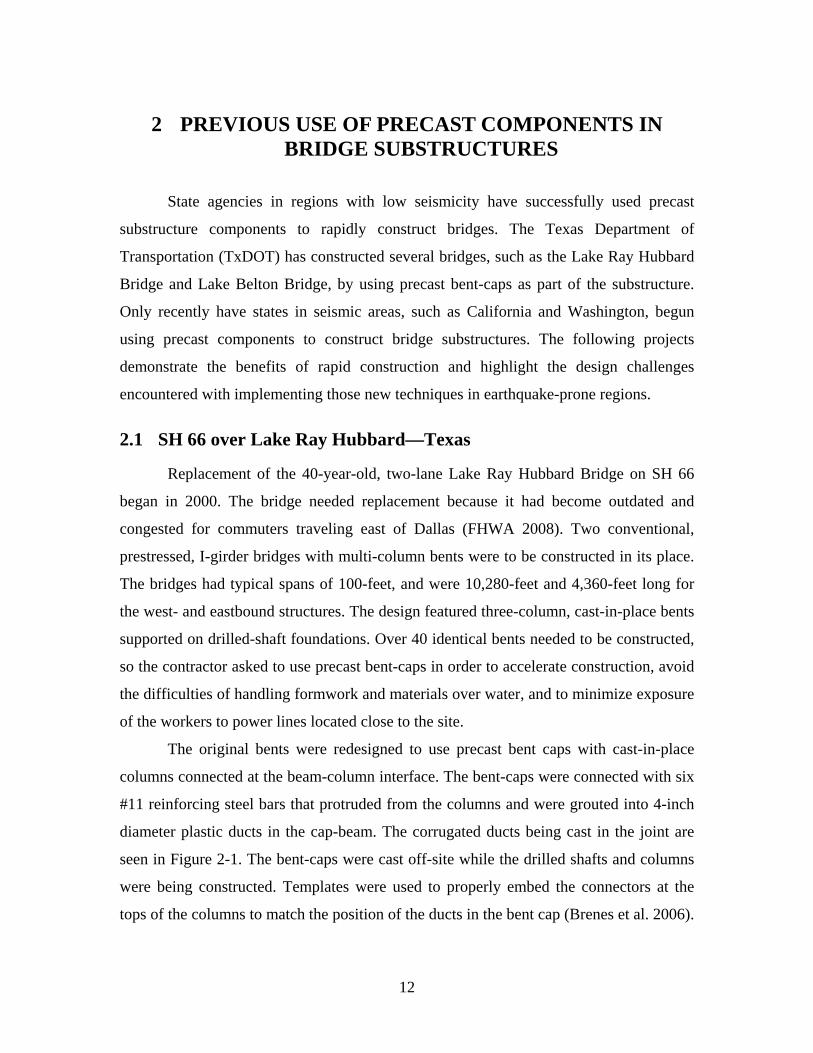
The original bents were redesigned to use precast bent caps with cast-in-place
columns connected at the beam-column interface. The bent-caps were connected with six
#11 reinforcing steel bars that protruded from the columns and were grouted into 4-inch
diameter plastic ducts in the cap-beam. The corrugated ducts being cast in the joint are
seen in Figure 2-1. The bent-caps were cast off-site while the drilled shafts and columns
were being constructed. Templates were used to properly embed the connectors at the
tops of the columns to match the position of the ducts in the bent cap (Brenes et al. 2006).
12
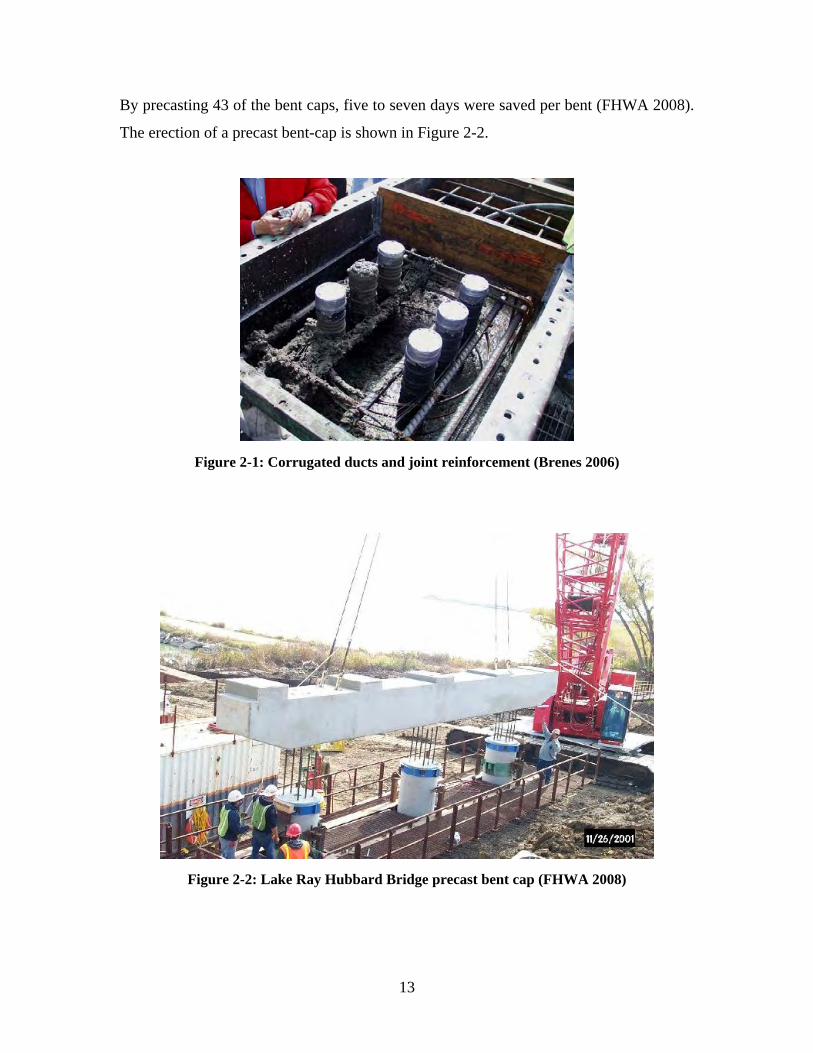
By precasting 43 of the bent caps, five to seven days were saved per bent (FHWA 2008).
The erection of a precast bent-cap is shown in Figure 2-2.
Figure 2-1: Corrugated ducts and joint reinforcement (Brenes 2006)
Figure 2-2: Lake Ray Hubbard Bridge precast bent cap (FHWA 2008)
13
2.2 SH 36 over Lake Belton—Texas
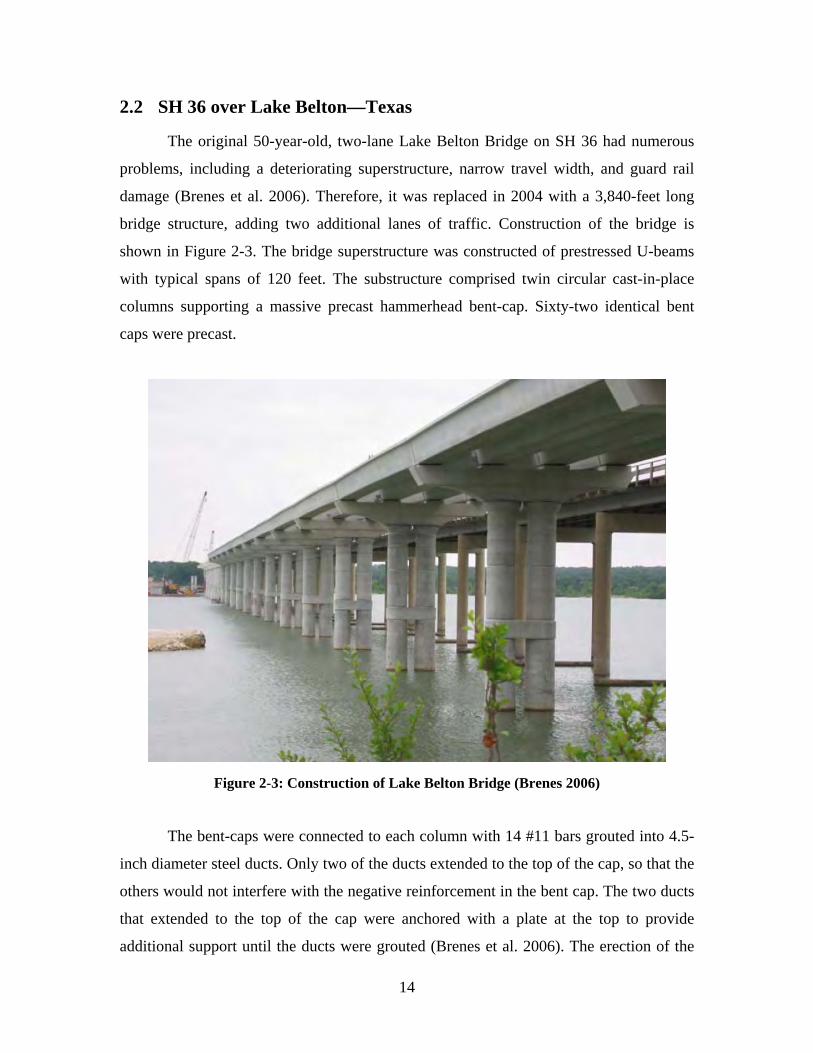
The original 50-year-old, two-lane Lake Belton Bridge on SH 36 had numerous
problems, including a deteriorating superstructure, narrow travel width, and guard rail
damage (Brenes et al. 2006). Therefore, it was replaced in 2004 with a 3,840-feet long
bridge structure, adding two additional lanes of traffic. Construction of the bridge is
shown in Figure 2-3. The bridge superstructure was constructed of prestressed U-beams
with typical spans of 120 feet. The substructure comprised twin circular cast-in-place
columns supporting a massive precast hammerhead bent-cap. Sixty-two identical bent
caps were precast.
Figure 2-3: Construction of Lake Belton Bridge (Brenes 2006)
The bent-caps were connected to each column with 14 #11 bars grouted into 4.5-
inch diameter steel ducts. Only two of the ducts extended to the top of the cap, so that the
others would not interfere with the negative reinforcement in the bent cap. The two ducts
that extended to the top of the cap were anchored with a plate at the top to provide
additional support until the ducts were grouted (Brenes et al. 2006). The erection of the
14
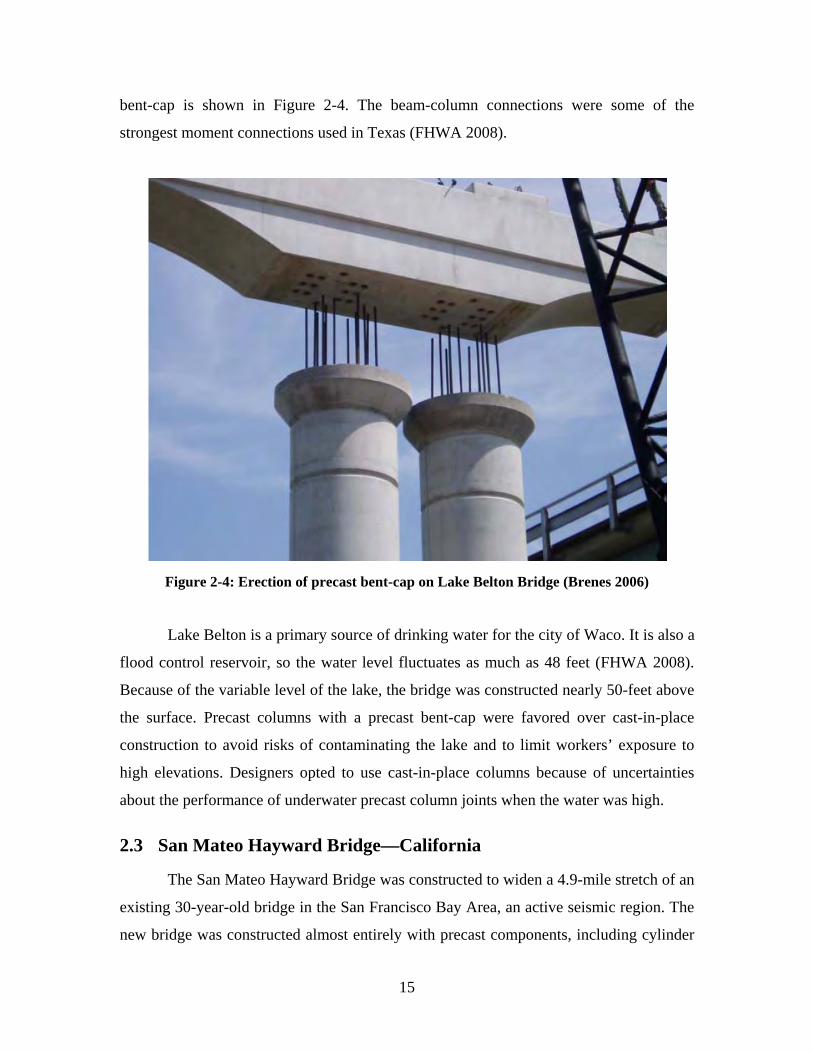
bent-cap is shown in Figure 2-4. The beam-column connections were some of the
strongest moment connections used in Texas (FHWA 2008).
Figure 2-4: Erection of precast bent-cap on Lake Belton Bridge (Brenes 2006)
Lake Belton is a primary source of drinking water for the city of Waco. It is also a
flood control reservoir, so the water level fluctuates as much as 48 feet (FHWA 2008).
Because of the variable level of the lake, the bridge was constructed nearly 50-feet above
the surface. Precast columns with a precast bent-cap were favored over cast-in-place
construction to avoid risks of contaminating the lake and to limit workers’ exposure to
high elevations. Designers opted to use cast-in-place columns because of uncertainties
about the performance of underwater precast column joints when the water was high.
2.3 San Mateo Hayward Bridge—California
The San Mateo Hayward Bridge was constructed to widen a 4.9-mile stretch of an
existing 30-year-old bridge in the San Francisco Bay Area, an active seismic region. The
new bridge was constructed almost entirely with precast components, including cylinder
15
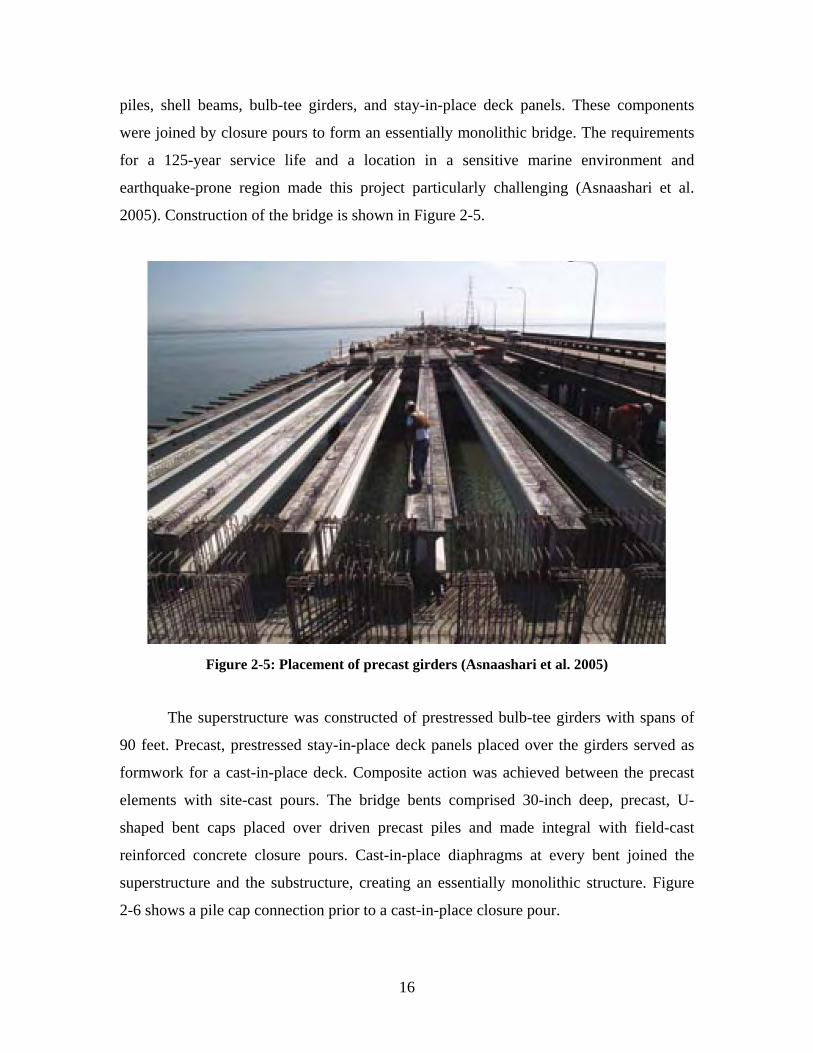
piles, shell beams, bulb-tee girders, and stay-in-place deck panels. These components
were joined by closure pours to form an essentially monolithic bridge. The requirements
for a 125-year service life and a location in a sensitive marine environment and
earthquake-prone region made this project particularly challenging (Asnaashari et al.
2005). Construction of the bridge is shown in Figure 2-5.
Figure 2-5: Placement of precast girders (Asnaashari et al. 2005)
The superstructure was constructed of prestressed bulb-tee girders with spans of
90 feet. Precast, prestressed stay-in-place deck panels placed over the girders served as
formwork for a cast-in-place deck. Composite action was achieved between the precast
elements with site-cast pours. The bridge bents comprised 30-inch deep, precast, U-
shaped bent caps placed over driven precast piles and made integral with field-cast
reinforced concrete closure pours. Cast-in-place diaphragms at every bent joined the
superstructure and the substructure, creating an essentially monolithic structure. Figure
2-6 shows a pile cap connection prior to a cast-in-place closure pour.
16
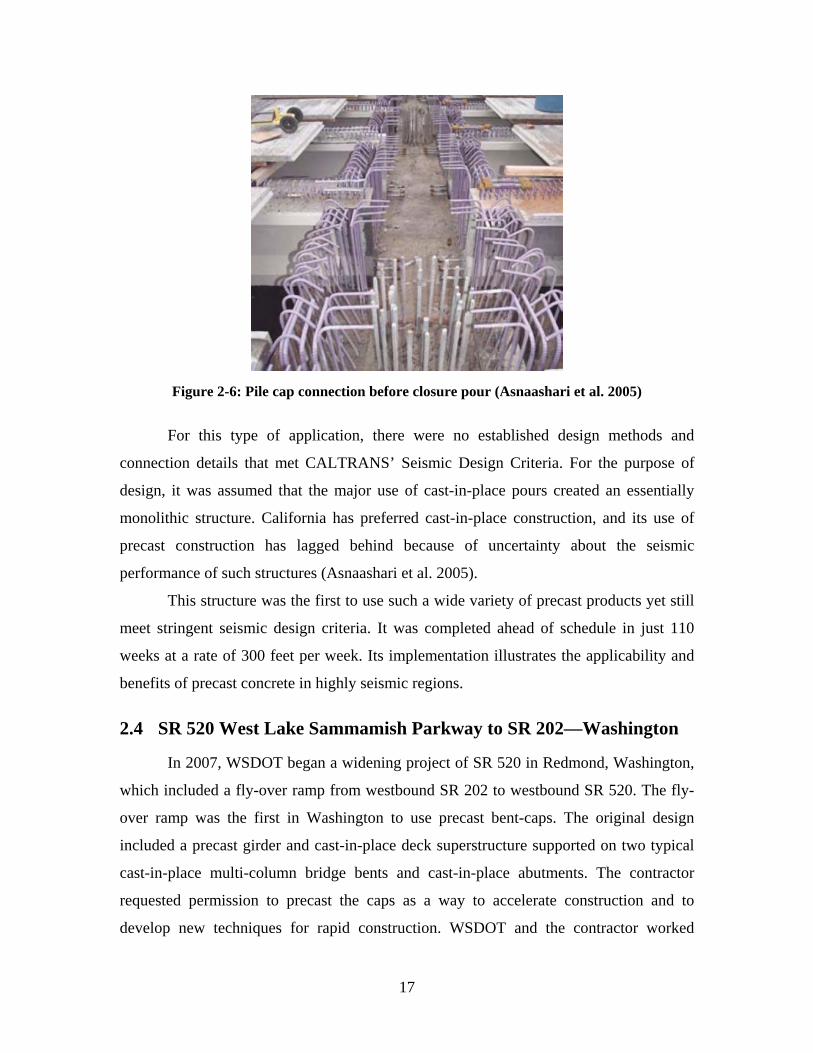
Figure 2-6: Pile cap connection before closure pour (Asnaashari et al. 2005)
For this type of application, there were no established design methods and
connection details that met CALTRANS’ Seismic Design Criteria. For the purpose of
design, it was assumed that the major use of cast-in-place pours created an essentially
monolithic structure. California has preferred cast-in-place construction, and its use of
precast construction has lagged behind because of uncertainty about the seismic
performance of such structures (Asnaashari et al. 2005).
This structure was the first to use such a wide variety of precast products yet still
meet stringent seismic design criteria. It was completed ahead of schedule in just 110
weeks at a rate of 300 feet per week. Its implementation illustrates the applicability and
benefits of precast concrete in highly seismic regions.
2.4 SR 520 West Lake Sammamish Parkway to SR 202—Washington
In 2007, WSDOT began a widening project of SR 520 in Redmond, Washington,
which included a fly-over ramp from westbound SR 202 to westbound SR 520. The fly-
over ramp was the first in Washington to use precast bent-caps. The original design
included a precast girder and cast-in-place deck superstructure supported on two typical
cast-in-place multi-column bridge bents and cast-in-place abutments. The contractor
requested permission to precast the caps as a way to accelerate construction and to
develop new techniques for rapid construction. WSDOT and the contractor worked
17
closely to design a precast alternative. The final bent design featured two 5-foot diameter,
cast-in-place columns and a precast bent-cap joined at the beam-column interface.
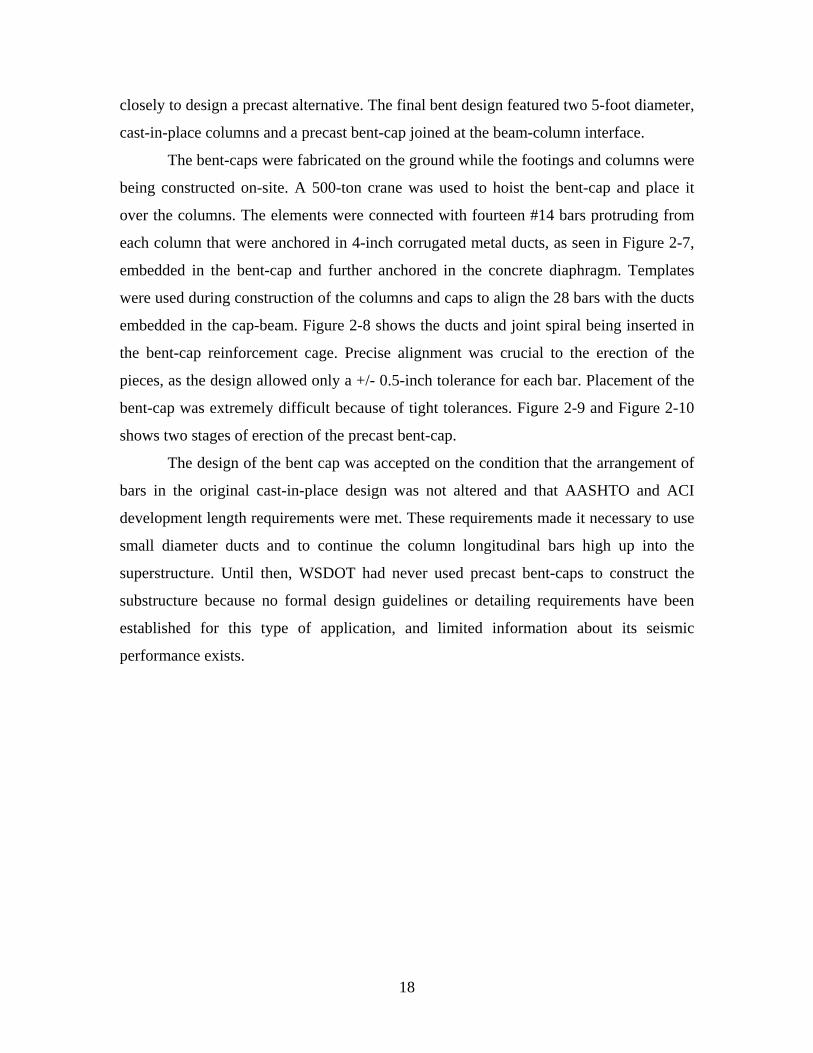
The bent-caps were fabricated on the ground while the footings and columns were
being constructed on-site. A 500-ton crane was used to hoist the bent-cap and place it
over the columns. The elements were connected with fourteen #14 bars protruding from
each column that were anchored in 4-inch corrugated metal ducts, as seen in Figure 2-7,
embedded in the bent-cap and further anchored in the concrete diaphragm. Templates
were used during construction of the columns and caps to align the 28 bars with the ducts
embedded in the cap-beam. Figure 2-8 shows the ducts and joint spiral being inserted in
the bent-cap reinforcement cage. Precise alignment was crucial to the erection of the
pieces, as the design allowed only a +/- 0.5-inch tolerance for each bar. Placement of the
bent-cap was extremely difficult because of tight tolerances. Figure 2-9 and Figure 2-10
shows two stages of erection of the precast bent-cap.
The design of the bent cap was accepted on the condition that the arrangement of
bars in the original cast-in-place design was not altered and that AASHTO and ACI
development length requirements were met. These requirements made it necessary to use
small diameter ducts and to continue the column longitudinal bars high up into the
superstructure. Until then, WSDOT had never used precast bent-caps to construct the
substructure because no formal design guidelines or detailing requirements have been
established for this type of application, and limited information about its seismic
performance exists.
18
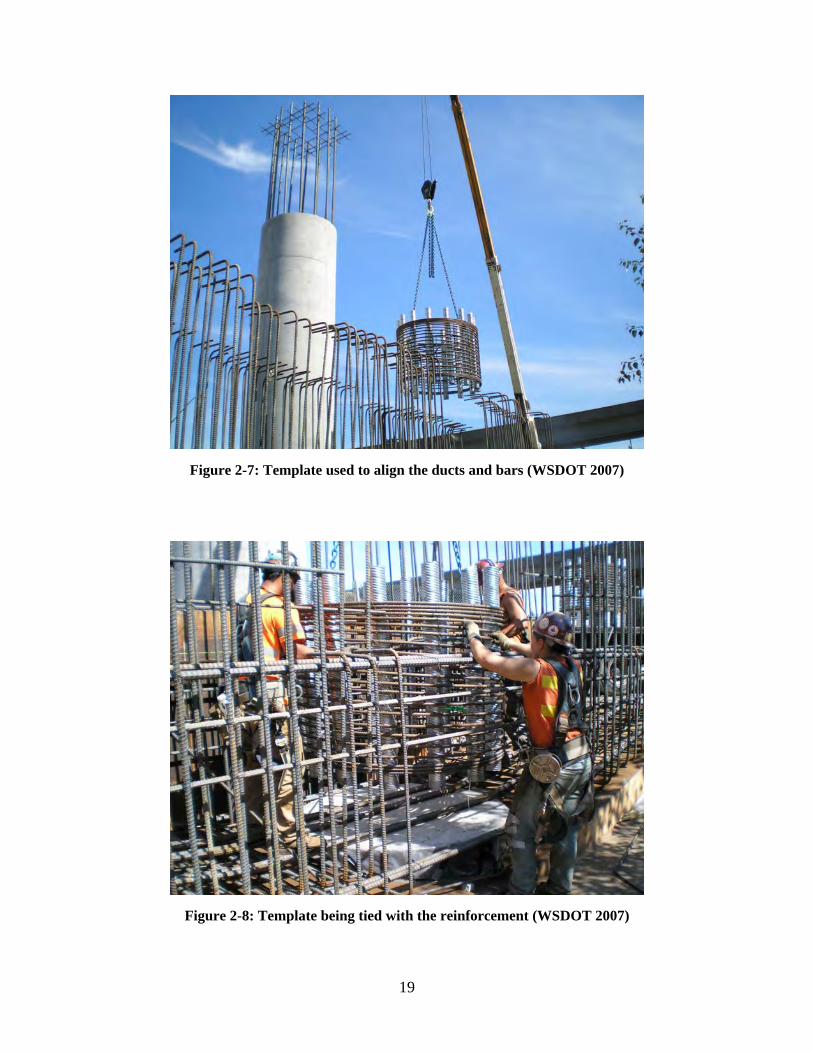
Figure 2-7: Template used to align the ducts and bars (WSDOT 2007)
Figure 2-8: Template being tied with the reinforcement (WSDOT 2007)
19
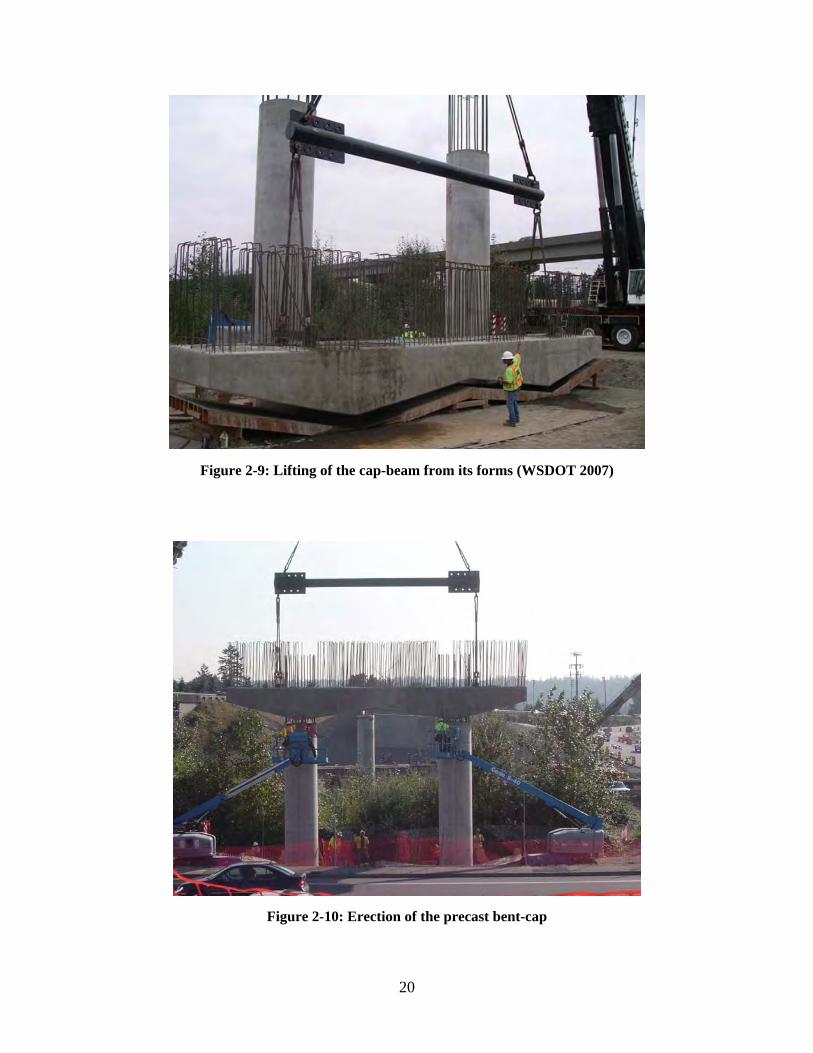
Figure 2-9: Lifting of the cap-beam from its forms (WSDOT 2007)
Figure 2-10: Erection of the precast bent-cap
20

3 EXPERIMENTAL PROGRAM
This section covers the development and design of the test program, including
design of the specimens, test set-up, testing procedures, and instrumentation. Additional
details regarding the experimental methods, including construction and instrumentation
procedures of the specimens, material testing and properties, and design details, are given
in Appendix B.
3.1 Overview
The experimental program included cyclic tests of four column-beam
subassemblies and three monotonic anchorage pullout tests on #8 bars in grouted ducts.
These tests were conducted to (1) evaluate the seismic performance of the proposed
precast connections, (2) study the anchorage conditions of the longitudinal bars, (3)
investigate the performance of two methods of local debonding, and (4) compare the
performance of the connection with that of a typical, cast-in-place beam-column joint.
The pullout tests are discussed in Appendix D. The subassembly test matrix is provided
in Table 3-1. Each specimen will be referred to using the following nomenclature:
Subassembly Tests
� DB5-RE = Typical cast-in-place reference column
� LB8-FB = Large bar connection with bars fully bonded in grouted ducts
� LB8-D1 = Large bar connection with bars debonded 8 db using Method 1
� LB8-D2 = Large bar connection with bars debonded 8 db using Method 2
Pullout Tests
� AD8-FB = Pullout test with the bar fully bonded in grouted duct
� AD8-D1 = Pullout test with the bar debonded 8 db using Method 1
� AD8-D2 = Pullout tests with the bar debonded 8 db using Method 2
21
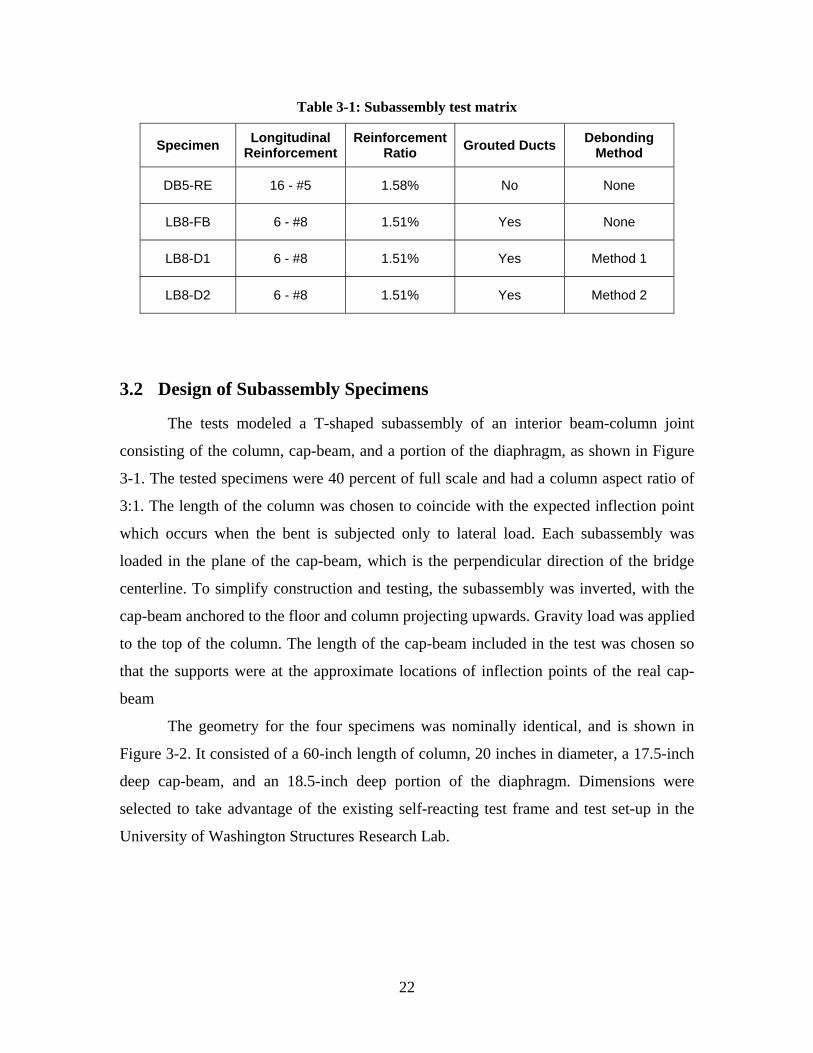
Table 3-1: Subassembly test matrix
Specimen Longitudinal Reinforcement
Reinforcement Ratio Grouted Ducts Debonding
Method
DB5-RE 16 - #5 1.58% No None
LB8-FB 6 - #8 1.51% Yes None
LB8-D1 6 - #8 1.51% Yes Method 1
LB8-D2 6 - #8 1.51% Yes Method 2
3.2 Design of Subassembly Specimens
The tests modeled a T-shaped subassembly of an interior beam-column joint
consisting of the column, cap-beam, and a portion of the diaphragm, as shown in Figure
3-1. The tested specimens were 40 percent of full scale and had a column aspect ratio of
3:1. The length of the column was chosen to coincide with the expected inflection point
which occurs when the bent is subjected only to lateral load. Each subassembly was
loaded in the plane of the cap-beam, which is the perpendicular direction of the bridge
centerline. To simplify construction and testing, the subassembly was inverted, with the
cap-beam anchored to the floor and column projecting upwards. Gravity load was applied
to the top of the column. The length of the cap-beam included in the test was chosen so
that the supports were at the approximate locations of inflection points of the real cap-
beam
The geometry for the four specimens was nominally identical, and is shown in
Figure 3-2. It consisted of a 60-inch length of column, 20 inches in diameter, a 17.5-inch
deep cap-beam, and an 18.5-inch deep portion of the diaphragm. Dimensions were
selected to take advantage of the existing self-reacting test frame and test set-up in the
University of Washington Structures Research Lab.
22
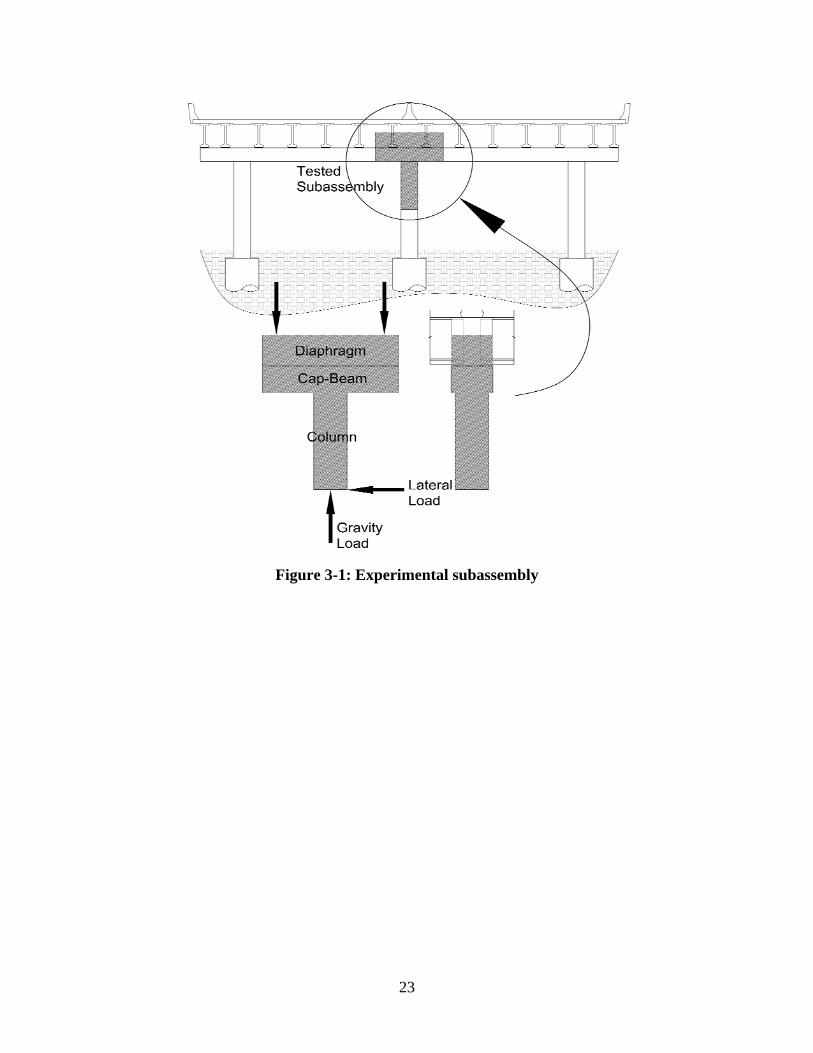
Figure 3-1: Experimental subassembly
23
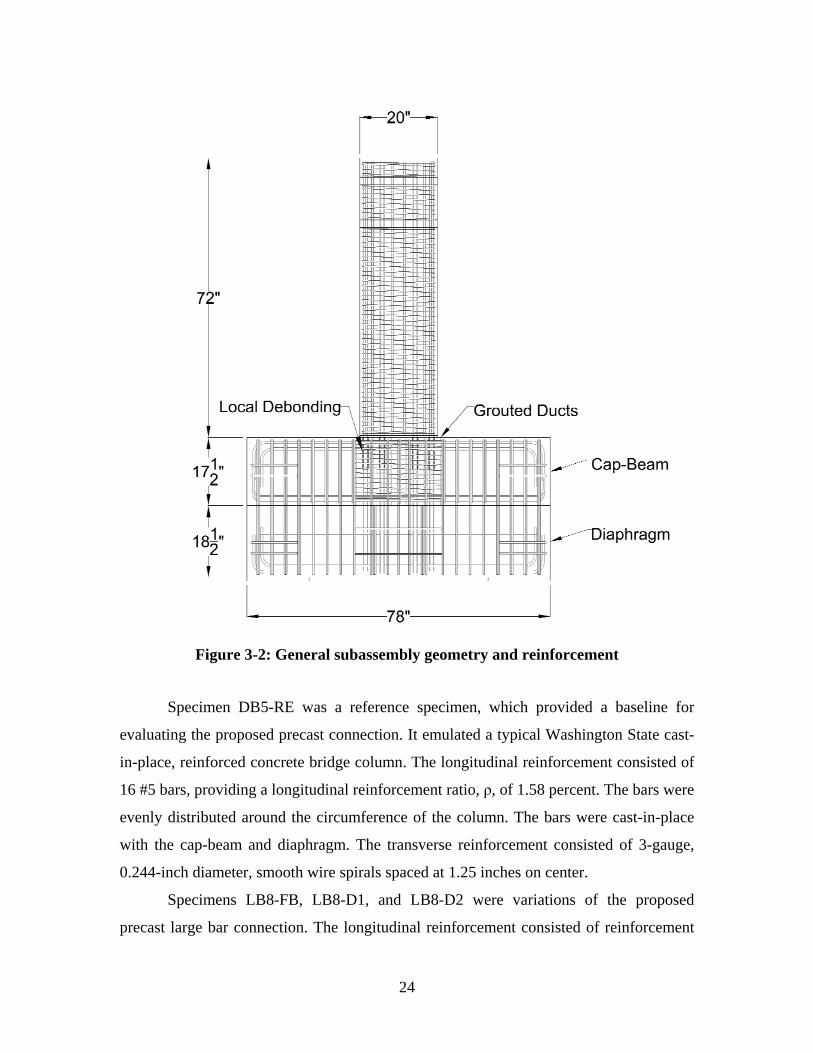
Figure 3-2: General subassembly geometry and reinforcement
Specimen DB5-RE was a reference specimen, which provided a baseline for
evaluating the proposed precast connection. It emulated a typical Washington State cast-
in-place, reinforced concrete bridge column. The longitudinal reinforcement consisted of
16 #5 bars, providing a longitudinal reinforcement ratio, ρ, of 1.58 percent. The bars were
evenly distributed around the circumference of the column. The bars were cast-in-place
with the cap-beam and diaphragm. The transverse reinforcement consisted of 3-gauge,
0.244-inch diameter, smooth wire spirals spaced at 1.25 inches on center.
Specimens LB8-FB, LB8-D1, and LB8-D2 were variations of the proposed
precast large bar connection. The longitudinal reinforcement consisted of reinforcement
24
concentrated in six #8 bars, simulating a 40 percent scale of the six #18 bars in the
prototype and providing a ρ of 1.51 percent. The bars were anchored in 4-inch diameter
grouted corrugated metal ducts in the cap-beam and further anchored in concrete within
the diaphragm. Fluid, high-strength grout with an average compressive strength, f’g , of
8500 psi at 5 days was used.
In Specimen LB8-FB the bars were fully grouted into the ducts. In specimens
LB8-D1 and LB8-D2 the bars were debonded over a length of 8 bar diameters, db, into
the cap-beam within the grouted ducts by using two methods. The debonded region was
placed in the cap beam for several reasons. First, the joint region constituted a large,
relatively rigid, block of concrete that would provide restraint to buckling. Second, bond
stresses would distribute deeper in the beam instead of at the surface as a result of the
superior bond in the grouted ducts (Raynor et al. 2002, Steuck et al. 2007). Last, it was a
more constructible alternative, as bars could easily be sleeved for debonding after casting
and prior to erection. LB8-D1 was debonded by using a 1-inch, SCH-40 PVC pipe slit
longitudinally, taped tightly around the bar, and sealed with caulk at the ends. The goal of
Method 1 was to inhibit bar buckling through stiff lateral support. However, it introduced
the possibility of developing friction between the bar and sleeve because the PVC pipe
fitted so tightly around the bar. Specimen LB8-D2 was debonded with a loosely fitting 1-
inch SCH-30 PVC. The pipe was slid over the bar and sealed at the ends, providing a
large gap to ensure complete debonding but lacking lateral resistance to bar buckling in
the region.
For all precast specimens, 12 #3 longitudinal bars that stopped at the interface
were added in the column to meet AASHTO spacing requirements. The spiral
reinforcement in the columns was the same as that in specimen DB5-RE, and it continued
at the same spacing into the cap-beam, around the ducts, to confine the joint region. A
0.5-inch thick grout pad was also cast at the beam-column interface to simulate field
erection of the precast pieces.
Details of the prototype were scaled as closely as possible in the tests, but some
parameters of the prototype could not be proportioned exactly. For example, the
prototype bridge column was transversely reinforced with #6 bar spirals. Direct scaling
for the specimens would have required a 0.3-inch diameter deformed bar, but such
25
material was not available. Instead, 0.244-inch diameter smooth wire spiral was used.
Similarly, the 8.5-inch diameter ducts used in the proposed connection directly scaled to
a 3.2-inch diameter duct. The smallest available corrugated metal duct of the type used in
the anchorage study conducted by Steuck et al. (2007) was 6 inches. The best available
alternative was to use a 4-inch diameter post-tensioning duct, even though its
deformation pattern was different. Steuck conducted a pullout test using a #8 bar grouted
into this duct size and got results consistent with the equivalent full-scale pullout tests.
The specimens were capacity designed to ensure that unwanted response
mechanisms in the subassembly, such as cap-beam failure, were suppressed. The
AASHTO Load and Resistance Factor Deign (LRFD) and ACI-318 codes were satisfied
for the parameters not specifically tested. The design yield strengths, fy, for the
reinforcing bars and wire spiral were 60 ksi and 90 ksi, respectively. The design strengths
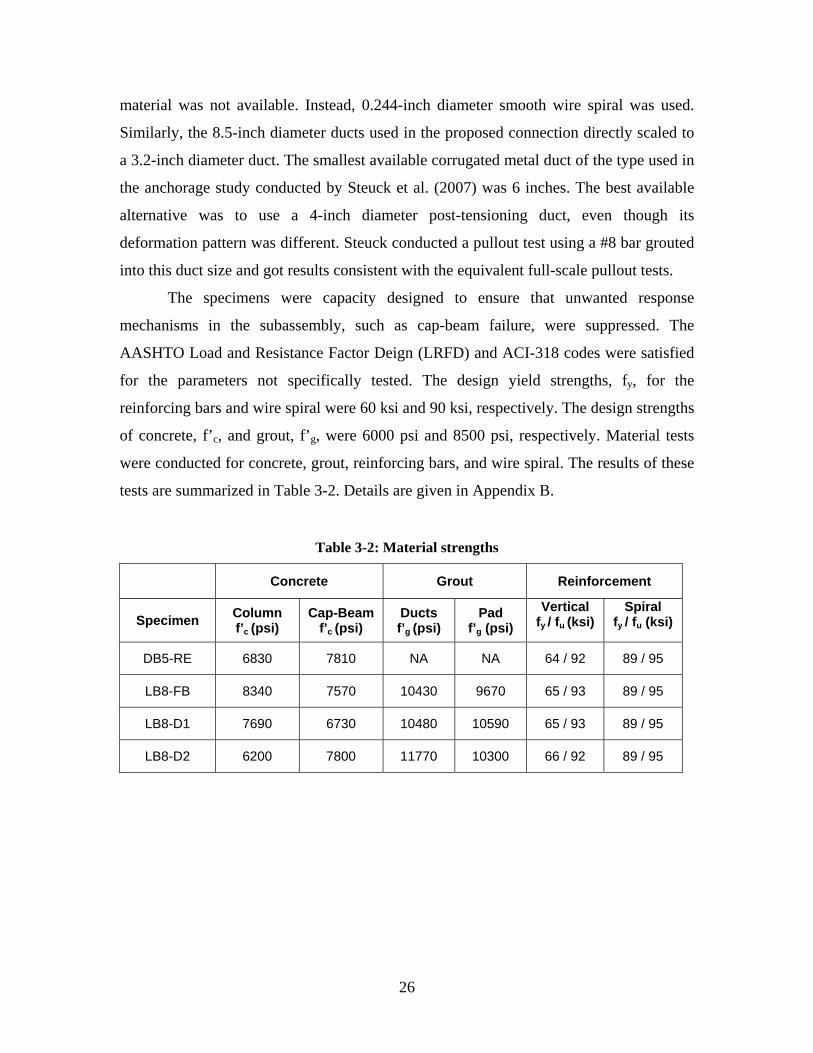
of concrete, f’c, and grout, f’g, were 6000 psi and 8500 psi, respectively. Material tests
were conducted for concrete, grout, reinforcing bars, and wire spiral. The results of these
tests are summarized in Table 3-2. Details are given in Appendix B.
Table 3-2: Material strengths
Concrete Grout Reinforcement
Specimen Column f’c (psi)
Cap-Beam f’c (psi)
Ducts f’g (psi)
Pad f’g (psi)
Vertical fy / fu (ksi)
Spiral fy / fu (ksi)
DB5-RE 6830 7810 NA NA 64 / 92 89 / 95
LB8-FB 8340 7570 10430 9670 65 / 93 89 / 95
LB8-D1 7690 6730 10480 10590 65 / 93 89 / 95
LB8-D2 6200 7800 11770 10300 66 / 92 89 / 95
26
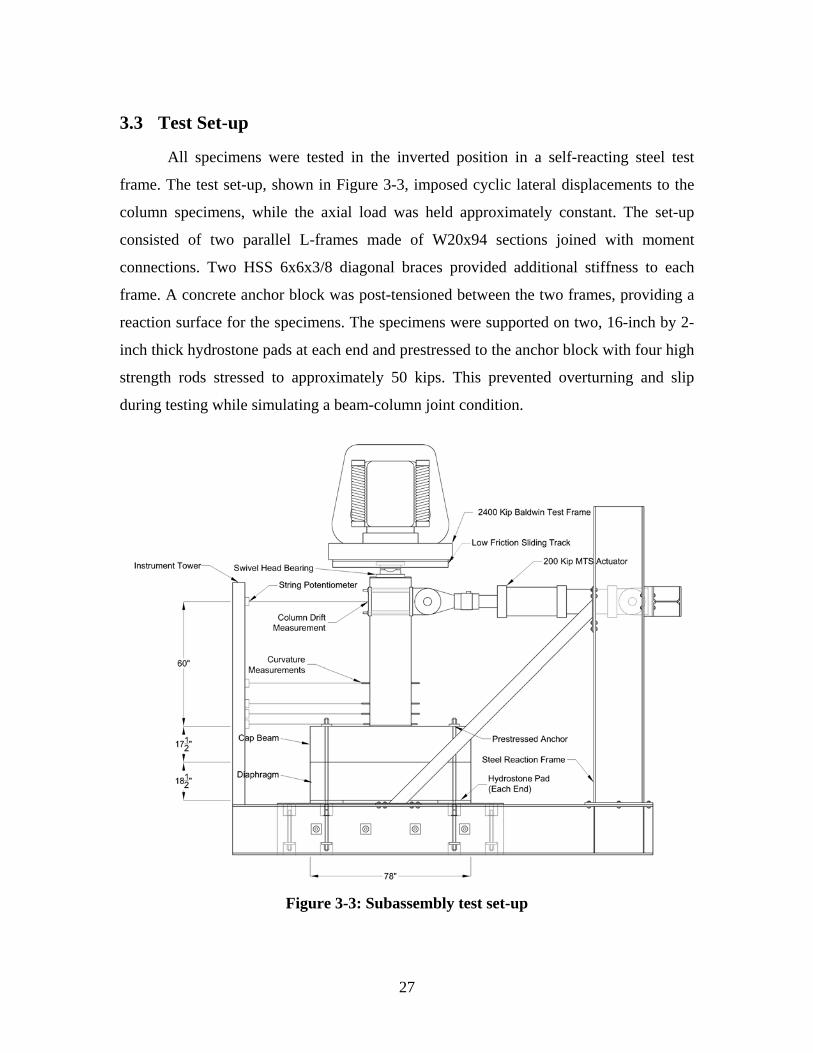
3.3 Test Set-up
All specimens were tested in the inverted position in a self-reacting steel test
frame. The test set-up, shown in Figure 3-3, imposed cyclic lateral displacements to the
column specimens, while the axial load was held approximately constant. The set-up
consisted of two parallel L-frames made of W20x94 sections joined with moment
connections. Two HSS 6x6x3/8 diagonal braces provided additional stiffness to each
frame. A concrete anchor block was post-tensioned between the two frames, providing a
reaction surface for the specimens. The specimens were supported on two, 16-inch by 2-
inch thick hydrostone pads at each end and prestressed to the anchor block with four high
strength rods stressed to approximately 50 kips. This prevented overturning and slip
during testing while simulating a beam-column joint condition.
Figure 3-3: Subassembly test set-up
27
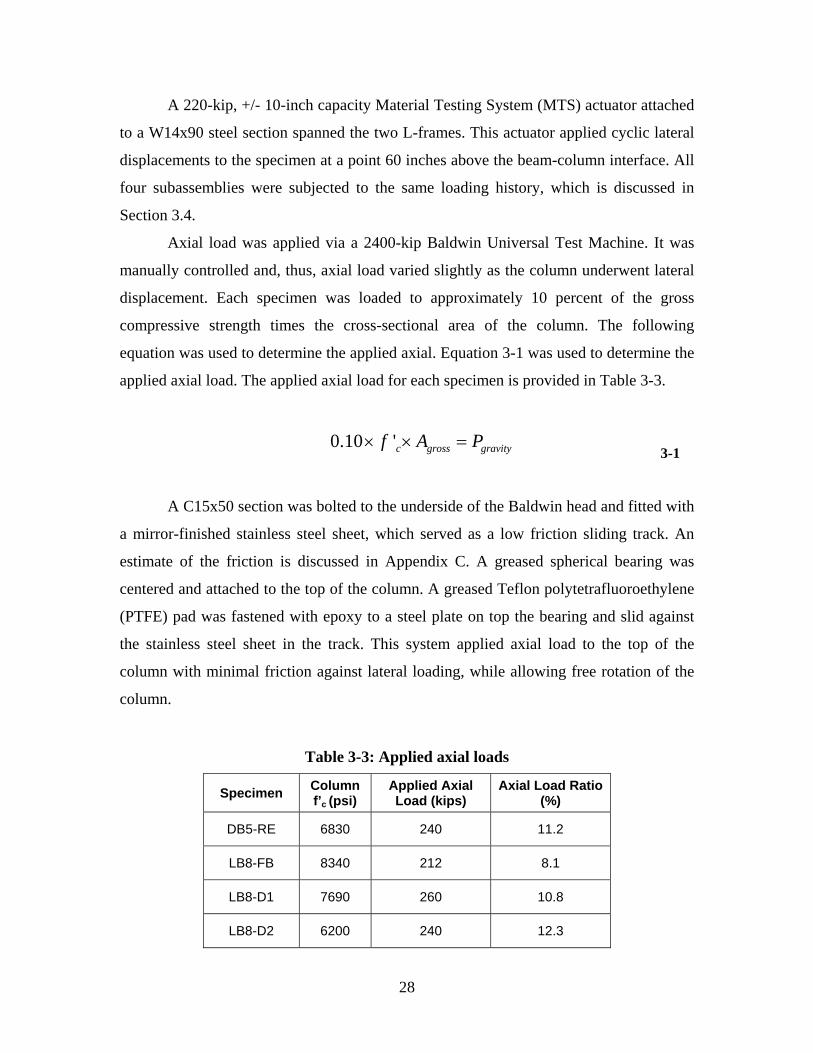
A 220-kip, +/- 10-inch capacity Material Testing System (MTS) actuator attached
to a W14x90 steel section spanned the two L-frames. This actuator applied cyclic lateral
displacements to the specimen at a point 60 inches above the beam-column interface. All
four subassemblies were subjected to the same loading history, which is discussed in
Section 3.4.
Axial load was applied via a 2400-kip Baldwin Universal Test Machine. It was
manually controlled and, thus, axial load varied slightly as the column underwent lateral
displacement. Each specimen was loaded to approximately 10 percent of the gross
compressive strength times the cross-sectional area of the column. The following
equation was used to determine the applied axial. Equation 3-1 was used to determine the
applied axial load. The applied axial load for each specimen is provided in Table 3-3.
0.10× f ' × A = Pc gross gravity
A C15x50 section was bolted to the underside of the Baldwin head and fitted with
a mirror-finished stainless steel sheet, which served as a low friction sliding track. An
estimate of the friction is discussed in Appendix C. A greased spherical bearing was
centered and attached to the top of the column. A greased Teflon polytetrafluoroethylene
(PTFE) pad was fastened with epoxy to a steel plate on top the bearing and slid against
the stainless steel sheet in the track. This system applied axial load to the top of the
column with minimal friction against lateral loading, while allowing free rotation of the
column.
Table 3-3: Applied axial loads
Specimen Column f’c (psi)
Applied Axial Load (kips)
Axial Load Ratio (%)
DB5-RE 6830 240 11.2
LB8-FB 8340 212 8.1
LB8-D1 7690 260 10.8
LB8-D2 6200 240 12.3
28
3-1
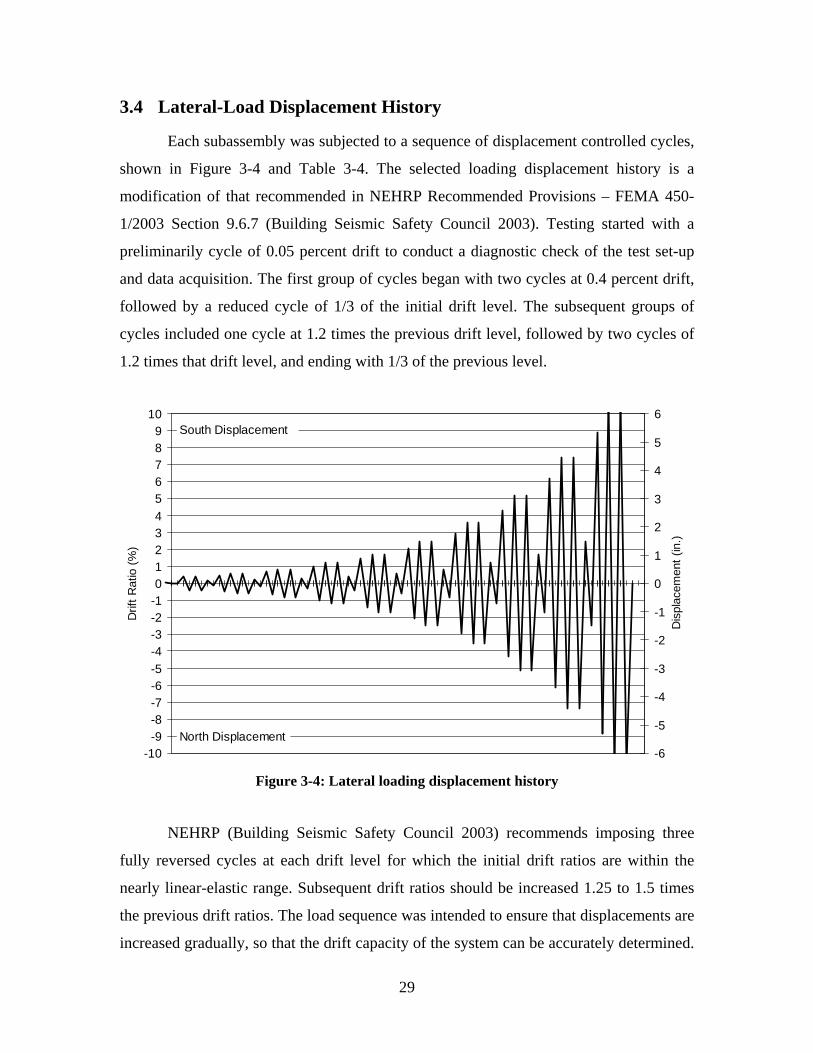
3.4 Lateral-Load Displacement History
Each subassembly was subjected to a sequence of displacement controlled cycles,
shown in Figure 3-4 and Table 3-4. The selected loading displacement history is a
modification of that recommended in NEHRP Recommended Provisions – FEMA 450-
1/2003 Section 9.6.7 (Building Seismic Safety Council 2003). Testing started with a
preliminarily cycle of 0.05 percent drift to conduct a diagnostic check of the test set-up
and data acquisition. The first group of cycles began with two cycles at 0.4 percent drift,
followed by a reduced cycle of 1/3 of the initial drift level. The subsequent groups of
cycles included one cycle at 1.2 times the previous drift level, followed by two cycles of
1.2 times that drift level, and ending with 1/3 of the previous level.
10 6 9 8 7 6 5 4 3 2 1 0
-1 -2 -3 -4 -5 -6 -7 -8
North Displacement
South Displacement 5
4
3
2
1
0
-1
-2
-3
-4
-5
Drif
t Rat
io (%
)
Dis
plac
emen
t (in
.)
-9 -10 -6
Figure 3-4: Lateral loading displacement history
NEHRP (Building Seismic Safety Council 2003) recommends imposing three
fully reversed cycles at each drift level for which the initial drift ratios are within the
nearly linear-elastic range. Subsequent drift ratios should be increased 1.25 to 1.5 times
the previous drift ratios. The load sequence was intended to ensure that displacements are
increased gradually, so that the drift capacity of the system can be accurately determined.
29
However, the large number of loading repetitions leads to an unrealistic softening of the
system. For example, small increasing steps would create results showing unnaturally
high maximum drifts, low lateral resistance, and a small rate of change of energy stored
in the system in comparison to the response expected in a major seismic event. It might
also mask any undesirable failures that might occur in the inelastic response range of a
seismic event. A reduced intermediate drift level between increased levels was chosen to
determine the response at a lower level and any new damage that might occur.
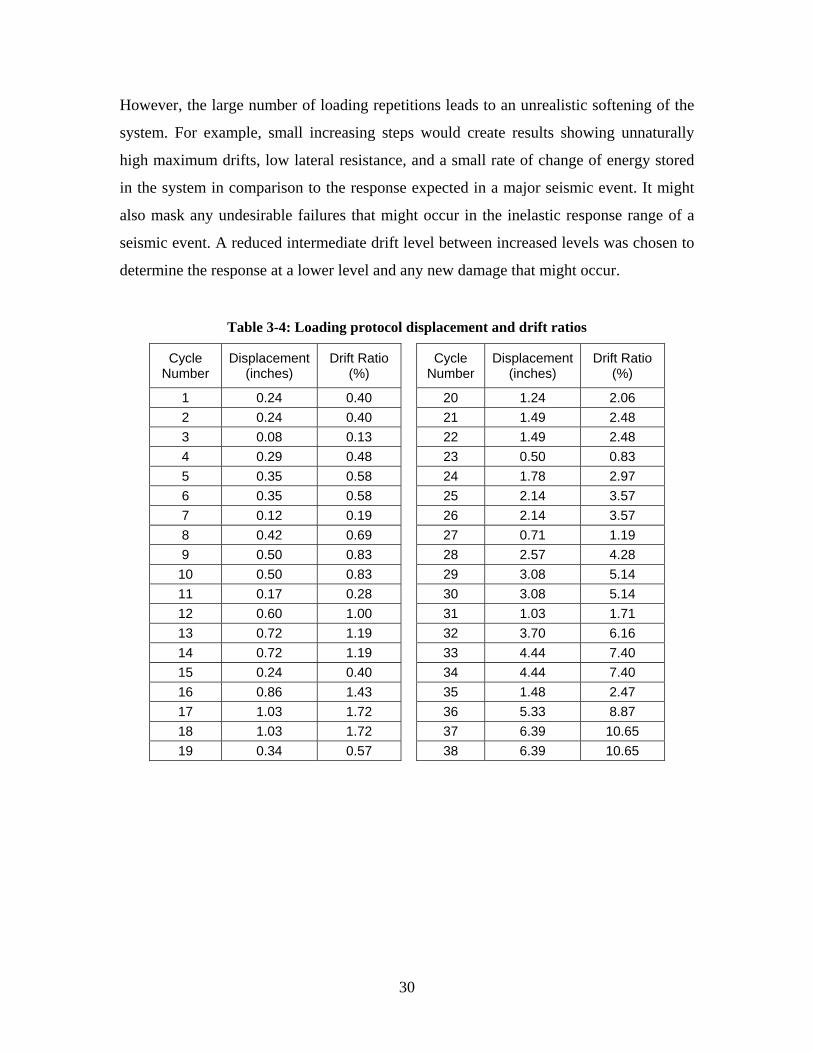
Table 3-4: Loading protocol displacement and drift ratios
Cycle Number
Displacement (inches)
Drift Ratio (%)
1 0.24 0.40 2 0.24 0.40 3 0.08 0.13 4 0.29 0.48 5 0.35 0.58 6 0.35 0.58 7 0.12 0.19 8 0.42 0.69 9 0.50 0.83 10 0.50 0.83 11 0.17 0.28 12 0.60 1.00 13 0.72 1.19 14 0.72 1.19 15 0.24 0.40 16 0.86 1.43 17 1.03 1.72 18 1.03 1.72 19 0.34 0.57
Cycle Number
Displacement (inches)
Drift Ratio (%)
20 1.24 2.06 21 1.49 2.48 22 1.49 2.48 23 0.50 0.83 24 1.78 2.97 25 2.14 3.57 26 2.14 3.57 27 0.71 1.19 28 2.57 4.28 29 3.08 5.14 30 3.08 5.14 31 1.03 1.71 32 3.70 6.16 33 4.44 7.40 34 4.44 7.40 35 1.48 2.47 36 5.33 8.87 37 6.39 10.65 38 6.39 10.65
30
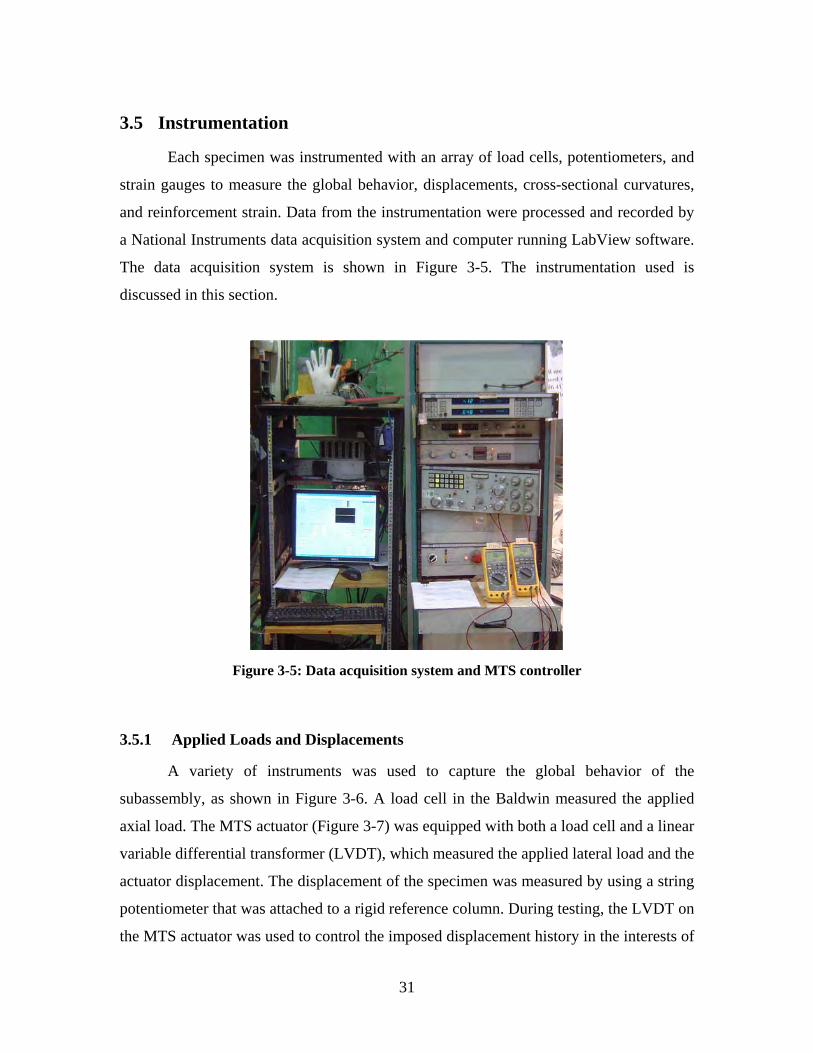
3.5 Instrumentation
Each specimen was instrumented with an array of load cells, potentiometers, and
strain gauges to measure the global behavior, displacements, cross-sectional curvatures,
and reinforcement strain. Data from the instrumentation were processed and recorded by
a National Instruments data acquisition system and computer running LabView software.
The data acquisition system is shown in Figure 3-5. The instrumentation used is
discussed in this section.
Figure 3-5: Data acquisition system and MTS controller
3.5.1 Applied Loads and Displacements
A variety of instruments was used to capture the global behavior of the
subassembly, as shown in Figure 3-6. A load cell in the Baldwin measured the applied
axial load. The MTS actuator (Figure 3-7) was equipped with both a load cell and a linear
variable differential transformer (LVDT), which measured the applied lateral load and the
actuator displacement. The displacement of the specimen was measured by using a string
potentiometer that was attached to a rigid reference column. During testing, the LVDT on
the MTS actuator was used to control the imposed displacement history in the interests of
31
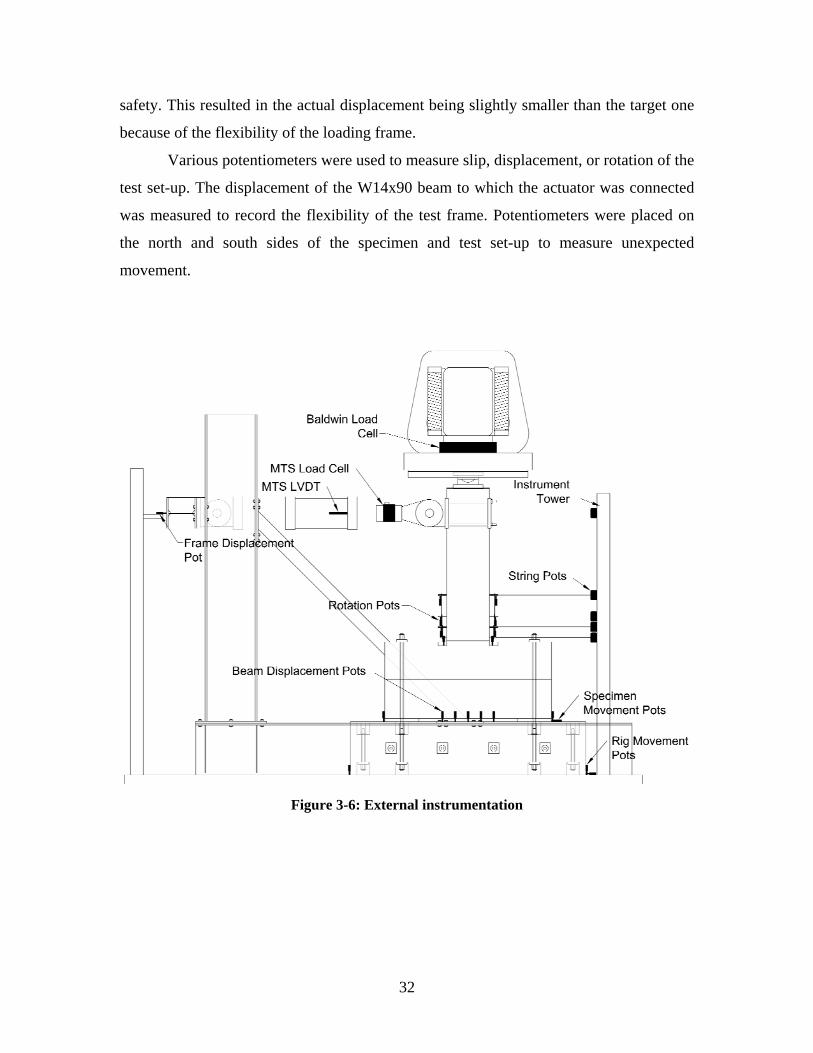
safety. This resulted in the actual displacement being slightly smaller than the target one
because of the flexibility of the loading frame.
Various potentiometers were used to measure slip, displacement, or rotation of the
test set-up. The displacement of the W14x90 beam to which the actuator was connected
was measured to record the flexibility of the test frame. Potentiometers were placed on
the north and south sides of the specimen and test set-up to measure unexpected
movement.
Figure 3-6: External instrumentation
32
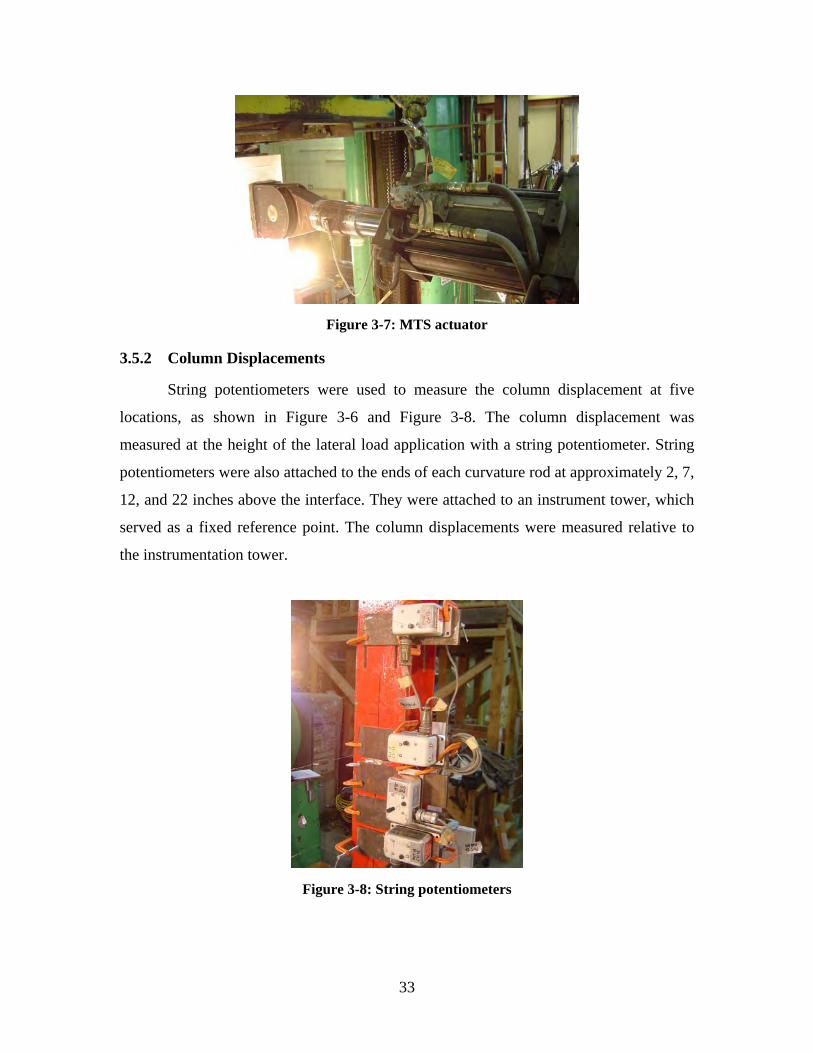
Figure 3-7: MTS actuator
3.5.2 Column Displacements
String potentiometers were used to measure the column displacement at five
locations, as shown in Figure 3-6 and Figure 3-8. The column displacement was
measured at the height of the lateral load application with a string potentiometer. String
potentiometers were also attached to the ends of each curvature rod at approximately 2, 7,
12, and 22 inches above the interface. They were attached to an instrument tower, which
served as a fixed reference point. The column displacements were measured relative to
the instrumentation tower.
Figure 3-8: String potentiometers
33
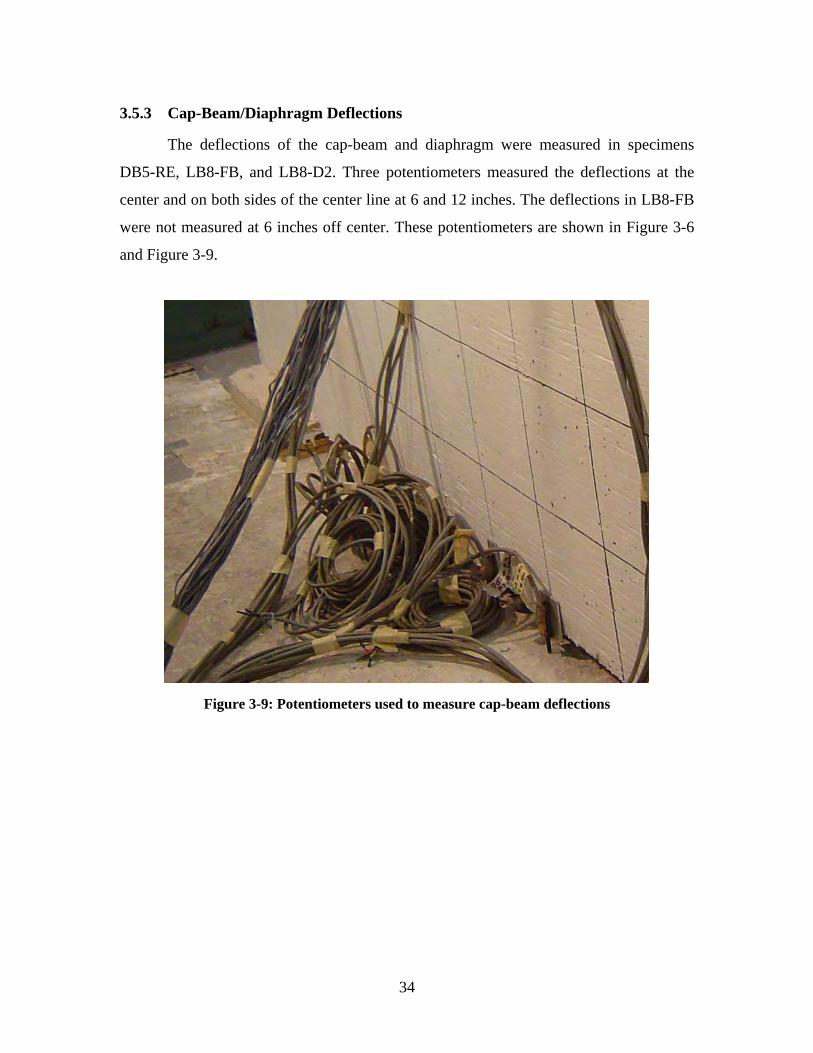
3.5.3 Cap-Beam/Diaphragm Deflections
The deflections of the cap-beam and diaphragm were measured in specimens
DB5-RE, LB8-FB, and LB8-D2. Three potentiometers measured the deflections at the
center and on both sides of the center line at 6 and 12 inches. The deflections in LB8-FB
were not measured at 6 inches off center. These potentiometers are shown in Figure 3-6
and Figure 3-9.
Figure 3-9: Potentiometers used to measure cap-beam deflections
34
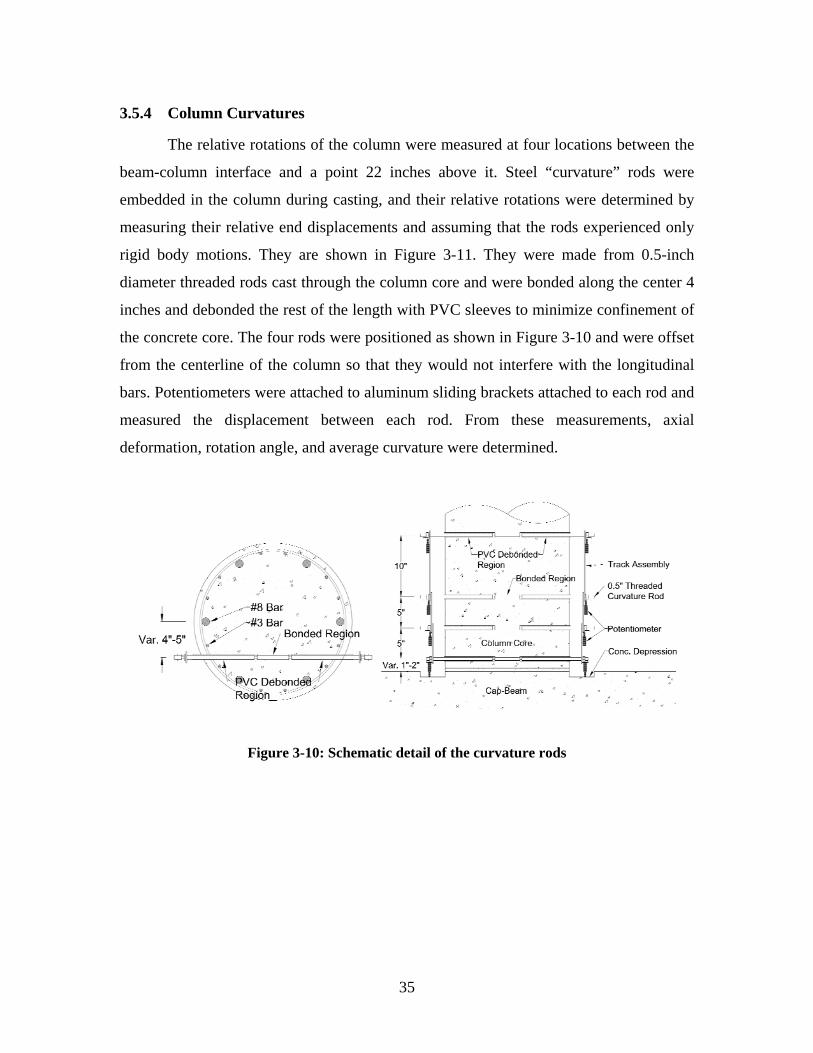
3.5.4 Column Curvatures
The relative rotations of the column were measured at four locations between the
beam-column interface and a point 22 inches above it. Steel “curvature” rods were
embedded in the column during casting, and their relative rotations were determined by
measuring their relative end displacements and assuming that the rods experienced only
rigid body motions. They are shown in Figure 3-11. They were made from 0.5-inch
diameter threaded rods cast through the column core and were bonded along the center 4
inches and debonded the rest of the length with PVC sleeves to minimize confinement of
the concrete core. The four rods were positioned as shown in Figure 3-10 and were offset
from the centerline of the column so that they would not interfere with the longitudinal
bars. Potentiometers were attached to aluminum sliding brackets attached to each rod and
measured the displacement between each rod. From these measurements, axial
deformation, rotation angle, and average curvature were determined.
Figure 3-10: Schematic detail of the curvature rods
35
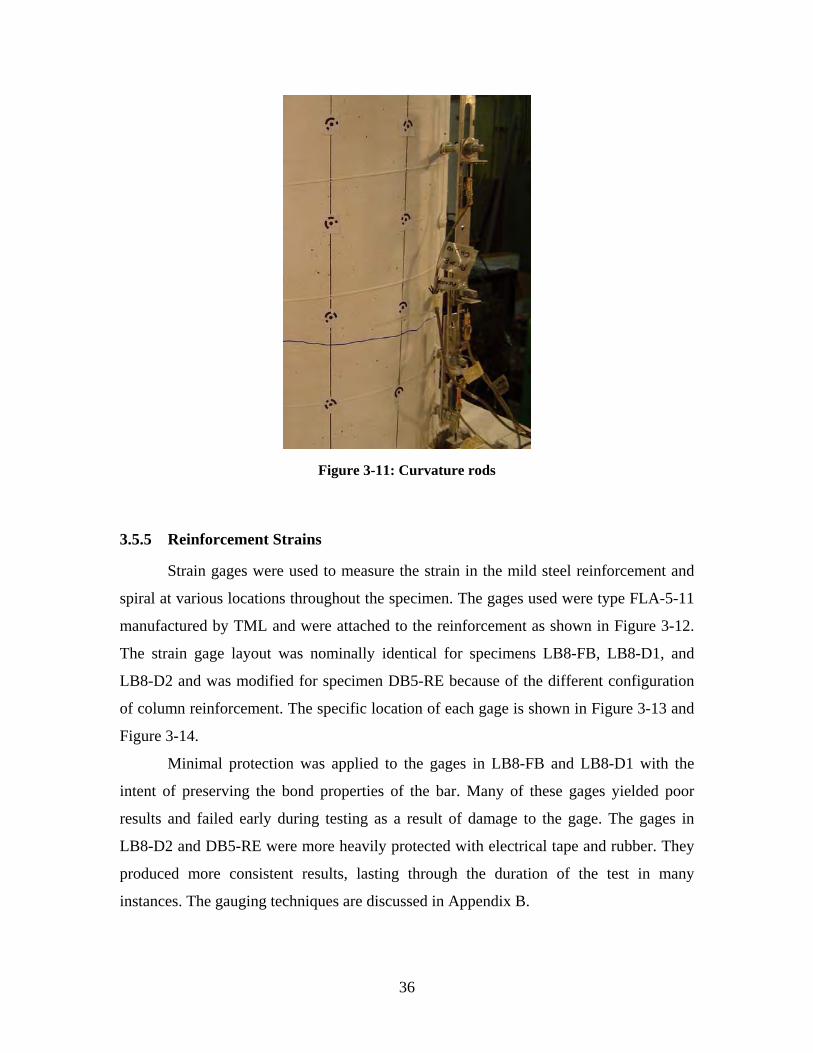
Figure 3-11: Curvature rods
3.5.5 Reinforcement Strains
Strain gages were used to measure the strain in the mild steel reinforcement and
spiral at various locations throughout the specimen. The gages used were type FLA-5-11
manufactured by TML and were attached to the reinforcement as shown in Figure 3-12.
The strain gage layout was nominally identical for specimens LB8-FB, LB8-D1, and
LB8-D2 and was modified for specimen DB5-RE because of the different configuration
of column reinforcement. The specific location of each gage is shown in Figure 3-13 and
Figure 3-14.
Minimal protection was applied to the gages in LB8-FB and LB8-D1 with the
intent of preserving the bond properties of the bar. Many of these gages yielded poor
results and failed early during testing as a result of damage to the gage. The gages in
LB8-D2 and DB5-RE were more heavily protected with electrical tape and rubber. They
produced more consistent results, lasting through the duration of the test in many
instances. The gauging techniques are discussed in Appendix B.
36
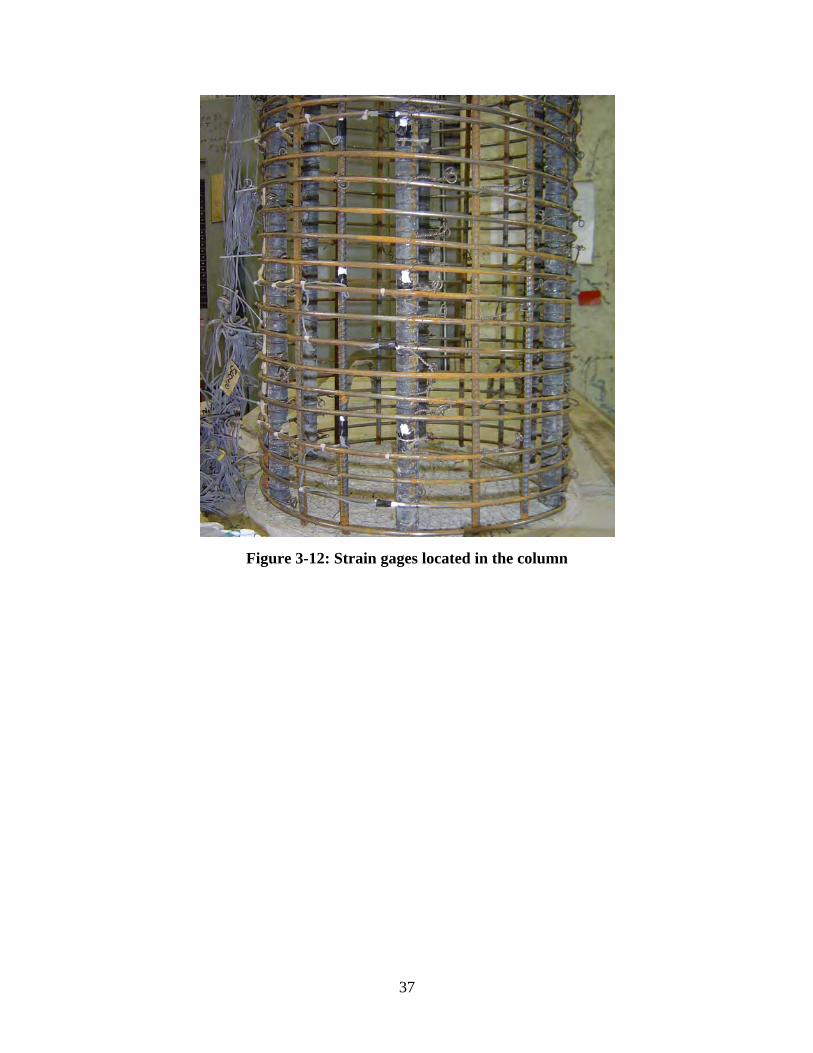
Figure 3-12: Strain gages located in the column
37
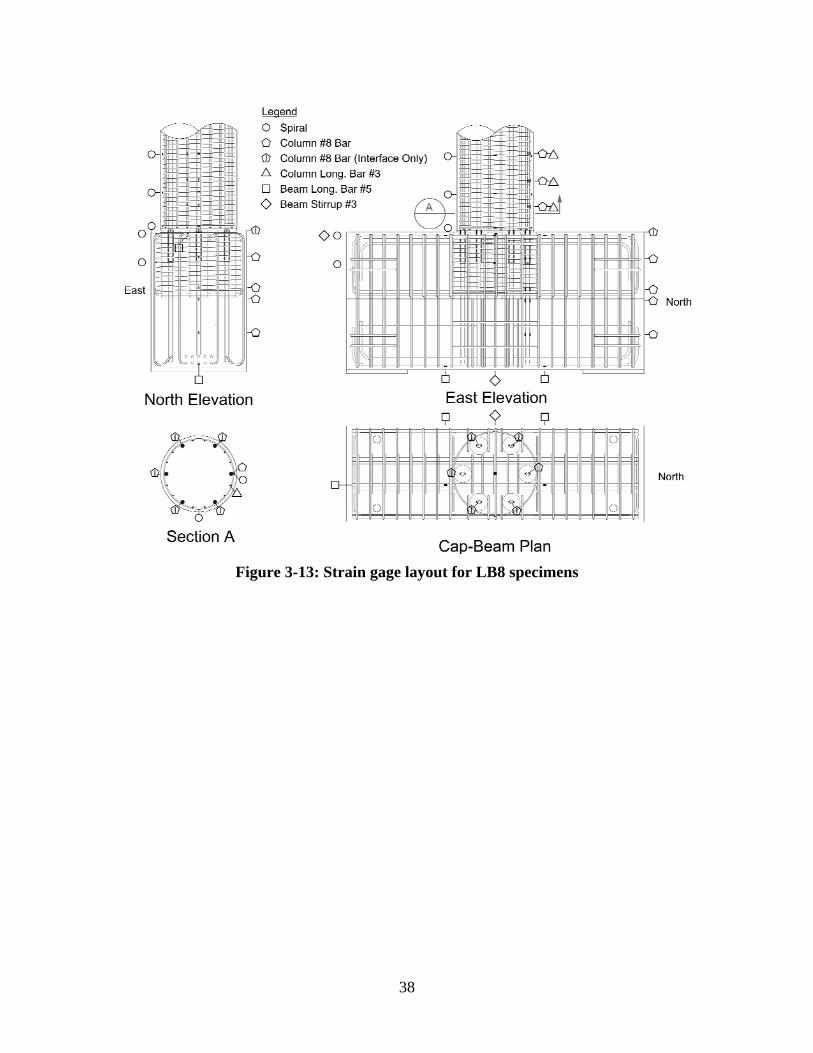
Figure 3-13: Strain gage layout for LB8 specimens
38
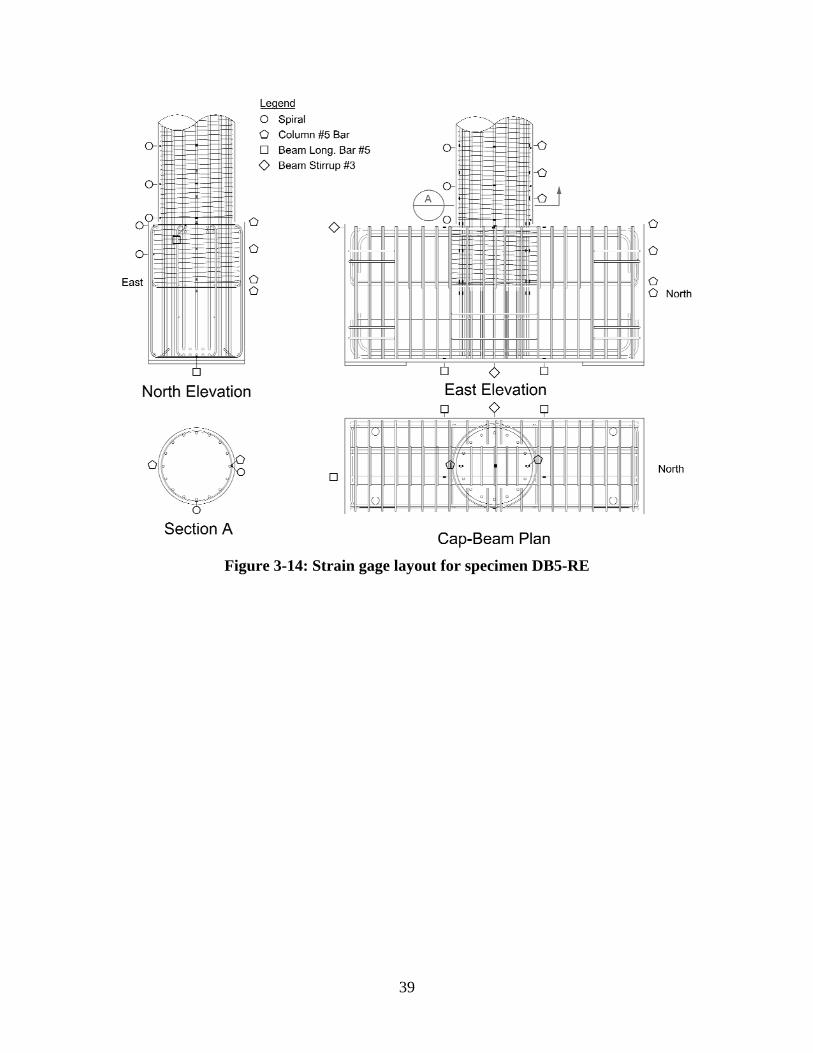
Figure 3-14: Strain gage layout for specimen DB5-RE
39
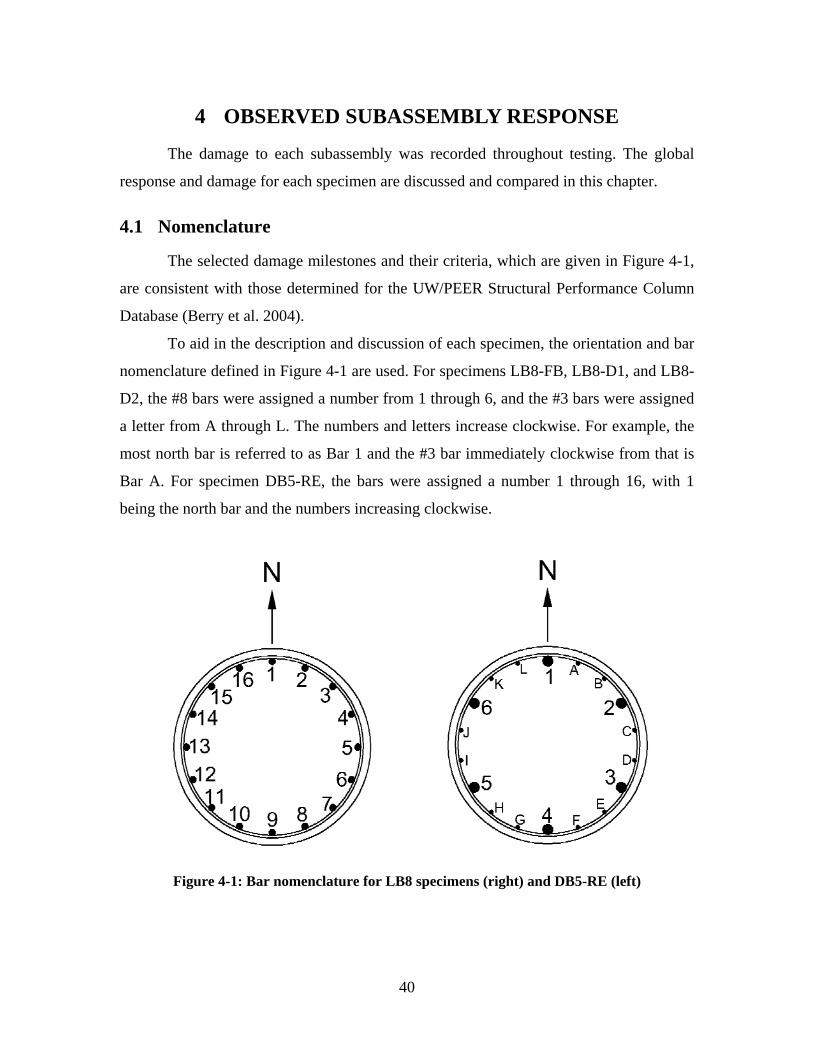
4 OBSERVED SUBASSEMBLY RESPONSE
The damage to each subassembly was recorded throughout testing. The global
response and damage for each specimen are discussed and compared in this chapter.
4.1 Nomenclature
The selected damage milestones and their criteria, which are given in Figure 4-1,
are consistent with those determined for the UW/PEER Structural Performance Column
Database (Berry et al. 2004).
To aid in the description and discussion of each specimen, the orientation and bar
nomenclature defined in Figure 4-1 are used. For specimens LB8-FB, LB8-D1, and LB8-
D2, the #8 bars were assigned a number from 1 through 6, and the #3 bars were assigned
a letter from A through L. The numbers and letters increase clockwise. For example, the
most north bar is referred to as Bar 1 and the #3 bar immediately clockwise from that is
Bar A. For specimen DB5-RE, the bars were assigned a number 1 through 16, with 1
being the north bar and the numbers increasing clockwise.
Figure 4-1: Bar nomenclature for LB8 specimens (right) and DB5-RE (left)
40
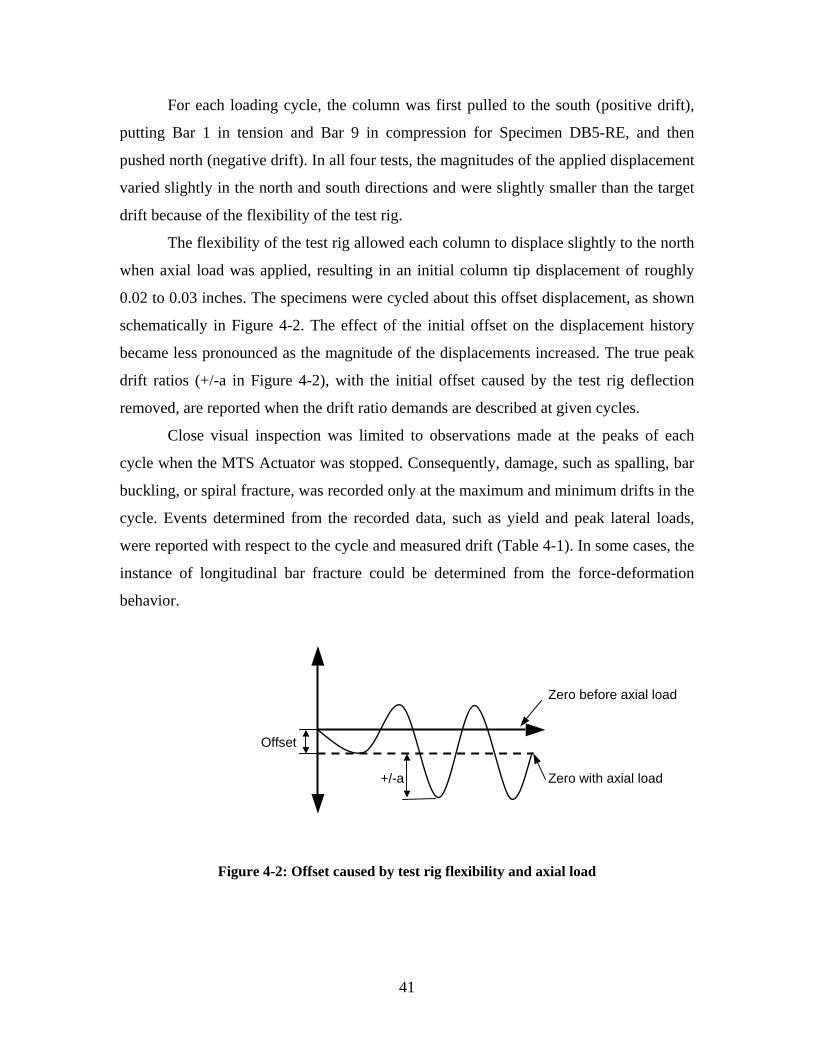
For each loading cycle, the column was first pulled to the south (positive drift),
putting Bar 1 in tension and Bar 9 in compression for Specimen DB5-RE, and then
pushed north (negative drift). In all four tests, the magnitudes of the applied displacement
varied slightly in the north and south directions and were slightly smaller than the target
drift because of the flexibility of the test rig.
The flexibility of the test rig allowed each column to displace slightly to the north
when axial load was applied, resulting in an initial column tip displacement of roughly
0.02 to 0.03 inches. The specimens were cycled about this offset displacement, as shown
schematically in Figure 4-2. The effect of the initial offset on the displacement history
became less pronounced as the magnitude of the displacements increased. The true peak
drift ratios (+/-a in Figure 4-2), with the initial offset caused by the test rig deflection
removed, are reported when the drift ratio demands are described at given cycles.
Close visual inspection was limited to observations made at the peaks of each
cycle when the MTS Actuator was stopped. Consequently, damage, such as spalling, bar
buckling, or spiral fracture, was recorded only at the maximum and minimum drifts in the
cycle. Events determined from the recorded data, such as yield and peak lateral loads,
were reported with respect to the cycle and measured drift (Table 4-1). In some cases, the
instance of longitudinal bar fracture could be determined from the force-deformation
behavior.
Offset
+/-a Zero with axial load
Zero before axial load
Figure 4-2: Offset caused by test rig flexibility and axial load
41
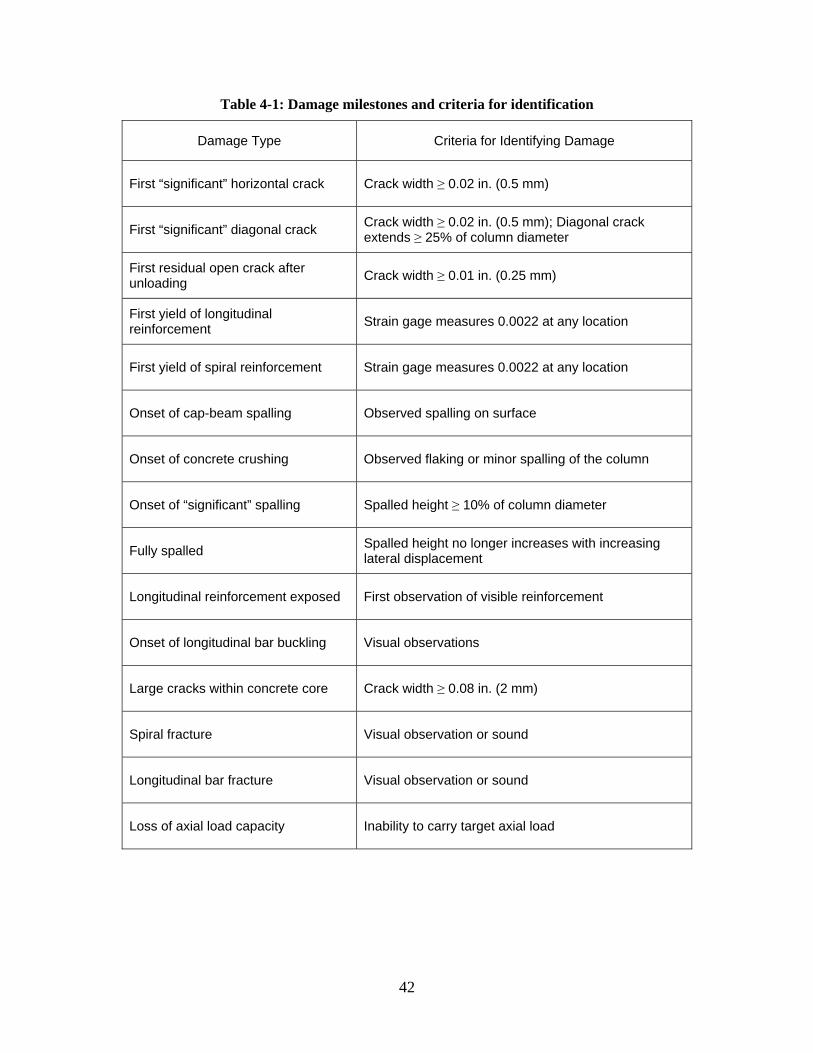
Table 4-1: Damage milestones and criteria for identification
Damage Type Criteria for Identifying Damage
First “significant” horizontal crack Crack width ≥ 0.02 in. (0.5 mm)
First “significant” diagonal crack Crack width ≥ 0.02 in. (0.5 mm); Diagonal crack extends ≥ 25% of column diameter
First residual open crack after unloading Crack width ≥ 0.01 in. (0.25 mm)
First yield of longitudinal reinforcement Strain gage measures 0.0022 at any location
First yield of spiral reinforcement Strain gage measures 0.0022 at any location
Onset of cap-beam spalling Observed spalling on surface
Onset of concrete crushing Observed flaking or minor spalling of the column
Onset of “significant” spalling Spalled height ≥ 10% of column diameter
Fully spalled Spalled height no longer increases with increasing lateral displacement
Longitudinal reinforcement exposed First observation of visible reinforcement
Onset of longitudinal bar buckling Visual observations
Large cracks within concrete core Crack width ≥ 0.08 in. (2 mm)
Spiral fracture Visual observation or sound
Longitudinal bar fracture Visual observation or sound
Loss of axial load capacity Inability to carry target axial load
42
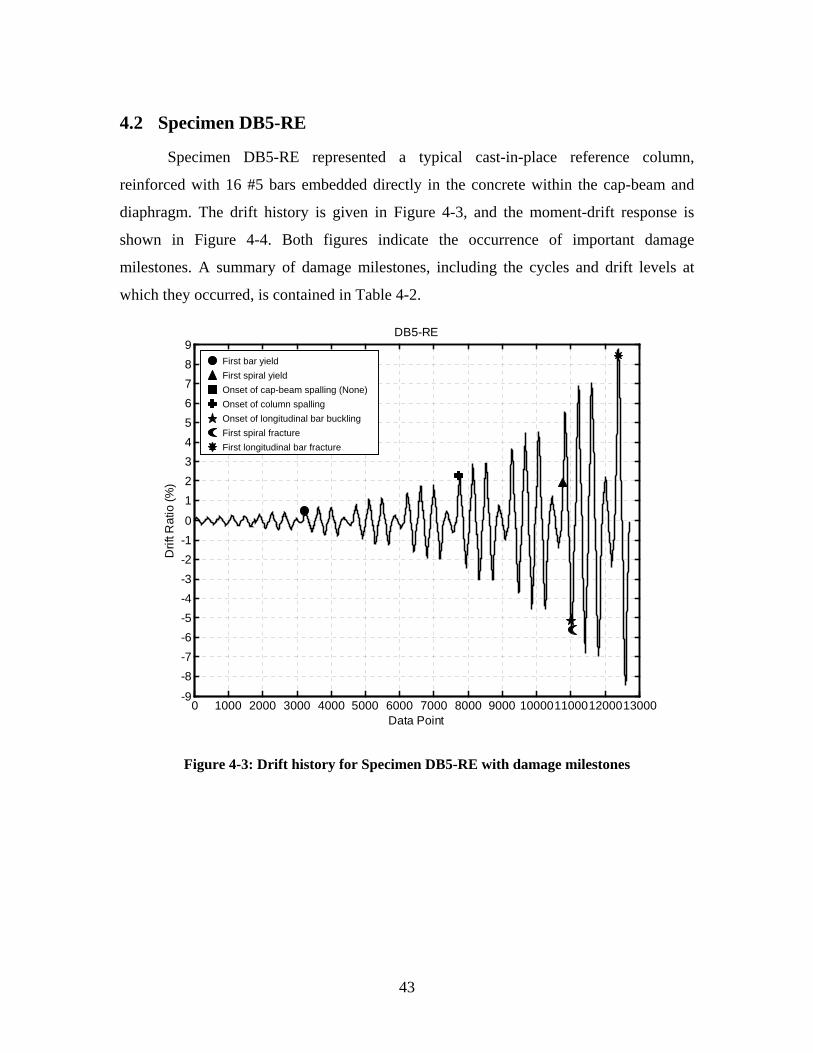
4.2 Specimen DB5-RE
Specimen DB5-RE represented a typical cast-in-place reference column,
reinforced with 16 #5 bars embedded directly in the concrete within the cap-beam and
diaphragm. The drift history is given in Figure 4-3, and the moment-drift response is
shown in Figure 4-4. Both figures indicate the occurrence of important damage
milestones. A summary of damage milestones, including the cycles and drift levels at
which they occurred, is contained in Table 4-2.
-9
-8 -7 -6 -5 -4 -3 -2 -1 0
1 2 3 4 5 6 7 8 9
DB5-RE
Drif
t Rat
io (%
)
First bar yield First spiral yield Onset of cap-beam spalling (None) Onset of column spalling Onset of longitudinal bar buckling First spiral fracture First longitudinal bar fracture
0 1000 2000 3000 4000 5000 6000 7000 8000 9000 10000110001200013000 Data Point
Figure 4-3: Drift history for Specimen DB5-RE with damage milestones
43
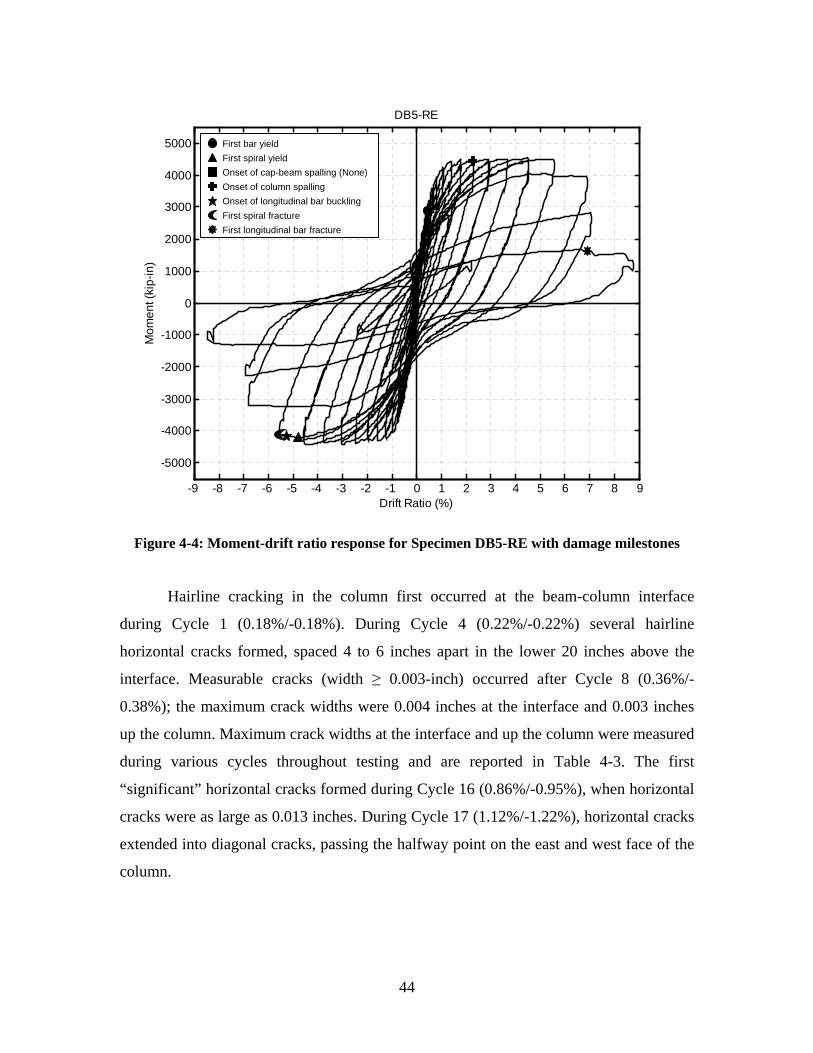
DB5-RE
5000 First bar yield First spiral yield Onset of cap-beam spalling (None)4000 Onset of column spalling Onset of longitudinal bar buckling3000 First spiral fracture First longitudinal bar fracture
2000
1000
0
-1000
-2000
-3000
-4000
-5000
-9 -8 -7 -6 -5 -4 -3 -2 -1 0 1 2 3 4 5 6 7 8 9
Mom
ent (
kip-
in)
Drift Ratio (%)
Figure 4-4: Moment-drift ratio response for Specimen DB5-RE with damage milestones
Hairline cracking in the column first occurred at the beam-column interface
during Cycle 1 (0.18%/-0.18%). During Cycle 4 (0.22%/-0.22%) several hairline
horizontal cracks formed, spaced 4 to 6 inches apart in the lower 20 inches above the
interface. Measurable cracks (width ≥ 0.003-inch) occurred after Cycle 8 (0.36%/-
0.38%); the maximum crack widths were 0.004 inches at the interface and 0.003 inches
up the column. Maximum crack widths at the interface and up the column were measured
during various cycles throughout testing and are reported in Table 4-3. The first
“significant” horizontal cracks formed during Cycle 16 (0.86%/-0.95%), when horizontal
cracks were as large as 0.013 inches. During Cycle 17 (1.12%/-1.22%), horizontal cracks
extended into diagonal cracks, passing the halfway point on the east and west face of the
column.
44
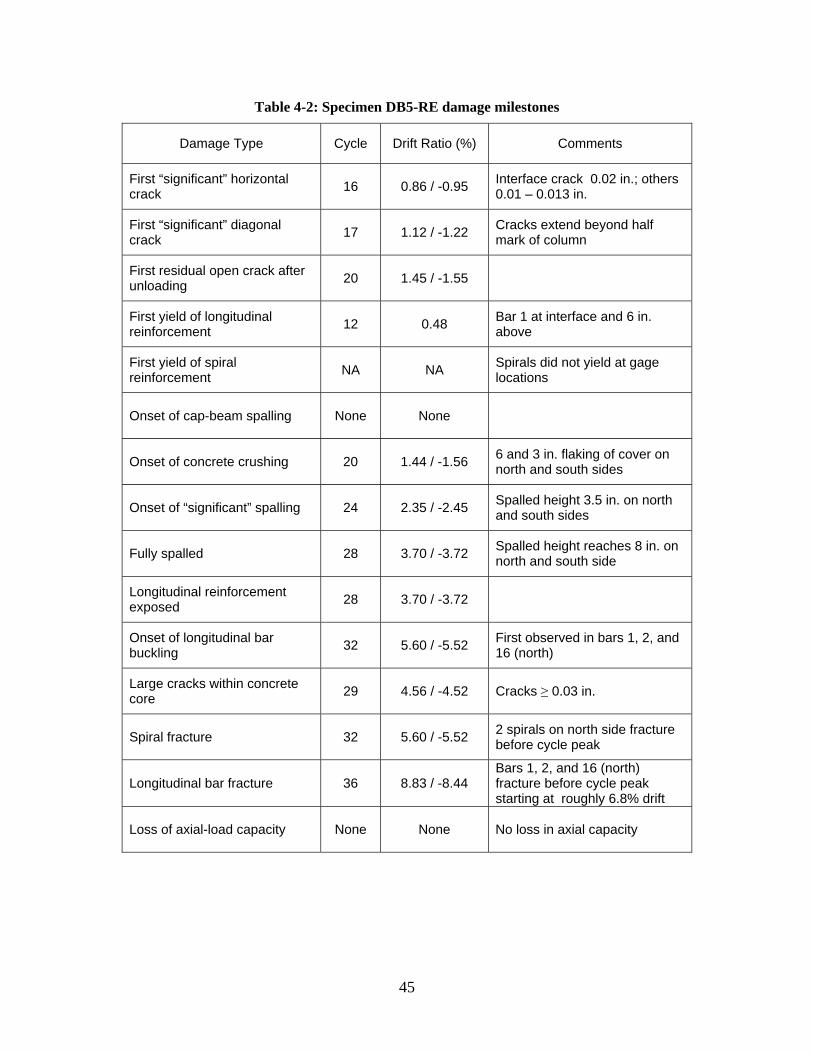
Table 4-2: Specimen DB5-RE damage milestones
Damage Type Cycle Drift Ratio (%) Comments
First “significant” horizontal crack 16 0.86 / -0.95 Interface crack 0.02 in.; others
0.01 – 0.013 in.
First “significant” diagonal crack 17 1.12 / -1.22 Cracks extend beyond half
mark of column
First residual open crack after unloading 20 1.45 / -1.55
First yield of longitudinal reinforcement 12 0.48 Bar 1 at interface and 6 in.
above
First yield of spiral reinforcement NA NA Spirals did not yield at gage
locations
Onset of cap-beam spalling None None
Onset of concrete crushing 20 1.44 / -1.56 6 and 3 in. flaking of cover on north and south sides
Onset of “significant” spalling 24 2.35 / -2.45 Spalled height 3.5 in. on north and south sides
Fully spalled 28 3.70 / -3.72 Spalled height reaches 8 in. on north and south side
Longitudinal reinforcement exposed 28 3.70 / -3.72
Onset of longitudinal bar buckling 32 5.60 / -5.52 First observed in bars 1, 2, and
16 (north)
Large cracks within concrete core 29 4.56 / -4.52 Cracks ≥ 0.03 in.
Spiral fracture 32 5.60 / -5.52 2 spirals on north side fracture before cycle peak
Longitudinal bar fracture 36 8.83 / -8.44 Bars 1, 2, and 16 (north) fracture before cycle peak starting at roughly 6.8% drift
Loss of axial-load capacity None None No loss in axial capacity
45
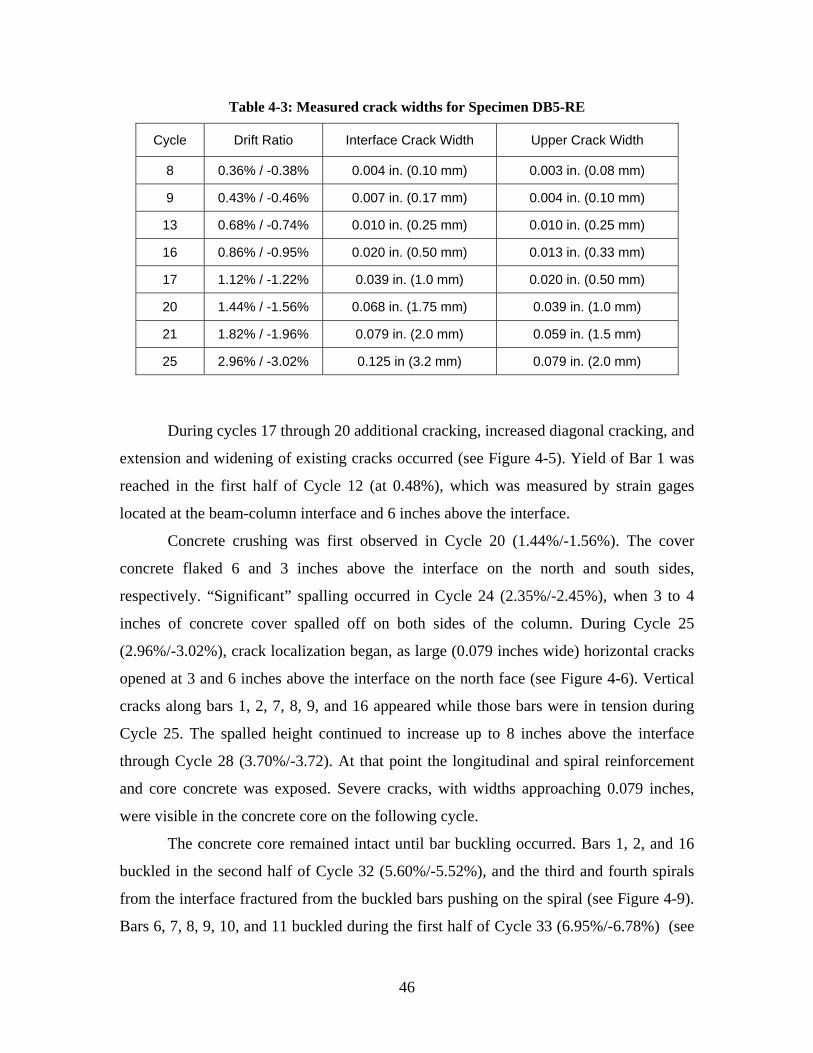
Table 4-3: Measured crack widths for Specimen DB5-RE
Cycle Drift Ratio Interface Crack Width Upper Crack Width
8 0.36% / -0.38% 0.004 in. (0.10 mm) 0.003 in. (0.08 mm)
9 0.43% / -0.46% 0.007 in. (0.17 mm) 0.004 in. (0.10 mm)
13 0.68% / -0.74% 0.010 in. (0.25 mm) 0.010 in. (0.25 mm)
16 0.86% / -0.95% 0.020 in. (0.50 mm) 0.013 in. (0.33 mm)
17 1.12% / -1.22% 0.039 in. (1.0 mm) 0.020 in. (0.50 mm)
20 1.44% / -1.56% 0.068 in. (1.75 mm) 0.039 in. (1.0 mm)
21 1.82% / -1.96% 0.079 in. (2.0 mm) 0.059 in. (1.5 mm)
25 2.96% / -3.02% 0.125 in (3.2 mm) 0.079 in. (2.0 mm)
During cycles 17 through 20 additional cracking, increased diagonal cracking, and
extension and widening of existing cracks occurred (see Figure 4-5). Yield of Bar 1 was
reached in the first half of Cycle 12 (at 0.48%), which was measured by strain gages
located at the beam-column interface and 6 inches above the interface.
Concrete crushing was first observed in Cycle 20 (1.44%/-1.56%). The cover
concrete flaked 6 and 3 inches above the interface on the north and south sides,
respectively. “Significant” spalling occurred in Cycle 24 (2.35%/-2.45%), when 3 to 4
inches of concrete cover spalled off on both sides of the column. During Cycle 25
(2.96%/-3.02%), crack localization began, as large (0.079 inches wide) horizontal cracks
opened at 3 and 6 inches above the interface on the north face (see Figure 4-6). Vertical
cracks along bars 1, 2, 7, 8, 9, and 16 appeared while those bars were in tension during
Cycle 25. The spalled height continued to increase up to 8 inches above the interface
through Cycle 28 (3.70%/-3.72). At that point the longitudinal and spiral reinforcement
and core concrete was exposed. Severe cracks, with widths approaching 0.079 inches,
were visible in the concrete core on the following cycle.
The concrete core remained intact until bar buckling occurred. Bars 1, 2, and 16
buckled in the second half of Cycle 32 (5.60%/-5.52%), and the third and fourth spirals
from the interface fractured from the buckled bars pushing on the spiral (see Figure 4-9).
Bars 6, 7, 8, 9, 10, and 11 buckled during the first half of Cycle 33 (6.95%/-6.78%) (see
46
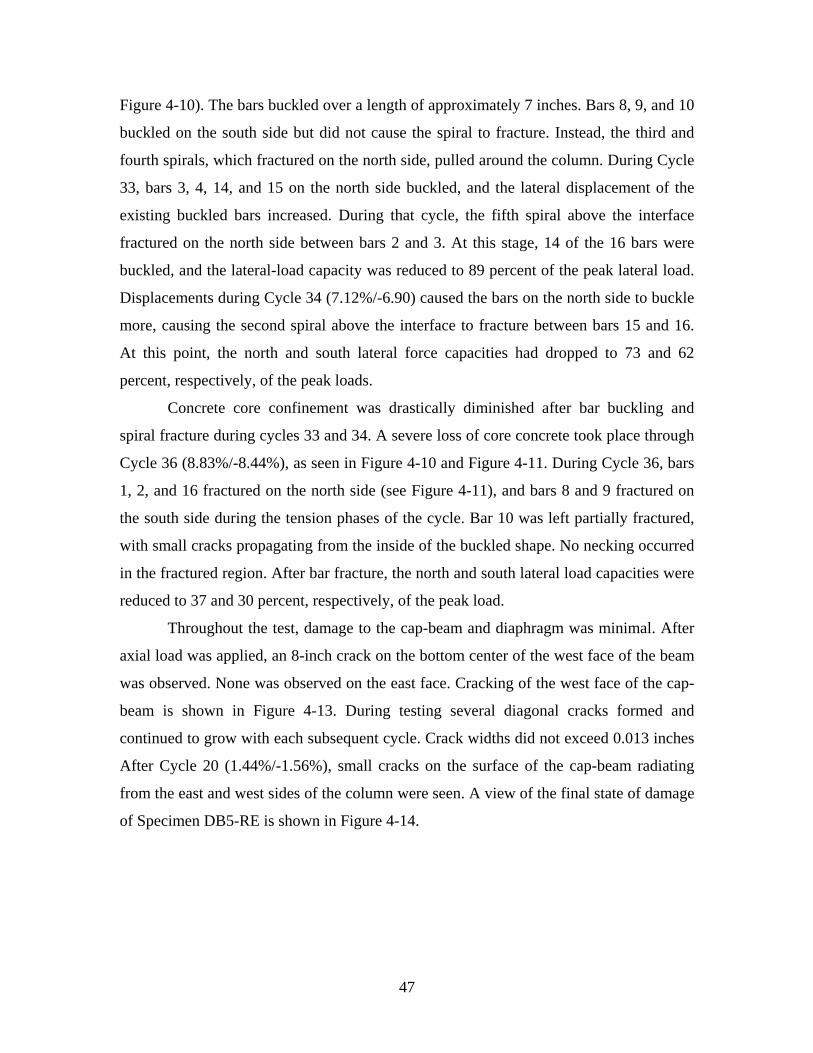
Figure 4-10). The bars buckled over a length of approximately 7 inches. Bars 8, 9, and 10
buckled on the south side but did not cause the spiral to fracture. Instead, the third and
fourth spirals, which fractured on the north side, pulled around the column. During Cycle
33, bars 3, 4, 14, and 15 on the north side buckled, and the lateral displacement of the
existing buckled bars increased. During that cycle, the fifth spiral above the interface
fractured on the north side between bars 2 and 3. At this stage, 14 of the 16 bars were
buckled, and the lateral-load capacity was reduced to 89 percent of the peak lateral load.
Displacements during Cycle 34 (7.12%/-6.90) caused the bars on the north side to buckle
more, causing the second spiral above the interface to fracture between bars 15 and 16.
At this point, the north and south lateral force capacities had dropped to 73 and 62
percent, respectively, of the peak loads.
Concrete core confinement was drastically diminished after bar buckling and
spiral fracture during cycles 33 and 34. A severe loss of core concrete took place through
Cycle 36 (8.83%/-8.44%), as seen in Figure 4-10 and Figure 4-11. During Cycle 36, bars
1, 2, and 16 fractured on the north side (see Figure 4-11), and bars 8 and 9 fractured on
the south side during the tension phases of the cycle. Bar 10 was left partially fractured,
with small cracks propagating from the inside of the buckled shape. No necking occurred
in the fractured region. After bar fracture, the north and south lateral load capacities were
reduced to 37 and 30 percent, respectively, of the peak load.
Throughout the test, damage to the cap-beam and diaphragm was minimal. After
axial load was applied, an 8-inch crack on the bottom center of the west face of the beam
was observed. None was observed on the east face. Cracking of the west face of the cap-
beam is shown in Figure 4-13. During testing several diagonal cracks formed and
continued to grow with each subsequent cycle. Crack widths did not exceed 0.013 inches
After Cycle 20 (1.44%/-1.56%), small cracks on the surface of the cap-beam radiating
from the east and west sides of the column were seen. A view of the final state of damage
of Specimen DB5-RE is shown in Figure 4-14.
47
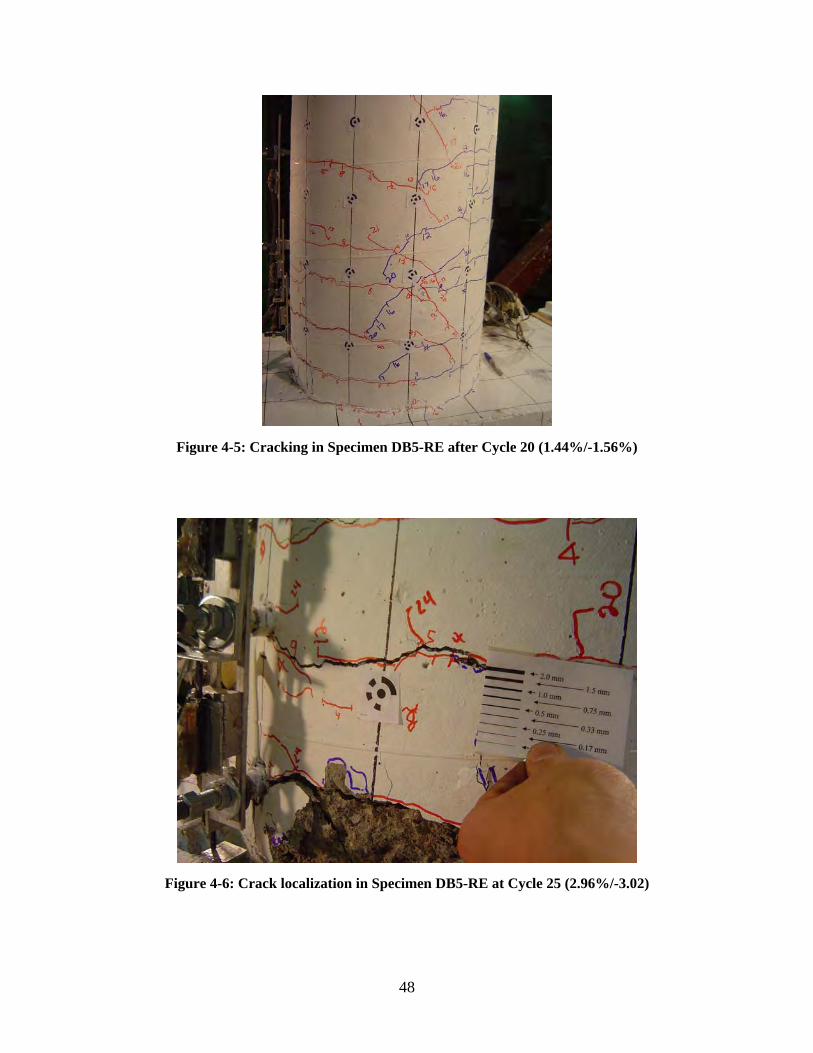
Figure 4-5: Cracking in Specimen DB5-RE after Cycle 20 (1.44%/-1.56%)
Figure 4-6: Crack localization in Specimen DB5-RE at Cycle 25 (2.96%/-3.02)
48
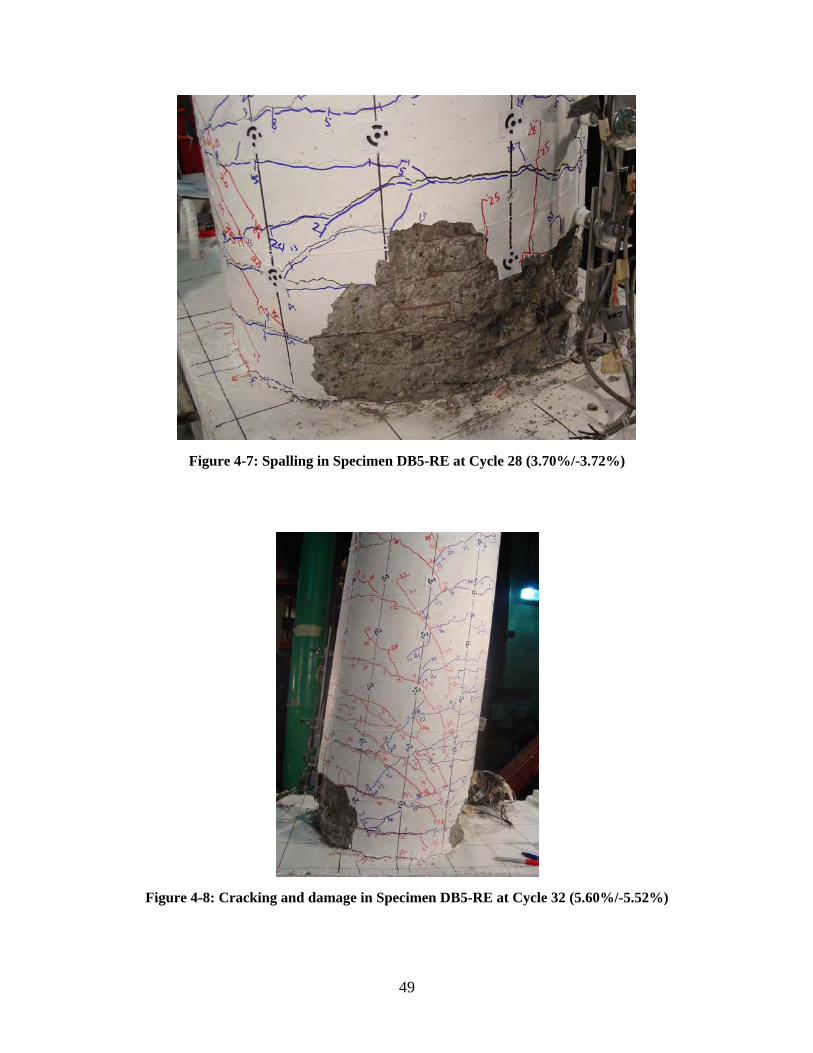
Figure 4-7: Spalling in Specimen DB5-RE at Cycle 28 (3.70%/-3.72%)
Figure 4-8: Cracking and damage in Specimen DB5-RE at Cycle 32 (5.60%/-5.52%)
49
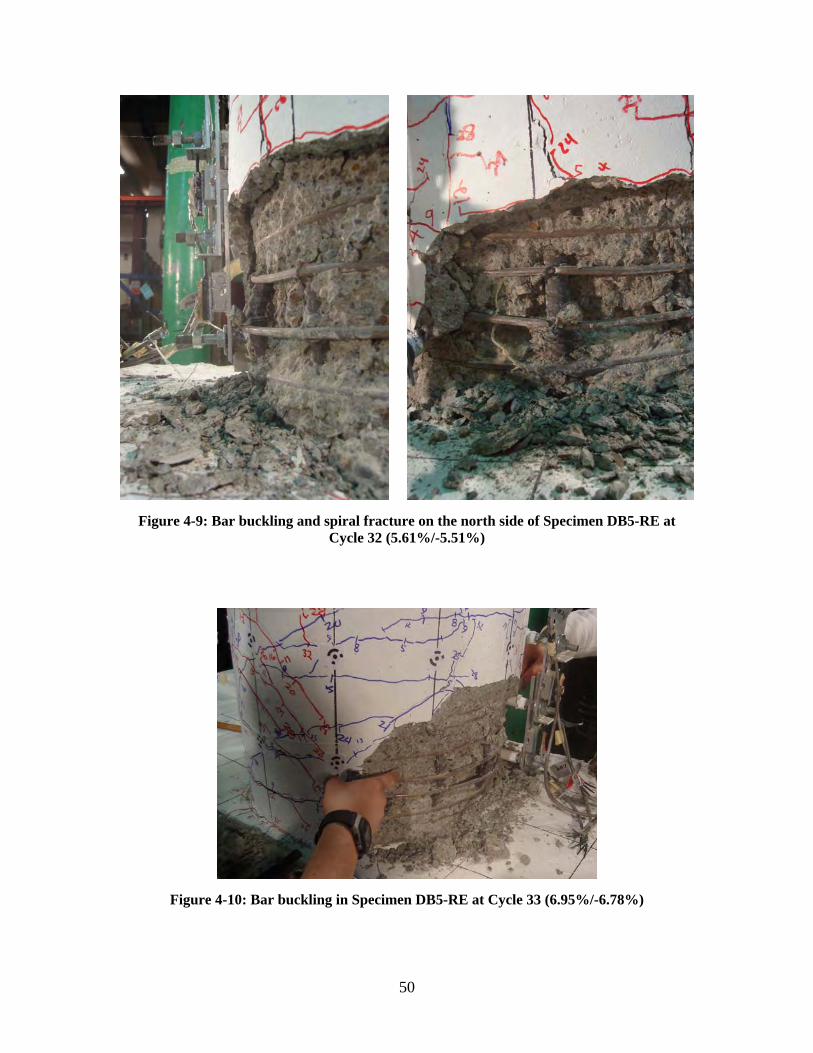
Figure 4-9: Bar buckling and spiral fracture on the north side of Specimen DB5-RE at Cycle 32 (5.61%/-5.51%)
Figure 4-10: Bar buckling in Specimen DB5-RE at Cycle 33 (6.95%/-6.78%)
50
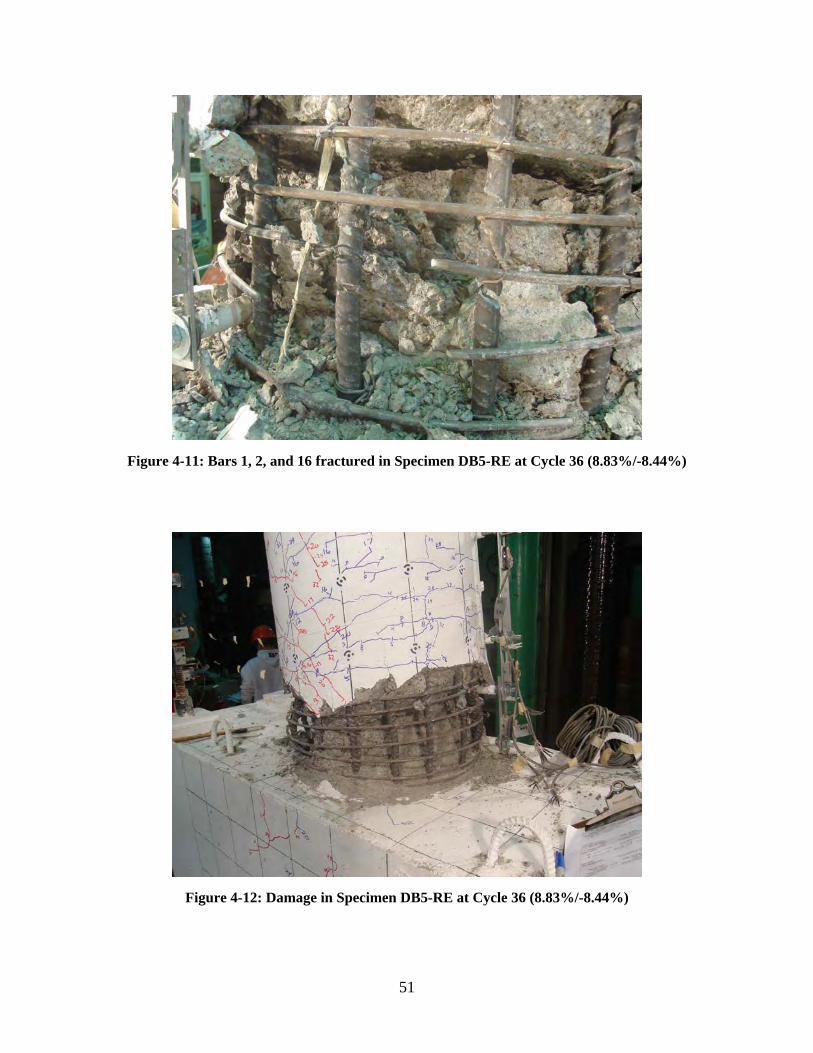
Figure 4-11: Bars 1, 2, and 16 fractured in Specimen DB5-RE at Cycle 36 (8.83%/-8.44%)
Figure 4-12: Damage in Specimen DB5-RE at Cycle 36 (8.83%/-8.44%)
51
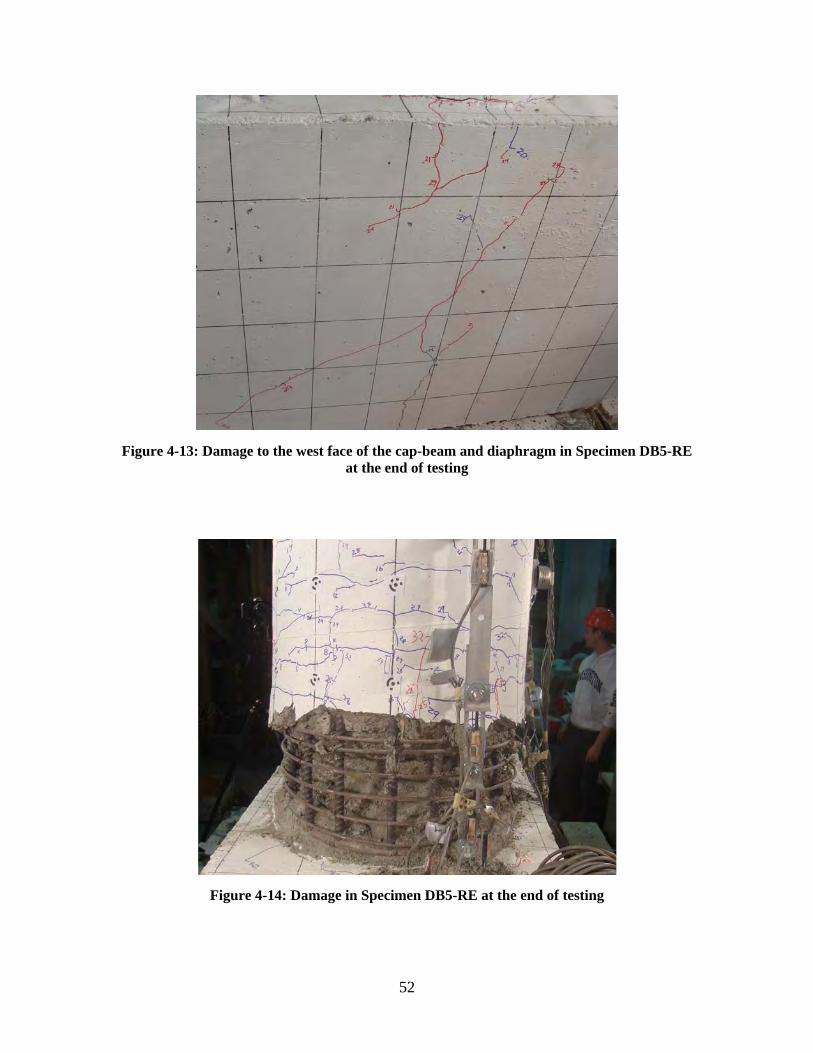
Figure 4-13: Damage to the west face of the cap-beam and diaphragm in Specimen DB5-RE at the end of testing
Figure 4-14: Damage in Specimen DB5-RE at the end of testing
52
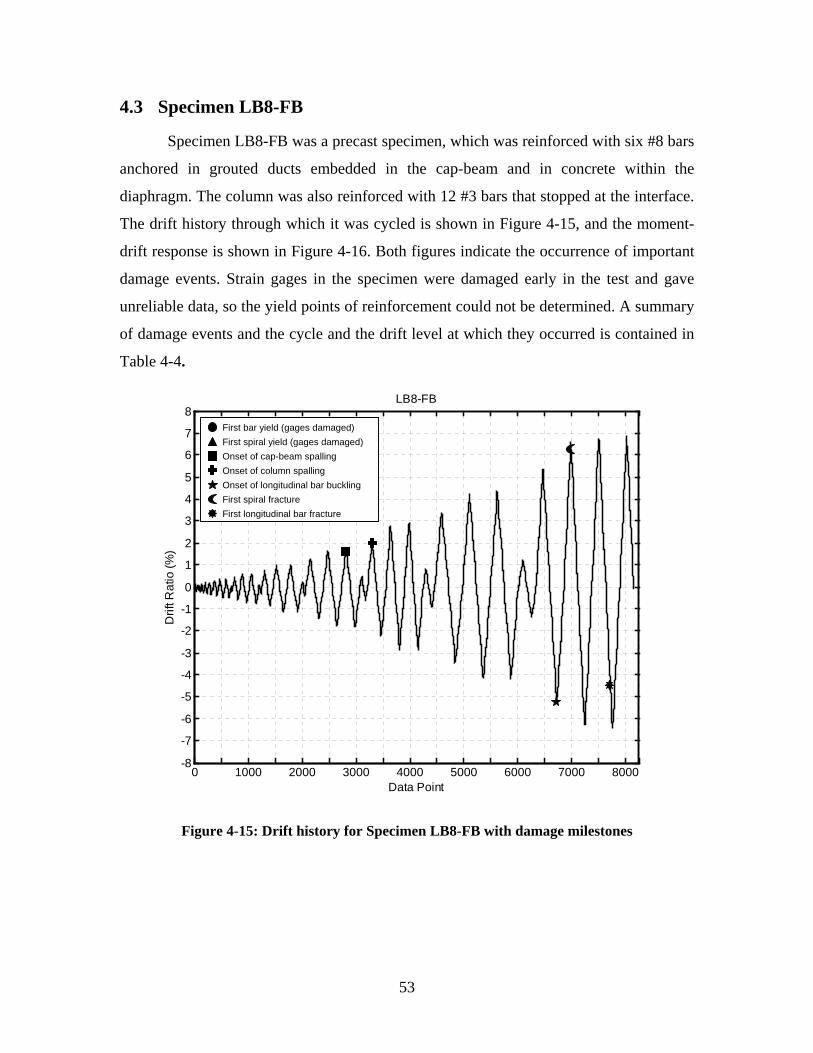
4.3 Specimen LB8-FB
Specimen LB8-FB was a precast specimen, which was reinforced with six #8 bars
anchored in grouted ducts embedded in the cap-beam and in concrete within the
diaphragm. The column was also reinforced with 12 #3 bars that stopped at the interface.
The drift history through which it was cycled is shown in Figure 4-15, and the moment-
drift response is shown in Figure 4-16. Both figures indicate the occurrence of important
damage events. Strain gages in the specimen were damaged early in the test and gave
unreliable data, so the yield points of reinforcement could not be determined. A summary
of damage events and the cycle and the drift level at which they occurred is contained in
Table 4-4.
LB8-FB
0 1000 2000 3000 4000 5000 6000 7000 8000 -8
-7
-6
-5
-4
-3
-2
-1
0
1
2
3
4
5
6
7
8
Drif
t Rat
io (%
)
First bar yield (gages damaged) First spiral yield (gages damaged) Onset of cap-beam spalling Onset of column spalling Onset of longitudinal bar buckling First spiral fracture First longitudinal bar fracture
Data Point
Figure 4-15: Drift history for Specimen LB8-FB with damage milestones
53
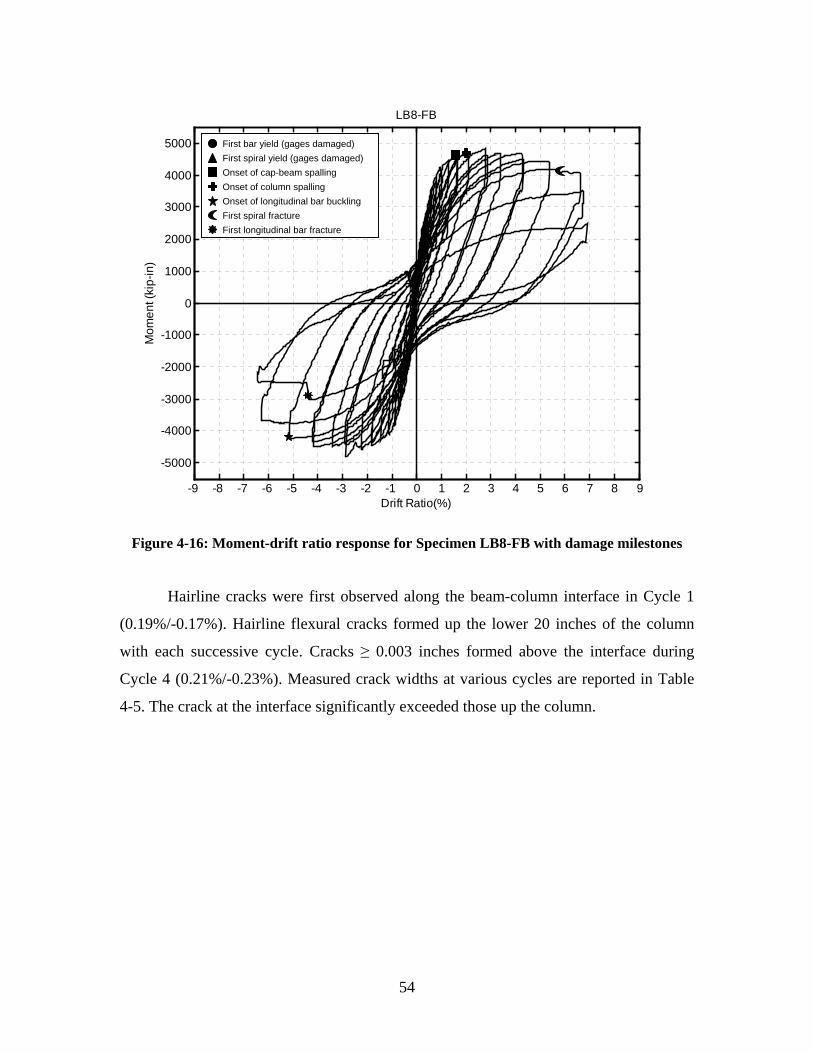
LB8-FB
5000 First bar yield (gages damaged) First spiral yield (gages damaged) Onset of cap-beam spalling4000 Onset of column spalling Onset of longitudinal bar buckling3000 First spiral fracture First longitudinal bar fracture
2000
1000
0
-1000
-2000
-3000
-4000
-5000
-9 -8 -7 -6 -5 -4 -3 -2 -1 0 1 2 3 4 5 6 7 8 9 Drift Ratio(%)
Mom
ent (
kip-
in)
Figure 4-16: Moment-drift ratio response for Specimen LB8-FB with damage milestones
Hairline cracks were first observed along the beam-column interface in Cycle 1
(0.19%/-0.17%). Hairline flexural cracks formed up the lower 20 inches of the column
with each successive cycle. Cracks ≥ 0.003 inches formed above the interface during
Cycle 4 (0.21%/-0.23%). Measured crack widths at various cycles are reported in Table
4-5. The crack at the interface significantly exceeded those up the column.
54
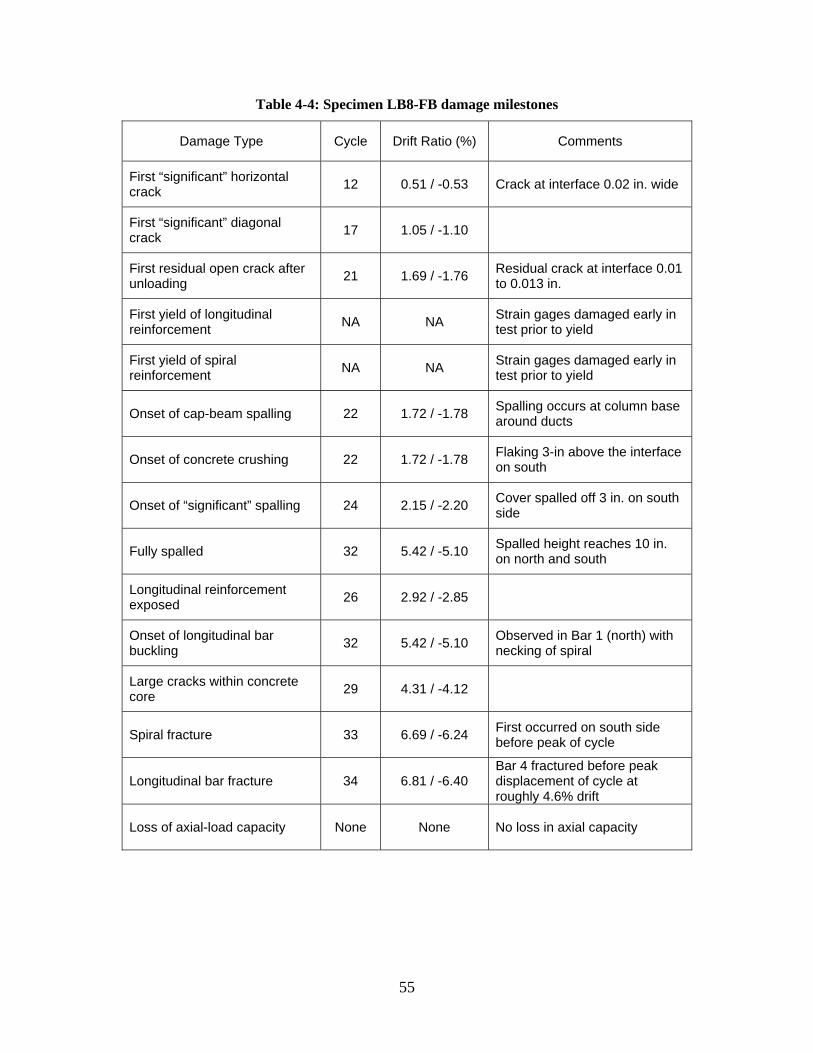
Table 4-4: Specimen LB8-FB damage milestones
Damage Type Cycle Drift Ratio (%) Comments
First “significant” horizontal crack 12 0.51 / -0.53 Crack at interface 0.02 in. wide
First “significant” diagonal crack 17 1.05 / -1.10
First residual open crack after unloading 21 1.69 / -1.76 Residual crack at interface 0.01
to 0.013 in.
First yield of longitudinal reinforcement NA NA Strain gages damaged early in
test prior to yield
First yield of spiral reinforcement NA NA Strain gages damaged early in
test prior to yield
Onset of cap-beam spalling 22 1.72 / -1.78 Spalling occurs at column base around ducts
Onset of concrete crushing 22 1.72 / -1.78 Flaking 3-in above the interface on south
Onset of “significant” spalling 24 2.15 / -2.20 Cover spalled off 3 in. on south side
Fully spalled 32 5.42 / -5.10 Spalled height reaches 10 in. on north and south
Longitudinal reinforcement exposed 26 2.92 / -2.85
Onset of longitudinal bar buckling 32 5.42 / -5.10 Observed in Bar 1 (north) with
necking of spiral
Large cracks within concrete core 29 4.31 / -4.12
Spiral fracture 33 6.69 / -6.24 First occurred on south side before peak of cycle
Longitudinal bar fracture 34 6.81 / -6.40 Bar 4 fractured before peak displacement of cycle at roughly 4.6% drift
Loss of axial-load capacity None None No loss in axial capacity
55
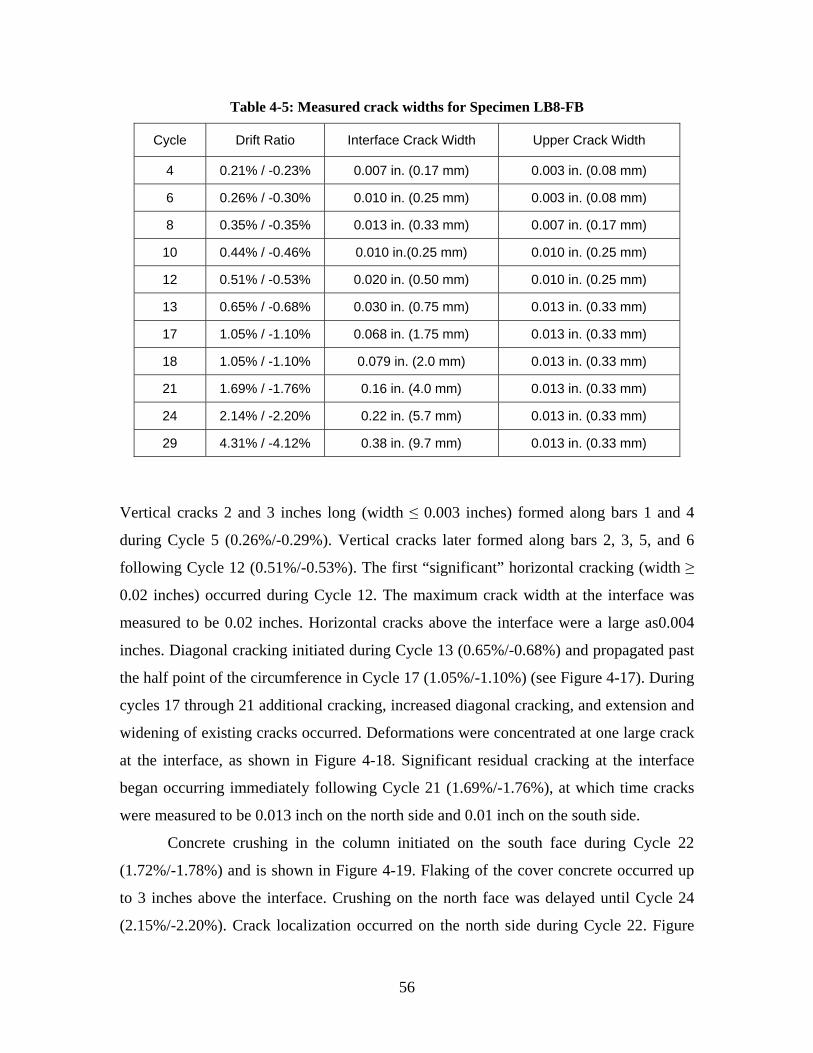
Table 4-5: Measured crack widths for Specimen LB8-FB
Cycle Drift Ratio Interface Crack Width Upper Crack Width
4 0.21% / -0.23% 0.007 in. (0.17 mm) 0.003 in. (0.08 mm)
6 0.26% / -0.30% 0.010 in. (0.25 mm) 0.003 in. (0.08 mm)
8 0.35% / -0.35% 0.013 in. (0.33 mm) 0.007 in. (0.17 mm)
10 0.44% / -0.46% 0.010 in.(0.25 mm) 0.010 in. (0.25 mm)
12 0.51% / -0.53% 0.020 in. (0.50 mm) 0.010 in. (0.25 mm)
13 0.65% / -0.68% 0.030 in. (0.75 mm) 0.013 in. (0.33 mm)
17 1.05% / -1.10% 0.068 in. (1.75 mm) 0.013 in. (0.33 mm)
18 1.05% / -1.10% 0.079 in. (2.0 mm) 0.013 in. (0.33 mm)
21 1.69% / -1.76% 0.16 in. (4.0 mm) 0.013 in. (0.33 mm)
24 2.14% / -2.20% 0.22 in. (5.7 mm) 0.013 in. (0.33 mm)
29 4.31% / -4.12% 0.38 in. (9.7 mm) 0.013 in. (0.33 mm)
Vertical cracks 2 and 3 inches long (width ≤ 0.003 inches) formed along bars 1 and 4
during Cycle 5 (0.26%/-0.29%). Vertical cracks later formed along bars 2, 3, 5, and 6
following Cycle 12 (0.51%/-0.53%). The first “significant” horizontal cracking (width ≥
0.02 inches) occurred during Cycle 12. The maximum crack width at the interface was
measured to be 0.02 inches. Horizontal cracks above the interface were a large as0.004
inches. Diagonal cracking initiated during Cycle 13 (0.65%/-0.68%) and propagated past
the half point of the circumference in Cycle 17 (1.05%/-1.10%) (see Figure 4-17). During
cycles 17 through 21 additional cracking, increased diagonal cracking, and extension and
widening of existing cracks occurred. Deformations were concentrated at one large crack
at the interface, as shown in Figure 4-18. Significant residual cracking at the interface
began occurring immediately following Cycle 21 (1.69%/-1.76%), at which time cracks
were measured to be 0.013 inch on the north side and 0.01 inch on the south side.
Concrete crushing in the column initiated on the south face during Cycle 22
(1.72%/-1.78%) and is shown in Figure 4-19. Flaking of the cover concrete occurred up
to 3 inches above the interface. Crushing on the north face was delayed until Cycle 24
(2.15%/-2.20%). Crack localization occurred on the north side during Cycle 22. Figure
56
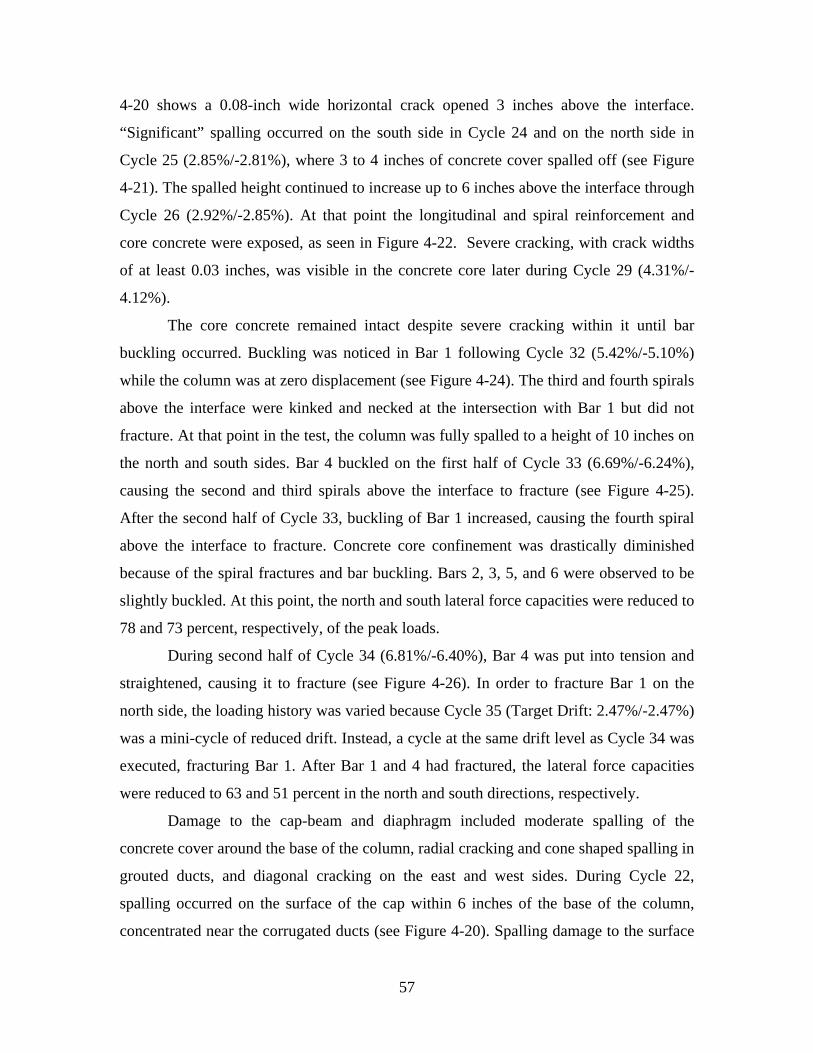
4-20 shows a 0.08-inch wide horizontal crack opened 3 inches above the interface.
“Significant” spalling occurred on the south side in Cycle 24 and on the north side in
Cycle 25 (2.85%/-2.81%), where 3 to 4 inches of concrete cover spalled off (see Figure
4-21). The spalled height continued to increase up to 6 inches above the interface through
Cycle 26 (2.92%/-2.85%). At that point the longitudinal and spiral reinforcement and
core concrete were exposed, as seen in Figure 4-22. Severe cracking, with crack widths
of at least 0.03 inches, was visible in the concrete core later during Cycle 29 (4.31%/-
4.12%).
The core concrete remained intact despite severe cracking within it until bar
buckling occurred. Buckling was noticed in Bar 1 following Cycle 32 (5.42%/-5.10%)
while the column was at zero displacement (see Figure 4-24). The third and fourth spirals
above the interface were kinked and necked at the intersection with Bar 1 but did not
fracture. At that point in the test, the column was fully spalled to a height of 10 inches on
the north and south sides. Bar 4 buckled on the first half of Cycle 33 (6.69%/-6.24%),
causing the second and third spirals above the interface to fracture (see Figure 4-25).
After the second half of Cycle 33, buckling of Bar 1 increased, causing the fourth spiral
above the interface to fracture. Concrete core confinement was drastically diminished
because of the spiral fractures and bar buckling. Bars 2, 3, 5, and 6 were observed to be
slightly buckled. At this point, the north and south lateral force capacities were reduced to
78 and 73 percent, respectively, of the peak loads.
During second half of Cycle 34 (6.81%/-6.40%), Bar 4 was put into tension and
straightened, causing it to fracture (see Figure 4-26). In order to fracture Bar 1 on the
north side, the loading history was varied because Cycle 35 (Target Drift: 2.47%/-2.47%)
was a mini-cycle of reduced drift. Instead, a cycle at the same drift level as Cycle 34 was
executed, fracturing Bar 1. After Bar 1 and 4 had fractured, the lateral force capacities
were reduced to 63 and 51 percent in the north and south directions, respectively.
Damage to the cap-beam and diaphragm included moderate spalling of the
concrete cover around the base of the column, radial cracking and cone shaped spalling in
grouted ducts, and diagonal cracking on the east and west sides. During Cycle 22,
spalling occurred on the surface of the cap within 6 inches of the base of the column,
concentrated near the corrugated ducts (see Figure 4-20). Spalling damage to the surface
57
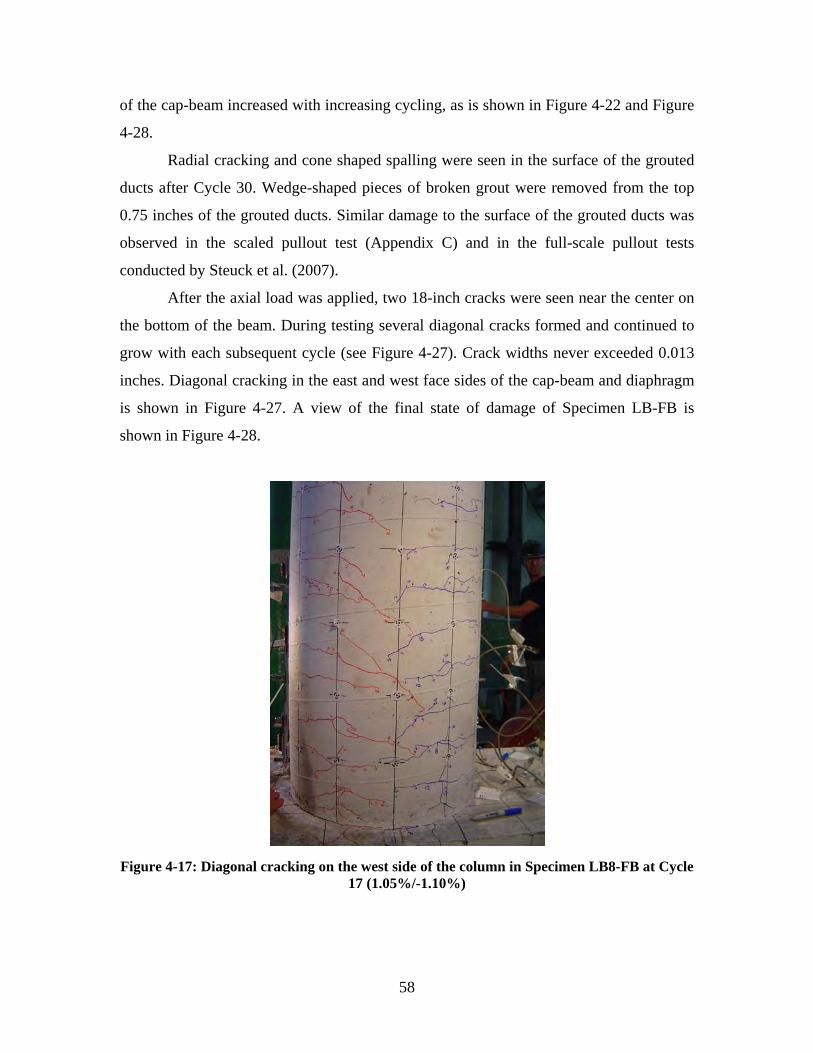
of the cap-beam increased with increasing cycling, as is shown in Figure 4-22 and Figure
4-28.
Radial cracking and cone shaped spalling were seen in the surface of the grouted
ducts after Cycle 30. Wedge-shaped pieces of broken grout were removed from the top
0.75 inches of the grouted ducts. Similar damage to the surface of the grouted ducts was
observed in the scaled pullout test (Appendix C) and in the full-scale pullout tests
conducted by Steuck et al. (2007).
After the axial load was applied, two 18-inch cracks were seen near the center on
the bottom of the beam. During testing several diagonal cracks formed and continued to
grow with each subsequent cycle (see Figure 4-27). Crack widths never exceeded 0.013
inches. Diagonal cracking in the east and west face sides of the cap-beam and diaphragm
is shown in Figure 4-27. A view of the final state of damage of Specimen LB-FB is
shown in Figure 4-28.
Figure 4-17: Diagonal cracking on the west side of the column in Specimen LB8-FB at Cycle 17 (1.05%/-1.10%)
58
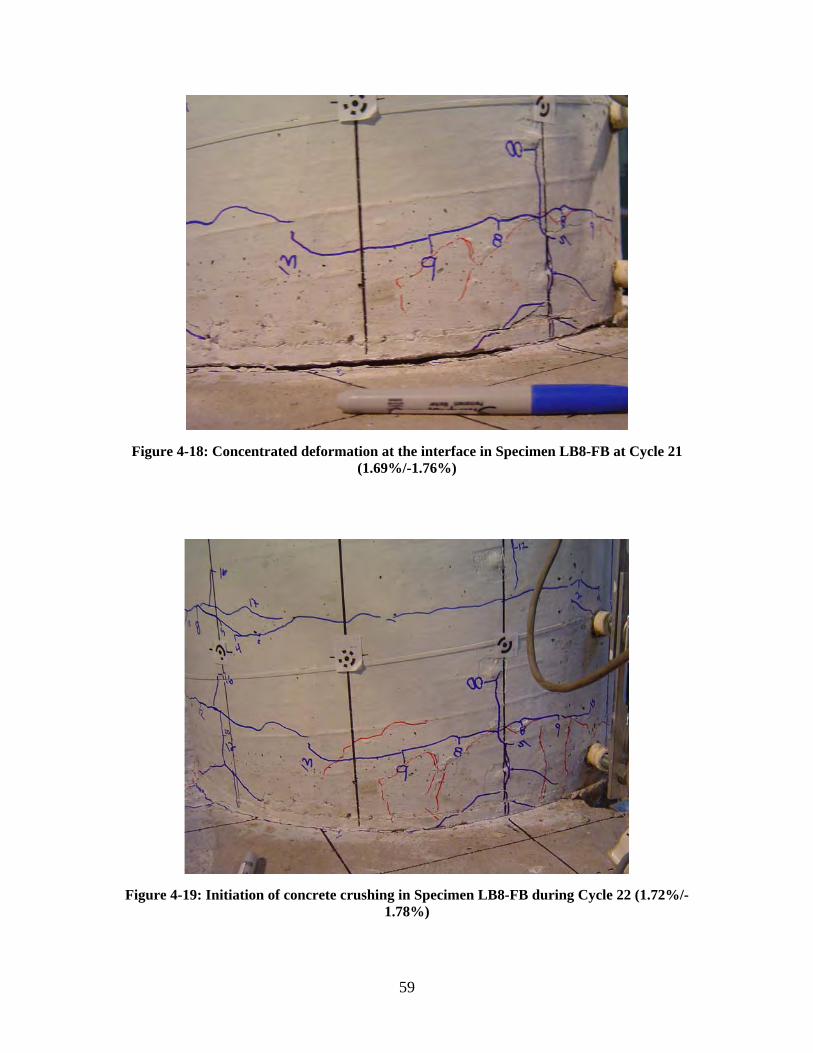
Figure 4-18: Concentrated deformation at the interface in Specimen LB8-FB at Cycle 21 (1.69%/-1.76%)
Figure 4-19: Initiation of concrete crushing in Specimen LB8-FB during Cycle 22 (1.72%/-1.78%)
59
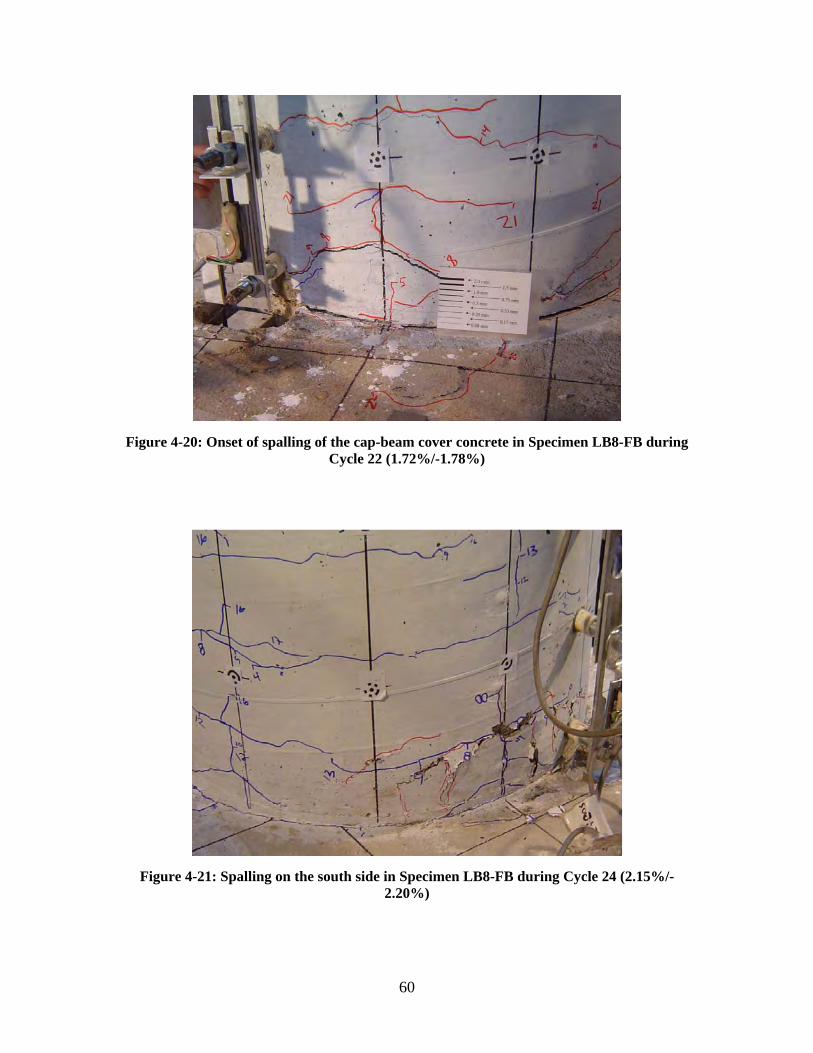
Figure 4-20: Onset of spalling of the cap-beam cover concrete in Specimen LB8-FB during Cycle 22 (1.72%/-1.78%)
Figure 4-21: Spalling on the south side in Specimen LB8-FB during Cycle 24 (2.15%/-2.20%)
60
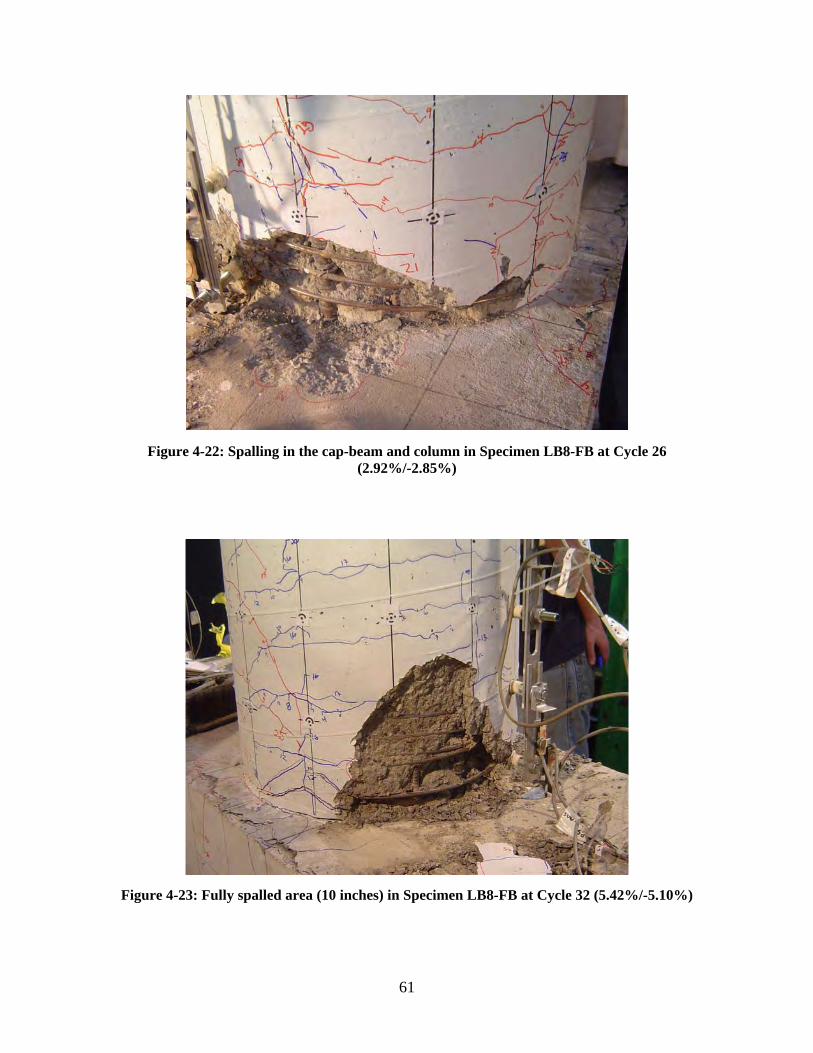
Figure 4-22: Spalling in the cap-beam and column in Specimen LB8-FB at Cycle 26 (2.92%/-2.85%)
Figure 4-23: Fully spalled area (10 inches) in Specimen LB8-FB at Cycle 32 (5.42%/-5.10%)
61
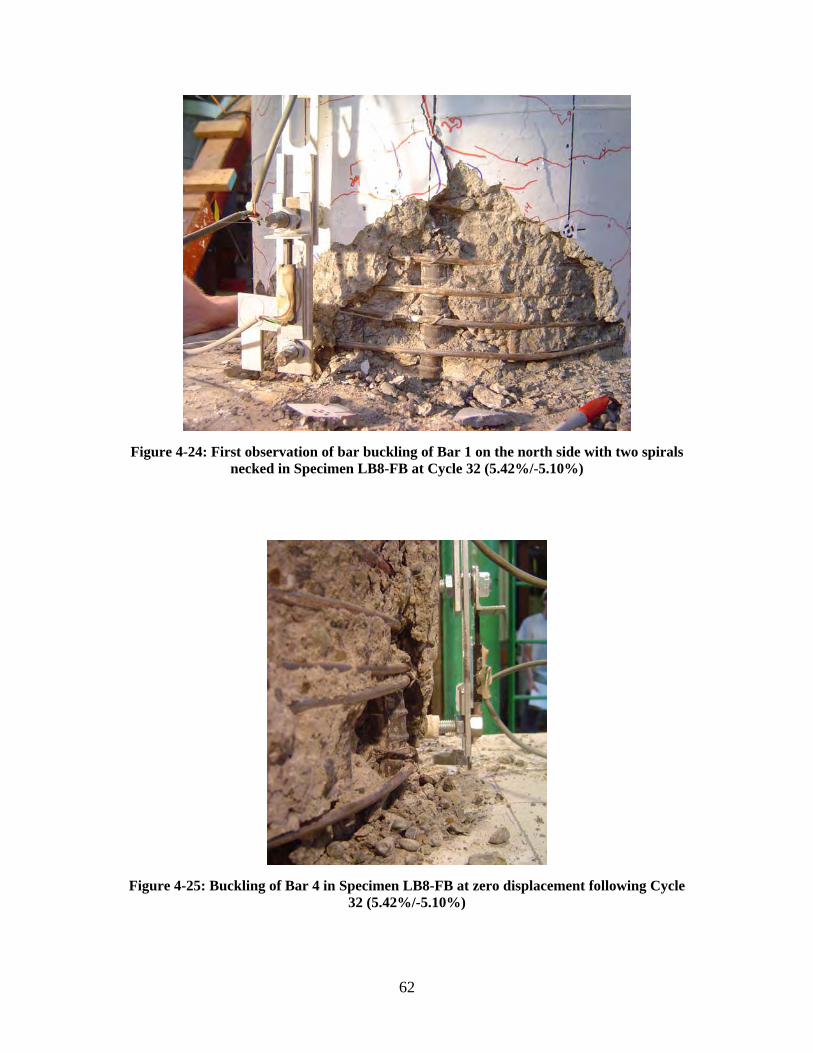
Figure 4-24: First observation of bar buckling of Bar 1 on the north side with two spirals necked in Specimen LB8-FB at Cycle 32 (5.42%/-5.10%)
Figure 4-25: Buckling of Bar 4 in Specimen LB8-FB at zero displacement following Cycle 32 (5.42%/-5.10%)
62
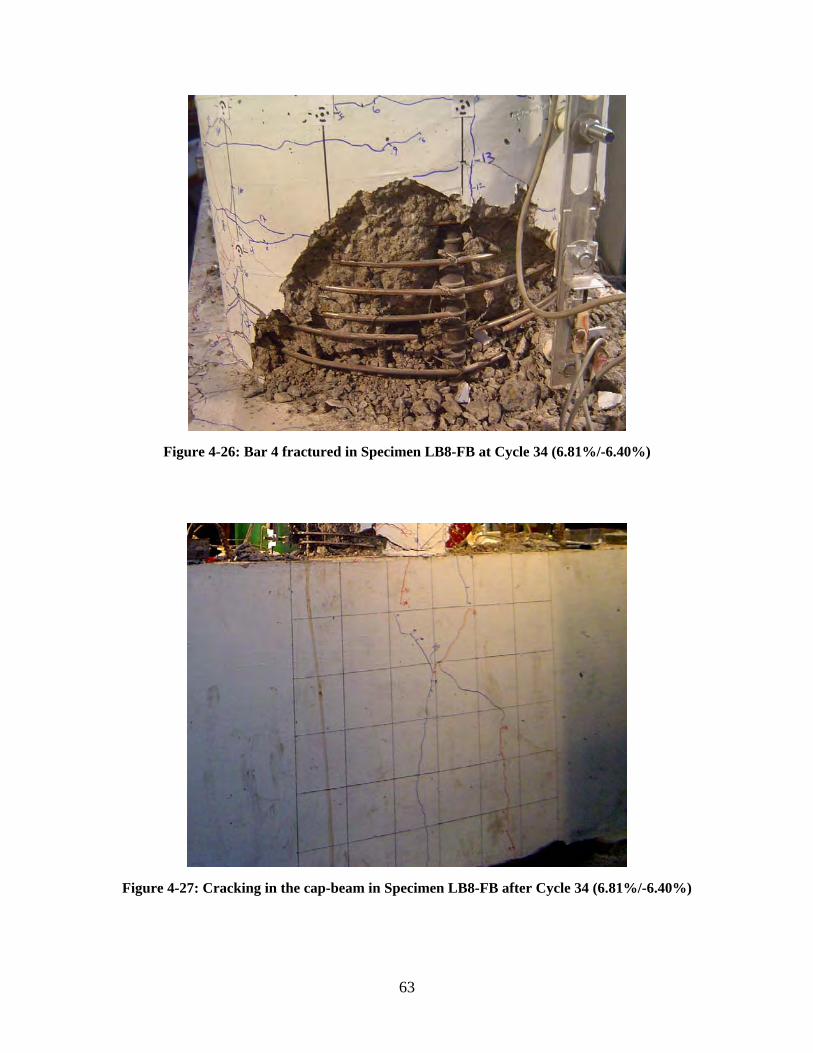
Figure 4-26: Bar 4 fractured in Specimen LB8-FB at Cycle 34 (6.81%/-6.40%)
Figure 4-27: Cracking in the cap-beam in Specimen LB8-FB after Cycle 34 (6.81%/-6.40%)
63
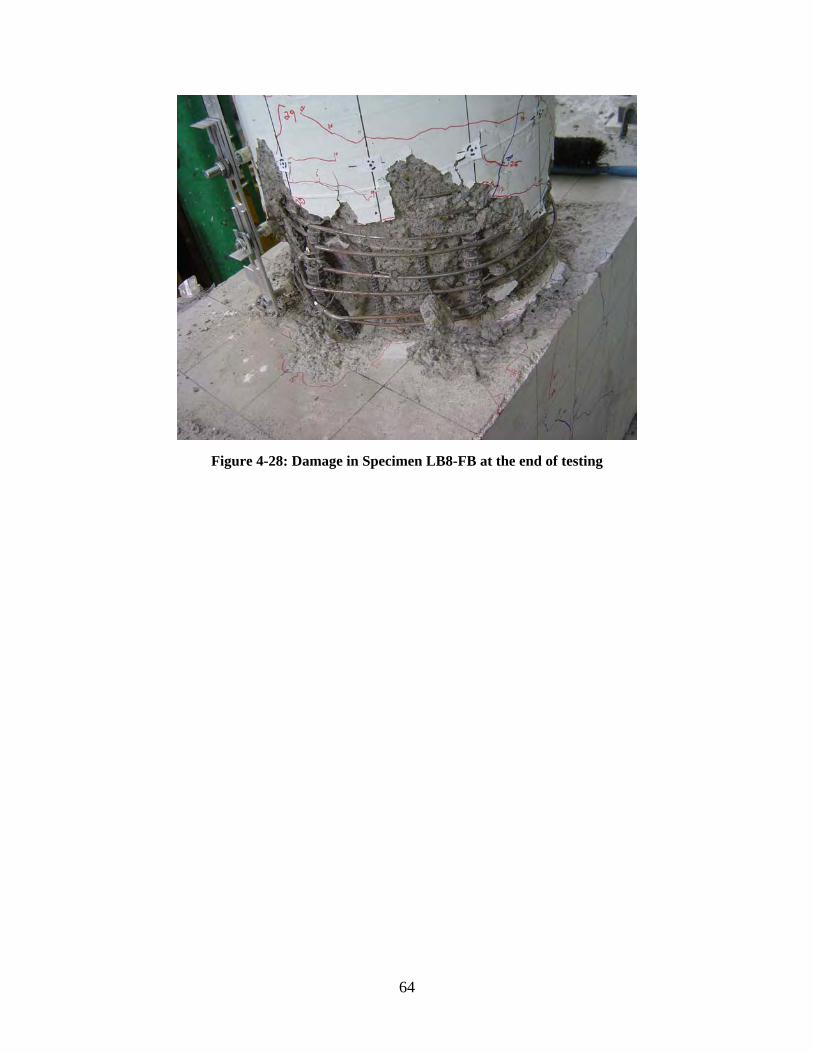
Figure 4-28: Damage in Specimen LB8-FB at the end of testing
64
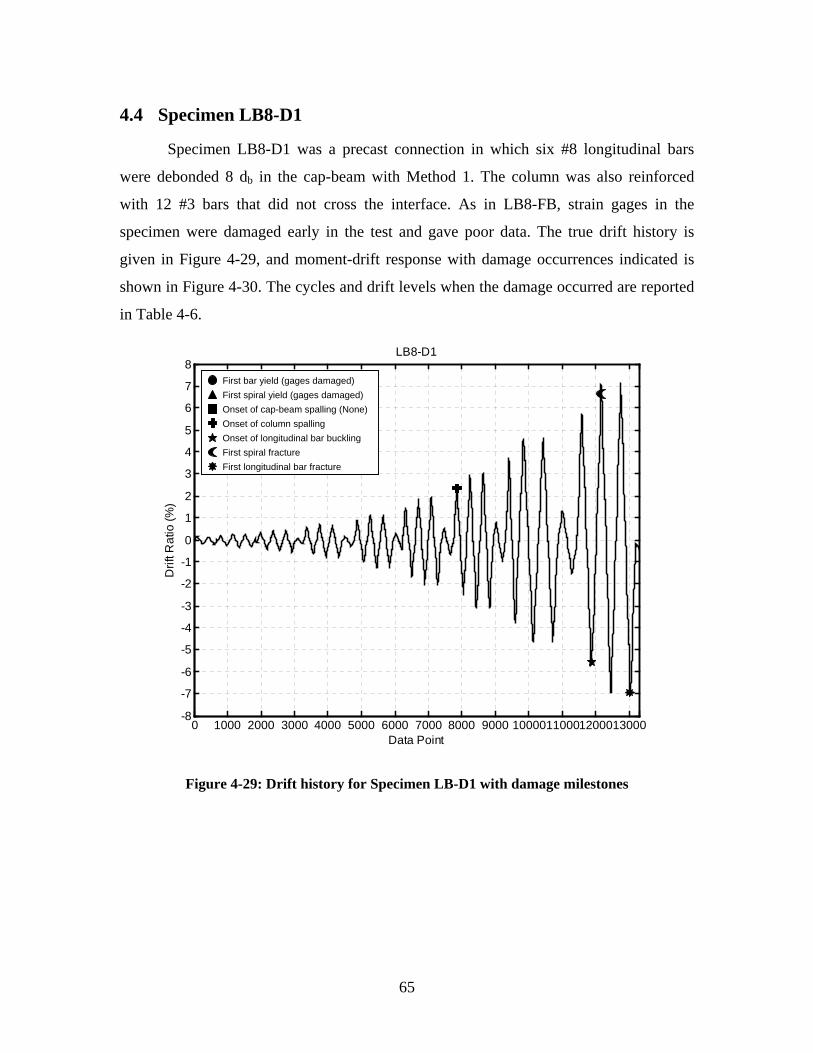
4.4 Specimen LB8-D1
Specimen LB8-D1 was a precast connection in which six #8 longitudinal bars
were debonded 8 db in the cap-beam with Method 1. The column was also reinforced
with 12 #3 bars that did not cross the interface. As in LB8-FB, strain gages in the
specimen were damaged early in the test and gave poor data. The true drift history is
given in Figure 4-29, and moment-drift response with damage occurrences indicated is
shown in Figure 4-30. The cycles and drift levels when the damage occurred are reported
in Table 4-6.
-8
-7
-6
-5
-4
-3
-2
-1
0
1
2
3
4
5
6
7
8
Drif
t Rat
io (%
)
LB8-D1
First bar yield (gages damaged) First spiral yield (gages damaged) Onset of cap-beam spalling (None) Onset of column spalling Onset of longitudinal bar buckling First spiral fracture First longitudinal bar fracture
0 1000 2000 3000 4000 5000 6000 7000 8000 9000 10000110001200013000 Data Point
Figure 4-29: Drift history for Specimen LB-D1 with damage milestones
65
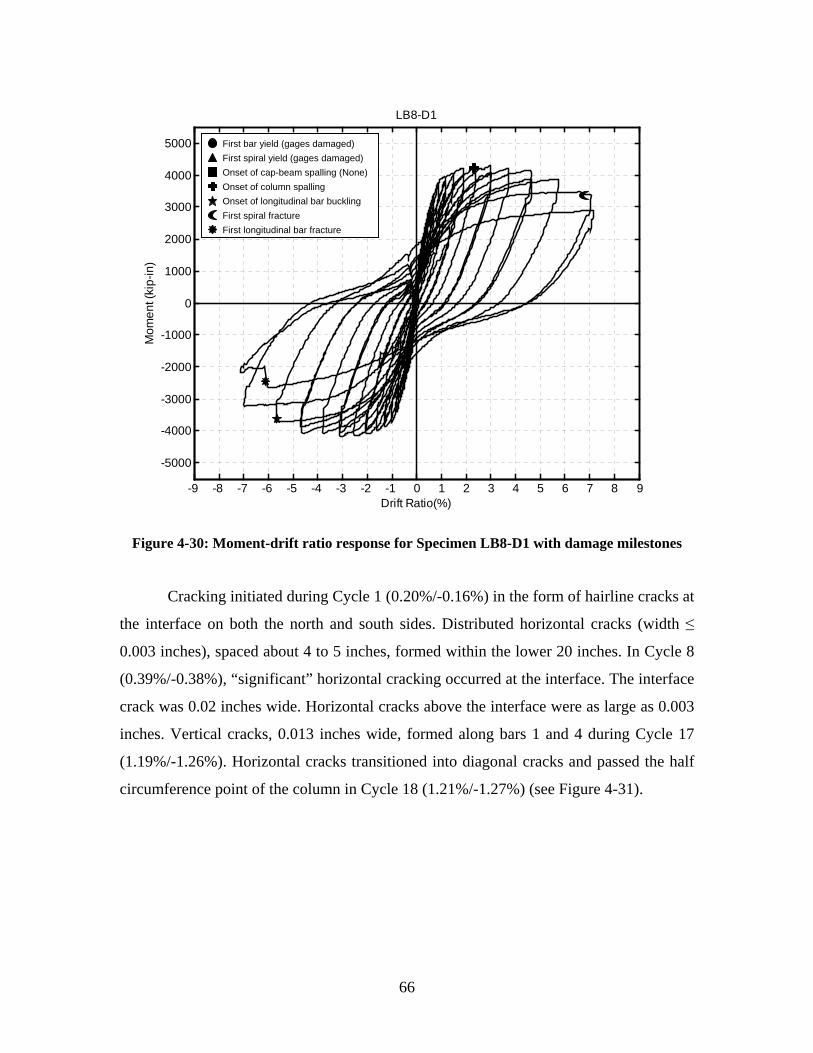
LB8-D1
5000 First bar yield (gages damaged) First spiral yield (gages damaged) Onset of cap-beam spalling (None)4000 Onset of column spalling Onset of longitudinal bar buckling3000 First spiral fracture First longitudinal bar fracture
2000
1000
0
-1000
-2000
-3000
-4000
-5000
-9 -8 -7 -6 -5 -4 -3 -2 -1 0 1 2 3 4 5 6 7 8 9
Mom
ent (
kip-
in)
Drift Ratio(%)
Figure 4-30: Moment-drift ratio response for Specimen LB8-D1 with damage milestones
Cracking initiated during Cycle 1 (0.20%/-0.16%) in the form of hairline cracks at
the interface on both the north and south sides. Distributed horizontal cracks (width ≤
0.003 inches), spaced about 4 to 5 inches, formed within the lower 20 inches. In Cycle 8
(0.39%/-0.38%), “significant” horizontal cracking occurred at the interface. The interface
crack was 0.02 inches wide. Horizontal cracks above the interface were as large as 0.003
inches. Vertical cracks, 0.013 inches wide, formed along bars 1 and 4 during Cycle 17
(1.19%/-1.26%). Horizontal cracks transitioned into diagonal cracks and passed the half
circumference point of the column in Cycle 18 (1.21%/-1.27%) (see Figure 4-31).
66
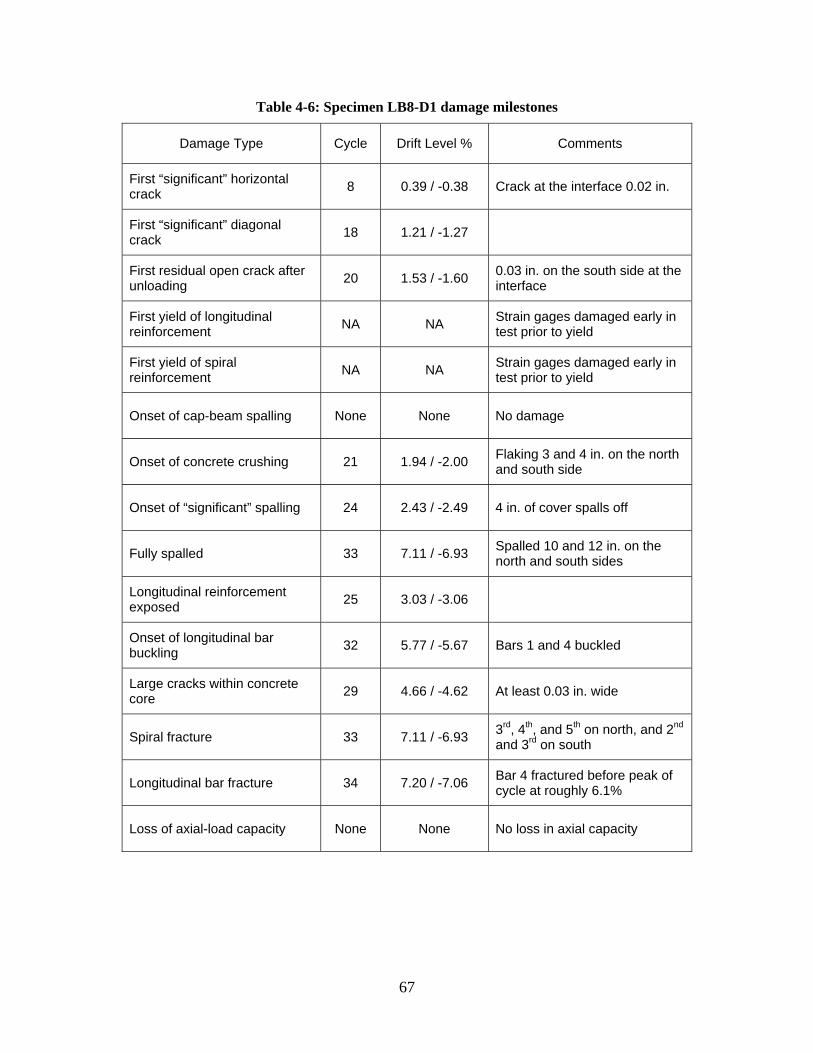
Table 4-6: Specimen LB8-D1 damage milestones
Damage Type Cycle Drift Level % Comments
First “significant” horizontal crack 8 0.39 / -0.38 Crack at the interface 0.02 in.
First “significant” diagonal crack 18 1.21 / -1.27
First residual open crack after unloading 20 1.53 / -1.60 0.03 in. on the south side at the
interface
First yield of longitudinal reinforcement NA NA Strain gages damaged early in
test prior to yield
First yield of spiral reinforcement NA NA Strain gages damaged early in
test prior to yield
Onset of cap-beam spalling None None No damage
Onset of concrete crushing 21 1.94 / -2.00 Flaking 3 and 4 in. on the north and south side
Onset of “significant” spalling 24 2.43 / -2.49 4 in. of cover spalls off
Fully spalled 33 7.11 / -6.93 Spalled 10 and 12 in. on the north and south sides
Longitudinal reinforcement exposed 25 3.03 / -3.06
Onset of longitudinal bar buckling 32 5.77 / -5.67 Bars 1 and 4 buckled
Large cracks within concrete core 29 4.66 / -4.62 At least 0.03 in. wide
Spiral fracture 33 7.11 / -6.93 3rd, 4th, and 5th on north, and 2nd
and 3rd on south
Longitudinal bar fracture 34 7.20 / -7.06 Bar 4 fractured before peak of cycle at roughly 6.1%
Loss of axial-load capacity None None No loss in axial capacity
67
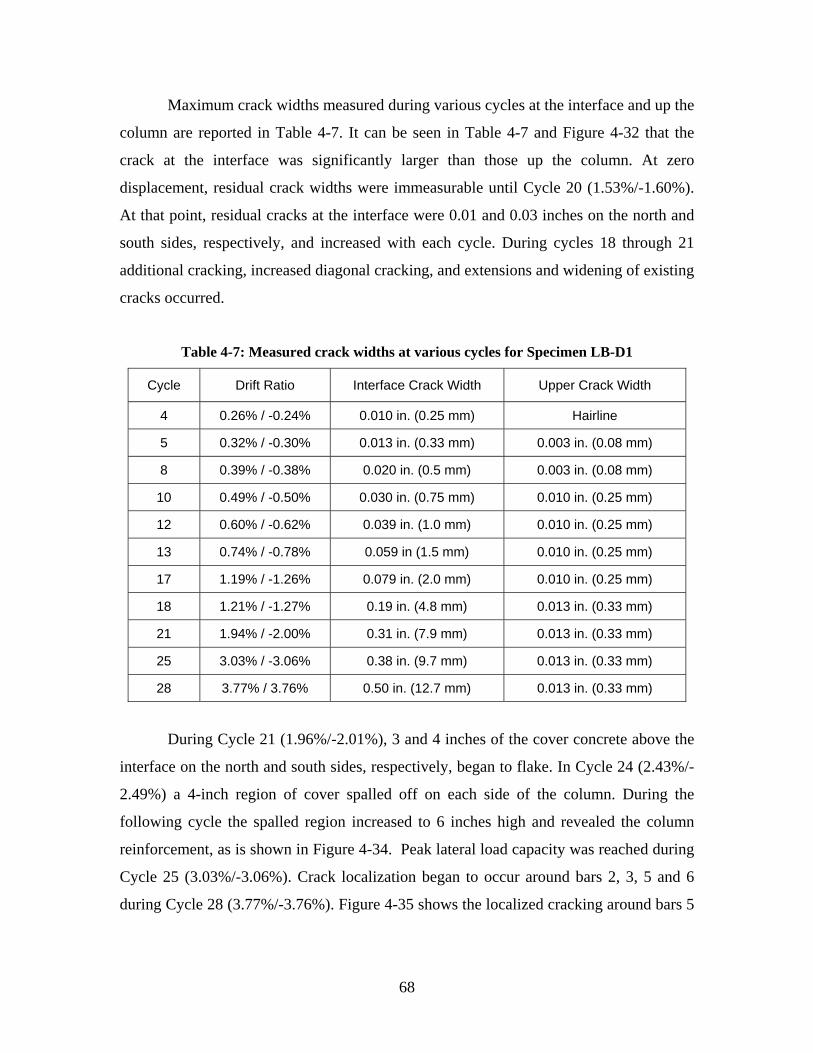
Maximum crack widths measured during various cycles at the interface and up the
column are reported in Table 4-7. It can be seen in Table 4-7 and Figure 4-32 that the
crack at the interface was significantly larger than those up the column. At zero
displacement, residual crack widths were immeasurable until Cycle 20 (1.53%/-1.60%).
At that point, residual cracks at the interface were 0.01 and 0.03 inches on the north and
south sides, respectively, and increased with each cycle. During cycles 18 through 21
additional cracking, increased diagonal cracking, and extensions and widening of existing
cracks occurred.
Table 4-7: Measured crack widths at various cycles for Specimen LB-D1
Cycle Drift Ratio Interface Crack Width Upper Crack Width
4 0.26% / -0.24% 0.010 in. (0.25 mm) Hairline
5 0.32% / -0.30% 0.013 in. (0.33 mm) 0.003 in. (0.08 mm)
8 0.39% / -0.38% 0.020 in. (0.5 mm) 0.003 in. (0.08 mm)
10 0.49% / -0.50% 0.030 in. (0.75 mm) 0.010 in. (0.25 mm)
12 0.60% / -0.62% 0.039 in. (1.0 mm) 0.010 in. (0.25 mm)
13 0.74% / -0.78% 0.059 in (1.5 mm) 0.010 in. (0.25 mm)
17 1.19% / -1.26% 0.079 in. (2.0 mm) 0.010 in. (0.25 mm)
18 1.21% / -1.27% 0.19 in. (4.8 mm) 0.013 in. (0.33 mm)
21 1.94% / -2.00% 0.31 in. (7.9 mm) 0.013 in. (0.33 mm)
25 3.03% / -3.06% 0.38 in. (9.7 mm) 0.013 in. (0.33 mm)
28 3.77% / 3.76% 0.50 in. (12.7 mm) 0.013 in. (0.33 mm)
During Cycle 21 (1.96%/-2.01%), 3 and 4 inches of the cover concrete above the
interface on the north and south sides, respectively, began to flake. In Cycle 24 (2.43%/-
2.49%) a 4-inch region of cover spalled off on each side of the column. During the
following cycle the spalled region increased to 6 inches high and revealed the column
reinforcement, as is shown in Figure 4-34. Peak lateral load capacity was reached during
Cycle 25 (3.03%/-3.06%). Crack localization began to occur around bars 2, 3, 5 and 6
during Cycle 28 (3.77%/-3.76%). Figure 4-35 shows the localized cracking around bars 5
68
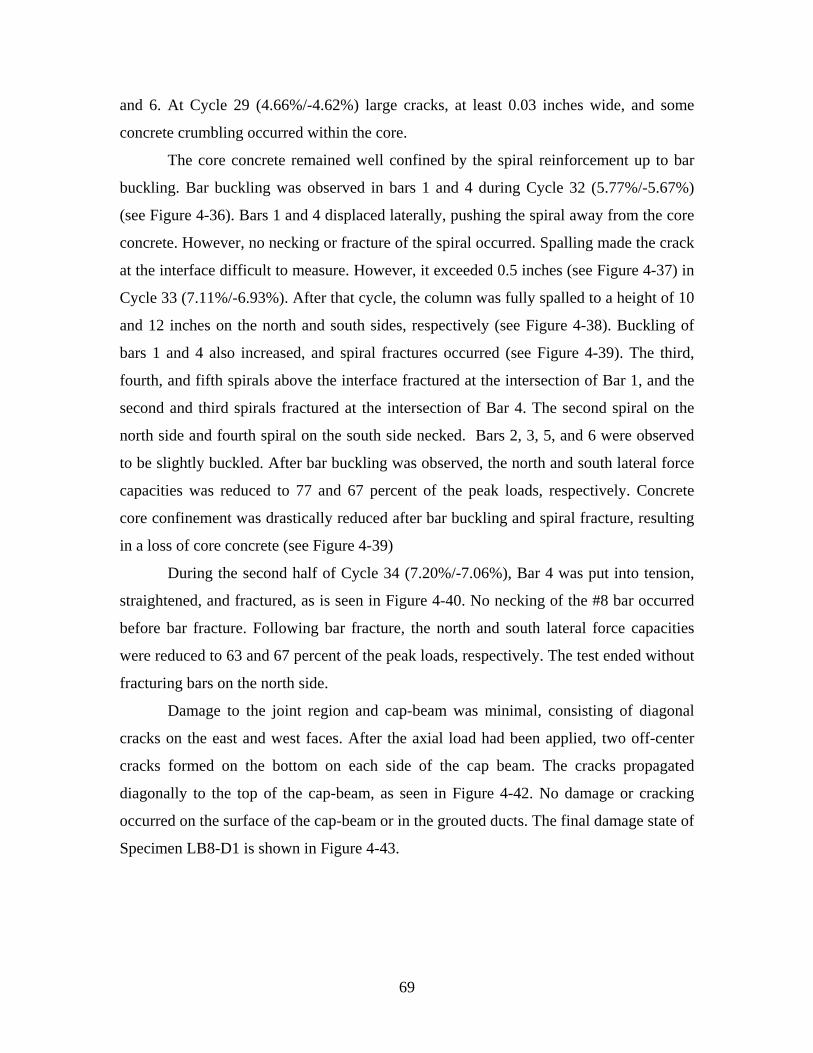
and 6. At Cycle 29 (4.66%/-4.62%) large cracks, at least 0.03 inches wide, and some
concrete crumbling occurred within the core.
The core concrete remained well confined by the spiral reinforcement up to bar
buckling. Bar buckling was observed in bars 1 and 4 during Cycle 32 (5.77%/-5.67%)
(see Figure 4-36). Bars 1 and 4 displaced laterally, pushing the spiral away from the core
concrete. However, no necking or fracture of the spiral occurred. Spalling made the crack
at the interface difficult to measure. However, it exceeded 0.5 inches (see Figure 4-37) in
Cycle 33 (7.11%/-6.93%). After that cycle, the column was fully spalled to a height of 10
and 12 inches on the north and south sides, respectively (see Figure 4-38). Buckling of
bars 1 and 4 also increased, and spiral fractures occurred (see Figure 4-39). The third,
fourth, and fifth spirals above the interface fractured at the intersection of Bar 1, and the
second and third spirals fractured at the intersection of Bar 4. The second spiral on the
north side and fourth spiral on the south side necked. Bars 2, 3, 5, and 6 were observed
to be slightly buckled. After bar buckling was observed, the north and south lateral force
capacities was reduced to 77 and 67 percent of the peak loads, respectively. Concrete
core confinement was drastically reduced after bar buckling and spiral fracture, resulting
in a loss of core concrete (see Figure 4-39)
During the second half of Cycle 34 (7.20%/-7.06%), Bar 4 was put into tension,
straightened, and fractured, as is seen in Figure 4-40. No necking of the #8 bar occurred
before bar fracture. Following bar fracture, the north and south lateral force capacities
were reduced to 63 and 67 percent of the peak loads, respectively. The test ended without
fracturing bars on the north side.
Damage to the joint region and cap-beam was minimal, consisting of diagonal
cracks on the east and west faces. After the axial load had been applied, two off-center
cracks formed on the bottom on each side of the cap beam. The cracks propagated
diagonally to the top of the cap-beam, as seen in Figure 4-42. No damage or cracking
occurred on the surface of the cap-beam or in the grouted ducts. The final damage state of
Specimen LB8-D1 is shown in Figure 4-43.
69
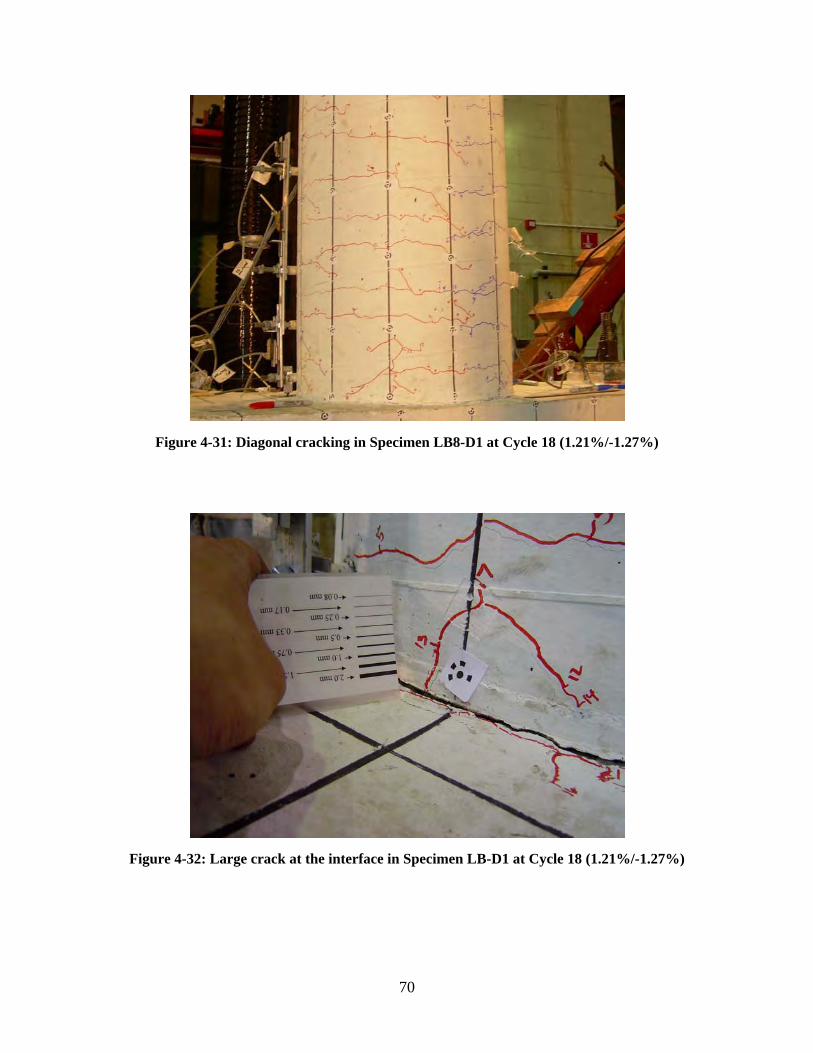
Figure 4-31: Diagonal cracking in Specimen LB8-D1 at Cycle 18 (1.21%/-1.27%)
Figure 4-32: Large crack at the interface in Specimen LB-D1 at Cycle 18 (1.21%/-1.27%)
70
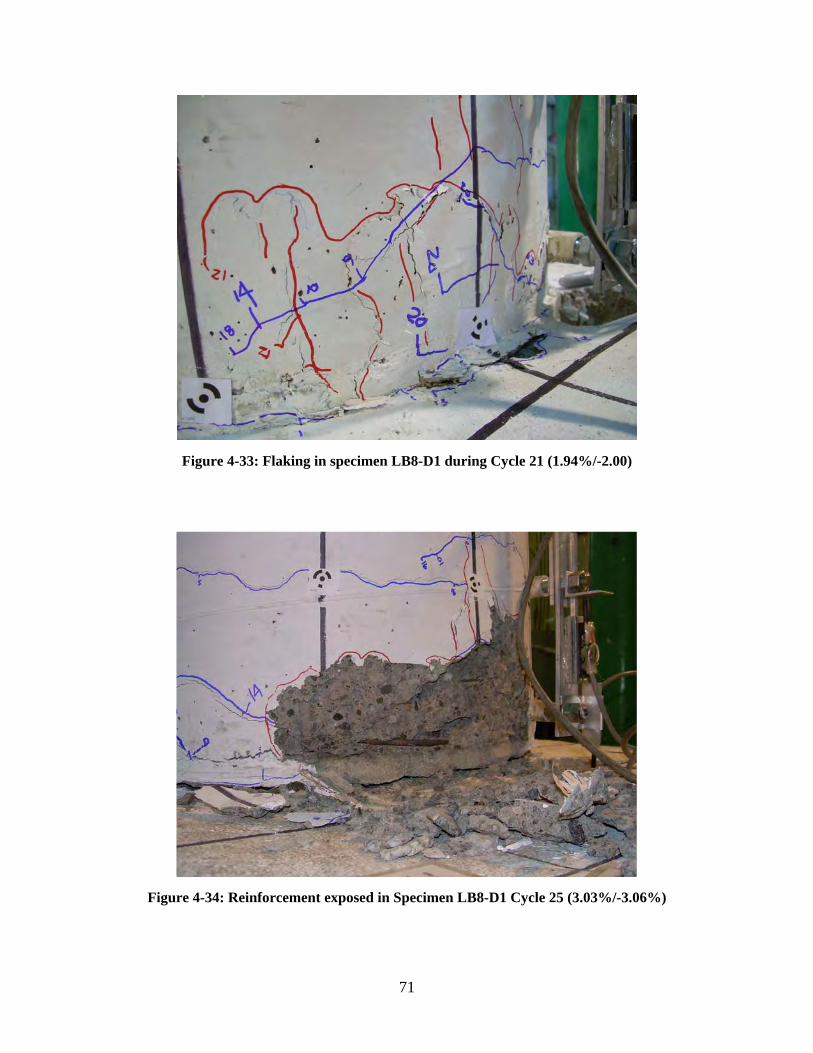
Figure 4-33: Flaking in specimen LB8-D1 during Cycle 21 (1.94%/-2.00)
Figure 4-34: Reinforcement exposed in Specimen LB8-D1 Cycle 25 (3.03%/-3.06%)
71
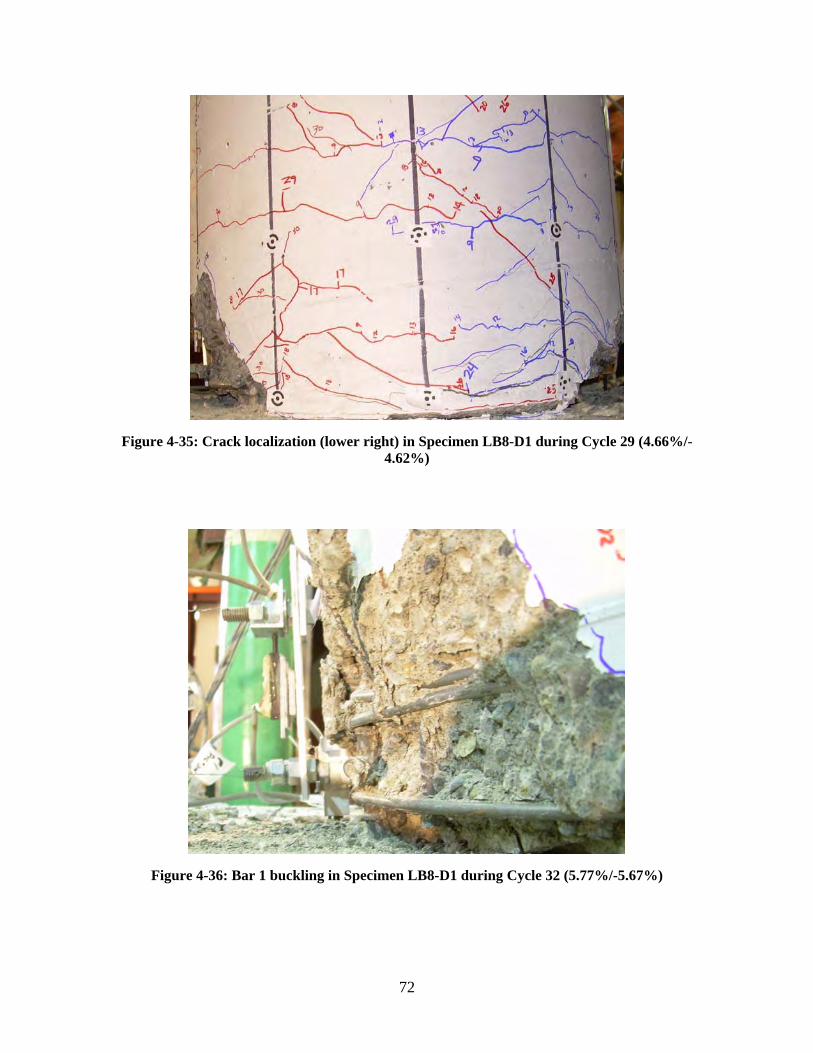
Figure 4-35: Crack localization (lower right) in Specimen LB8-D1 during Cycle 29 (4.66%/-4.62%)
Figure 4-36: Bar 1 buckling in Specimen LB8-D1 during Cycle 32 (5.77%/-5.67%)
72
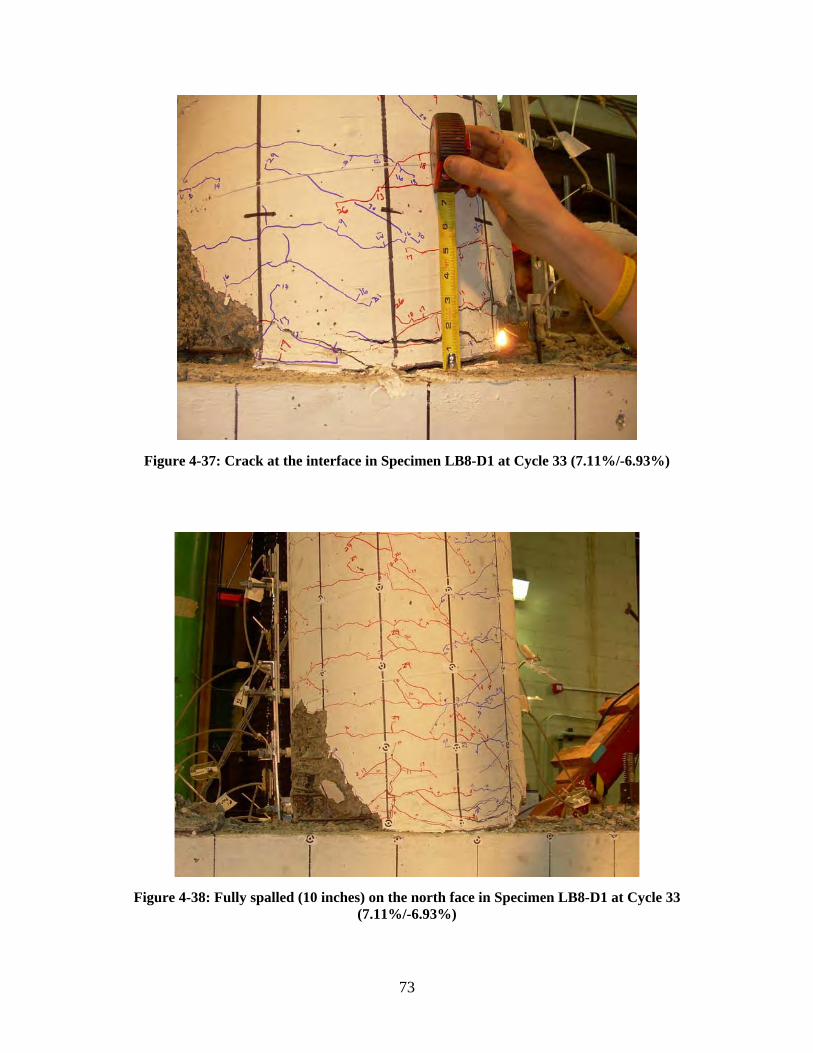
Figure 4-37: Crack at the interface in Specimen LB8-D1 at Cycle 33 (7.11%/-6.93%)
Figure 4-38: Fully spalled (10 inches) on the north face in Specimen LB8-D1 at Cycle 33 (7.11%/-6.93%)
73
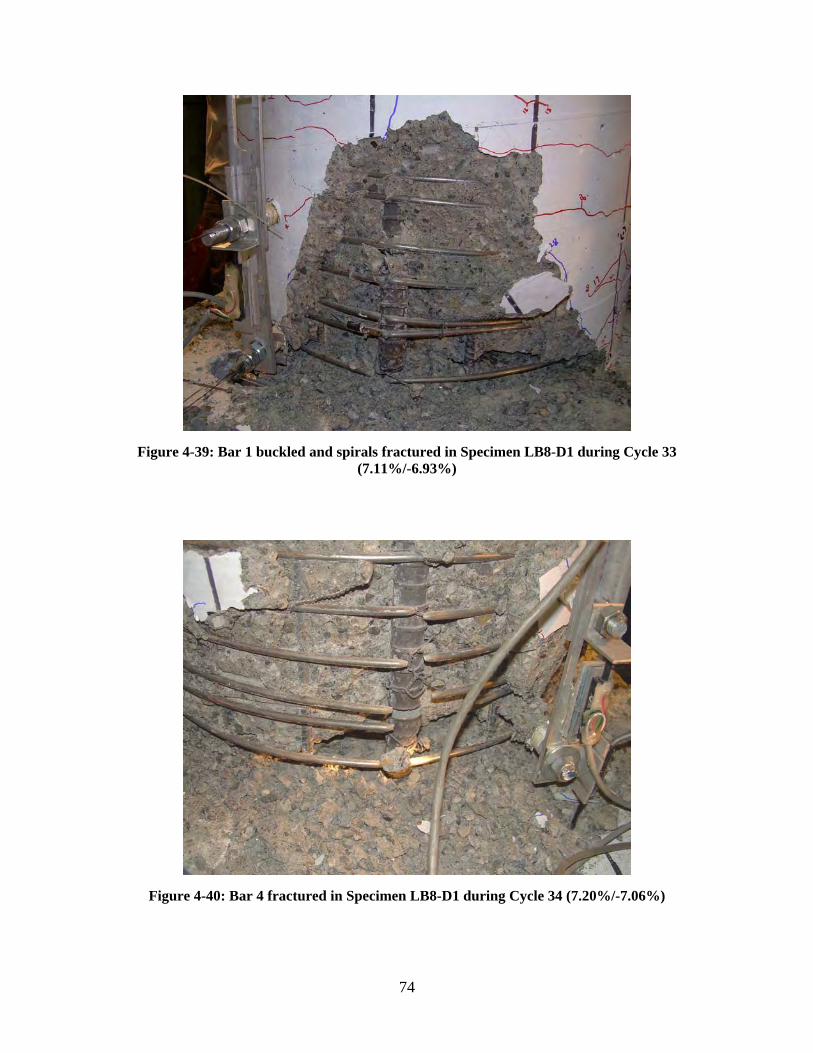
Figure 4-39: Bar 1 buckled and spirals fractured in Specimen LB8-D1 during Cycle 33 (7.11%/-6.93%)
Figure 4-40: Bar 4 fractured in Specimen LB8-D1 during Cycle 34 (7.20%/-7.06%)
74
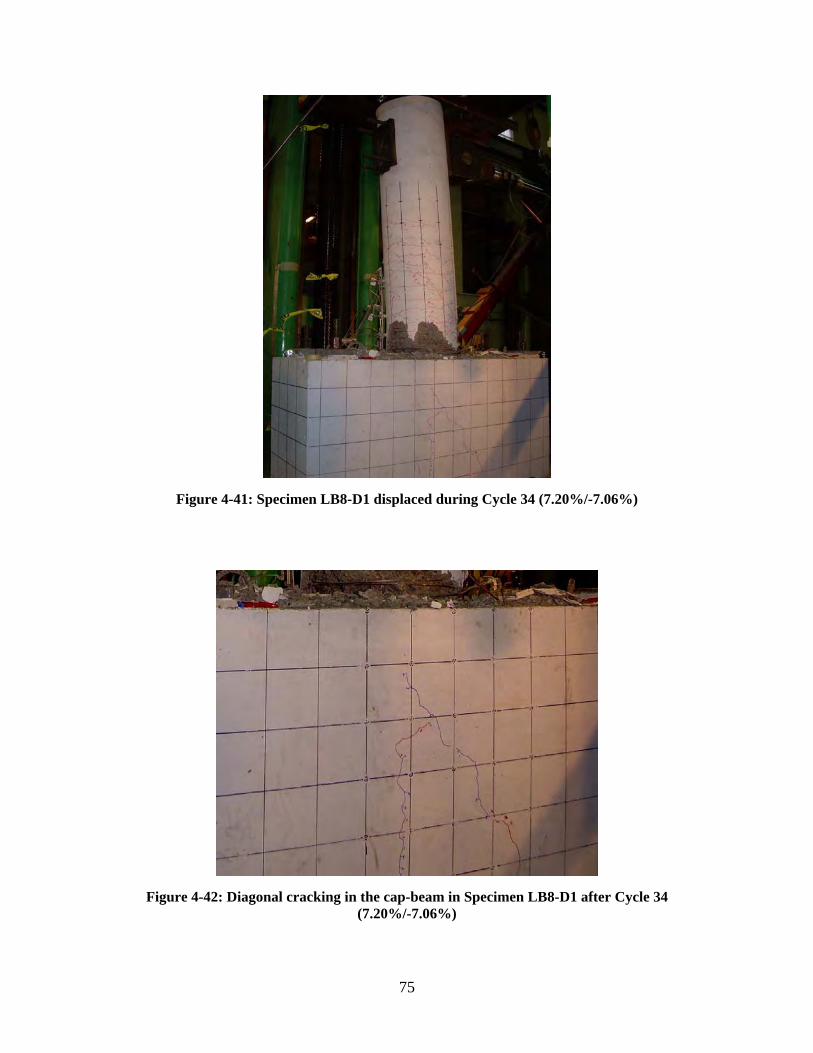
Figure 4-41: Specimen LB8-D1 displaced during Cycle 34 (7.20%/-7.06%)
Figure 4-42: Diagonal cracking in the cap-beam in Specimen LB8-D1 after Cycle 34 (7.20%/-7.06%)
75
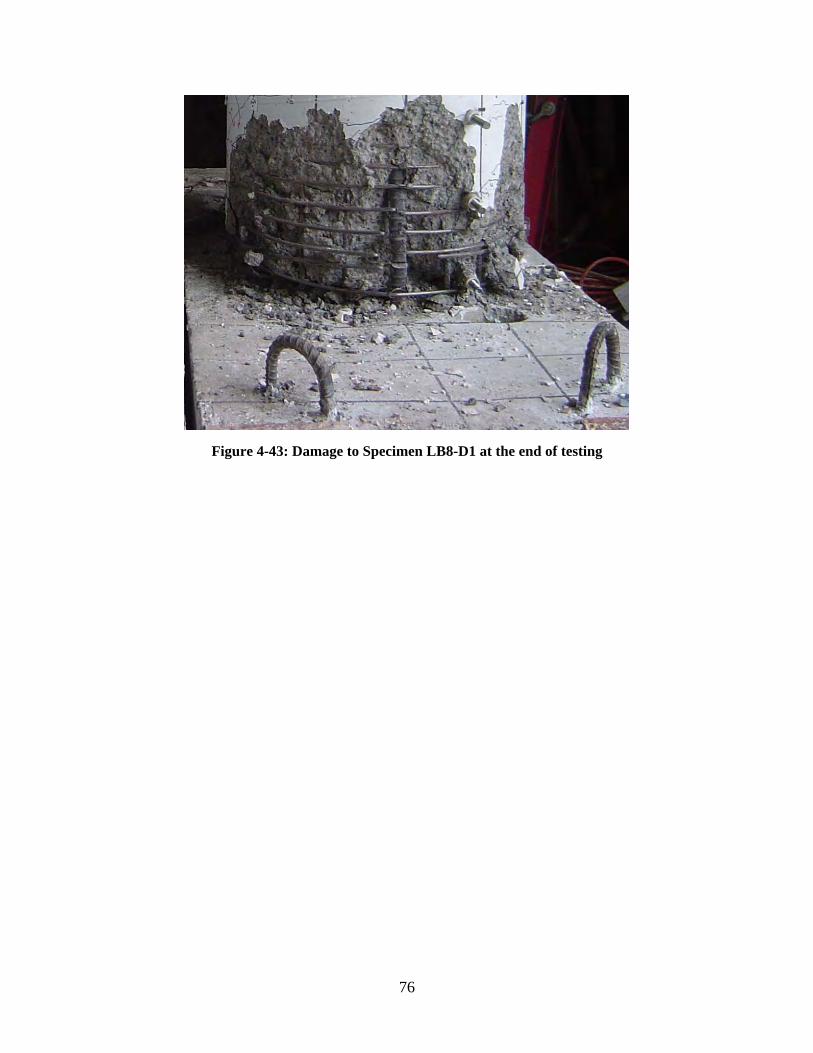
Figure 4-43: Damage to Specimen LB8-D1 at the end of testing
76
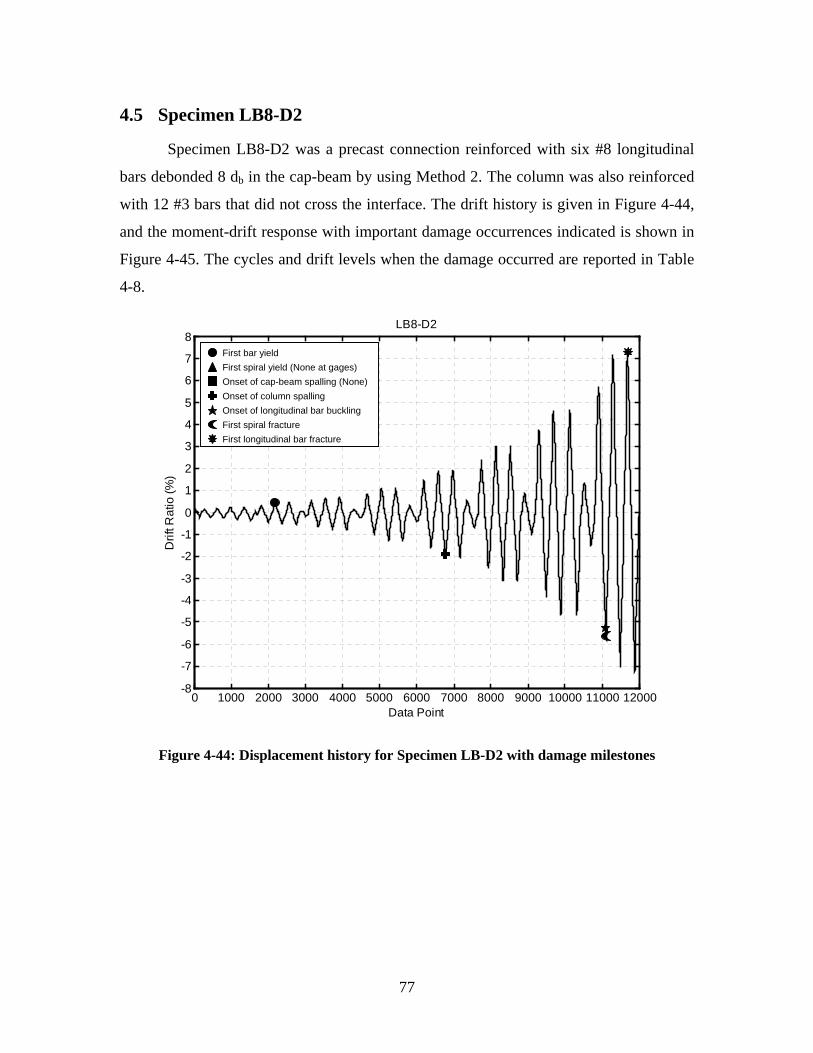
4.5 Specimen LB8-D2
Specimen LB8-D2 was a precast connection reinforced with six #8 longitudinal
bars debonded 8 db in the cap-beam by using Method 2. The column was also reinforced
with 12 #3 bars that did not cross the interface. The drift history is given in Figure 4-44,
and the moment-drift response with important damage occurrences indicated is shown in
Figure 4-45. The cycles and drift levels when the damage occurred are reported in Table
4-8.
LB8-D2
-8
-7
-6
-5
-4
-3
-2
-1
0
1
2
3
4
5
6
7
8
Drif
t Rat
io (%
)
First bar yield First spiral yield (None at gages) Onset of cap-beam spalling (None) Onset of column spalling Onset of longitudinal bar buckling First spiral fracture First longitudinal bar fracture
0 1000 2000 3000 4000 5000 6000 7000 8000 9000 10000 11000 12000 Data Point
Figure 4-44: Displacement history for Specimen LB-D2 with damage milestones
77
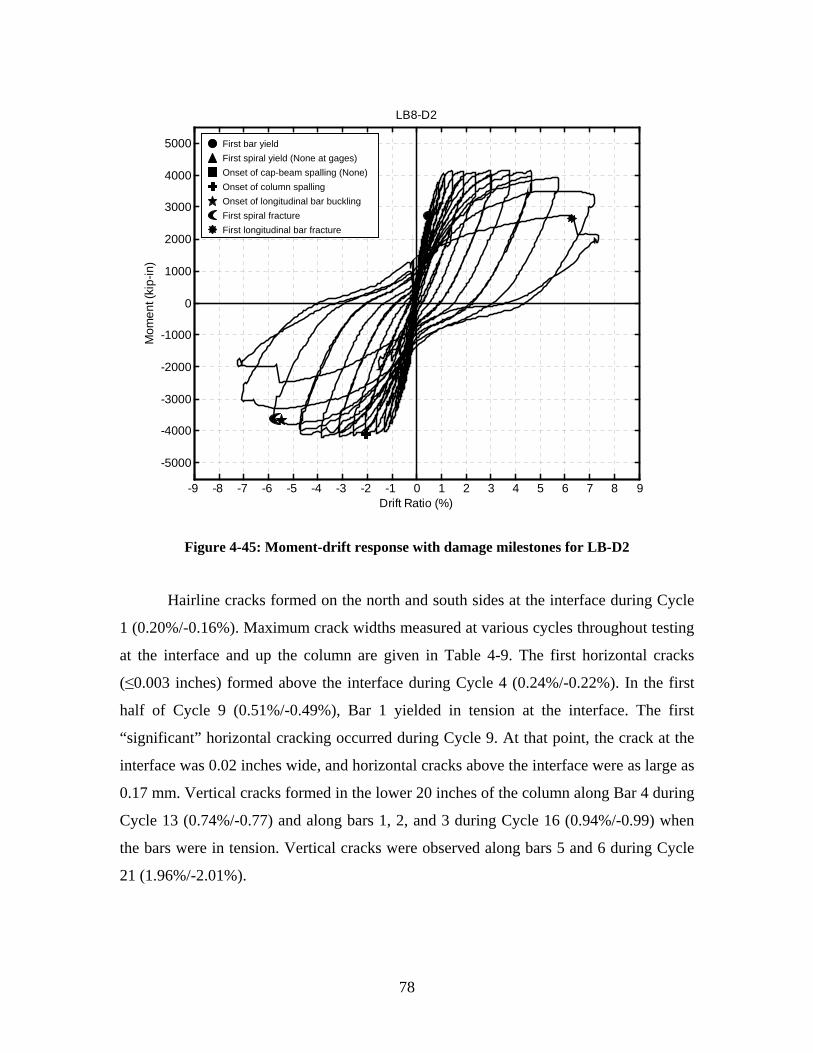
LB8-D2
5000 First bar yield First spiral yield (None at gages) Onset of cap-beam spalling (None)4000 Onset of column spalling Onset of longitudinal bar buckling3000 First spiral fracture First longitudinal bar fracture
2000
1000
0
-1000
-2000
-3000
-4000
-5000
-9 -8 -7 -6 -5 -4 -3 -2 -1 0 1 2 3 4 5 6 7 8 9
Mom
ent (
kip-
in)
Drift Ratio (%)
Figure 4-45: Moment-drift response with damage milestones for LB-D2
Hairline cracks formed on the north and south sides at the interface during Cycle
1 (0.20%/-0.16%). Maximum crack widths measured at various cycles throughout testing
at the interface and up the column are given in Table 4-9. The first horizontal cracks
(≤0.003 inches) formed above the interface during Cycle 4 (0.24%/-0.22%). In the first
half of Cycle 9 (0.51%/-0.49%), Bar 1 yielded in tension at the interface. The first
“significant” horizontal cracking occurred during Cycle 9. At that point, the crack at the
interface was 0.02 inches wide, and horizontal cracks above the interface were as large as
0.17 mm. Vertical cracks formed in the lower 20 inches of the column along Bar 4 during
Cycle 13 (0.74%/-0.77) and along bars 1, 2, and 3 during Cycle 16 (0.94%/-0.99) when
the bars were in tension. Vertical cracks were observed along bars 5 and 6 during Cycle
21 (1.96%/-2.01%).
78
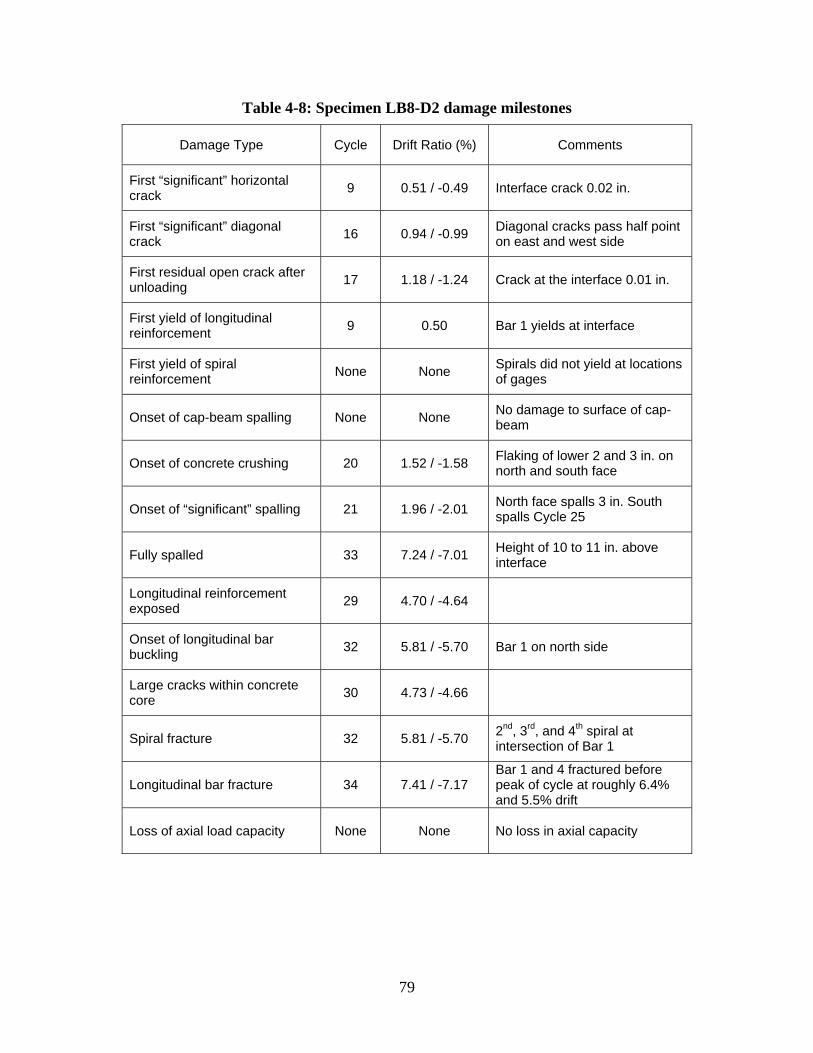
Table 4-8: Specimen LB8-D2 damage milestones
Damage Type Cycle Drift Ratio (%) Comments
First “significant” horizontal crack 9 0.51 / -0.49 Interface crack 0.02 in.
First “significant” diagonal crack 16 0.94 / -0.99 Diagonal cracks pass half point
on east and west side
First residual open crack after unloading 17 1.18 / -1.24 Crack at the interface 0.01 in.
First yield of longitudinal reinforcement 9 0.50 Bar 1 yields at interface
First yield of spiral reinforcement None None Spirals did not yield at locations
of gages
Onset of cap-beam spalling None None No damage to surface of cap-beam
Onset of concrete crushing 20 1.52 / -1.58 Flaking of lower 2 and 3 in. on north and south face
Onset of “significant” spalling 21 1.96 / -2.01 North face spalls 3 in. South spalls Cycle 25
Fully spalled 33 7.24 / -7.01 Height of 10 to 11 in. above interface
Longitudinal reinforcement exposed 29 4.70 / -4.64
Onset of longitudinal bar buckling 32 5.81 / -5.70 Bar 1 on north side
Large cracks within concrete core 30 4.73 / -4.66
Spiral fracture 32 5.81 / -5.70 2nd, 3rd, and 4th spiral at intersection of Bar 1
Longitudinal bar fracture 34 7.41 / -7.17 Bar 1 and 4 fractured before peak of cycle at roughly 6.4% and 5.5% drift
Loss of axial load capacity None None No loss in axial capacity
79
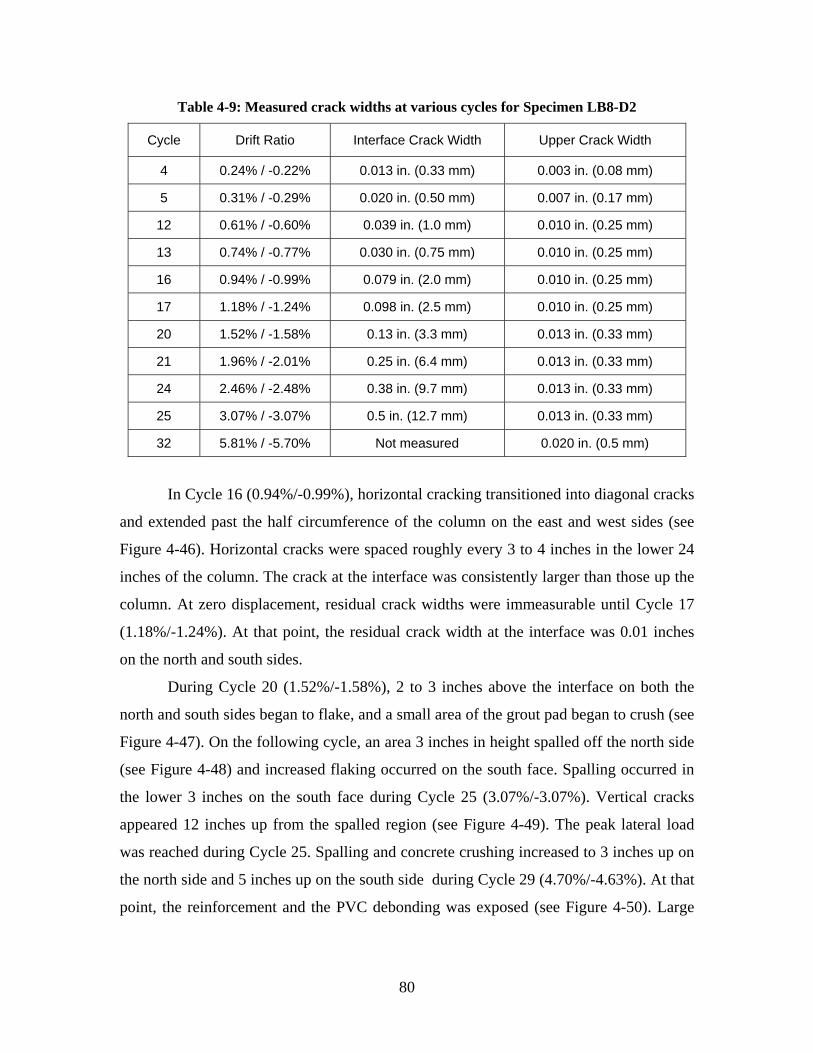
Table 4-9: Measured crack widths at various cycles for Specimen LB8-D2
Cycle Drift Ratio Interface Crack Width Upper Crack Width
4 0.24% / -0.22% 0.013 in. (0.33 mm) 0.003 in. (0.08 mm)
5 0.31% / -0.29% 0.020 in. (0.50 mm) 0.007 in. (0.17 mm)
12 0.61% / -0.60% 0.039 in. (1.0 mm) 0.010 in. (0.25 mm)
13 0.74% / -0.77% 0.030 in. (0.75 mm) 0.010 in. (0.25 mm)
16 0.94% / -0.99% 0.079 in. (2.0 mm) 0.010 in. (0.25 mm)
17 1.18% / -1.24% 0.098 in. (2.5 mm) 0.010 in. (0.25 mm)
20 1.52% / -1.58% 0.13 in. (3.3 mm) 0.013 in. (0.33 mm)
21 1.96% / -2.01% 0.25 in. (6.4 mm) 0.013 in. (0.33 mm)
24 2.46% / -2.48% 0.38 in. (9.7 mm) 0.013 in. (0.33 mm)
25 3.07% / -3.07% 0.5 in. (12.7 mm) 0.013 in. (0.33 mm)
32 5.81% / -5.70% Not measured 0.020 in. (0.5 mm)
In Cycle 16 (0.94%/-0.99%), horizontal cracking transitioned into diagonal cracks
and extended past the half circumference of the column on the east and west sides (see
Figure 4-46). Horizontal cracks were spaced roughly every 3 to 4 inches in the lower 24
inches of the column. The crack at the interface was consistently larger than those up the
column. At zero displacement, residual crack widths were immeasurable until Cycle 17
(1.18%/-1.24%). At that point, the residual crack width at the interface was 0.01 inches
on the north and south sides.
During Cycle 20 (1.52%/-1.58%), 2 to 3 inches above the interface on both the
north and south sides began to flake, and a small area of the grout pad began to crush (see
Figure 4-47). On the following cycle, an area 3 inches in height spalled off the north side
(see Figure 4-48) and increased flaking occurred on the south face. Spalling occurred in
the lower 3 inches on the south face during Cycle 25 (3.07%/-3.07%). Vertical cracks
appeared 12 inches up from the spalled region (see Figure 4-49). The peak lateral load
was reached during Cycle 25. Spalling and concrete crushing increased to 3 inches up on
the north side and 5 inches up on the south side during Cycle 29 (4.70%/-4.63%). At that
point, the reinforcement and the PVC debonding was exposed (see Figure 4-50). Large
80
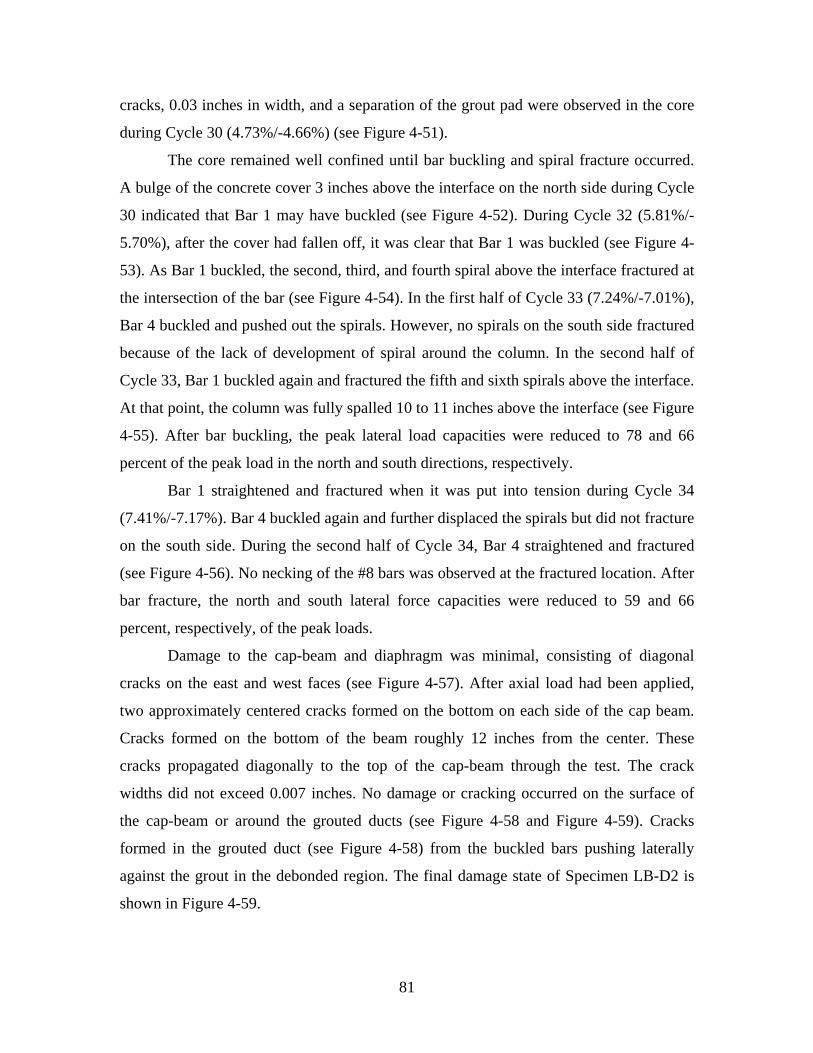
cracks, 0.03 inches in width, and a separation of the grout pad were observed in the core
during Cycle 30 (4.73%/-4.66%) (see Figure 4-51).
The core remained well confined until bar buckling and spiral fracture occurred.
A bulge of the concrete cover 3 inches above the interface on the north side during Cycle
30 indicated that Bar 1 may have buckled (see Figure 4-52). During Cycle 32 (5.81%/-
5.70%), after the cover had fallen off, it was clear that Bar 1 was buckled (see Figure 4-
53). As Bar 1 buckled, the second, third, and fourth spiral above the interface fractured at
the intersection of the bar (see Figure 4-54). In the first half of Cycle 33 (7.24%/-7.01%),
Bar 4 buckled and pushed out the spirals. However, no spirals on the south side fractured
because of the lack of development of spiral around the column. In the second half of
Cycle 33, Bar 1 buckled again and fractured the fifth and sixth spirals above the interface.
At that point, the column was fully spalled 10 to 11 inches above the interface (see Figure
4-55). After bar buckling, the peak lateral load capacities were reduced to 78 and 66
percent of the peak load in the north and south directions, respectively.
Bar 1 straightened and fractured when it was put into tension during Cycle 34
(7.41%/-7.17%). Bar 4 buckled again and further displaced the spirals but did not fracture
on the south side. During the second half of Cycle 34, Bar 4 straightened and fractured
(see Figure 4-56). No necking of the #8 bars was observed at the fractured location. After
bar fracture, the north and south lateral force capacities were reduced to 59 and 66
percent, respectively, of the peak loads.
Damage to the cap-beam and diaphragm was minimal, consisting of diagonal
cracks on the east and west faces (see Figure 4-57). After axial load had been applied,
two approximately centered cracks formed on the bottom on each side of the cap beam.
Cracks formed on the bottom of the beam roughly 12 inches from the center. These
cracks propagated diagonally to the top of the cap-beam through the test. The crack
widths did not exceed 0.007 inches. No damage or cracking occurred on the surface of
the cap-beam or around the grouted ducts (see Figure 4-58 and Figure 4-59). Cracks
formed in the grouted duct (see Figure 4-58) from the buckled bars pushing laterally
against the grout in the debonded region. The final damage state of Specimen LB-D2 is
shown in Figure 4-59.
81
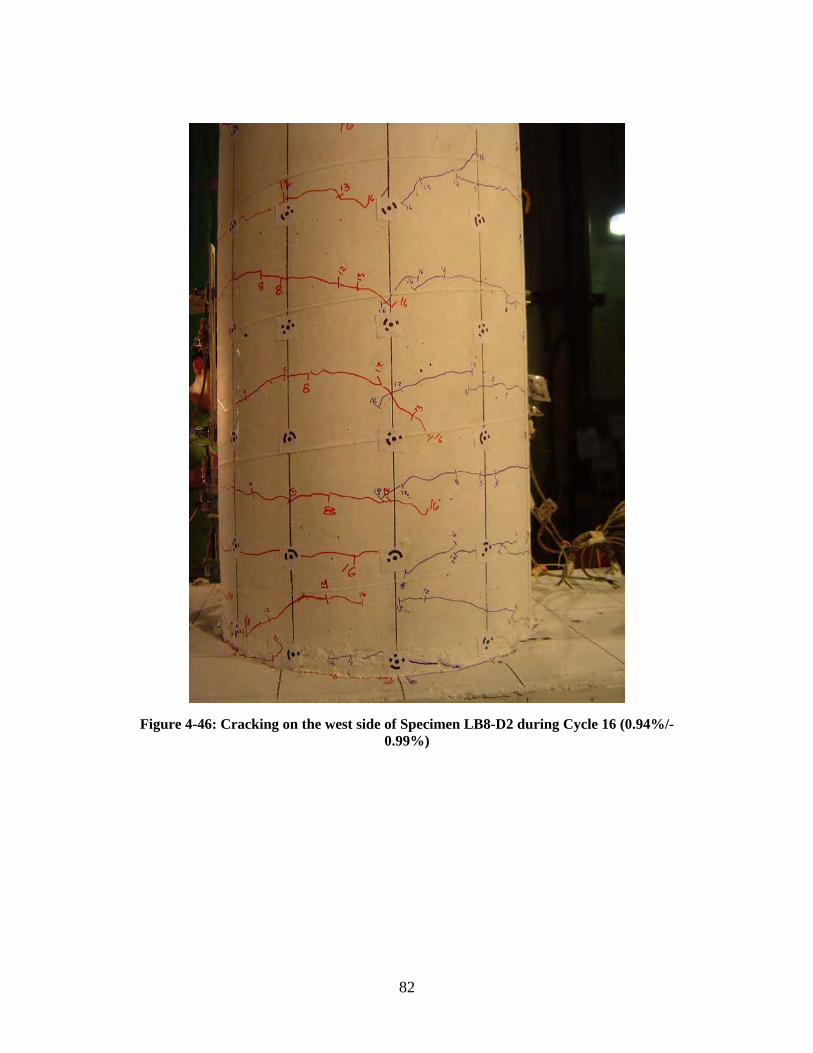
Figure 4-46: Cracking on the west side of Specimen LB8-D2 during Cycle 16 (0.94%/-0.99%)
82
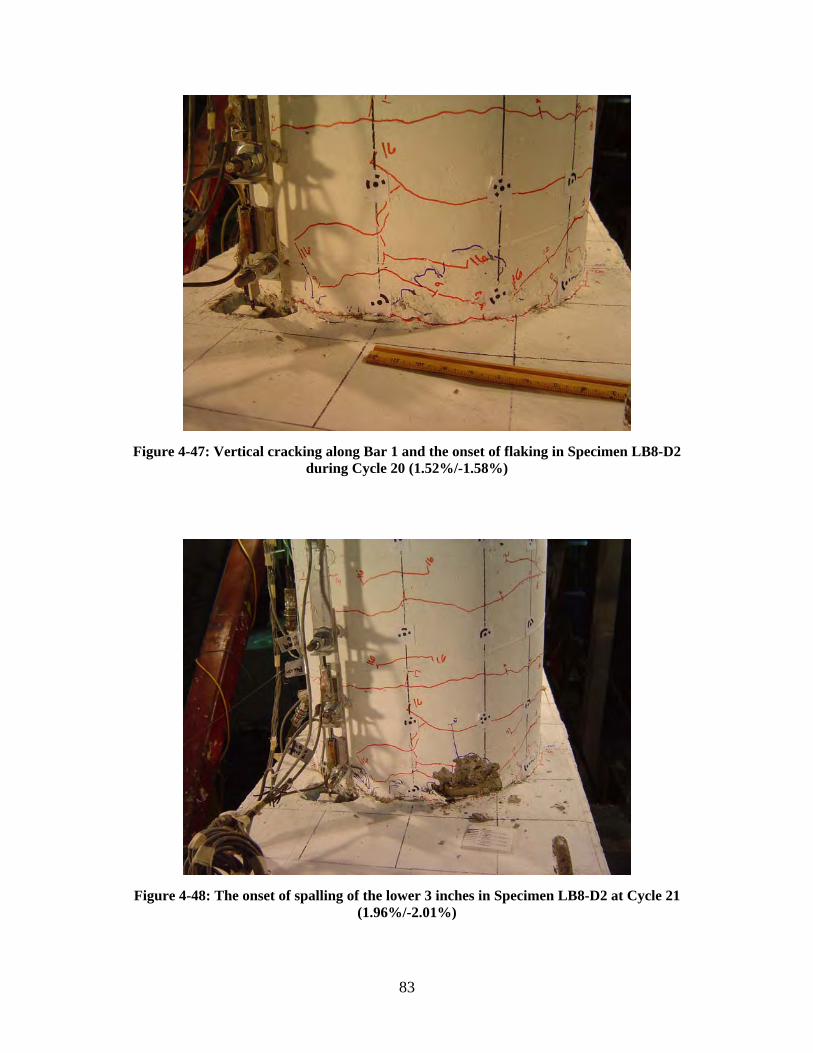
Figure 4-47: Vertical cracking along Bar 1 and the onset of flaking in Specimen LB8-D2 during Cycle 20 (1.52%/-1.58%)
Figure 4-48: The onset of spalling of the lower 3 inches in Specimen LB8-D2 at Cycle 21 (1.96%/-2.01%)
83
Figure 4-49: Spalling on the south face of Specimen LB8-D2 during Cycle 25 (3.07%/-3.07%)
Figure 4-40: 5 inches spalled on the south face in Specimen LB8-D2 at Cycle 29 (4.70%/-4.63%)
84
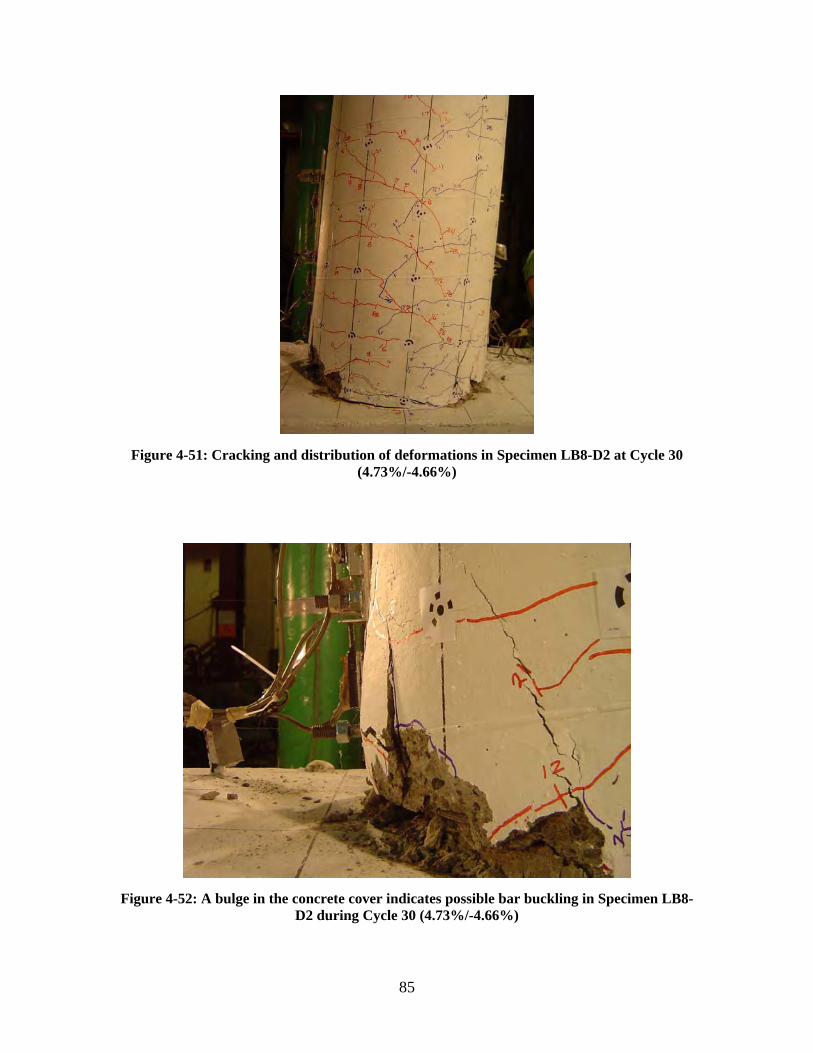
Figure 4-51: Cracking and distribution of deformations in Specimen LB8-D2 at Cycle 30 (4.73%/-4.66%)
Figure 4-52: A bulge in the concrete cover indicates possible bar buckling in Specimen LB8-D2 during Cycle 30 (4.73%/-4.66%)
85
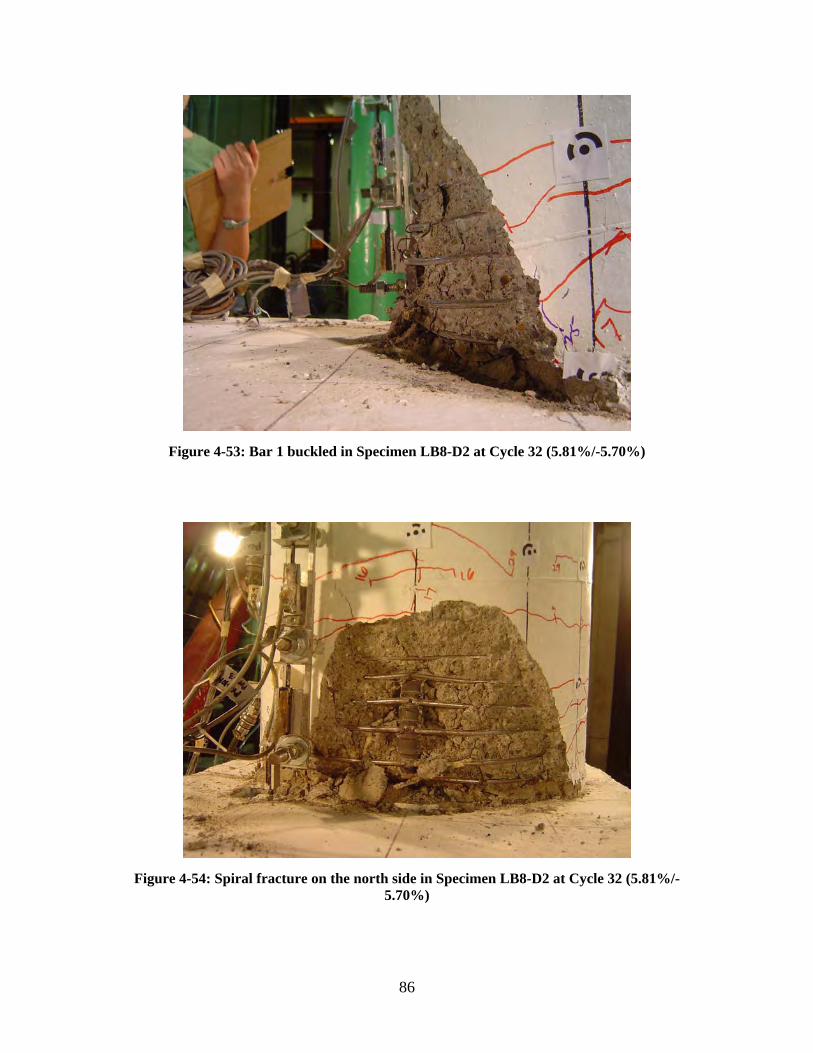
Figure 4-53: Bar 1 buckled in Specimen LB8-D2 at Cycle 32 (5.81%/-5.70%)
Figure 4-54: Spiral fracture on the north side in Specimen LB8-D2 at Cycle 32 (5.81%/-5.70%)
86
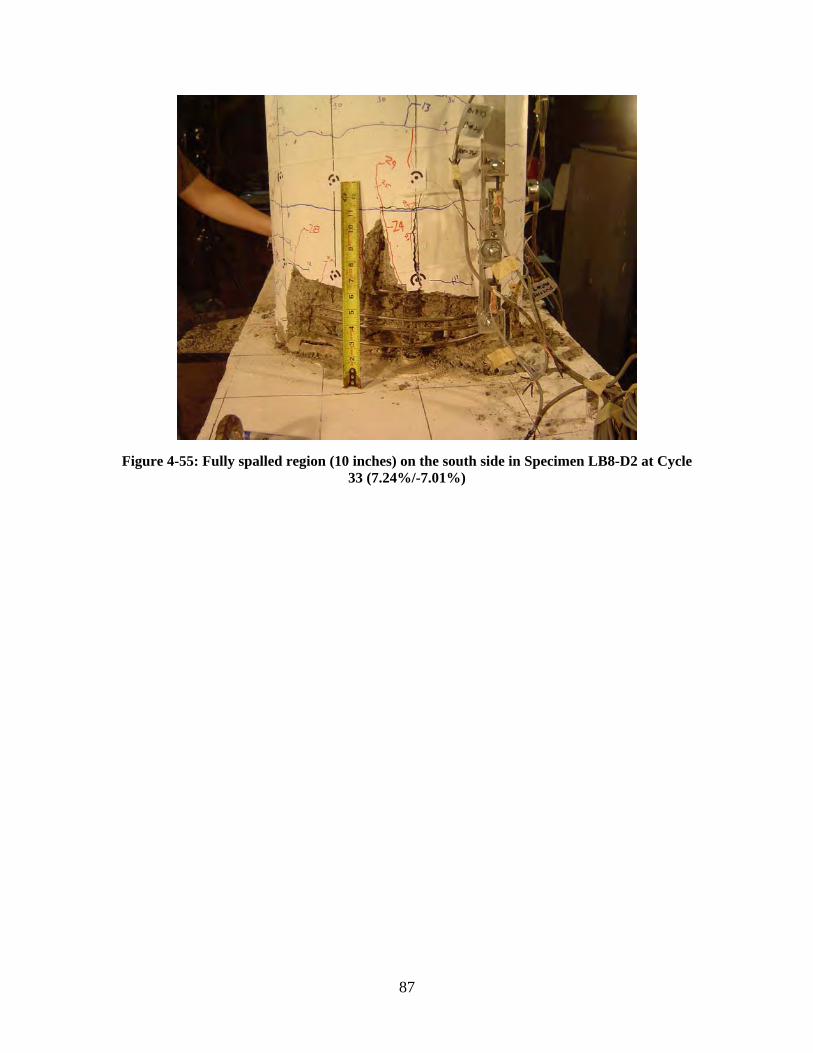
Figure 4-55: Fully spalled region (10 inches) on the south side in Specimen LB8-D2 at Cycle 33 (7.24%/-7.01%)
87
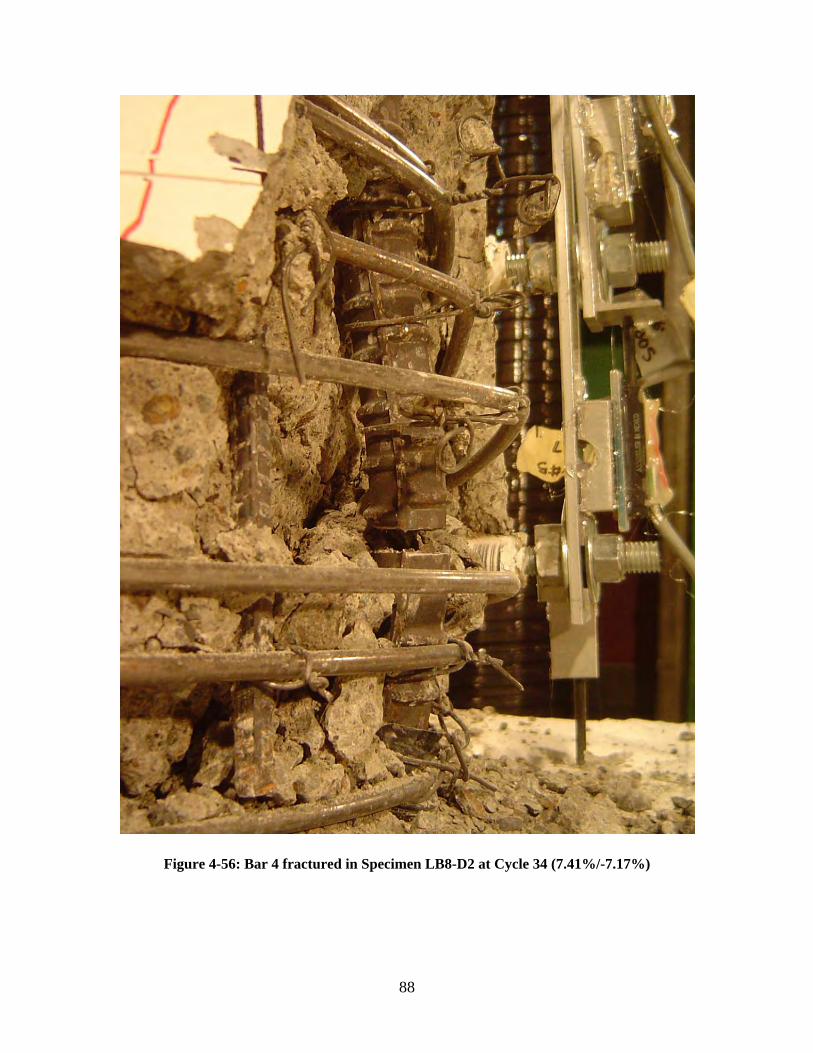
Figure 4-56: Bar 4 fractured in Specimen LB8-D2 at Cycle 34 (7.41%/-7.17%)
88
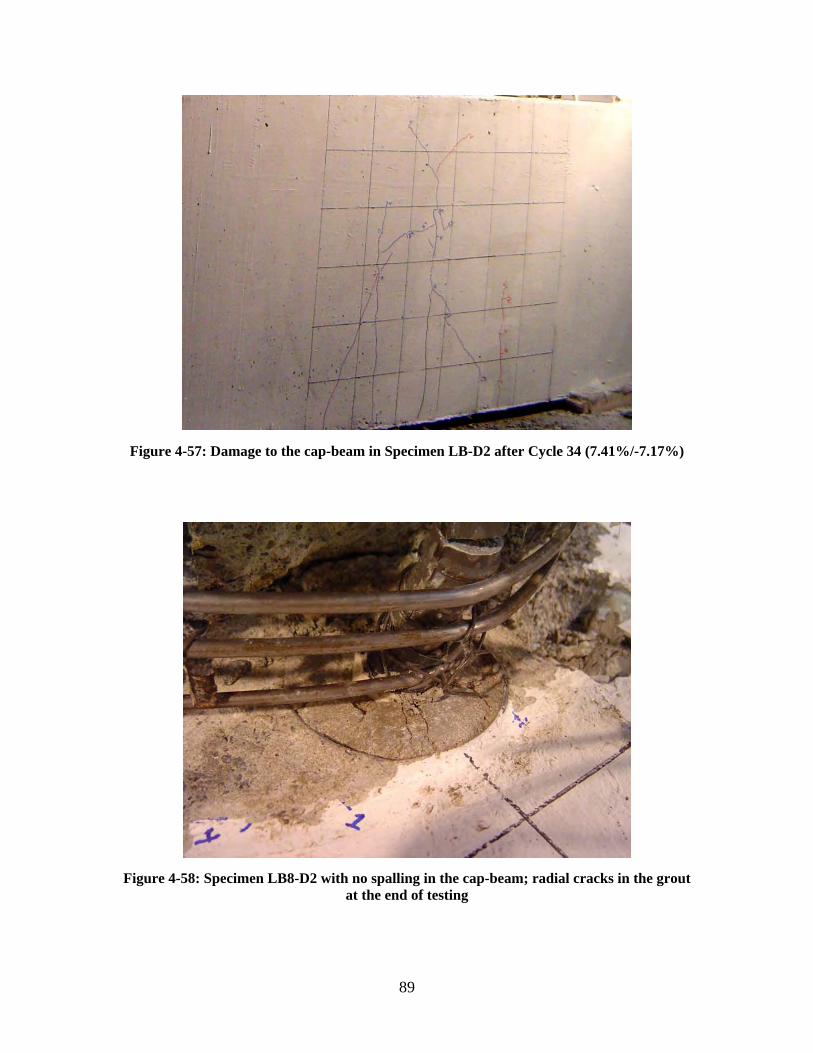
Figure 4-57: Damage to the cap-beam in Specimen LB-D2 after Cycle 34 (7.41%/-7.17%)
Figure 4-58: Specimen LB8-D2 with no spalling in the cap-beam; radial cracks in the grout at the end of testing
89
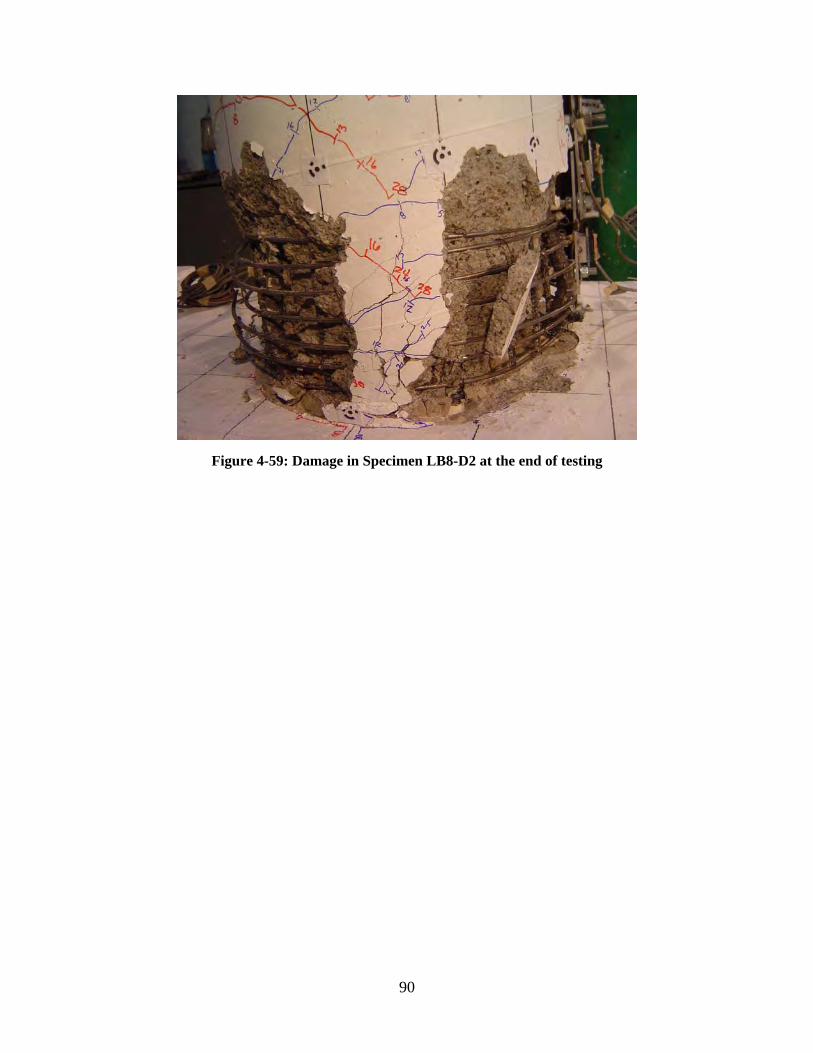
Figure 4-59: Damage in Specimen LB8-D2 at the end of testing
90
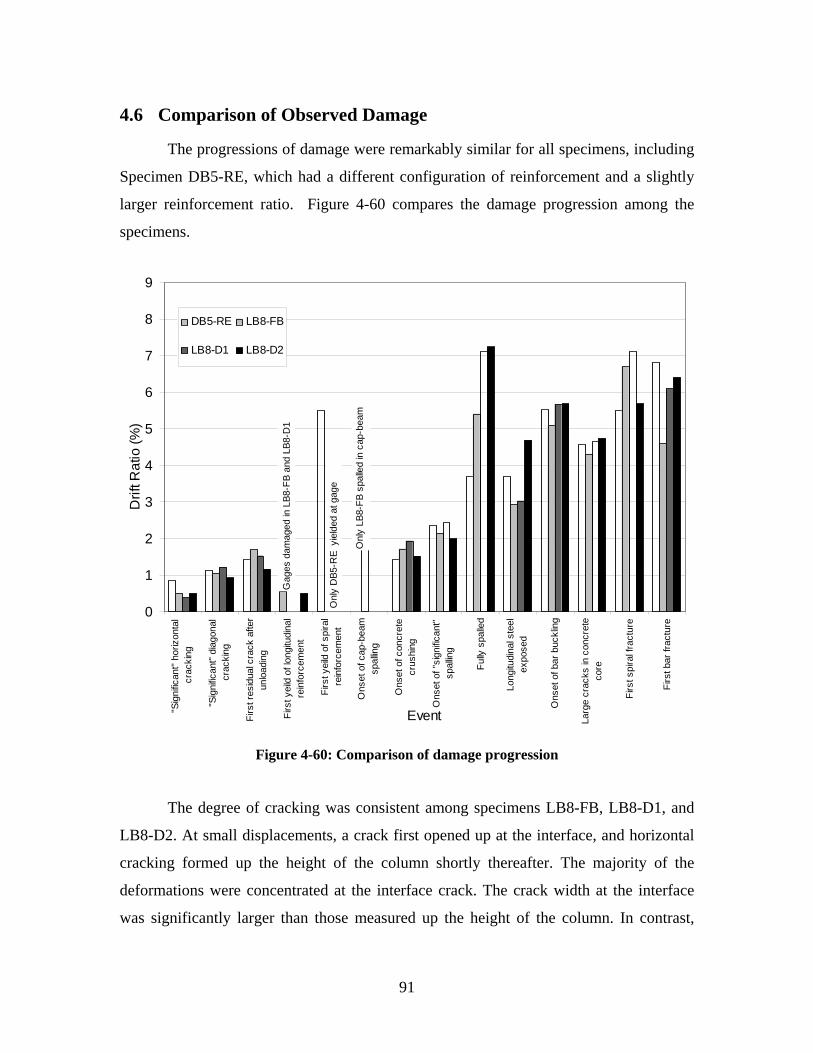
4.6 Comparison of Observed Damage
The progressions of damage were remarkably similar for all specimens, including
Specimen DB5-RE, which had a different configuration of reinforcement and a slightly
larger reinforcement ratio. Figure 4-60 compares the damage progression among the
specimens.
0
1
2
3
4
5
6
7
8
9
Drif
t Rat
io (%
)
DB5-RE LB8-FB
LB8-D1 LB8-D2 O
nly
DB5
-RE
yie
lded
at g
age
Onl
y LB
8-FB
spa
lled
in c
ap-b
eam
Gag
es d
amag
ed in
LB8
-FB
and
LB8-
D1
"Sig
nific
ant"
horiz
onta
lcr
acki
ng
"Sig
nific
ant"
diag
onal
crac
king
Firs
t res
idua
l cra
ck a
fter
unlo
adin
g
Firs
t yei
ld o
f lon
gitu
dina
lre
info
rcem
ent
Firs
t yei
ld o
f spi
ral
rein
forc
emen
t
Ons
et o
f cap
-bea
msp
allin
g
Ons
et o
f con
cret
ecr
ushi
ng
Ons
et o
f "si
gnific
ant"
spal
ling
Fully
spa
lled
Long
itudi
nal s
teel
expo
sed
Ons
et o
f bar
buc
klin
g
Event Larg
e cr
acks
in c
oncr
ete
core
Firs
t spi
ral f
ract
ure
Firs
t bar
frac
ture
Figure 4-60: Comparison of damage progression
The degree of cracking was consistent among specimens LB8-FB, LB8-D1, and
LB8-D2. At small displacements, a crack first opened up at the interface, and horizontal
cracking formed up the height of the column shortly thereafter. The majority of the
deformations were concentrated at the interface crack. The crack width at the interface
was significantly larger than those measured up the height of the column. In contrast,
91
cracks in DB5-RE were well distributed up the height of the column. Cracks widths
measured above the interface were nearly the same as those measured at the interface.
At drift levels of less than 0.5 percent, the crack at the interface was measurably
larger in LB8-D1 and LB8-D2 than in LB8-FB. The larger interface cracks at small drifts
are attributed to the slightly greater flexibility in LB8-D1 and LB8-D2 than in LB8-FB.
At drifts of larger than 0.5 percent, the cracks at the interface were roughly the same
width for the three precast specimens. As the bars naturally debonded themselves in LB8-
FB, the crack width at the interface approached those in LB8-D1 and LB8-D2. This is
consistent with the observation of significant vertical cracking along the longitudinal bars
in the column of LB8-FB, indicating debonding of bars.
The levels of damage to the cover concrete in the columns were nearly identical in
all specimens. In all cases, the initiation of concrete crushing (flaking) occurred at
roughly 1.5 percent drift, and the initiation of and spalling occurred at 2 percent drift.
However, the progression of spalling was slightly slower in the precast specimens than in
Specimen DB5-RE. In Specimen DB5-RE, the column was fully spalled at a smaller drift
level than in the precast specimens. At the end of testing, the spalled height reached 10 to
12 inches in all specimens.
Specimen LB8-FB experienced considerable spalling of the beam surface and
radial cracking propagating from around each duct. This cracking initiated at 1.6 percent
drift and increased during the test. In contrast, the cap-beam surfaces of LB8-D1, LB8-
D2, and DB5-RE did not spall. Intentional debonding of the #8 bars in specimens LB8-
D1 and LB8-D2 eliminated spalling damage to the cap-beam by anchoring the bar deeper
in the beam and reducing the bond stress demand on cover concrete. In Specimen DB5-
RE, several short radial cracks were observed around the base of the column near the
locations of the #5 bars. Other damage to the cap-beam, seen in all specimens, consisted
of several diagonal cracks propagating from the bottom of the cap beam, initiating after
the application of axial load and slowly growing with each subsequent loading cycle.
Buckling of the most north and south bars occurred at roughly the same drift
levels (approximately 5.5 percent) and in the same cycle (Cycle 32) in each specimen.
The finding that buckling occurred at almost the same drift was surprising, given that
Specimen DB5-RE had smaller bars and that in specimens LB8-D1 and LB8-D2 the bars
92
were debonded over a length of 8 db. The buckling always occurred in the column,
whereas the debonded region was in the cap beam.
In all specimens, spirals fractured when bar buckling was first observed (Cycle
32) or shortly thereafter (Cycle 33). Fracture occurred as a result of the buckled bars
pushing laterally on the spiral. The drift levels at which spirals fractured differed slightly
among specimens, possibly because of the slight differences in displacements through
which each column was cycled.
Bar fracture occurred at roughly the same drift level in specimens LB8-D1, LB8-
D2 and DB5-RE. It occurred in the first two specimens during the same cycle number
(Cycle 34), while not in the third specimen until Cycle 36. Specimen LB8-FB fractured
during the same cycle number (Cycle 34) as LB8-D1 and LB8-D2 but at a lower drift
level. In all cases, the event occurred before the peak drift of the cycle, resulted in
brittleness with no necking evident, and occurred from low-cycle fatigue caused by
buckling and re-straightening.
93
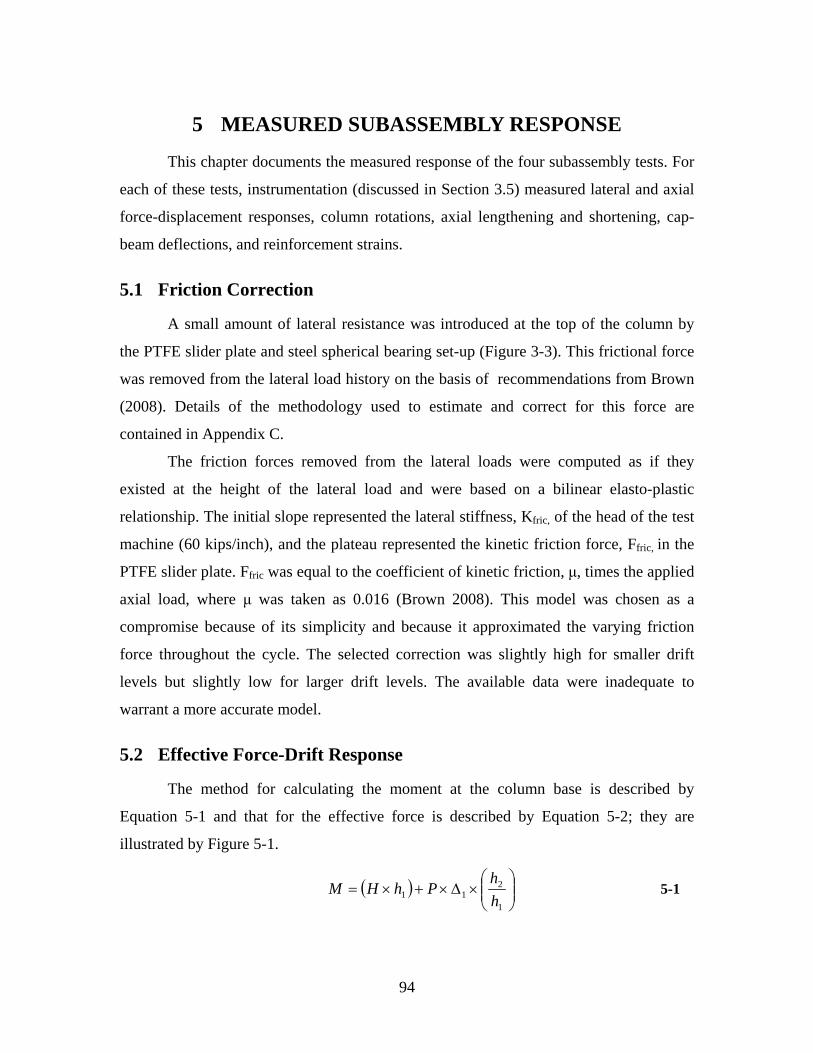
5 MEASURED SUBASSEMBLY RESPONSE
This chapter documents the measured response of the four subassembly tests. For
each of these tests, instrumentation (discussed in Section 3.5) measured lateral and axial
force-displacement responses, column rotations, axial lengthening and shortening, cap-
beam deflections, and reinforcement strains.
5.1 Friction Correction
A small amount of lateral resistance was introduced at the top of the column by
the PTFE slider plate and steel spherical bearing set-up (Figure 3-3). This frictional force
was removed from the lateral load history on the basis of recommendations from Brown
(2008). Details of the methodology used to estimate and correct for this force are
contained in Appendix C.
The friction forces removed from the lateral loads were computed as if they
existed at the height of the lateral load and were based on a bilinear elasto-plastic
relationship. The initial slope represented the lateral stiffness, Kfric, of the head of the test
machine (60 kips/inch), and the plateau represented the kinetic friction force, Ffric, in the
PTFE slider plate. Ffric was equal to the coefficient of kinetic friction, μ, times the applied
axial load, where μ was taken as 0.016 (Brown 2008). This model was chosen as a
compromise because of its simplicity and because it approximated the varying friction
force throughout the cycle. The selected correction was slightly high for smaller drift
levels but slightly low for larger drift levels. The available data were inadequate to
warrant a more accurate model.
5.2 Effective Force-Drift Response
The method for calculating the moment at the column base is described by
Equation 5-1 and that for the effective force is described by Equation 5-2; they are
illustrated by Figure 5-1.
⎛ h2 ⎞M = (H × h1 )+ P ×Δ1 × ⎜⎜ ⎟⎟ 5-1 ⎝ h1 ⎠
94
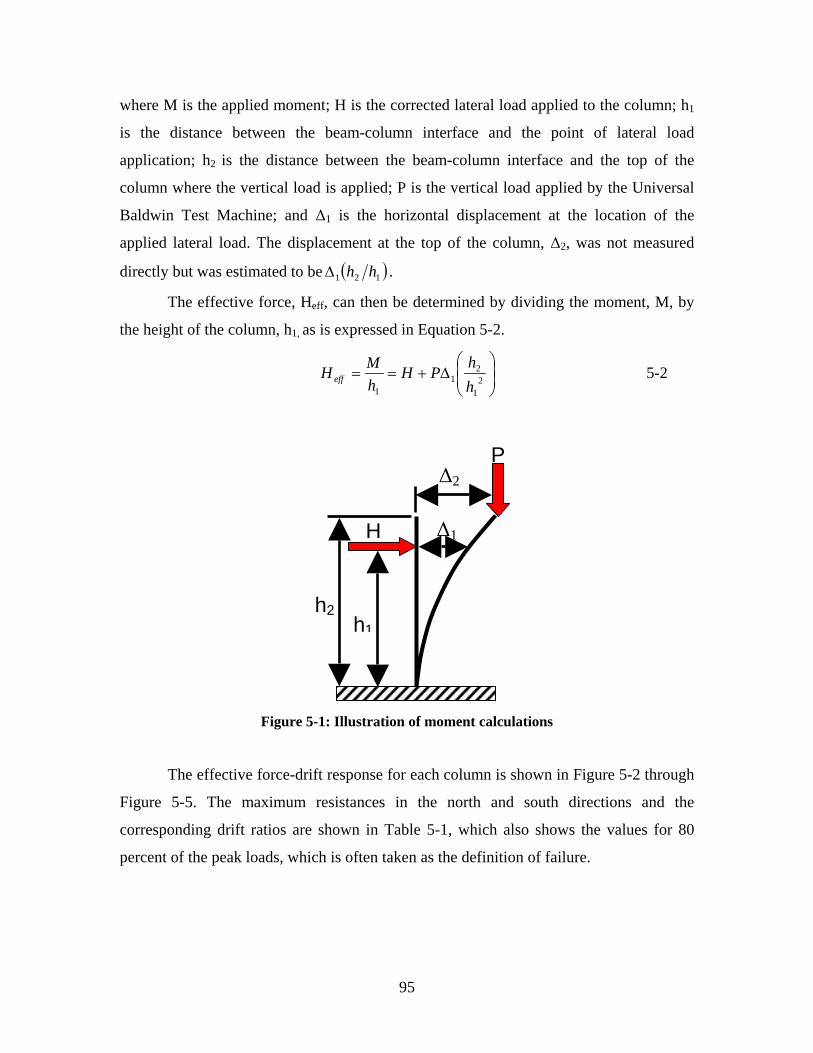
where M is the applied moment; H is the corrected lateral load applied to the column; h1
is the distance between the beam-column interface and the point of lateral load
application; h2 is the distance between the beam-column interface and the top of the
column where the vertical load is applied; P is the vertical load applied by the Universal
Baldwin Test Machine; and Δ1 is the horizontal displacement at the location of the
applied lateral load. The displacement at the top of the column, Δ2, was not measured
directly but was estimated to be Δ1 (h2 h1 ) . The effective force, Heff, can then be determined by dividing the moment, M, by
the height of the column, h1, as is expressed in Equation 5-2.
M ⎛ h ⎞ H eff = = H + PΔ1
⎜ 2 ⎟ 5-2⎜ 2 ⎟h h1 ⎝ 1 ⎠
P Δ2
h1
H Δ1
h2
Figure 5-1: Illustration of moment calculations
The effective force-drift response for each column is shown in Figure 5-2 through
Figure 5-5. The maximum resistances in the north and south directions and the
corresponding drift ratios are shown in Table 5-1, which also shows the values for 80
percent of the peak loads, which is often taken as the definition of failure.
95
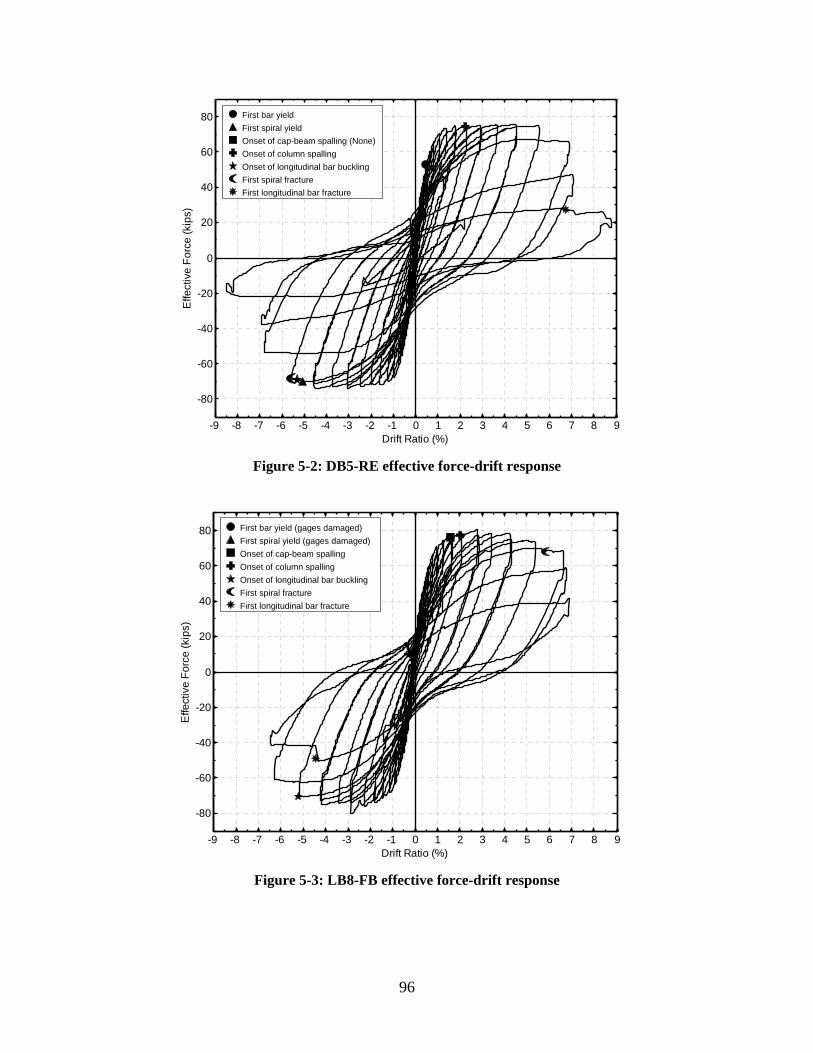
Effe
ctiv
e Fo
rce
(kip
s)
Effe
ctiv
e Fo
rce
(kip
s)
80
60
40
20
0
-20
-40
-60
-80
First bar yield First spiral yield Onset of cap-beam spalling (None) Onset of column spalling Onset of longitudinal bar buckling First spiral fracture First longitudinal bar fracture
-9 -8 -7 -6 -5 -4 -3 -2 -1 0 1 2 3 4 5 6 7 8 Drift Ratio (%)
Figure 5-2: DB5-RE effective force-drift response
80
60
40
20
0
-20
-40
-60
-80
-9 -8 -7 -6 -5 -4 -3 -2 -1 0 1 2 3 4 5 6 7 8 9 Drift Ratio (%)
First bar yield (gages damaged) First spiral yield (gages damaged) Onset of cap-beam spalling Onset of column spalling Onset of longitudinal bar buckling First spiral fracture First longitudinal bar fracture
Figure 5-3: LB8-FB effective force-drift response
96
9
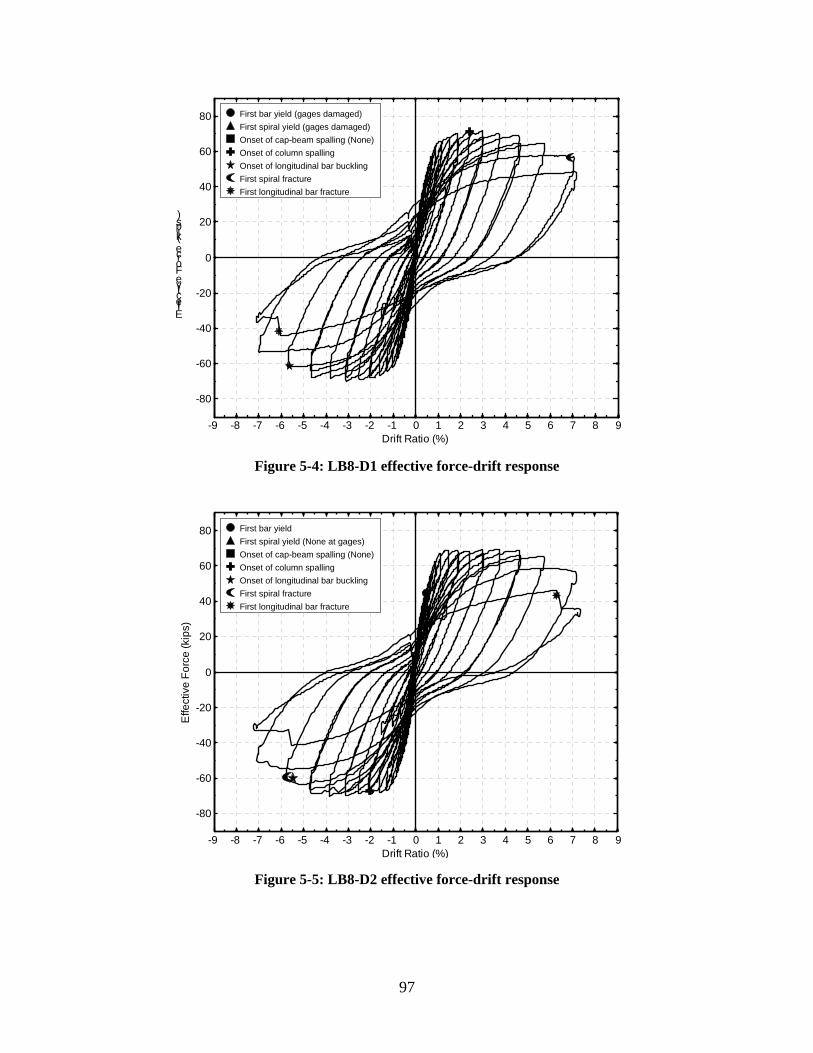
80
60
40
psk
)i
20 (ecr 0oFevtic -20 effE
-40
-60
-80
-9 -8 -7 -6 -5 -4 -3 -2 -1 0 1 2 3 4 5 6 7 8 9
First bar yield (gages damaged) First spiral yield (gages damaged) Onset of cap-beam spalling (None) Onset of column spalling Onset of longitudinal bar buckling First spiral fracture First longitudinal bar fracture
Effe
ctiv
e Fo
rce
(kip
s)
Drift Ratio (%)
Figure 5-4: LB8-D1 effective force-drift response
80
60
40
20
0
-20
-40
-60
-80
-9 -8 -7 -6 -5 -4 -3 -2 -1 0 1 2 3 4 5 6 7 8 9 Drift Ratio (%)
First bar yield First spiral yield (None at gages) Onset of cap-beam spalling (None) Onset of column spalling Onset of longitudinal bar buckling First spiral fracture First longitudinal bar fracture
Figure 5-5: LB8-D2 effective force-drift response
97
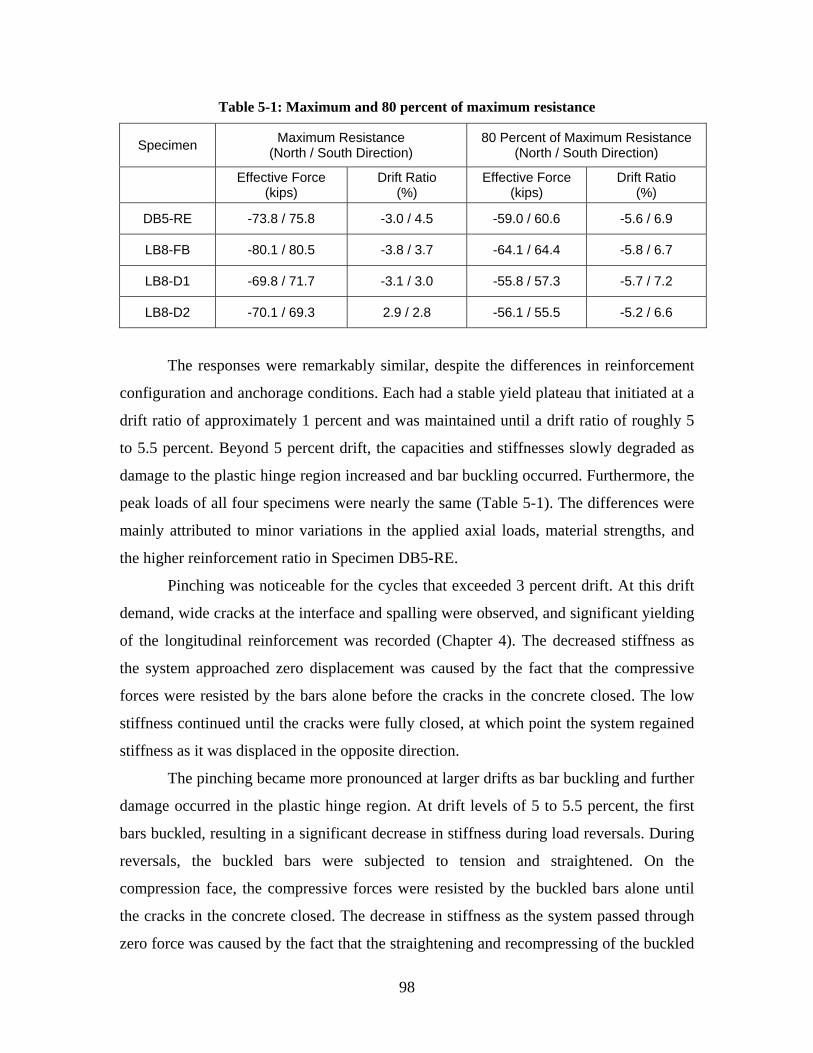
Table 5-1: Maximum and 80 percent of maximum resistance
Specimen Maximum Resistance (North / South Direction)
80 Percent of Maximum Resistance (North / South Direction)
Effective Force (kips)
Drift Ratio (%)
Effective Force (kips)
Drift Ratio (%)
DB5-RE -73.8 / 75.8 -3.0 / 4.5 -59.0 / 60.6 -5.6 / 6.9
LB8-FB -80.1 / 80.5 -3.8 / 3.7 -64.1 / 64.4 -5.8 / 6.7
LB8-D1 -69.8 / 71.7 -3.1 / 3.0 -55.8 / 57.3 -5.7 / 7.2
LB8-D2 -70.1 / 69.3 2.9 / 2.8 -56.1 / 55.5 -5.2 / 6.6
The responses were remarkably similar, despite the differences in reinforcement
configuration and anchorage conditions. Each had a stable yield plateau that initiated at a
drift ratio of approximately 1 percent and was maintained until a drift ratio of roughly 5
to 5.5 percent. Beyond 5 percent drift, the capacities and stiffnesses slowly degraded as
damage to the plastic hinge region increased and bar buckling occurred. Furthermore, the
peak loads of all four specimens were nearly the same (Table 5-1). The differences were
mainly attributed to minor variations in the applied axial loads, material strengths, and
the higher reinforcement ratio in Specimen DB5-RE.
Pinching was noticeable for the cycles that exceeded 3 percent drift. At this drift
demand, wide cracks at the interface and spalling were observed, and significant yielding
of the longitudinal reinforcement was recorded (Chapter 4). The decreased stiffness as
the system approached zero displacement was caused by the fact that the compressive
forces were resisted by the bars alone before the cracks in the concrete closed. The low
stiffness continued until the cracks were fully closed, at which point the system regained
stiffness as it was displaced in the opposite direction.
The pinching became more pronounced at larger drifts as bar buckling and further
damage occurred in the plastic hinge region. At drift levels of 5 to 5.5 percent, the first
bars buckled, resulting in a significant decrease in stiffness during load reversals. During
reversals, the buckled bars were subjected to tension and straightened. On the
compression face, the compressive forces were resisted by the buckled bars alone until
the cracks in the concrete closed. The decrease in stiffness as the system passed through
zero force was caused by the fact that the straightening and recompressing of the buckled
98
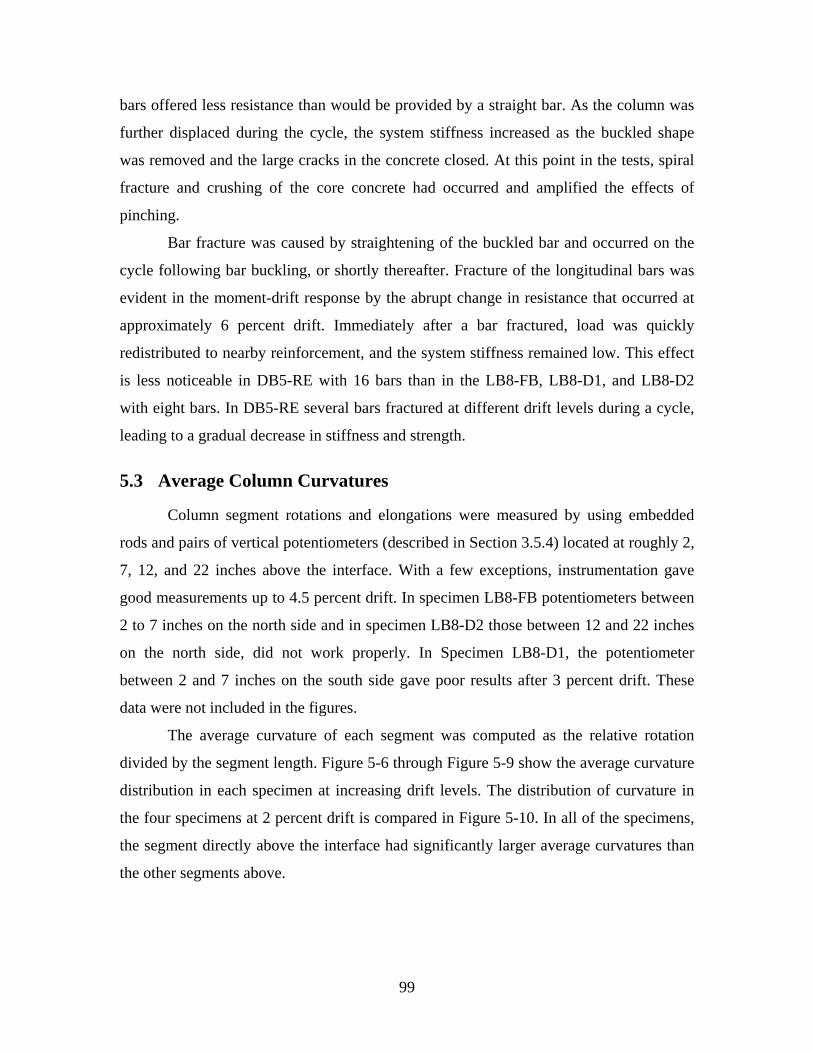
bars offered less resistance than would be provided by a straight bar. As the column was
further displaced during the cycle, the system stiffness increased as the buckled shape
was removed and the large cracks in the concrete closed. At this point in the tests, spiral
fracture and crushing of the core concrete had occurred and amplified the effects of
pinching.
Bar fracture was caused by straightening of the buckled bar and occurred on the
cycle following bar buckling, or shortly thereafter. Fracture of the longitudinal bars was
evident in the moment-drift response by the abrupt change in resistance that occurred at
approximately 6 percent drift. Immediately after a bar fractured, load was quickly
redistributed to nearby reinforcement, and the system stiffness remained low. This effect
is less noticeable in DB5-RE with 16 bars than in the LB8-FB, LB8-D1, and LB8-D2
with eight bars. In DB5-RE several bars fractured at different drift levels during a cycle,
leading to a gradual decrease in stiffness and strength.
5.3 Average Column Curvatures
Column segment rotations and elongations were measured by using embedded
rods and pairs of vertical potentiometers (described in Section 3.5.4) located at roughly 2,
7, 12, and 22 inches above the interface. With a few exceptions, instrumentation gave
good measurements up to 4.5 percent drift. In specimen LB8-FB potentiometers between
2 to 7 inches on the north side and in specimen LB8-D2 those between 12 and 22 inches
on the north side, did not work properly. In Specimen LB8-D1, the potentiometer
between 2 and 7 inches on the south side gave poor results after 3 percent drift. These
data were not included in the figures.
The average curvature of each segment was computed as the relative rotation
divided by the segment length. Figure 5-6 through Figure 5-9 show the average curvature
distribution in each specimen at increasing drift levels. The distribution of curvature in
the four specimens at 2 percent drift is compared in Figure 5-10. In all of the specimens,
the segment directly above the interface had significantly larger average curvatures than
the other segments above.
99
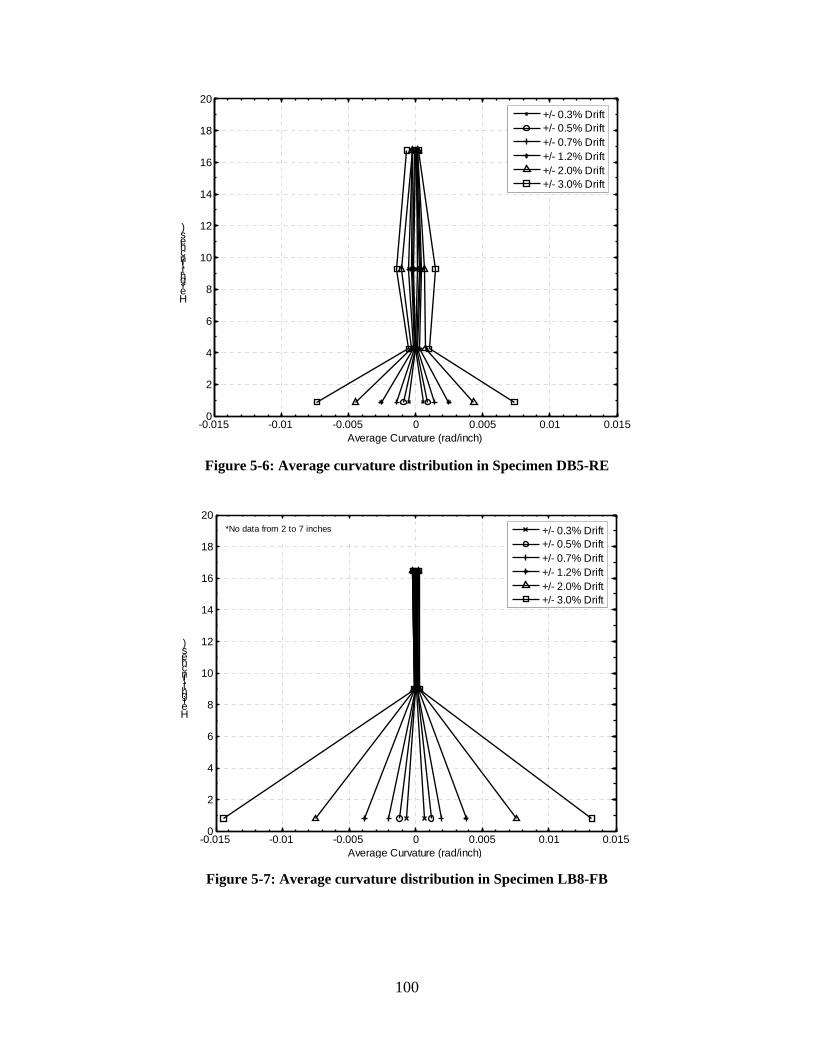
0
2
4
6
8
10
12
14
16
18
20
He ight(in che s)
+/- 0.3% Drift +/- 0.5% Drift +/- 0.7% Drift +/- 1.2% Drift +/- 2.0% Drift +/- 3.0% Drift
-0.015 -0.01 -0.005 0 0.005 0.01 0.015 Average Curvature (rad/inch)
Figure 5-6: Average curvature distribution in Specimen DB5-RE
0
2
4
6
8
10
12
14
16
18
20
He ight(in che s)
+/- 0.3% Drift +/- 0.5% Drift +/- 0.7% Drift +/- 1.2% Drift +/- 2.0% Drift +/- 3.0% Drift
*No data from 2 to 7 inches
-0.015 -0.01 -0.005 0 0.005 0.01 0.015 Average Curvature (rad/inch)
Figure 5-7: Average curvature distribution in Specimen LB8-FB
100
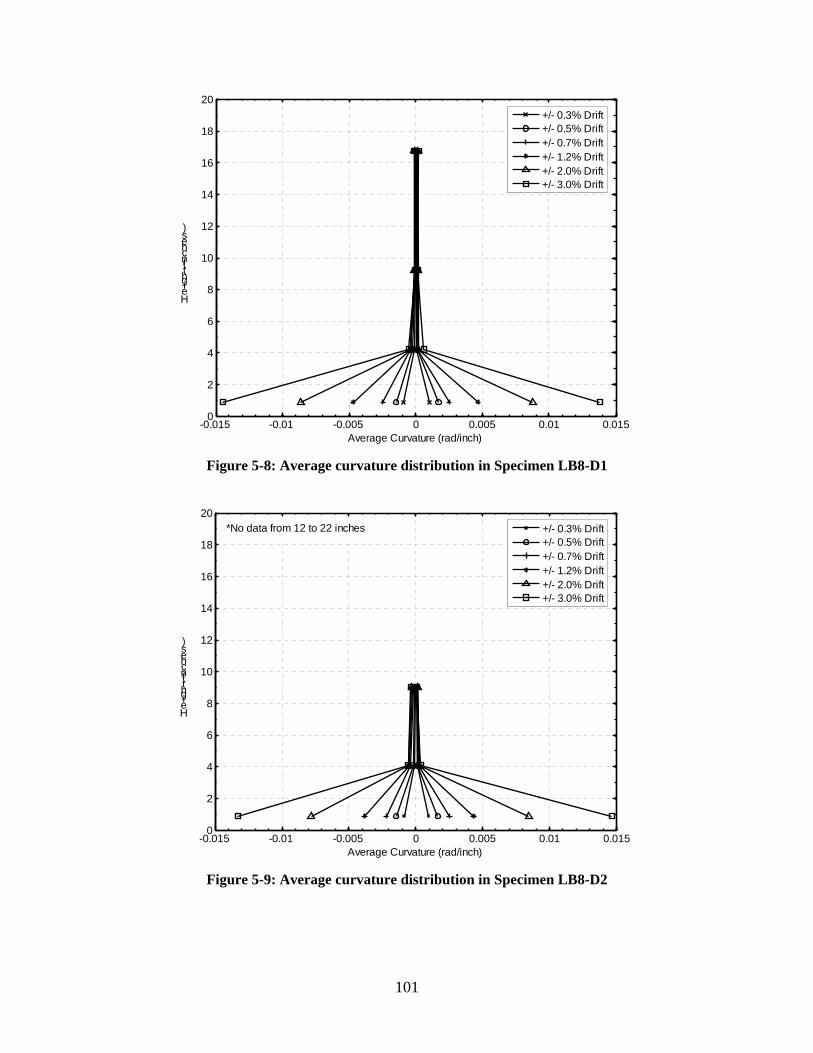
0
2
4
6
8
10
12
14
16
18
20
He ight(in che s)
+/- 0.3% Drift +/- 0.5% Drift +/- 0.7% Drift +/- 1.2% Drift +/- 2.0% Drift +/- 3.0% Drift
-0.015 -0.01 -0.005 0 0.005 0.01 0.015 Average Curvature (rad/inch)
Figure 5-8: Average curvature distribution in Specimen LB8-D1
0
2
4
6
8
10
12
14
16
18
20
He ight(in che s)
+/- 0.3% Drift +/- 0.5% Drift +/- 0.7% Drift +/- 1.2% Drift +/- 2.0% Drift +/- 3.0% Drift
*No data from 12 to 22 inches
-0.015 -0.01 -0.005 0 0.005 0.01 0.015 Average Curvature (rad/inch)
Figure 5-9: Average curvature distribution in Specimen LB8-D2
101
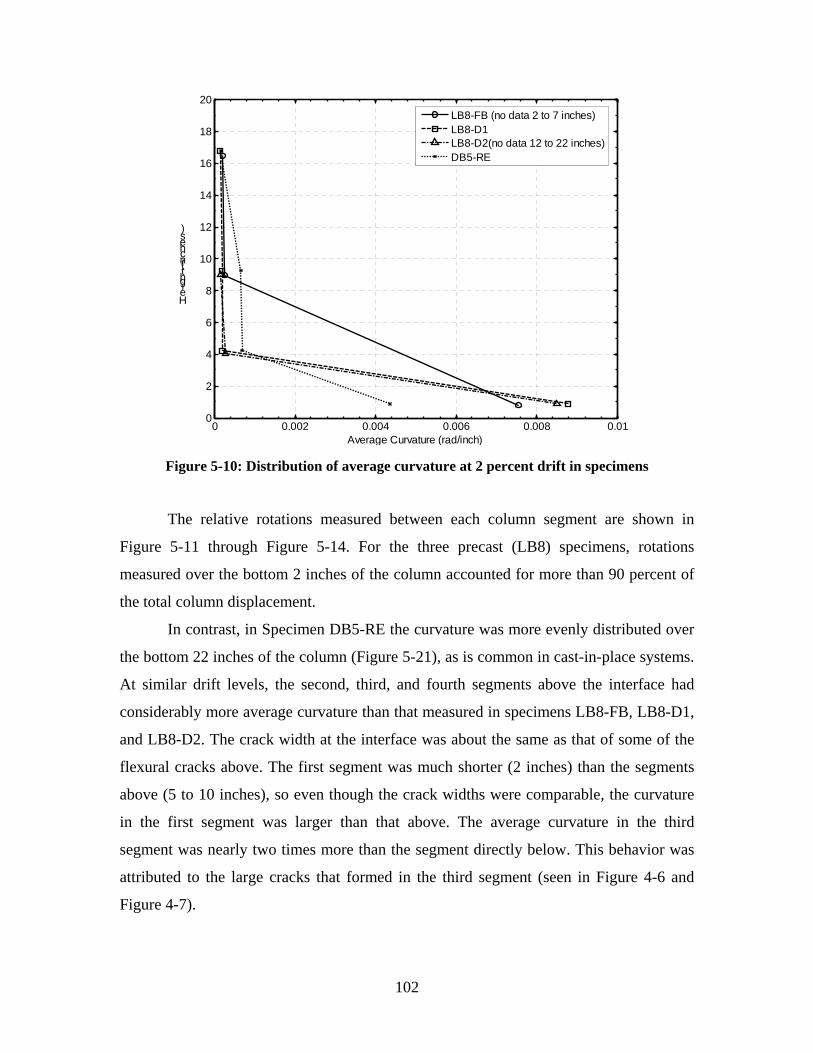
0
2
4
6
8
10
12
14
16
18
20
He ight(in che s)
LB8-FB (no data 2 to 7 inches) LB8-D1 LB8-D2(no data 12 to 22 inches) DB5-RE
0 0.002 0.004 0.006 0.008 0.01 Average Curvature (rad/inch)
Figure 5-10: Distribution of average curvature at 2 percent drift in specimens
The relative rotations measured between each column segment are shown in
Figure 5-11 through Figure 5-14. For the three precast (LB8) specimens, rotations
measured over the bottom 2 inches of the column accounted for more than 90 percent of
the total column displacement.
In contrast, in Specimen DB5-RE the curvature was more evenly distributed over
the bottom 22 inches of the column (Figure 5-21), as is common in cast-in-place systems.
At similar drift levels, the second, third, and fourth segments above the interface had
considerably more average curvature than that measured in specimens LB8-FB, LB8-D1,
and LB8-D2. The crack width at the interface was about the same as that of some of the
flexural cracks above. The first segment was much shorter (2 inches) than the segments
above (5 to 10 inches), so even though the crack widths were comparable, the curvature
in the first segment was larger than that above. The average curvature in the third
segment was nearly two times more than the segment directly below. This behavior was
attributed to the large cracks that formed in the third segment (seen in Figure 4-6 and
Figure 4-7).
102
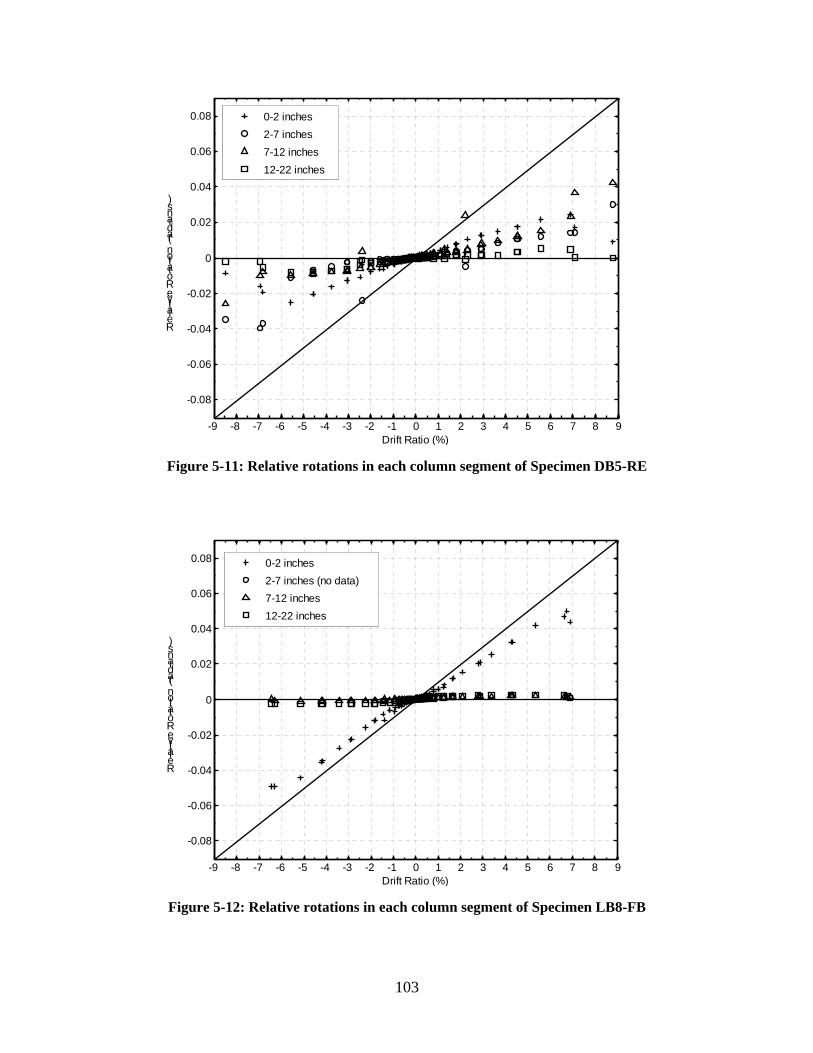
-9 -8 -7 -6 -5 -4 -3 -2 -1 0 1 2 3 4 5 6 7 8 Drift Ratio (%)
Figure 5-11: Relative rotations in each column segment of Specimen DB5-RE
-0.08
-0.06
-0.04
-0.02
0
0.02
0.04
0.06
0.08
Re la tive Ro ta tio n (ra dia n s)
0-2 inches 2-7 inches 7-12 inches 12-22 inches
)sn a diarn (otita oRevtila eR
0.08
0.06
0.04
0.02
0
-0.02
-0.04
-0.06
-0.08
0-2 inches 2-7 inches (no data) 7-12 inches 12-22 inches
-9 -8 -7 -6 -5 -4 -3 -2 -1 0 1 2 3 4 5 6 7 8 9 Drift Ratio (%)
Figure 5-12: Relative rotations in each column segment of Specimen LB8-FB
103
9
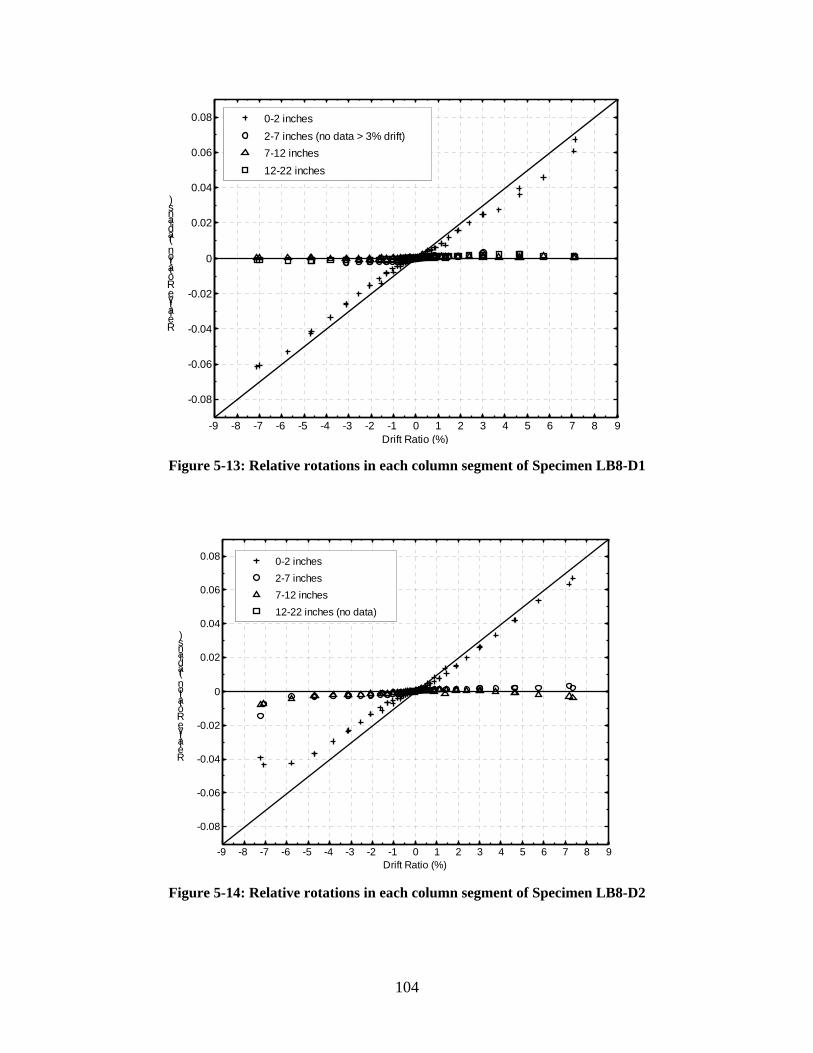
-9 -8 -7 -6 -5 -4 -3 -2 -1 0 1 2 3 4 5 6 7 8 Drift Ratio (%)
Figure 5-13: Relative rotations in each column segment of Specimen LB8-D1
-0.08
-0.06
-0.04
-0.02
0
0.02
0.04
0.06
0.08
Re la tive Ro ta tio n (ra dia n s)
0-2 inches 2-7 inches (no data > 3% drift) 7-12 inches 12-22 inches
)sn a diarn (otita oRevtialeR
0.08
0.06
0.04
0.02
0
-0.02
-0.04
-0.06
-0.08
0-2 inches 2-7 inches 7-12 inches 12-22 inches (no data)
-9 -8 -7 -6 -5 -4 -3 -2 -1 0 1 2 3 4 5 6 7 8 9 Drift Ratio (%)
Figure 5-14: Relative rotations in each column segment of Specimen LB8-D2
104
9
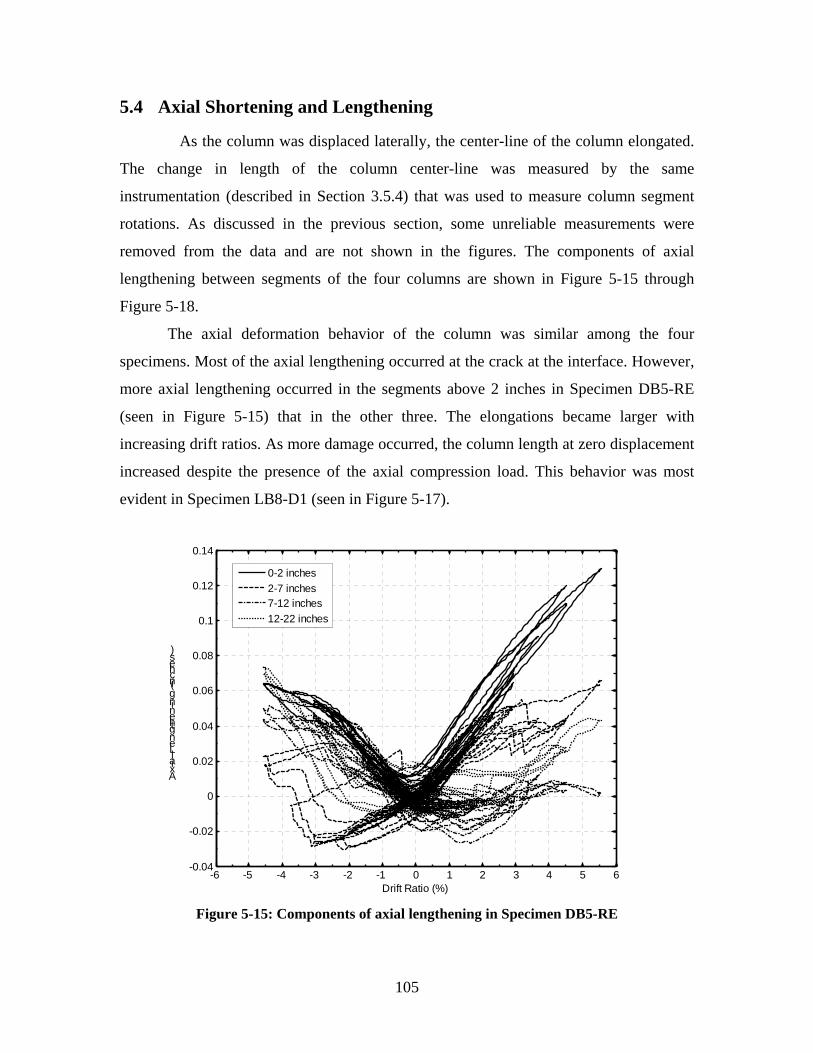
5.4 Axial Shortening and Lengthening
As the column was displaced laterally, the center-line of the column elongated.
The change in length of the column center-line was measured by the same
instrumentation (described in Section 3.5.4) that was used to measure column segment
rotations. As discussed in the previous section, some unreliable measurements were
removed from the data and are not shown in the figures. The components of axial
lengthening between segments of the four columns are shown in Figure 5-15 through
Figure 5-18.
The axial deformation behavior of the column was similar among the four
specimens. Most of the axial lengthening occurred at the crack at the interface. However,
more axial lengthening occurred in the segments above 2 inches in Specimen DB5-RE
(seen in Figure 5-15) that in the other three. The elongations became larger with
increasing drift ratios. As more damage occurred, the column length at zero displacement
increased despite the presence of the axial compression load. This behavior was most
evident in Specimen LB8-D1 (seen in Figure 5-17).
-6 -5 -4 -3 -2 -1 0 1 2 3 4 5 Drift Ratio (%)
Figure 5-15: Components of axial lengthening in Specimen DB5-RE
-0.04
-0.02
0
0.02
0.04
0.06
0.08
0.1
0.12
0.14
Axia lLe ngthe n ing(in che s)
0-2 inches 2-7 inches 7-12 inches 12-22 inches
105
6
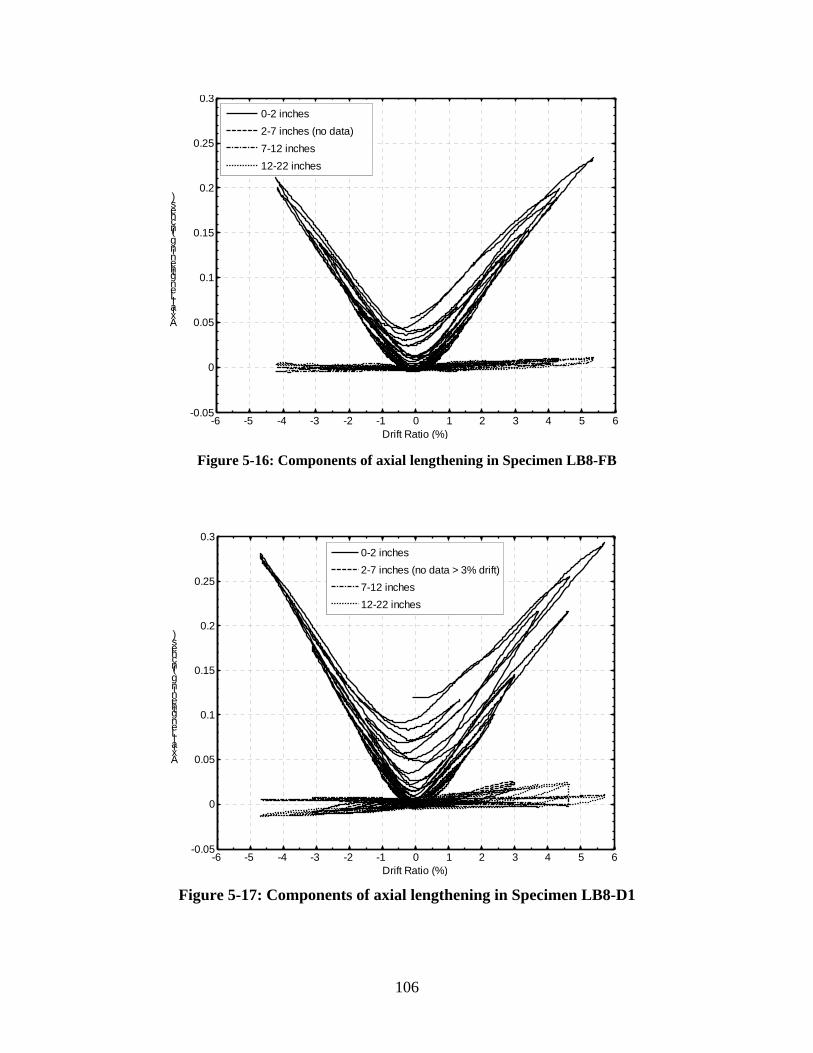
-0.05
0
0.05
0.1
0.15
0.2
0.25
0.3
Axia lLe ngthe n ing(in che s)
0-2 inches 2-7 inches (no data) 7-12 inches 12-22 inches
-6 -5 -4 -3 -2 -1 0 1 2 3 4 5 Drift Ratio (%)
Figure 5-16: Components of axial lengthening in Specimen LB8-FB
g g
-0.05
0
0.05
0.1
0.15
0.2
0.25
0.3
Axia lLe ngthe n ing(in che s)
0-2 inches 2-7 inches (no data > 3% drift) 7-12 inches 12-22 inches
-6 -5 -4 -3 -2 -1 0 1 2 3 4 5 Drift Ratio (%)
Figure 5-17: Components of axial lengthening in Specimen LB8-D1
106
6
6
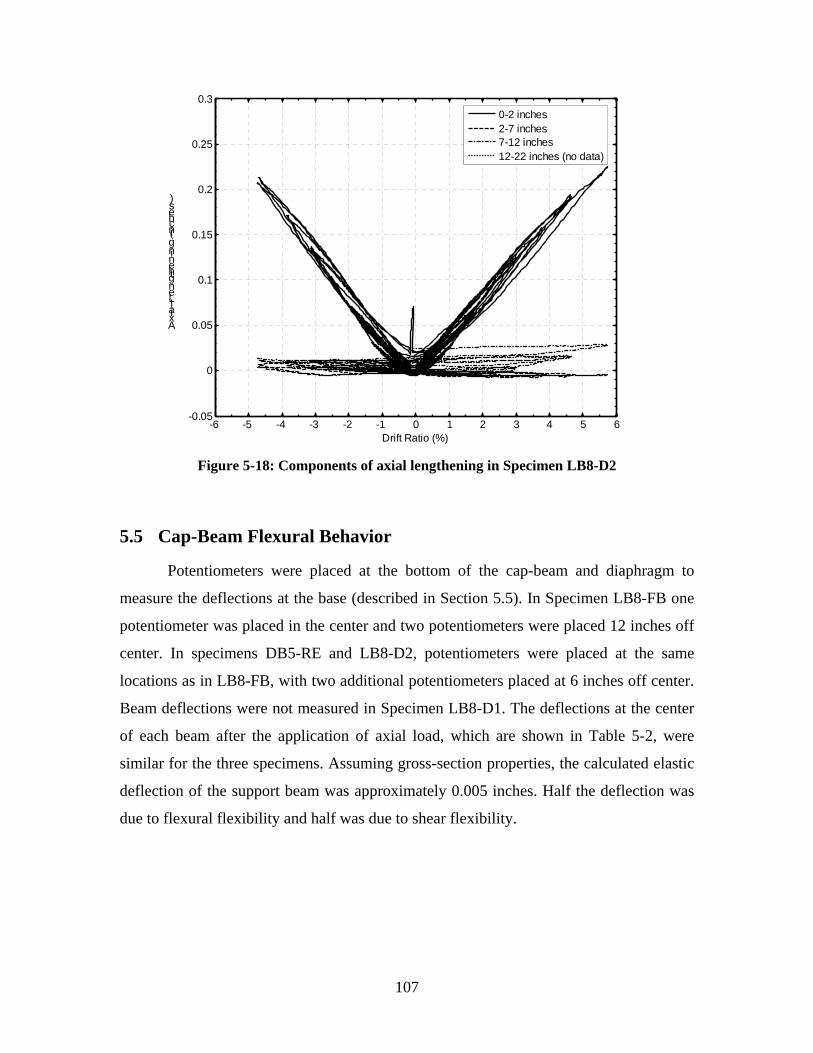
-0.05
0
0.05
0.1
0.15
0.2
0.25
0.3
Axia lLe ngthe n ing(in che s)
0-2 inches 2-7 inches 7-12 inches 12-22 inches (no data)
-6 -5 -4 -3 -2 -1 0 1 2 3 4 5 6 Drift Ratio (%)
Figure 5-18: Components of axial lengthening in Specimen LB8-D2
5.5 Cap-Beam Flexural Behavior
Potentiometers were placed at the bottom of the cap-beam and diaphragm to
measure the deflections at the base (described in Section 5.5). In Specimen LB8-FB one
potentiometer was placed in the center and two potentiometers were placed 12 inches off
center. In specimens DB5-RE and LB8-D2, potentiometers were placed at the same
locations as in LB8-FB, with two additional potentiometers placed at 6 inches off center.
Beam deflections were not measured in Specimen LB8-D1. The deflections at the center
of each beam after the application of axial load, which are shown in Table 5-2, were
similar for the three specimens. Assuming gross-section properties, the calculated elastic
deflection of the support beam was approximately 0.005 inches. Half the deflection was
due to flexural flexibility and half was due to shear flexibility.
107
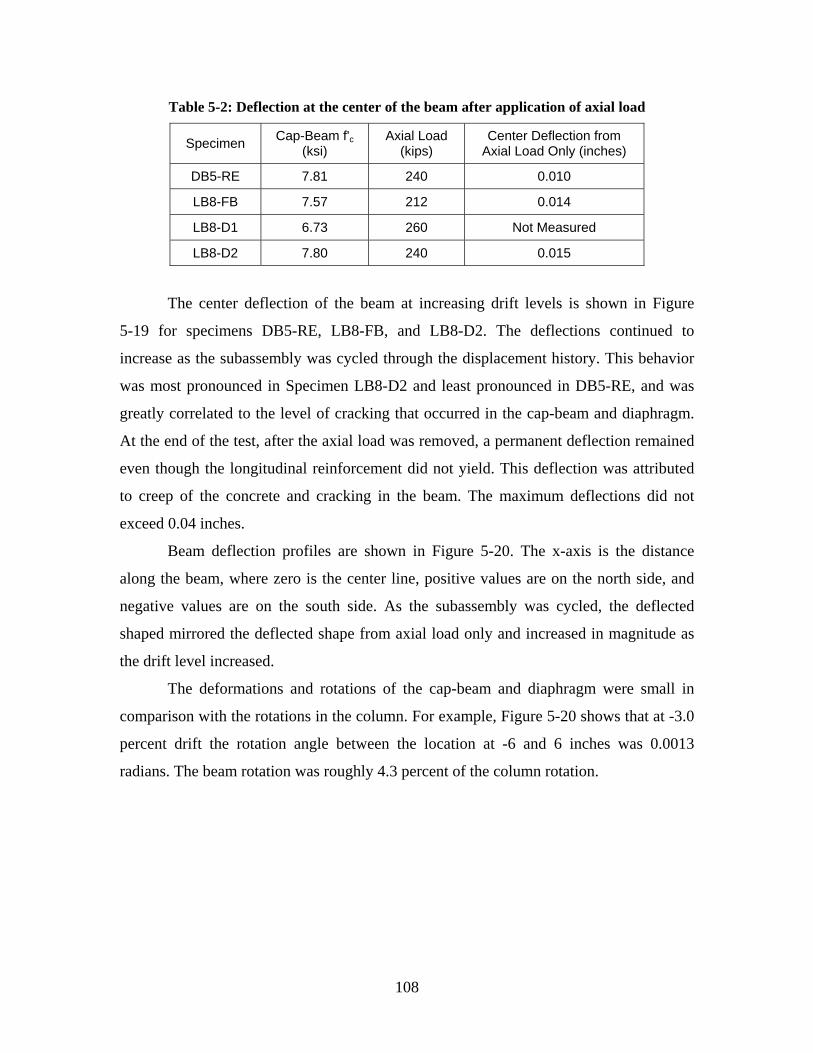
Table 5-2: Deflection at the center of the beam after application of axial load
Specimen Cap-Beam f'c (ksi)
Axial Load (kips)
Center Deflection from Axial Load Only (inches)
DB5-RE 7.81 240 0.010
LB8-FB 7.57 212 0.014
LB8-D1 6.73 260 Not Measured
LB8-D2 7.80 240 0.015
The center deflection of the beam at increasing drift levels is shown in Figure
5-19 for specimens DB5-RE, LB8-FB, and LB8-D2. The deflections continued to
increase as the subassembly was cycled through the displacement history. This behavior
was most pronounced in Specimen LB8-D2 and least pronounced in DB5-RE, and was
greatly correlated to the level of cracking that occurred in the cap-beam and diaphragm.
At the end of the test, after the axial load was removed, a permanent deflection remained
even though the longitudinal reinforcement did not yield. This deflection was attributed
to creep of the concrete and cracking in the beam. The maximum deflections did not
exceed 0.04 inches.
Beam deflection profiles are shown in Figure 5-20. The x-axis is the distance
along the beam, where zero is the center line, positive values are on the north side, and
negative values are on the south side. As the subassembly was cycled, the deflected
shaped mirrored the deflected shape from axial load only and increased in magnitude as
the drift level increased.
The deformations and rotations of the cap-beam and diaphragm were small in
comparison with the rotations in the column. For example, Figure 5-20 shows that at -3.0
percent drift the rotation angle between the location at -6 and 6 inches was 0.0013
radians. The beam rotation was roughly 4.3 percent of the column rotation.
108
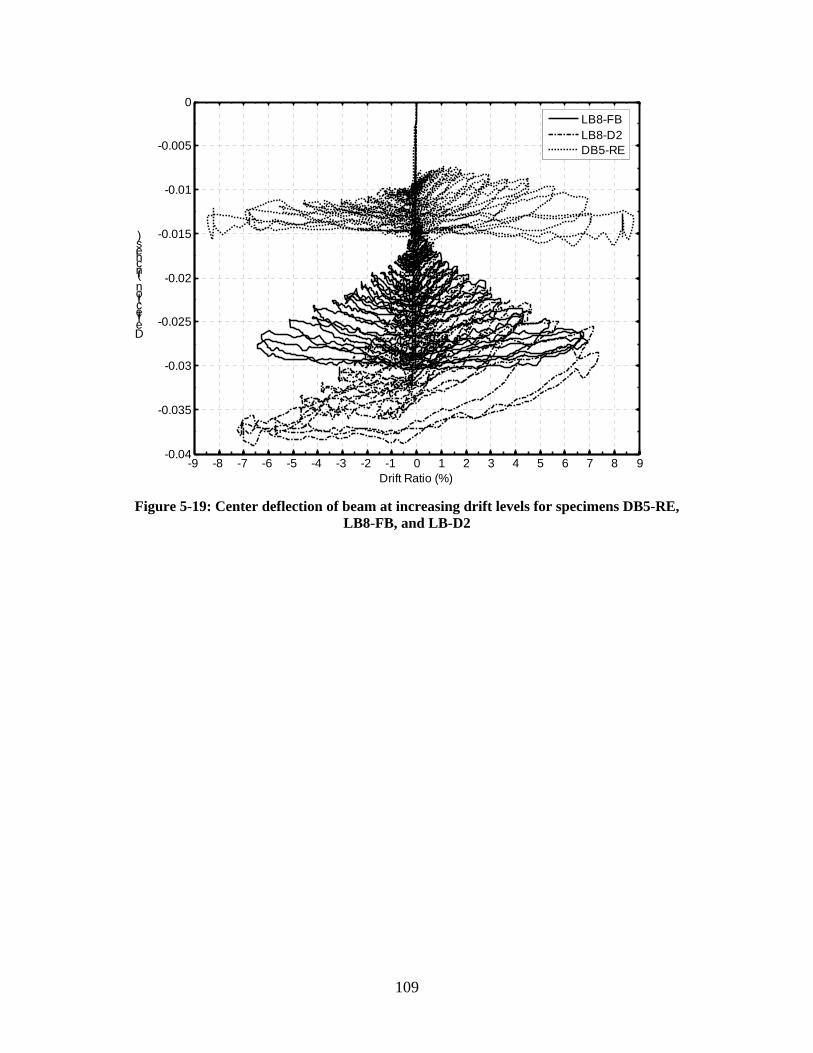
-0.04
-0.035
-0.03
-0.025
-0.02
-0.015
-0.01
-0.005
0
De fle ctio n (in che s)
LB8-FB LB8-D2 DB5-RE
-9 -8 -7 -6 -5 -4 -3 -2 -1 0 1 2 3 4 5 6 7 8 9 Drift Ratio (%)
Figure 5-19: Center deflection of beam at increasing drift levels for specimens DB5-RE, LB8-FB, and LB-D2
109
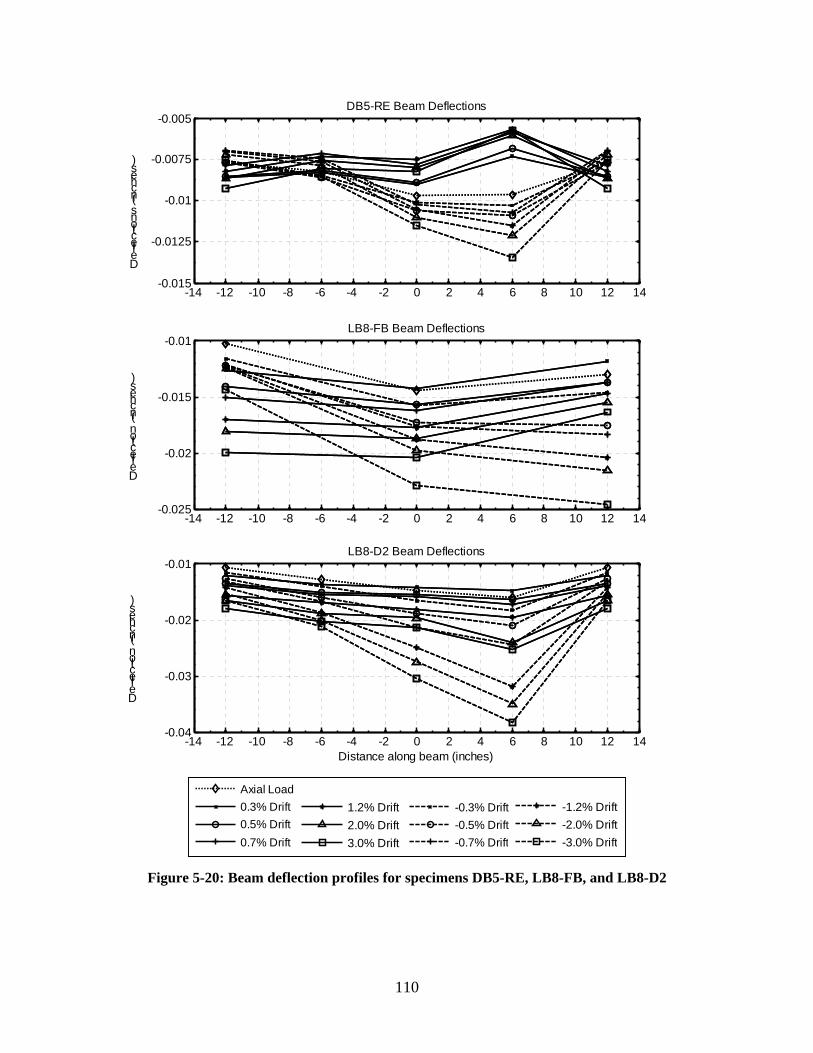
DB5-RE Beam Deflections
-0.015
-0.0125
-0.01
-0.0075
-0.005
D e fle ctio n s (in che s)
-14 -12 -10 -8 -6 -4 -2 0 2 4 6 8 10 12 14
LB8-FB Beam Deflections
-14 -12 -10 -8 -6 -4 -2 0 2 4 6 8 10 12 14
LB8-D2 Beam Deflections
-0.025
-0.02
-0.015
-0.01
D e fle ctio n (in che s)
-0.04
-0.03
-0.02
-0.01
De fle ctio n (in che s)
-14 -12 -10 -8 -6 -4 -2 0 2 4 6 8 10 12 14 Distance along beam (inches)
0.3% Drift Axial Load
1.2% Drift -0.3% Drift -1.2% Drift 0.5% Drift 2.0% Drift -0.5% Drift -2.0% Drift 0.7% Drift 3.0% Drift -0.7% Drift -3.0% Drift
Figure 5-20: Beam deflection profiles for specimens DB5-RE, LB8-FB, and LB8-D2
110
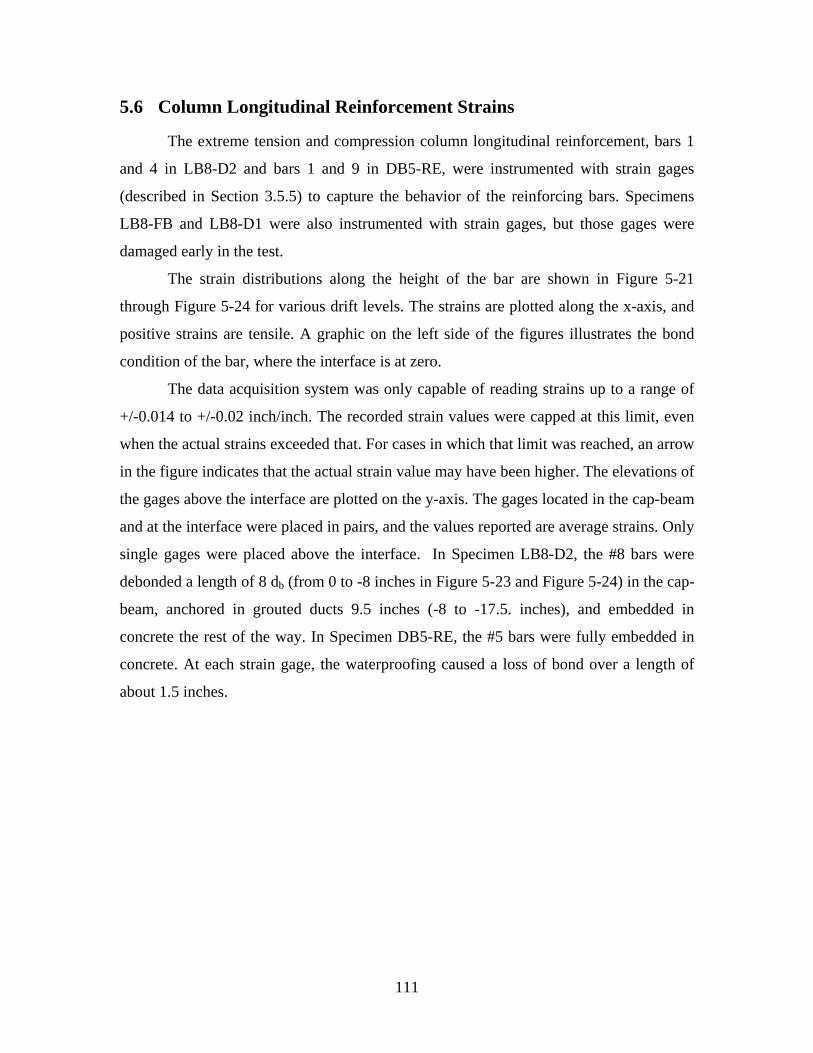
5.6 Column Longitudinal Reinforcement Strains
The extreme tension and compression column longitudinal reinforcement, bars 1
and 4 in LB8-D2 and bars 1 and 9 in DB5-RE, were instrumented with strain gages
(described in Section 3.5.5) to capture the behavior of the reinforcing bars. Specimens
LB8-FB and LB8-D1 were also instrumented with strain gages, but those gages were
damaged early in the test.
The strain distributions along the height of the bar are shown in Figure 5-21
through Figure 5-24 for various drift levels. The strains are plotted along the x-axis, and
positive strains are tensile. A graphic on the left side of the figures illustrates the bond
condition of the bar, where the interface is at zero.
The data acquisition system was only capable of reading strains up to a range of
+/-0.014 to +/-0.02 inch/inch. The recorded strain values were capped at this limit, even
when the actual strains exceeded that. For cases in which that limit was reached, an arrow
in the figure indicates that the actual strain value may have been higher. The elevations of
the gages above the interface are plotted on the y-axis. The gages located in the cap-beam
and at the interface were placed in pairs, and the values reported are average strains. Only
single gages were placed above the interface. In Specimen LB8-D2, the #8 bars were
debonded a length of 8 db (from 0 to -8 inches in Figure 5-23 and Figure 5-24) in the cap-
beam, anchored in grouted ducts 9.5 inches (-8 to -17.5. inches), and embedded in
concrete the rest of the way. In Specimen DB5-RE, the #5 bars were fully embedded in
concrete. At each strain gage, the waterproofing caused a loss of bond over a length of
about 1.5 inches.
111
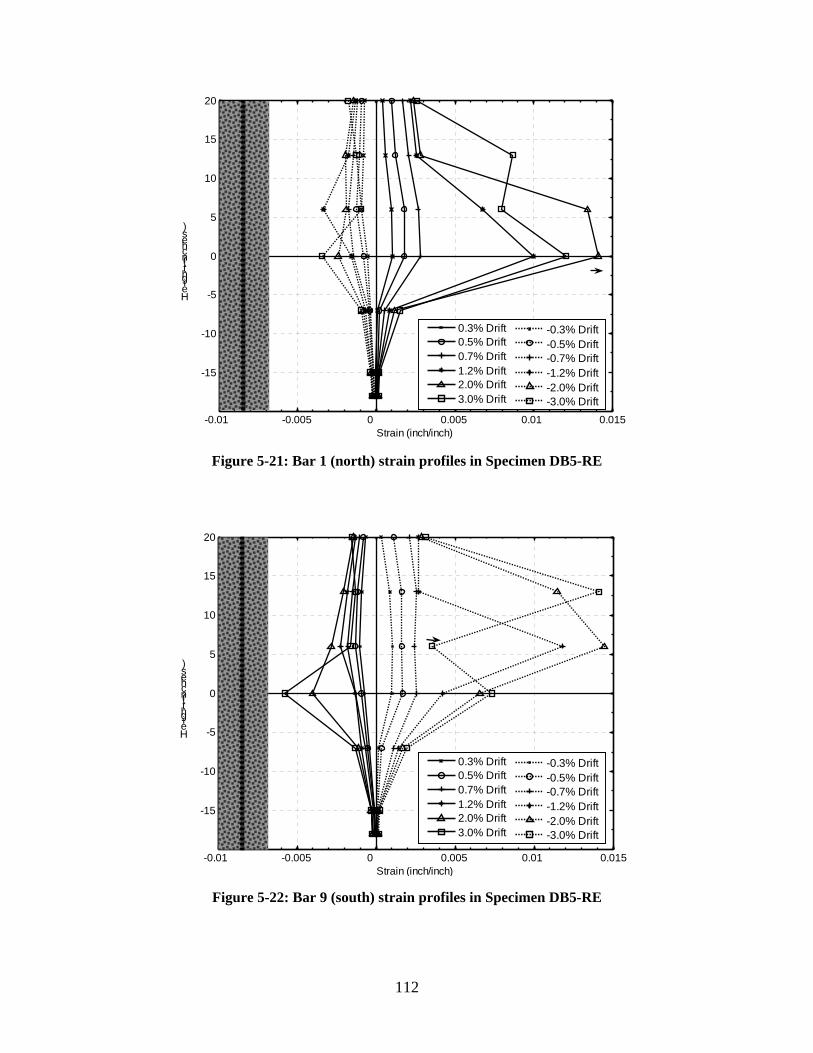
c
)sehn(ithgi eH
20
15
10
5
0
-5
-10
-15
0.3% Drift 0.5% Drift 0.7% Drift 1.2% Drift 2.0% Drift 3.0% Drift
-0.3% Drift -0.5% Drift -0.7% Drift -1.2% Drift -2.0% Drift -3.0% Drift
-0.01 -0.005 0 0.005 0.01 0.015 Strain (inch/inch)
Figure 5-21: Bar 1 (north) strain profiles in Specimen DB5-RE
-0.01 -0.005 0 0.005 0.01 0.015
-15
-10
-5
0
5
10
15
20
He ight(in che s)
0.3% Drift 0.5% Drift 0.7% Drift 1.2% Drift 2.0% Drift 3.0% Drift
-0.3% Drift -0.5% Drift -0.7% Drift -1.2% Drift -2.0% Drift -3.0% Drift
Strain (inch/inch)
Figure 5-22: Bar 9 (south) strain profiles in Specimen DB5-RE
112
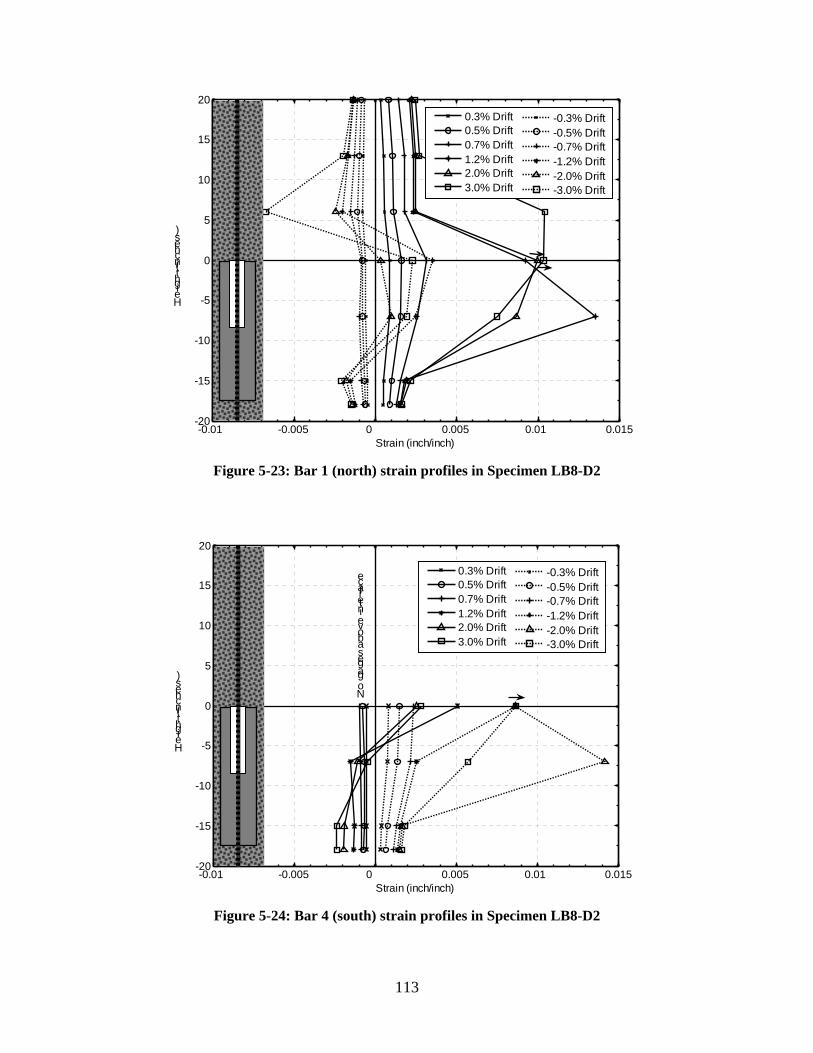
)sehcn(ithgieH
-0.01 -0.005 0 0.005 0.01 0.015 Strain (inch/inch)
Figure 5-23: Bar 1 (north) strain profiles in Specimen LB8-D2
-20
-15
-10
-5
0
5
10
15
20 0.3% Drift 0.5% Drift 0.7% Drift 1.2% Drift 2.0% Drift 3.0% Drift
-0.3% Drift -0.5% Drift -0.7% Drift -1.2% Drift -2.0% Drift -3.0% Drift
20
15
10
5 )sehnc 0(ithgi He -5
-10
-15
-20
No gage s a bo ve in te rfa ce 0.3% Drift
0.5% Drift 0.7% Drift 1.2% Drift 2.0% Drift 3.0% Drift
-0.3% Drift -0.5% Drift -0.7% Drift -1.2% Drift -2.0% Drift -3.0% Drift
-0.01 -0.005 0 0.005 0.01 0.015 Strain (inch/inch)
Figure 5-24: Bar 4 (south) strain profiles in Specimen LB8-D2
113
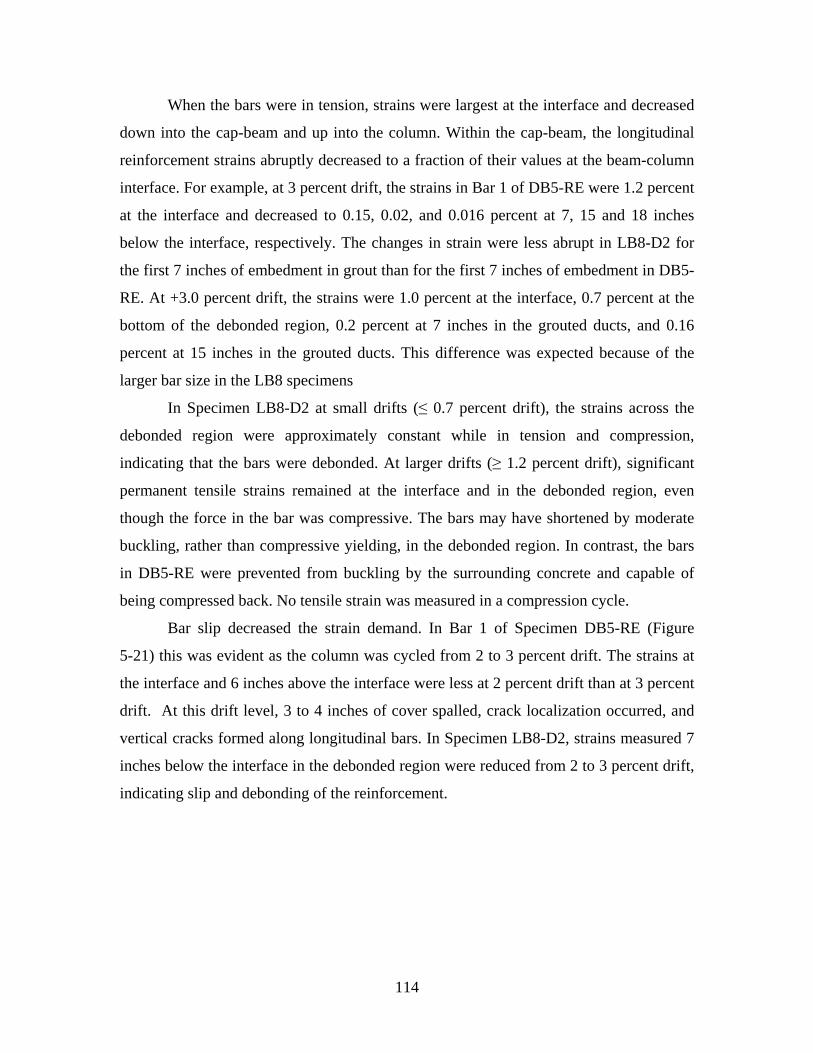
When the bars were in tension, strains were largest at the interface and decreased
down into the cap-beam and up into the column. Within the cap-beam, the longitudinal
reinforcement strains abruptly decreased to a fraction of their values at the beam-column
interface. For example, at 3 percent drift, the strains in Bar 1 of DB5-RE were 1.2 percent
at the interface and decreased to 0.15, 0.02, and 0.016 percent at 7, 15 and 18 inches
below the interface, respectively. The changes in strain were less abrupt in LB8-D2 for
the first 7 inches of embedment in grout than for the first 7 inches of embedment in DB5-
RE. At +3.0 percent drift, the strains were 1.0 percent at the interface, 0.7 percent at the
bottom of the debonded region, 0.2 percent at 7 inches in the grouted ducts, and 0.16
percent at 15 inches in the grouted ducts. This difference was expected because of the
larger bar size in the LB8 specimens
In Specimen LB8-D2 at small drifts (≤ 0.7 percent drift), the strains across the
debonded region were approximately constant while in tension and compression,
indicating that the bars were debonded. At larger drifts (≥ 1.2 percent drift), significant
permanent tensile strains remained at the interface and in the debonded region, even
though the force in the bar was compressive. The bars may have shortened by moderate
buckling, rather than compressive yielding, in the debonded region. In contrast, the bars
in DB5-RE were prevented from buckling by the surrounding concrete and capable of
being compressed back. No tensile strain was measured in a compression cycle.
Bar slip decreased the strain demand. In Bar 1 of Specimen DB5-RE (Figure
5-21) this was evident as the column was cycled from 2 to 3 percent drift. The strains at
the interface and 6 inches above the interface were less at 2 percent drift than at 3 percent
drift. At this drift level, 3 to 4 inches of cover spalled, crack localization occurred, and
vertical cracks formed along longitudinal bars. In Specimen LB8-D2, strains measured 7
inches below the interface in the debonded region were reduced from 2 to 3 percent drift,
indicating slip and debonding of the reinforcement.
114
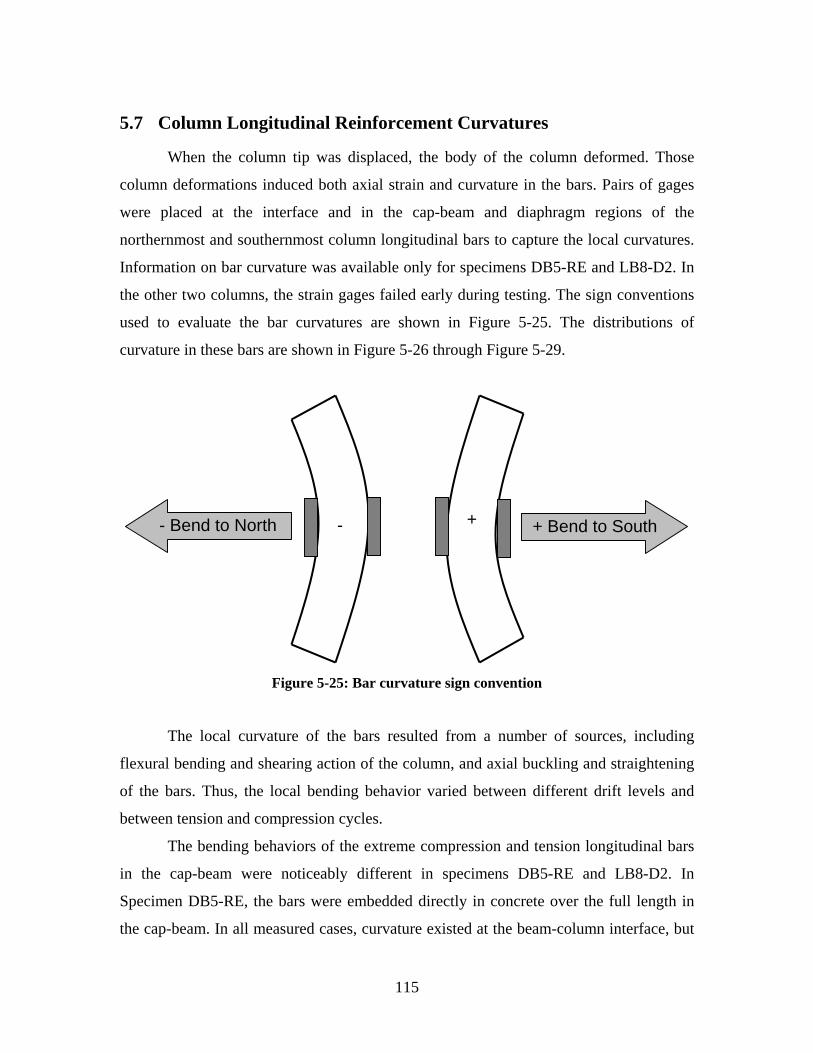
5.7 Column Longitudinal Reinforcement Curvatures
When the column tip was displaced, the body of the column deformed. Those
column deformations induced both axial strain and curvature in the bars. Pairs of gages
were placed at the interface and in the cap-beam and diaphragm regions of the
northernmost and southernmost column longitudinal bars to capture the local curvatures.
Information on bar curvature was available only for specimens DB5-RE and LB8-D2. In
the other two columns, the strain gages failed early during testing. The sign conventions
used to evaluate the bar curvatures are shown in Figure 5-25. The distributions of
curvature in these bars are shown in Figure 5-26 through Figure 5-29.
+ Bend to South- Bend to North +-
Figure 5-25: Bar curvature sign convention
The local curvature of the bars resulted from a number of sources, including
flexural bending and shearing action of the column, and axial buckling and straightening
of the bars. Thus, the local bending behavior varied between different drift levels and
between tension and compression cycles.
The bending behaviors of the extreme compression and tension longitudinal bars
in the cap-beam were noticeably different in specimens DB5-RE and LB8-D2. In
Specimen DB5-RE, the bars were embedded directly in concrete over the full length in
the cap-beam. In all measured cases, curvature existed at the beam-column interface, but
115
it was negligible at the first gage location within the cap-beam, 7 inches below the
interface. This behavior can be seen in bars 1 and 9 in Figure 5-26 and Figure 5-27. Two
explanations are plausible. The most likely explanation is that the concrete was
sufficiently rigid to suppress all curvature in the cap-beam. However, it is also possible
that the bar had an oscillating curvature diagram, as occurs in a beam on an elastic
foundation, and that a node occurred at 7 inches below the interface.
By contrast, the bars in Specimen LB8-D2 were debonded over the first 8 inches
in the cap-beam by means of a plastic sleeve surrounding the bar. The small gap around
the sleeve allowed enough lateral movement for significant curvatures to exist 7 inches
down from the interface. This can be seen in Figure 5-28 and Figure 5-29 for bars 1 and
4.
While curvatures were evident within the cap-beam, the distribution of that
curvature did not conform to a consistent pattern. At +/- 1.2 and +/- 3.0 percent drift in
Bar 1, and at +2.0 and +/-3.0 percent drift in Bar 4, the curvatures at the interface at 7
inches down into the cap-beam had opposite signs, suggesting double-curvature bending.
This behavior is illustrated in Figure 5-30. However, the behavior at low drift levels (≤
0.7 percent drift) was different. In Bar 1 the curvatures were in the same direction at both
locations, and in Bar 4 the curvature at 7 inches below the interface was essentially zero.
The variations in curvatures that formed along the bars in LB8-D2 also account
for the inability of the bars to be recompressed and for the existence of tensile strains
when the bars were in compression (discussed in Section 5.6). The double-curvature
bending suggests that the bars were loaded at the interface by a combination of rotation
and lateral translation due to shear sliding. That combination would be very difficult to
predict.
The curvature also suggests that after inelastic action the bars may have been
shortened by buckling rather than yielding in compression. That behavior would be
consistent with the fact that they showed net tensile strain even when they were subjected
to compressive stress (see Section 5.6)
116
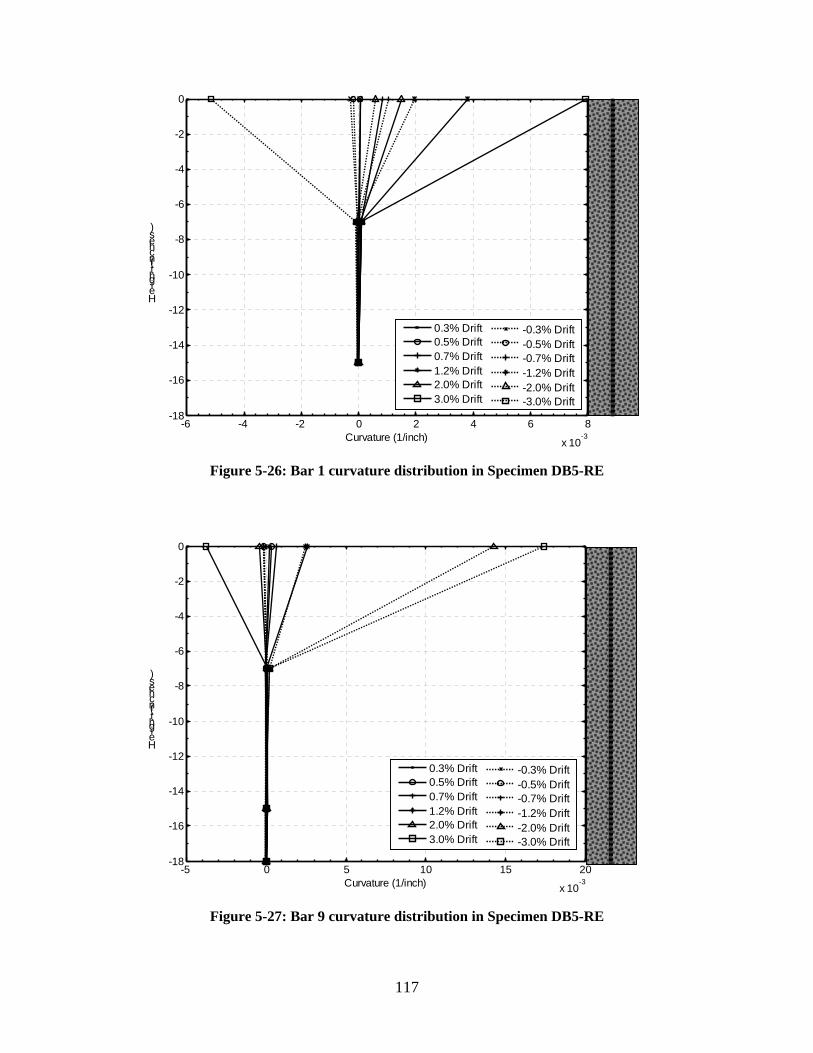
-6 -4 -2 0 2 4 6 8 Curvature (1/inch) -3
x 10
Figure 5-26: Bar 1 curvature distribution in Specimen DB5-RE
-18
-16
-14
-12
-10
-8
-6
-4
-2
0
He ight(in che s)
0.3% Drift 0.5% Drift 0.7% Drift 1.2% Drift 2.0% Drift 3.0% Drift
-0.3% Drift -0.5% Drift -0.7% Drift -1.2% Drift -2.0% Drift -3.0% Drift
-5 0 5 10 15 20 Curvature (1/inch) -3
x 10
Figure 5-27: Bar 9 curvature distribution in Specimen DB5-RE
-18
-16
-14
-12
-10
-8
-6
-4
-2
0
He ight(in che s)
0.3% Drift 0.5% Drift 0.7% Drift 1.2% Drift 2.0% Drift 3.0% Drift
-0.3% Drift -0.5% Drift -0.7% Drift -1.2% Drift -2.0% Drift -3.0% Drift
117
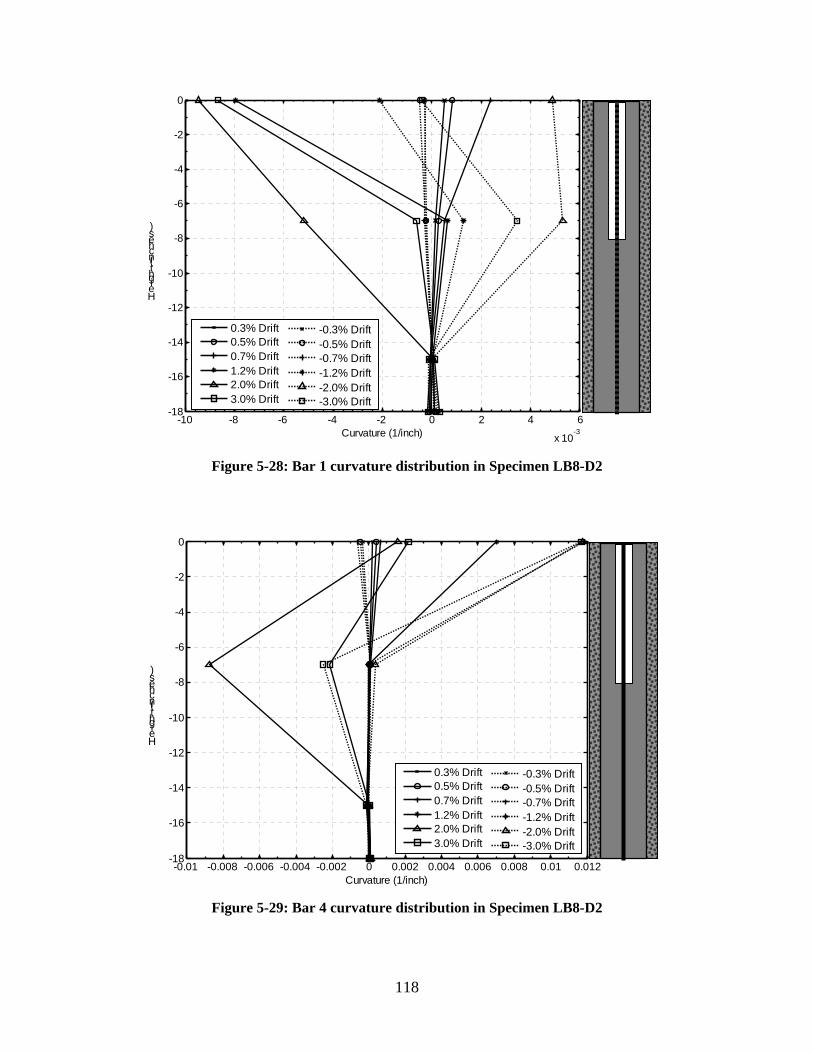
-18
-16
-14
-12
-10
-8
-6
-4
-2
0
He ight(in che s)
0.3% Drift 0.5% Drift 0.7% Drift 1.2% Drift 2.0% Drift 3.0% Drift
-0.3% Drift -0.5% Drift -0.7% Drift -1.2% Drift -2.0% Drift -3.0% Drift
-10 -8 -6 -4 -2 0 2 4 6 Curvature (1/inch) -3
x 10
Figure 5-28: Bar 1 curvature distribution in Specimen LB8-D2
-18
-16
-14
-12
-10
-8
-6
-4
-2
0
He ight(in che s)
0.3% Drift 0.5% Drift 0.7% Drift 1.2% Drift 2.0% Drift 3.0% Drift
-0.3% Drift -0.5% Drift -0.7% Drift -1.2% Drift -2.0% Drift -3.0% Drift
-0.01 -0.008 -0.006 -0.004 -0.002 0 0.002 0.004 0.006 0.008 0.01 0.012 Curvature (1/inch)
Figure 5-29: Bar 4 curvature distribution in Specimen LB8-D2
118
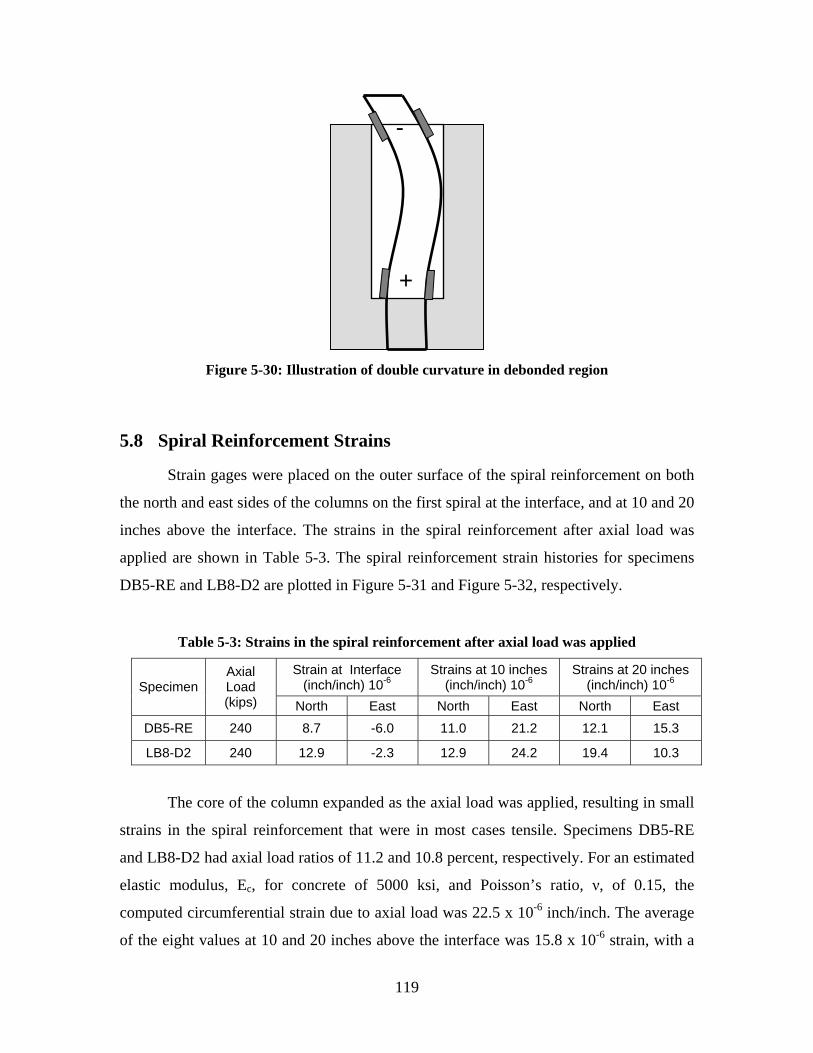
+
-
Figure 5-30: Illustration of double curvature in debonded region
5.8 Spiral Reinforcement Strains
Strain gages were placed on the outer surface of the spiral reinforcement on both
the north and east sides of the columns on the first spiral at the interface, and at 10 and 20
inches above the interface. The strains in the spiral reinforcement after axial load was
applied are shown in Table 5-3. The spiral reinforcement strain histories for specimens
DB5-RE and LB8-D2 are plotted in Figure 5-31 and Figure 5-32, respectively.
Table 5-3: Strains in the spiral reinforcement after axial load was applied
Specimen Axial Load
Strain at Interface (inch/inch) 10-6
Strains at 10 inches (inch/inch) 10-6
Strains at 20 inches (inch/inch) 10-6
(kips) North East North East North East DB5-RE 240 8.7 -6.0 11.0 21.2 12.1 15.3
LB8-D2 240 12.9 -2.3 12.9 24.2 19.4 10.3
The core of the column expanded as the axial load was applied, resulting in small
strains in the spiral reinforcement that were in most cases tensile. Specimens DB5-RE
and LB8-D2 had axial load ratios of 11.2 and 10.8 percent, respectively. For an estimated
elastic modulus, Ec, for concrete of 5000 ksi, and Poisson’s ratio, ν, of 0.15, the
computed circumferential strain due to axial load was 22.5 x 10⁻⁶ inch/inch. The average
of the eight values at 10 and 20 inches above the interface was 15.8 x 10⁻⁶ strain, with a
119
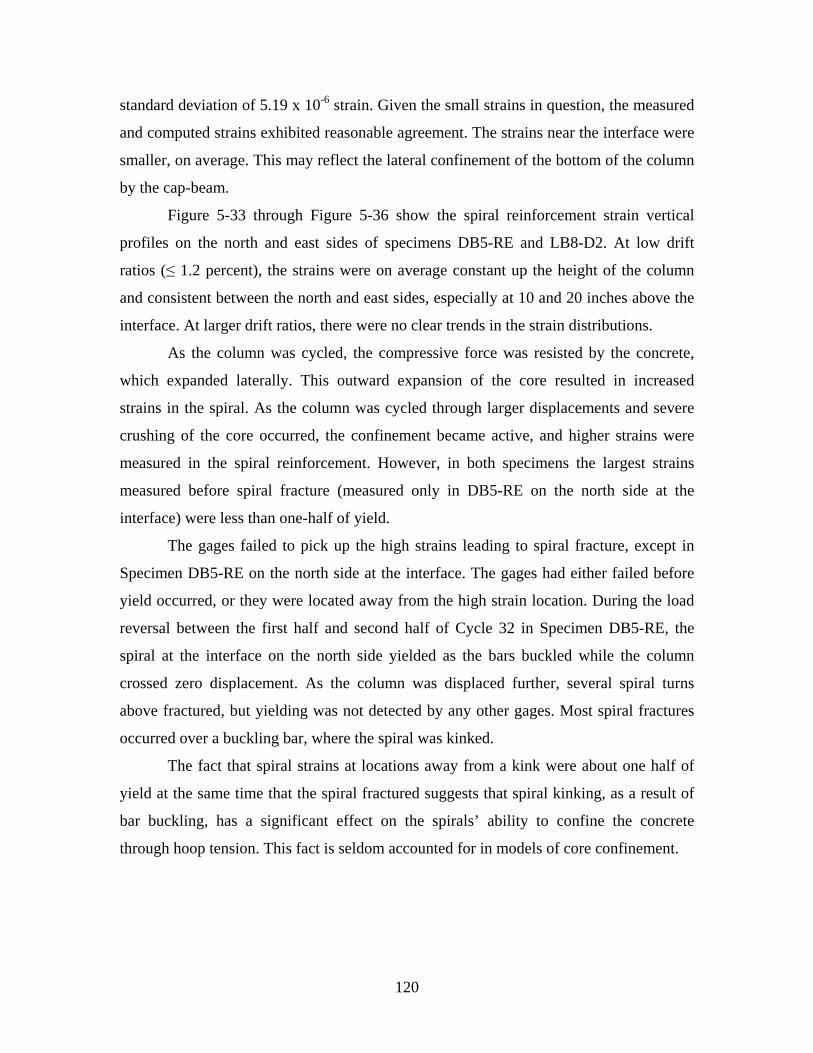
standard deviation of 5.19 x 10⁻⁶ strain. Given the small strains in question, the measured
and computed strains exhibited reasonable agreement. The strains near the interface were
smaller, on average. This may reflect the lateral confinement of the bottom of the column
by the cap-beam.
Figure 5-33 through Figure 5-36 show the spiral reinforcement strain vertical
profiles on the north and east sides of specimens DB5-RE and LB8-D2. At low drift
ratios (≤ 1.2 percent), the strains were on average constant up the height of the column
and consistent between the north and east sides, especially at 10 and 20 inches above the
interface. At larger drift ratios, there were no clear trends in the strain distributions.
As the column was cycled, the compressive force was resisted by the concrete,
which expanded laterally. This outward expansion of the core resulted in increased
strains in the spiral. As the column was cycled through larger displacements and severe
crushing of the core occurred, the confinement became active, and higher strains were
measured in the spiral reinforcement. However, in both specimens the largest strains
measured before spiral fracture (measured only in DB5-RE on the north side at the
interface) were less than one-half of yield.
The gages failed to pick up the high strains leading to spiral fracture, except in
Specimen DB5-RE on the north side at the interface. The gages had either failed before
yield occurred, or they were located away from the high strain location. During the load
reversal between the first half and second half of Cycle 32 in Specimen DB5-RE, the
spiral at the interface on the north side yielded as the bars buckled while the column
crossed zero displacement. As the column was displaced further, several spiral turns
above fractured, but yielding was not detected by any other gages. Most spiral fractures
occurred over a buckling bar, where the spiral was kinked.
The fact that spiral strains at locations away from a kink were about one half of
yield at the same time that the spiral fractured suggests that spiral kinking, as a result of
bar buckling, has a significant effect on the spirals’ ability to confine the concrete
through hoop tension. This fact is seldom accounted for in models of core confinement.
120
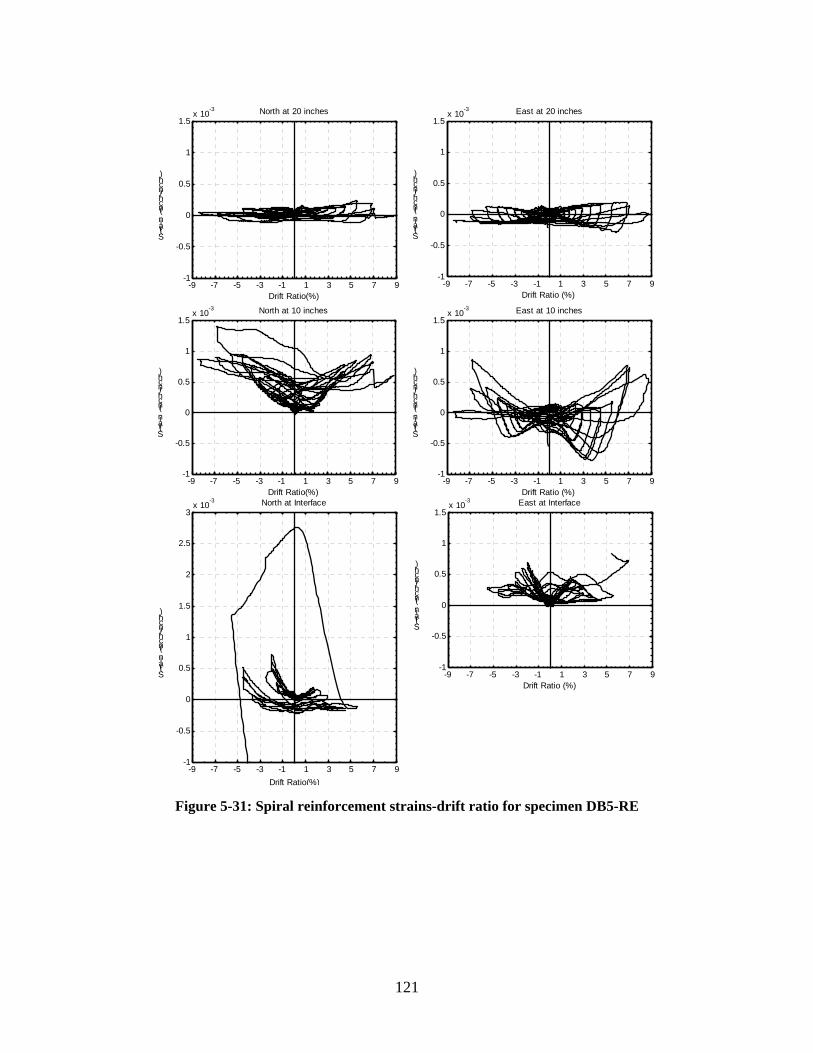
-3 -3North at 20 inches East at 20 inches x 10 x 101.5 1.5
11
)) hh c 0.5 c 0.5 n h/in
h/icc n(i
i0
n (i 0 n a n iarr tt S
-0.5 S
-0.5
-1 -9 -7 -5 -3 -1 1 3 5 7 9 -9 -7 -5 -3 -1 1 3 5 7 9
-1
Drift Ratio(%) Drift Ratio (%) -3 -3North at 10 inches East at 10 inches x 10 x 10
1.5 1.5
1 1
) )h hc 0.5 c 0.5 n n h/i
h/i
c c n n(i 0 (i 0n ni ia ar rt tS S
-0.5 -0.5
-1 -1 -9 -7 -5 -3 -1 1 3 5 7 9 -9 -7 -5 -3 -1 1 3 5 7 9
x 10-3
Drift Ratio(%) North at Interface x 10
-3 Drift Ratio (%)
East at Interface 3 1.5
2.5 1
)hc 0.5 2 n h/ic n(i 01.5 n
hi) artc n S/i -0.5
(ihc 1 n in art 0.5 -1 S -9 -7 -5 -3 -1 1 3 5 7 9
Drift Ratio (%) 0
-0.5
-1 -9 -7 -5 -3 -1 1 3 5 7 9
Drift Ratio(%)
Figure 5-31: Spiral reinforcement strains-drift ratio for specimen DB5-RE
121
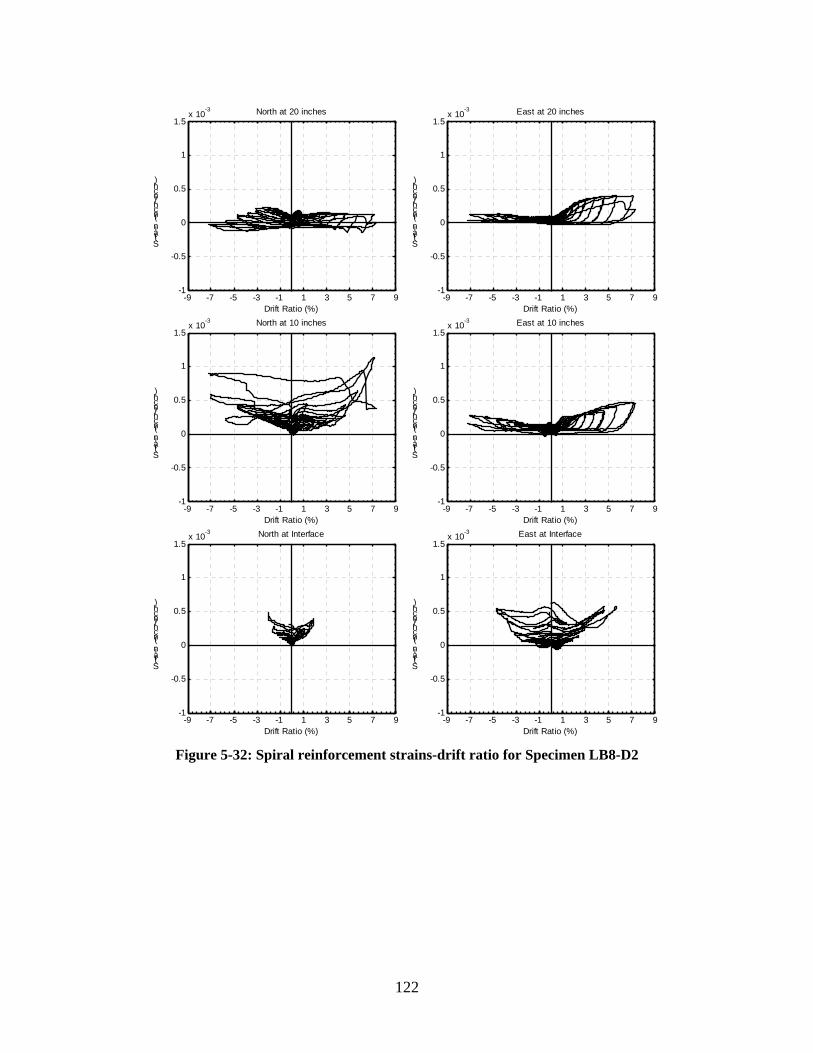
-3 -3North at 20 inches East at 20 inches x 10 x 101.5 1.5
1 1
) )h h0.5 0.5 c cn n h/i
h/i
c c n n(i (i0 0n ni ia ar rt tS S
-0.5 -0.5
-1 -1 -9 -7 -5 -3 -1 1 3 5 7 9 -9 -7 -5 -3 -1 1 3 5 7 9
Drift Ratio (%) Drift Ratio (%) -3 -3North at 10 inches East at 10 inches x 10 x 10
1.5 1.5
1 1
) )h h0.5 0.5 c c n n h/i
h/i
c c n n(i (i0 0n ni ia ar rt tS S
-0.5 -0.5
-1 -1 -9 -7 -5 -3 -1 1 3 5 7 9 -9 -7 -5 -3 -1 1 3 5 7 9
Drift Ratio (%) Drift Ratio (%) -3 -3North at Interface East at Interface x 10 x 10
1.5 1.5
1 1
) )h h0.5 0.5 c c n n h/i
h/i
c c n n(i (i0 0n ni ia ar rt tS S
-0.5 -0.5
-1 -1 -9 -7 -5 -3 -1 1 3 5 7 9 -9 -7 -5 -3 -1 1 3 5 7 9
Drift Ratio (%) Drift Ratio (%)
Figure 5-32: Spiral reinforcement strains-drift ratio for Specimen LB8-D2
122
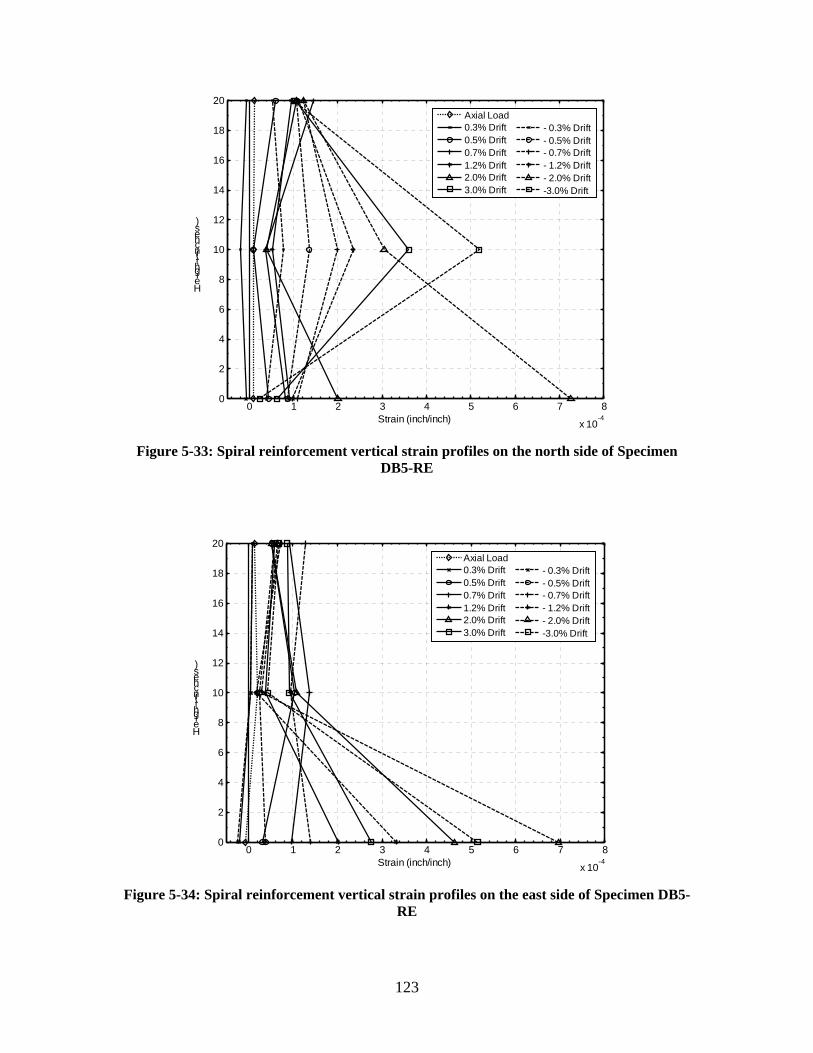
0 1 2 3 4 5 6 7 80
2
4
6
8
10
12
14
16
18
20
He ight(in che s)
Axial Load 0.3% Drift 0.5% Drift 0.7% Drift 1.2% Drift 2.0% Drift 3.0% Drift
- 0.3% Drift - 0.5% Drift - 0.7% Drift - 1.2% Drift - 2.0% Drift -3.0% Drift
-4Strain (inch/inch) x 10
Figure 5-33: Spiral reinforcement vertical strain profiles on the north side of Specimen DB5-RE
0 1 2 3 4 5 6 7 80
2
4
6
8
10
12
14
16
18
20
He ight(in che s)
Axial Load 0.3% Drift 0.5% Drift 0.7% Drift 1.2% Drift 2.0% Drift 3.0% Drift
- 0.3% Drift - 0.5% Drift - 0.7% Drift - 1.2% Drift - 2.0% Drift -3.0% Drift
-4Strain (inch/inch) x 10
Figure 5-34: Spiral reinforcement vertical strain profiles on the east side of Specimen DB5-RE
123
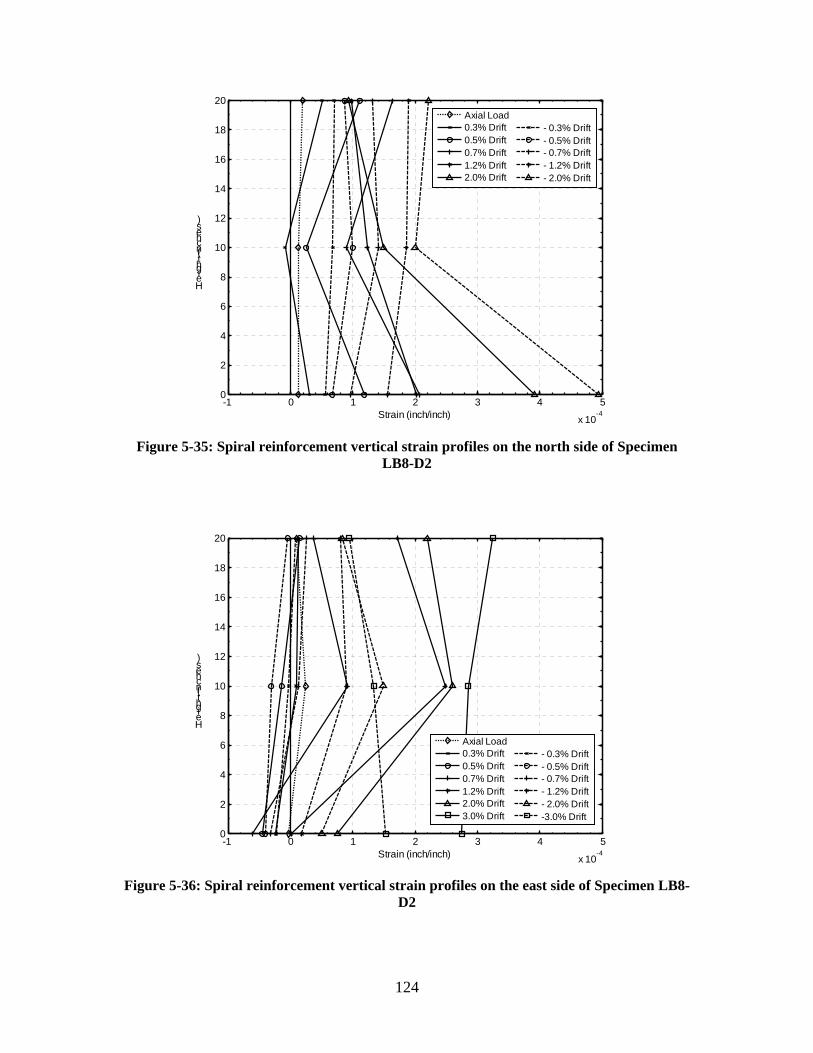
( )
)sehcn(ithgi eH
-1 0 1 2 3 4 5 -4
x 10
0
2
4
6
8
10
12
14
16
18
20
Strain (inch/inch)
Axial Load 0.3% Drift 0.5% Drift 0.7% Drift 1.2% Drift 2.0% Drift
- 0.3% Drift - 0.5% Drift - 0.7% Drift - 1.2% Drift - 2.0% Drift
Figure 5-35: Spiral reinforcement vertical strain profiles on the north side of Specimen LB8-D2
)sehcn(ithgi eH
-1 0 1 2 3 4 5 -4
x 10
0
2
4
6
8
10
12
14
16
18
20
Strain (inch/inch)
Axial Load 0.3% Drift 0.5% Drift 0.7% Drift 1.2% Drift 2.0% Drift 3.0% Drift
- 0.3% Drift - 0.5% Drift - 0.7% Drift - 1.2% Drift - 2.0% Drift -3.0% Drift
Figure 5-36: Spiral reinforcement vertical strain profiles on the east side of Specimen LB8-D2
124
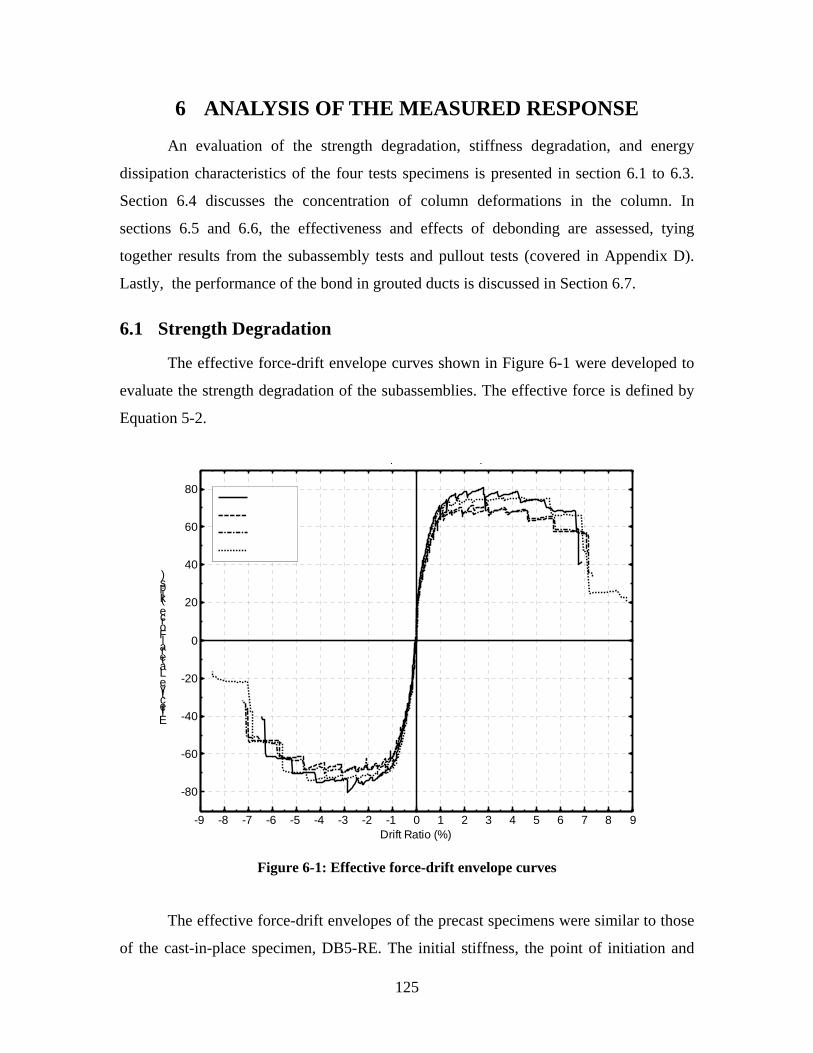
6 ANALYSIS OF THE MEASURED RESPONSE
An evaluation of the strength degradation, stiffness degradation, and energy
dissipation characteristics of the four tests specimens is presented in section 6.1 to 6.3.
Section 6.4 discusses the concentration of column deformations in the column. In
sections 6.5 and 6.6, the effectiveness and effects of debonding are assessed, tying
together results from the subassembly tests and pullout tests (covered in Appendix D).
Lastly, the performance of the bond in grouted ducts is discussed in Section 6.7.
6.1 Strength Degradation
The effective force-drift envelope curves shown in Figure 6-1 were developed to
evaluate the strength degradation of the subassemblies. The effective force is defined by
Equation 5-2.
p p
80 LB8-FB LB8-D1
60 LB8-D2 DB5-RE
40 )spki( 20 ecrFo l 0aretaLe -20 vticeff -40E
-60
-80
-9 -8 -7 -6 -5 -4 -3 -2 -1 0 1 2 3 4 5 6 7 8 9 Drift Ratio (%)
Figure 6-1: Effective force-drift envelope curves
The effective force-drift envelopes of the precast specimens were similar to those
of the cast-in-place specimen, DB5-RE. The initial stiffness, the point of initiation and
125
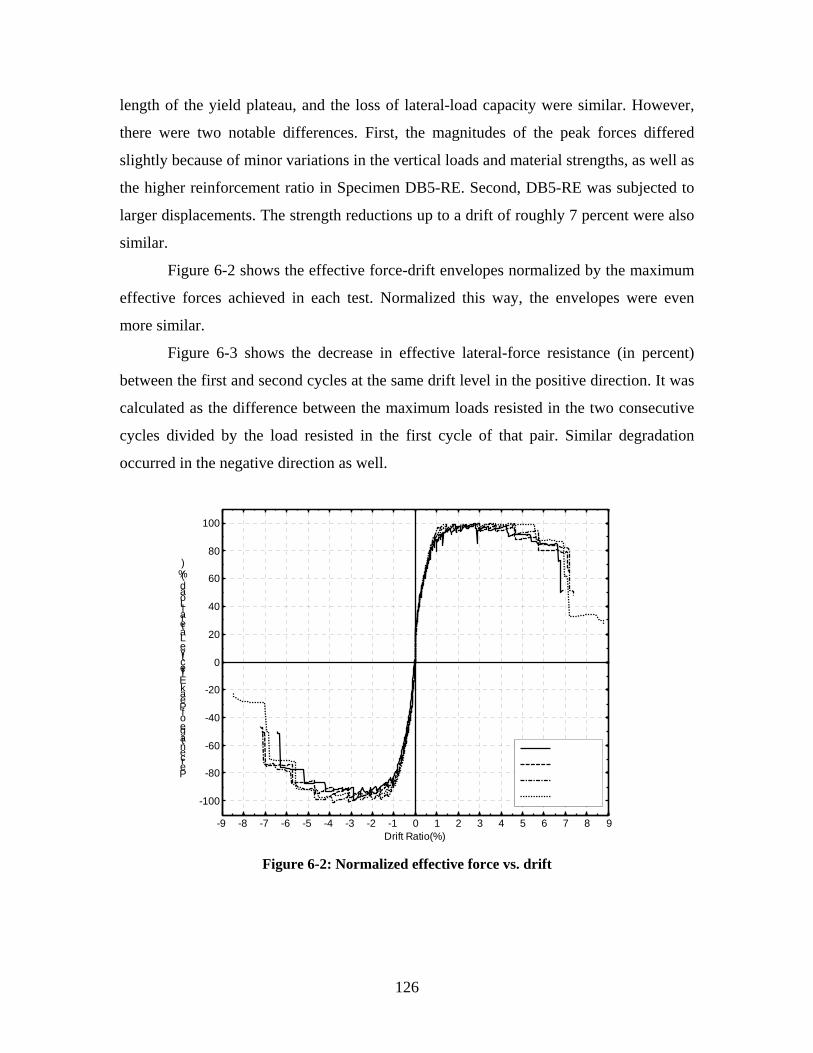
length of the yield plateau, and the loss of lateral-load capacity were similar. However,
there were two notable differences. First, the magnitudes of the peak forces differed
slightly because of minor variations in the vertical loads and material strengths, as well as
the higher reinforcement ratio in Specimen DB5-RE. Second, DB5-RE was subjected to
larger displacements. The strength reductions up to a drift of roughly 7 percent were also
similar.
Figure 6-2 shows the effective force-drift envelopes normalized by the maximum
effective forces achieved in each test. Normalized this way, the envelopes were even
more similar.
Figure 6-3 shows the decrease in effective lateral-force resistance (in percent)
between the first and second cycles at the same drift level in the positive direction. It was
calculated as the difference between the maximum loads resisted in the two consecutive
cycles divided by the load resisted in the first cycle of that pair. Similar degradation
occurred in the negative direction as well.
100
80 )%( 60da oLl 40 are a 20 tLevtic 0effEak -20 ePfo -40 egtan -60 LB8-FBecr LB8-D1 Pe -80
LB8-D2 DB5-RE-100
-9 -8 -7 -6 -5 -4 -3 -2 -1 0 1 2 3 4 5 6 7 8 9 Drift Ratio(%)
Figure 6-2: Normalized effective force vs. drift
126
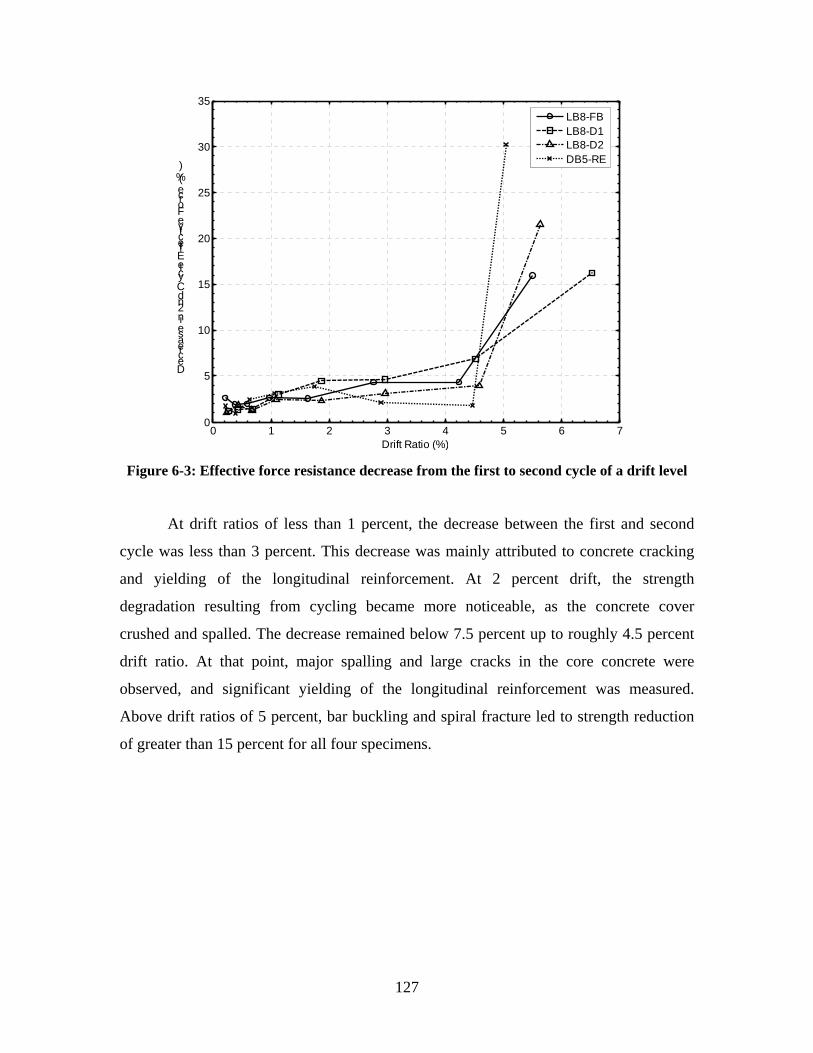
0
5
10
15
20
25
30
35
Decreasein2ndCycleEffectiveForce(%)
LB8-FB LB8-D1 LB8-D2 DB5-RE
76543210Drift Ratio (%)
Figure 6-3: Effective force resistance decrease from the first to second cycle of a drift level
At drift ratios of less than 1 percent, the decrease between the first and second
cycle was less than 3 percent. This decrease was mainly attributed to concrete cracking
and yielding of the longitudinal reinforcement. At 2 percent drift, the strength
degradation resulting from cycling became more noticeable, as the concrete cover
crushed and spalled. The decrease remained below 7.5 percent up to roughly 4.5 percent
drift ratio. At that point, major spalling and large cracks in the core concrete were
observed, and significant yielding of the longitudinal reinforcement was measured.
Above drift ratios of 5 percent, bar buckling and spiral fracture led to strength reduction
of greater than 15 percent for all four specimens.
127
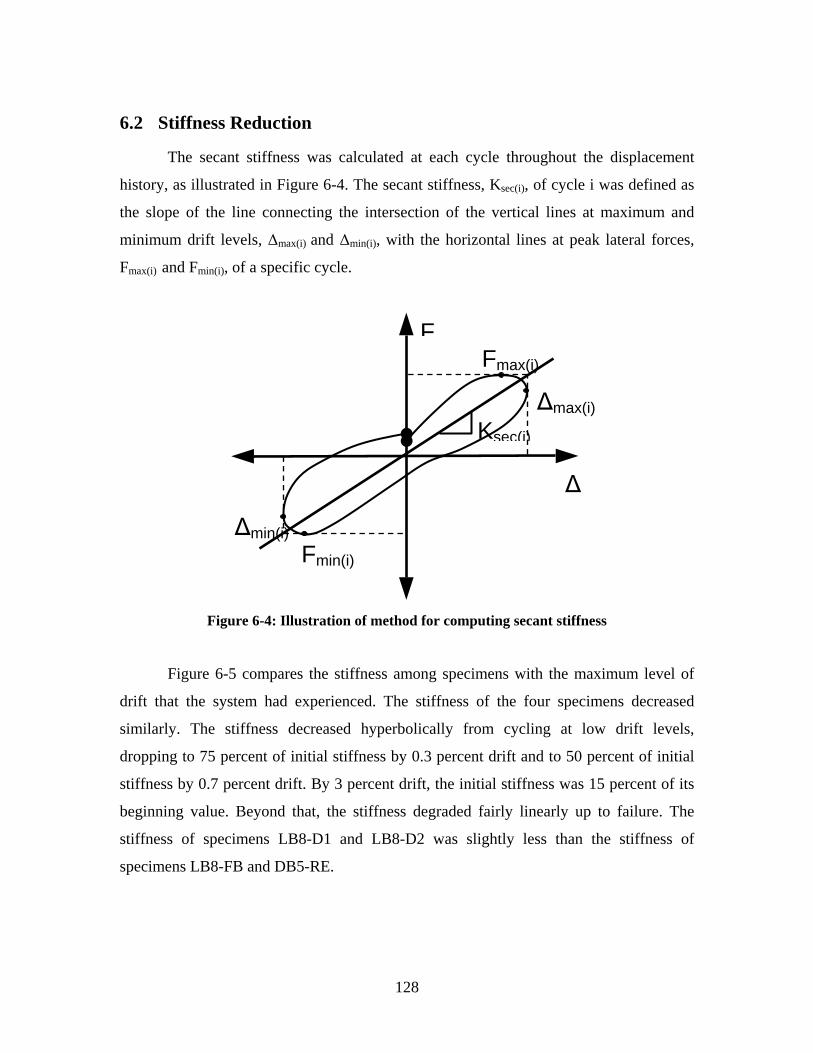
6.2 Stiffness Reduction
The secant stiffness was calculated at each cycle throughout the displacement
history, as illustrated in Figure 6-4. The secant stiffness, Ksec(i), of cycle i was defined as
the slope of the line connecting the intersection of the vertical lines at maximum and
minimum drift levels, Δmax(i) and Δmin(i), with the horizontal lines at peak lateral forces,
Fmax(i) and Fmin(i), of a specific cycle.
Ksec(i)
Fmax(i)
Fmin(i)
Δmin(i)
Δmax(i)
F
Δ
Figure 6-4: Illustration of method for computing secant stiffness
Figure 6-5 compares the stiffness among specimens with the maximum level of
drift that the system had experienced. The stiffness of the four specimens decreased
similarly. The stiffness decreased hyperbolically from cycling at low drift levels,
dropping to 75 percent of initial stiffness by 0.3 percent drift and to 50 percent of initial
stiffness by 0.7 percent drift. By 3 percent drift, the initial stiffness was 15 percent of its
beginning value. Beyond that, the stiffness degraded fairly linearly up to failure. The
stiffness of specimens LB8-D1 and LB8-D2 was slightly less than the stiffness of
specimens LB8-FB and DB5-RE.
128
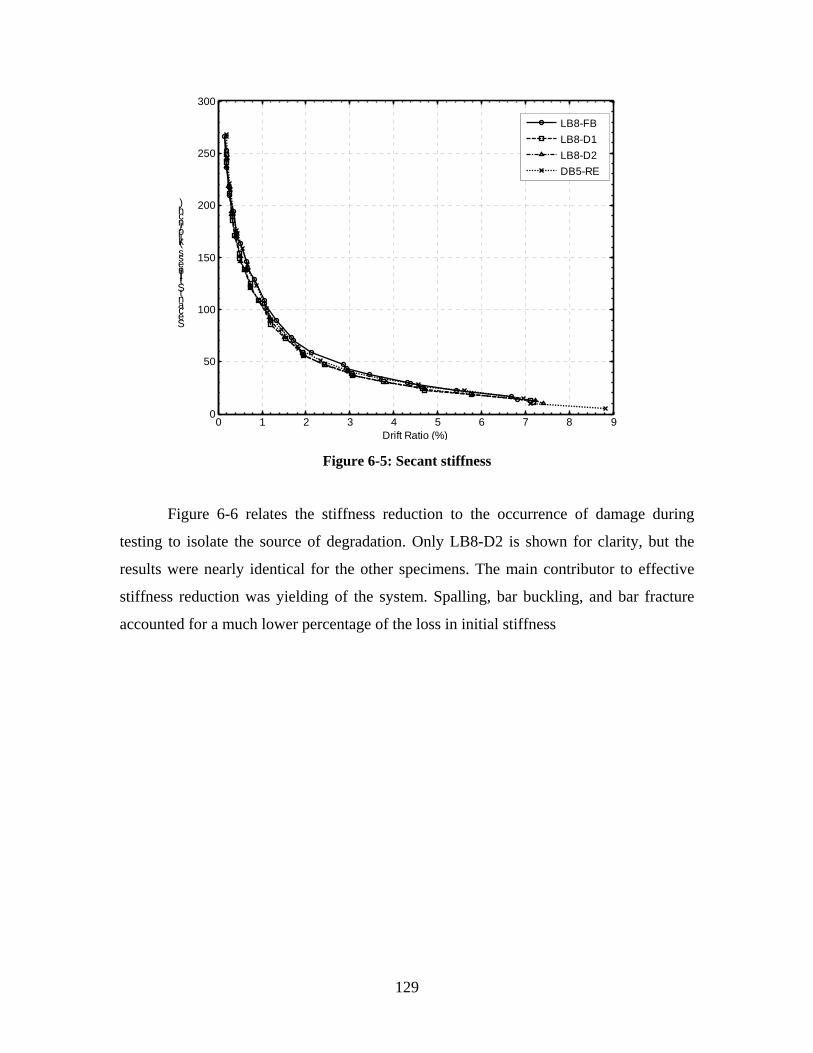
0
50
100
150
200
250
300
Se ca n tStiffn e ss (kip/in ch)
LB8-FB LB8-D1 LB8-D2 DB5-RE
0 1 2 3 4 5 6 7 8 9 Drift Ratio (%)
Figure 6-5: Secant stiffness
Figure 6-6 relates the stiffness reduction to the occurrence of damage during
testing to isolate the source of degradation. Only LB8-D2 is shown for clarity, but the
results were nearly identical for the other specimens. The main contributor to effective
stiffness reduction was yielding of the system. Spalling, bar buckling, and bar fracture
accounted for a much lower percentage of the loss in initial stiffness
129
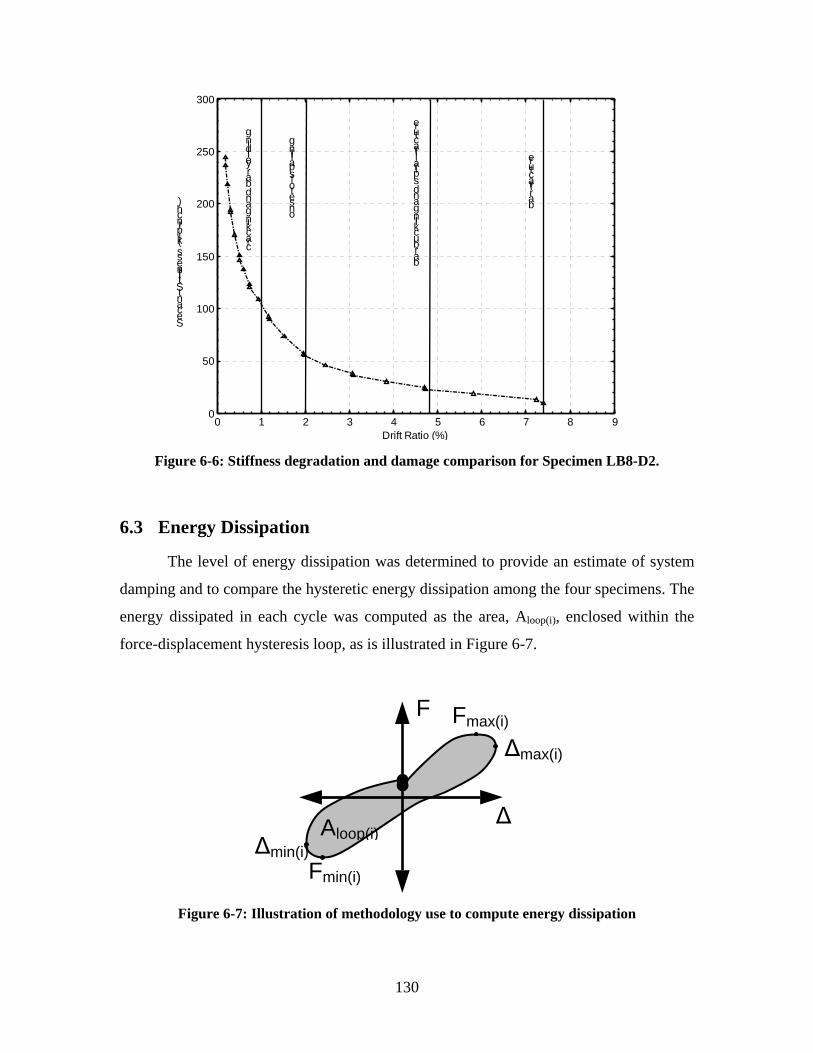
300
250
200
150
100
50
frab
rtca
rue
rtca
rue
f
psdnagn
irla
kcubrab
li
ign
tesno
fo
llaps
dl ign ieyrabdnagn
rc
kca i
)
/i pki
ffi
hcn
(ssen tStnaceS
98765432100
Drift Ratio (%)
Figure 6-6: Stiffness degradation and damage comparison for Specimen LB8-D2.
6.3 Energy Dissipation
The level of energy dissipation was determined to provide an estimate of system
damping and to compare the hysteretic energy dissipation among the four specimens. The
energy dissipated in each cycle was computed as the area, Aloop(i), enclosed within the
force-displacement hysteresis loop, as is illustrated in Figure 6-7.
130
Figure 6-7: Illustration of methodology use to compute energy dissipation
Fmin(i)
Δmax(i)
Aloop(i)Δmin(i)
Δ
Fmax(i)F
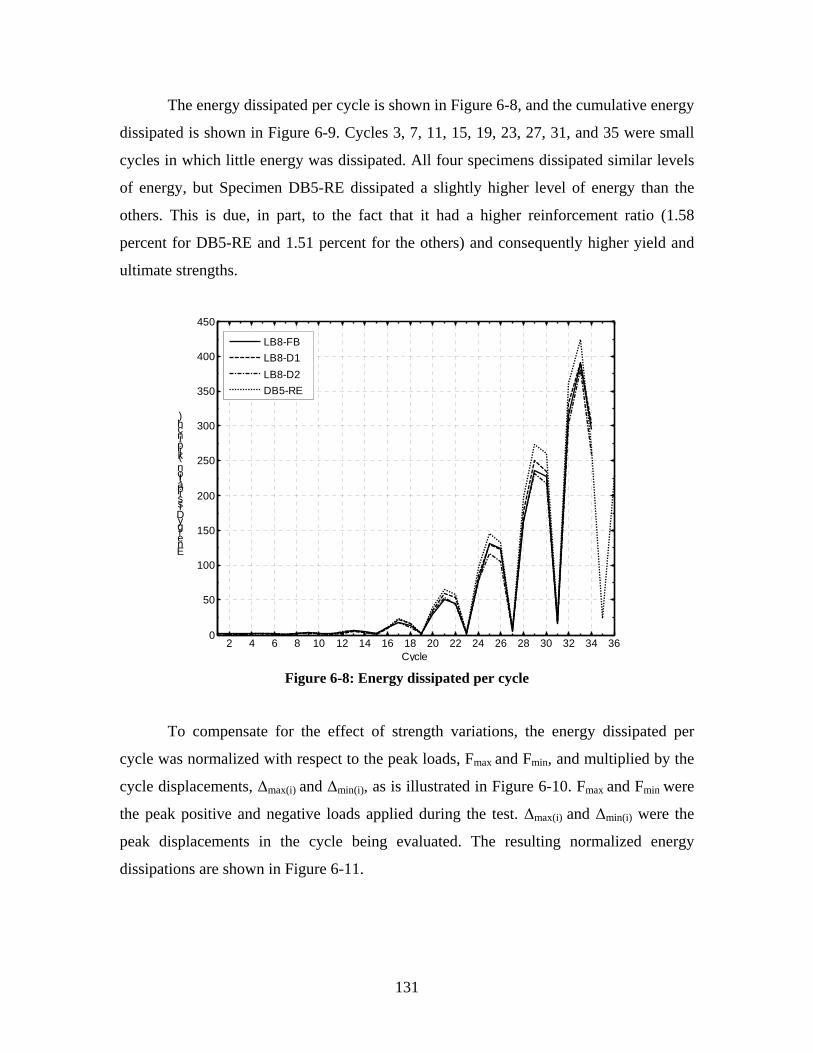
0
50
100
150
200
250
300
350
400
450
En e rgy Dissipa tio n (kip-in ch)
LB8-FB LB8-D1 LB8-D2 DB5-RE
The energy dissipated per cycle is shown in Figure 6-8, and the cumulative energy
dissipated is shown in Figure 6-9. Cycles 3, 7, 11, 15, 19, 23, 27, 31, and 35 were small
cycles in which little energy was dissipated. All four specimens dissipated similar levels
of energy, but Specimen DB5-RE dissipated a slightly higher level of energy than the
others. This is due, in part, to the fact that it had a higher reinforcement ratio (1.58
percent for DB5-RE and 1.51 percent for the others) and consequently higher yield and
ultimate strengths.
2 4 6 8 10 12 14 16 18 20 22 24 26 28 30 32 34 36 Cycle
Figure 6-8: Energy dissipated per cycle
To compensate for the effect of strength variations, the energy dissipated per
cycle was normalized with respect to the peak loads, Fmax and Fmin, and multiplied by the
cycle displacements, Δmax(i) and Δmin(i), as is illustrated in Figure 6-10. Fmax and Fmin were
the peak positive and negative loads applied during the test. Δmax(i) and Δmin(i) were the
peak displacements in the cycle being evaluated. The resulting normalized energy
dissipations are shown in Figure 6-11.
131
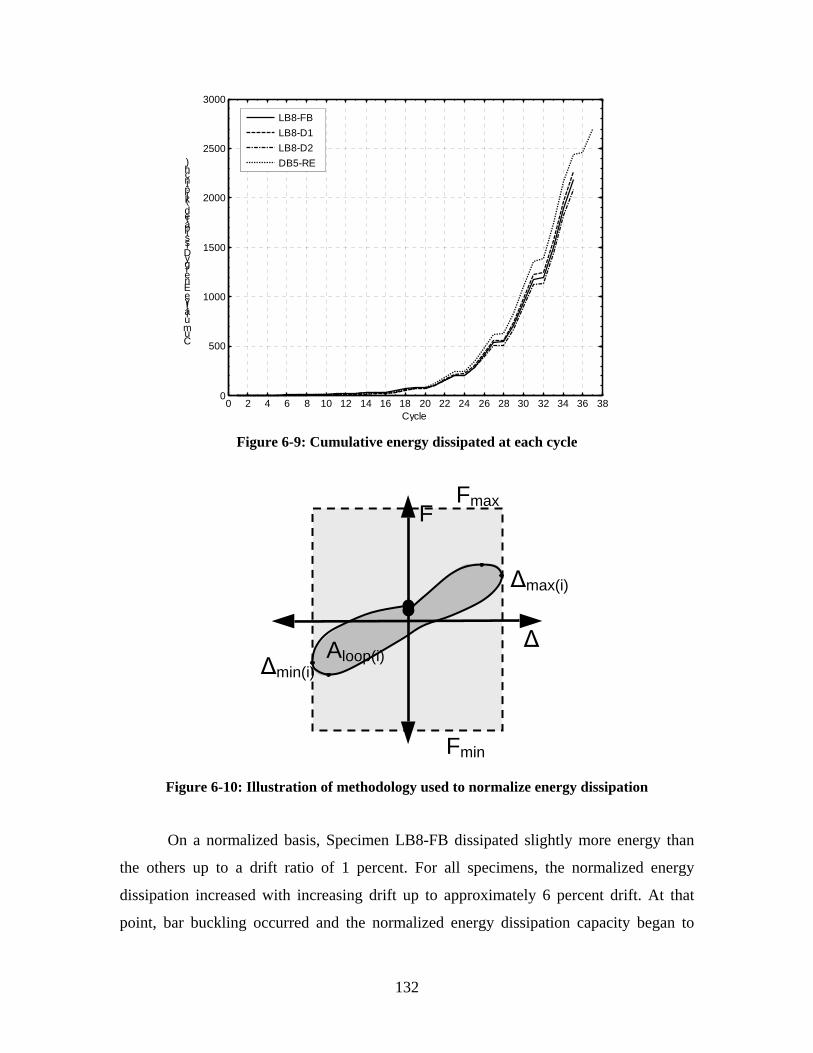
0
500
1000
1500
2000
2500
3000
Cu m u la tive En e rgy Dissipa te d(kip-in ch)
LB8-FB LB8-D1 LB8-D2 DB5-RE
0 2 4 6 8 10 12 14 16 18 20 22 24 26 28 30 32 34 36 38 Cycle
Figure 6-9: Cumulative energy dissipated at each cycle
Fmin
Δmax(i)
Aloop(i)Δmin(i)
F
Δ
Fmax
Figure 6-10: Illustration of methodology used to normalize energy dissipation
On a normalized basis, Specimen LB8-FB dissipated slightly more energy than
the others up to a drift ratio of 1 percent. For all specimens, the normalized energy
dissipation increased with increasing drift up to approximately 6 percent drift. At that
point, bar buckling occurred and the normalized energy dissipation capacity began to
132
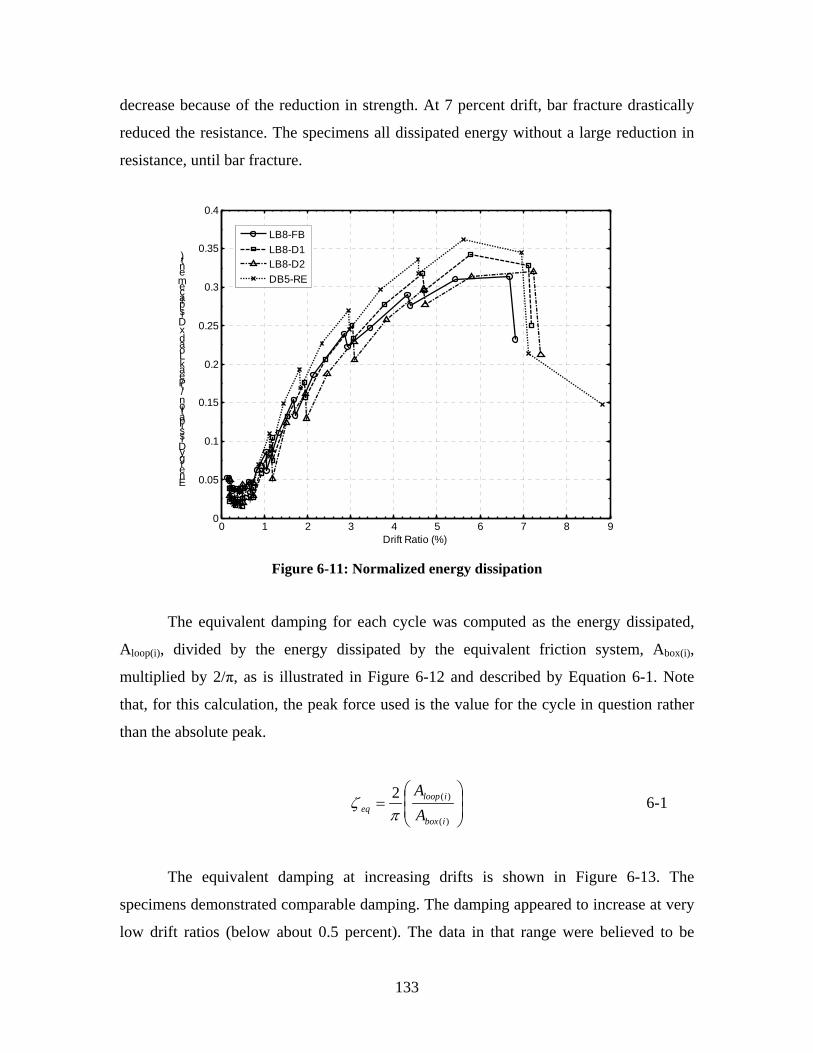
0
0.05
0.1
0.15
0.2
0.25
0.3
0.35
0.4
En e rgy Dissipa tio n/(Pe a kLo a d x Displa ce m e n t)
LB8-FB LB8-D1 LB8-D2 DB5-RE
decrease because of the reduction in strength. At 7 percent drift, bar fracture drastically
reduced the resistance. The specimens all dissipated energy without a large reduction in
resistance, until bar fracture.
0 1 2 3 4 5 6 7 8 9 Drift Ratio (%)
Figure 6-11: Normalized energy dissipation
The equivalent damping for each cycle was computed as the energy dissipated,
Aloop(i), divided by the energy dissipated by the equivalent friction system, Abox(i),
multiplied by 2/π, as is illustrated in Figure 6-12 and described by Equation 6-1. Note
that, for this calculation, the peak force used is the value for the cycle in question rather
than the absolute peak.
⎛ A ⎞2 loop(i)ζ = ⎜ ⎟ 6-1⎜ ⎟eq π A⎝ box(i) ⎠
The equivalent damping at increasing drifts is shown in Figure 6-13. The
specimens demonstrated comparable damping. The damping appeared to increase at very
low drift ratios (below about 0.5 percent). The data in that range were believed to be
133
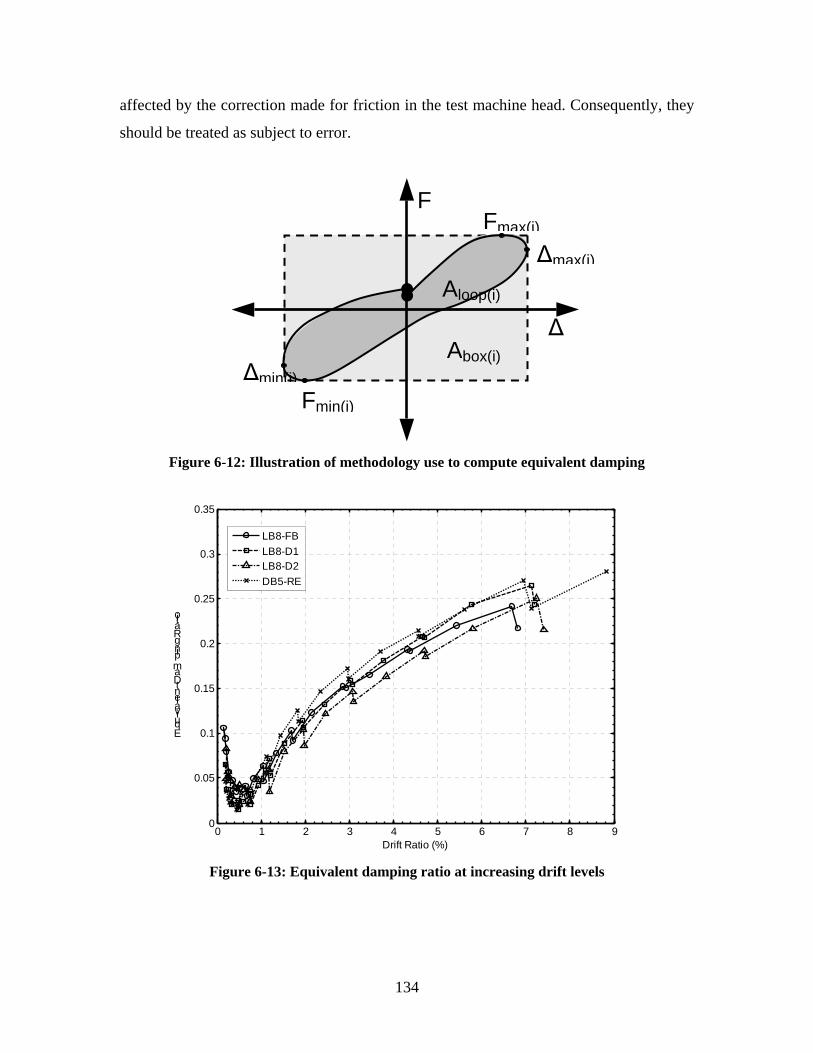
affected by the correction made for friction in the test machine head. Consequently, they
should be treated as subject to error.
Δmax(i)
Aloop(i)
Fmax(i)
Fmin(i)
Δmin(i)
F
Δ Abox(i)
Figure 6-12: Illustration of methodology use to compute equivalent damping
0 1 2 3 4 5 6 7 8 9 Drift Ratio (%)
Figure 6-13: Equivalent damping ratio at increasing drift levels
0
0.05
0.1
0.15
0.2
0.25
0.3
0.35
Equ iva le n tDa m ping Ra tio
LB8-FB LB8-D1 LB8-D2 DB5-RE
134
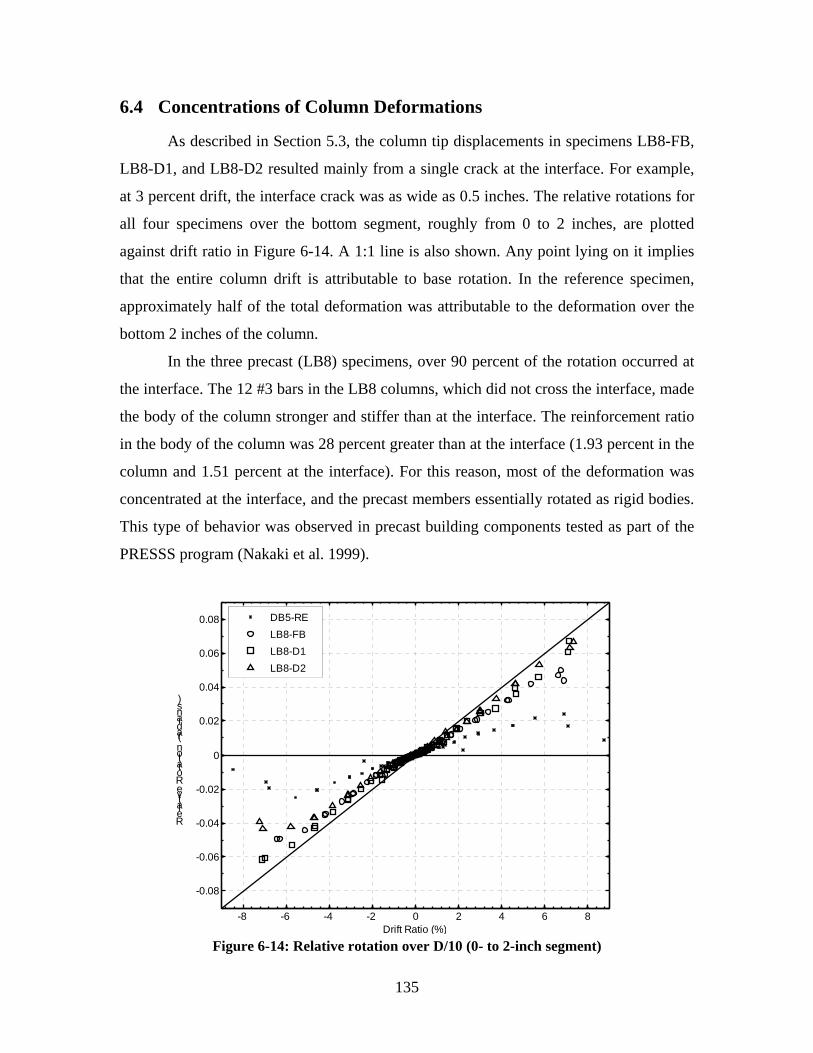
6.4 Concentrations of Column Deformations
As described in Section 5.3, the column tip displacements in specimens LB8-FB,
LB8-D1, and LB8-D2 resulted mainly from a single crack at the interface. For example,
at 3 percent drift, the interface crack was as wide as 0.5 inches. The relative rotations for
all four specimens over the bottom segment, roughly from 0 to 2 inches, are plotted
against drift ratio in Figure 6-14. A 1:1 line is also shown. Any point lying on it implies
that the entire column drift is attributable to base rotation. In the reference specimen,
approximately half of the total deformation was attributable to the deformation over the
bottom 2 inches of the column.
In the three precast (LB8) specimens, over 90 percent of the rotation occurred at
the interface. The 12 #3 bars in the LB8 columns, which did not cross the interface, made
the body of the column stronger and stiffer than at the interface. The reinforcement ratio
in the body of the column was 28 percent greater than at the interface (1.93 percent in the
column and 1.51 percent at the interface). For this reason, most of the deformation was
concentrated at the interface, and the precast members essentially rotated as rigid bodies.
This type of behavior was observed in precast building components tested as part of the
PRESSS program (Nakaki et al. 1999).
0.08 DB5-RE LB8-FB
0.06 LB8-D1 LB8-D2
0.04
s)
(ra dia n
0.02
Ro ta tio n
0
Re la tive
-0.04
-0.02
-0.06
-0.08
-8 -6 -4 -2 0 2 4 6 8 Drift Ratio (%)
Figure 6-14: Relative rotation over D/10 (0- to 2-inch segment)
135
6.5 Effectiveness of Intentional Debonding
Bars in specimens LB8-D1 and LB8-D2 were debonded intentionally in the cap-
beam to distribute bar deformation over the debonded length, thereby reducing the
maximum strains at the interface and delaying bar fracture. In Specimen LB8-D1, the
debonding sleeve was placed tightly around the bar with the goal of inhibiting buckling
through stiff lateral support. However, this approach introduced the possibility of friction
between the bar and plastic sleeve. A more loosely fitting sleeve was used in Specimen
LB8-D2 to provide a gap large enough to ensure complete debonding, but it then lacked
resistance to bar buckling in the debonded region. The debonding methods were also
evaluated in the pullout test specimens (covered in Appendix D), which replicated the
anchorage conditions in the precast subassemblies.
Debonding the bars reduced the strain concentrations at low drift levels, but it did
not delay bar fracture as intended. Bar buckling and bar fracture occurred during nearly
the same cycles and at the same drift ratios in each specimen. This occurred even though
specimens LB8-D1 and LB8-D2 were intentionally debonded, and DB5-RE had a
different configuration of smaller bars.
Bar buckling and fracture always occurred in the plastic hinge region of the
column, whereas the debonded region was in the cap-beam. In all four subassemblies, bar
fracture was brittle with no evident necking. Furthermore, in Specimen DB5-RE a
partially fractured bar showed cracks propagating from the inner side of the buckle. This,
along with the lack of necking, indicated that fracture occurred as a consequence of low-
cycle fatigue from bar buckling and straightening instead of high strain concentrations at
the interface from tension and compression.
Both the subassembly and pullout tests showed no measureable difference
between the two debonding methods. In specimens AD8-D1 and AD8-D2, strains were
constant across the debonded region and nearly equal for the same bar stress (Figure
D-21 and Figure D-22). At small drift ratios (≤ 0.7 percent drift), the strains across the
debonded region in LB8-D2 were approximately constant while in tension and
compression. This indicated that the bars were fully debonded and that no friction
developed between the bar and the PVC sleeve.
136
The effectiveness of debonding in specimens LB8-FB and LB8-D1 could not be
compared because strain gage data were unreliable. It is unknown whether bars in LB8-
D1 were fully debonded or whether friction forces developed between the bar and sleeve.
However, the results from the three pullout tests and the fact that the moment-drift
responses of specimen LB8-D1 and LB8-D2 showed no measureable difference suggests
strongly that the bars were debonded and that there was no difference between the two
methods.
6.6 Effects of Intentional Debonding
The effective force-drift responses, which are shown in Figure 5-2 through Figure
5-5, showed that debonding of the bars in the cap-beam had little effect on the overall
hysteretic performance of the system. As the bars in Specimen LB8-FB debonded
themselves in the column, the behavior approached that of an intentionally debonded
specimen.
The stiffness at small drifts was slightly less in LB8-D1 and LB8-D2 than in LB8-
FB. In the pullout tests, specimens AD8-D1 and AD8-D2 were also less stiff while the
bars were elastic. This behavior occurred because the bar was allowed to freely elongate
over the debonded length. In the fully bonded specimens, this elongation occurred over a
much shorter length because the bars grouted into corrugated ducts provided high bond
(Steuck et al. 2007).
Debonding of the bars created a region where the bars lacked lateral restraint
against bending, which was measured in strain and bar curvature data from Specimen
LB8-D2. Significant curvature in the bar was measured at both the interface and at 7
inches below in the debonded region, whereas in DB5-RE, which had bars fully anchored
in concrete, no bending occurred below the interface. However, the fact that bar buckling
occurred at nearly the same drift ratio in all four specimens suggests that the lack of
lateral restraint did not accelerate bar buckling. Bar buckling always occurred in the
column. Furthermore, the lateral displacement allowed in the debonded region before
being restrained by the grout was very small.
The lack of lateral resistance in the debonded specimens may have contributed to
the inability of the bar to be recompressed in a compression cycle at drift ratios of larger
137
than 1.2 percent. Significant permanent tensile strains remained at the interface and in the
debonded region. In contrast, the bars in Specimen DB5-RE were capable of being
recompressed in the compression cycle, for drift levels of less than 3.0 percent (strain
gage data were not reliable beyond 3.0 percent drift). The lack of good strain gage data in
LB8-FB prevented a direct comparison with the fully bonded condition. Therefore, it is
unknown whether the different behaviors were a direct result of debonding or resulted
from the fact that Specimen DB5-RE had smaller bars. However, there was no evidence
to suggest that this behavior affected the occurrence of bar buckling and bar fracture.
Intentional debonding did eliminate the spalling damage to the surface of the cap-
beam by anchoring the bar deeper in the beam and reducing demand on the cover
concrete. No damage to the surface of the cap beam occurred in specimens LB8-D1 and
LB8-D2 (discussed in Section 4.3). However, the level of damage in the cap-beam of
Specimen LB8-FB was much less than that in the columns.
The same trends in damage to the surface concrete were observed and measured
in the three pullout tests. In Specimen AD8-FB, radial cracking and flaking occurred in
the surface of the grout and in the concrete around the ducts. Furthermore, significant
displacements at the surface of the concrete, duct, and grout were measured in AD8-FB.
By contrast, no damage was observed and negligible surface displacements were
measured in AD8-D1 and AD8-D2.
Anchoring the bar deeper not only reduced demand on the cover concrete but also
allowed the bar to be embedded in a more highly confined region capable of developing
much higher bond stresses. Strain profiles (Section D.7.3) from the pullout tests showed a
larger reduction in strain, and corresponding bar stress, in specimens AD8-D1 and AD8-
D2 than in AD8-FB for the first 7 inches over which the bar was embedded in grout. This
was attributed to formation of a pullout cone at the surface of the concrete or grout where
bond extended to the surface. In the debonded specimens (AD8-D1 and AD8-D2) the
bonded region started deep in the body of the grout, where the cone could not form. Thus
a debonded bar can be anchored in a shorter length than is possible for a fully bonded bar.
138
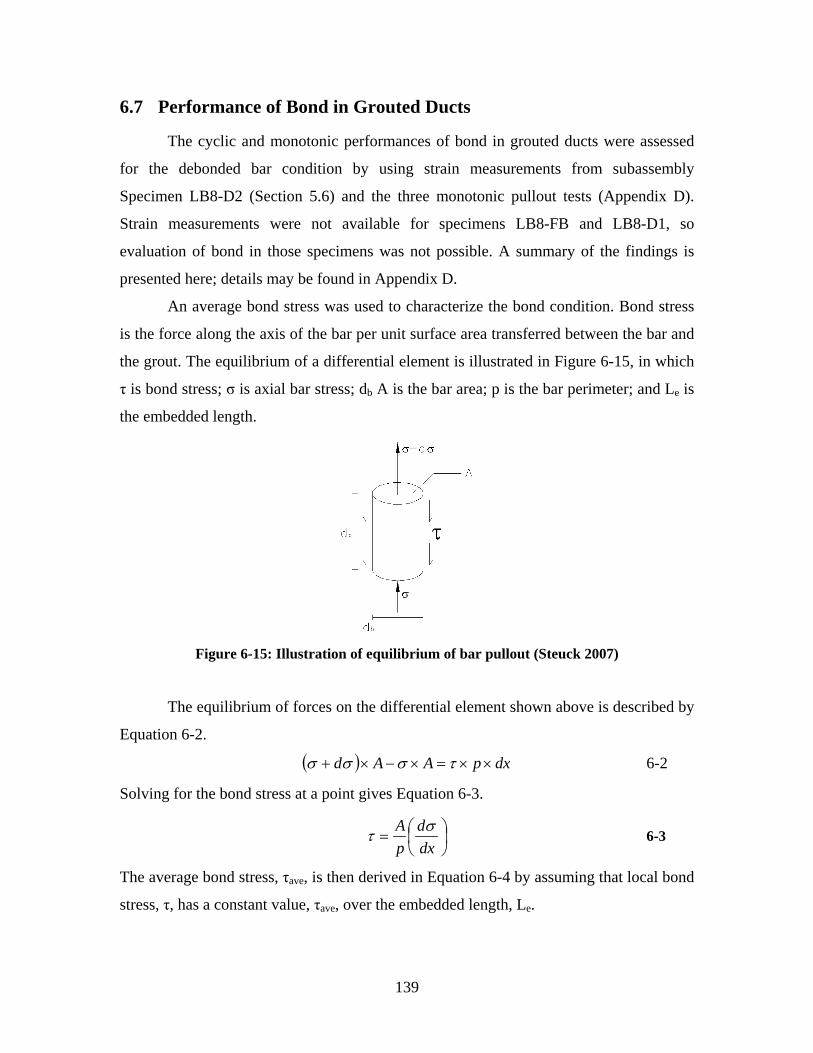
6.7 Performance of Bond in Grouted Ducts
The cyclic and monotonic performances of bond in grouted ducts were assessed
for the debonded bar condition by using strain measurements from subassembly
Specimen LB8-D2 (Section 5.6) and the three monotonic pullout tests (Appendix D).
Strain measurements were not available for specimens LB8-FB and LB8-D1, so
evaluation of bond in those specimens was not possible. A summary of the findings is
presented here; details may be found in Appendix D.
An average bond stress was used to characterize the bond condition. Bond stress
is the force along the axis of the bar per unit surface area transferred between the bar and
the grout. The equilibrium of a differential element is illustrated in Figure 6-15, in which
τ is bond stress; σ is axial bar stress; db A is the bar area; p is the bar perimeter; and Le is
the embedded length.
Figure 6-15: Illustration of equilibrium of bar pullout (Steuck 2007)
The equilibrium of forces on the differential element shown above is described by
dx
Equation 6-2.
(σ + dσ )× A − σ × A = τ × p × dx 6-2
Solving for the bond stress at a point gives Equation 6-3.
τ = ⎜ ⎟A ⎛ dσ ⎞ 6-3 p ⎝ ⎠
The average bond stress, τave, is then derived in Equation 6-4 by assuming that local bond
stress, τ, has a constant value, τave, over the embedded length, Le.
139

A ⎛ σ ⎞τ ave = ⎜⎜ ⎟⎟ 6-4 p ⎝ Le ⎠
Equation 6-4 can also be expressed in terms of embedment length, Le, which is
shown in Equation 6-5.
σLe = db 6-5 4 ×τ ave
π 2In this equation it is assumed that A = db and p = π × db , even though a4
reinforcing bar is not a perfect cylinder. This assumption is the basis of the ACI and
AASHTO code development length equations, in which it is assumed that a fully
developed bar will reach a bar stress of fy.
Strain profiles from the three pullout specimens and Specimen LB8-D2 are shown
in Figure 6-16. The profiles from the pullout tests are shown for bar stresses of 20 and 60
ksi, which were calculated by using the load read from the load cell and the nominal bar
area of the #8 bar (0.79 inches2). The profiles shown for Specimen LB8-D2 are the first
occurrence when the interface strain reached a strain equal to that at the surface of the
pullout specimens for those two bar stresses. Thus, before reaching the strains shown in
Figure 6-16, the bars in the three pullout specimens had undergone only monotonic
loading, but the bars in Specimen LB8-D2 had undergone cyclic loading. Note also that
the measured strains were slightly higher than the average strain in the bar because the
bars were ground flat before the gages were applied. For all D1 and D2 tests, the
similarity in the magnitudes of the stresses at the surface and at a depth of 7 inches
confirms that both methods were effective in debonding the bars.
By using Equation 6-4, the average bond stresses were calculated for the first 7
inches of embedment in grout; these are shown in Table 6-1. The bars were assumed to
be elastic. Nominal values for db (1 inch for the #8 bar) and the elastic modulus of steel
(E = 29000 ksi) were assumed.
140
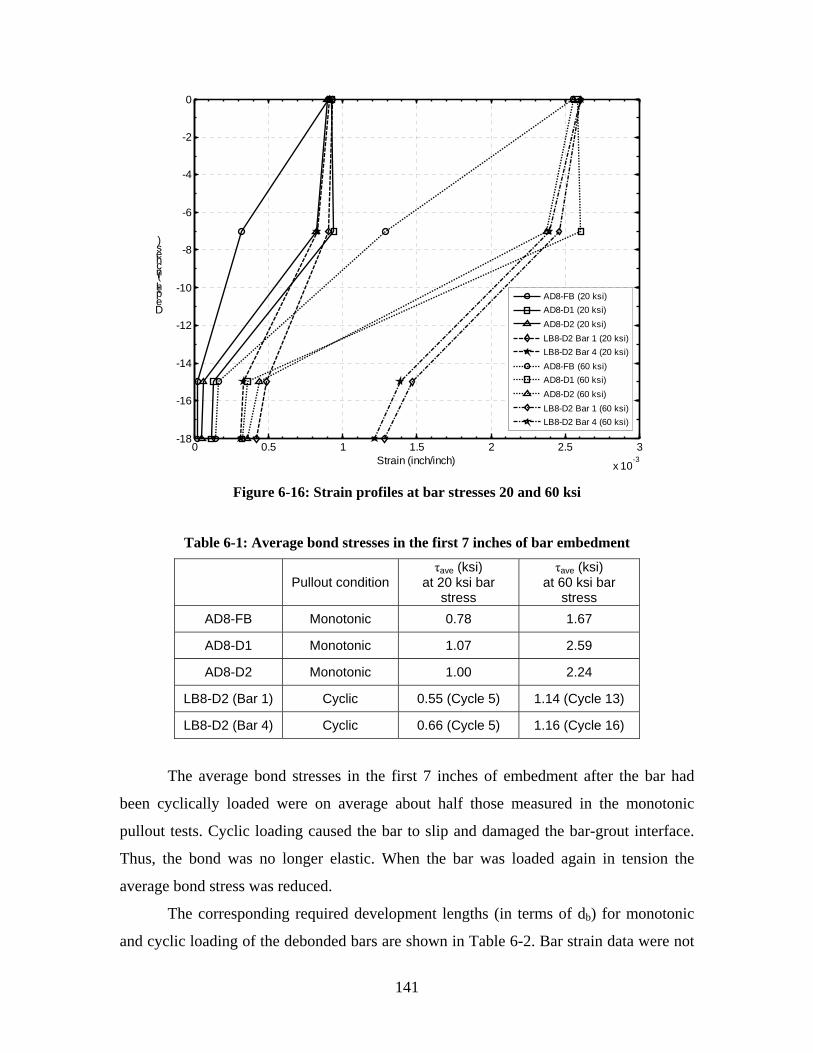
-18
-16
-14
-12
-10
-8
-6
-4
-2
0
Depth(in che s)
AD8-FB (20 ksi) AD8-D1 (20 ksi) AD8-D2 (20 ksi) LB8-D2 Bar 1 (20 ksi) LB8-D2 Bar 4 (20 ksi) AD8-FB (60 ksi) AD8-D1 (60 ksi) AD8-D2 (60 ksi) LB8-D2 Bar 1 (60 ksi) LB8-D2 Bar 4 (60 ksi)
0 0.5 1 1.5 2 2.5 3 Strain (inch/inch) -3
x 10
Figure 6-16: Strain profiles at bar stresses 20 and 60 ksi
Table 6-1: Average bond stresses in the first 7 inches of bar embedment
Pullout condition τave (ksi)
at 20 ksi bar stress
τave (ksi) at 60 ksi bar
stress AD8-FB Monotonic 0.78 1.67
AD8-D1 Monotonic 1.07 2.59
AD8-D2 Monotonic 1.00 2.24
LB8-D2 (Bar 1) Cyclic 0.55 (Cycle 5) 1.14 (Cycle 13)
LB8-D2 (Bar 4) Cyclic 0.66 (Cycle 5) 1.16 (Cycle 16)
The average bond stresses in the first 7 inches of embedment after the bar had
been cyclically loaded were on average about half those measured in the monotonic
pullout tests. Cyclic loading caused the bar to slip and damaged the bar-grout interface.
Thus, the bond was no longer elastic. When the bar was loaded again in tension the
average bond stress was reduced.
The corresponding required development lengths (in terms of db) for monotonic
and cyclic loading of the debonded bars are shown in Table 6-2. Bar strain data were not
141
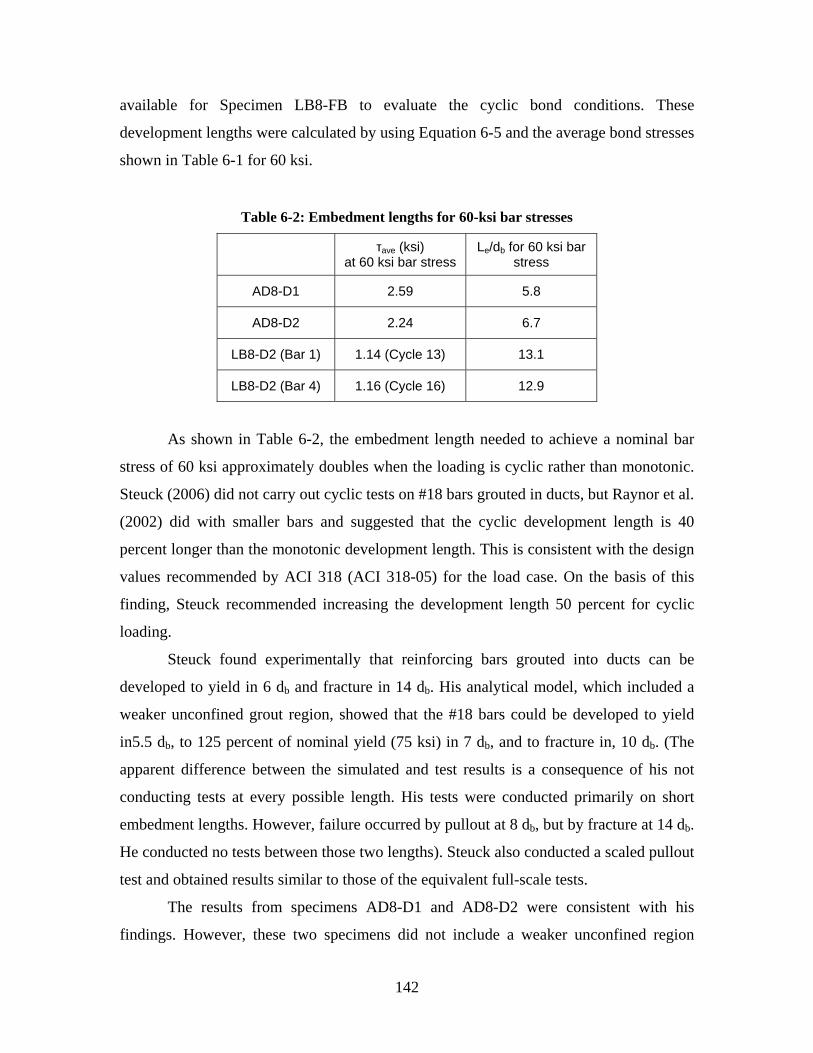
available for Specimen LB8-FB to evaluate the cyclic bond conditions. These
development lengths were calculated by using Equation 6-5 and the average bond stresses
shown in Table 6-1 for 60 ksi.
Table 6-2: Embedment lengths for 60-ksi bar stresses
τave (ksi) at 60 ksi bar stress
Le/db for 60 ksi bar stress
AD8-D1 2.59 5.8
AD8-D2 2.24 6.7
LB8-D2 (Bar 1) 1.14 (Cycle 13) 13.1
LB8-D2 (Bar 4) 1.16 (Cycle 16) 12.9
As shown in Table 6-2, the embedment length needed to achieve a nominal bar
stress of 60 ksi approximately doubles when the loading is cyclic rather than monotonic.
Steuck (2006) did not carry out cyclic tests on #18 bars grouted in ducts, but Raynor et al.
(2002) did with smaller bars and suggested that the cyclic development length is 40
percent longer than the monotonic development length. This is consistent with the design
values recommended by ACI 318 (ACI 318-05) for the load case. On the basis of this
finding, Steuck recommended increasing the development length 50 percent for cyclic
loading.
Steuck found experimentally that reinforcing bars grouted into ducts can be
developed to yield in 6 db and fracture in 14 db. His analytical model, which included a
weaker unconfined grout region, showed that the #18 bars could be developed to yield
in5.5 db, to 125 percent of nominal yield (75 ksi) in 7 db, and to fracture in, 10 db. (The
apparent difference between the simulated and test results is a consequence of his not
conducting tests at every possible length. His tests were conducted primarily on short
embedment lengths. However, failure occurred by pullout at 8 db, but by fracture at 14 db.
He conducted no tests between those two lengths). Steuck also conducted a scaled pullout
test and obtained results similar to those of the equivalent full-scale tests.
The results from specimens AD8-D1 and AD8-D2 were consistent with his
findings. However, these two specimens did not include a weaker unconfined region
142
because the front of the bonded region occurred quite deep in the grout, where no cone
could form. The calculated average bond stresses used were not at peak bar stress, so they
would increase as the bar slipped further.
In Appendix D, the measured strain distributions from the three pullout specimens
were compared with the strain distributions calculated by the nonlinear finite element
model developed by Steuck et al. (2007). The model calculated the strain distribution
reasonably well. The model was very accurate in calculating the strain distribution for the
fully bonded specimen but over-estimated the strains in the bar for the debonded
specimens. This good agreement between the measured data and a numerical model that
was developed and calibrated independently adds creditability to both the measured data
and the model.
The ACI code development lengths are very conservative for the development of
bars in grouted ducts (Steuck 2007). The bond stresses measured during testing were
significantly higher than ACI monotonic and seismic bond strenths. However, the change
in stress was measured over only part of the bar, whereas ACI bond stresses are averaged
over the whole length of the bar. The bond stress is likely to vary over the embedded
length of the bar, so the two circumstances are not directly comparable. However, given
that caveat, the bond strengths are much higher and the needed embedment lengths are
much shorter than those specified by ACI 318-05.
143
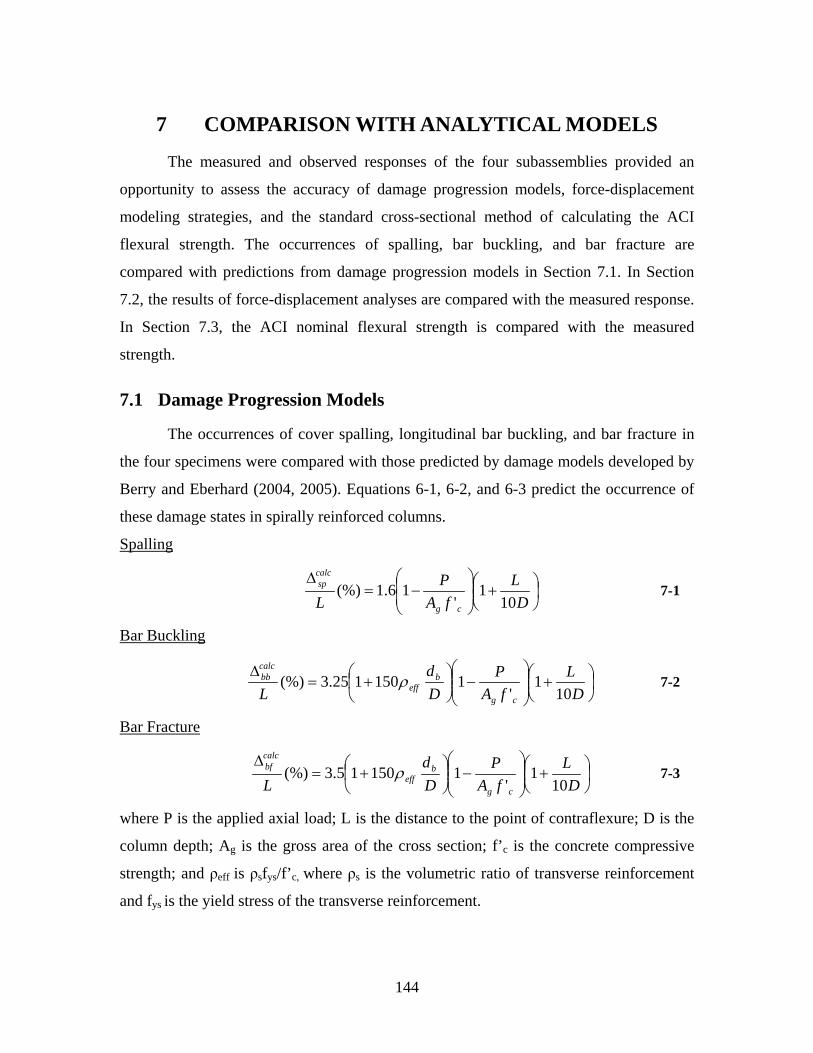
7 COMPARISON WITH ANALYTICAL MODELS
The measured and observed responses of the four subassemblies provided an
opportunity to assess the accuracy of damage progression models, force-displacement
modeling strategies, and the standard cross-sectional method of calculating the ACI
flexural strength. The occurrences of spalling, bar buckling, and bar fracture are
compared with predictions from damage progression models in Section 7.1. In Section
7.2, the results of force-displacement analyses are compared with the measured response.
In Section 7.3, the ACI nominal flexural strength is compared with the measured
strength.
7.1 Damage Progression Models
The occurrences of cover spalling, longitudinal bar buckling, and bar fracture in
the four specimens were compared with those predicted by damage models developed by
Berry and Eberhard (2004, 2005). Equations 6-1, 6-2, and 6-3 predict the occurrence of
these damage states in spirally reinforced columns.
Spalling
calcΔ sp ⎛ P ⎞⎛ L ⎞(%) = 1.6⎜1− ⎟⎜1+ ⎟ 7-1L ⎜ Ag f ' c
⎟⎝ 10D ⎠⎝ ⎠
Bar Buckling
calc ⎛ ⎞Δbb ⎛ db ⎞ P ⎛ L ⎞(%) = 3.25⎜1+150ρeff ⎟⎜⎜1− ⎟
⎟⎜1+ ⎟ 7-2L ⎝ D ⎠⎝ Ag f ' c ⎠⎝ 10D ⎠
Bar Fracture
calcΔbf ⎛ db ⎞⎛ P ⎞⎛ L ⎞(%) = 3.5⎜1+150ρeff ⎟⎜⎜1− ⎟
⎟⎜1+ ⎟ 7-3L ⎝ D ⎠⎝ Ag f ' c ⎠⎝ 10D ⎠
where P is the applied axial load; L is the distance to the point of contraflexure; D is the
column depth; Ag is the gross area of the cross section; f’c is the concrete compressive
strength; and ρeff is ρsfys/f’c, where ρs is the volumetric ratio of transverse reinforcement
and fys is the yield stress of the transverse reinforcement.
144
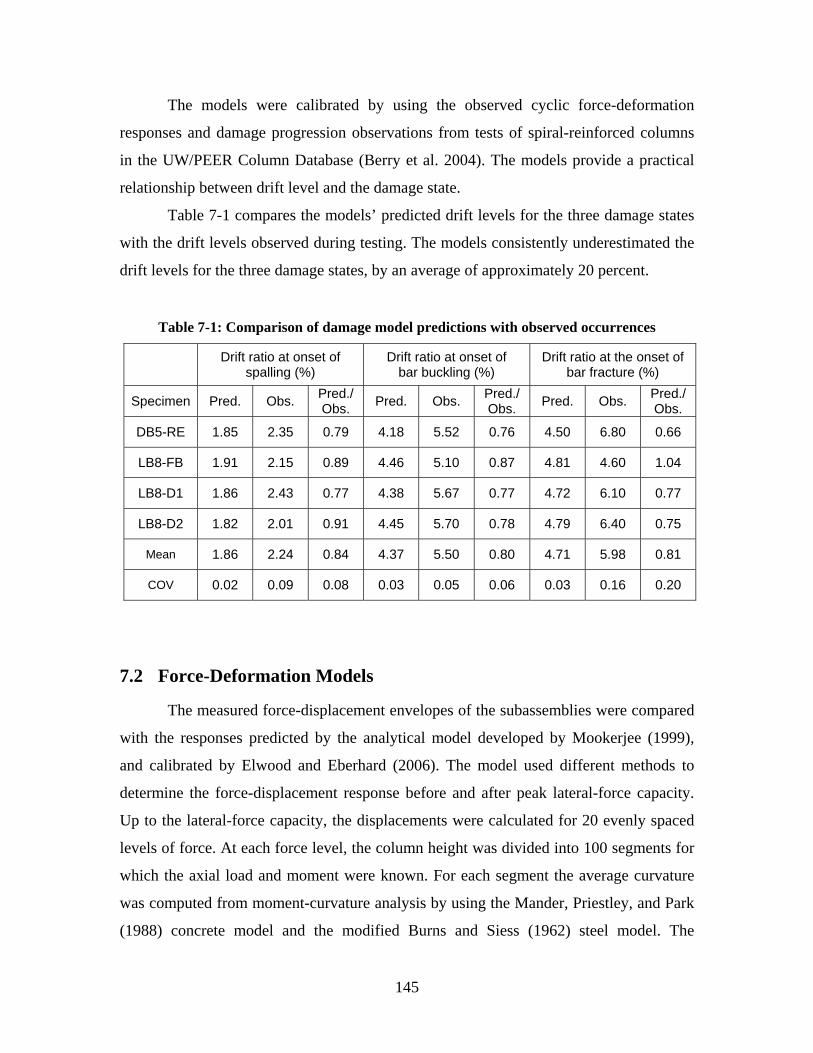
The models were calibrated by using the observed cyclic force-deformation
responses and damage progression observations from tests of spiral-reinforced columns
in the UW/PEER Column Database (Berry et al. 2004). The models provide a practical
relationship between drift level and the damage state.
Table 7-1 compares the models’ predicted drift levels for the three damage states
with the drift levels observed during testing. The models consistently underestimated the
drift levels for the three damage states, by an average of approximately 20 percent.
Table 7-1: Comparison of damage model predictions with observed occurrences
Drift ratio at onset of spalling (%)
Drift ratio at onset of bar buckling (%)
Drift ratio at the onset of bar fracture (%)
Specimen Pred. Obs. Pred./ Obs. Pred. Obs. Pred./
Obs. Pred. Obs. Pred./ Obs.
DB5-RE 1.85 2.35 0.79 4.18 5.52 0.76 4.50 6.80 0.66
LB8-FB 1.91 2.15 0.89 4.46 5.10 0.87 4.81 4.60 1.04
LB8-D1 1.86 2.43 0.77 4.38 5.67 0.77 4.72 6.10 0.77
LB8-D2 1.82 2.01 0.91 4.45 5.70 0.78 4.79 6.40 0.75
Mean 1.86 2.24 0.84 4.37 5.50 0.80 4.71 5.98 0.81
COV 0.02 0.09 0.08 0.03 0.05 0.06 0.03 0.16 0.20
7.2 Force-Deformation Models
The measured force-displacement envelopes of the subassemblies were compared
with the responses predicted by the analytical model developed by Mookerjee (1999),
and calibrated by Elwood and Eberhard (2006). The model used different methods to
determine the force-displacement response before and after peak lateral-force capacity.
Up to the lateral-force capacity, the displacements were calculated for 20 evenly spaced
levels of force. At each force level, the column height was divided into 100 segments for
which the axial load and moment were known. For each segment the average curvature
was computed from moment-curvature analysis by using the Mander, Priestley, and Park
(1988) concrete model and the modified Burns and Siess (1962) steel model. The
145
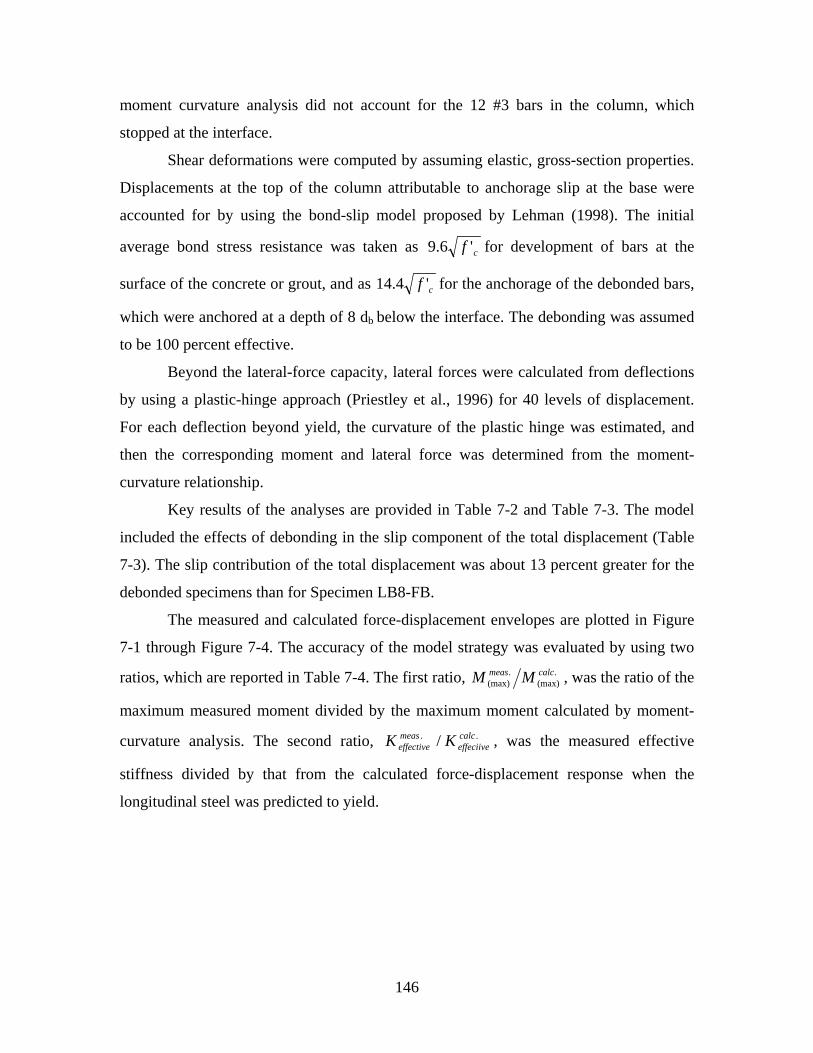
moment curvature analysis did not account for the 12 #3 bars in the column, which
stopped at the interface.
Shear deformations were computed by assuming elastic, gross-section properties.
Displacements at the top of the column attributable to anchorage slip at the base were
accounted for by using the bond-slip model proposed by Lehman (1998). The initial
average bond stress resistance was taken as 9.6 f ' c for development of bars at the
surface of the concrete or grout, and as 14.4 f ' c for the anchorage of the debonded bars,
which were anchored at a depth of 8 db below the interface. The debonding was assumed
to be 100 percent effective.
Beyond the lateral-force capacity, lateral forces were calculated from deflections
by using a plastic-hinge approach (Priestley et al., 1996) for 40 levels of displacement.
For each deflection beyond yield, the curvature of the plastic hinge was estimated, and
then the corresponding moment and lateral force was determined from the moment-
curvature relationship.
Key results of the analyses are provided in Table 7-2 and Table 7-3. The model
included the effects of debonding in the slip component of the total displacement (Table
7-3). The slip contribution of the total displacement was about 13 percent greater for the
debonded specimens than for Specimen LB8-FB.
The measured and calculated force-displacement envelopes are plotted in Figure
7-1 through Figure 7-4. The accuracy of the model strategy was evaluated by using two meas. calc.M , was the ratio of the ratios, which are reported in Table 7-4. The first ratio, M (max) (max)
maximum measured moment divided by the maximum moment calculated by moment-meas . calc .curvature analysis. The second ratio, K / K , was the measured effective effective effeciive
stiffness divided by that from the calculated force-displacement response when the
longitudinal steel was predicted to yield.
146
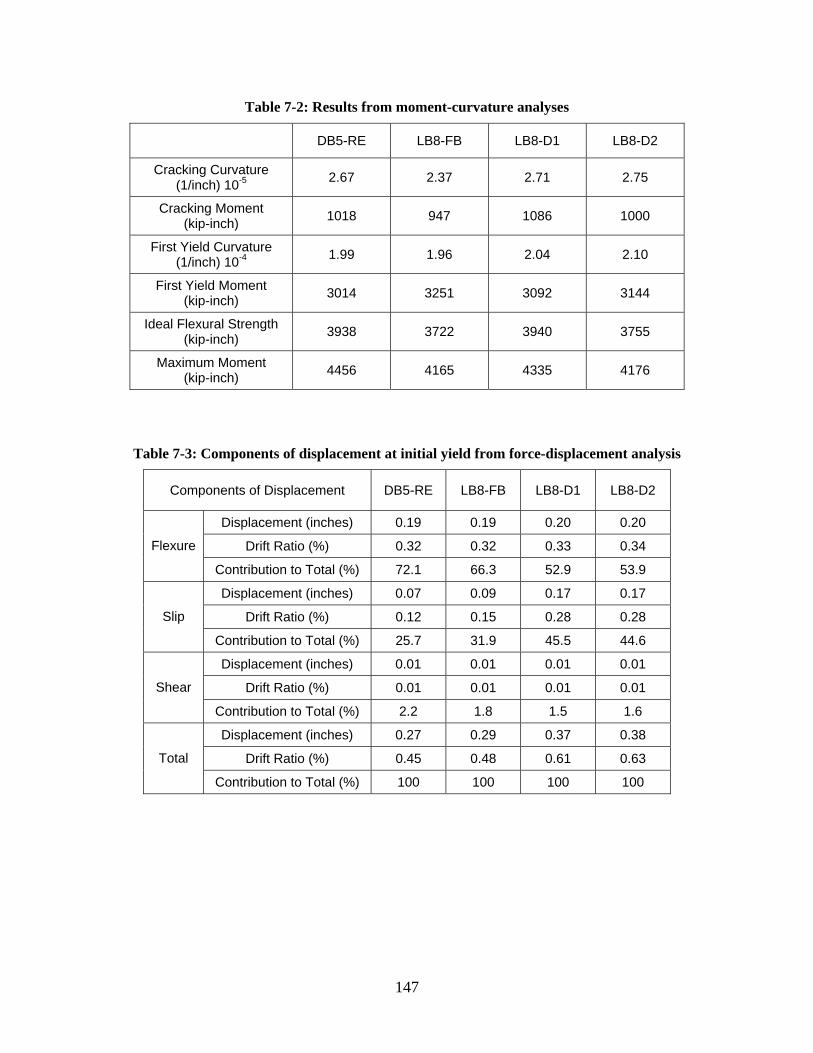
Table 7-2: Results from moment-curvature analyses
DB5-RE LB8-FB LB8-D1 LB8-D2
Cracking Curvature (1/inch) 10-5 2.67 2.37 2.71 2.75
Cracking Moment (kip-inch) 1018 947 1086 1000
First Yield Curvature (1/inch) 10-4 1.99 1.96 2.04 2.10
First Yield Moment (kip-inch) 3014 3251 3092 3144
Ideal Flexural Strength (kip-inch) 3938 3722 3940 3755
Maximum Moment (kip-inch) 4456 4165 4335 4176
Table 7-3: Components of displacement at initial yield from force-displacement analysis
Components of Displacement DB5-RE LB8-FB LB8-D1 LB8-D2
Flexure
Displacement (inches) 0.19 0.19 0.20 0.20
Drift Ratio (%) 0.32 0.32 0.33 0.34
Contribution to Total (%) 72.1 66.3 52.9 53.9
Slip
Displacement (inches) 0.07 0.09 0.17 0.17
Drift Ratio (%) 0.12 0.15 0.28 0.28
Contribution to Total (%) 25.7 31.9 45.5 44.6
Shear
Displacement (inches) 0.01 0.01 0.01 0.01
Drift Ratio (%) 0.01 0.01 0.01 0.01
Contribution to Total (%) 2.2 1.8 1.5 1.6
Total
Displacement (inches) 0.27 0.29 0.37 0.38
Drift Ratio (%) 0.45 0.48 0.61 0.63
Contribution to Total (%) 100 100 100 100
147
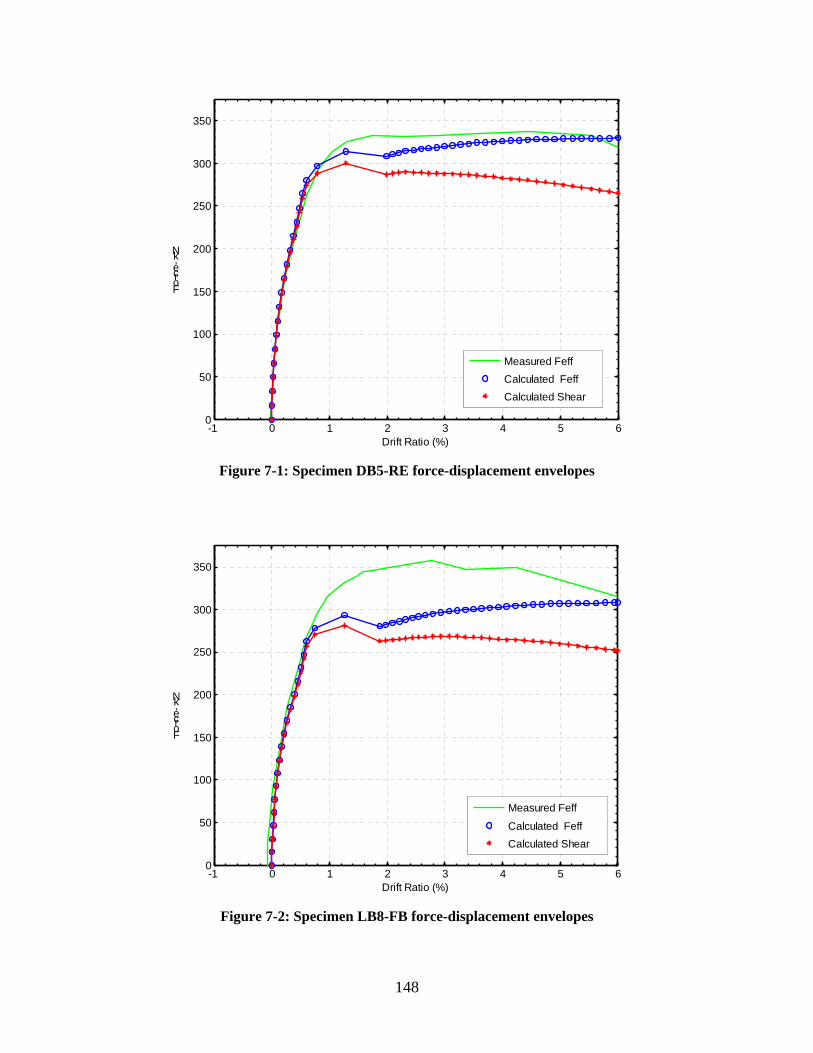
0
50
100
150
200
250
300
350
Fo rce,kN
Measured Feff Calculated Feff Calculated Shear
-1 0 1 2 3 4 5 6 Drift Ratio (%)
Figure 7-1: Specimen DB5-RE force-displacement envelopes
-1 0 1 2 3 4 5 6 Drift Ratio (%)
Figure 7-2: Specimen LB8-FB force-displacement envelopes
0
50
100
150
200
250
300
350
Fo rce, kN
Measured Feff
Calculated Feff Calculated Shear
148
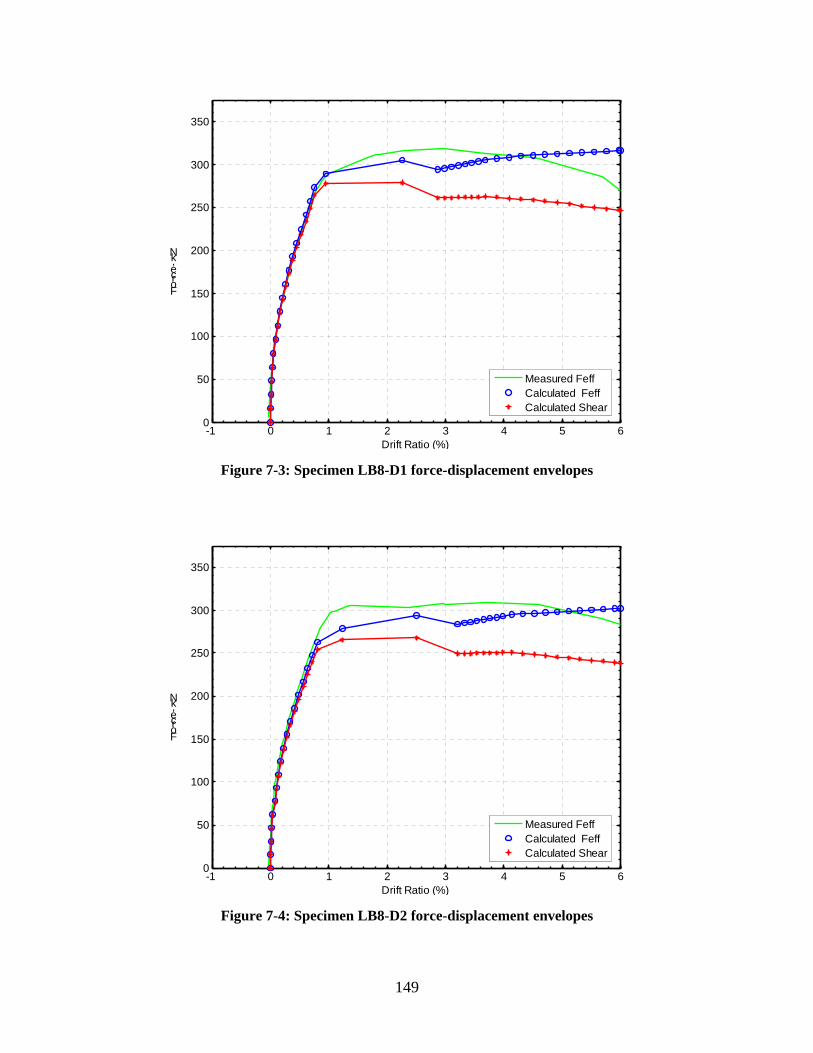
0
50
100
150
200
250
300
350
Fo rce, kN
Measured Feff Calculated Feff Calculated Shear
-1 0 1 2 3 4 5 6 Drift Ratio (%)
Figure 7-3: Specimen LB8-D1 force-displacement envelopes
-1 0 1 2 3 4 5 6 Drift Ratio (%)
Figure 7-4: Specimen LB8-D2 force-displacement envelopes
0
50
100
150
200
250
300
350
Fo rce, kN
Measured Feff Calculated Feff Calculated Shear
149
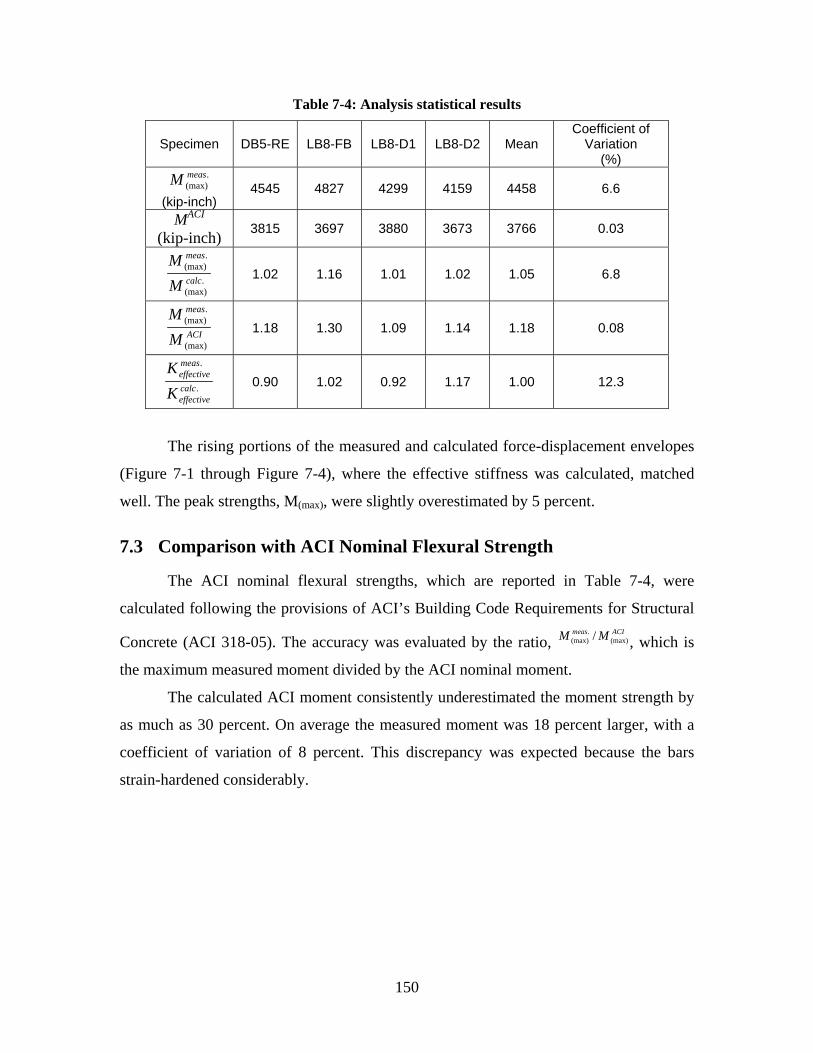
Table 7-4: Analysis statistical results
Specimen DB5-RE LB8-FB LB8-D1 LB8-D2 Mean Coefficient of
Variation (%)
. (max)M meas
(kip-inch) 4545 4827 4299 4159 4458 6.6
MACI
(kip-inch) 3815 3697 3880 3673 3766 0.03
. (max)
. (max) calc
meas
M M
1.02 1.16 1.01 1.02 1.05 6.8
ACI
meas
M M
(max)
. (max)
1.18 1.30 1.09 1.14 1.18 0.08
.
.
calc effective
meas effective
K K
0.90 1.02 0.92 1.17 1.00 12.3
The rising portions of the measured and calculated force-displacement envelopes
(Figure 7-1 through Figure 7-4), where the effective stiffness was calculated, matched
well. The peak strengths, M(max), were slightly overestimated by 5 percent.
7.3 Comparison with ACI Nominal Flexural Strength
The ACI nominal flexural strengths, which are reported in Table 7-4, were
calculated following the provisions of ACI’s Building Code Requirements for Structural meas. ACIM (max) / M (max)Concrete (ACI 318-05). The accuracy was evaluated by the ratio, , which is
the maximum measured moment divided by the ACI nominal moment.
The calculated ACI moment consistently underestimated the moment strength by
as much as 30 percent. On average the measured moment was 18 percent larger, with a
coefficient of variation of 8 percent. This discrepancy was expected because the bars
strain-hardened considerably.
150
8 IMPLEMENTATION CONSIDERATIONS
The design and construction recommendations contained in this chapter provide
engineers, fabricators, and contractors with practical guidance for designing and
constructing the large-bar precast bridge bent system. The recommendations focus on
those aspects of the design and construction of the large-bar precast bridge-bent that
differ from conventional practice. These recommendations were developed from
experience gained during construction and testing in the laboratory, as well as from
discussions with WSDOT personnel, local engineers, fabricators, and contractors.
The methods used to design the experimental subassemblies are first evaluated in
Section 8.1. Recommendations for design and field implementation of the system are
contained in sections 8.2 and 8.3.
8.1 Evaluation of Design Methods
The subassemblies were designed following the AASHTO LRFD and ACI-318
specifications to the extent possible. However, special procedures were developed for
some design considerations, such as anchorage of large bars in grouted ducts. The
applicability of the design procedures and engineering judgments are evaluated in this
section.
8.1.1 Flexural Strength
In sections 7.2 and 7.3, the measured flexural strengths were compared with the
flexural strengths calculated with moment-curvature analysis and the provisions in ACI
318-05. These calculations showed that moment-curvature analysis of the column cross-
section at the interface can be used to accurately calculate the flexural strength. The
flexural strength can also be calculated conservatively by using the provisions of ACI
318-05.
8.1.2 Stiffness
The measured stiffnesses (Section 6.2) and calculated stiffnesses (Section 7.2) of
the four subassemblies at first yield were all similar. For the purpose of design, the bridge
151
bents constructed with the proposed system can be modeled in the same way as cast-in-
place bents.
8.1.3 Force-Reduction Factor
The strength, ductility, and energy dissipation capacity of the precast system were
similar to those of a typical cast-in-place system (sections 6.1 and 6.3). For this reason,
the force-reduction factors for a cast-in-place bridge-bent can be applied to the proposed
system.
8.1.4 Sliding Shear at the Beam-Column Interface
Sliding at the column-beam interface was resisted by friction between the
concrete-to-grout surface and dowel action of the longitudinal bars. The surfaces at the
column and cap-beam interface were both intentionally roughened to ensure than that
sliding did not occur. The procedure used to roughen the surfaces is discussed in Section
B.2.7.
No sliding at the interface was observed, even after significant loss of core
concrete, bar buckling, and bar fracture. Assuming that all the sliding resistance was
attributed to friction between the concrete and grout interface and that the axial load was
shared between the bars and concrete, the coefficient of friction demand was calculated to
be approximately 0.68 at maximum lateral resistance of the subassembly. This value is
below the monotonic friction capacity defined by ACI 318-05, which is 1.0 for concrete
placed against hardened concrete with the surface intentionally roughened. However,
cyclic loading should be expected to reduce the shear-friction capacity of the interface.
As the concrete crushes, loose particles of sand and aggregate will fill the crack and act
as rollers, thereby reducing the effectiveness of the intentionally roughened surface.
Testing showed no evidence of sliding. That finding suggests that the cyclic friction
capacity is larger than 0.68.
8.1.5 Anchorage Length
The vertical column bars in the precast system are embedded in the grouted ducts
of the precast cap-beam and are further anchored in the cast-in-place diaphragm. During
erection of the girders and deck, prior to the diaphragm being cast, the bars need to be
152
adequately developed in the grouted ducts for erection loads. Additional development of
the bars in the diaphragm is available for resisting seismic loads induced after the bridge
has been completed.
The selected development lengths of the vertical column bars in the grouted ducts
were based on recommendations from Steuck et al. (2007). Full-scale monotonic pullout
tests showed that reinforcing bars of sizes up to #18 in grouted ducts can be developed
monotonically to yield in 6 db and to fracture in 14 db. Finite-element modeling calibrated
against the test results showed that the bars can be developed to yield in 5.5 db and to
fracture in 10 db. The difference lies in the fact that tests were conducted only for certain
embedment lengths, for example 8 and 14 db , with no intermediate results.
On the basis of the work of Raynor et al. (2002), Steuck recommended increasing
the development length 50 percent to account for cyclic loading but did not conduct
cyclic tests to confirm that recommendation. In general, the depth of the precast cap-
beam is sufficient to accommodate a development length with a 50 percent increase for
cyclic loading and 8 db for deliberate debonding.
The monotonic and cyclic performances of bond in grouted ducts were compared
in Section 6.7. The average cyclic bond stress determined from strain gage data in beam-
column Specimen LB8-D2 was found to be, on average, half that measured in the
monotonic pullout tests on identical bars (Appendix D). Strain profiles from bars in
Specimen LB8-D2 (Section 5.6) showed significant strains at the ends of the grouted
ducts, 18 db below the interface. For example, at 2 and 3 percent drift ratio, the strain 18
db below the interface was a little more than one half of yield. This suggests that
continuation of the bars into the cast-in-place diaphragm is necessary for cyclic loads,
even though development in the grouted ducts is sufficient under monotonic loading.
Continuation of the bars into the diaphragm provides additional embedment and aids in
transferring joint shear through the cap-beam and diaphragm. Joint shear is discussed in
Section 8.1.7.
8.1.6 Debonded Length
The column bars in specimens LB8-D1 and LB8-D2 were deliberately debonded
over a length of 8 db (8 inches) in the cap-beam to reduce the strains at the connection
153
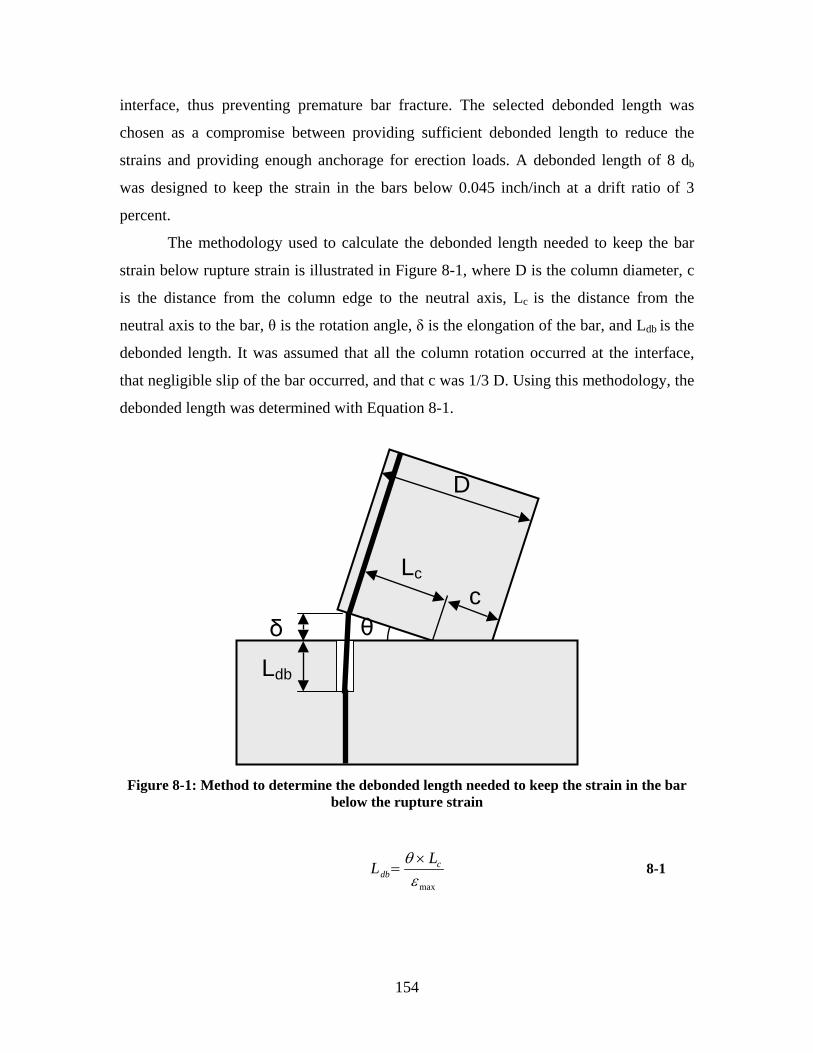
interface, thus preventing premature bar fracture. The selected debonded length was
chosen as a compromise between providing sufficient debonded length to reduce the
strains and providing enough anchorage for erection loads. A debonded length of 8 db
was designed to keep the strain in the bars below 0.045 inch/inch at a drift ratio of 3
percent.
The methodology used to calculate the debonded length needed to keep the bar
strain below rupture strain is illustrated in Figure 8-1, where D is the column diameter, c
is the distance from the column edge to the neutral axis, Lc is the distance from the
neutral axis to the bar, θ is the rotation angle, δ is the elongation of the bar, and Ldb is the
debonded length. It was assumed that all the column rotation occurred at the interface,
that negligible slip of the bar occurred, and that c was 1/3 D. Using this methodology, the
debonded length was determined with Equation 8-1.
c
Ldb
δ
D
θ
Lc
Figure 8-1: Method to determine the debonded length needed to keep the strain in the bar below the rupture strain
θ × LcLdb = 8-1εmax
154
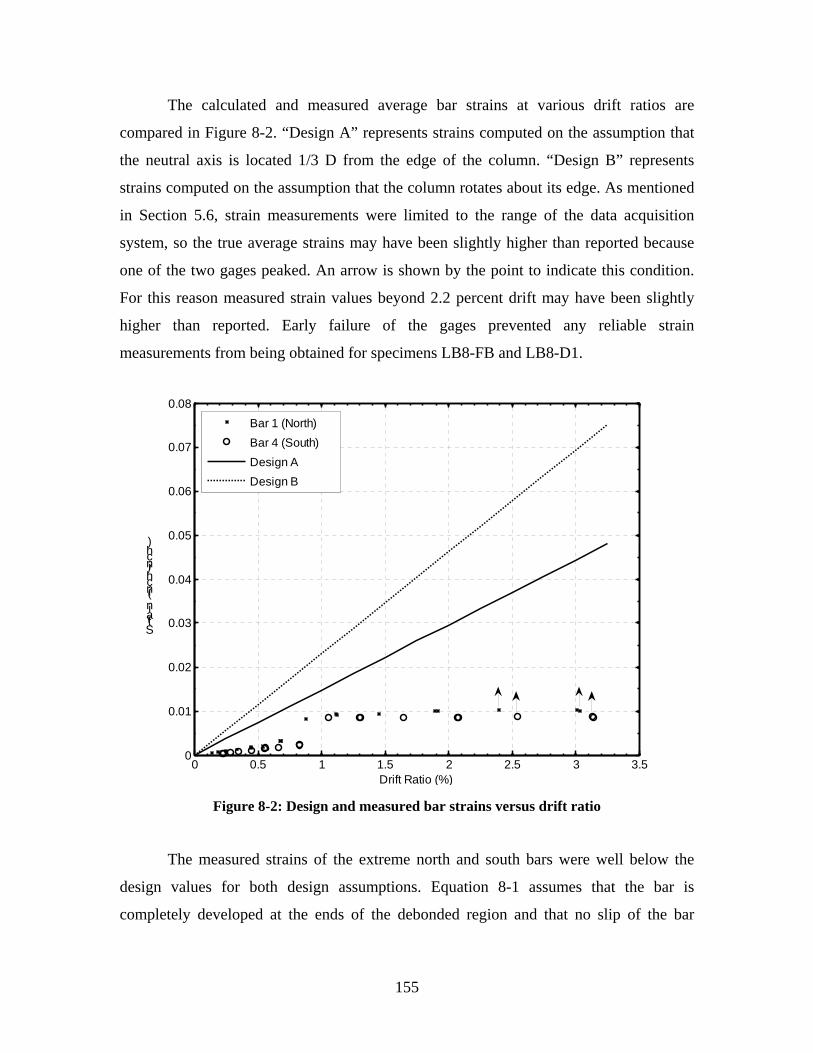
The calculated and measured average bar strains at various drift ratios are
compared in Figure 8-2. “Design A” represents strains computed on the assumption that
the neutral axis is located 1/3 D from the edge of the column. “Design B” represents
strains computed on the assumption that the column rotates about its edge. As mentioned
in Section 5.6, strain measurements were limited to the range of the data acquisition
system, so the true average strains may have been slightly higher than reported because
one of the two gages peaked. An arrow is shown by the point to indicate this condition.
For this reason measured strain values beyond 2.2 percent drift may have been slightly
higher than reported. Early failure of the gages prevented any reliable strain
measurements from being obtained for specimens LB8-FB and LB8-D1.
0
0.01
0.02
0.03
0.04
0.05
0.06
0.07
0.08
Stra in (in ch/in ch)
Bar 1 (North) Bar 4 (South) Design A Design B
0 0.5 1 1.5 2 2.5 3 3.5 Drift Ratio (%)
Figure 8-2: Design and measured bar strains versus drift ratio
The measured strains of the extreme north and south bars were well below the
design values for both design assumptions. Equation 8-1 assumes that the bar is
completely developed at the ends of the debonded region and that no slip of the bar
155
occurs. This methodology is conservative to ensure that bar strains are kept below rupture
strain.
Cyclic displacements of the column were found to damage the concrete and grout
and degrade the bond (Section 6.7), causing the bars to slip and debond themselves. For
example, (referring to Figure 8-2) at 2 percent drift the average strains measured in the
north and south bars were approximately 0.01 inch/inch, but the expected strain
calculated from Equation 8-1 was roughly 0.03 inch/inch. This indicates that the effective
debonded length, between the points where the bar was completely fixed, was
approximately three times the original intentional debonded length. Spalling damage and
other effects of cyclic loading must therefore have caused the bar to debond an additional
16 db (16 inches).
Intentional debonding did not have any measurable impact on the overall
hysteretic performance for the cyclic displacement history to which the subassemblies
were subjected. Debonding of the longitudinal bars also did not delay bar fracture. These
findings suggest that intentional debonding is unnecessary under the cyclic loading
program used here.
However, the results might be different for a pulse loading event. A pulse load is
expected to cause concentrated strains at the interface and act similarly to a monotonic
pullout of the bar. The bond stress would likely be higher because the grout and concrete
would be relatively undamaged and bar slip would be much less than under a
progressively increasing cyclic load history. This would result in a higher strain
concentration at the interface, in which case debonding would be advantageous in
preventing bar fracture.
8.1.7 Joint Shear
The tension and compression forces from the column bars and concrete cause
shear force in the beam-column joint. The intensity of the resulting joint shear stress
depends on the area of the joint that can be mobilized to resist the force. The vertical
dimension of the joint may be taken as the length of the bars, so continuation of the bars
up into the diaphragm increases the joint area and lowers the joint shear stress demand.
The AASHTO LRFD Design Specifications require spiral reinforcement around the bars
156
(and by implication here, the ducts) in the cap-beam at the same spacing as in the column.
This spiral provides confinement of the joint region and increases its shear stress
capacity. Detailed drawings of the reinforcement are provided in Appendix B.
The joint shear stress demand in the tests was approximately 180 psi or 2.1 cf ' .
This demand is well below the capacity set forth in ACI 318-05, and consequently no
shear damage occurred in the joint. The only observed damage was minor flexural
cracking (discussed in Chapter 4) due to bending of the beam.
8.2 Design Recommendations
The main design recommendations resulting from the foregoing evaluation are as
follows:
8.2.1 Strength, Stiffness and Ductility
� Forces acting on the beam-column joint can be determined from conventional frame
analysis of the bridge-bent that assumes that the connections are moment resisting.
� The flexural strength can be determined from a cross-sectional analysis of the column
section at the beam-column interface.
� Stiffness can be predicted by using standard methods for reinforced concrete
columns.
� In all cases the tests showed that a drift ratio of 5.5 percent (sections 5.2 and 6.1)
could be reached before bar buckling and fracture occurred. This value is
approximately three times the demand expected in even a major earthquake and is
comparable to the value achieved with a cast-in-place system. This finding suggests
that the precast system has sufficient ductility capacity for all foreseeable needs.
8.2.2 Bond and Anchorage
� The development length needed for the bars in grouted ducts can be determined by
following the recommendations of Steuck et al. (2007). Steuck’s results were based
on monotonic loading and are appropriate, without modification, for construction
loading.
157
� The development length required for cyclic loading should be increased by 50 percent
beyond the value recommended by Steuck et al. If the bars are extended into the cast-
in-place diaphragm, the length of bar embedded in the diaphragm should be used
toward the anchorage length requirements for seismic loading that occurs after the
bridge has been completed.
� For cyclic loading that is approximately symmetric about zero rotation, debonding of
the longitudinal bars to reduce the strain concentration at the interface and inhibit bar
fracture is not necessary. The cyclic loading causes sufficient additional debonding to
reduce the strain concentration.
� Debonding may be beneficial in preventing premature bar fracture in the event of
pulse loading. The required length of the debonded region can be conservatively
determined with Equation 8-1.
8.2.3 Interface and Joint Shear
� The concentration of cracking at the interface gives rise to the possibility of a shear
sliding failure there, and it should be checked by using shear friction principles. The
effective friction coefficients provided in the AASHTO and ACI codes, which were
developed for monotonic loading, are likely to be unjustifiably high for use with
cyclic loads. They were also developed for concrete-to-concrete, and not concrete-to-
grout, interfaces. The experiments showed that an effective friction coefficient of at
least 0.65 is justifiable under cyclic loading.
� The details of the joint within the cap beam and diaphragm were adequate to suppress
joint shear failure. The calculated joint shear stress demand was much lower than the
capacities set forth by ACI-318. However, the longitudinal bars were continued into
the diaphragm, thereby enlarging the joint area and reducing the stress. If the bars had
been stopped within the cap beam, the joint shear stress would have been higher and
might have proved critical even if the bar anchorage had been adequate.
8.2.4 Corrosion and Durability
The precast system has the same durability considerations as a cast-in-place
bridge bent, such as adequate clear cover and concrete mix selection. Two additional
issues should also be considered.
158
� Debonding of the bars would create region where the bar was exposed to a small void
of air. If water were to penetrate it, corrosion could occur. However, the probability
of this occurring is very low because the moisture would have to penetrate through
the grout pad, which is under permanent compression, and then rise upwards into the
debonding sleeve. Furthermore, the use of large bars, which have a low
surface/volume ratio, provides protection against corrosion failure. Specification of
moisture-resistant details, such as caulking the ends of the debonding sleeve, would
help to even further reduce the probability of corrosion failure.
� The corrugated metal ducts extend to the bottom surface of the cap-beam, and present
a possible corrosion initiation site. The use of galvanized ducts, or stopping the ducts
short of the surface, would provide options for guarding against such corrosion.
8.2.5 Footing Connnection
� Details for the column-to-footing connection have not been developed. However,
concepts similar to those used for the beam-to-column connection or standard
detailing can be used, depending on whether the column is precast or cast-in-place.
In the former case, testing would be needed to validate the performance of the
connection.
8.3 Field Implementation Recommendations
The following are recommendations for field implementation:
8.3.1 Bar placement
� The bars should be centered in the ducts as nearly as possible. No tests were
conducted to verify the sensitivity of eccentric alignment of the large bars. However,
earlier tests by Raynor (2002) on smaller bars found that eccentric placement reduced
the anchorage strength only slightly.
� Terminating the bars in the diaphragm at slightly varying heights would aid in
alignment of the bars and ducts on-site, because only one bar-duct pair would need to
be aligned at a time.
159
8.3.2 Grout
� The grout used in the test specimens is described in Section B.1.3. Approximately 5
days were required for the grout to reach strengths of over 8500 psi. Samples younger
than 5 days were typically “green” and at 2 or 3 days had little compressive strength.
A faster setting grout with comparable performance would help speed the erection
time on-site.
� The grouting operation should be conducted in such a way that no air voids form and
the grout is properly consolidated, particularly in the ducts. This process is easier with
larger ducts. No difficulties were experienced by Steuck in his tests on #18 bars in 8-
inch diameter ducts.
� Setting of the girders depends on the time needed for the grout to achieve strength.
� Roughening of the cap-beam and column surface, in combination with dowel action,
is sufficient to resist sliding between the concrete and grout surfaces at the interface.
However, a roughened surface increases the likelihood of air voids forming at the top
of the grout pad. Thus, the concrete surfaces should be roughened, and the interface
should be grouted, in a way that minimizes air voids.
160
9 SUMMARY AND CONCLUSIONS
9.1 Summary
This research evaluated the seismic performance of a new precast bridge bent
system that was developed to accelerate construction of bridge substructures in seismic
regions. The system consists of a precast column and cap-beam connected on site at the
beam-column interface. The connection consists of six large vertical column bars (#18)
grouted into large corrugated metal ducts embedded within the cap-beam. The small
number of bars and large ducts allows for accelerated erection and generous tolerances.
The primary research issues were the seismic performance of the connection, and the
anchorage of the large bars, under cyclic loading.
Four scaled column subassembly tests and three monotonic bar pullout tests were
conducted at approximately 40 percent scale. The first subassembly simulated a typical
cast-in-place bridge column and served as a baseline for comparison. The other three
simulated the precast connection, with some longitudinal reinforcement that was not
continuous across the interface. In two of these precast subassemblies, the large bars were
debonded (using two methods) over a short length near the beam-column interface to
reduce the strain concentration there. The subassemblies were tested under constant axial
load and a cyclic lateral-displacement history.
All four subassemblies demonstrated nearly identical force-displacement
responses and levels of physical damage. The subassemblies all maintained 80 percent of
their peak lateral resistance out to approximately 5.5 percent drift, thereby demonstrating
a drift capacity that is much greater than the demand of even a large earthquake. The four
subassemblies ultimately failed as a result of bar buckling and bar fracture, which
occurred at nearly the same drift in each specimen. The majority of deformations in the
precast subassemblies resulted from a large crack opening at the interface. In the cast-in-
place subassembly, deformations were more evenly distributed up the column.
The measured responses of the subassemblies were compared with the results of a
force-displacement analysis by using standard material models. The calculated maximum
moments, effective forces, and effective stiffnesses were predicted well by the analysis.
161
The maximum measured moments were higher than the nominal moment predicted by
ACI procedures, but this was expected because the bars strain-hardened significantly.
Damage models (Berry and Eberhard, 2004, 2005) underestimated the drift ratio at
spalling, bar buckling, and bar fracture by 16 to 20 percent.
Design and construction recommendations that focus on those aspects that differ
from conventional practice were developed to provide engineers, fabricators, and
contractors with practical guidance for designing and constructing the large-bar precast
bridge bent system.
Three monotonic pullout tests on bars replicating the anchorage conditions in the
subassembly of the proposed system were conducted to more closely study the anchorage
conditions and distribution of bond stress along the bars. In the fully bonded specimen,
significant displacements of the surface of the grout and of the duct surrounding the bar
were measured. They were consistent with the patterns of radial cracking and flaking that
were observed. In the two debonded specimens, no cracking occurred, and surface
displacements of the grout and concrete were negligible. Measured strains along the bars
indicated that both debonding methods were effective in fully debonding the bar and that
there was no measurable difference between the two methods.
9.2 Conclusions
The findings of this experimental research program support the following
conclusions:
9.2.1 Column Subassembly Tests
� The proposed precast bridge bent system performs well out to a drift of 5.5
percent.
� The behavior of the precast connection was in most respects similar to that of a
typical cast-in-place connection. In particular, both failed in the same way, by bar
buckling followed by fracture.
� The majority of deformation of the precast system was concentrated at one large
crack at the interface of the beam-column joint. This behavior differed from that
of the cast-in-place reinforce concrete connection, in which deformations were
more distributed over the column height.
162
� Debonding of the longitudinal bars over a length of 8 db in the cap-beam had little
effect on the overall hysteretic performance of the system. It did slightly reduce
the stiffness under low loads.
� Debonding of the bars did not delay bar fracture. Fracture occurred not by
elongation of the unbent bar under cyclic axial load but as a result of low-cycle
fatigue caused by buckling and straightening in the column. The buckling
occurred in the bonded region in the column, not in the PVC sleeves used for
debonding in the cap-beam.
� Debonding prevented spalling damage to the cap-beam. However, the spalling
damage to the cap-beam in the fully bonded specimen was not great.
9.2.2 Bar Pullout Test
� The front-end force-displacement behavior of each of the bars was primarily
governed by the stress-strain response of steel because the bar was fully anchored
and showed no rigid-body slip.
� Debonding the bar over a length of 8 db added flexibility to the system by
allowing the bar to elongate freely over the debonded region. The added
flexibility was most noticeable under elastic conditions.
� There was no measurable difference between the two debonding methods. Bar
strains within the debonded region were nearly constant, indicating that the bars
were debonded and that negligible friction developed between the bar and PVC
sleeve.
� Debonding the bar over a length of 8 db reduced or eliminated the damage to the
surface of the grout and concrete. Measured displacements at the surface
confirmed this by indicating that surface displacements of the concrete, duct, and
grout in the two debonded specimens were negligible in comparison with those
measured in the fully bonded specimen.
� For a fully bonded bar, a cone of grout cracks at the front end and makes the
region ineffective for transmitting force through the duct into the concrete. The
depth of the cone was about equal to the duct diameter.
163

� In a bar deliberately debonded by a sleeve, the high bond stresses occurred just
beyond the sleeve, where confinement was good enough to prevent formation of a
cone. The bond was effective over the entire bonded length.
9.3 Recommendations for Further Research
Additional research is needed to investigate the following areas to fully
implement or enhance rapid constructability of the proposed precast system:
� The connection tested here is suitable for connecting the column to the cap-beam.
Development of a column-to-foundation connection, based on similar principles,
is desirable.
� Testing to determine the sensitivity to variations of some of the details should be
conducted. Examples include the effect of grout type and strength, eccentricity of
the bar in the duct, and different duct materials.
� Design procedures and equations should be developed to help designers in
implementing the system.
164

ACKNOWLEDGMENTS
The authors would first and foremost like to thank the Washington State
Department of Transportation for sponsoring this project. Without their support and
vision, this research would not have been possible.
Many people at the University of Washington Department of Civil Engineering
Structures Lab generously gave of their time and knowledge. Vince Chaijeroen, the
Structures Lab Manager, unconditionally assisted in this project, staying many late nights
and going out of his way to ensure that testing was successful. Fellow graduate and
undergraduate students Wayne Brown, Amanda Jellin, Jon Pavadorac, Alicia Black,
Golnaz Jankah, Andrea Leonard, Andy Gilbert, John Werner, and Jason Perkinaz made
this research a smooth and enjoyable experience. They gave kindly of their personal time
to help in the construction and testing of the specimens. I am so grateful for their help and
support. Without their help, this research would have been a formidable, if not
impossible, task.
165
REFERENCES
AASHTO. (2005). “LRFD Bridge Design Specifications 4th edition.” American Association of State Highway and Transportation Officials, Washington, DC.
ACI Committee 318 (2005). “Building Code Requirements for Structural Concrete and Commentary.” ACI 318-05/ACI 318-05R, American Concrete Institute, Farming Hills, MI.
Asnaashari, Ali., Gafton, Jon R., and Johnnie, Mark. (2005) “Precast Concrete Design-Construction of SanMateo-Hayward Bridge Widening Project.” PCI Journal, Jan-Feb 2005, pp 26-43.
Berry, Mike P., and Eberhard, Marc O. (2003a). “Performance Models for Flexural Damage in Reinforced Concrete Columns.” Pacific Earthquake Engineering Research Center Report 2003, University of California, Berkeley California.
Berry, Mike P., and Eberhard, Marc O. (2003b). “Performance Modeling Strategies for Modern Reinforced Concrete Bridge Columns.” Pacific Earthquake Engineering Research Center Report 2003, University of California, Berkeley California.
Berry, Mike P., and Eberhard, Marc O. (2004). “PEER Structural Performance Database User’s Manual.” Pacific Earthquake Engineering Research Center Report 2004, <www.ce.washington.edu/~peeral>, University of California, Berkeley, CA.
Berry, Mike P., and Eberhard, Marc O. (2005). “Practical Performance Model for Bar Buckling.” Journal of Structural Engineering, ASCE, Vol 131, No 7, July 2005, pp 1060-1070.
Billington, S.L., Barnes, R.W., and Breen, J.E. (2001) “Alternative Substructure Systems for Standard Highway Bridges.”Journal of Bridge Engineering, March-April 2001, pp 87-94.
Brenes, Francisco J., Wood, Sharon L., Kreger, Michael E. (2006). “Anchorage Requirements for Grouted Vertical Duct Connectors in Precast Bent Cap System.” Report No. FHWA/TX-06/0-4176-1, Texas Department of Transporation, Texas.
Brown, Wayne. (2008) “Bar Buckling in Reinforced Concrete Bridge Columns.” Master’s Thesis, University of Washington, Seattle, WA.
166
Building Seismic Safety Council. (2003) “NEHRP Recommended Provisions for Seismic Regulations and for New Buildings and Other Structures (FEMA 450).” National Earthquake Hazards Reduction Program, National Institute of Building Sciences, Washington, D.C.
Burns, N.H., and Seiss, C.P. (1962). “Load-Deformation Characteristics of Beam-Column Connections in Reinforced Concrete.” Civil Engineering Studies Structural Research Series No. 234, University of Illinois, Urbana, Illinois.
Eligehausen, R., Popov, E., and Bertero, V. (1983). “Local Bond Stress-Slip Relationships of Deformed Bars Under Generalized Excitations.” Earthquake Engineering Research Center, Report UCB/EERC-83/23, University of California, Berkeley, CA.
Elwood, K.J. and Eberhard, M.O. (2006) “Effective Stiffness of Reinforced Concrete Columns,” PEER Research Digest 2006-1, March 2006, pp 4.
FHWA (2006). “2006 Condition and Performance Report.” U.S. Department of Transportation, Federal Highway Administration.
FHWA (2008). “Prefabricated Bridge Elements and Systems-Substructures” Federal Highway Administration, <http://www.fhwa.dot.gov/bridge/prefab/bentcaps.htm.>
Hieber, David G., Wacker, Jonathan M, Eberhard, Marc O., and Stanton, John F. (2005a). “Precast Concrete Pier Systems for Rapid Construction of Bridges in Seismic Regions.” Washington State Department of Transportation Report No. WA-RD-611.1, Washington State Department of Transportation, Washington, 2005.
Hieber, David G., Wacker, Jonathan M., Eberhard, Marc O., and Stanton, John F. (2005b). “State of the Art Report on Precast Concrete Systems for Rapid Construction of Bridges.” Washington State Department of Transportation Report No. WA-RD-549.1, Washington State Department of Transportation, Washington, 2005.
Khaleghi, Bijan. (2005). “Use of Precast Concrete Members for Accelerated Bridge Construction in Washington State.” Transportation Research Record. Journal of the Transportation Research Board. CD 11-S. Transportation Research Board at the National Academies, Washington DC, pp 187-196.
Lehman, Dawn E. (1998). “Performance-Based Seismic Design of Well-Confined Concrete Columns.” Ph.D. Dissertation, Department of Civil and Environmental Engineering, University of California, Berkeley, CA.
167
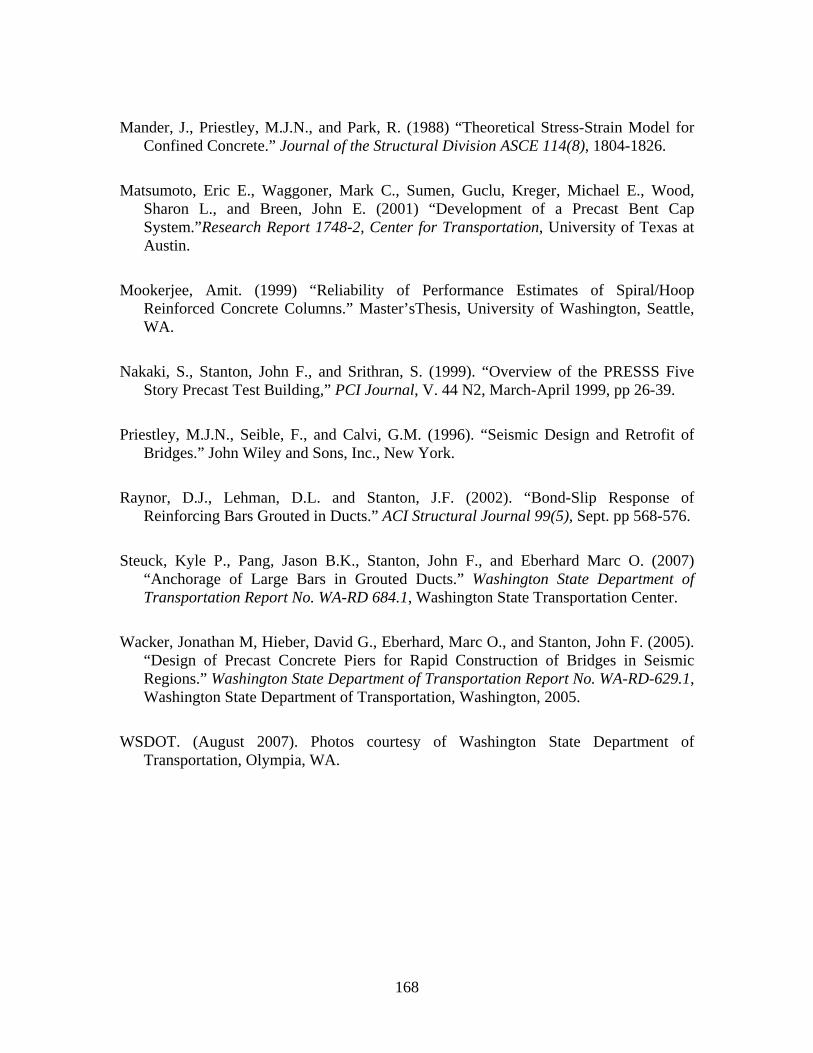
Mander, J., Priestley, M.J.N., and Park, R. (1988) “Theoretical Stress-Strain Model for Confined Concrete.” Journal of the Structural Division ASCE 114(8), 1804-1826.
Matsumoto, Eric E., Waggoner, Mark C., Sumen, Guclu, Kreger, Michael E., Wood, Sharon L., and Breen, John E. (2001) “Development of a Precast Bent Cap System.”Research Report 1748-2, Center for Transportation, University of Texas at Austin.
Mookerjee, Amit. (1999) “Reliability of Performance Estimates of Spiral/Hoop Reinforced Concrete Columns.” Master’sThesis, University of Washington, Seattle, WA.
Nakaki, S., Stanton, John F., and Srithran, S. (1999). “Overview of the PRESSS Five Story Precast Test Building,” PCI Journal, V. 44 N2, March-April 1999, pp 26-39.
Priestley, M.J.N., Seible, F., and Calvi, G.M. (1996). “Seismic Design and Retrofit of Bridges.” John Wiley and Sons, Inc., New York.
Raynor, D.J., Lehman, D.L. and Stanton, J.F. (2002). “Bond-Slip Response of Reinforcing Bars Grouted in Ducts.” ACI Structural Journal 99(5), Sept. pp 568-576.
Steuck, Kyle P., Pang, Jason B.K., Stanton, John F., and Eberhard Marc O. (2007) “Anchorage of Large Bars in Grouted Ducts.” Washington State Department of Transportation Report No. WA-RD 684.1, Washington State Transportation Center.
Wacker, Jonathan M, Hieber, David G., Eberhard, Marc O., and Stanton, John F. (2005). “Design of Precast Concrete Piers for Rapid Construction of Bridges in Seismic Regions.” Washington State Department of Transportation Report No. WA-RD-629.1, Washington State Department of Transportation, Washington, 2005.
WSDOT. (August 2007). Photos courtesy of Washington State Department of Transportation, Olympia, WA.
168
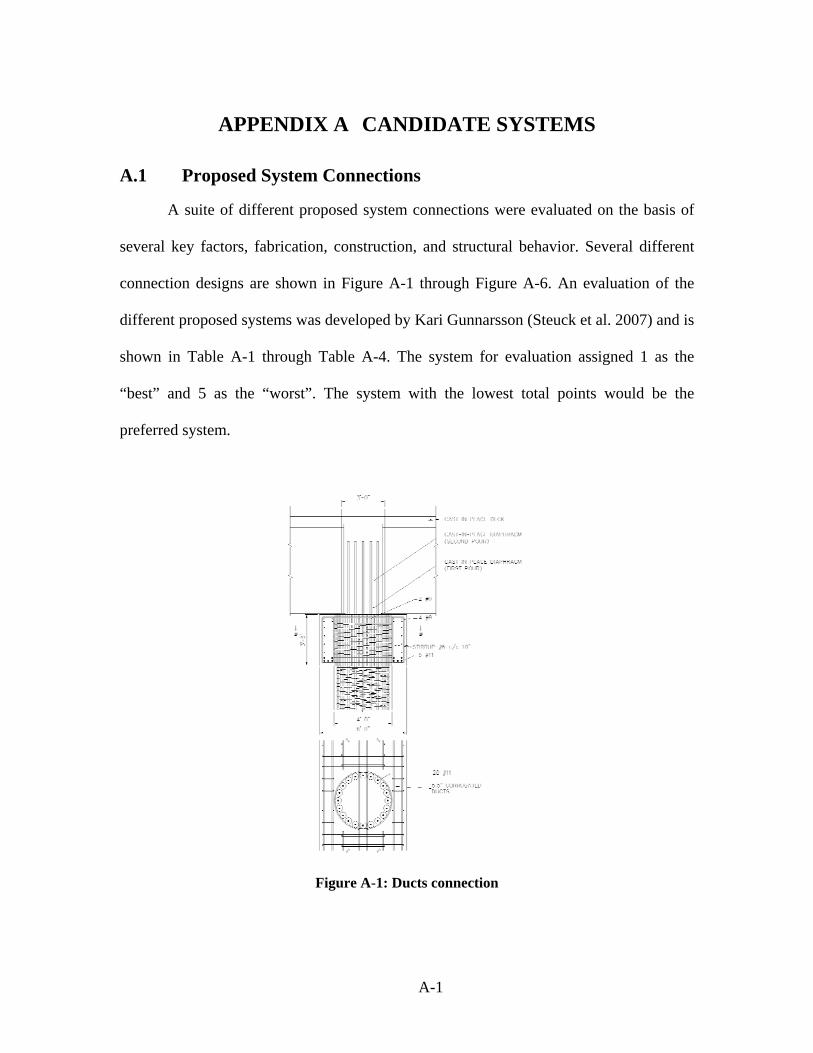
APPENDIX A CANDIDATE SYSTEMS
A.1 Proposed System Connections
A suite of different proposed system connections were evaluated on the basis of
several key factors, fabrication, construction, and structural behavior. Several different
connection designs are shown in Figure A-1 through Figure A-6. An evaluation of the
different proposed systems was developed by Kari Gunnarsson (Steuck et al. 2007) and is
shown in Table A-1 through Table A-4. The system for evaluation assigned 1 as the
“best” and 5 as the “worst”. The system with the lowest total points would be the
preferred system.
Figure A-1: Ducts connection
A-1
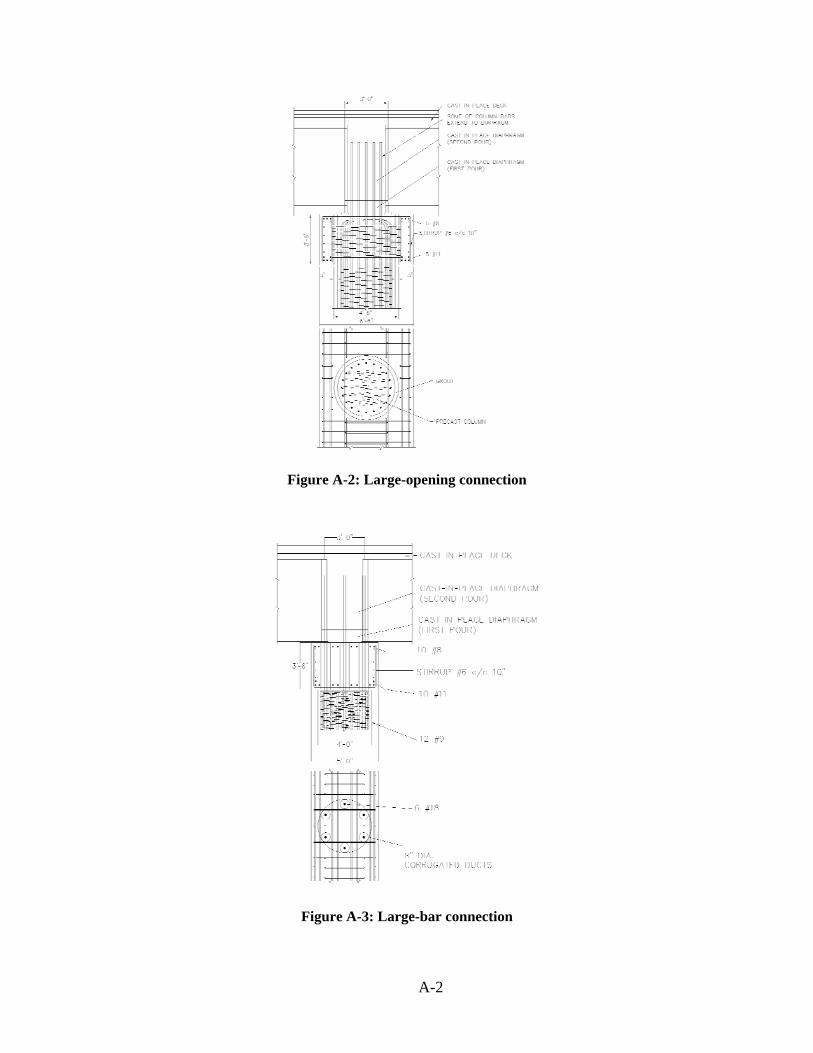
Figure A-2: Large-opening connection
Figure A-3: Large-bar connection
A-2
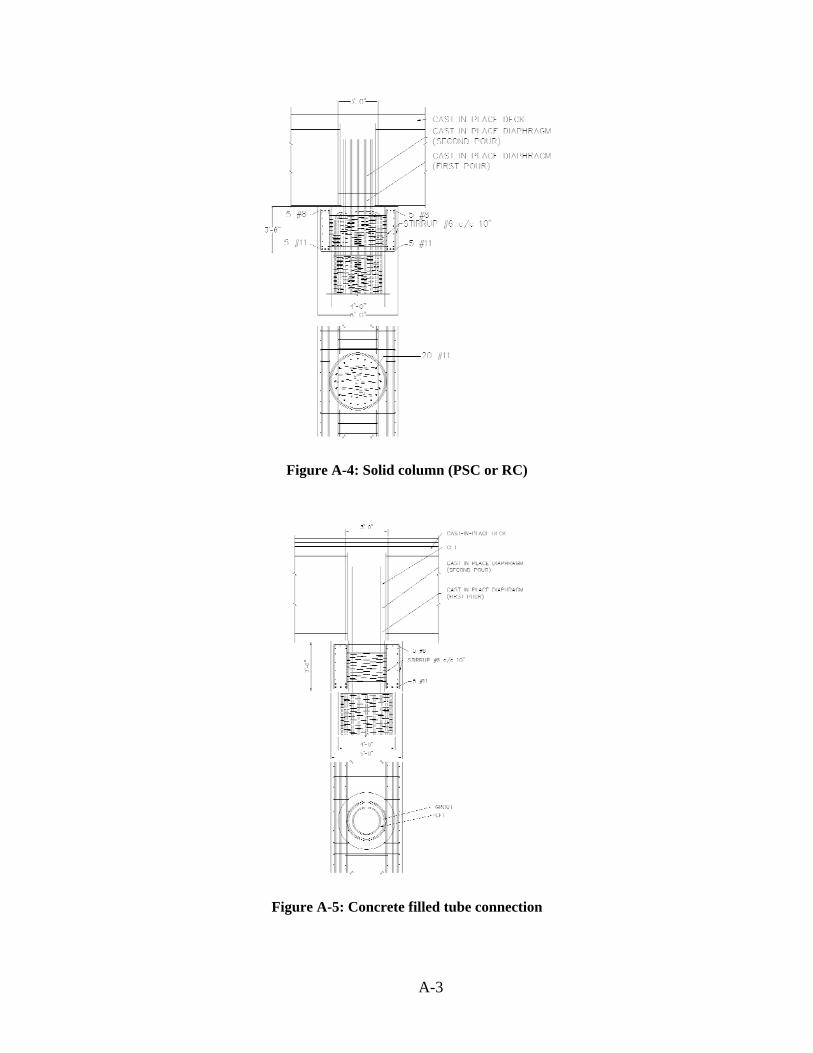
Figure A-4: Solid column (PSC or RC)
Figure A-5: Concrete filled tube connection
A-3
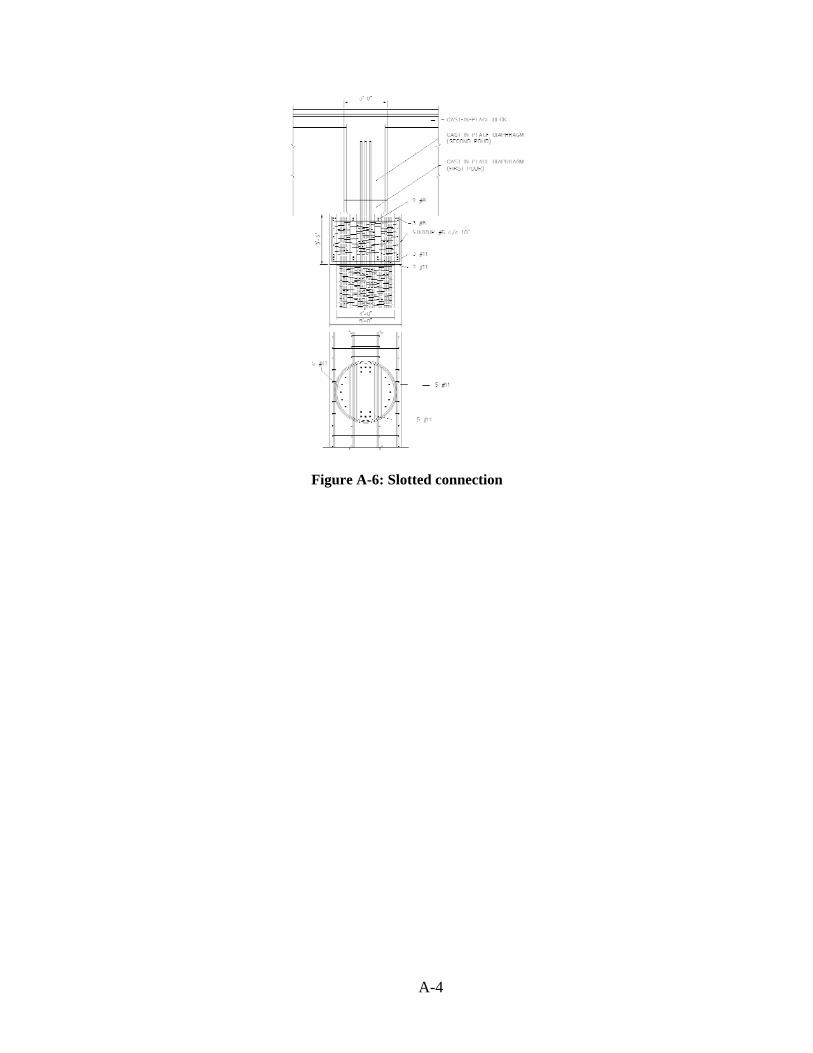
Figure A-6: Slotted connection
A-4
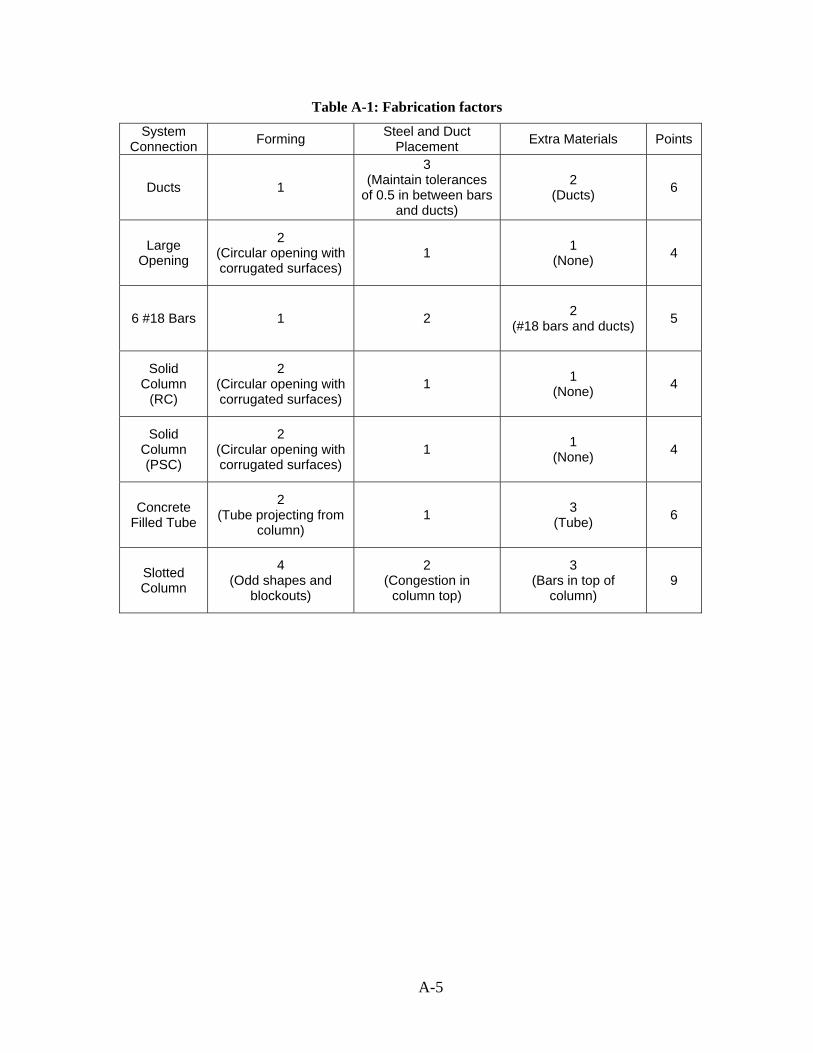
Table A-1: Fabrication factors
System Connection Forming Steel and Duct
Placement Extra Materials Points
Ducts 1
3 (Maintain tolerances
of 0.5 in between bars and ducts)
2 (Ducts) 6
Large Opening
2 (Circular opening with corrugated surfaces)
1 1 (None) 4
6 #18 Bars 1 2 2 (#18 bars and ducts) 5
Solid Column
(RC)
2 (Circular opening with corrugated surfaces)
1 1 (None) 4
Solid Column (PSC)
2 (Circular opening with corrugated surfaces)
1 1 (None) 4
Concrete Filled Tube
2 (Tube projecting from
column) 1 3
(Tube) 6
Slotted Column
4 (Odd shapes and
blockouts)
2 (Congestion in
column top)
3 (Bars in top of
column) 9
A-5
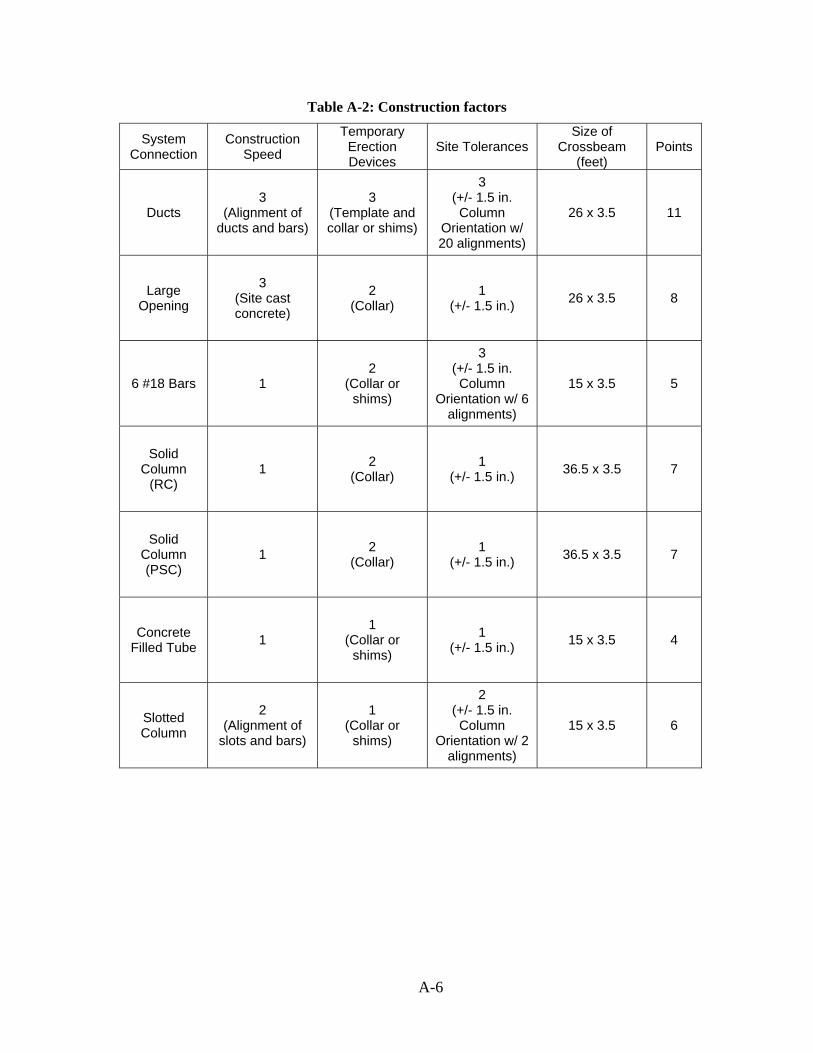
Table A-2: Construction factors
System Connection
Construction Speed
Temporary Erection Devices
Site Tolerances Size of
Crossbeam (feet)
Points
Ducts 3
(Alignment of ducts and bars)
3 (Template and collar or shims)
3 (+/- 1.5 in. Column
Orientation w/ 20 alignments)
26 x 3.5 11
Large Opening
3 (Site cast concrete)
2 (Collar)
1 (+/- 1.5 in.) 26 x 3.5 8
6 #18 Bars 1 2
(Collar or shims)
3 (+/- 1.5 in. Column
Orientation w/ 6 alignments)
15 x 3.5 5
Solid Column
(RC) 1 2
(Collar) 1
(+/- 1.5 in.) 36.5 x 3.5 7
Solid Column (PSC)
1 2 (Collar)
1 (+/- 1.5 in.) 36.5 x 3.5 7
Concrete Filled Tube 1
1 (Collar or
shims)
1 (+/- 1.5 in.) 15 x 3.5 4
Slotted Column
2 (Alignment of
slots and bars)
1 (Collar or
shims)
2 (+/- 1.5 in. Column
Orientation w/ 2 alignments)
15 x 3.5 6
A-6
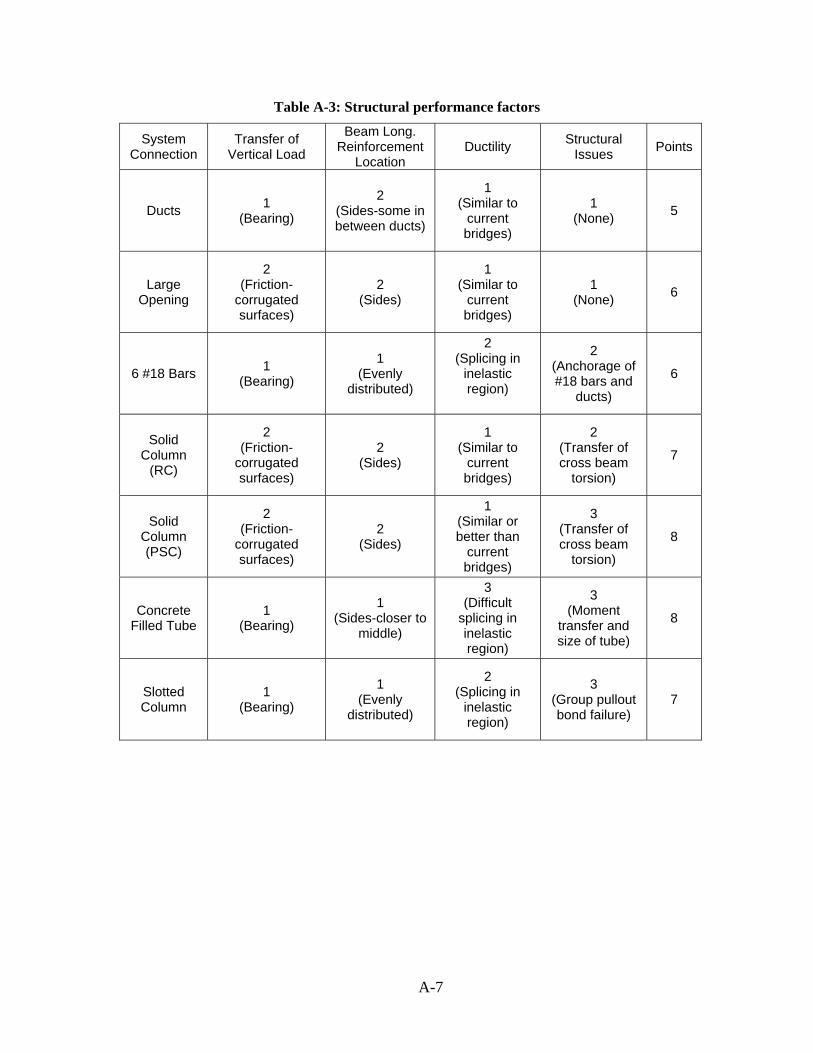
Table A-3: Structural performance factors
System Connection
Transfer of Vertical Load
Beam Long. Reinforcement
Location Ductility Structural
Issues Points
Ducts 1 (Bearing)
2 (Sides-some in between ducts)
1 (Similar to
current bridges)
1 (None) 5
Large Opening
2 (Friction-
corrugated surfaces)
2 (Sides)
1 (Similar to
current bridges)
1 (None) 6
6 #18 Bars 1 (Bearing)
1 (Evenly
distributed)
2 (Splicing in
inelastic region)
2 (Anchorage of #18 bars and
ducts)
6
Solid Column
(RC)
2 (Friction-
corrugated surfaces)
2 (Sides)
1 (Similar to
current bridges)
2 (Transfer of cross beam
torsion)
7
Solid Column (PSC)
2 (Friction-
corrugated surfaces)
2 (Sides)
1 (Similar or better than
current bridges)
3 (Transfer of cross beam
torsion)
8
Concrete Filled Tube
1 (Bearing)
1 (Sides-closer to
middle)
3 (Difficult
splicing in inelastic region)
3 (Moment
transfer and size of tube)
8
Slotted Column
1 (Bearing)
1 (Evenly
distributed)
2 (Splicing in
inelastic region)
3 (Group pullout bond failure)
7
A-7
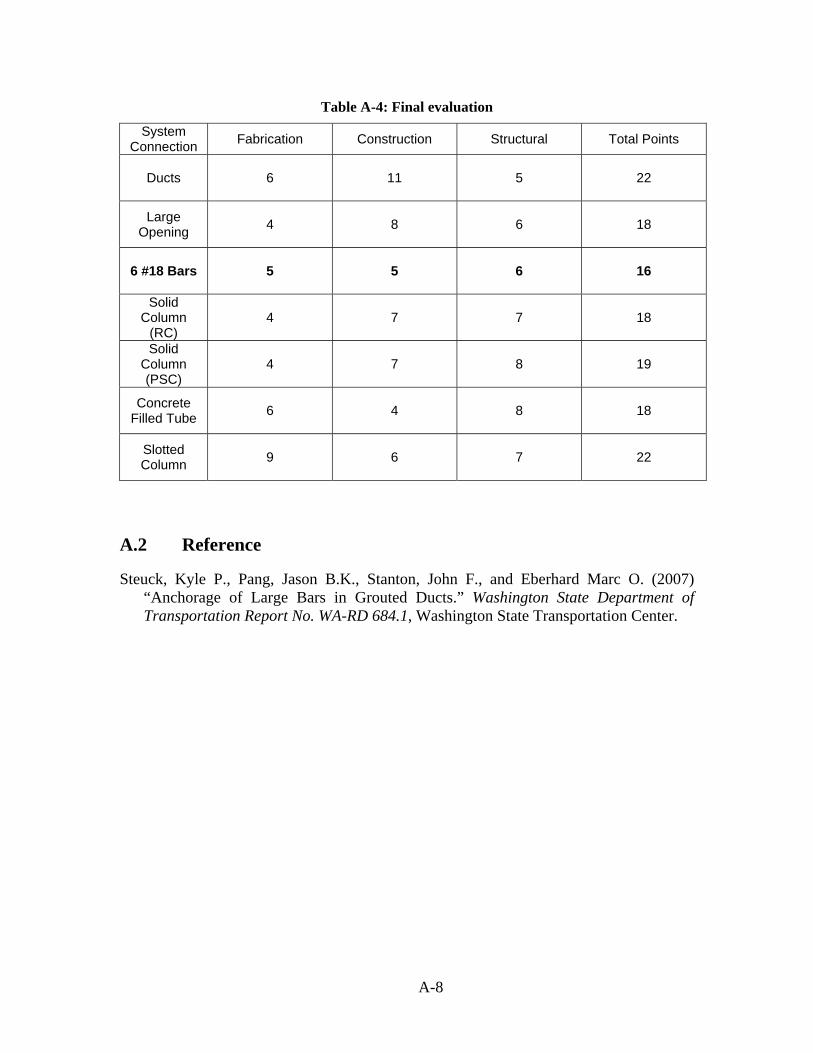
Table A-4: Final evaluation
System Connection Fabrication Construction Structural Total Points
Ducts 6 11 5 22
Large Opening 4 8 6 18
6 #18 Bars 5 5 6 16
Solid Column
(RC) 4 7 7 18
Solid Column (PSC)
4 7 8 19
Concrete Filled Tube 6 4 8 18
Slotted Column 9 6 7 22
A.2 Reference
Steuck, Kyle P., Pang, Jason B.K., Stanton, John F., and Eberhard Marc O. (2007) “Anchorage of Large Bars in Grouted Ducts.” Washington State Department of Transportation Report No. WA-RD 684.1, Washington State Transportation Center.
A-8
APPENDIX B EXPERIMENTAL METHODS
B.1 Materials
Steel reinforcement, concrete, high strength grout, corrugated metal duct, and
PVC debonding were used in the construction of the test specimens. The properties,
mixing or assembly processes, and material testing procedures are discussed in this
section.
B.1.1 Steel Reinforcement
The longitudinal column reinforcement and three #8 bars used in the pullout tests
were Grade 60 deformed bars conforming to ASTM A706. The longitudinal and shear
reinforcement in the cap-beam and diaphragm, as well as the transverse reinforcement in
the pullout specimens, were Grade 60 deformed bars conforming to ASTM A615. The #8
bars used in the columns and pullout tests all had horizontal “bamboo” style
deformations, which is very similar to the lug pattern of the #18 bars used by Steuck et al.
(2007). The deformation patterns for #5 bar longitudinal reinforcement in Specimen
DB5-RE were inclined lugs.
The wire was used for the spiral transverse reinforcement in the column and joint
region for all four column specimens was 3-Gage, 0.244-inch diameter Brite Basic. It had
a specified ultimate strength of 100 ksi and yield strength of 90 ksi. The measured yield
and ultimate tensile strength, and the modulus of elasticity for the reinforcement
determined from tension tests are listed in Table B-1. The stress-strain responses for
reinforcement are shown in Figure B-1 to Figure B-10.
The measured yield and ultimate strengths of the spiral wire were slightly below
the specified values. The wire was bent into spirals when it was delivered and had to be
straightened for tension testing. It is possible that this process affected the results. The
yield strengths of the #3 bars were also slightly lower than the specified strength.
However, this made little difference to the results because the wire remained elastic at all
times.
B-1
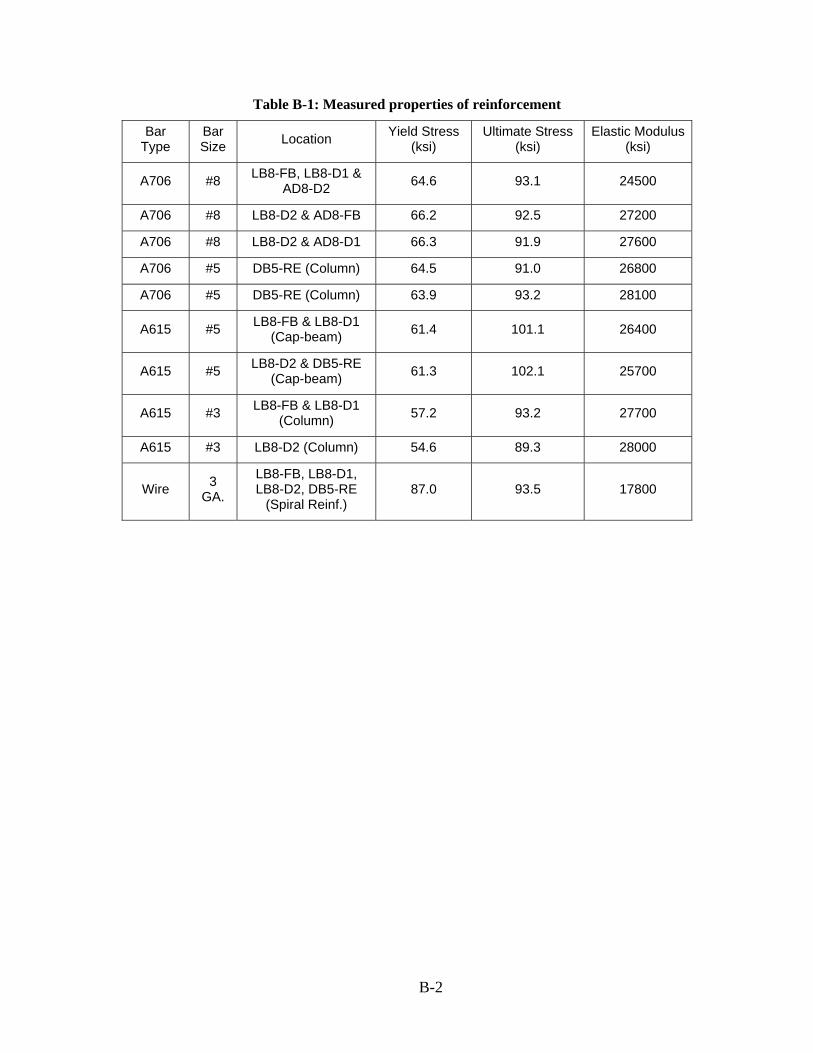
Table B-1: Measured properties of reinforcement
Bar Type
Bar Size Location Yield Stress
(ksi) Ultimate Stress
(ksi) Elastic Modulus
(ksi)
A706 #8 LB8-FB, LB8-D1 & AD8-D2 64.6 93.1 24500
A706 #8 LB8-D2 & AD8-FB 66.2 92.5 27200
A706 #8 LB8-D2 & AD8-D1 66.3 91.9 27600
A706 #5 DB5-RE (Column) 64.5 91.0 26800
A706 #5 DB5-RE (Column) 63.9 93.2 28100
A615 #5 LB8-FB & LB8-D1 (Cap-beam) 61.4 101.1 26400
A615 #5 LB8-D2 & DB5-RE (Cap-beam) 61.3 102.1 25700
A615 #3 LB8-FB & LB8-D1 (Column) 57.2 93.2 27700
A615 #3 LB8-D2 (Column) 54.6 89.3 28000
Wire 3 GA.
LB8-FB, LB8-D1, LB8-D2, DB5-RE
(Spiral Reinf.) 87.0 93.5 17800
B-2
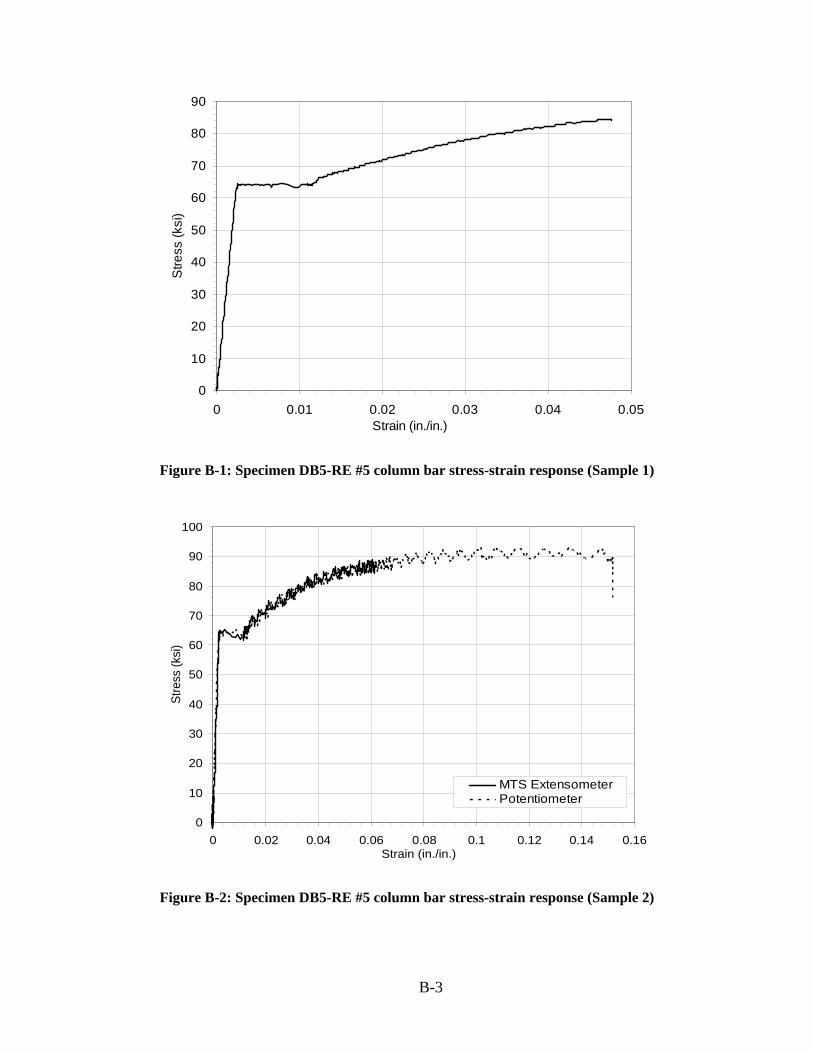
0
10
20
30
40
50
60
70
80
90
Stre
ss (k
si)
0 0.01 0.02 0.03 0.04 0.05 Strain (in./in.)
Figure B-1: Specimen DB5-RE #5 column bar stress-strain response (Sample 1)
100
90
80
70
MTS Extensometer Potentiometer
0 0.02 0.04 0.06 0.08 0.1 0.12 0.14 0.16 Strain (in./in.)
Figure B-2: Specimen DB5-RE #5 column bar stress-strain response (Sample 2)
B-3
Stre
ss (k
si) 60
50
40
30
20
10
0
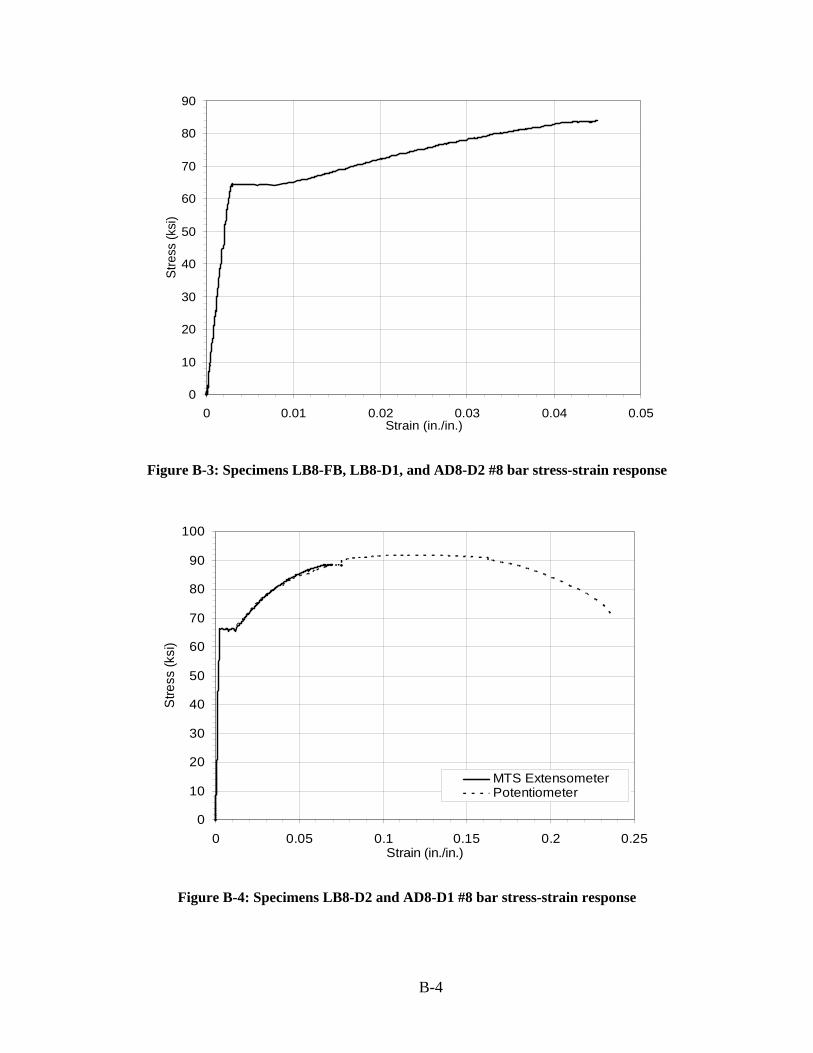
0
10
20
30
40
50
60
70
80
90
Stre
ss (k
si)
0 0.01 0.02 0.03 0.04 0.05 Strain (in./in.)
Figure B-3: Specimens LB8-FB, LB8-D1, and AD8-D2 #8 bar stress-strain response
100
90
80
70
Stre
ss (k
si) 60
50
40
30
20 MTS Extensometer
10 Potentiometer
0
0 0.05 0.1 0.15 0.2 0.25 Strain (in./in.)
Figure B-4: Specimens LB8-D2 and AD8-D1 #8 bar stress-strain response
B-4
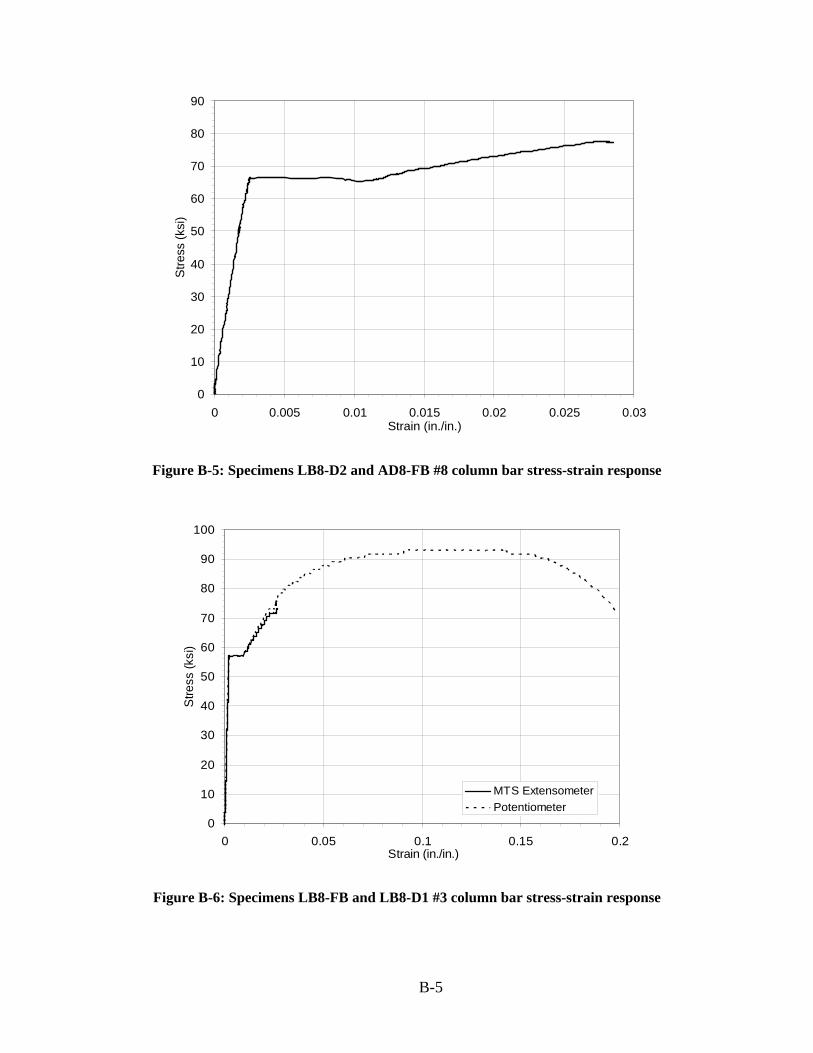
0
10
20
30
40
50
60
70
80
90
Stre
ss (k
si)
0 0.005 0.01 0.015 0.02 0.025 0.03 Strain (in./in.)
Figure B-5: Specimens LB8-D2 and AD8-FB #8 column bar stress-strain response
100
90
80
70
Stre
ss (k
si) 60
50
40
30
20
MTS Extensometer 10 Potentiometer
0
0 0.05 0.1 0.15 0.2 Strain (in./in.)
Figure B-6: Specimens LB8-FB and LB8-D1 #3 column bar stress-strain response
B-5
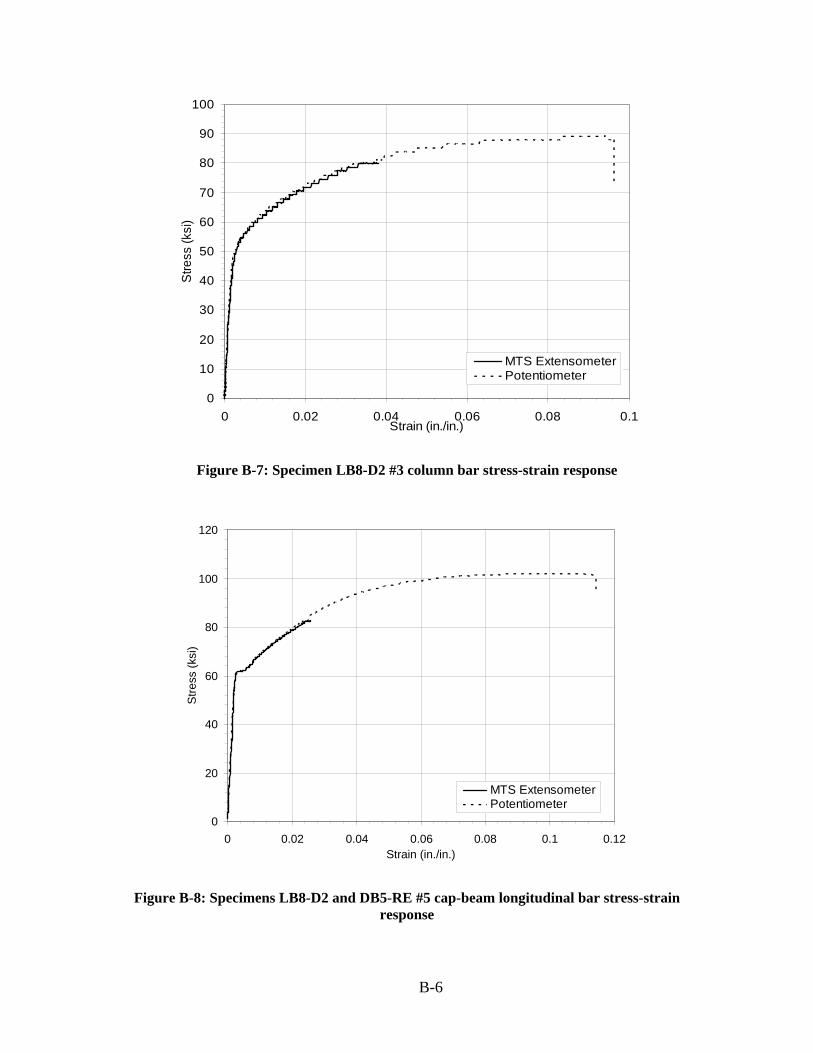
0
20
40
60
80
100
120
Stre
ss (k
si)
MTS Extensometer Potentiometer
100
90
80
70 St
ress
(ksi
) 60
50
40
30
20
MTS Extensometer 10 Potentiometer
0 0 0.02 0.04 0.06 0.08 0.1
Strain (in./in.)
Figure B-7: Specimen LB8-D2 #3 column bar stress-strain response
0 0.02 0.04 0.06 0.08 0.1 0.12 Strain (in./in.)
Figure B-8: Specimens LB8-D2 and DB5-RE #5 cap-beam longitudinal bar stress-strain response
B-6
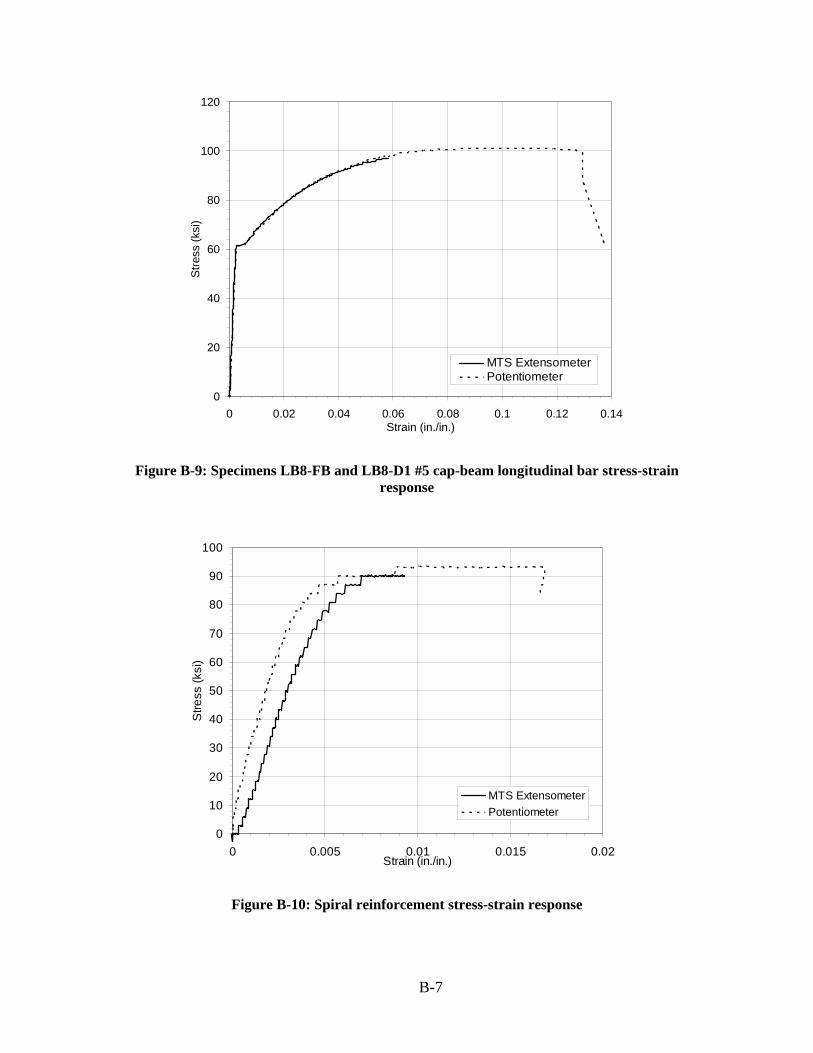
0
20
40
60
80
100
120
Stre
ss (k
si)
MTS Extensometer Potentiometer
0 0.02 0.04 0.06 0.08 0.1 0.12 0.14 Strain (in./in.)
Figure B-9: Specimens LB8-FB and LB8-D1 #5 cap-beam longitudinal bar stress-strain response
100
90
80
70
Stre
ss (k
si) 60
50
40
30
20
10
0
MTS Extensometer Potentiometer
0 0.005 0.01 0.015 0.02 Strain (in./in.)
Figure B-10: Spiral reinforcement stress-strain response
B-7
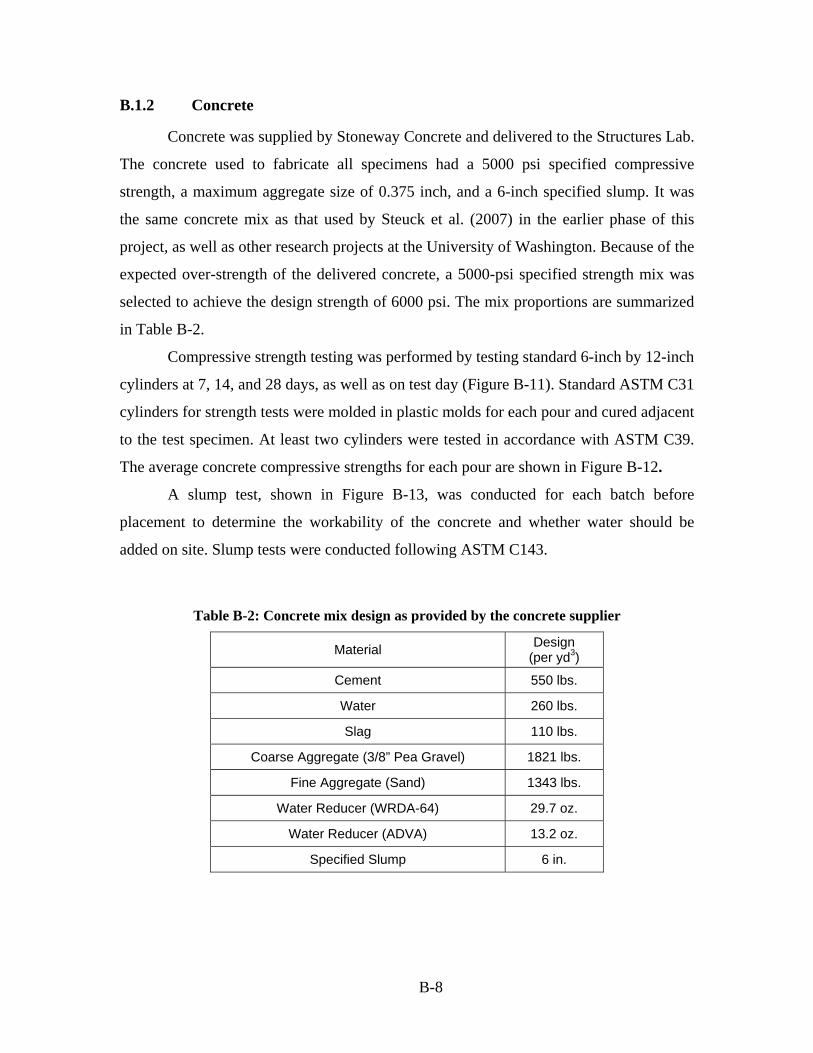
B.1.2 Concrete
Concrete was supplied by Stoneway Concrete and delivered to the Structures Lab.
The concrete used to fabricate all specimens had a 5000 psi specified compressive
strength, a maximum aggregate size of 0.375 inch, and a 6-inch specified slump. It was
the same concrete mix as that used by Steuck et al. (2007) in the earlier phase of this
project, as well as other research projects at the University of Washington. Because of the
expected over-strength of the delivered concrete, a 5000-psi specified strength mix was
selected to achieve the design strength of 6000 psi. The mix proportions are summarized
in Table B-2.
Compressive strength testing was performed by testing standard 6-inch by 12-inch
cylinders at 7, 14, and 28 days, as well as on test day (Figure B-11). Standard ASTM C31
cylinders for strength tests were molded in plastic molds for each pour and cured adjacent
to the test specimen. At least two cylinders were tested in accordance with ASTM C39.
The average concrete compressive strengths for each pour are shown in Figure B-12.
A slump test, shown in Figure B-13, was conducted for each batch before
placement to determine the workability of the concrete and whether water should be
added on site. Slump tests were conducted following ASTM C143.
Table B-2: Concrete mix design as provided by the concrete supplier
Material Design (per yd3)
Cement 550 lbs.
Water 260 lbs.
Slag 110 lbs.
Coarse Aggregate (3/8” Pea Gravel) 1821 lbs.
Fine Aggregate (Sand) 1343 lbs.
Water Reducer (WRDA-64) 29.7 oz.
Water Reducer (ADVA) 13.2 oz.
Specified Slump 6 in.
B-8
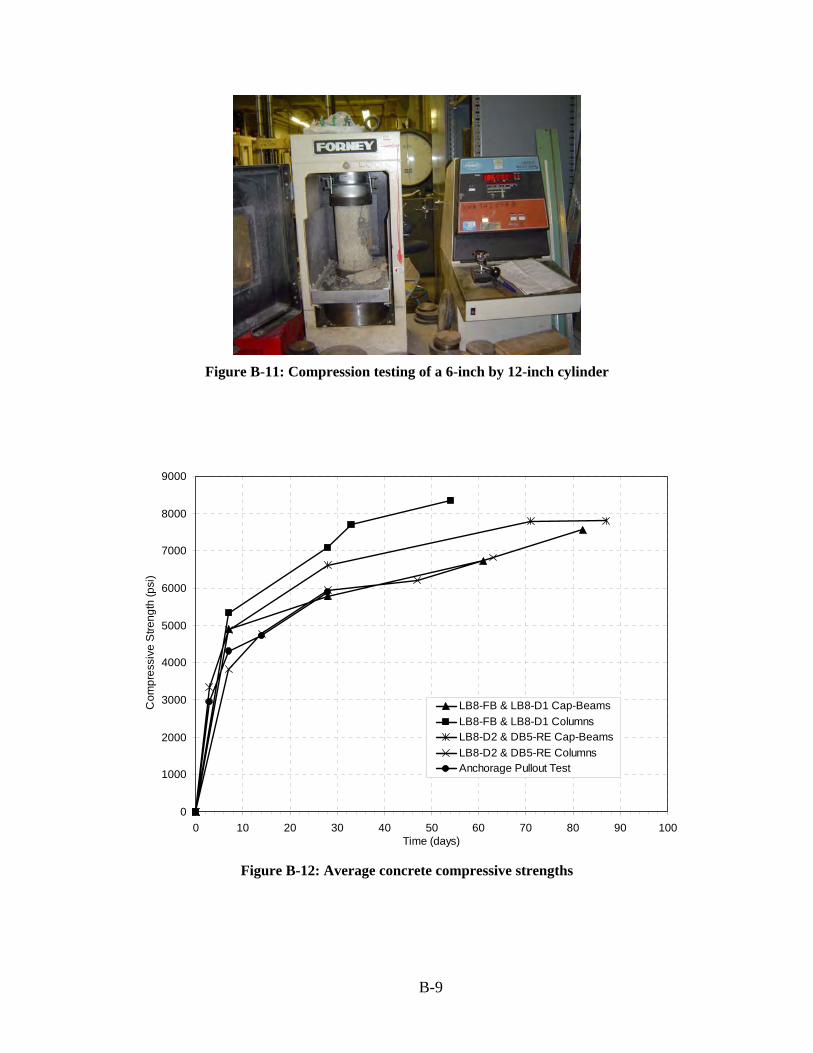
Com
pres
sive
Stre
ngth
(psi
)
Figure B-11: Compression testing of a 6-inch by 12-inch cylinder
9000
8000
7000
6000
5000
4000
3000 LB8-FB & LB8-D1 Cap-Beams
LB8-FB & LB8-D1 Columns
2000 LB8-D2 & DB5-RE Cap-Beams LB8-D2 & DB5-RE Columns Anchorage Pullout Test 1000
0
0 10 20 30 40 50 60 70 80 90 100 Time (days)
Figure B-12: Average concrete compressive strengths
B-9
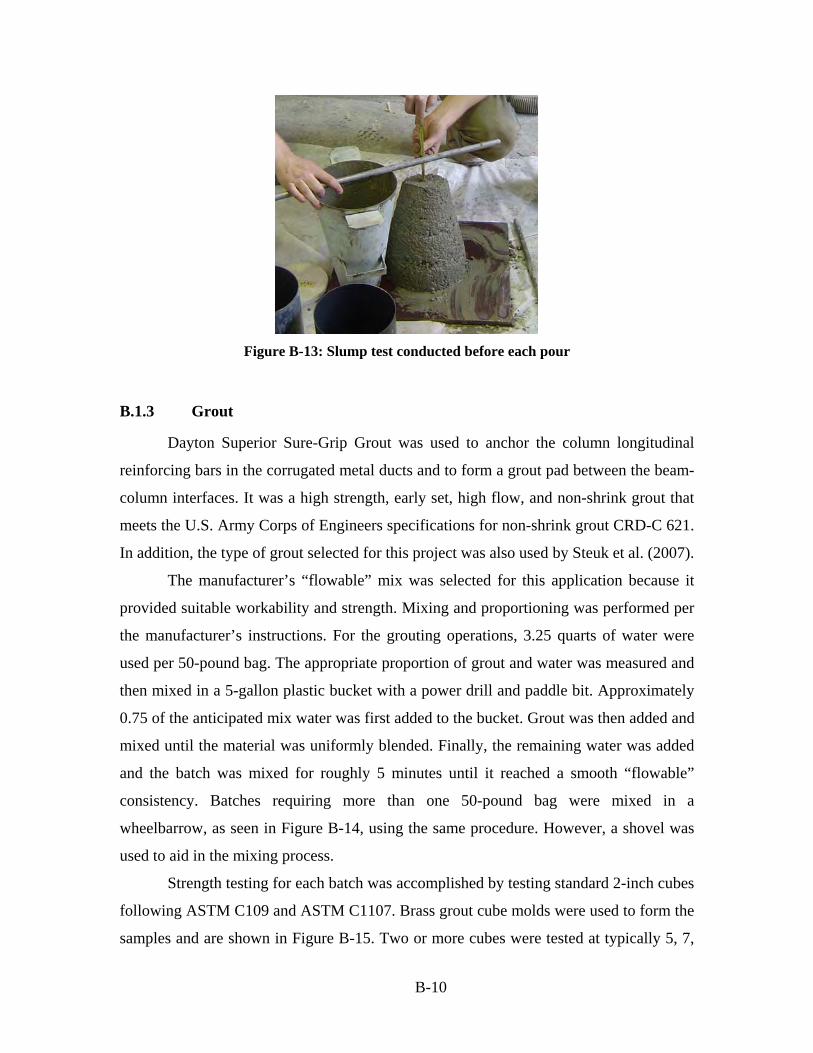
Figure B-13: Slump test conducted before each pour
B.1.3 Grout
Dayton Superior Sure-Grip Grout was used to anchor the column longitudinal
reinforcing bars in the corrugated metal ducts and to form a grout pad between the beam-
column interfaces. It was a high strength, early set, high flow, and non-shrink grout that
meets the U.S. Army Corps of Engineers specifications for non-shrink grout CRD-C 621.
In addition, the type of grout selected for this project was also used by Steuk et al. (2007).
The manufacturer’s “flowable” mix was selected for this application because it
provided suitable workability and strength. Mixing and proportioning was performed per
the manufacturer’s instructions. For the grouting operations, 3.25 quarts of water were
used per 50-pound bag. The appropriate proportion of grout and water was measured and
then mixed in a 5-gallon plastic bucket with a power drill and paddle bit. Approximately
0.75 of the anticipated mix water was first added to the bucket. Grout was then added and
mixed until the material was uniformly blended. Finally, the remaining water was added
and the batch was mixed for roughly 5 minutes until it reached a smooth “flowable”
consistency. Batches requiring more than one 50-pound bag were mixed in a
wheelbarrow, as seen in Figure B-14, using the same procedure. However, a shovel was
used to aid in the mixing process.
Strength testing for each batch was accomplished by testing standard 2-inch cubes
following ASTM C109 and ASTM C1107. Brass grout cube molds were used to form the
samples and are shown in Figure B-15. Two or more cubes were tested at typically 5, 7,
B-10
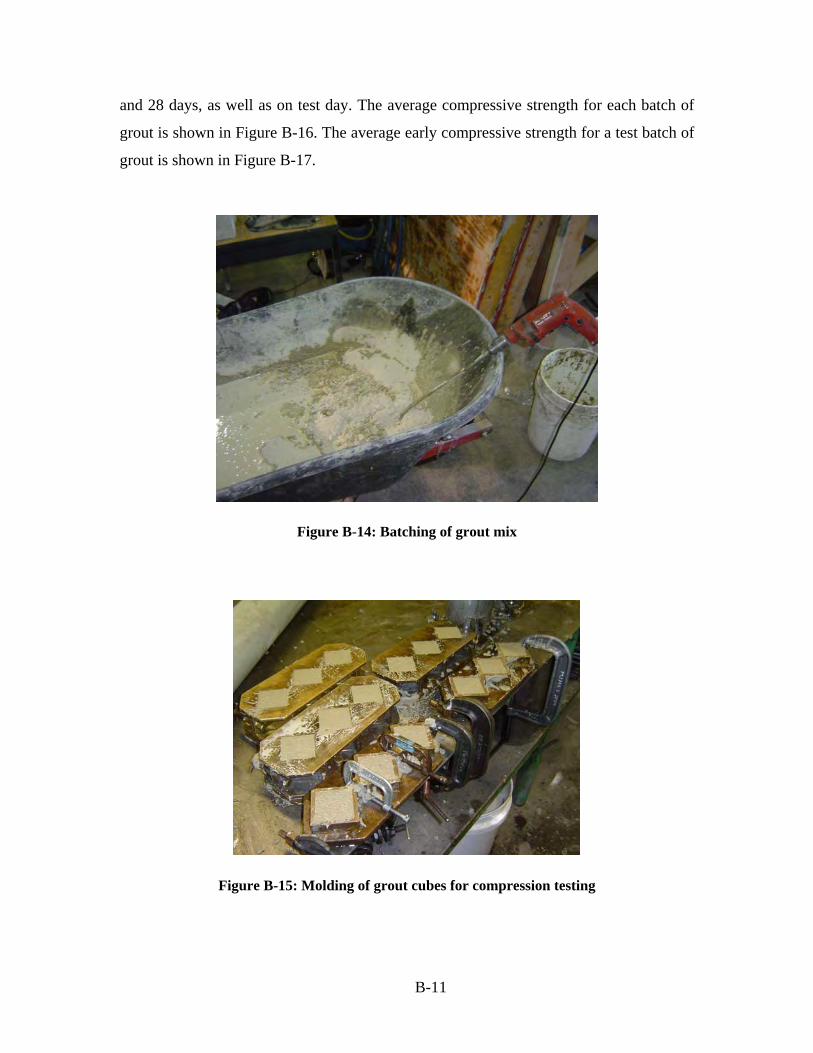
and 28 days, as well as on test day. The average compressive strength for each batch of
grout is shown in Figure B-16. The average early compressive strength for a test batch of
grout is shown in Figure B-17.
Figure B-14: Batching of grout mix
Figure B-15: Molding of grout cubes for compression testing
B-11
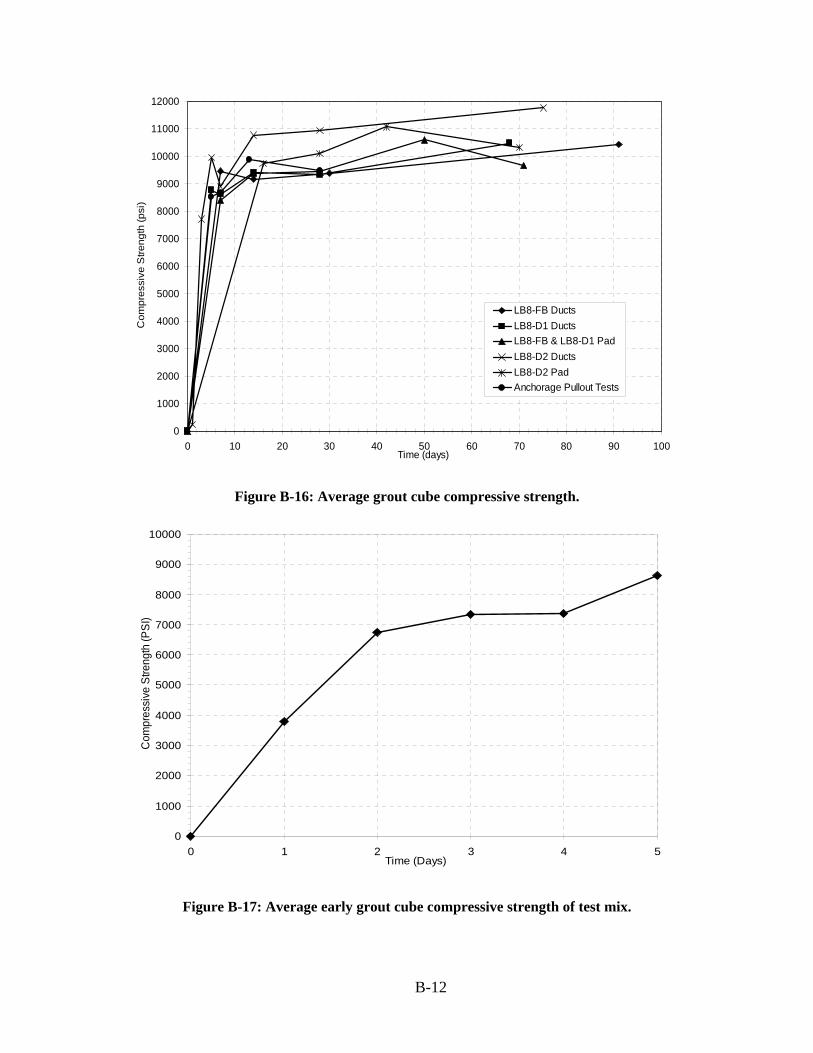
0
1000
2000
3000
4000
5000
6000
7000
8000
9000
10000
11000
12000
Com
pres
sive
Stre
ngth
(psi
)
LB8-FB Ducts LB8-D1 Ducts LB8-FB & LB8-D1 Pad LB8-D2 Ducts LB8-D2 Pad Anchorage Pullout Tests
0 10 20 30 40 50 60 70 80 90 100 Time (days)
Figure B-16: Average grout cube compressive strength.
0
1000
2000
3000
4000
5000
6000
7000
8000
9000
10000
Com
pres
sive
Stre
ngth
(PSI
)
0 1 2 3 4 5 Time (Days)
Figure B-17: Average early grout cube compressive strength of test mix.
B-12
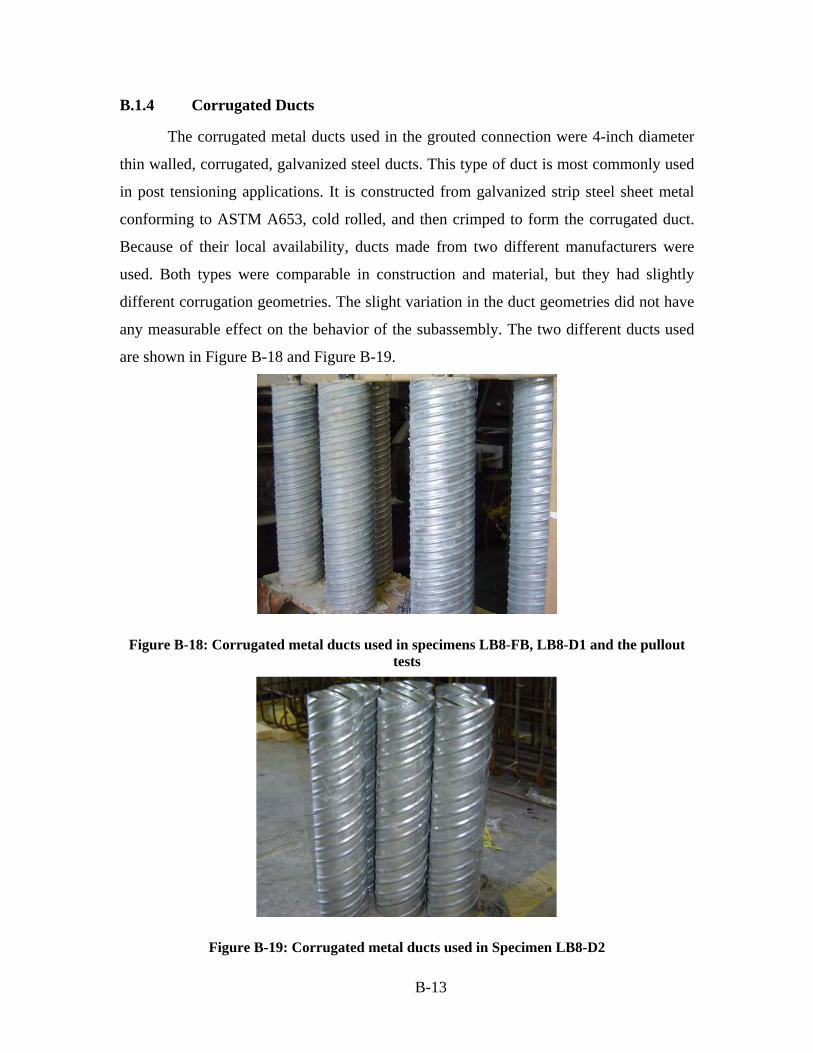
B.1.4 Corrugated Ducts
The corrugated metal ducts used in the grouted connection were 4-inch diameter
thin walled, corrugated, galvanized steel ducts. This type of duct is most commonly used
in post tensioning applications. It is constructed from galvanized strip steel sheet metal
conforming to ASTM A653, cold rolled, and then crimped to form the corrugated duct.
Because of their local availability, ducts made from two different manufacturers were
used. Both types were comparable in construction and material, but they had slightly
different corrugation geometries. The slight variation in the duct geometries did not have
any measurable effect on the behavior of the subassembly. The two different ducts used
are shown in Figure B-18 and Figure B-19.
Figure B-18: Corrugated metal ducts used in specimens LB8-FB, LB8-D1 and the pullout tests
Figure B-19: Corrugated metal ducts used in Specimen LB8-D2
B-13
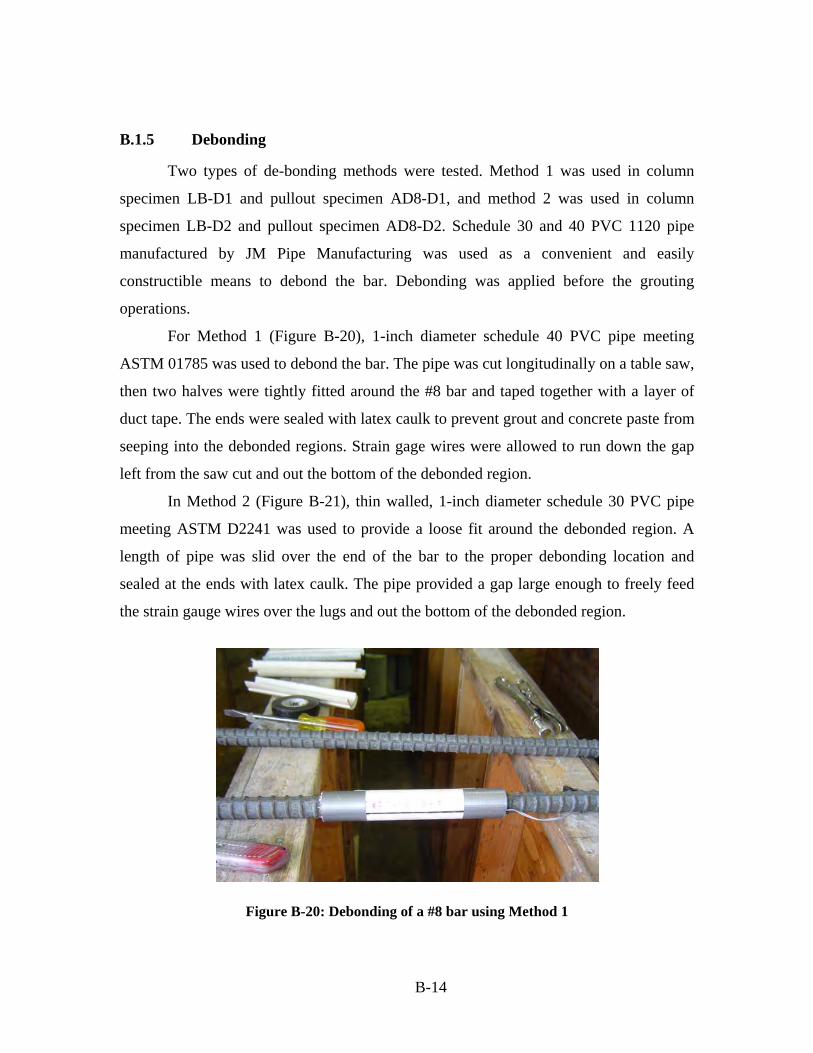
B.1.5 Debonding
Two types of de-bonding methods were tested. Method 1 was used in column
specimen LB-D1 and pullout specimen AD8-D1, and method 2 was used in column
specimen LB-D2 and pullout specimen AD8-D2. Schedule 30 and 40 PVC 1120 pipe
manufactured by JM Pipe Manufacturing was used as a convenient and easily
constructible means to debond the bar. Debonding was applied before the grouting
operations.
For Method 1 (Figure B-20), 1-inch diameter schedule 40 PVC pipe meeting
ASTM 01785 was used to debond the bar. The pipe was cut longitudinally on a table saw,
then two halves were tightly fitted around the #8 bar and taped together with a layer of
duct tape. The ends were sealed with latex caulk to prevent grout and concrete paste from
seeping into the debonded regions. Strain gage wires were allowed to run down the gap
left from the saw cut and out the bottom of the debonded region.
In Method 2 (Figure B-21), thin walled, 1-inch diameter schedule 30 PVC pipe
meeting ASTM D2241 was used to provide a loose fit around the debonded region. A
length of pipe was slid over the end of the bar to the proper debonding location and
sealed at the ends with latex caulk. The pipe provided a gap large enough to freely feed
the strain gauge wires over the lugs and out the bottom of the debonded region.
Figure B-20: Debonding of a #8 bar using Method 1
B-14
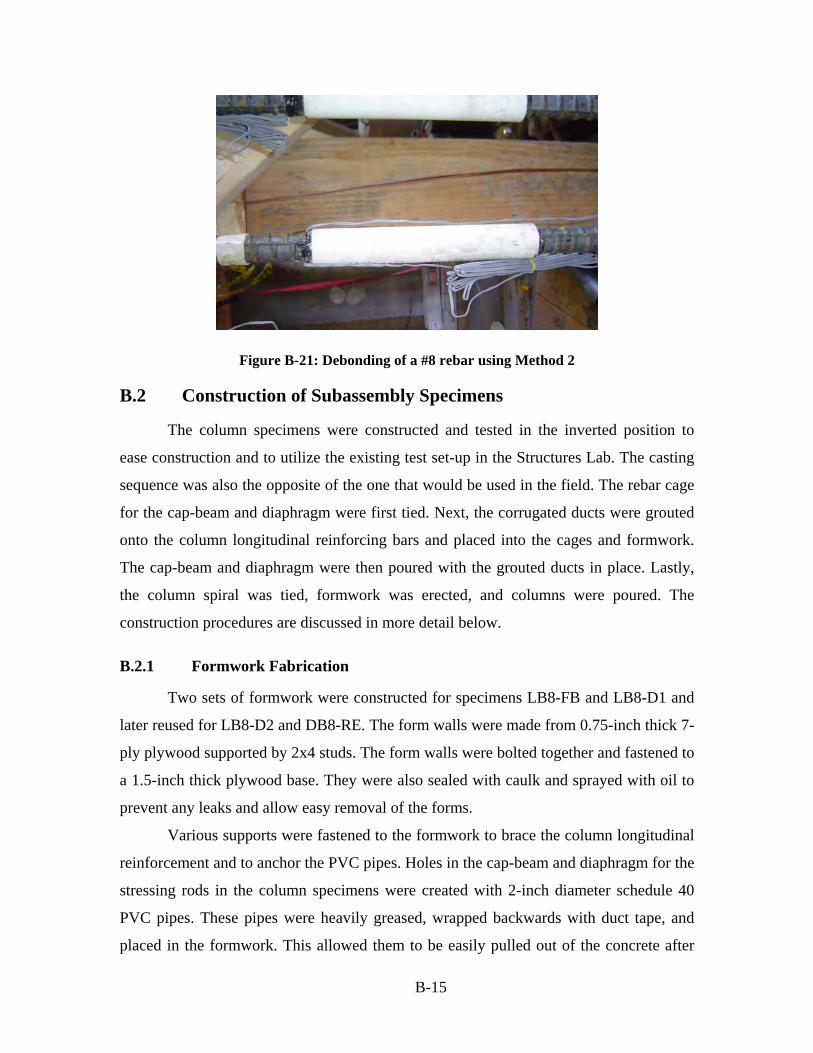
Figure B-21: Debonding of a #8 rebar using Method 2
B.2 Construction of Subassembly Specimens
The column specimens were constructed and tested in the inverted position to
ease construction and to utilize the existing test set-up in the Structures Lab. The casting
sequence was also the opposite of the one that would be used in the field. The rebar cage
for the cap-beam and diaphragm were first tied. Next, the corrugated ducts were grouted
onto the column longitudinal reinforcing bars and placed into the cages and formwork.
The cap-beam and diaphragm were then poured with the grouted ducts in place. Lastly,
the column spiral was tied, formwork was erected, and columns were poured. The
construction procedures are discussed in more detail below.
B.2.1 Formwork Fabrication
Two sets of formwork were constructed for specimens LB8-FB and LB8-D1 and
later reused for LB8-D2 and DB8-RE. The form walls were made from 0.75-inch thick 7-
ply plywood supported by 2x4 studs. The form walls were bolted together and fastened to
a 1.5-inch thick plywood base. They were also sealed with caulk and sprayed with oil to
prevent any leaks and allow easy removal of the forms.
Various supports were fastened to the formwork to brace the column longitudinal
reinforcement and to anchor the PVC pipes. Holes in the cap-beam and diaphragm for the
stressing rods in the column specimens were created with 2-inch diameter schedule 40
PVC pipes. These pipes were heavily greased, wrapped backwards with duct tape, and
placed in the formwork. This allowed them to be easily pulled out of the concrete after
B-15
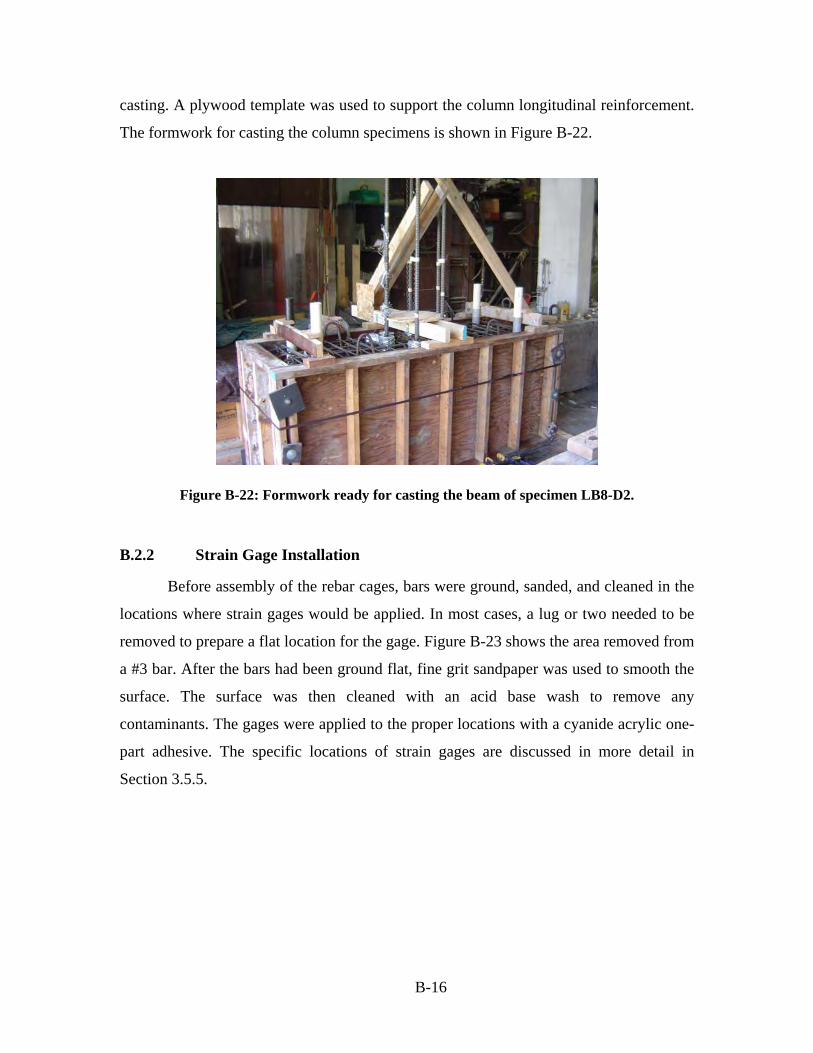
casting. A plywood template was used to support the column longitudinal reinforcement.
The formwork for casting the column specimens is shown in Figure B-22.
Figure B-22: Formwork ready for casting the beam of specimen LB8-D2.
B.2.2 Strain Gage Installation
Before assembly of the rebar cages, bars were ground, sanded, and cleaned in the
locations where strain gages would be applied. In most cases, a lug or two needed to be
removed to prepare a flat location for the gage. Figure B-23 shows the area removed from
a #3 bar. After the bars had been ground flat, fine grit sandpaper was used to smooth the
surface. The surface was then cleaned with an acid base wash to remove any
contaminants. The gages were applied to the proper locations with a cyanide acrylic one-
part adhesive. The specific locations of strain gages are discussed in more detail in
Section 3.5.5.
B-16
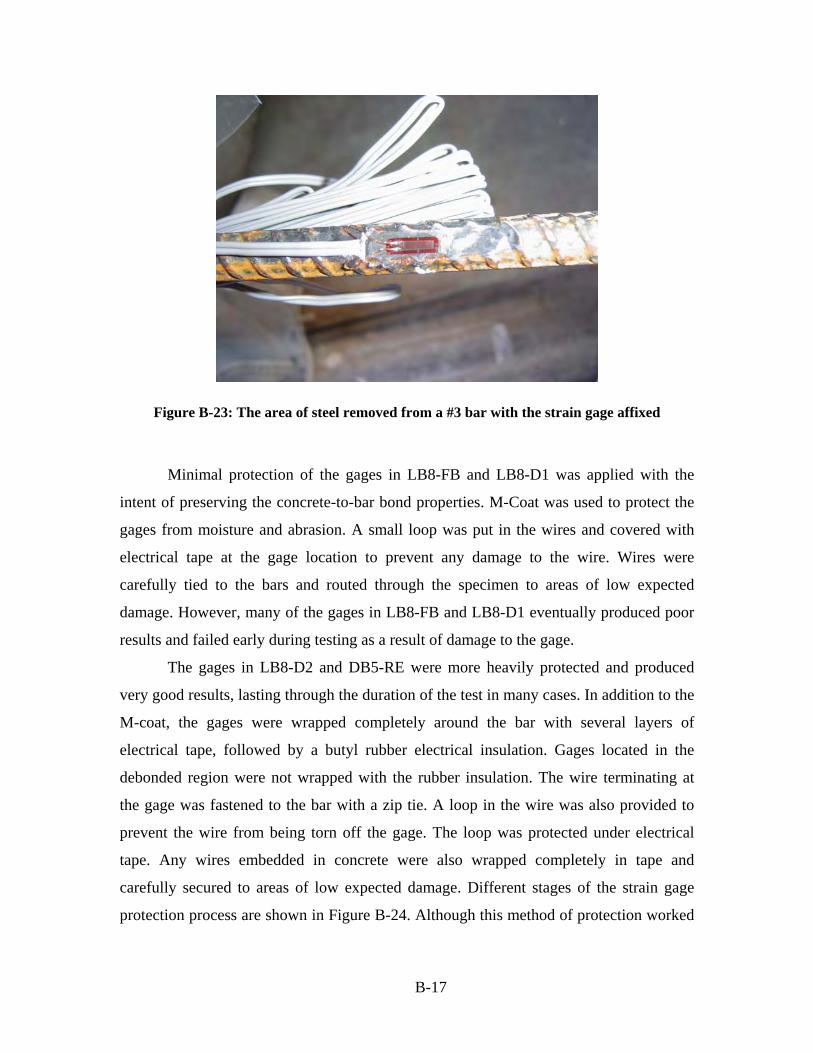
Figure B-23: The area of steel removed from a #3 bar with the strain gage affixed
Minimal protection of the gages in LB8-FB and LB8-D1 was applied with the
intent of preserving the concrete-to-bar bond properties. M-Coat was used to protect the
gages from moisture and abrasion. A small loop was put in the wires and covered with
electrical tape at the gage location to prevent any damage to the wire. Wires were
carefully tied to the bars and routed through the specimen to areas of low expected
damage. However, many of the gages in LB8-FB and LB8-D1 eventually produced poor
results and failed early during testing as a result of damage to the gage.
The gages in LB8-D2 and DB5-RE were more heavily protected and produced
very good results, lasting through the duration of the test in many cases. In addition to the
M-coat, the gages were wrapped completely around the bar with several layers of
electrical tape, followed by a butyl rubber electrical insulation. Gages located in the
debonded region were not wrapped with the rubber insulation. The wire terminating at
the gage was fastened to the bar with a zip tie. A loop in the wire was also provided to
prevent the wire from being torn off the gage. The loop was protected under electrical
tape. Any wires embedded in concrete were also wrapped completely in tape and
carefully secured to areas of low expected damage. Different stages of the strain gage
protection process are shown in Figure B-24. Although this method of protection worked
B-17
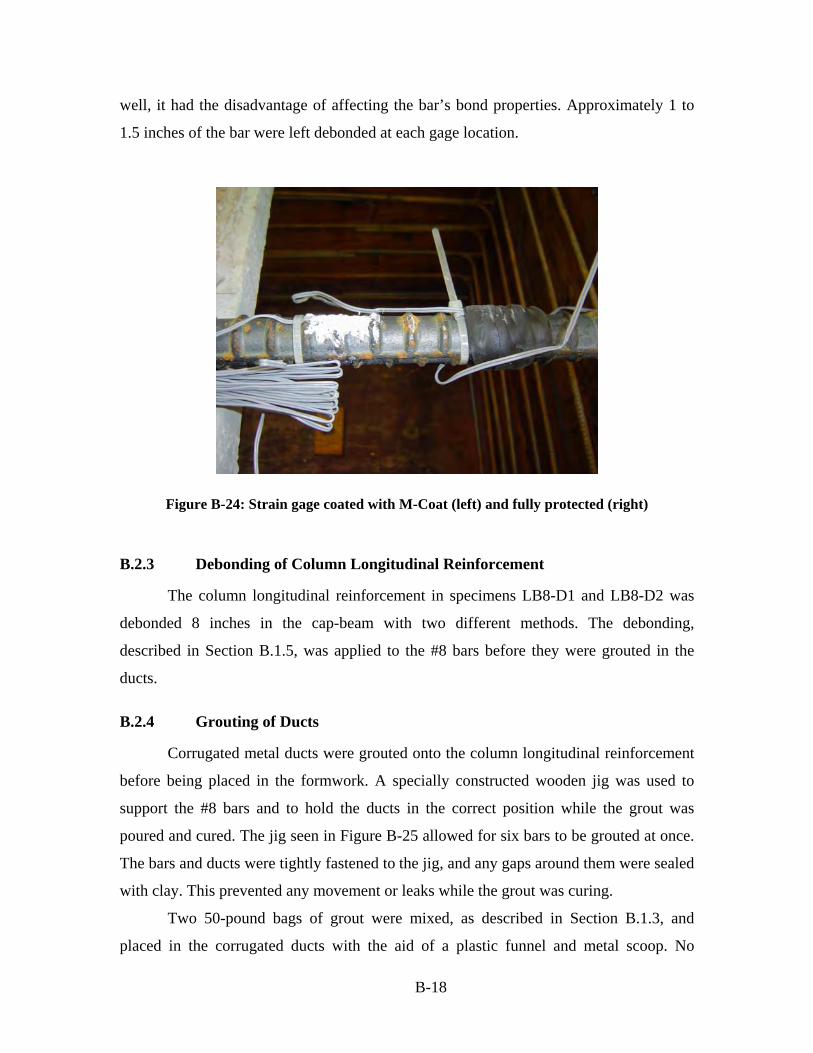
well, it had the disadvantage of affecting the bar’s bond properties. Approximately 1 to
1.5 inches of the bar were left debonded at each gage location.
Figure B-24: Strain gage coated with M-Coat (left) and fully protected (right)
B.2.3 Debonding of Column Longitudinal Reinforcement
The column longitudinal reinforcement in specimens LB8-D1 and LB8-D2 was
debonded 8 inches in the cap-beam with two different methods. The debonding,
described in Section B.1.5, was applied to the #8 bars before they were grouted in the
ducts.
B.2.4 Grouting of Ducts
Corrugated metal ducts were grouted onto the column longitudinal reinforcement
before being placed in the formwork. A specially constructed wooden jig was used to
support the #8 bars and to hold the ducts in the correct position while the grout was
poured and cured. The jig seen in Figure B-25 allowed for six bars to be grouted at once.
The bars and ducts were tightly fastened to the jig, and any gaps around them were sealed
with clay. This prevented any movement or leaks while the grout was curing.
Two 50-pound bags of grout were mixed, as described in Section B.1.3, and
placed in the corrugated ducts with the aid of a plastic funnel and metal scoop. No
B-18
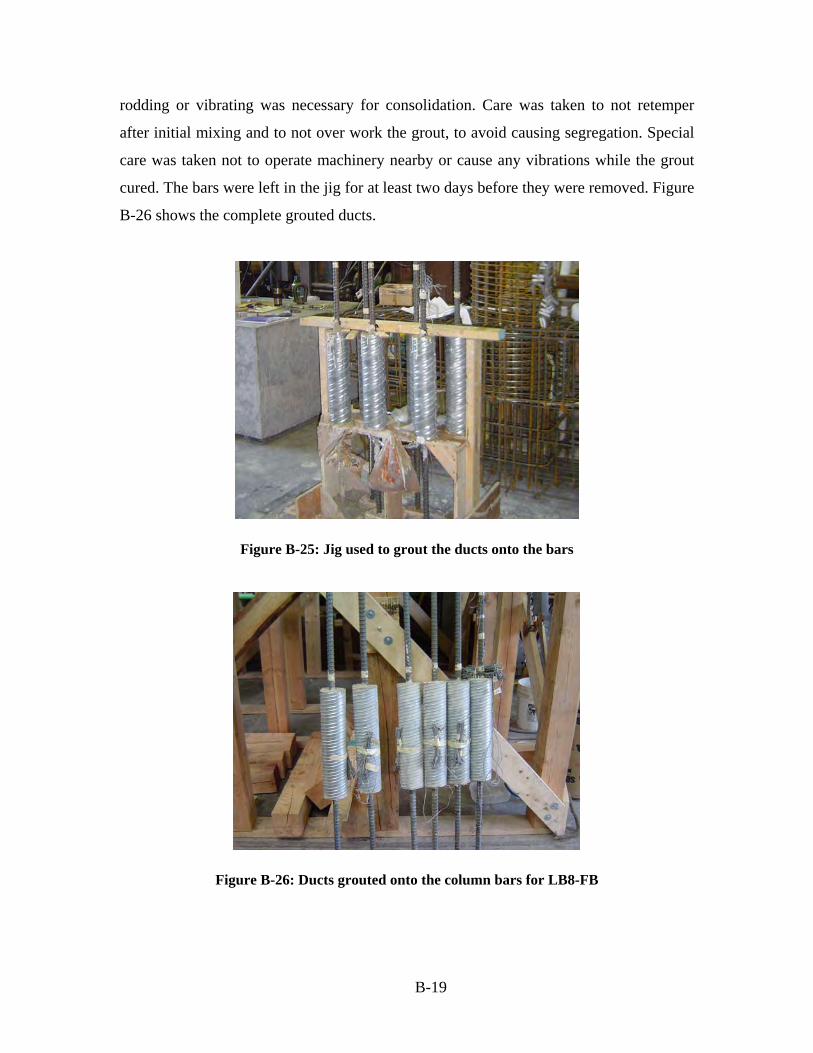
rodding or vibrating was necessary for consolidation. Care was taken to not retemper
after initial mixing and to not over work the grout, to avoid causing segregation. Special
care was taken not to operate machinery nearby or cause any vibrations while the grout
cured. The bars were left in the jig for at least two days before they were removed. Figure
B-26 shows the complete grouted ducts.
Figure B-25: Jig used to grout the ducts onto the bars
Figure B-26: Ducts grouted onto the column bars for LB8-FB
B-19
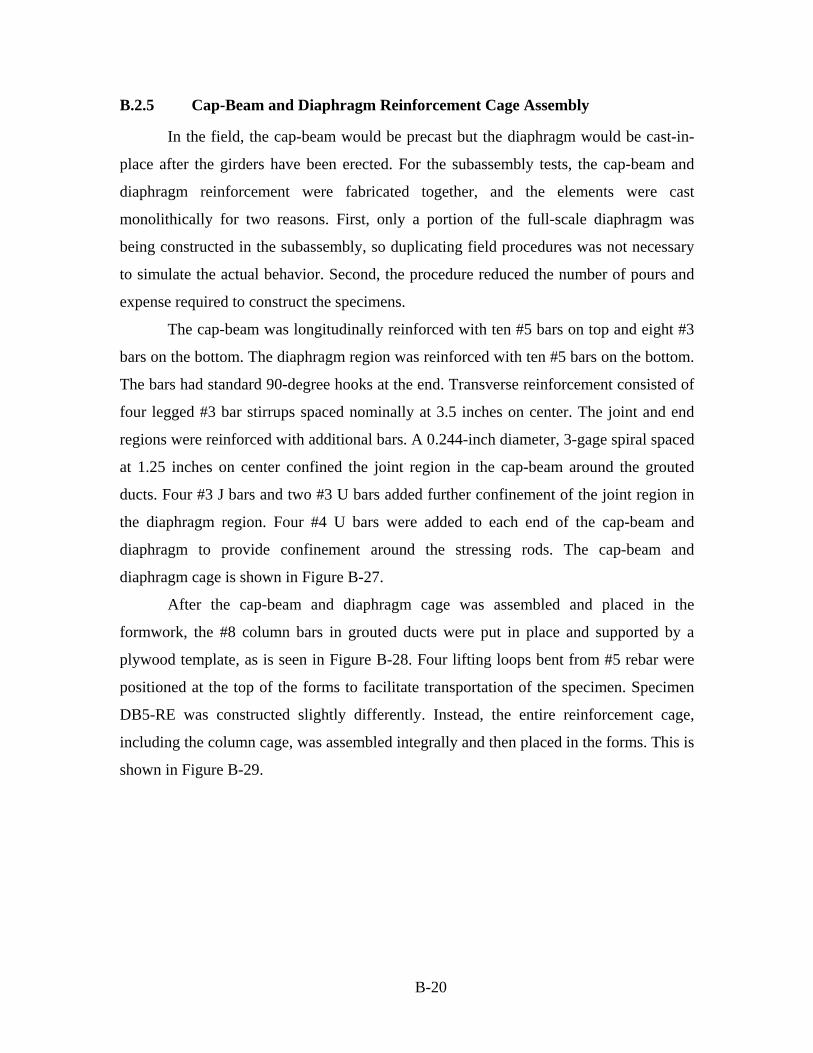
B.2.5 Cap-Beam and Diaphragm Reinforcement Cage Assembly
In the field, the cap-beam would be precast but the diaphragm would be cast-in-
place after the girders have been erected. For the subassembly tests, the cap-beam and
diaphragm reinforcement were fabricated together, and the elements were cast
monolithically for two reasons. First, only a portion of the full-scale diaphragm was
being constructed in the subassembly, so duplicating field procedures was not necessary
to simulate the actual behavior. Second, the procedure reduced the number of pours and
expense required to construct the specimens.
The cap-beam was longitudinally reinforced with ten #5 bars on top and eight #3
bars on the bottom. The diaphragm region was reinforced with ten #5 bars on the bottom.
The bars had standard 90-degree hooks at the end. Transverse reinforcement consisted of
four legged #3 bar stirrups spaced nominally at 3.5 inches on center. The joint and end
regions were reinforced with additional bars. A 0.244-inch diameter, 3-gage spiral spaced
at 1.25 inches on center confined the joint region in the cap-beam around the grouted
ducts. Four #3 J bars and two #3 U bars added further confinement of the joint region in
the diaphragm region. Four #4 U bars were added to each end of the cap-beam and
diaphragm to provide confinement around the stressing rods. The cap-beam and
diaphragm cage is shown in Figure B-27.
After the cap-beam and diaphragm cage was assembled and placed in the
formwork, the #8 column bars in grouted ducts were put in place and supported by a
plywood template, as is seen in Figure B-28. Four lifting loops bent from #5 rebar were
positioned at the top of the forms to facilitate transportation of the specimen. Specimen
DB5-RE was constructed slightly differently. Instead, the entire reinforcement cage,
including the column cage, was assembled integrally and then placed in the forms. This is
shown in Figure B-29.
B-20
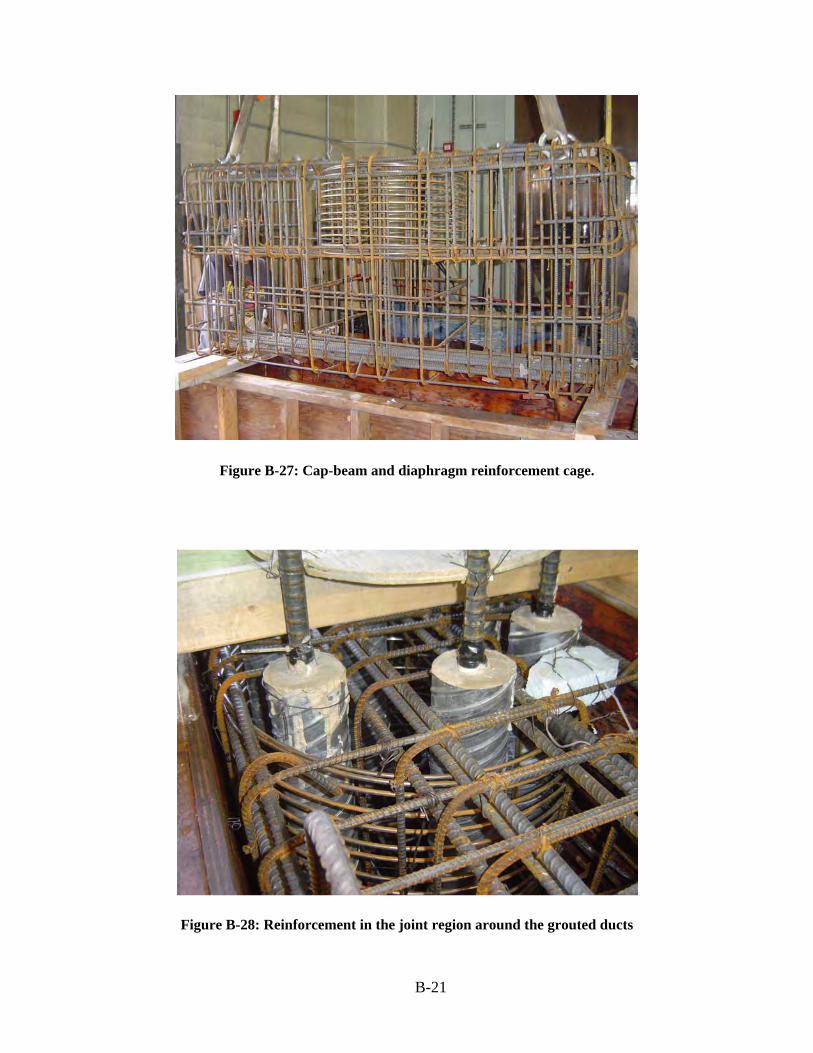
Figure B-27: Cap-beam and diaphragm reinforcement cage.
Figure B-28: Reinforcement in the joint region around the grouted ducts
B-21
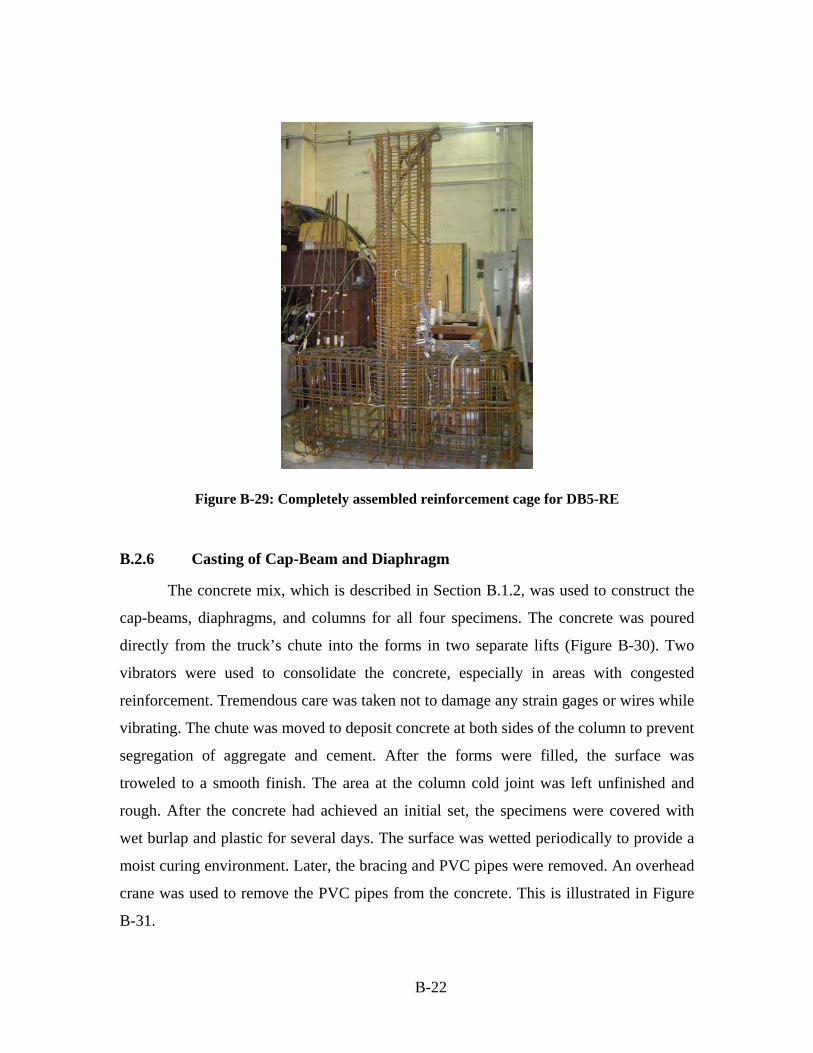
Figure B-29: Completely assembled reinforcement cage for DB5-RE
B.2.6 Casting of Cap-Beam and Diaphragm
The concrete mix, which is described in Section B.1.2, was used to construct the
cap-beams, diaphragms, and columns for all four specimens. The concrete was poured
directly from the truck’s chute into the forms in two separate lifts (Figure B-30). Two
vibrators were used to consolidate the concrete, especially in areas with congested
reinforcement. Tremendous care was taken not to damage any strain gages or wires while
vibrating. The chute was moved to deposit concrete at both sides of the column to prevent
segregation of aggregate and cement. After the forms were filled, the surface was
troweled to a smooth finish. The area at the column cold joint was left unfinished and
rough. After the concrete had achieved an initial set, the specimens were covered with
wet burlap and plastic for several days. The surface was wetted periodically to provide a
moist curing environment. Later, the bracing and PVC pipes were removed. An overhead
crane was used to remove the PVC pipes from the concrete. This is illustrated in Figure
B-31.
B-22
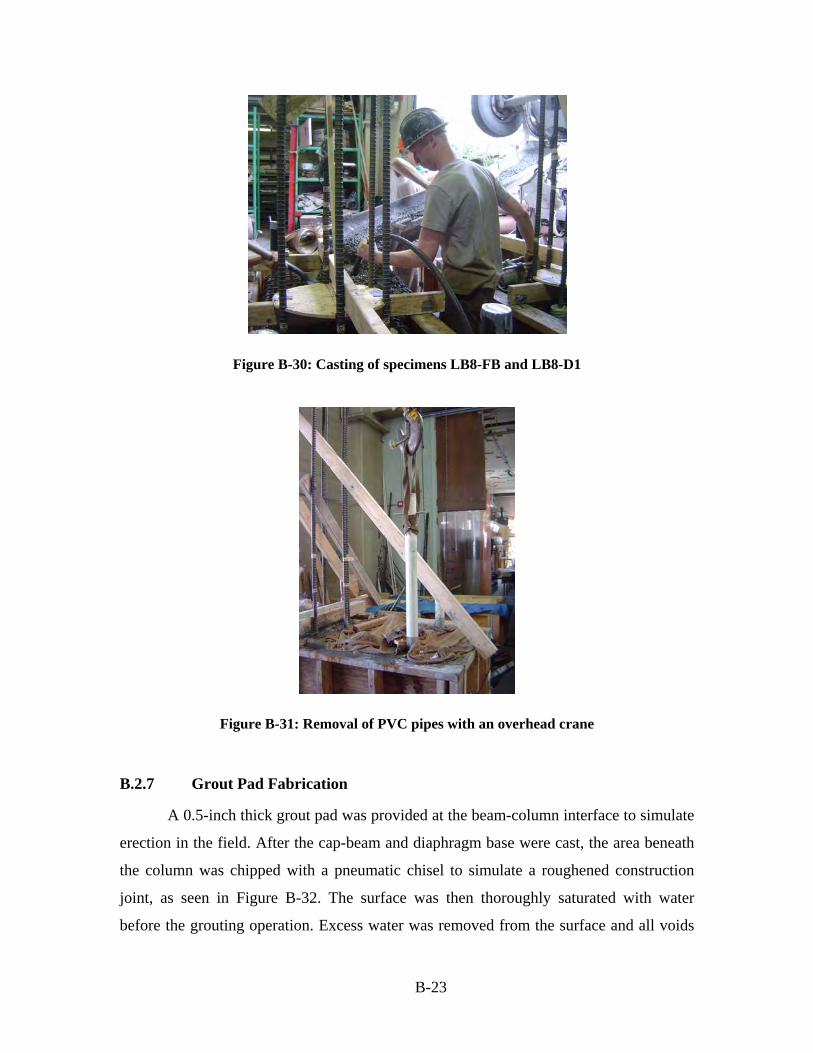
Figure B-30: Casting of specimens LB8-FB and LB8-D1
Figure B-31: Removal of PVC pipes with an overhead crane
B.2.7 Grout Pad Fabrication
A 0.5-inch thick grout pad was provided at the beam-column interface to simulate
erection in the field. After the cap-beam and diaphragm base were cast, the area beneath
the column was chipped with a pneumatic chisel to simulate a roughened construction
joint, as seen in Figure B-32. The surface was then thoroughly saturated with water
before the grouting operation. Excess water was removed from the surface and all voids
B-23
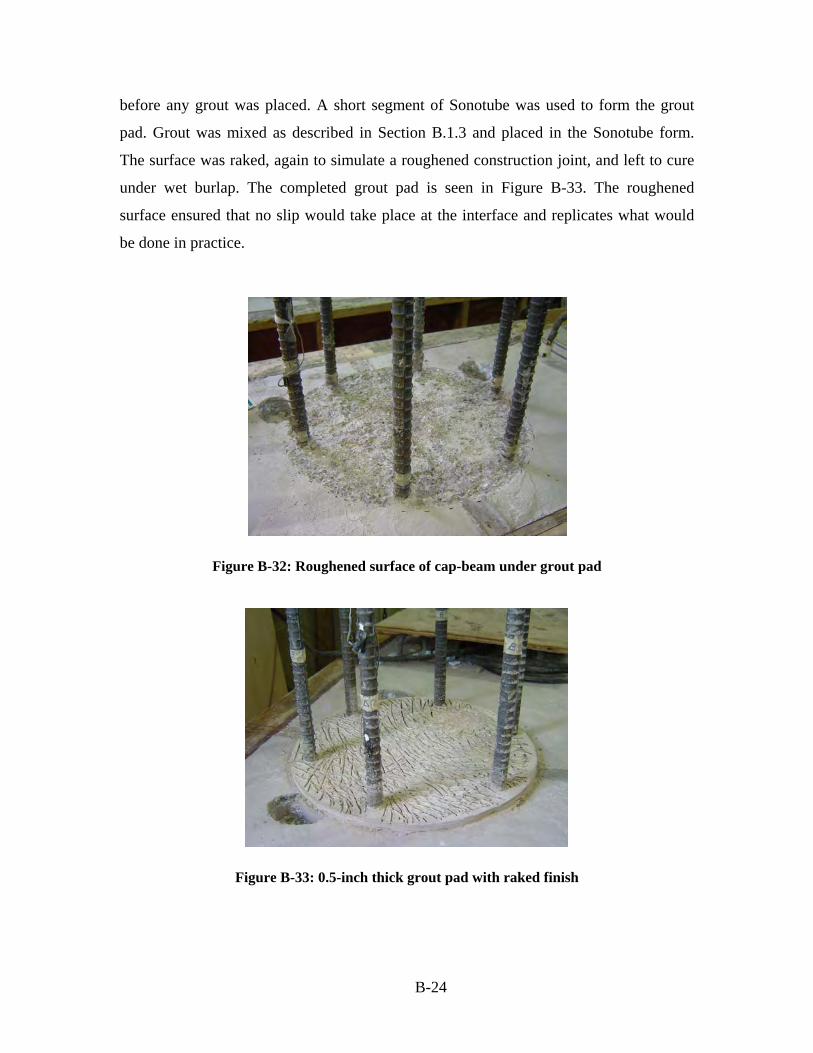
before any grout was placed. A short segment of Sonotube was used to form the grout
pad. Grout was mixed as described in Section B.1.3 and placed in the Sonotube form.
The surface was raked, again to simulate a roughened construction joint, and left to cure
under wet burlap. The completed grout pad is seen in Figure B-33. The roughened
surface ensured that no slip would take place at the interface and replicates what would
be done in practice.
Figure B-32: Roughened surface of cap-beam under grout pad
Figure B-33: 0.5-inch thick grout pad with raked finish
B-24
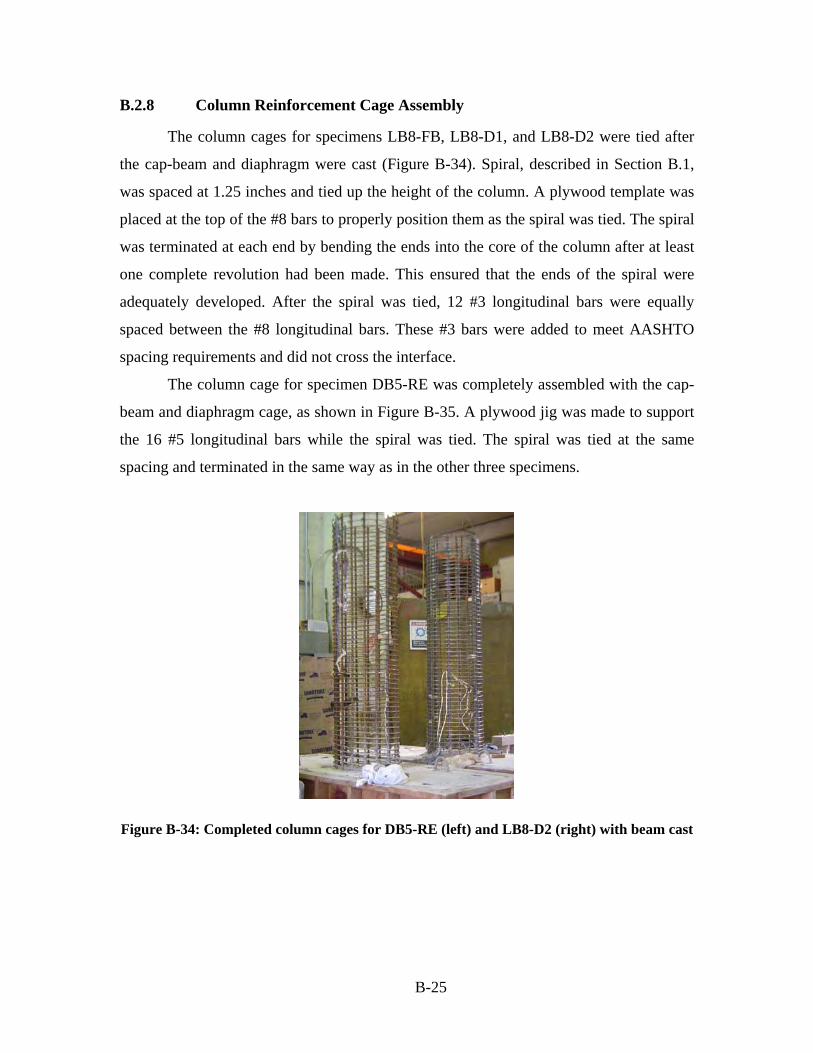
B.2.8 Column Reinforcement Cage Assembly
The column cages for specimens LB8-FB, LB8-D1, and LB8-D2 were tied after
the cap-beam and diaphragm were cast (Figure B-34). Spiral, described in Section B.1,
was spaced at 1.25 inches and tied up the height of the column. A plywood template was
placed at the top of the #8 bars to properly position them as the spiral was tied. The spiral
was terminated at each end by bending the ends into the core of the column after at least
one complete revolution had been made. This ensured that the ends of the spiral were
adequately developed. After the spiral was tied, 12 #3 longitudinal bars were equally
spaced between the #8 longitudinal bars. These #3 bars were added to meet AASHTO
spacing requirements and did not cross the interface.
The column cage for specimen DB5-RE was completely assembled with the cap-
beam and diaphragm cage, as shown in Figure B-35. A plywood jig was made to support
the 16 #5 longitudinal bars while the spiral was tied. The spiral was tied at the same
spacing and terminated in the same way as in the other three specimens.
Figure B-34: Completed column cages for DB5-RE (left) and LB8-D2 (right) with beam cast
B-25
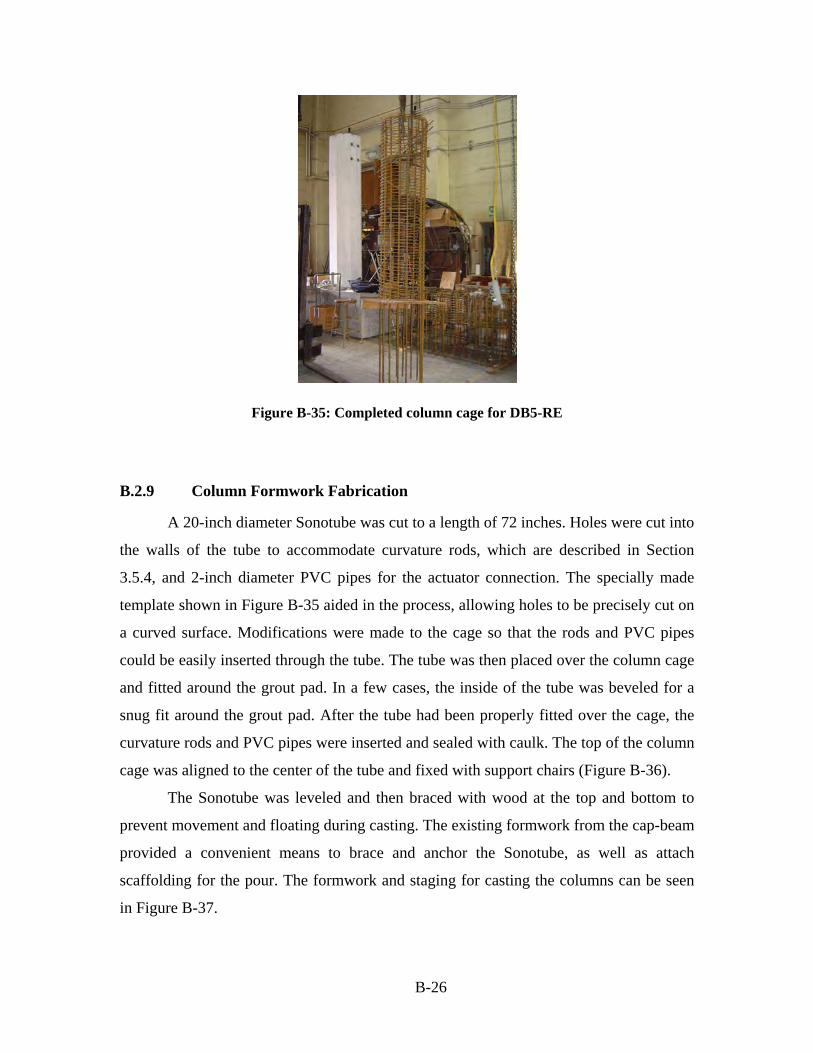
Figure B-35: Completed column cage for DB5-RE
B.2.9 Column Formwork Fabrication
A 20-inch diameter Sonotube was cut to a length of 72 inches. Holes were cut into
the walls of the tube to accommodate curvature rods, which are described in Section
3.5.4, and 2-inch diameter PVC pipes for the actuator connection. The specially made
template shown in Figure B-35 aided in the process, allowing holes to be precisely cut on
a curved surface. Modifications were made to the cage so that the rods and PVC pipes
could be easily inserted through the tube. The tube was then placed over the column cage
and fitted around the grout pad. In a few cases, the inside of the tube was beveled for a
snug fit around the grout pad. After the tube had been properly fitted over the cage, the
curvature rods and PVC pipes were inserted and sealed with caulk. The top of the column
cage was aligned to the center of the tube and fixed with support chairs (Figure B-36).
The Sonotube was leveled and then braced with wood at the top and bottom to
prevent movement and floating during casting. The existing formwork from the cap-beam
provided a convenient means to brace and anchor the Sonotube, as well as attach
scaffolding for the pour. The formwork and staging for casting the columns can be seen
in Figure B-37.
B-26
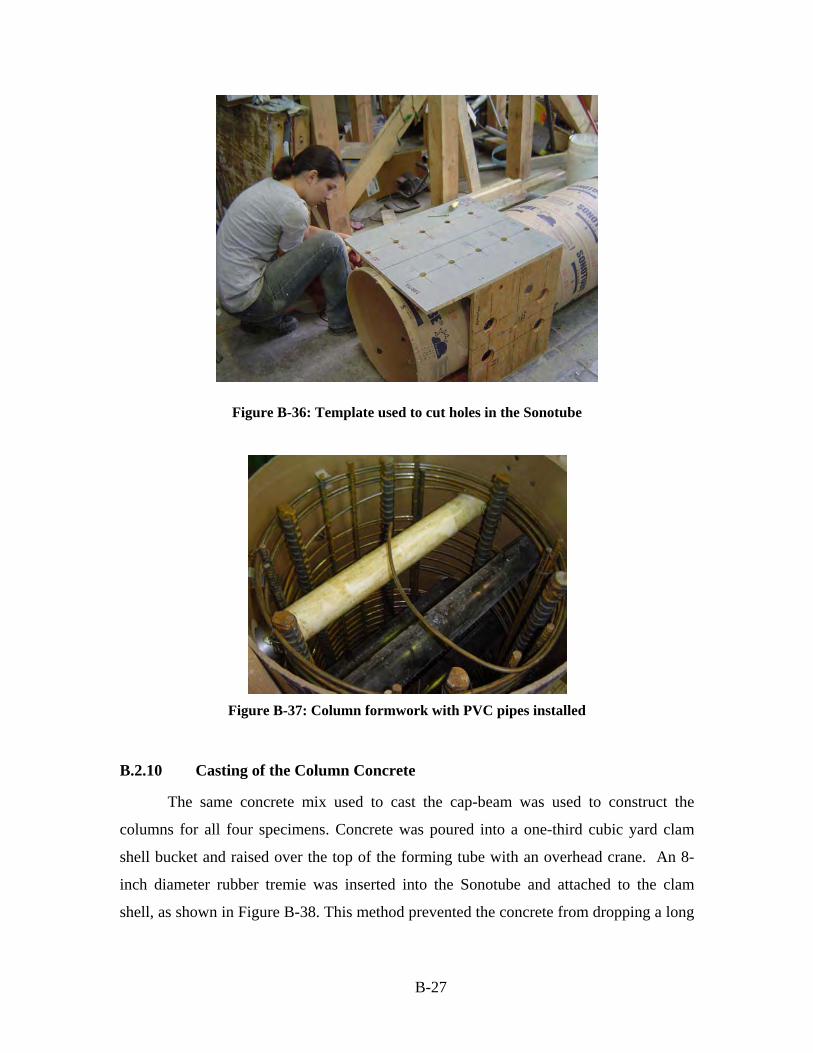
Figure B-36: Template used to cut holes in the Sonotube
Figure B-37: Column formwork with PVC pipes installed
B.2.10 Casting of the Column Concrete
The same concrete mix used to cast the cap-beam was used to construct the
columns for all four specimens. Concrete was poured into a one-third cubic yard clam
shell bucket and raised over the top of the forming tube with an overhead crane. An 8-
inch diameter rubber tremie was inserted into the Sonotube and attached to the clam
shell, as shown in Figure B-38. This method prevented the concrete from dropping a long
B-27
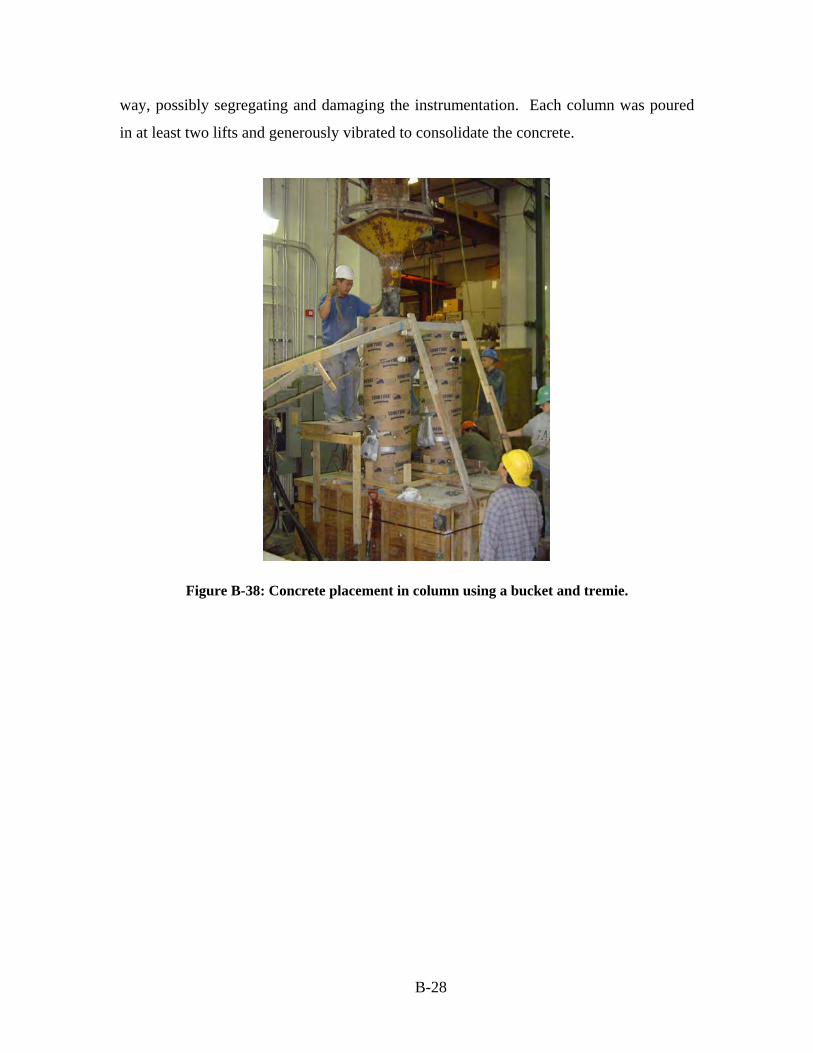
way, possibly segregating and damaging the instrumentation. Each column was poured
in at least two lifts and generously vibrated to consolidate the concrete.
Figure B-38: Concrete placement in column using a bucket and tremie.
B-28
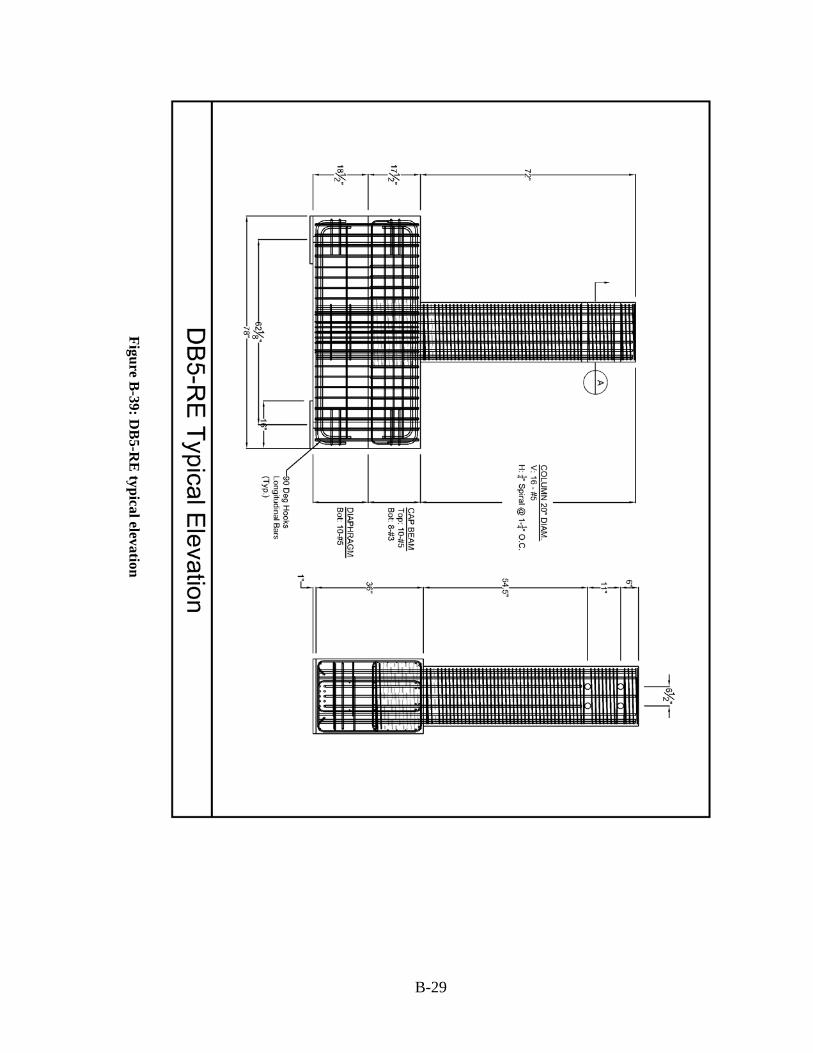
Figure B-39: D
B5-R
E typical elevation
B-29
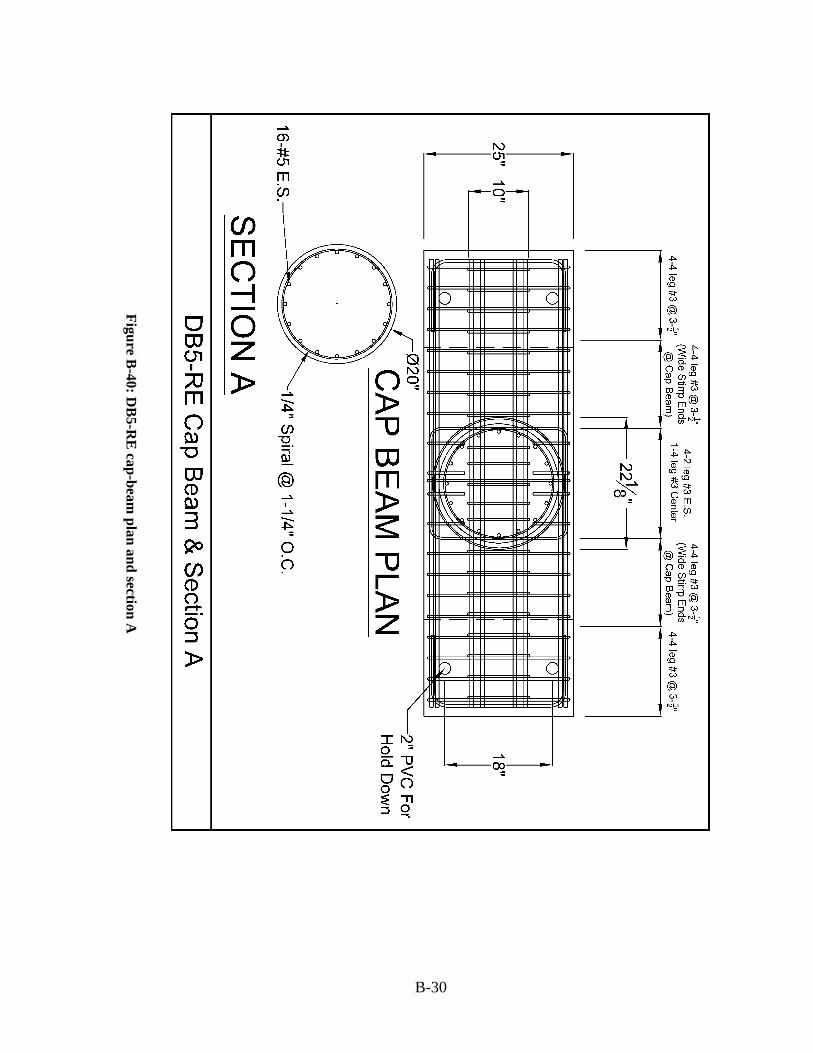
Figure B-40: D
B5-R
E cap-beam
plan and section A
B-30
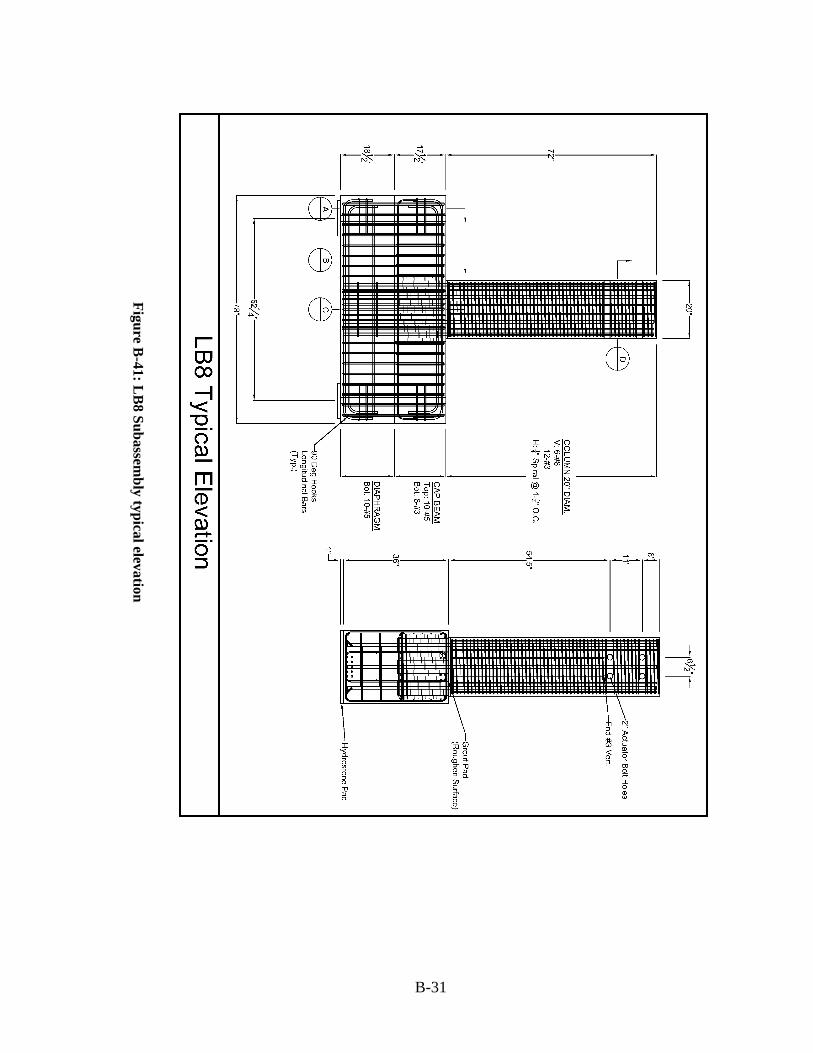
Figure B-41: L
B8 Subassem
bly typical elevation
B-31
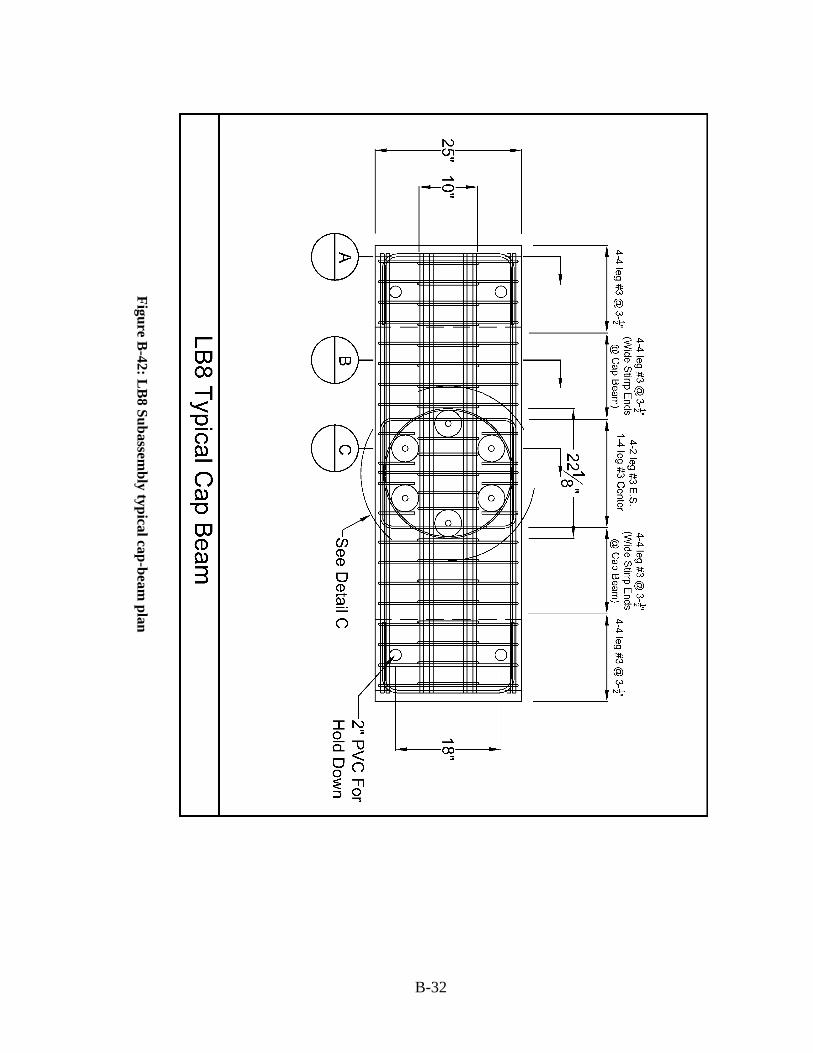
Figure B-42: L
B8 Subassem
bly typical cap-beam plan
B-32
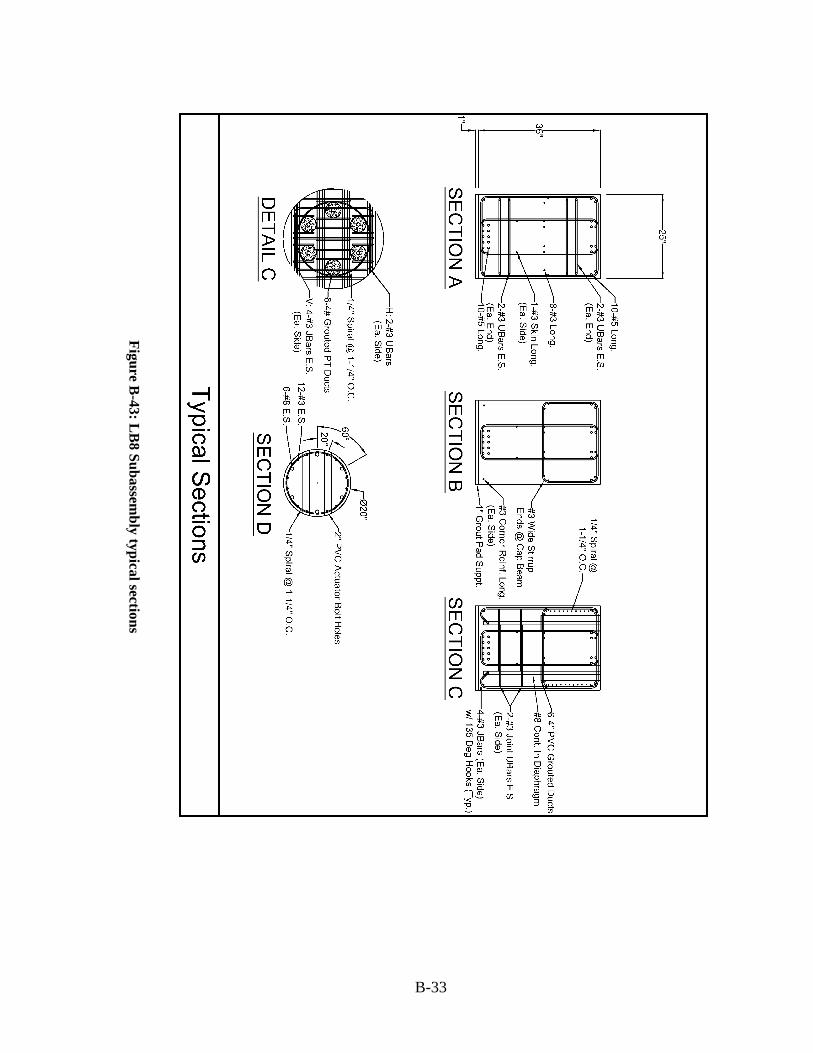
Figure B-43: L
B8 Subassem
bly typical sections
B-33

B.3 Reference
Steuck, Kyle P., Pang, Jason B.K., Stanton, John F., and Eberhard Marc O. (2007) “Anchorage of Large Bars in Grouted Ducts.” Washington State Department of Transportation Report No. WA-RD 684.1, Washington State Transportation Center.
B-34
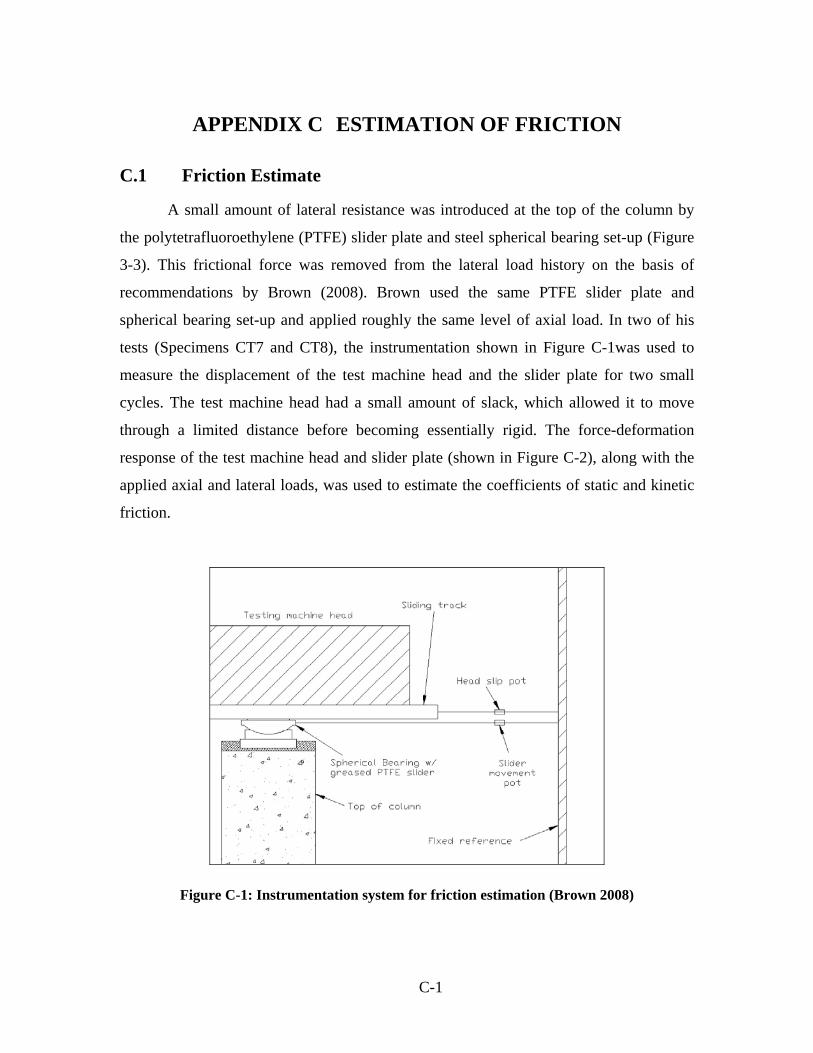
APPENDIX C ESTIMATION OF FRICTION
C.1 Friction Estimate
A small amount of lateral resistance was introduced at the top of the column by
the polytetrafluoroethylene (PTFE) slider plate and steel spherical bearing set-up (Figure
3-3). This frictional force was removed from the lateral load history on the basis of
recommendations by Brown (2008). Brown used the same PTFE slider plate and
spherical bearing set-up and applied roughly the same level of axial load. In two of his
tests (Specimens CT7 and CT8), the instrumentation shown in Figure C-1was used to
measure the displacement of the test machine head and the slider plate for two small
cycles. The test machine head had a small amount of slack, which allowed it to move
through a limited distance before becoming essentially rigid. The force-deformation
response of the test machine head and slider plate (shown in Figure C-2), along with the
applied axial and lateral loads, was used to estimate the coefficients of static and kinetic
friction.
Figure C-1: Instrumentation system for friction estimation (Brown 2008)
C-1
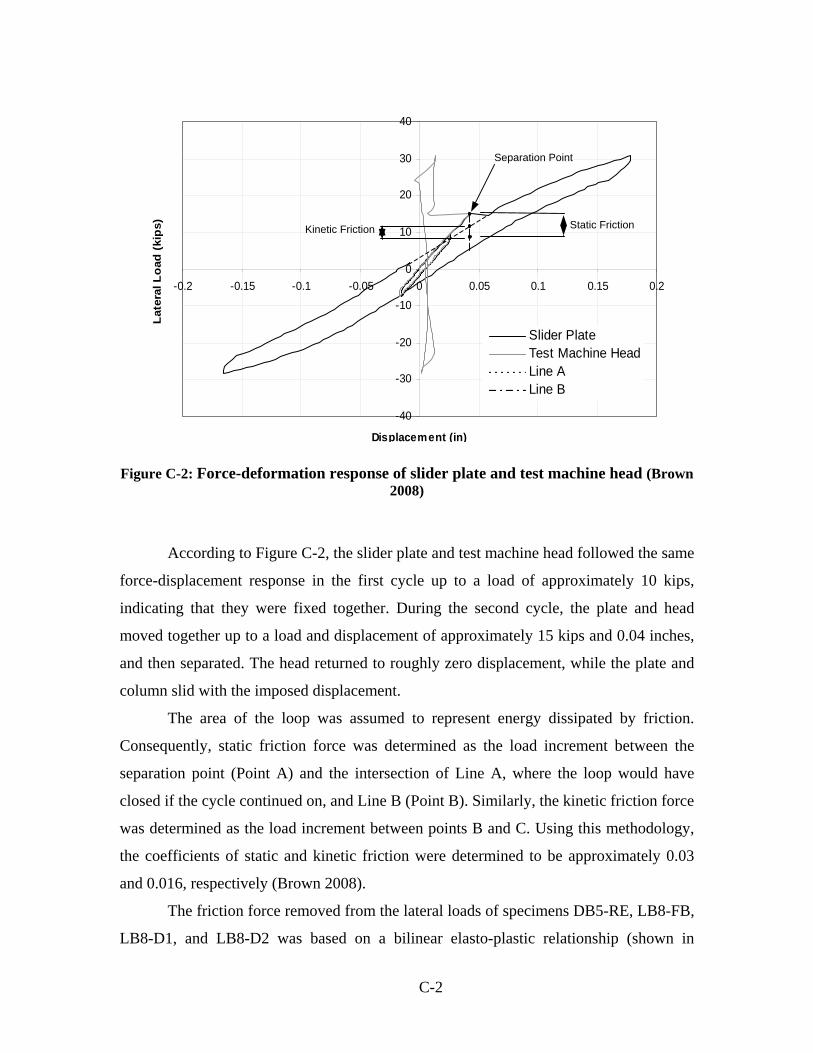
40
30 Separation Point
20
Kinetic Friction
(kip
s)
10 Static Friction
Late
ral L
oad
0 -0.2 -0.15 -0.1 -0.05 0 0.05 0.1 0.15 0.2
-10
-20 Slider Plate Test Machine Head
-30 Line A Line B
-40
Displacement (in)
Figure C-2: Force-deformation response of slider plate and test machine head (Brown 2008)
According to Figure C-2, the slider plate and test machine head followed the same
force-displacement response in the first cycle up to a load of approximately 10 kips,
indicating that they were fixed together. During the second cycle, the plate and head
moved together up to a load and displacement of approximately 15 kips and 0.04 inches,
and then separated. The head returned to roughly zero displacement, while the plate and
column slid with the imposed displacement.
The area of the loop was assumed to represent energy dissipated by friction.
Consequently, static friction force was determined as the load increment between the
separation point (Point A) and the intersection of Line A, where the loop would have
closed if the cycle continued on, and Line B (Point B). Similarly, the kinetic friction force
was determined as the load increment between points B and C. Using this methodology,
the coefficients of static and kinetic friction were determined to be approximately 0.03
and 0.016, respectively (Brown 2008).
The friction force removed from the lateral loads of specimens DB5-RE, LB8-FB,
LB8-D1, and LB8-D2 was based on a bilinear elasto-plastic relationship (shown in
C-2
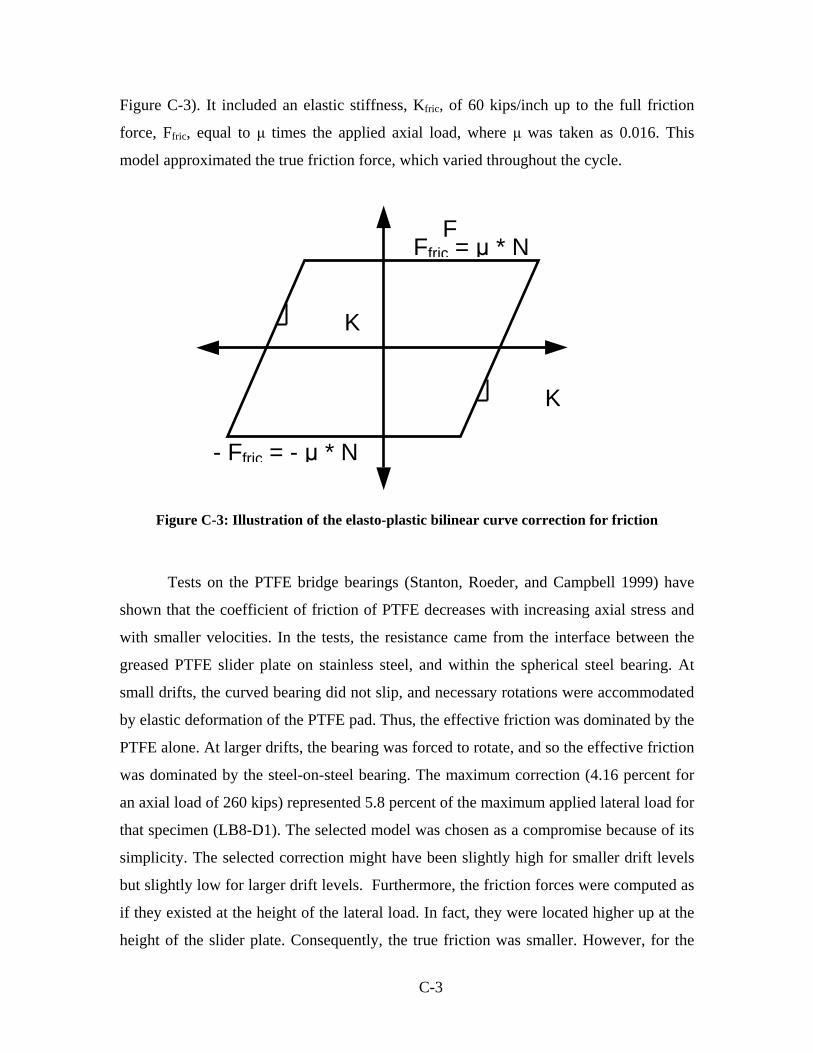
Figure C-3). It included an elastic stiffness, Kfric, of 60 kips/inch up to the full friction
force, Ffric, equal to μ times the applied axial load, where μ was taken as 0.016. This
model approximated the true friction force, which varied throughout the cycle.
FFfric = μ * N
K
K
- Ffric = - μ * N
Figure C-3: Illustration of the elasto-plastic bilinear curve correction for friction
Tests on the PTFE bridge bearings (Stanton, Roeder, and Campbell 1999) have
shown that the coefficient of friction of PTFE decreases with increasing axial stress and
with smaller velocities. In the tests, the resistance came from the interface between the
greased PTFE slider plate on stainless steel, and within the spherical steel bearing. At
small drifts, the curved bearing did not slip, and necessary rotations were accommodated
by elastic deformation of the PTFE pad. Thus, the effective friction was dominated by the
PTFE alone. At larger drifts, the bearing was forced to rotate, and so the effective friction
was dominated by the steel-on-steel bearing. The maximum correction (4.16 percent for
an axial load of 260 kips) represented 5.8 percent of the maximum applied lateral load for
that specimen (LB8-D1). The selected model was chosen as a compromise because of its
simplicity. The selected correction might have been slightly high for smaller drift levels
but slightly low for larger drift levels. Furthermore, the friction forces were computed as
if they existed at the height of the lateral load. In fact, they were located higher up at the
height of the slider plate. Consequently, the true friction was smaller. However, for the
C-3
purpose of correcting the measured lateral forces, the approach of using an “effective
friction” led to the correct result.
C.2 References
Brown, Wayne. (2008) “Bar Buckling in Reinforced Concrete Bridge Columns.” Master’s Thesis, University of Washington, Seattle, WA.
Stanton, John F., Roeder, Charles W., and Campbel, T.I. (1999) “High Load Multi-Rotational Bridge Bearings” NCHRP Report No. 432, National Cooperative Highway Research Program, Washington D.C.
C-4

APPENDIX D ANCHORAGE PULLOUT TESTS
This appendix covers the development and testing of three supplementary pullout
tests that were conducted to more closely study the anchorage conditions in the grouted
ducts.
D.1 Test Matrix
To more closely study the behavior of the debonding and anchorage of the #8
column bars in the precast assemblies, three monotonic pullout tests were conducted. The
test matrix is shown in Table D-1. Each specimen will be referred to using the following
nomenclature:
� AD8-FB = Pullout test with the bar fully bonded in grouted duct
� AD8-D1 = Pullout test with the bar debonded 8 db using Method 1
� AD8-D2 = Pullout test with the bar debonded 8 db using Method 2
Pullout specimens AD8-FB, AD8-D1, and AD8-D2 investigated the three bond
conditions studied in each of the subassembly tests. In each specimen a #8 bar was
grouted into a duct and embedded in concrete, but the presence and method of debonding
at the lead-in end differed in each. AD8-FB mirrored the #8 bar conditions in Specimen
LB8-FB, where the bars were fully grouted into the ducts. Similarly, AD8-D1 and AD8-
D2 mirrored the methods of debonding used in specimens LB8-D1 and LB8-D2,
respectively.
Table D-1: Anchorage and debonding pullout test matrix
Specimen Bar Size Grouted Ducts Debonding
AD8-FB #8 Yes None
AD8-D1 #8 Yes Method 1
AD8-D2 #8 Yes Method 2
D-1

D.2 Design of Specimen
The pullout tests were conducted on three #8 bars embedded in a concrete block
78 inches long, 48 inches wide, and 36 inches high. The tests were designed to replicate
the anchorage condition of a longitudinal column bar in the cap-beam and diaphragm
from subassembly specimens LB8-FB, LB8-D1, and LB8-D2. They were grouted 17.5
inches in a 4-inch diameter corrugated duct and were embedded 18.5 inches further in
concrete. The formwork used to cast the subassembly specimens and the loading
apparatus used by Steuck et al. (2007) were reused to construct and test the pullout
specimens. The bars were spaced 21 inches apart, so that the 36-inch diameter loading
apparatus could be placed over each bar without encountering another bar.
The concrete block was minimally reinforced with #3 bars at 4 inches on center
around each specimen to prevent the propagation of large cracks. Two 0.5-inch diameter
threaded rods were embedded 20 inches on each side of the #8 bar. These rods were used
to attach instrumentation to measure the displacements of the concrete, duct, grout, and
bars. To aid in transportation of the se-tup, lifting anchors bent from #5 bars were placed
in the corners of the concrete block where they would not interfere with the loading
apparatus.
D.3 Construction Procedures
The formwork described in Section B.2.1 was modified and used to cast the
pullout test specimens. The construction drawings for the pullout specimens are shown in
Figure D-1. A rebar cage, consisting of #3 bars spaced at 4 inches on center around each
pullout specimen, was tied and placed in the formwork. Strain gages were applied to
three #8 bars following the same procedure discussed in Section B.2.2 and protected with
the same method as that for specimens LB8-D2 and DB5-RE. The locations of the gages
are discussed in detail in Section D.5.3. Two of the three bars were debonded over a
length of 8 inches, one using Method 1 and another using Method 2 (shown in Figure
D-2).
D-2
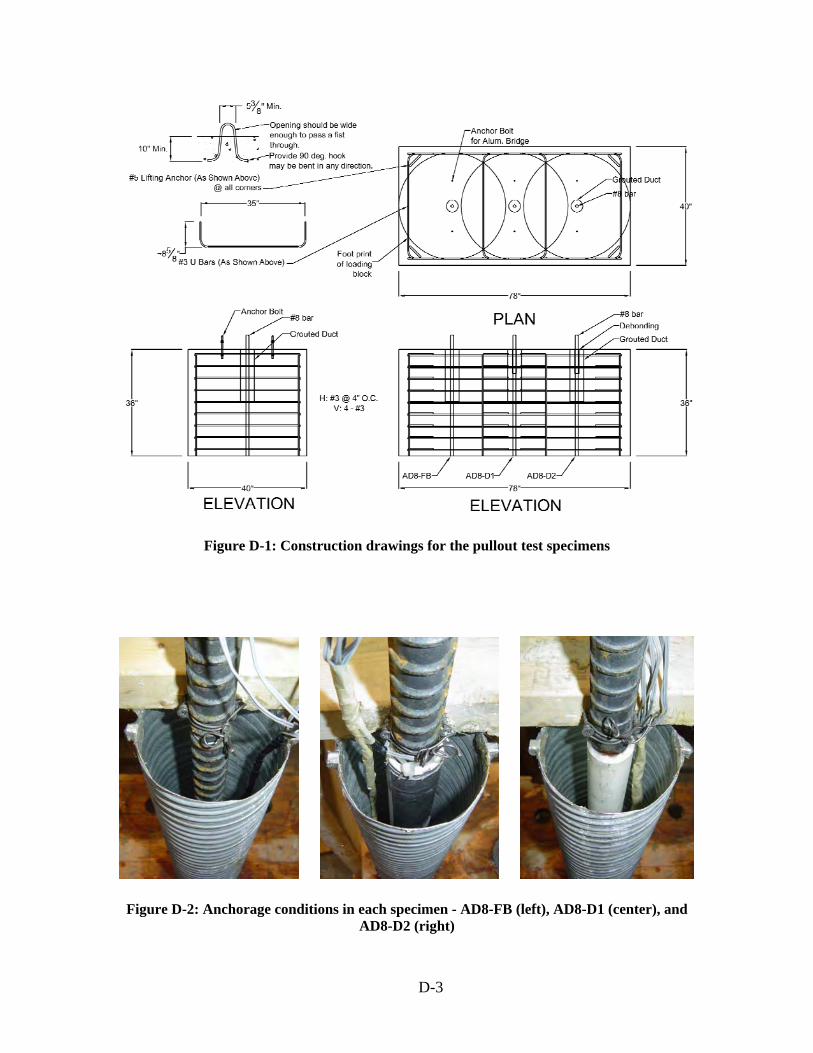
Figure D-1: Construction drawings for the pullout test specimens
Figure D-2: Anchorage conditions in each specimen - AD8-FB (left), AD8-D1 (center), and AD8-D2 (right)
D-3
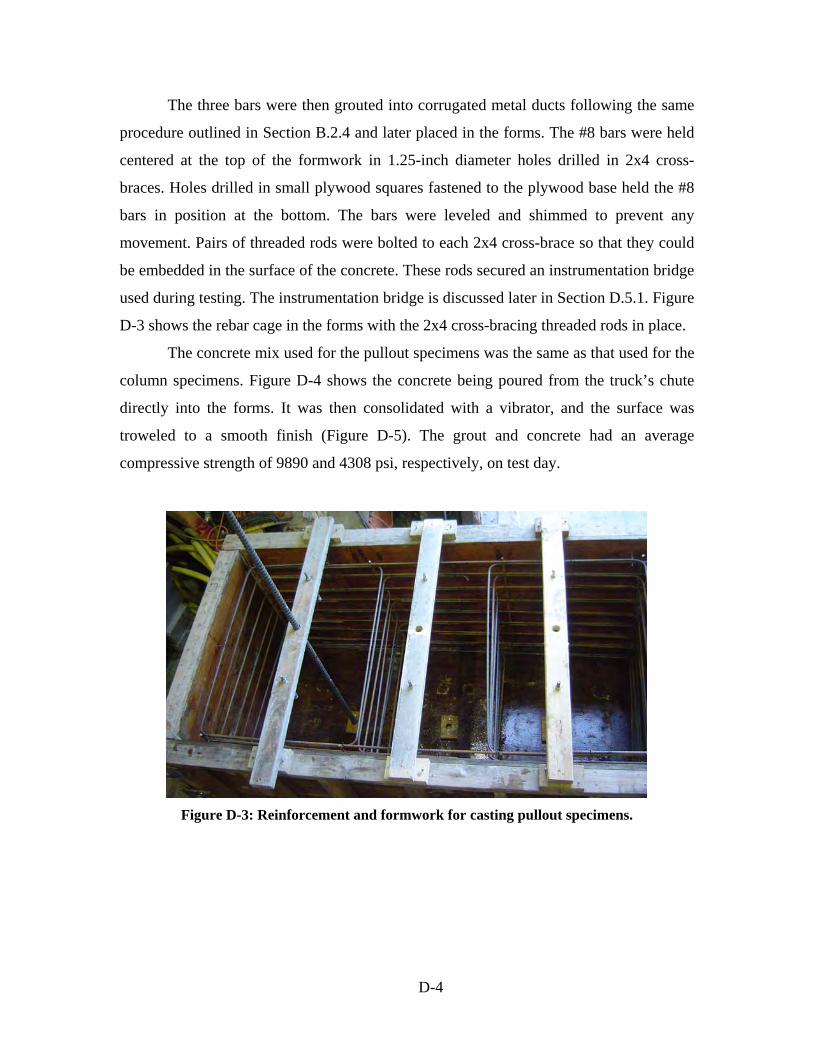
The three bars were then grouted into corrugated metal ducts following the same
procedure outlined in Section B.2.4 and later placed in the forms. The #8 bars were held
centered at the top of the formwork in 1.25-inch diameter holes drilled in 2x4 cross-
braces. Holes drilled in small plywood squares fastened to the plywood base held the #8
bars in position at the bottom. The bars were leveled and shimmed to prevent any
movement. Pairs of threaded rods were bolted to each 2x4 cross-brace so that they could
be embedded in the surface of the concrete. These rods secured an instrumentation bridge
used during testing. The instrumentation bridge is discussed later in Section D.5.1. Figure
D-3 shows the rebar cage in the forms with the 2x4 cross-bracing threaded rods in place.
The concrete mix used for the pullout specimens was the same as that used for the
column specimens. Figure D-4 shows the concrete being poured from the truck’s chute
directly into the forms. It was then consolidated with a vibrator, and the surface was
troweled to a smooth finish (Figure D-5). The grout and concrete had an average
compressive strength of 9890 and 4308 psi, respectively, on test day.
Figure D-3: Reinforcement and formwork for casting pullout specimens.
D-4
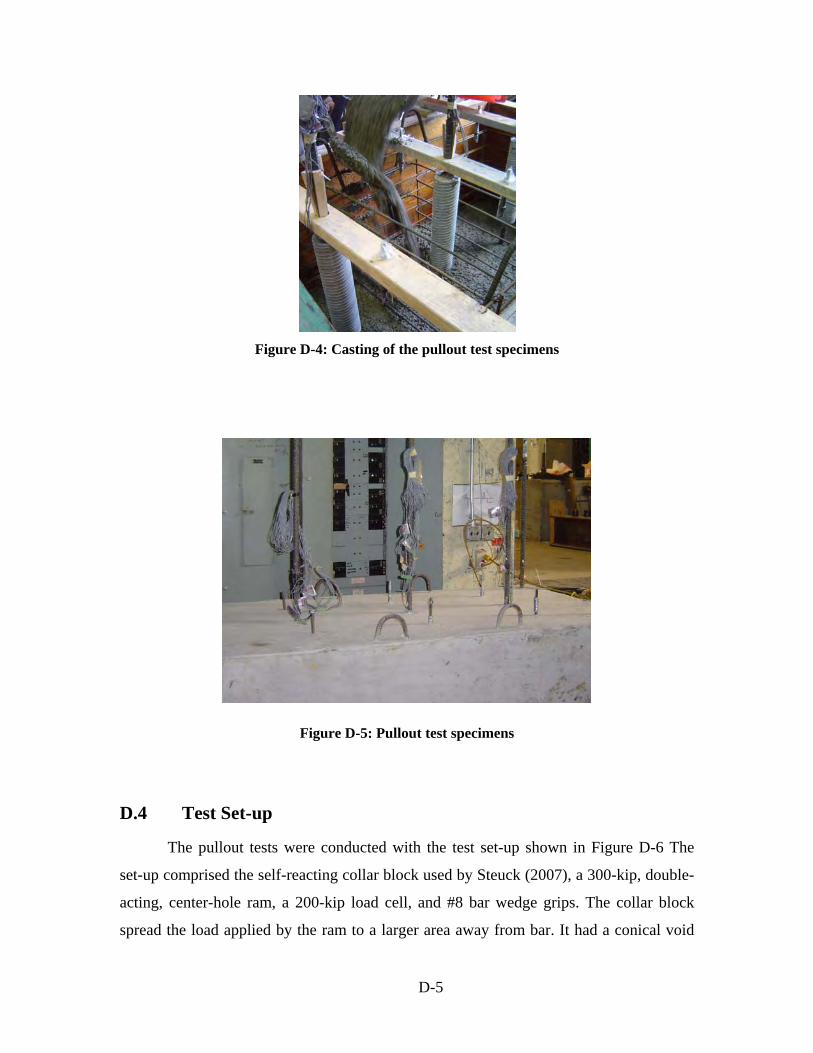
Figure D-4: Casting of the pullout test specimens
Figure D-5: Pullout test specimens
D.4 Test Set-up
The pullout tests were conducted with the test set-up shown in Figure D-6 The
set-up comprised the self-reacting collar block used by Steuck (2007), a 300-kip, double-
acting, center-hole ram, a 200-kip load cell, and #8 bar wedge grips. The collar block
spread the load applied by the ram to a larger area away from bar. It had a conical void
D-5
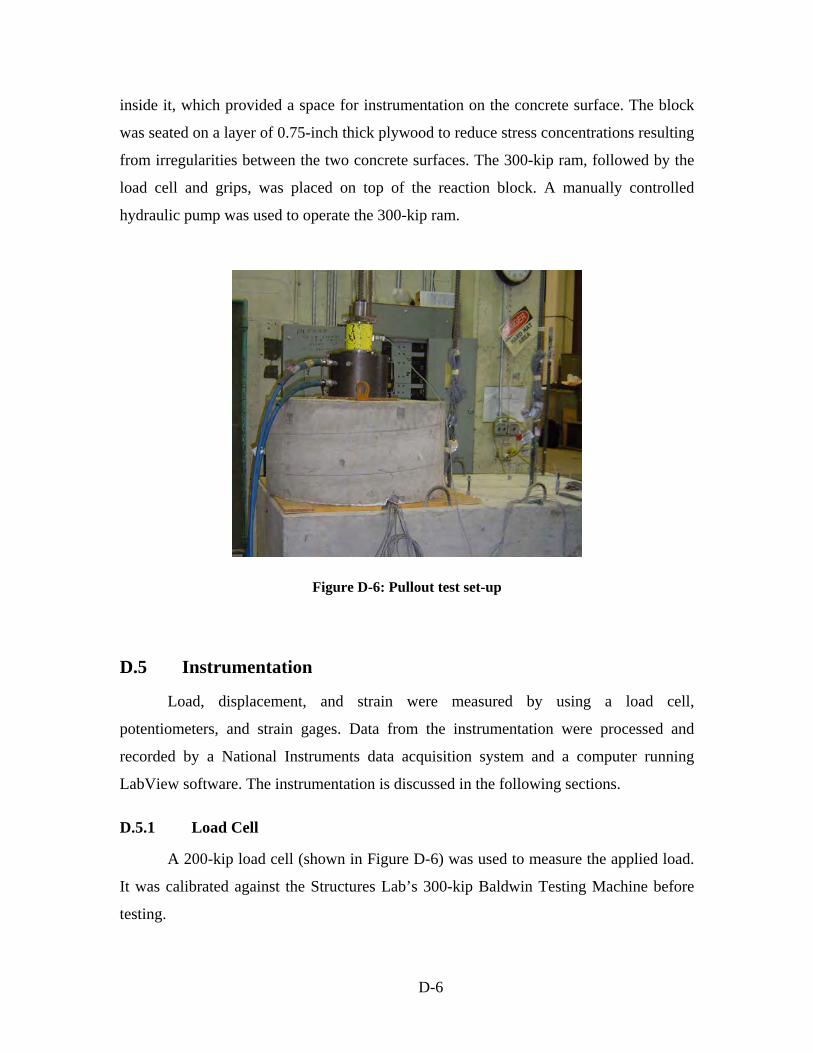
inside it, which provided a space for instrumentation on the concrete surface. The block
was seated on a layer of 0.75-inch thick plywood to reduce stress concentrations resulting
from irregularities between the two concrete surfaces. The 300-kip ram, followed by the
load cell and grips, was placed on top of the reaction block. A manually controlled
hydraulic pump was used to operate the 300-kip ram.
Figure D-6: Pullout test set-up
D.5 Instrumentation
Load, displacement, and strain were measured by using a load cell,
potentiometers, and strain gages. Data from the instrumentation were processed and
recorded by a National Instruments data acquisition system and a computer running
LabView software. The instrumentation is discussed in the following sections.
D.5.1 Load Cell
A 200-kip load cell (shown in Figure D-6) was used to measure the applied load.
It was calibrated against the Structures Lab’s 300-kip Baldwin Testing Machine before
testing.
D-6
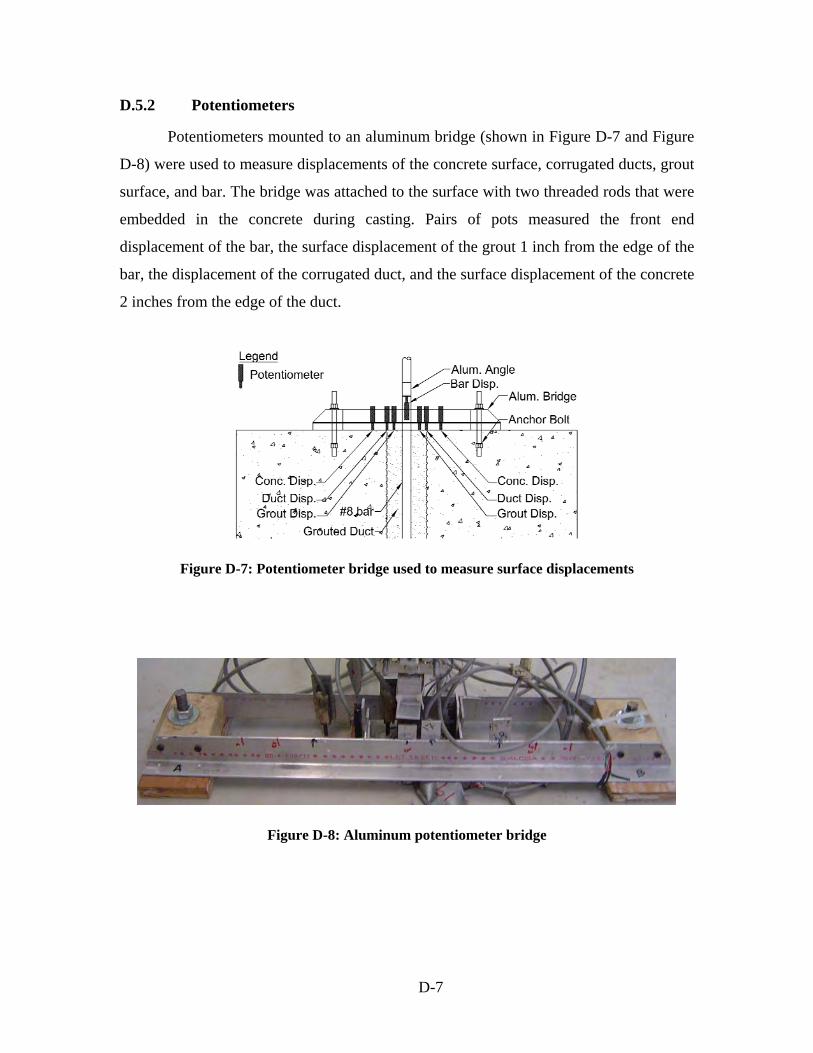
D.5.2 Potentiometers
Potentiometers mounted to an aluminum bridge (shown in Figure D-7 and Figure
D-8) were used to measure displacements of the concrete surface, corrugated ducts, grout
surface, and bar. The bridge was attached to the surface with two threaded rods that were
embedded in the concrete during casting. Pairs of pots measured the front end
displacement of the bar, the surface displacement of the grout 1 inch from the edge of the
bar, the displacement of the corrugated duct, and the surface displacement of the concrete
2 inches from the edge of the duct.
Figure D-7: Potentiometer bridge used to measure surface displacements
Figure D-8: Aluminum potentiometer bridge
D-7
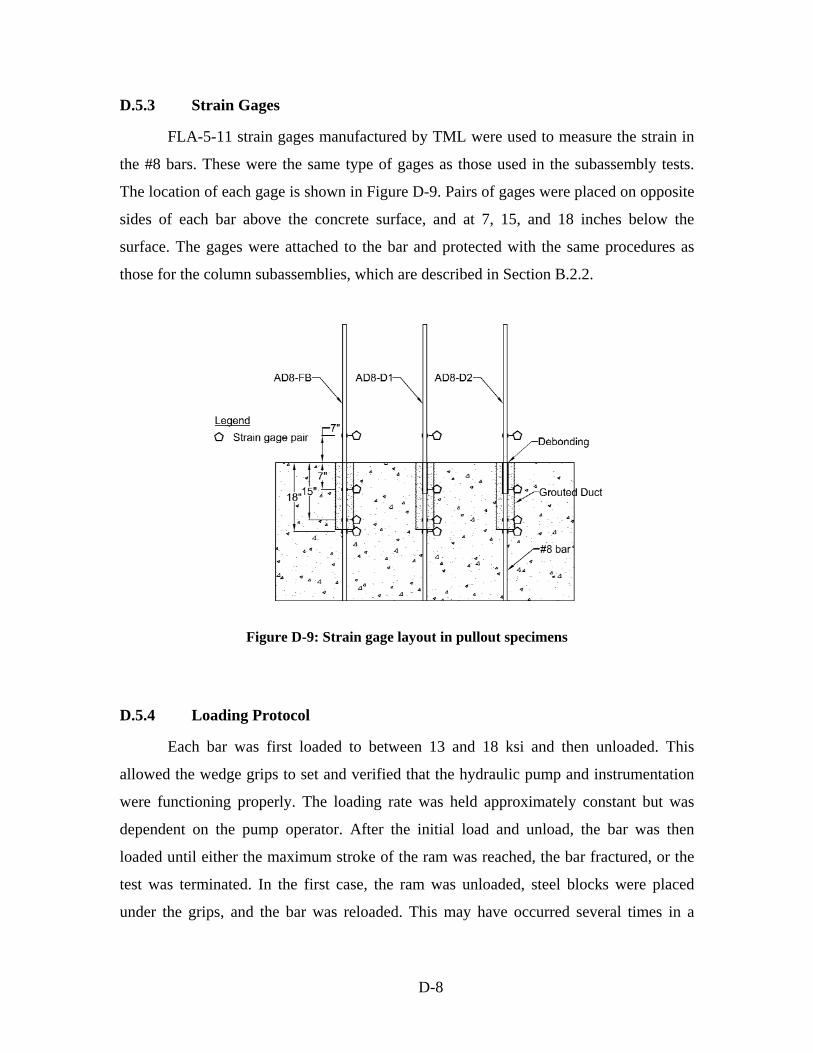
D.5.3 Strain Gages
FLA-5-11 strain gages manufactured by TML were used to measure the strain in
the #8 bars. These were the same type of gages as those used in the subassembly tests.
The location of each gage is shown in Figure D-9. Pairs of gages were placed on opposite
sides of each bar above the concrete surface, and at 7, 15, and 18 inches below the
surface. The gages were attached to the bar and protected with the same procedures as
those for the column subassemblies, which are described in Section B.2.2.
Figure D-9: Strain gage layout in pullout specimens
D.5.4 Loading Protocol
Each bar was first loaded to between 13 and 18 ksi and then unloaded. This
allowed the wedge grips to set and verified that the hydraulic pump and instrumentation
were functioning properly. The loading rate was held approximately constant but was
dependent on the pump operator. After the initial load and unload, the bar was then
loaded until either the maximum stroke of the ram was reached, the bar fractured, or the
test was terminated. In the first case, the ram was unloaded, steel blocks were placed
under the grips, and the bar was reloaded. This may have occurred several times in a
D-8
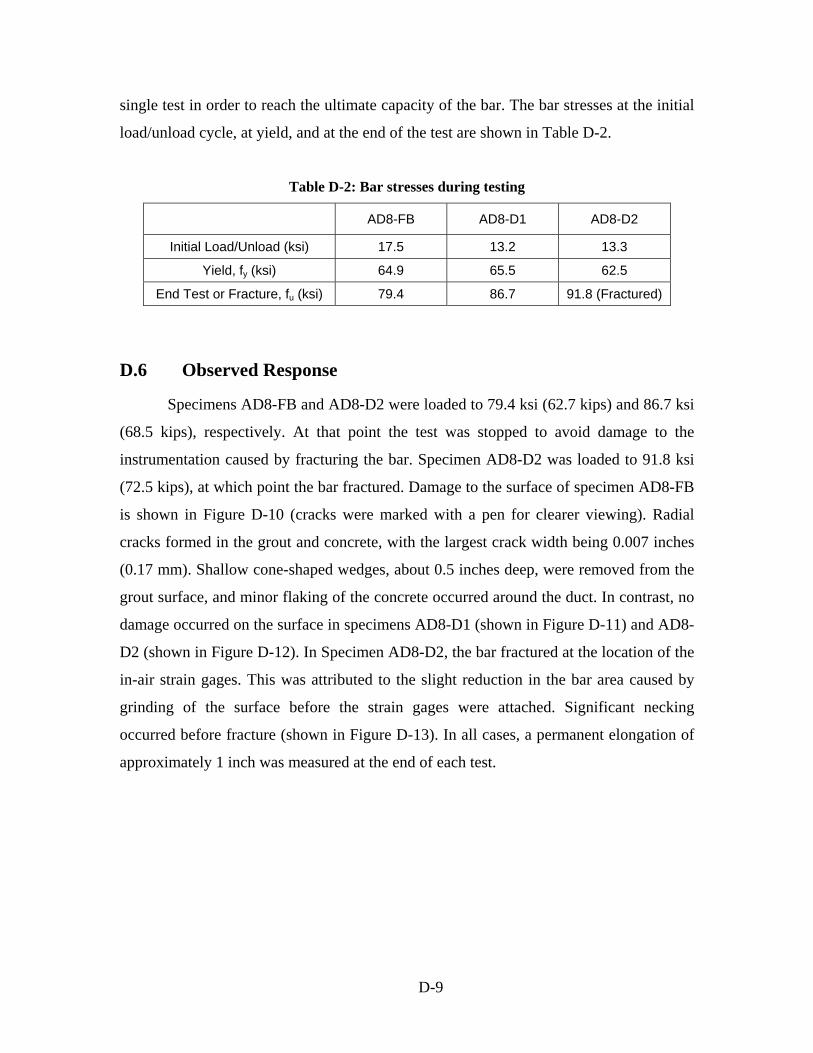
single test in order to reach the ultimate capacity of the bar. The bar stresses at the initial
load/unload cycle, at yield, and at the end of the test are shown in Table D-2.
Table D-2: Bar stresses during testing
AD8-FB AD8-D1 AD8-D2
Initial Load/Unload (ksi) 17.5 13.2 13.3
Yield, fy (ksi) 64.9 65.5 62.5
End Test or Fracture, fu (ksi) 79.4 86.7 91.8 (Fractured)
D.6 Observed Response
Specimens AD8-FB and AD8-D2 were loaded to 79.4 ksi (62.7 kips) and 86.7 ksi
(68.5 kips), respectively. At that point the test was stopped to avoid damage to the
instrumentation caused by fracturing the bar. Specimen AD8-D2 was loaded to 91.8 ksi
(72.5 kips), at which point the bar fractured. Damage to the surface of specimen AD8-FB
is shown in Figure D-10 (cracks were marked with a pen for clearer viewing). Radial
cracks formed in the grout and concrete, with the largest crack width being 0.007 inches
(0.17 mm). Shallow cone-shaped wedges, about 0.5 inches deep, were removed from the
grout surface, and minor flaking of the concrete occurred around the duct. In contrast, no
damage occurred on the surface in specimens AD8-D1 (shown in Figure D-11) and AD8-
D2 (shown in Figure D-12). In Specimen AD8-D2, the bar fractured at the location of the
in-air strain gages. This was attributed to the slight reduction in the bar area caused by
grinding of the surface before the strain gages were attached. Significant necking
occurred before fracture (shown in Figure D-13). In all cases, a permanent elongation of
approximately 1 inch was measured at the end of each test.
D-9
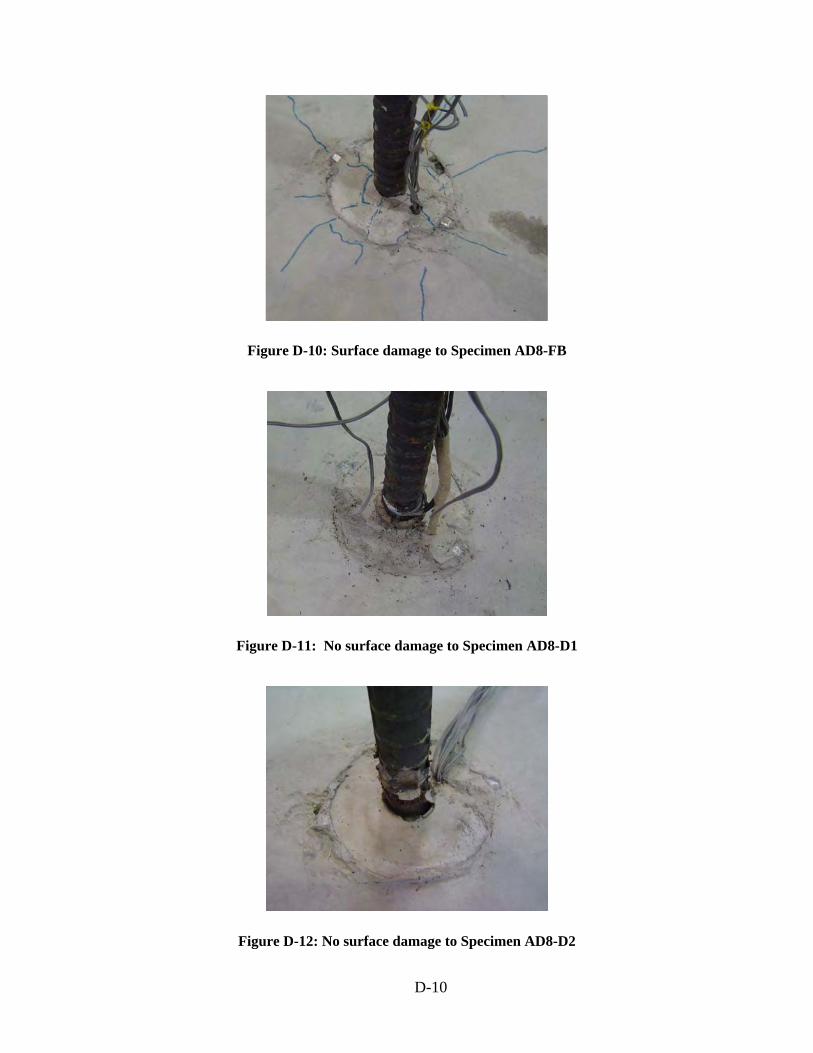
Figure D-10: Surface damage to Specimen AD8-FB
Figure D-11: No surface damage to Specimen AD8-D1
Figure D-12: No surface damage to Specimen AD8-D2
D-10
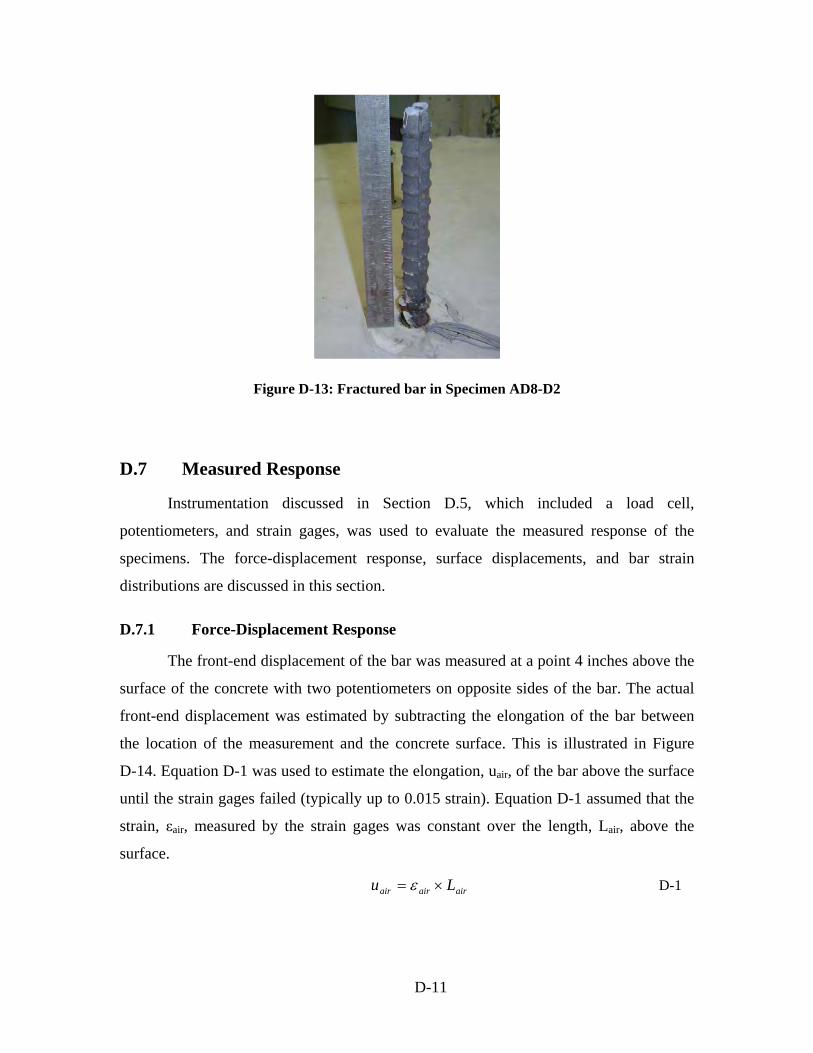
Figure D-13: Fractured bar in Specimen AD8-D2
D.7 Measured Response
Instrumentation discussed in Section D.5, which included a load cell,
potentiometers, and strain gages, was used to evaluate the measured response of the
specimens. The force-displacement response, surface displacements, and bar strain
distributions are discussed in this section.
D.7.1 Force-Displacement Response
The front-end displacement of the bar was measured at a point 4 inches above the
surface of the concrete with two potentiometers on opposite sides of the bar. The actual
front-end displacement was estimated by subtracting the elongation of the bar between
the location of the measurement and the concrete surface. This is illustrated in Figure
D-14. Equation D-1 was used to estimate the elongation, uair, of the bar above the surface
until the strain gages failed (typically up to 0.015 strain). Equation D-1 assumed that the
strain, εair, measured by the strain gages was constant over the length, Lair, above the
surface.
u = ε × L D-1air air air
D-11
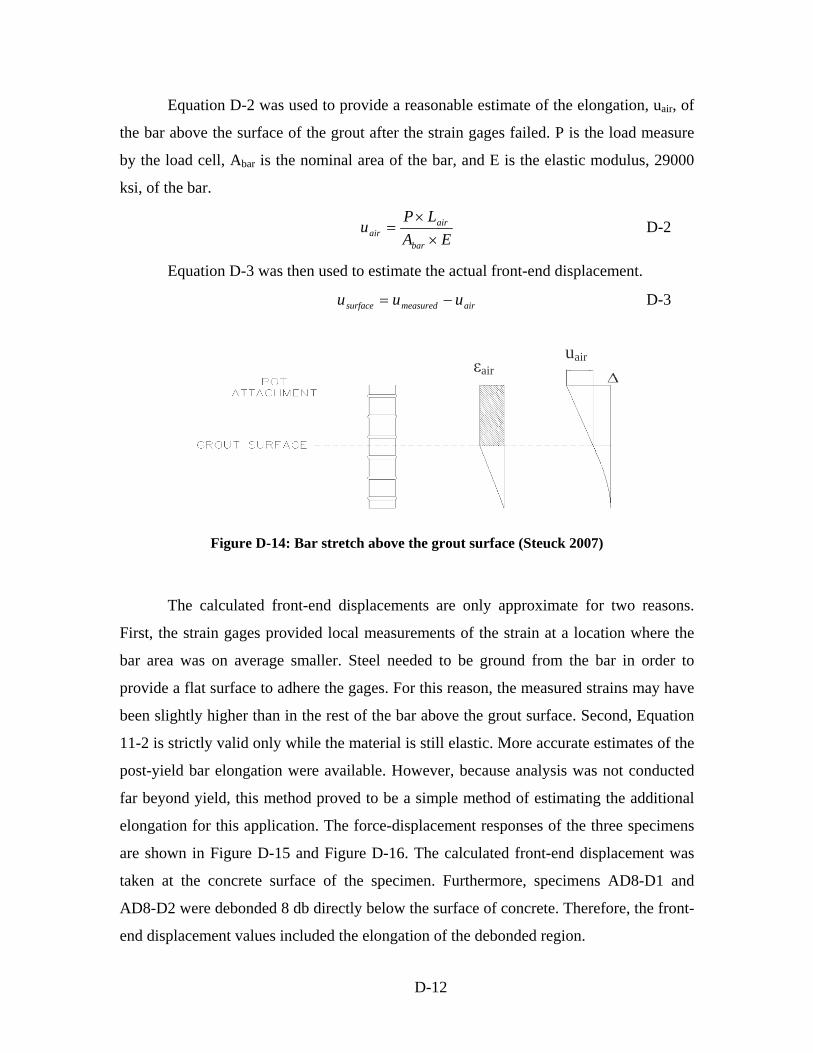
Equation D-2 was used to provide a reasonable estimate of the elongation, uair, of
the bar above the surface of the grout after the strain gages failed. P is the load measure
by the load cell, Abar is the nominal area of the bar, and E is the elastic modulus, 29000
ksi, of the bar.
P × Lairuair = D-2Abar × E
Equation D-3 was then used to estimate the actual front-end displacement.
u = u − u D-3surface measured air
uairεair
Figure D-14: Bar stretch above the grout surface (Steuck 2007)
The calculated front-end displacements are only approximate for two reasons.
First, the strain gages provided local measurements of the strain at a location where the
bar area was on average smaller. Steel needed to be ground from the bar in order to
provide a flat surface to adhere the gages. For this reason, the measured strains may have
been slightly higher than in the rest of the bar above the grout surface. Second, Equation
11-2 is strictly valid only while the material is still elastic. More accurate estimates of the
post-yield bar elongation were available. However, because analysis was not conducted
far beyond yield, this method proved to be a simple method of estimating the additional
elongation for this application. The force-displacement responses of the three specimens
are shown in Figure D-15 and Figure D-16. The calculated front-end displacement was
taken at the concrete surface of the specimen. Furthermore, specimens AD8-D1 and
AD8-D2 were debonded 8 db directly below the surface of concrete. Therefore, the front-
end displacement values included the elongation of the debonded region.
D-12
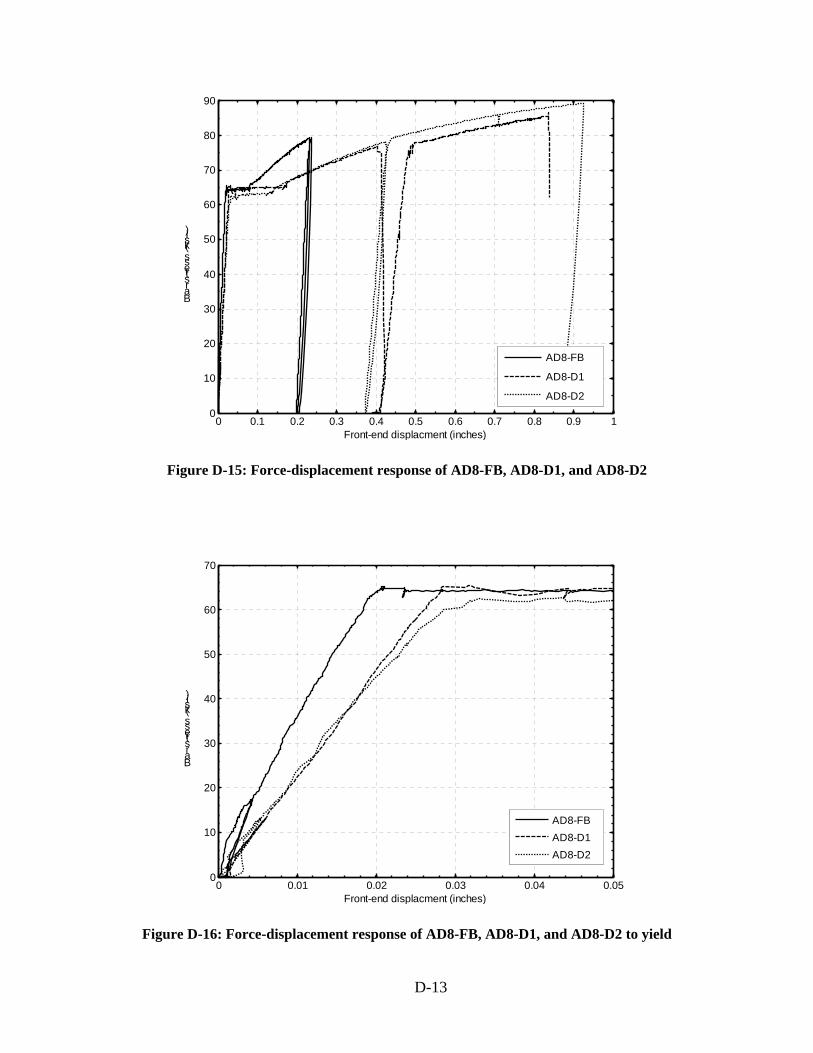
0
10
20
30
40
50
60
70
80
90
Ba r stre ss (ksi)
AD8-FB
AD8-D1
AD8-D2
0 0.1 0.2 0.3 0.4 0.5 0.6 0.7 0.8 0.9 1 Front-end displacment (inches)
Figure D-15: Force-displacement response of AD8-FB, AD8-D1, and AD8-D2
0
10
20
30
40
50
60
70
Ba r stre ss (ksi)
AD8-FB AD8-D1 AD8-D2
0 0.01 0.02 0.03 0.04 0.05 Front-end displacment (inches)
Figure D-16: Force-displacement response of AD8-FB, AD8-D1, and AD8-D2 to yield
D-13
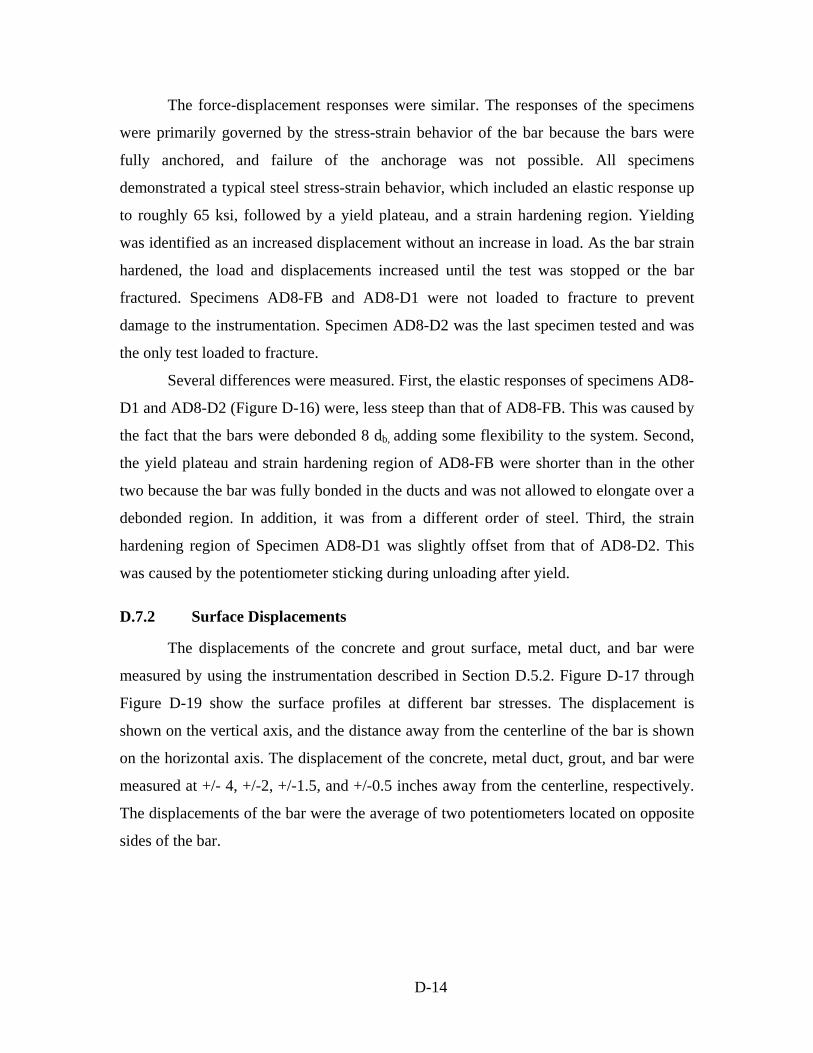
The force-displacement responses were similar. The responses of the specimens
were primarily governed by the stress-strain behavior of the bar because the bars were
fully anchored, and failure of the anchorage was not possible. All specimens
demonstrated a typical steel stress-strain behavior, which included an elastic response up
to roughly 65 ksi, followed by a yield plateau, and a strain hardening region. Yielding
was identified as an increased displacement without an increase in load. As the bar strain
hardened, the load and displacements increased until the test was stopped or the bar
fractured. Specimens AD8-FB and AD8-D1 were not loaded to fracture to prevent
damage to the instrumentation. Specimen AD8-D2 was the last specimen tested and was
the only test loaded to fracture.
Several differences were measured. First, the elastic responses of specimens AD8-
D1 and AD8-D2 (Figure D-16) were, less steep than that of AD8-FB. This was caused by
the fact that the bars were debonded 8 db, adding some flexibility to the system. Second,
the yield plateau and strain hardening region of AD8-FB were shorter than in the other
two because the bar was fully bonded in the ducts and was not allowed to elongate over a
debonded region. In addition, it was from a different order of steel. Third, the strain
hardening region of Specimen AD8-D1 was slightly offset from that of AD8-D2. This
was caused by the potentiometer sticking during unloading after yield.
D.7.2 Surface Displacements
The displacements of the concrete and grout surface, metal duct, and bar were
measured by using the instrumentation described in Section D.5.2. Figure D-17 through
Figure D-19 show the surface profiles at different bar stresses. The displacement is
shown on the vertical axis, and the distance away from the centerline of the bar is shown
on the horizontal axis. The displacement of the concrete, metal duct, grout, and bar were
measured at +/- 4, +/-2, +/-1.5, and +/-0.5 inches away from the centerline, respectively.
The displacements of the bar were the average of two potentiometers located on opposite
sides of the bar.
D-14
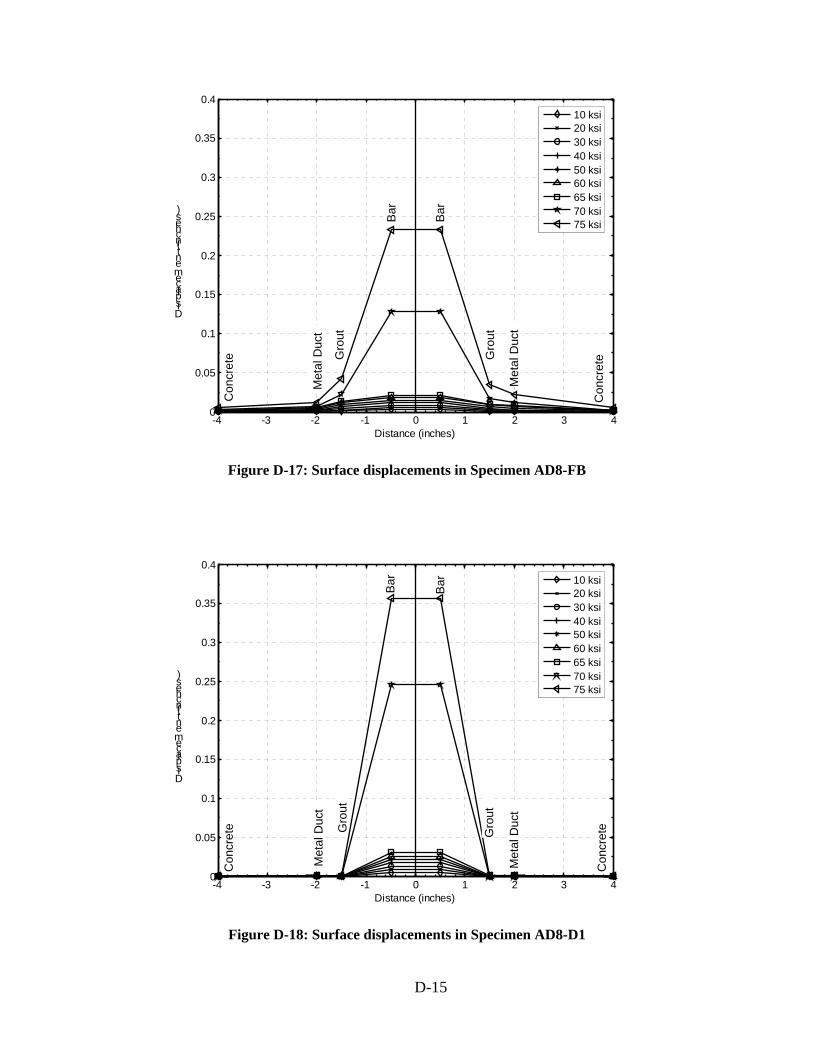
-4 -3 -2 -1 0 1 2 3 4 Distance (inches)
Figure D-17: Surface displacements in Specimen AD8-FB
0
0.05
0.1
0.15
0.2
0.25
0.3
0.35
0.4
Displa ce m e n t(in che s)
10 ksi 20 ksi 30 ksi 40 ksi 50 ksi 60 ksi 65 ksi 70 ksi 75 ksi B
ar
Bar
Met
al D
uct
Gro
ut
Gro
ut
Met
al D
uct
Con
cret
e
Con
cret
e
-4 -3 -2 -1 0 1 2 3 4 Distance (inches)
Figure D-18: Surface displacements in Specimen AD8-D1
D-15
0
0.05
0.1
0.15
0.2
0.25
0.3
0.35
0.4
Displa ce m e n t(in che s)
10 ksi 20 ksi 30 ksi 40 ksi 50 ksi 60 ksi 65 ksi 70 ksi 75 ksi
Bar
Bar
Gro
ut
Gro
ut
Met
al D
uct
Met
al D
uct
Con
cret
e
Con
cret
e
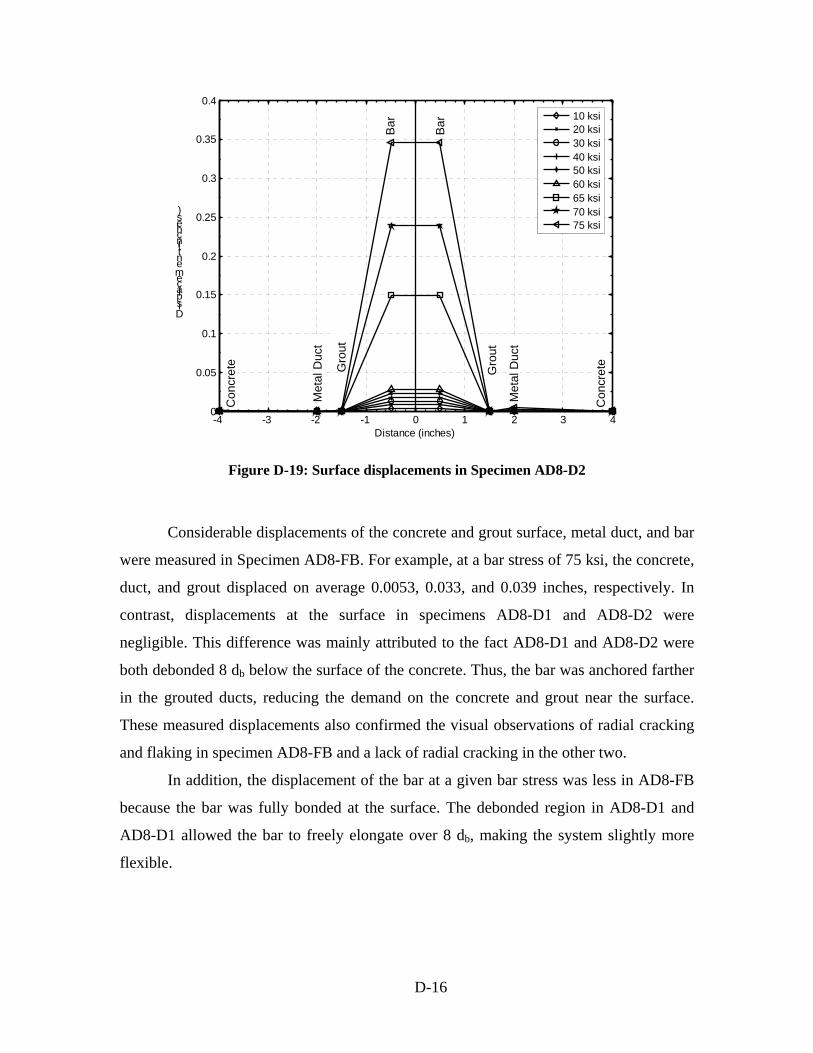
0.4
0.35
0.3
)s 0.25 ehcn(itn 0.2 e m eca pl 0.15 isD
0.1
0.05
0-4 -3 -2 -1 0 1 2 3 4
10 ksi 20 ksi 30 ksi 40 ksi 50 ksi 60 ksi 65 ksi 70 ksi 75 ksi
Con
cret
e
Con
cret
eGro
ut
Gro
ut
Met
al D
uct
Met
al D
uct
Bar
Bar
Distance (inches)
Figure D-19: Surface displacements in Specimen AD8-D2
Considerable displacements of the concrete and grout surface, metal duct, and bar
were measured in Specimen AD8-FB. For example, at a bar stress of 75 ksi, the concrete,
duct, and grout displaced on average 0.0053, 0.033, and 0.039 inches, respectively. In
contrast, displacements at the surface in specimens AD8-D1 and AD8-D2 were
negligible. This difference was mainly attributed to the fact AD8-D1 and AD8-D2 were
both debonded 8 db below the surface of the concrete. Thus, the bar was anchored farther
in the grouted ducts, reducing the demand on the concrete and grout near the surface.
These measured displacements also confirmed the visual observations of radial cracking
and flaking in specimen AD8-FB and a lack of radial cracking in the other two.
In addition, the displacement of the bar at a given bar stress was less in AD8-FB
because the bar was fully bonded at the surface. The debonded region in AD8-D1 and
AD8-D1 allowed the bar to freely elongate over 8 db, making the system slightly more
flexible.
D-16
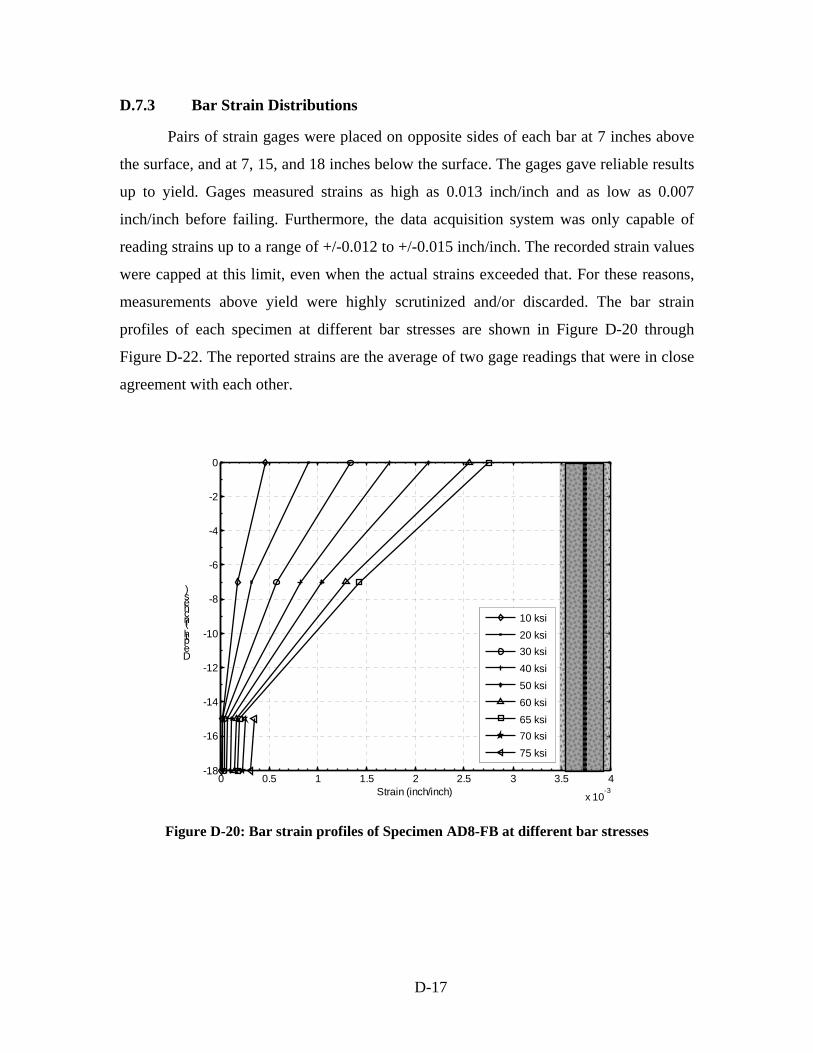
D.7.3 Bar Strain Distributions
Pairs of strain gages were placed on opposite sides of each bar at 7 inches above
the surface, and at 7, 15, and 18 inches below the surface. The gages gave reliable results
up to yield. Gages measured strains as high as 0.013 inch/inch and as low as 0.007
inch/inch before failing. Furthermore, the data acquisition system was only capable of
reading strains up to a range of +/-0.012 to +/-0.015 inch/inch. The recorded strain values
were capped at this limit, even when the actual strains exceeded that. For these reasons,
measurements above yield were highly scrutinized and/or discarded. The bar strain
profiles of each specimen at different bar stresses are shown in Figure D-20 through
Figure D-22. The reported strains are the average of two gage readings that were in close
agreement with each other.
0 0.5 1 1.5 2 2.5 3 3.5 4 Strain (inch/inch) -3
x 10
Figure D-20: Bar strain profiles of Specimen AD8-FB at different bar stresses
-18
-16
-14
-12
-10
-8
-6
-4
-2
0
Depth(in che s)
10 ksi 20 ksi 30 ksi 40 ksi 50 ksi 60 ksi 65 ksi 70 ksi 75 ksi
D-17
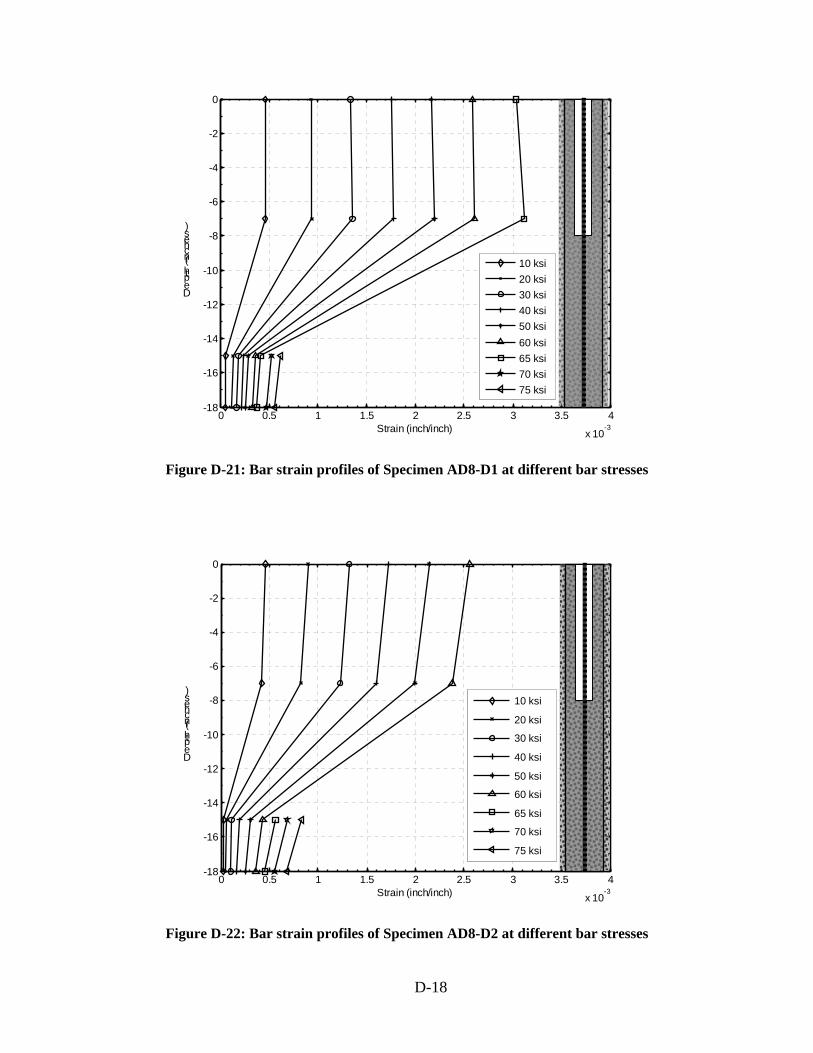
-18
-16
-14
-12
-10
-8
-6
-4
-2
0
Depth(in che s)
10 ksi 20 ksi 30 ksi 40 ksi 50 ksi 60 ksi 65 ksi 70 ksi 75 ksi
0 0.5 1 1.5 2 2.5 3 3.5 4 Strain (inch/inch) -3
x 10
Figure D-21: Bar strain profiles of Specimen AD8-D1 at different bar stresses
-18
-16
-14
-12
-10
-8
-6
-4
-2
0
Depth(in che s)
10 ksi
20 ksi
30 ksi
40 ksi
50 ksi
60 ksi
65 ksi
70 ksi
75 ksi
0 0.5 1 1.5 2 2.5 3 3.5 4 Strain (inch/inch) -3
x 10
Figure D-22: Bar strain profiles of Specimen AD8-D2 at different bar stresses
D-18
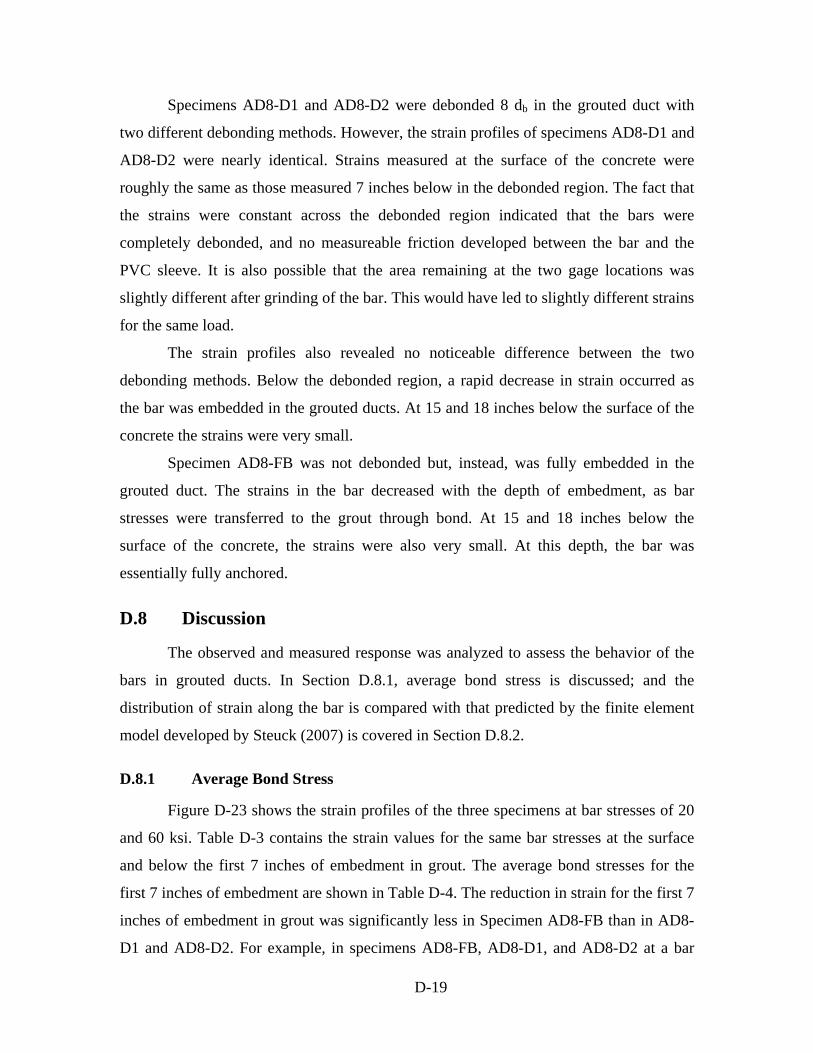
Specimens AD8-D1 and AD8-D2 were debonded 8 db in the grouted duct with
two different debonding methods. However, the strain profiles of specimens AD8-D1 and
AD8-D2 were nearly identical. Strains measured at the surface of the concrete were
roughly the same as those measured 7 inches below in the debonded region. The fact that
the strains were constant across the debonded region indicated that the bars were
completely debonded, and no measureable friction developed between the bar and the
PVC sleeve. It is also possible that the area remaining at the two gage locations was
slightly different after grinding of the bar. This would have led to slightly different strains
for the same load.
The strain profiles also revealed no noticeable difference between the two
debonding methods. Below the debonded region, a rapid decrease in strain occurred as
the bar was embedded in the grouted ducts. At 15 and 18 inches below the surface of the
concrete the strains were very small.
Specimen AD8-FB was not debonded but, instead, was fully embedded in the
grouted duct. The strains in the bar decreased with the depth of embedment, as bar
stresses were transferred to the grout through bond. At 15 and 18 inches below the
surface of the concrete, the strains were also very small. At this depth, the bar was
essentially fully anchored.
D.8 Discussion
The observed and measured response was analyzed to assess the behavior of the
bars in grouted ducts. In Section D.8.1, average bond stress is discussed; and the
distribution of strain along the bar is compared with that predicted by the finite element
model developed by Steuck (2007) is covered in Section D.8.2.
D.8.1 Average Bond Stress
Figure D-23 shows the strain profiles of the three specimens at bar stresses of 20
and 60 ksi. Table D-3 contains the strain values for the same bar stresses at the surface
and below the first 7 inches of embedment in grout. The average bond stresses for the
first 7 inches of embedment are shown in Table D-4. The reduction in strain for the first 7
inches of embedment in grout was significantly less in Specimen AD8-FB than in AD8-
D1 and AD8-D2. For example, in specimens AD8-FB, AD8-D1, and AD8-D2 at a bar
D-19
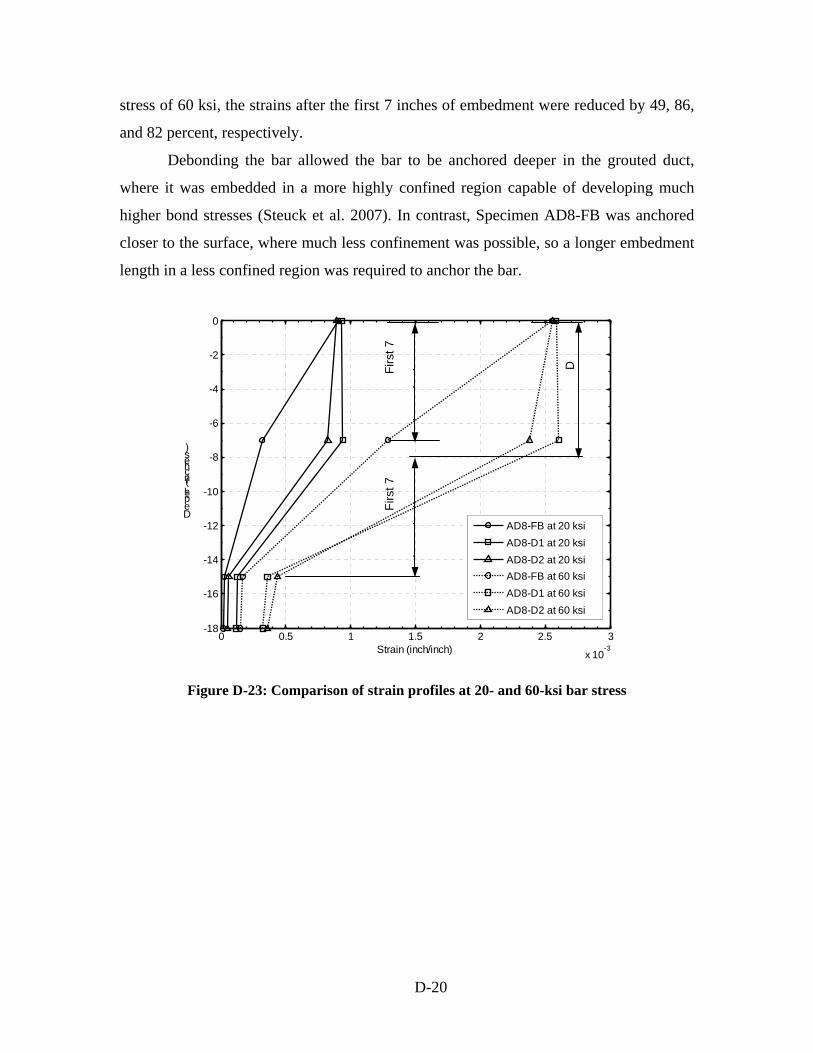
tt
stress of 60 ksi, the strains after the first 7 inches of embedment were reduced by 49, 86,
and 82 percent, respectively.
Debonding the bar allowed the bar to be anchored deeper in the grouted duct,
where it was embedded in a more highly confined region capable of developing much
higher bond stresses (Steuck et al. 2007). In contrast, Specimen AD8-FB was anchored
closer to the surface, where much less confinement was possible, so a longer embedment
length in a less confined region was required to anchor the bar.
0
-2
-4
-6
)s -8ehcn(ih -10 tpeD
-12
-14
-16
-18
Strain (inch/inch) 0 0.5 1 1.5 2 2.5 3
AD8-FB at 20 ksi AD8-D1 at 20 ksi AD8-D2 at 20 ksi AD8-FB at 60 ksi AD8-D1 at 60 ksi AD8-D2 at 60 ksi
Firs
t 7
i b
d
DFirs
t 7
i b
d
-3x 10
Figure D-23: Comparison of strain profiles at 20- and 60-ksi bar stress
D-20
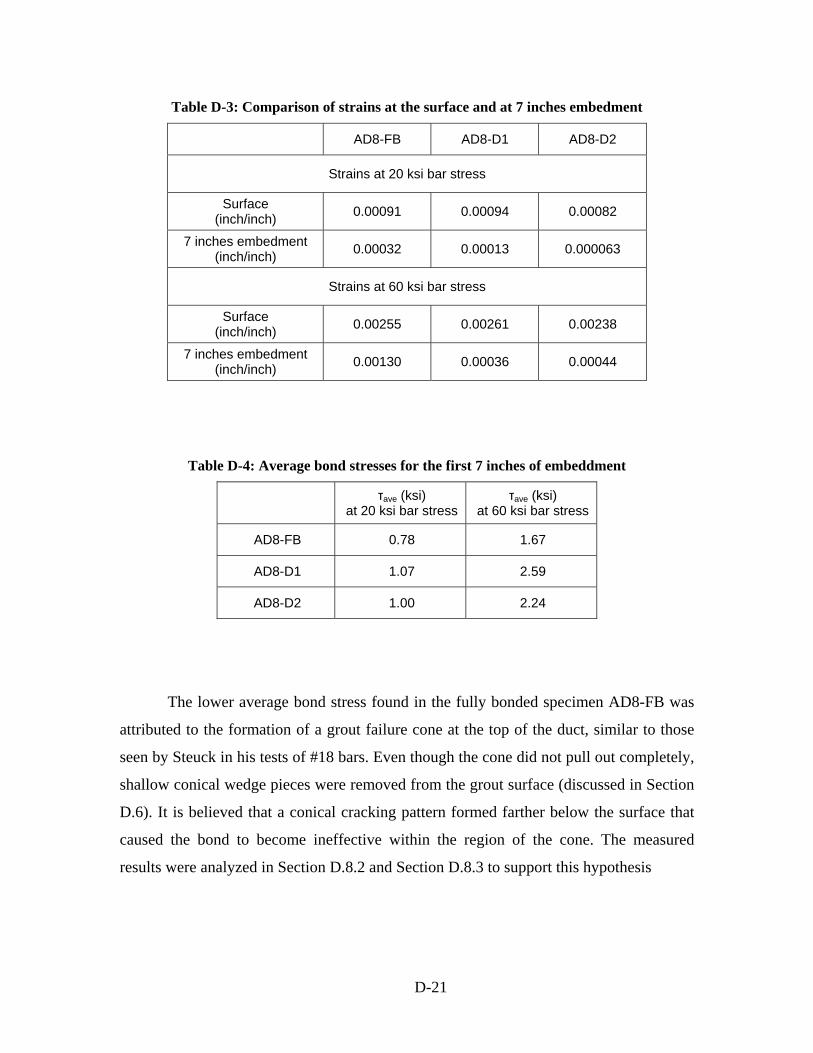
Table D-3: Comparison of strains at the surface and at 7 inches embedment
AD8-FB AD8-D1 AD8-D2
Strains at 20 ksi bar stress
Surface (inch/inch) 0.00091 0.00094 0.00082
7 inches embedment (inch/inch) 0.00032 0.00013 0.000063
Strains at 60 ksi bar stress
Surface (inch/inch) 0.00255 0.00261 0.00238
7 inches embedment (inch/inch) 0.00130 0.00036 0.00044
Table D-4: Average bond stresses for the first 7 inches of embeddment
τave (ksi) at 20 ksi bar stress
τave (ksi) at 60 ksi bar stress
AD8-FB 0.78 1.67
AD8-D1 1.07 2.59
AD8-D2 1.00 2.24
The lower average bond stress found in the fully bonded specimen AD8-FB was
attributed to the formation of a grout failure cone at the top of the duct, similar to those
seen by Steuck in his tests of #18 bars. Even though the cone did not pull out completely,
shallow conical wedge pieces were removed from the grout surface (discussed in Section
D.6). It is believed that a conical cracking pattern formed farther below the surface that
caused the bond to become ineffective within the region of the cone. The measured
results were analyzed in Section D.8.2 and Section D.8.3 to support this hypothesis
D-21
D.8.2 Comparison with Finite Element Modeling
The measured strain distributions (discussed in Section Error! Reference source
not found.) along the length of the bars were compared with the strain distributions
predicted by the nonlinear finite element model developed by Steuck et al. (2007). The
model was developed to simulate the monotonic pullout force-displacement behavior of
large bars grouted into ducts. The model consisted of a series of nonlinear, one-
dimensional bar elements attached to one-dimensional, nonlinear bond springs. It was
based on the assumption that slip, and consequent damage to the bond interface, at one
location, do not affect the stress-slip behavior at another location. The tests were
simulated by incrementing a series of increasing back-end slips and at each increment,
the stress, strain and slip at each node were determined.
The steel constitutive model was based on the one developed by Raynor et al.
(2002). The material parameters for the steel model were taken from the average results
from tensions tests on the #8 bars. The bond models for the portion of bar embedded in
grouted consisted of an unconfined bond model at the front end of the bar over a length
equivalent to a 45-degree cone, and a confined bond model along the remainder of the bar
embedded in grout. The unconfined bond model results in relatively low bond stresses.
For the portion of bar embedded in concrete, Eligehausen’s concrete bond model
(Eligehausen et al. 1983) was applied.
The strain distributions determined from the model for the two stress levels that
were compared in Figure D-23 are shown in Figures D-24 and D-25. The model assumed
that no failure cone formed at the front end of the bonded region in the debonded
specimen, and in the fully bonded specimen at 20 ksi. At a stress of 60 ksi, it assumed
that a 45 degree failure cone (i.e. 2 inches long in the 4 inch duct), with no bond stress,
formed at the front end of the fully bonded specimen. This assumption is based on the
findings by Steuck (2007) from his tests.
D-22
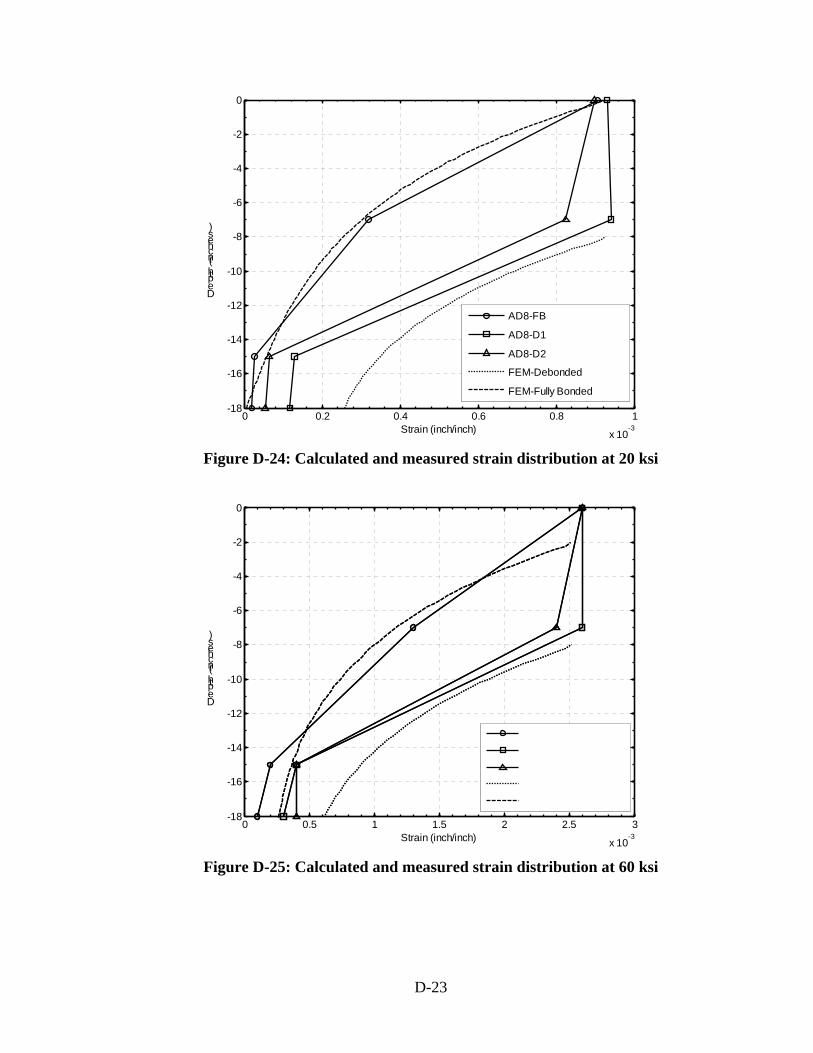
Figure D-24: Calculated and measured strain distribution at 20 ksi
0
-2
-4
-6
)s -8ehcn(ih -10 tpeD
-12
AD8-FB -14 AD8-D1
AD8-D2 -16 FEM-Debonded
FEM-Fully Bonded -18
Strain (inch/inch)
-4
-2
0
-6
Depth(in che s)
-10
-8
-12 AD8-FB
-14 AD8-D1
AD8-D2
-16 FEM-Debonded
FEM-Fully Bonded -18
0 0.2 0.4 0.6 0.8 1 Strain (inch/inch) x 10
-3
0 0.5 1 1.5 2 2.5 -3
x 10
Figure D-25: Calculated and measured strain distribution at 60 ksi
D-23
3
The model predicted the strain distribution relatively well. The model was
extremely accurate in simulating the fully bonded specimen at both 20 and 60 ksi steel
stress. For specimens AD8-D1 and AD8-D2, the calculated strains were typically about
two times larger than the measured strains. However, the measured values were small,
averaging approximately 15 percent of yeild. The fact that the calculated strains were
larger suggests that the bond stresses in the specimens were greater than those predicted
by the model and, thus, the model is conservative. This is particularly true because in the
test specimen bond is inevitably lost due to the protection over the gages, and this is not
taken into account into the model. Considering the small strain values in question, the
model predicted the strain distributions reasonably well.
Furthermore, some of the difference comes from the fact that straight lines were
used to connect the measured strains. Straight lines are used to interpolate between the
measured points because that is the least biased representation. The lines do not reflect
the actual strain at intermediate points. In Specimen AD8-FB, the lines are inconsistent
with the assumption of the cone failure at the front end because the strain 2 inches below
the interface was not measured. However the model assumes no strain reduction occurs
within the cone failure.
D.9 Summary and Conclusions
Three monotonic pullout tests were conducted to more closely investigate the
anchorage conditions in the three precast subassembly tests. The pullout specimens
consisted of a #8 bar anchored 17.5 inches in a 4-inch grouted duct and further embedded
18.5 inches in concrete. Two specimens were debonded 8 db with two different methods
of local debonding. The results from these tests revealed several conclusions:
� The front-end force-displacement of the bar was primarily governed by the stress-
strain response of steel because the bar was fully anchored.
� Debonding the bar 8 db added flexibility to the system by allowing the bar to
freely elongate over the deboned region.
D-24
� There was no measurable difference between the two debonding methods. Strains
across the debonded region were nearly constant, indicating that the bars were
debonded and no friction developed between the bar and PVC sleeve.
� Debonding the bar 8 db reduced and/or eliminated the damage to the surface of the
grout and concrete. Measured displacements at the surface confirmed this by
indicating that displacement of the concrete, duct, and grout in the two debonded
specimens were negligible.
� Debonding the bar allowed the bar to be anchored deeper in the grouted ducts in a
more highly confined region capable of developing much higher bond stresses.
Thus the bar can be anchored in a shorter length of embedment than in an
unconfined region at that surface. This also means that a fully bonded bar will
debond itself by a length roughly equal to the diameter of the duct at the front
end, which occurs from a cone failure at the surface.
D.10 References
Eligehausen, R., Popov, E., and Bertero, V. (1983). “Local Bond Stress-Slip Relationships of Deformed Bars Under Generalized Excitations.” Earthquake Engineering Research Center, Report UCB/EERC-83/23, University of California, Berkeley, CA.
Raynor, D.J., Lehman, D.L. and Stanton, J.F. (2002). “Bond-Slip Response of Reinforcing Bars Grouted in Ducts.” ACI Structural Journal 99(5), Sept. pp 568-576.
Steuck, Kyle P., Pang, Jason B.K., Stanton, John F., and Eberhard Marc O. (2007) “Anchorage of Large Bars in Grouted Ducts.” Washington State Department of Transportation Report No. WA-RD 684.1, Washington State Transportation Center.
D-25
Recommended