Royce Larsen
UC Cooperative Extension
Thank you to all that have helped
on this project, and to all the
landowners
Rangeland Management and Erosion Prevention Workshop
Thursday, September 5, 2019
Heritage RanchChanging Forage Conditions and Drought (2001-2019), Production and
Nutrients
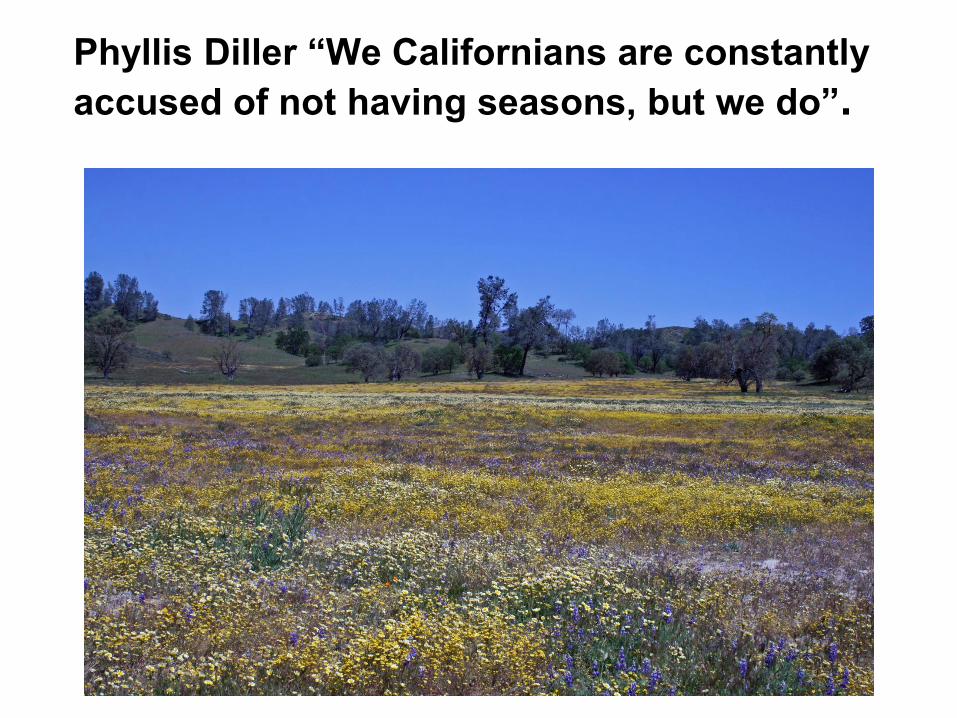
Phyllis Diller “We Californians are constantly
accused of not having seasons, but we do”.
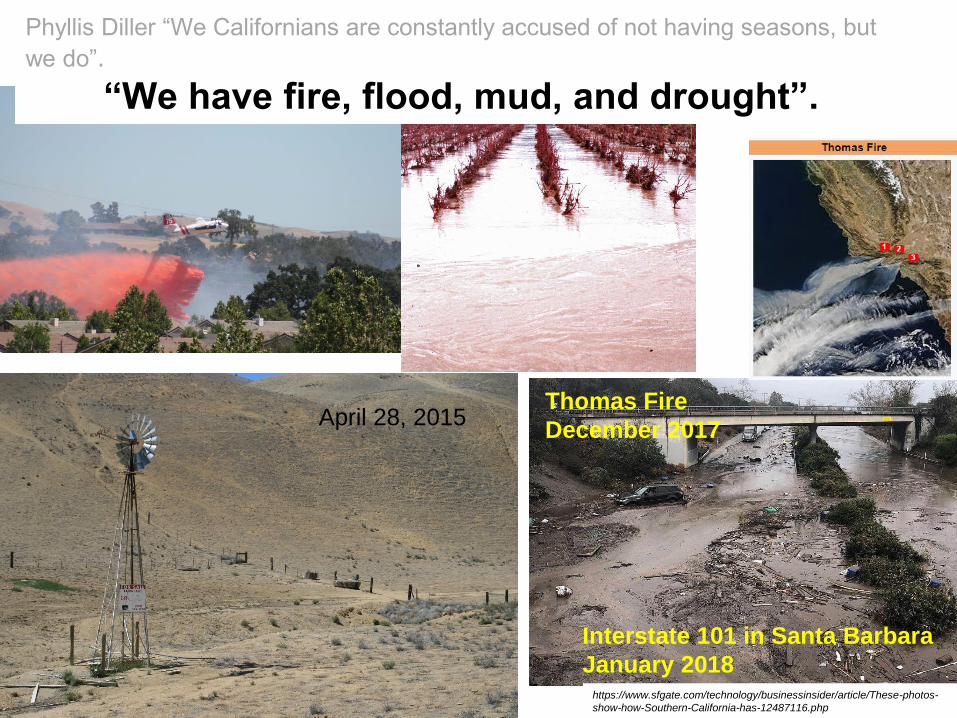
Phyllis Diller “We Californians are constantly accused of not having seasons, but
we do”.
“We have fire, flood, mud, and drought”.
Peak Forage Production April 2014 Thomas Fire
December 2017
Interstate 101 in Santa Barbara
January 2018https://www.sfgate.com/technology/businessinsider/article/These-photos-
show-how-Southern-California-has-12487116.php
April 28, 2015
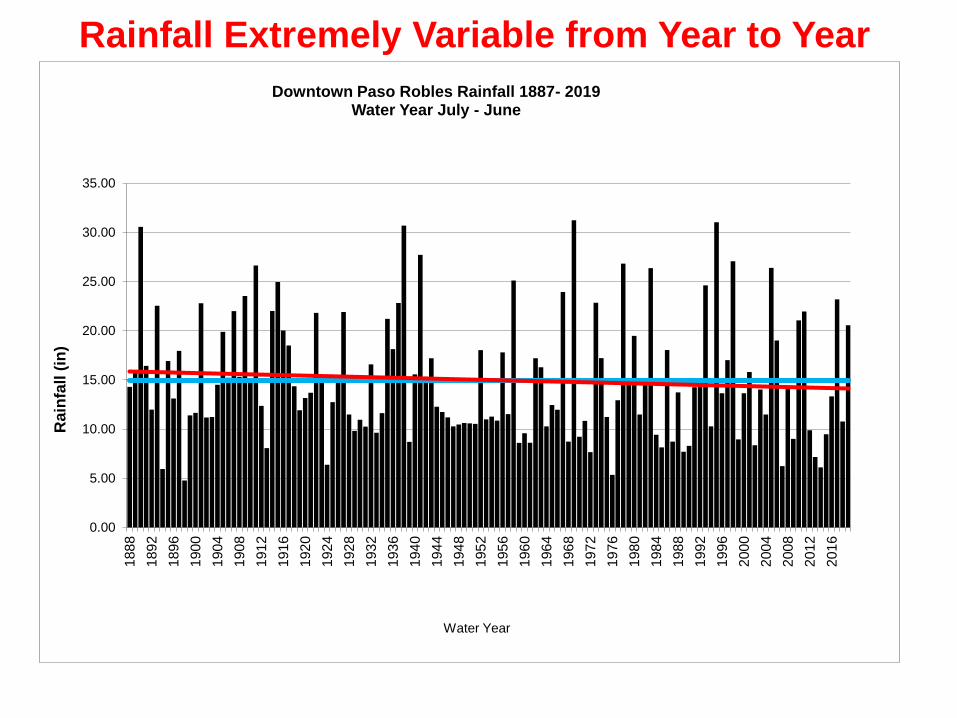
Rainfall Extremely Variable from Year to Year
0.00
5.00
10.00
15.00
20.00
25.00
30.00
35.00
188
8
189
2
189
6
190
0
190
4
190
8
191
2
191
6
192
0
192
4
192
8
193
2
193
6
194
0
194
4
194
8
1952
195
6
196
0
1964
196
8
197
2
197
6
198
0
198
4
198
8
199
2
199
6
200
0
200
4
200
8
201
2
201
6
Rain
fall
(in
)
Water Year
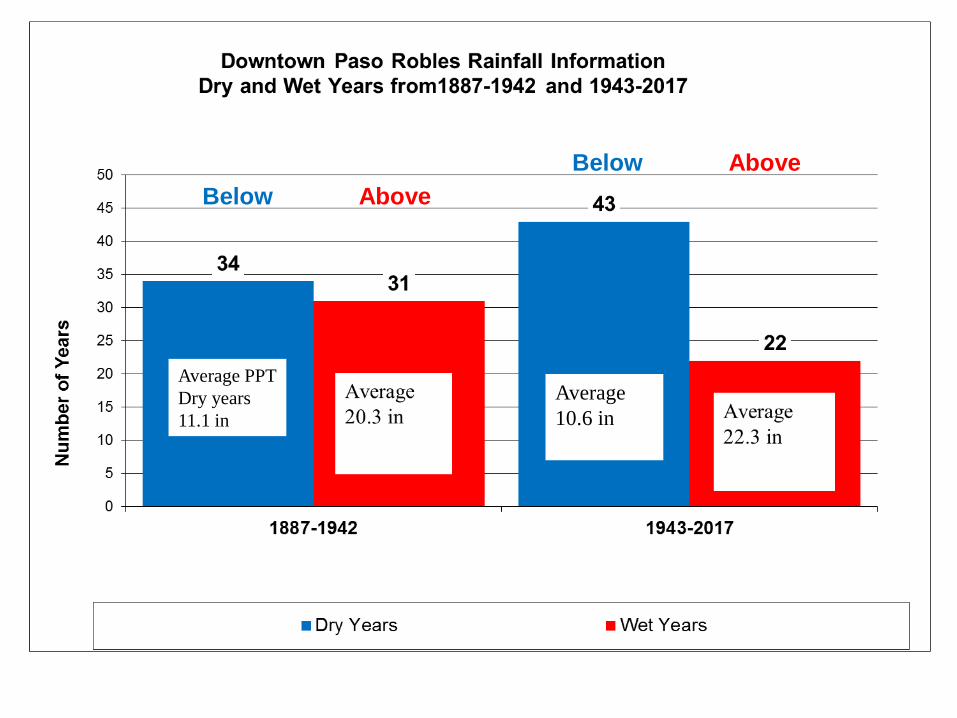
Downtown Paso Robles Rainfall 1887- 2019Water Year July - June
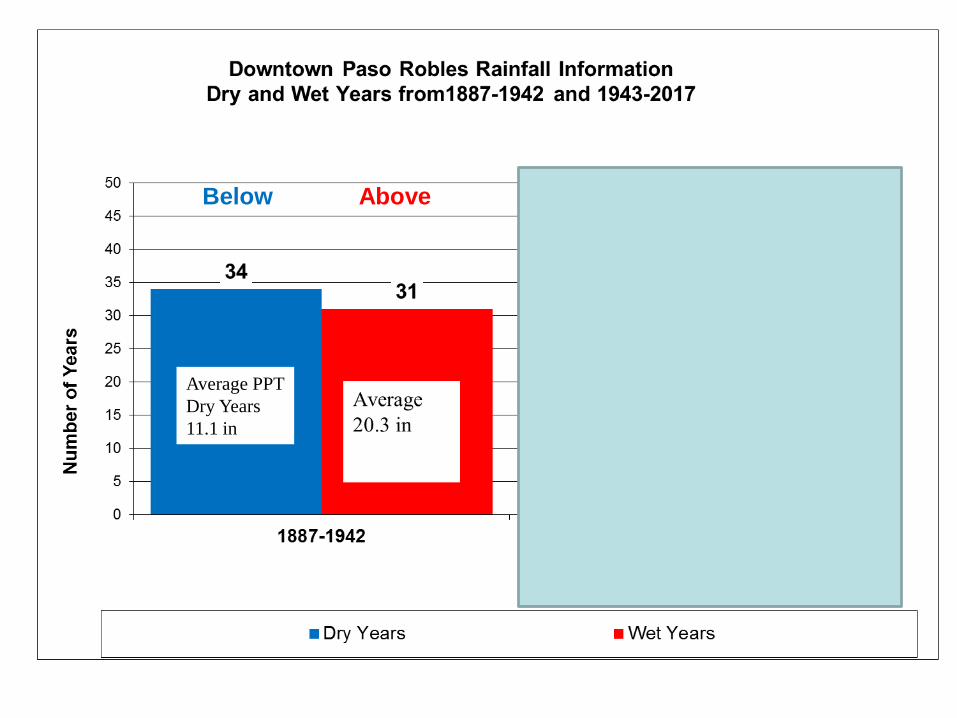
34 years
52% 31 years
48%
Average PPT
Wet Years
20.4 in
Average PPT
Dry Years
11.1 in
Average
10.6 in
Below Above
34 years
52% 31 years
48%
Average PPT
Wet Years
20.4 in
Average PPT
Dry Years
11.1 in
34 Dry
Years 52% 31 Wet
Years 48%
43 Dry
Years 66%
22 Wet
Years 34%
Average PPT
Dry Years
10.6 in
Average PPT
Wet Years
22.3 in
52%48%
66%
34%Average PPT
Dry years
11.1 in
Average
10.6 in
Below Above
Below Above
0
1
2
3
4
5
6
7
8
9
10
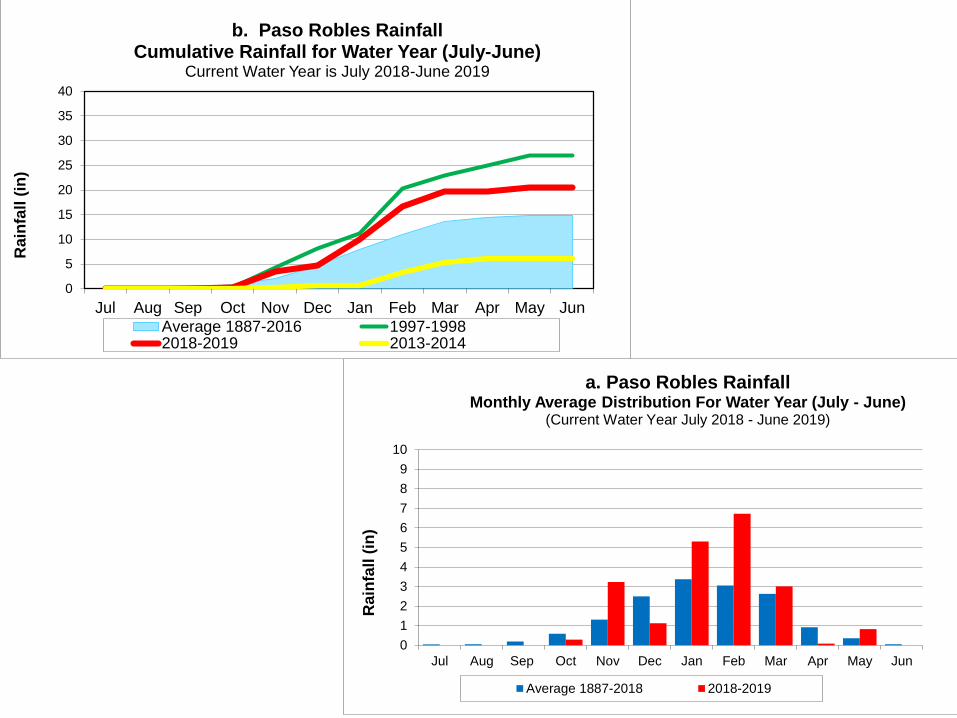
Jul Aug Sep Oct Nov Dec Jan Feb Mar Apr May Jun
Rain
fall
(in
) a. Paso Robles Rainfall
Monthly Average Distribution For Water Year (July - June)(Current Water Year July 2018 - June 2019)
Average 1887-2018 2018-2019
0
5
10
15
20
25
30
35
40
Jul Aug Sep Oct Nov Dec Jan Feb Mar Apr May Jun
Rain
fall
(in
) b. Paso Robles Rainfall
Cumulative Rainfall for Water Year (July-June)Current Water Year is July 2018-June 2019
Average 1887-2016 1997-19982018-2019 2013-2014
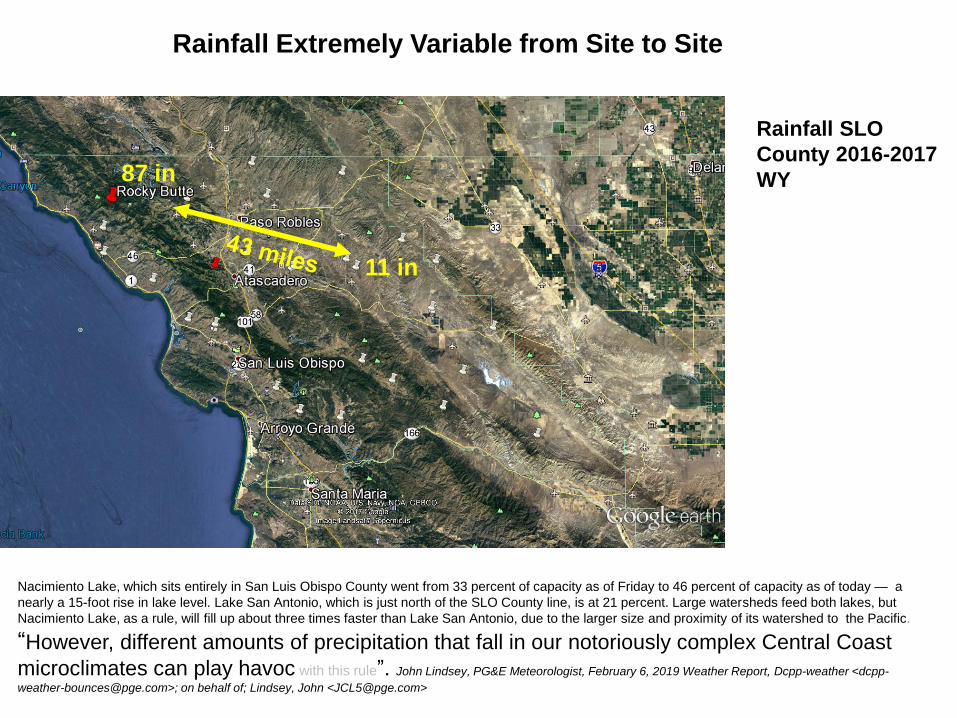
87 in
11 in
Rainfall SLO
County 2016-2017
WY
Rainfall Extremely Variable from Site to Site
Nacimiento Lake, which sits entirely in San Luis Obispo County went from 33 percent of capacity as of Friday to 46 percent of capacity as of today — a
nearly a 15-foot rise in lake level. Lake San Antonio, which is just north of the SLO County line, is at 21 percent. Large watersheds feed both lakes, but
Nacimiento Lake, as a rule, will fill up about three times faster than Lake San Antonio, due to the larger size and proximity of its watershed to the Pacific.
“However, different amounts of precipitation that fall in our notoriously complex Central Coast
microclimates can play havoc with this rule”. John Lindsey, PG&E Meteorologist, February 6, 2019 Weather Report, Dcpp-weather <dcpp-
[email protected]>; on behalf of; Lindsey, John <[email protected]>
-2.5
-2
-1.5
-1
-0.5
0
0.5
1
1.5
2
2.5
19941995199619971998199920002001200220032004200520062007200820092010201120122013
Ra
in &
Tem
per
atu
re I
nd
ex
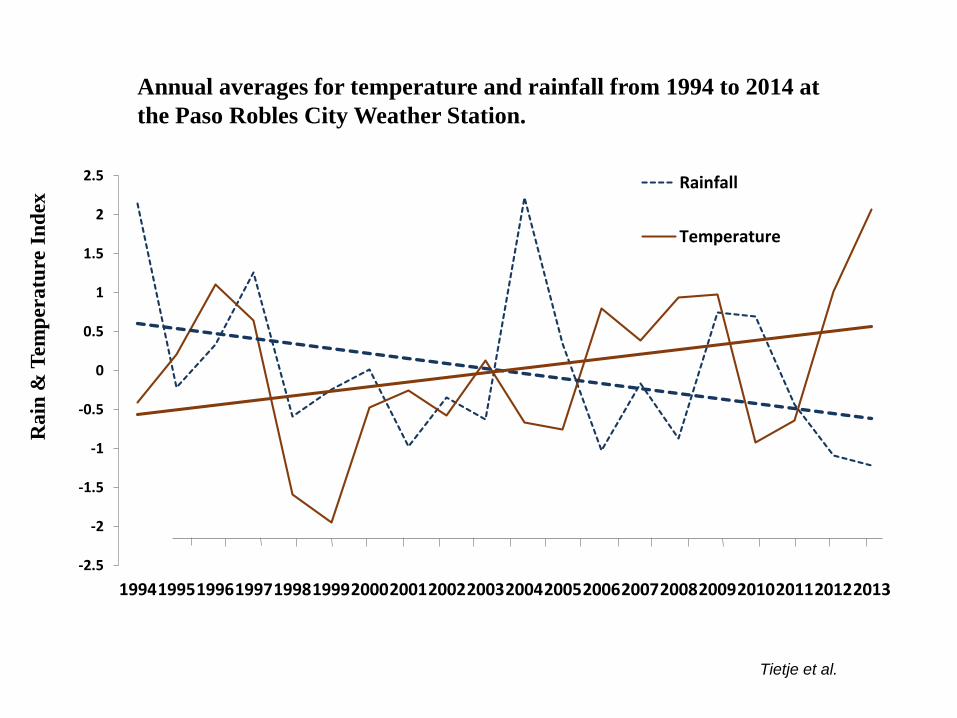
Rainfall
Temperature
Annual averages for temperature and rainfall from 1994 to 2014 at
the Paso Robles City Weather Station.
Tietje et al.
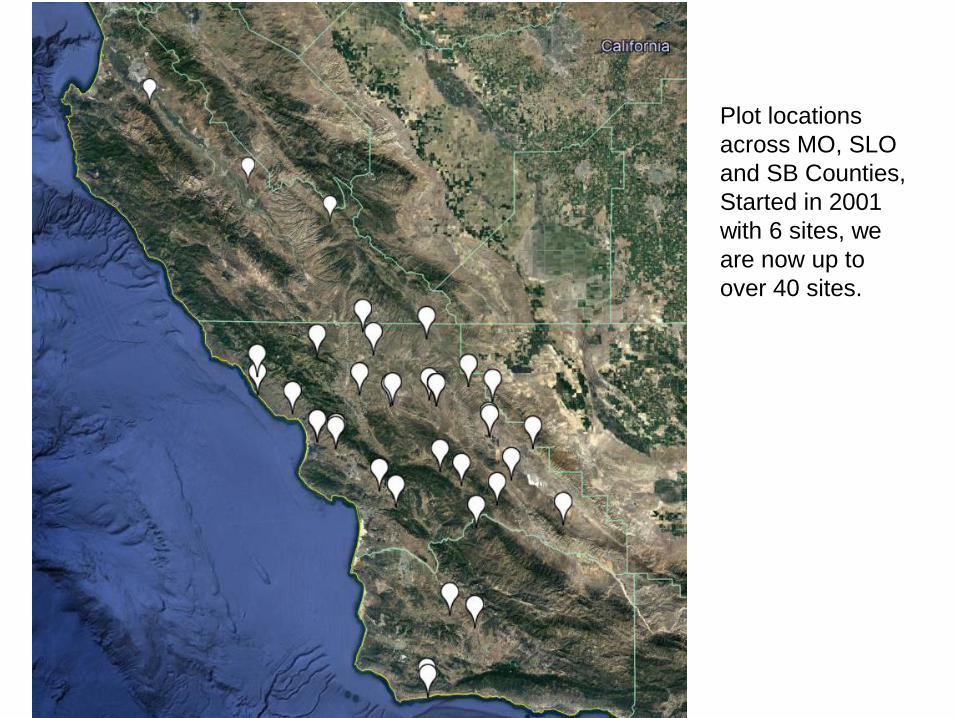
Plot locations
across MO, SLO
and SB Counties,
Started in 2001
with 6 sites, we
are now up to
over 40 sites.
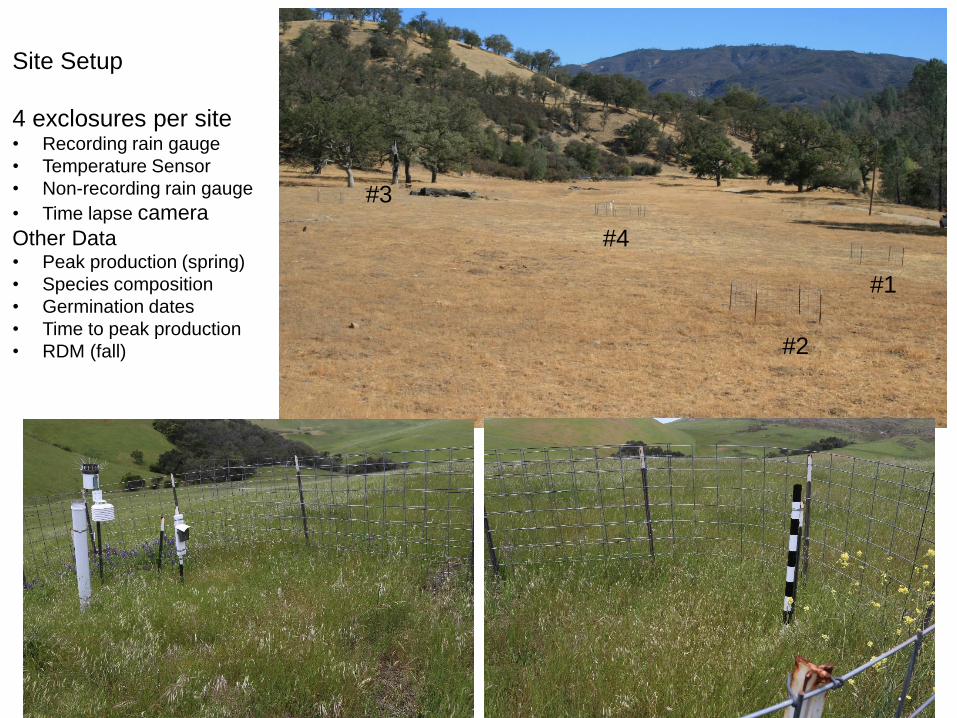
#1
#2
#3
#4
Site Setup
4 exclosures per site• Recording rain gauge
• Temperature Sensor
• Non-recording rain gauge
• Time lapse camera
Other Data• Peak production (spring)
• Species composition
• Germination dates
• Time to peak production
• RDM (fall)
0
5
10
15
Jul Aug Sep Oct Nov Dec Jan Feb Mar Apr May Jun
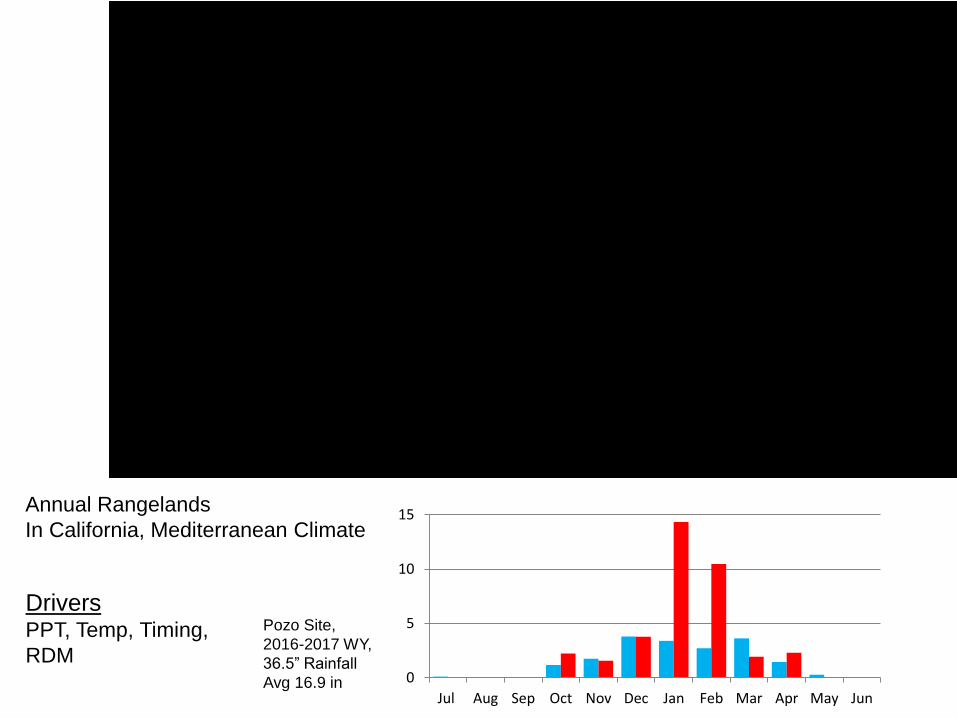
Annual Rangelands
In California, Mediterranean Climate
Pozo Site,
2016-2017 WY,
36.5” Rainfall
Avg 16.9 in
DriversPPT, Temp, Timing,
RDM
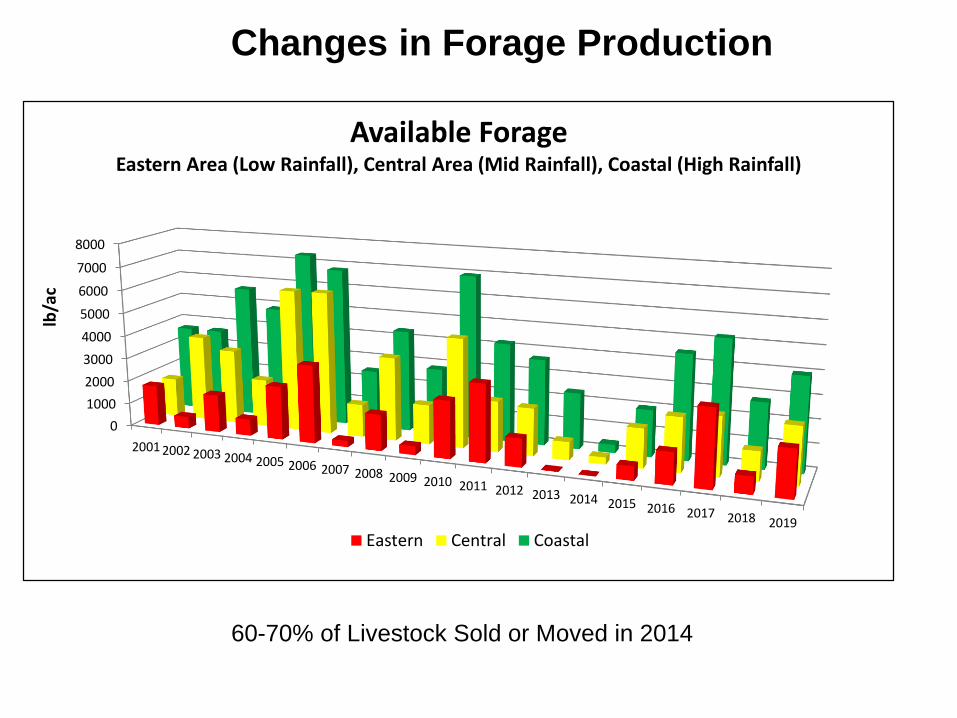
60-70% of Livestock Sold or Moved in 2014
Changes in Forage Production
0
1000
2000
3000
4000
5000
6000
7000
8000
2001 2002 2003 2004 2005 2006 2007 2008 2009 2010 2011 2012 2013 2014 2015 2016 2017 2018 2019
lb/a
c
Available ForageEastern Area (Low Rainfall), Central Area (Mid Rainfall), Coastal (High Rainfall)
Eastern Central Coastal
Variation from Coastal To Eastern
Spring 2006 10,200 lbs/ac
Spring 2014 3100 lbs/ac
Spring 2006 4000 lbs/ac
Spring 2014 31 lbs/ac
Coast Eastern
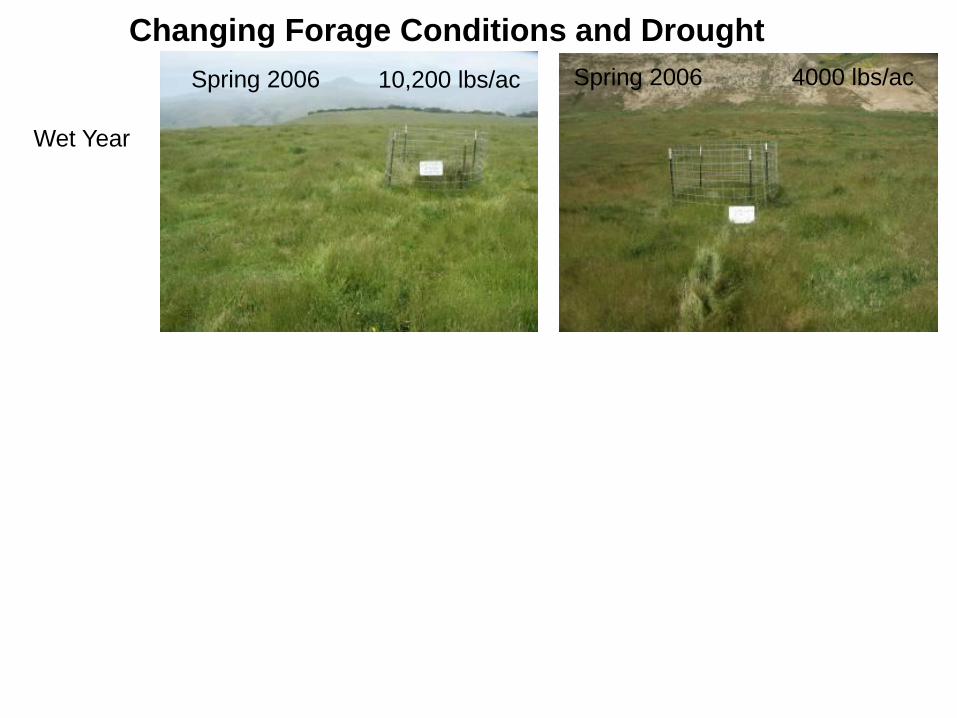
Changing Forage Conditions and Drought
Variation at the same site, from one year to the next
Wet Year
Dry Year
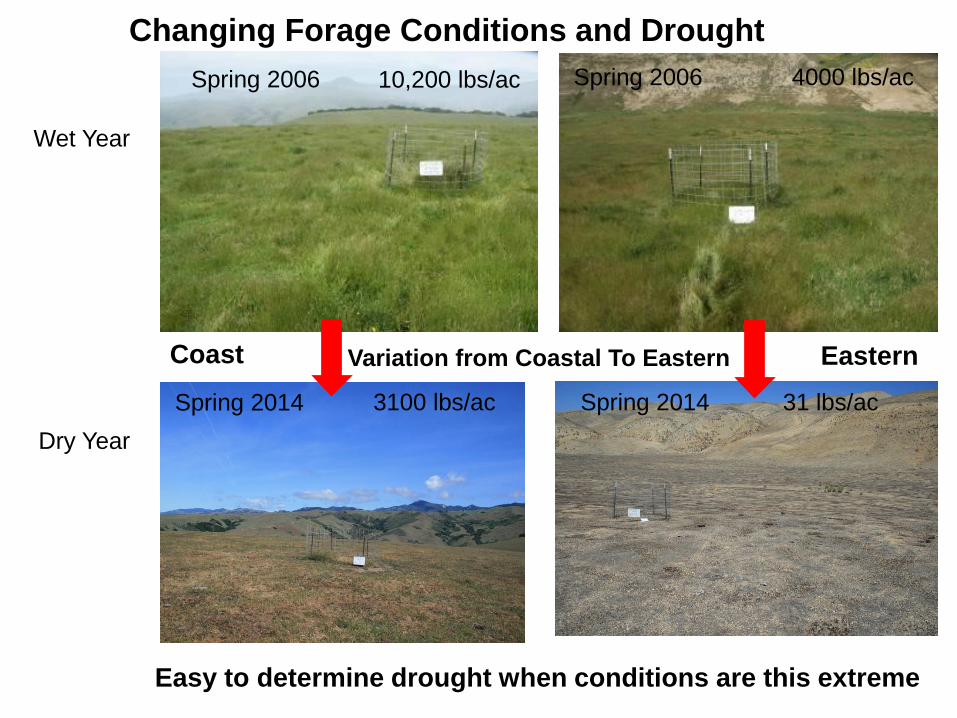
Variation from Coastal To Eastern
Spring 2006 10,200 lbs/ac
Spring 2014 3100 lbs/ac
Spring 2006 4000 lbs/ac
Spring 2014 31 lbs/ac
Coast Eastern
Changing Forage Conditions and Drought
Easy to determine drought when conditions are this extreme
Wet Year
Dry Year
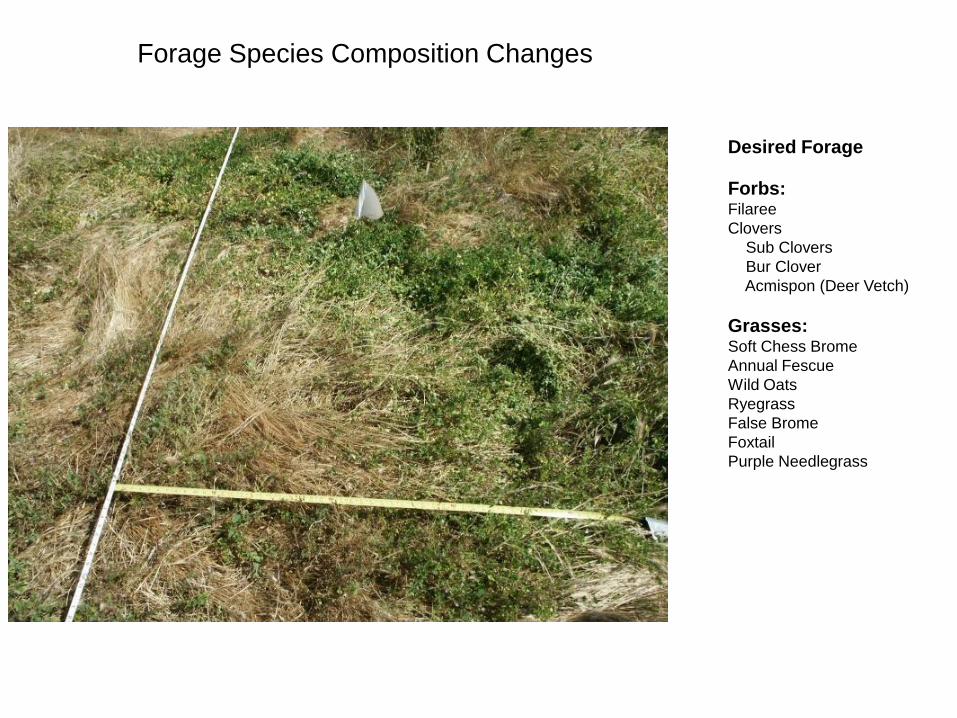
Desired Forage
Forbs:Filaree
Clovers
Sub Clovers
Bur Clover
Acmispon (Deer Vetch)
Grasses:Soft Chess Brome
Annual Fescue
Wild Oats
Ryegrass
False Brome
Foxtail
Purple Needlegrass
Forage Species Composition Changes
0.00
5.00
10.00
15.00
20.00
25.00
0%
10%
20%
30%
40%
50%
60%
70%
80%
90%
100%
2001 2002 2003 2004 2005 2006 2007 2008 2009 2010 2011 2012 2013 2014 2015 2016 2017
Rai
nfa
ll (i
n)
Gra
ss V
s. F
orb
s (%
of
Tota
l)
Year
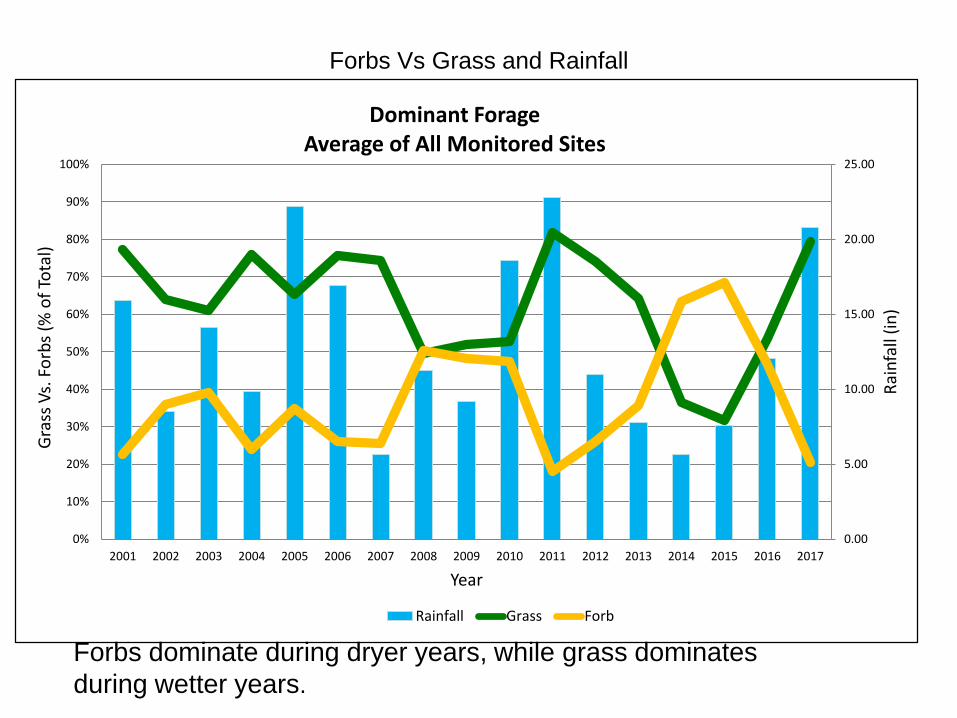
Dominant Forage Average of All Monitored Sites
Rainfall Grass Forb
Forbs dominate during dryer years, while grass dominates
during wetter years.
Forbs Vs Grass and Rainfall
0
50
100
150
200
250
300
350
400
450
500
0.00
1.00
2.00
3.00
4.00
5.00
6.00
7.00
8.00
9.00
10.00
Coast Central East
Rain
fall
(mm
)
Perc
ent
Crude Protein
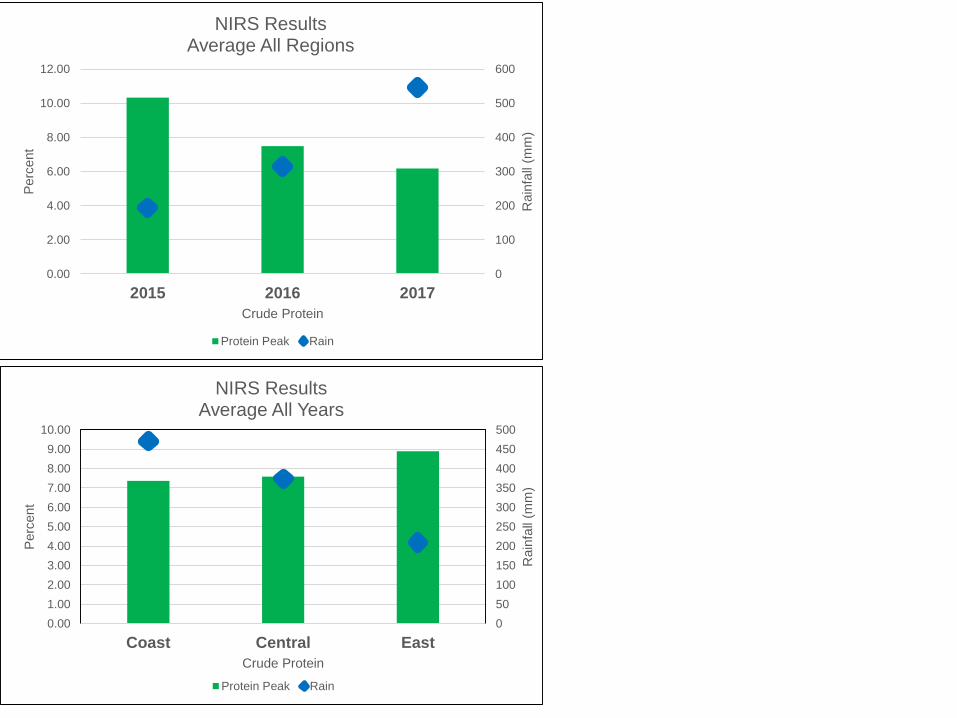
NIRS ResultsAverage All Years
Protein Peak Rain
0
100
200
300
400
500
600
0.00
2.00
4.00
6.00
8.00
10.00
12.00
2015 2016 2017
Rain
fall
(mm
)
Perc
ent
Crude Protein
NIRS ResultsAverage All Regions
Protein Peak Rain
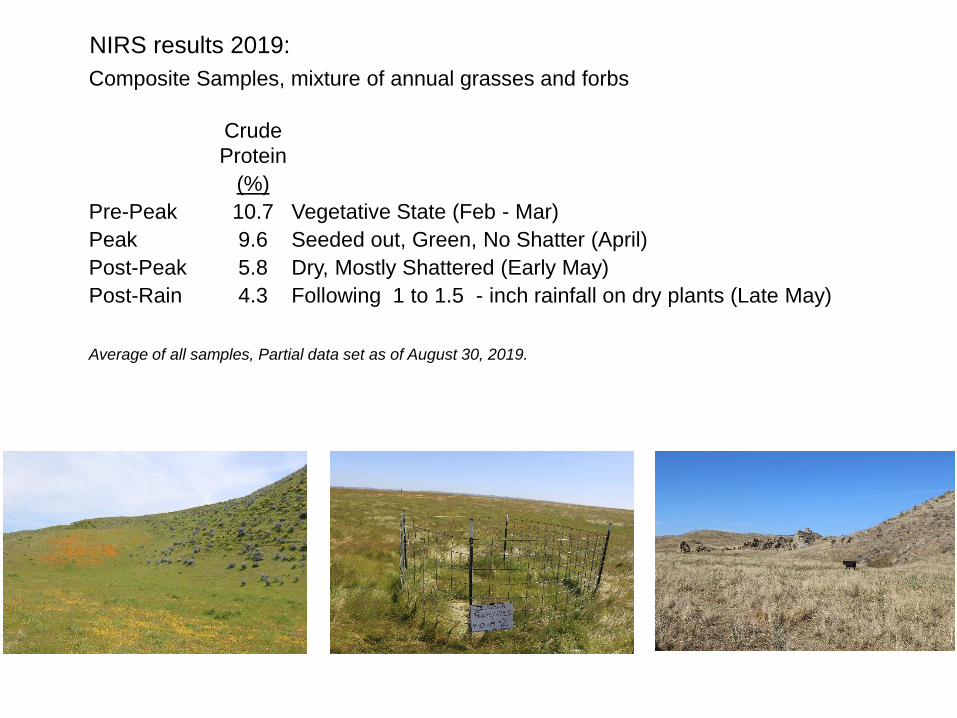
Composite Samples, mixture of annual grasses and forbs
Crude
Protein
(%)
Pre-Peak 10.7 Vegetative State (Feb - Mar)
Peak 9.6 Seeded out, Green, No Shatter (April)
Post-Peak 5.8 Dry, Mostly Shattered (Early May)
Post-Rain 4.3 Following 1 to 1.5 - inch rainfall on dry plants (Late May)
Average of all samples, Partial data set as of August 30, 2019.
NIRS results 2019:
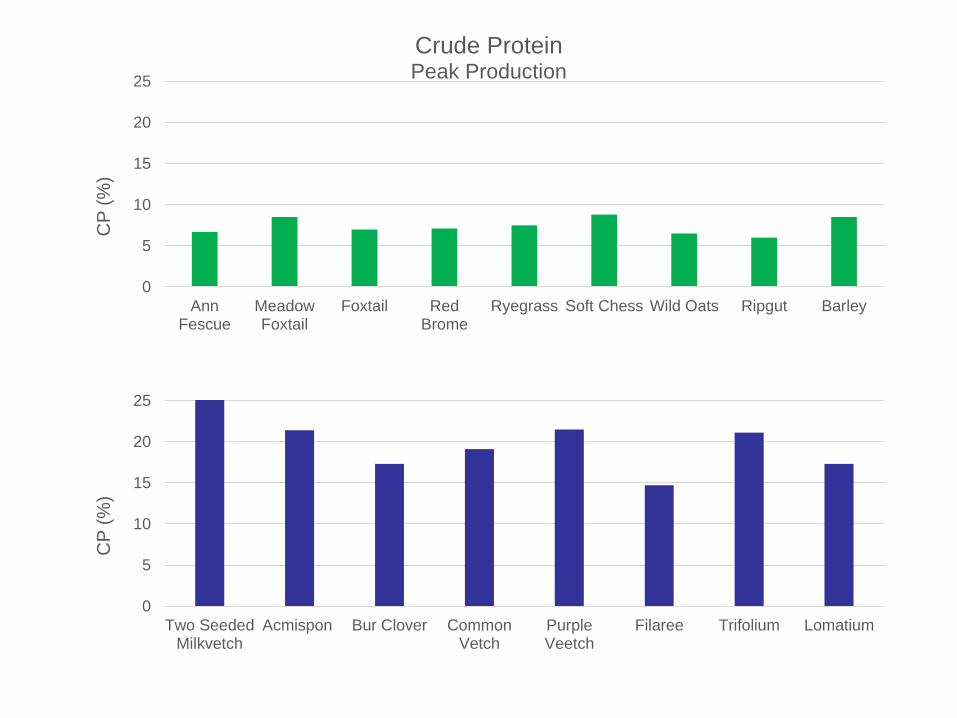
0
5
10
15
20
25
AnnFescue
MeadowFoxtail
Foxtail RedBrome
Ryegrass Soft Chess Wild Oats Ripgut Barley
CP
(%
)
Crude ProteinPeak Production
0
5
10
15
20
25
Two SeededMilkvetch
Acmispon Bur Clover CommonVetch
PurpleVeetch
Filaree Trifolium Lomatium
CP
(%
)
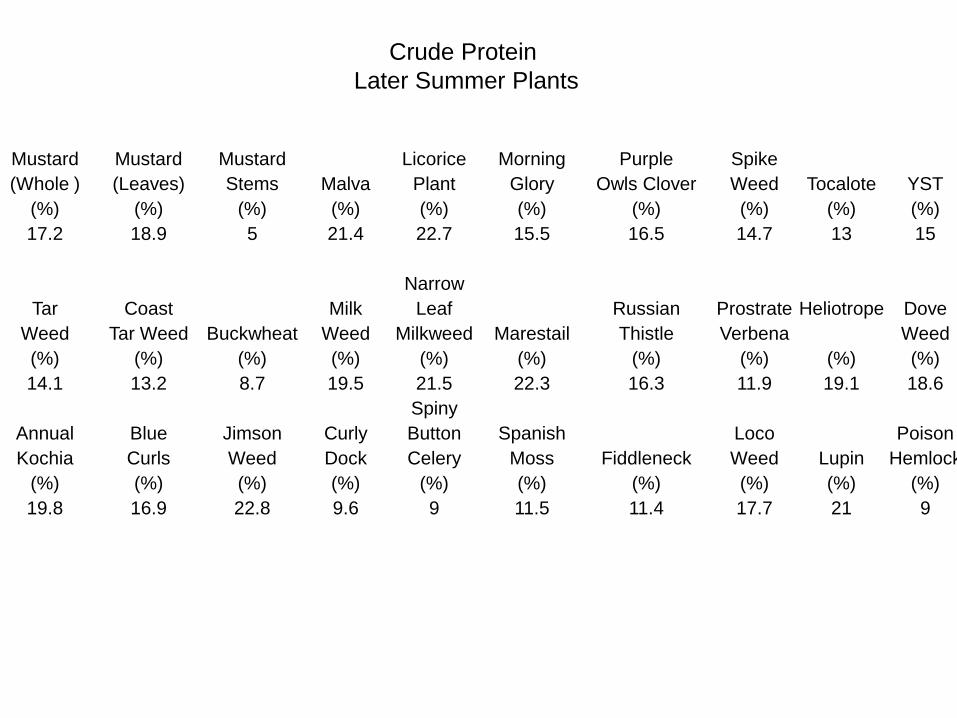
Mustard Mustard Mustard Licorice Morning Purple Spike
(Whole ) (Leaves) Stems Malva Plant Glory Owls Clover Weed Tocalote YST
(%) (%) (%) (%) (%) (%) (%) (%) (%) (%)
17.2 18.9 5 21.4 22.7 15.5 16.5 14.7 13 15
Narrow
Tar Coast Milk Leaf Russian Prostrate Heliotrope Dove
Weed Tar Weed Buckwheat Weed Milkweed Marestail Thistle Verbena Weed
(%) (%) (%) (%) (%) (%) (%) (%) (%) (%)
14.1 13.2 8.7 19.5 21.5 22.3 16.3 11.9 19.1 18.6
Spiny
Annual Blue Jimson Curly Button Spanish Loco Poison
Kochia Curls Weed Dock Celery Moss Fiddleneck Weed Lupin Hemlock
(%) (%) (%) (%) (%) (%) (%) (%) (%) (%)
19.8 16.9 22.8 9.6 9 11.5 11.4 17.7 21 9
Crude Protein
Later Summer Plants
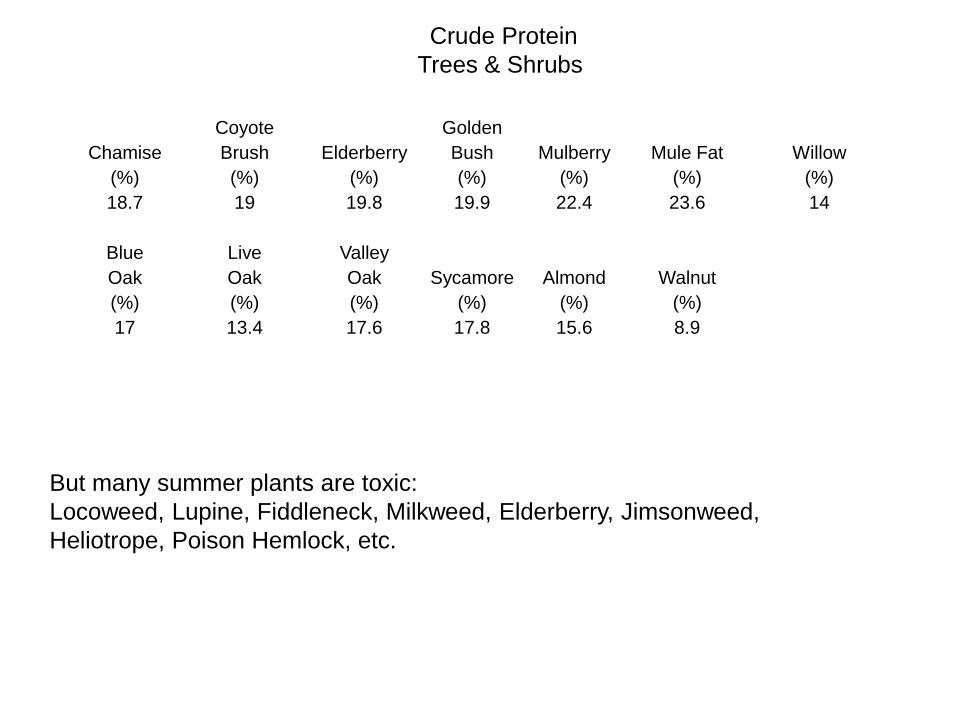
Coyote Golden
Chamise Brush Elderberry Bush Mulberry Mule Fat Willow
(%) (%) (%) (%) (%) (%) (%)
18.7 19 19.8 19.9 22.4 23.6 14
Blue Live Valley
Oak Oak Oak Sycamore Almond Walnut
(%) (%) (%) (%) (%) (%)
17 13.4 17.6 17.8 15.6 8.9
Crude Protein
Trees & Shrubs
But many summer plants are toxic:
Locoweed, Lupine, Fiddleneck, Milkweed, Elderberry, Jimsonweed,
Heliotrope, Poison Hemlock, etc.
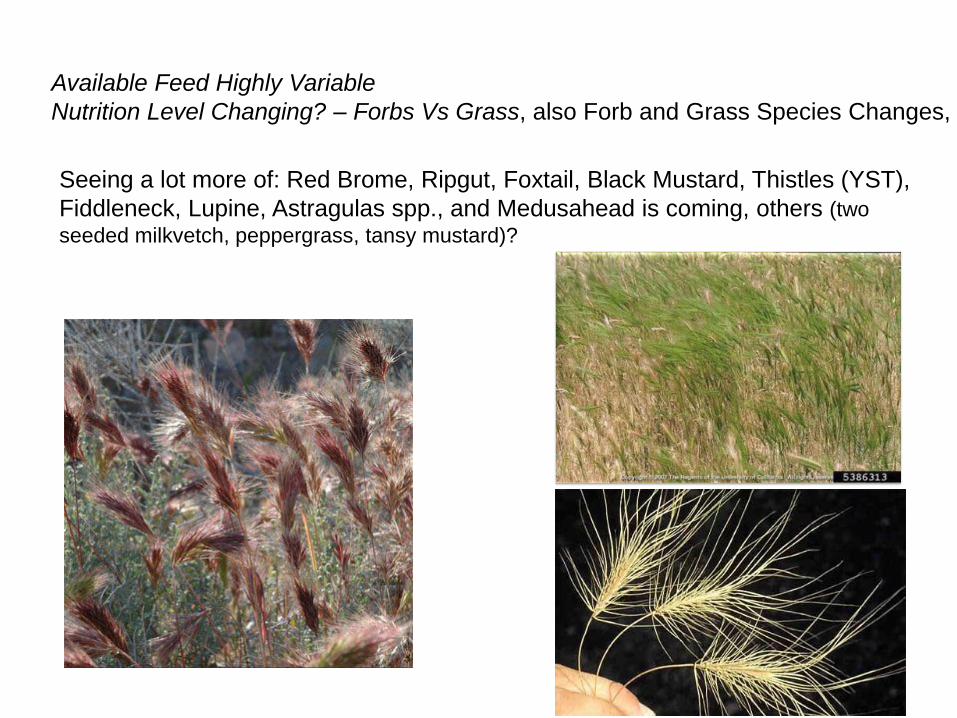
Available Feed Highly Variable
Nutrition Level Changing? – Forbs Vs Grass, also Forb and Grass Species Changes,
Seeing a lot more of: Red Brome, Ripgut, Foxtail, Black Mustard, Thistles (YST),
Fiddleneck, Lupine, Astragulas spp., and Medusahead is coming, others (two
seeded milkvetch, peppergrass, tansy mustard)?
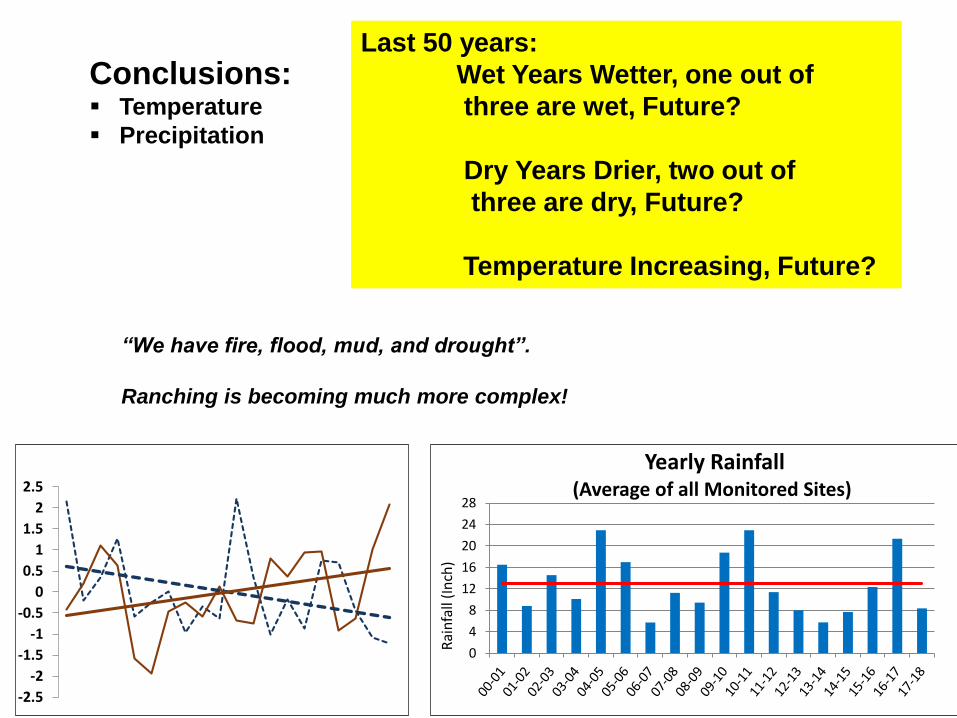
Last 50 years:
Wet Years Wetter, one out of
three are wet, Future?
Dry Years Drier, two out of
three are dry, Future?
Temperature Increasing, Future?
-2.5
-2
-1.5
-1
-0.5
0
0.5
1
1.5
2
2.5
0
4
8
12
16
20
24
28
Rai
nfa
ll (I
nch
)Yearly Rainfall
(Average of all Monitored Sites)
Conclusions:▪ Temperature
▪ Precipitation
“We have fire, flood, mud, and drought”.
Ranching is becoming much more complex!
Recommended