Race, Class, and the Fisher Ruling
Implications of a New Study of Class-Based Affirmative Action
Monday, July 22, 20131:00 EST
An Inside Higher Ed Webinar
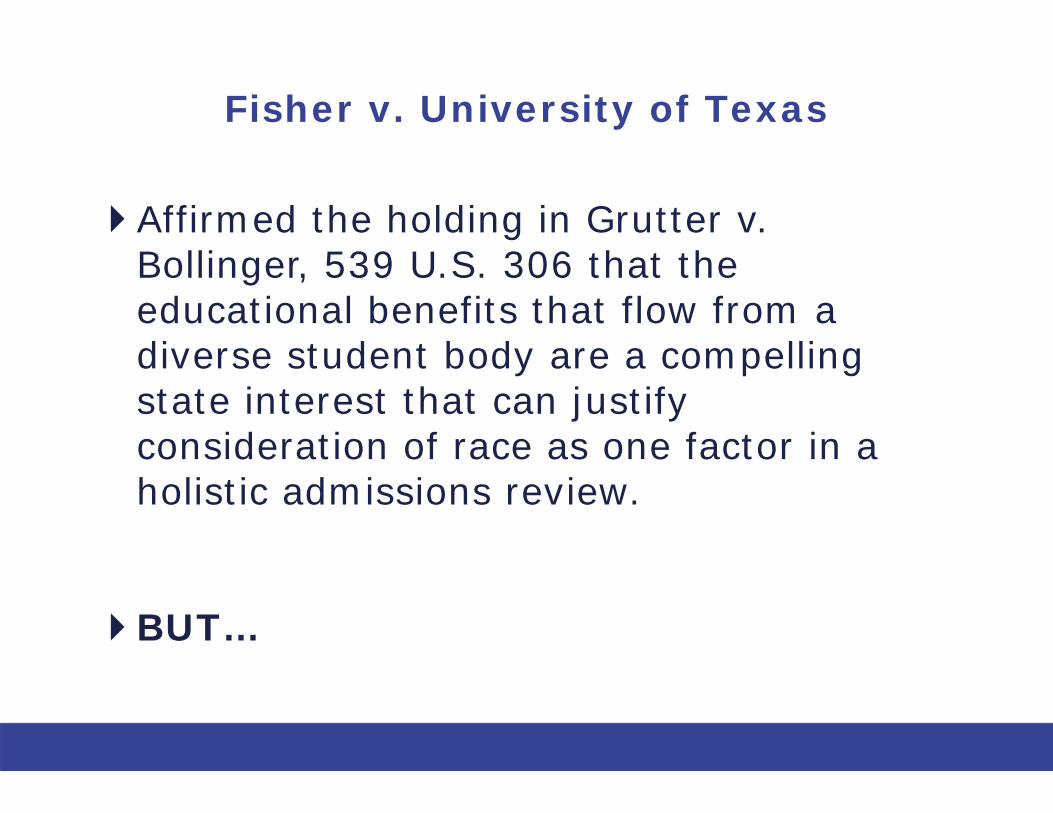
Fisher v. University of Texas
Affirmed the holding in Grutter v. Bollinger, 539 U.S. 306 that the educational benefits that flow from a diverse student body are a compelling state interest that can justify consideration of race as one factor in a holistic admissions review.
BUT…

Fisher v. University of Texas
“Narrow tailoring also requires that the reviewing court verify that it is "necessary" for a university to use race to achieve the educational benefits of diversity. This involves a careful judicial inquiry into whether a university could achieve sufficient diversity without using racial classifications…. The reviewing court must ultimately be satisfied that no workable race-neutral alternatives would produce the educational benefits of diversity.”

Legal Uncertainty
Mixed messages Race can still be considered
But if challenged in litigation, policy may be hard to justify under Fisher’s slightly confusing standard
Activist litigation

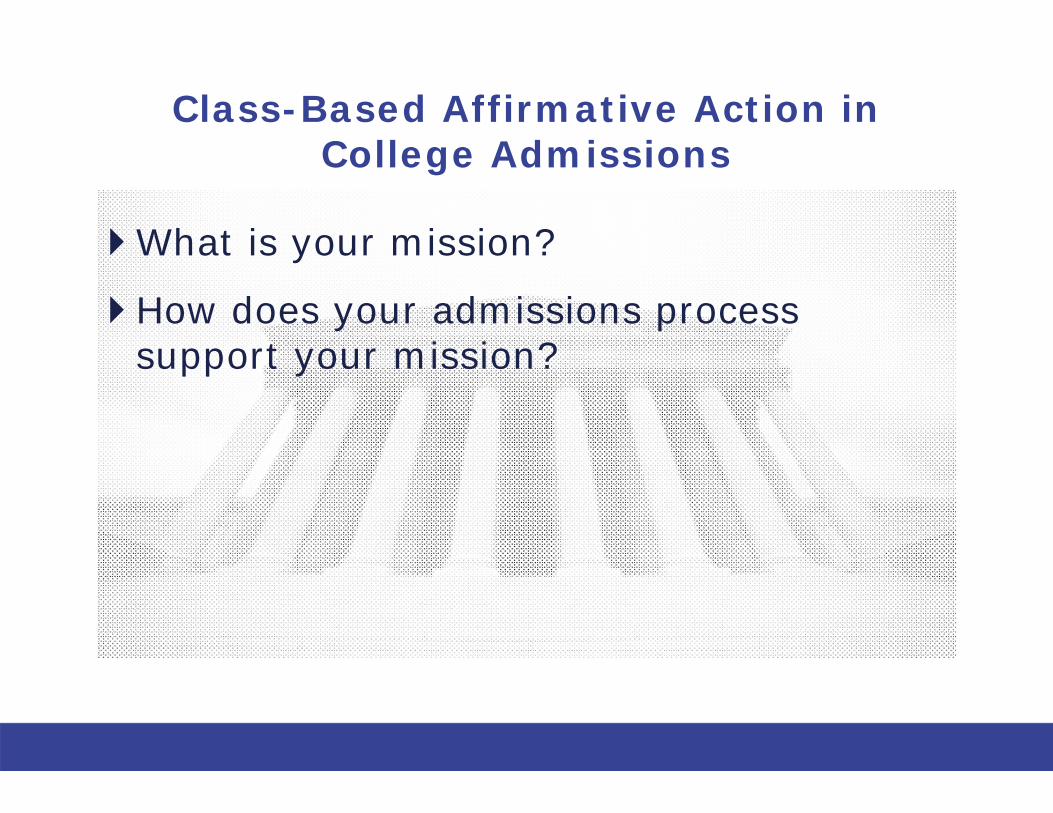
Class-Based Affirmative Action in College Admissions

Class-Based Affirmative Action in College Admissions
What is your mission?
Class-Based Affirmative Action in College Admissions
What is your mission?
How does your admissions process support your mission?

Class-Based Affirmative Action in College Admissions
What is your mission?
How does your admissions process support your mission? What applicant traits do you value?

Class-Based Affirmative Action in College Admissions
What is your mission?
How does your admissions process support your mission? What applicant traits do you value?
How do you measure those traits?

Class-Based Affirmative Action in College Admissions
What is your mission?
How does your admissions process support your mission? What applicant traits do you value?
How do you measure those traits?
What are your intended outcomes?

Class-Based Affirmative Action in College Admissions
What is your mission?
How does your admissions process support your mission? What applicant traits do you value?
How do you measure those traits?
What are your intended outcomes? To what extent did you achieve them?

Class-Based Affirmative Action in College Admissions

Class-Based Affirmative Action in College Admissions
The Disadvantage Index Quantify the obstacles an applicant has faced

Class-Based Affirmative Action in College Admissions
The Disadvantage Index Quantify the obstacles an applicant has faced
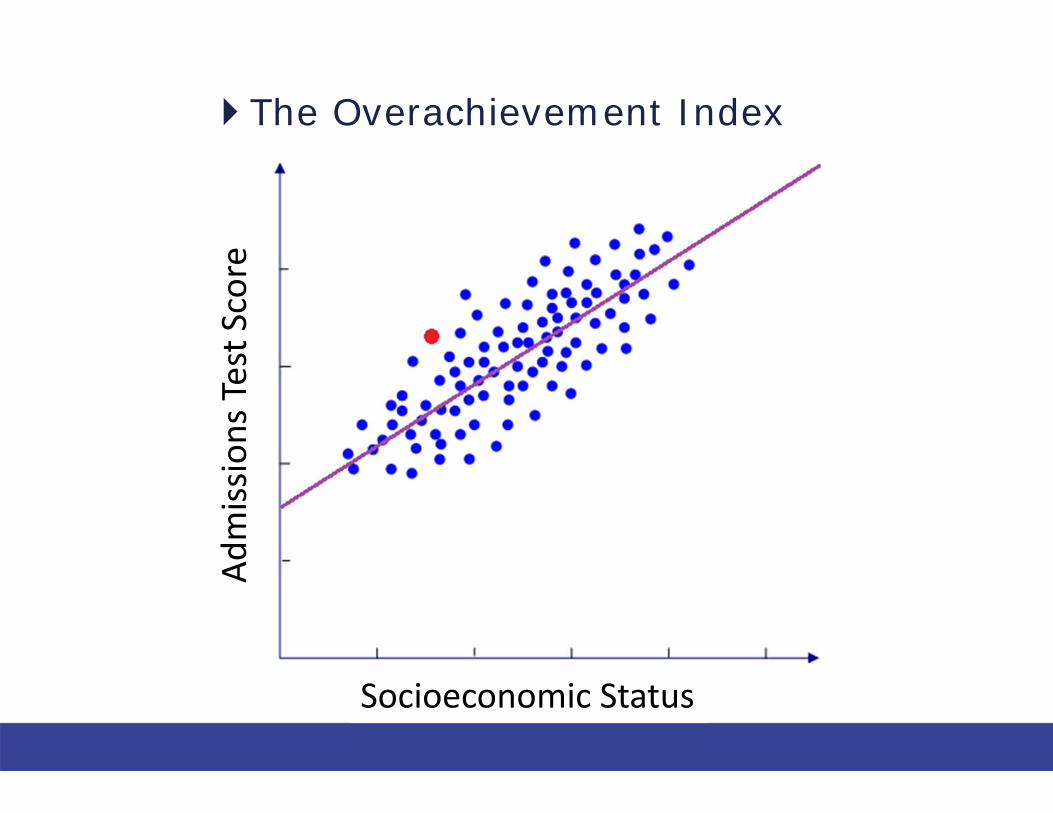
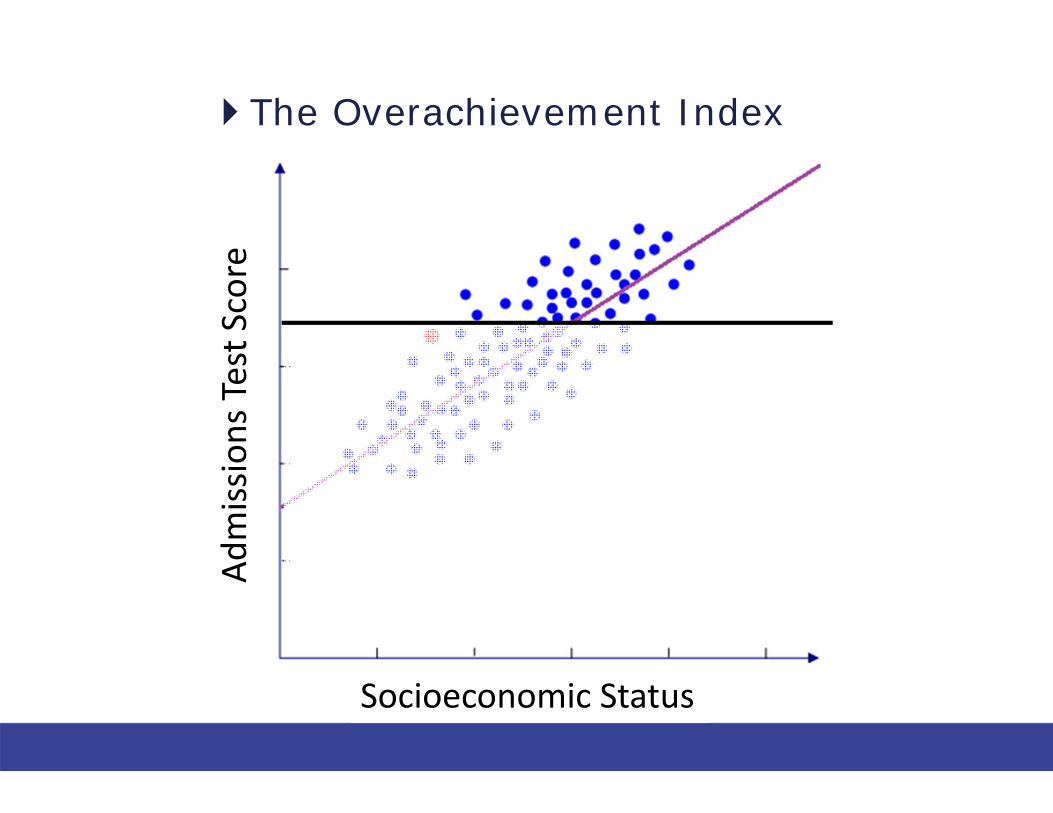
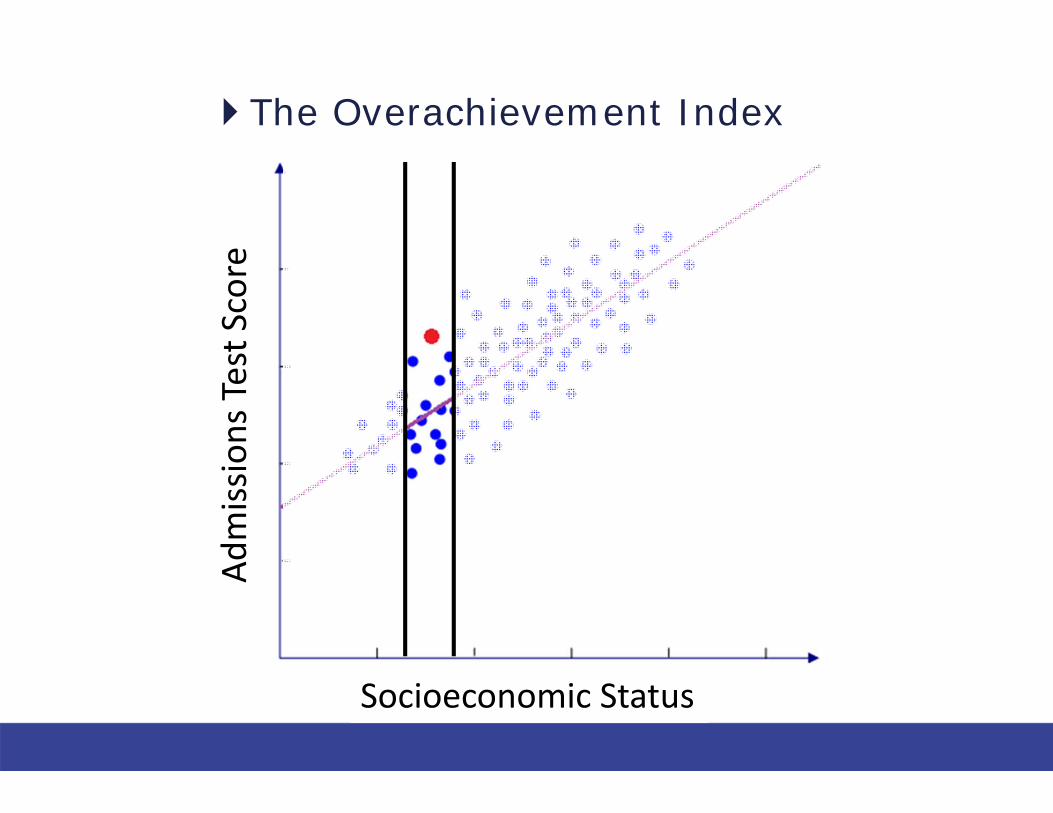
The Overachievement Index Quantify the extent to which an applicant has
overcome obstacles

The Overachievement Index
Admissions Test S
core
Socioeconomic Status
The Overachievement Index
Admissions Test S
core
Socioeconomic Status
The Overachievement Index
Admissions Test S
core
Socioeconomic Status
The Overachievement Index
Admissions Test S
core
Socioeconomic Status

The Disadvantage Index
Typical Applicants
Prob
ability of E
nrolling in College
High School Academic Achievement

The Disadvantage Index
Typical Applicants
Hypothetical Disadvantaged Applicants
Prob
ability of E
nrolling in College
High School Academic Achievement

The Disadvantage Index
Typical Applicants
Hypothetical Disadvantaged Applicants
Prob
ability of E
nrolling in College
High School Academic Achievement
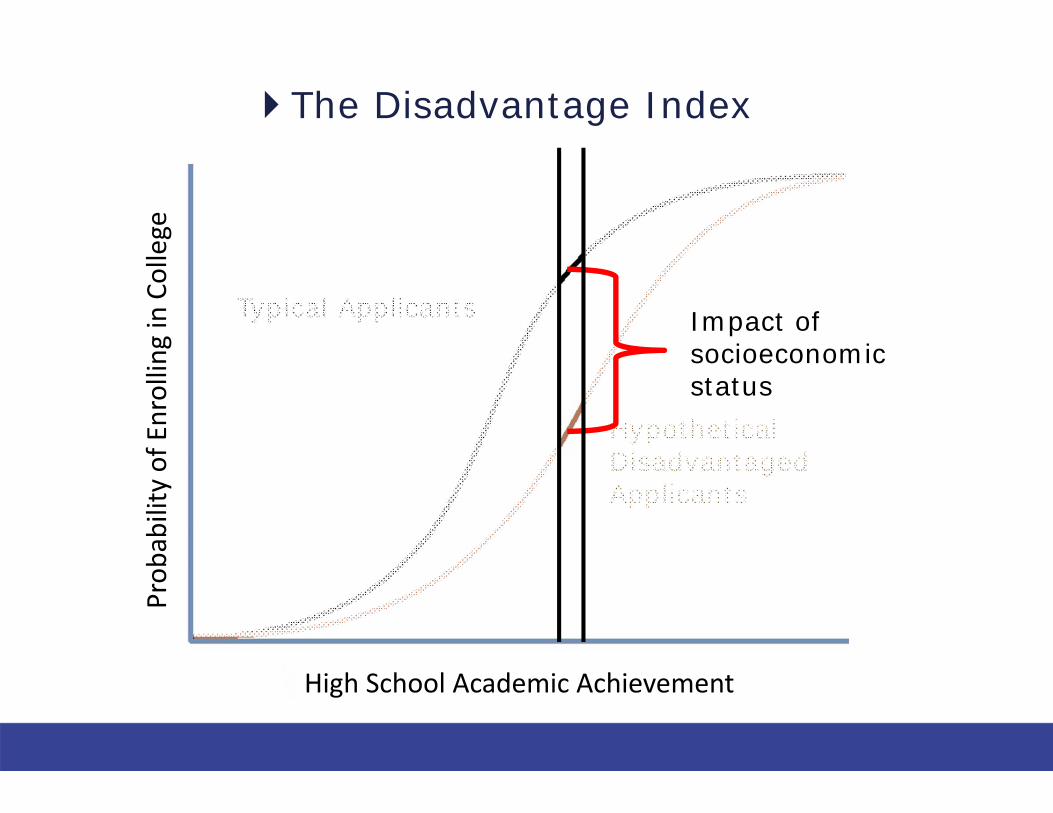
The Disadvantage Index
Typical Applicants
Hypothetical Disadvantaged Applicants
Impact of socioeconomic status
Prob
ability of E
nrolling in College
High School Academic Achievement

Socioeconomic Factors
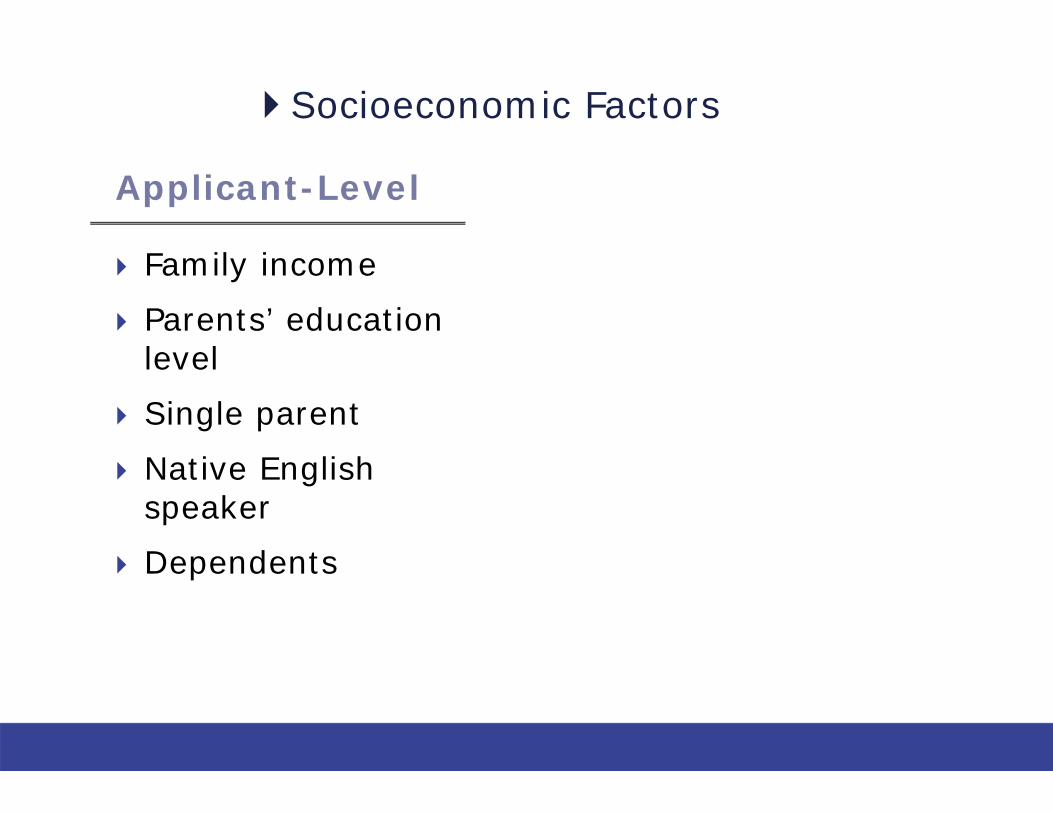
Socioeconomic Factors
Applicant-Level
Family income
Parents’ education level
Single parent
Native English speaker
Dependents
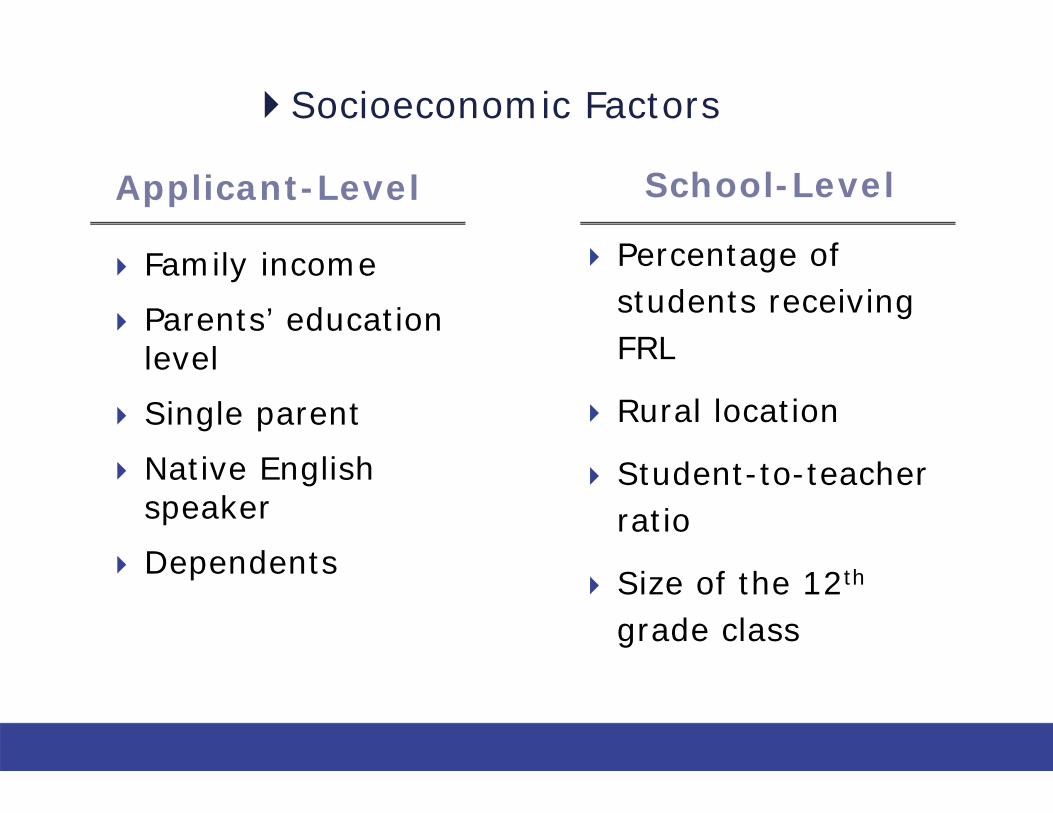
Socioeconomic Factors
School-Level
Percentage of students receiving FRL
Rural location
Student-to-teacher ratio
Size of the 12th
grade class
Applicant-Level
Family income
Parents’ education level
Single parent
Native English speaker
Dependents
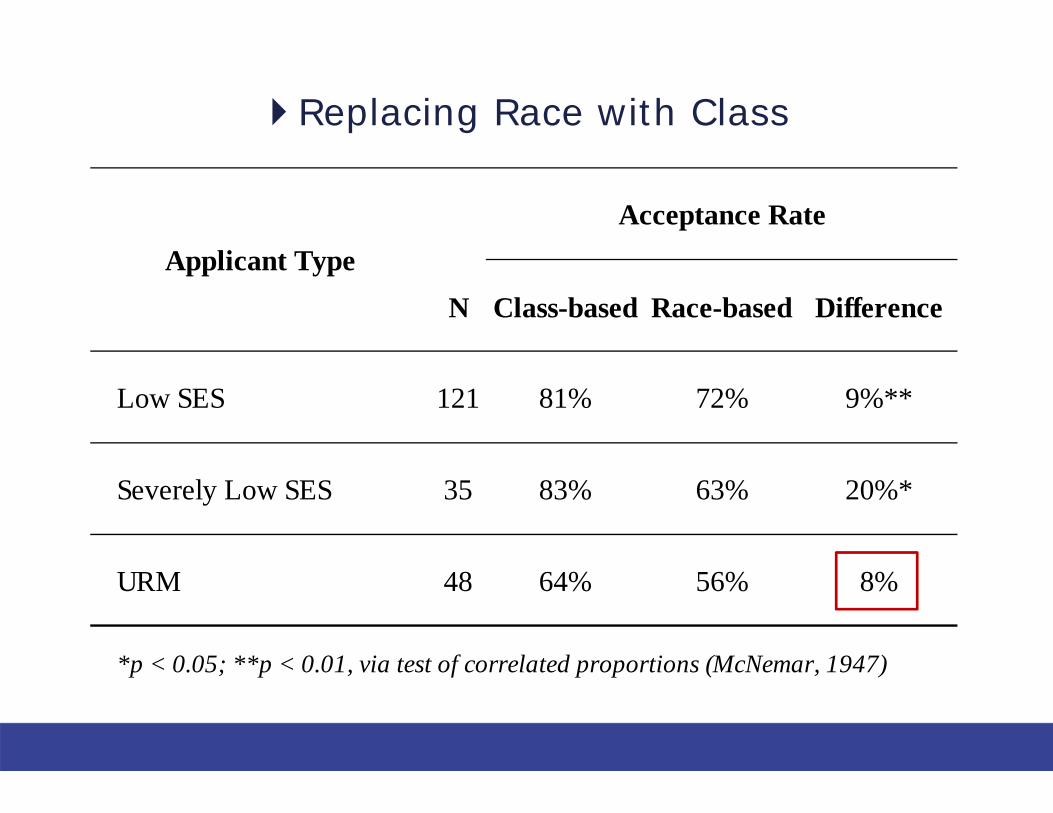
Replacing Race with Class
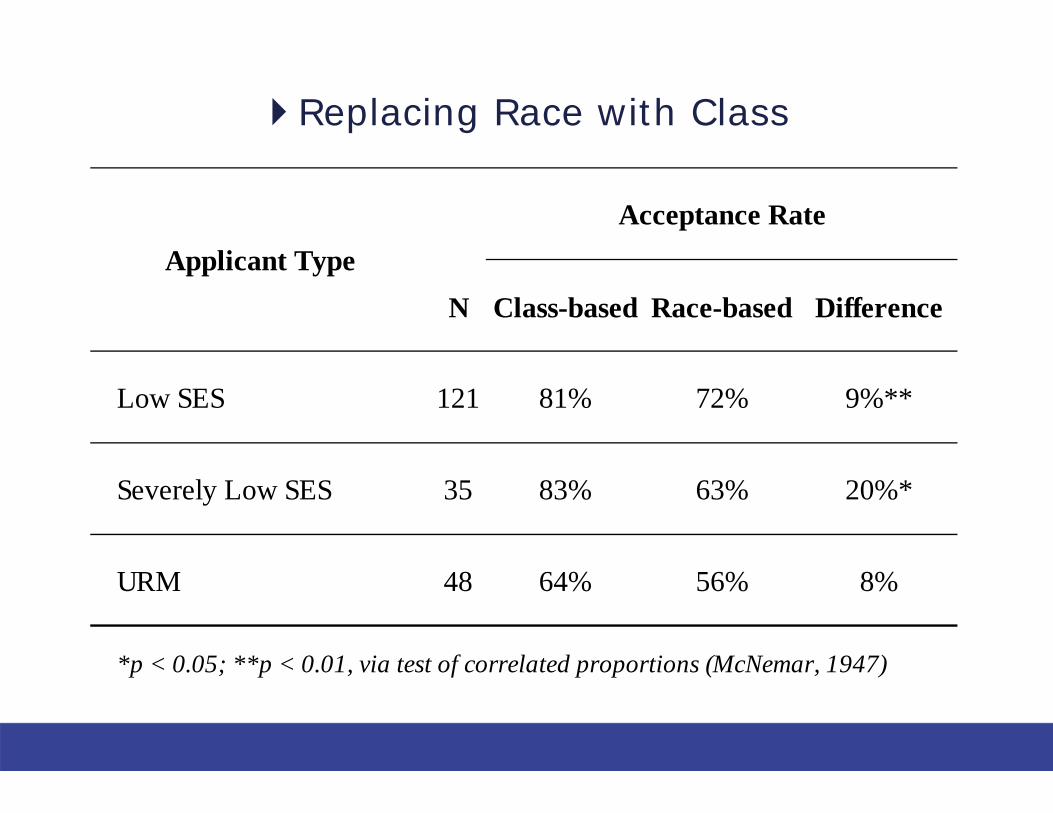
N Class-based Race-based Difference
Low SES 121 81% 72% 9%**
Severely Low SES 35 83% 63% 20%*
URM 48 64% 56% 8%
*p < 0.05; **p < 0.01, via test of correlated proportions (McNemar, 1947)
Applicant TypeAcceptance Rate
Replacing Race with Class
N Class-based Race-based Difference
Low SES 121 81% 72% 9%**
Severely Low SES 35 83% 63% 20%*
URM 48 64% 56% 8%
*p < 0.05; **p < 0.01, via test of correlated proportions (McNemar, 1947)
Applicant TypeAcceptance Rate
Replacing Race with Class

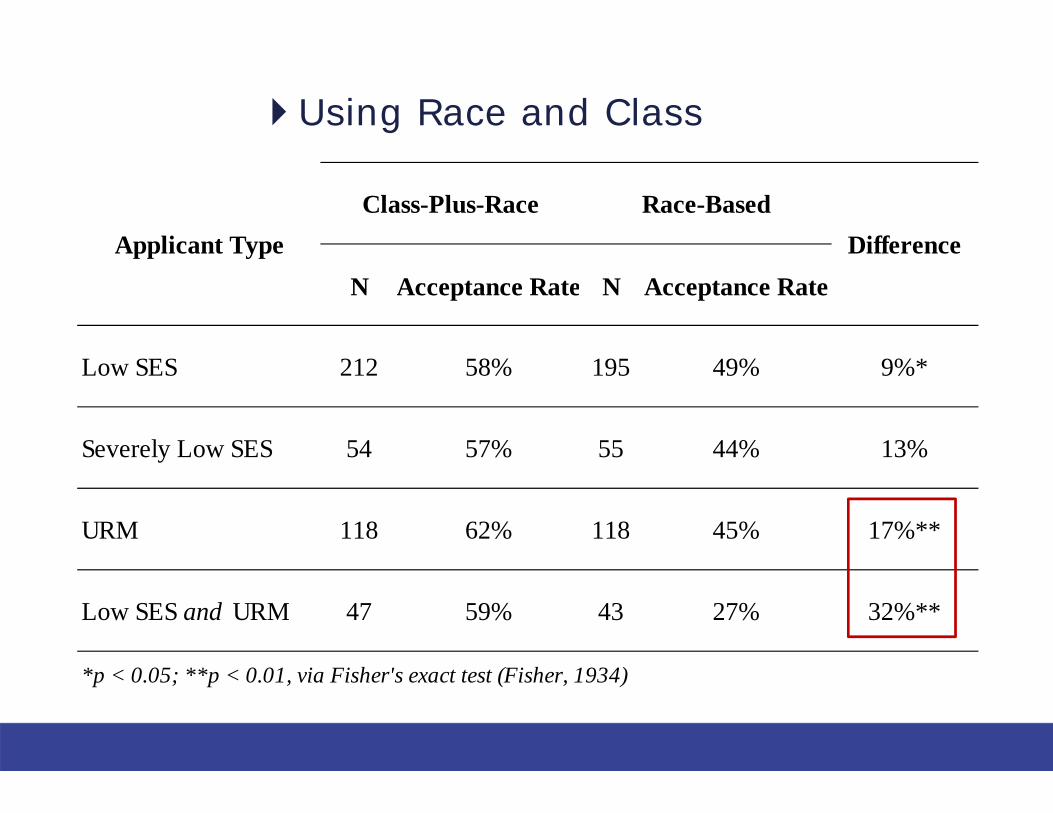
Using Race and Class

N Acceptance Rate N Acceptance Rate
Low SES 212 58% 195 49% 9%*
Severely Low SES 54 57% 55 44% 13%
URM 118 62% 118 45% 17%**
Low SES and URM 47 59% 43 27% 32%**
*p < 0.05; **p < 0.01, via Fisher's exact test (Fisher, 1934)
Applicant Type DifferenceClass-Plus-Race Race-Based
Using Race and Class
N Acceptance Rate N Acceptance Rate
Low SES 212 58% 195 49% 9%*
Severely Low SES 54 57% 55 44% 13%
URM 118 62% 118 45% 17%**
Low SES and URM 47 59% 43 27% 32%**
*p < 0.05; **p < 0.01, via Fisher's exact test (Fisher, 1934)
Applicant Type DifferenceClass-Plus-Race Race-Based
Using Race and Class

Can Class-Based Admits Succeed in College?
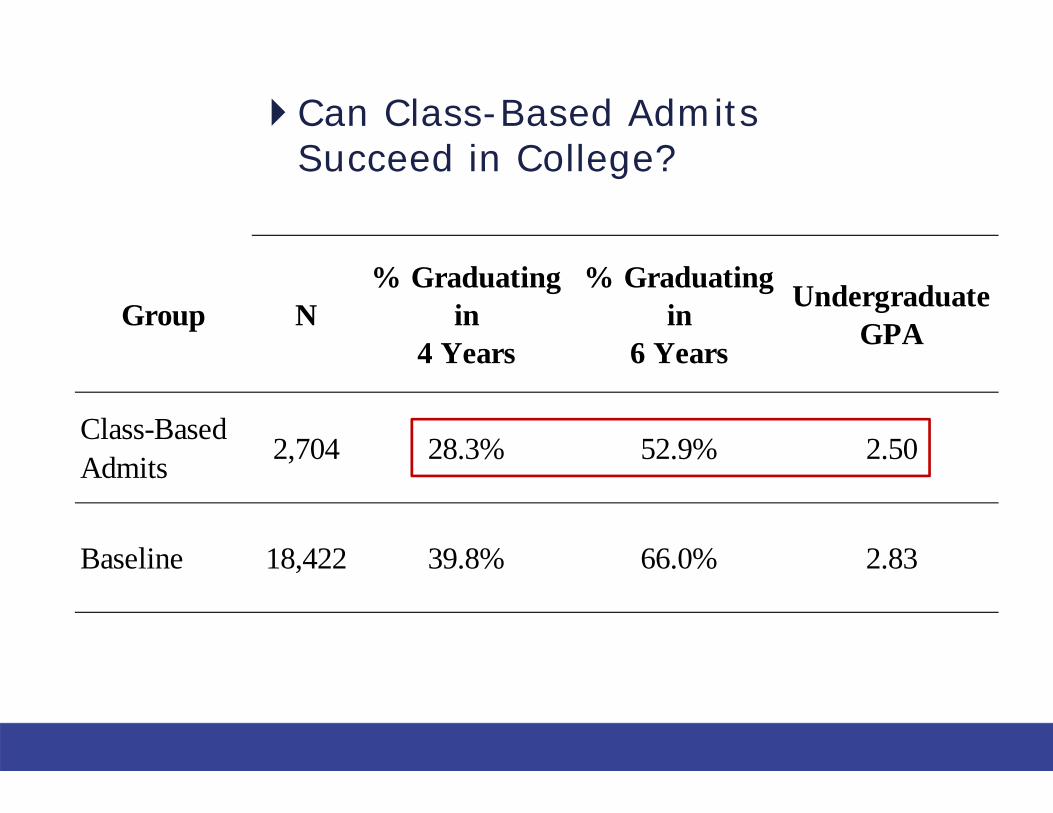
Can Class-Based Admits Succeed in College?
Group N% Graduating
in 4 Years
% Graduating in
6 Years
Undergraduate GPA
Class-Based Admits 2,704 28.3% 52.9% 2.50
Baseline 18,422 39.8% 66.0% 2.83
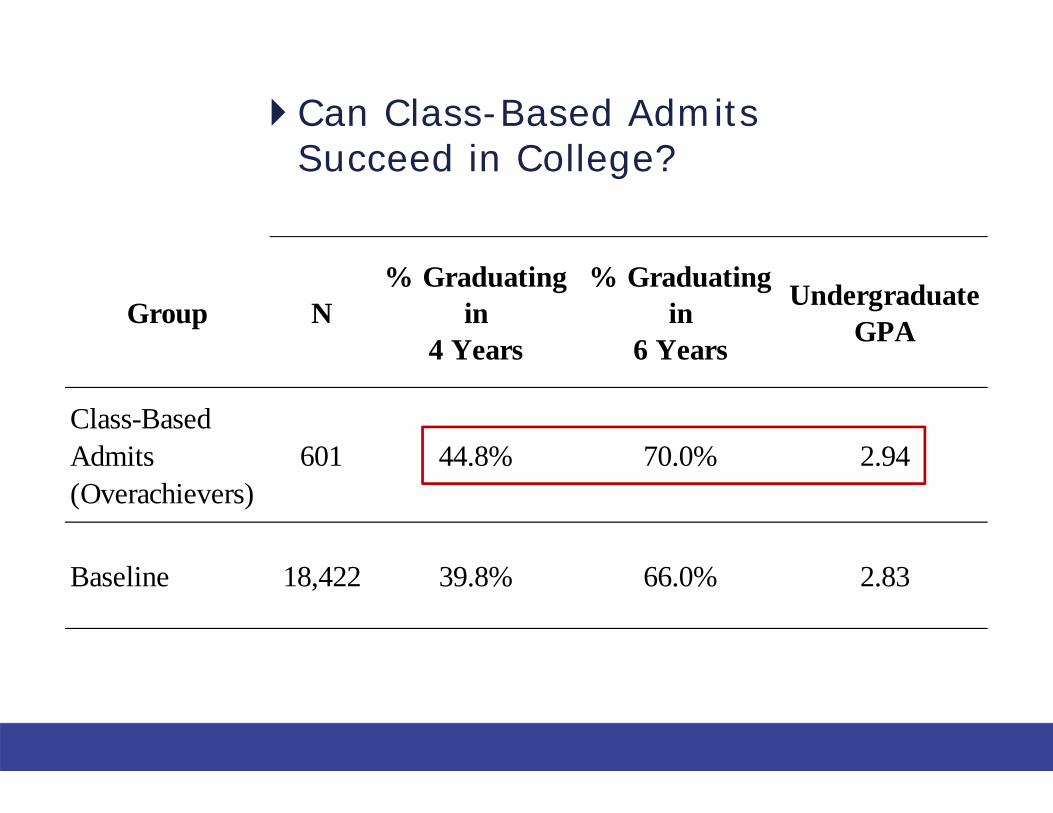
Can Class-Based Admits Succeed in College?
Group N% Graduating
in 4 Years
% Graduating in
6 Years
Undergraduate GPA
Class-Based Admits(Overachievers)
601 44.8% 70.0% 2.94
Baseline 18,422 39.8% 66.0% 2.83

Thank You!Matthew Gaertner
Research ScientistCenter for College & Career [email protected](512) 989-5395
Melissa HartProfessor of LawDirector, Byron White Center for the Study of
American Constitutional LawUniversity of Colorado Law [email protected](303) 735-6344
Recommended