Table of Contents
______________________________________________________________________________________________________________________________________________________________________
UNITED STATESSECURITIES AND EXCHANGE COMMISSION
WASHINGTON, D.C. 20549___________________________
FORM 10-Q☑ QUARTERLY REPORT PURSUANT TO SECTION 13 OR 15(d) OF THE SECURITIES EXCHANGE ACT OF 1934
For the quarterly period ended September 30, 2016OR
☐ TRANSITION REPORT PURSUANT TO SECTION 13 OR 15(d) OF THE SECURITIES EXCHANGE ACT OF 1934For the transition period from _____ to _____
Commission File No. 001-35674
REALOGY HOLDINGS CORP.(Exact name of registrant as specified in its charter)
20-8050955(I.R.S. Employer Identification Number)
Commission File No. 333-148153
REALOGY GROUP LLC(Exact name of registrant as specified in its charter)
20-4381990(I.R.S. Employer Identification Number)
Delaware(State or other jurisdiction of incorporation or organization)
175 Park AvenueMadison, NJ 07940
(Address of principal executive offices) (Zip Code)(973) 407-2000
(Registrants' telephone number, including area code)___________________________
Indicate by check mark whether the Registrants (1) have filed all reports required to be filed by Section 13 or 15(d) of the Securities Exchange Act of 1934 during thepreceding 12 months (or for such shorter period that the registrant was required to file such reports), and (2) have been subject to such filing requirements for the past90 days.
Realogy Holdings Corp. Yes ☑ No ☐ Realogy Group LLC Yes ☐ No ☑
Indicate by check mark whether the Registrants have submitted electronically and posted on its corporate Web site, if any, every Interactive Data File required to besubmitted and posted pursuant to Rule 405 of Regulation S-T (§ 232.405 of this chapter) during the preceding 12 months (or for such shorter period that theRegistrants were required to submit and post such files).
Realogy Holdings Corp. Yes ☑ No ☐ Realogy Group LLC Yes ☑ No ☐
Indicate by check mark whether the Registrants are large accelerated filers, accelerated filers, non-accelerated filers, or smaller reporting companies. See thedefinitions of "large accelerated filer," "accelerated filer" and "smaller reporting company" in Rule 12b-2 of the Exchange Act.
Large accelerated
filer Accelerated
filer Non-accelerated
filer Smaller reporting
company
(Do not check if a smaller reporting company)
Realogy Holdings Corp. ☑ ☐ ☐ ☐
Realogy Group LLC ☐ ☐ ☑ ☐
Indicate by check mark whether the Registrants are a shell company (as defined in Rule 12b-2 of the Exchange Act).
Realogy Holdings Corp. Yes ☐ No ☑ Realogy Group LLC Yes ☐ No ☑
There were 142,630,189 shares of Common Stock, $0.01 par value, of Realogy Holdings Corp. outstanding as of November 2, 2016.______________________________________________________________________________________________________________________________________________________________________
Table of Contents
TABLE OF CONTENTS
Page
Introductory Note 1Forward-Looking Statements 1 PART I FINANCIAL INFORMATION Item 1. Financial Statements 4 Report of Independent Registered Public Accounting Firm for Realogy Holdings Corp. 4 Report of Independent Registered Public Accounting Firm for Realogy Group LLC 5 Condensed Consolidated Statements of Operations for the three and nine months ended September 30, 2016 and 2015 6 Condensed Consolidated Statements of Comprehensive Income for the three and nine months ended September 30, 2016 and 2015 7 Condensed Consolidated Balance Sheets as of September 30, 2016 and December 31, 2015 8 Condensed Consolidated Statements of Cash Flows for the nine months ended September 30, 2016 and 2015 9 Notes to Condensed Consolidated Financial Statements 10Item 2. Management's Discussion and Analysis of Financial Condition and Results of Operations 31Item 3. Quantitative and Qualitative Disclosures about Market Risks 53Item 4. Controls and Procedures 53PART II OTHER INFORMATION 55Item 1. Legal Proceedings 55Item 2. Unregistered Sales of Equity Securities and Use of Proceeds 56Item 5. Other Information 56Item 6. Exhibits 57Signatures 58Exhibit Index 59
Table of Contents
INTRODUCTORY NOTE
Except as otherwise indicated or unless the context otherwise requires, the terms "we," "us," "our," "our company," "Realogy," "Realogy Holdings" andthe "Company" refer to Realogy Holdings Corp., a Delaware corporation, and its consolidated subsidiaries, including Realogy Intermediate Holdings LLC, aDelaware limited liability company ("Realogy Intermediate"), and Realogy Group LLC, a Delaware limited liability company ("Realogy Group"). NeitherRealogy Holdings, the indirect parent of Realogy Group, nor Realogy Intermediate, the direct parent company of Realogy Group, conducts any operationsother than with respect to its respective direct or indirect ownership of Realogy Group. As a result, the consolidated financial positions, results of operationsand cash flows of Realogy Holdings, Realogy Intermediate and Realogy Group are the same.
Realogy Holdings is not a party to the Senior Secured Credit Facility and Term Loan A Facility and certain references in this report to our consolidatedindebtedness exclude Realogy Holdings with respect to indebtedness under the Senior Secured Credit Facility and Term Loan A Facility. In addition, whileRealogy Holdings is a guarantor of Realogy Group's obligations under its unsecured notes, Realogy Holdings is not subject to the restrictive covenants in theindentures governing such indebtedness.
FORWARD-LOOKING STATEMENTS
Forward-looking statements included in this report and our other public filings or other public statements that we make from time to time are based onvarious facts and derived utilizing numerous important assumptions and are subject to known and unknown risks, uncertainties and other factors that maycause our actual results, performance or achievements to be materially different from any future results, performance or achievements expressed or implied bysuch forward-looking statements. Forward-looking statements include the information concerning our future financial performance, business strategy,projected plans and objectives, as well as projections of macroeconomic and industry trends, which are inherently unreliable due to the multiple factors thatimpact economic trends, and any such variations may be material. Statements preceded by, followed by or that otherwise include the words "believes,""expects," "anticipates," "intends," "projects," "estimates," "plans," and similar expressions or future or conditional verbs such as "will," "should," "would,""may" and "could" are generally forward-looking in nature and not historical facts. You should understand that the following important factors could affectour future results and cause actual results to differ materially from those expressed in the forward-looking statements:
• risks related to general business, economic, employment and political conditions and the U.S. residential real estate markets, either regionally ornationally, including but not limited to:
◦ a lack of improvement or a decline in the number of homesales, stagnant or declining home prices and/or a deterioration in other economicfactors that particularly impact the residential real estate market and the business segments in which we operate;
◦ a decrease in consumer confidence;
◦ the impact of recessions, slow economic growth, disruptions in the U.S. government or banking system, disruptions in a major geoeconomicregion, or equity or commodity markets and high levels of unemployment in the U.S. and abroad, which may impact all or a portion of thehousing markets in which we and our franchisees operate;
◦ increasing mortgage rates and/or constraints on the availability of mortgage financing;
◦ legislative, tax or regulatory changes (including changes in regulatory interpretations or enforcement practices) that would adversely impact theresidential real estate market, including changes relating to the Real Estate Settlement Procedures Act ("RESPA") and potential reforms ofFannie Mae and Freddie Mac, and potential tax code reform;
◦ continued or lengthier delays in homesale transaction closings that impact us or other industry participants resulting from the ConsumerFinancial Protection Bureau's rule relating to integrated mortgage disclosure forms, which became effective for new loan applications beginningOctober 3, 2015;
◦ a decrease in housing affordability;
◦ high levels of foreclosure activity;
◦ insufficient or excessive home inventory levels by market;
◦ changing attitudes towards home ownership, particularly among potential first-time homebuyers who may delay, or decide not to, purchase ahome; and
1
Table of Contents
◦ the inability or unwillingness of current homeowners to purchase their next home due to various factors, including limited or negative equity intheir current home, difficult mortgage underwriting standards, attractive rates on existing mortgages and the lack of available inventory in theirmarket;
• increased competition whether through traditional competitors or competitors with alternative business models;
• competition for more productive agents and manager talent may continue to impact the ability of our company owned brokerage business and ouraffiliated franchisees to attract and retain independent sales associates, either individually or as members of a team, at commission split ratescurrently paid by our company owned brokerages and our affiliated franchisees;
• our geographic and high-end market concentration, particularly with respect to our company owned brokerage operations;
• our inability to enter into franchise agreements with new franchisees at current net effective royalty rates, or to realize royalty revenue growth fromthem;
• our inability to renew existing franchise agreements at current net effective royalty rates or without increasing the amount and prevalence of non-standard incentives, or to maintain or enhance our value proposition to franchisees, including but not limited to our ability to successfully develop,license and scale our ZAPSM technology to our franchisees;
• the lack of revenue growth or declining profitability of our franchisees and company owned brokerage operations, including the impact of loweraverage broker commission rates;
• disputes or issues with entities that license us their tradenames for use in our business that could impede our franchising of those brands;
• actions by our franchisees that could harm our business or reputation, non-performance of our franchisees, controversies with our franchisees oractions against us by their independent sales associates or employees or third parties with which our franchisees have business relationships;
• loss or attrition among our senior executives or other key employees;
• we may be unable to achieve or maintain cost savings and other benefits from our restructuring activities;
• our restructuring activities could have an adverse impact on our operations;
• our inability to realize the benefits from acquisitions due to the loss of key personnel or productive agents of the acquired companies, as well as thepossibility that expected benefits and synergies of the transactions may not be achieved in a timely manner or at all;
• our failure or alleged failure to comply with laws, regulations and regulatory interpretations and any changes in laws and regulations or stricterinterpretations of regulatory requirements, including but not limited to (1) state or federal employment laws or regulations that would requirereclassification of independent contractor sales associates to employee status; and (2) RESPA or state consumer protection or similar laws;
• any adverse resolution of litigation, governmental or regulatory proceedings or arbitration awards as well as any adverse impact of decisions tovoluntarily modify business arrangements or enter into settlement agreements to avoid the risk of protracted and costly litigation or otherproceedings;
• the general impact of emerging technologies on our business;
• our inability to obtain new technologies and systems, to replace or introduce new technologies and systems as quickly as our competitors and in acost-effective manner or to achieve the benefits anticipated from new technologies or systems;
• the failure or significant disruption of our operations from various causes related to our critical information technologies and systems includingcybersecurity threats to our data and customer, franchisee and independent sales associate data as well as reputational or financial risks associatedwith a loss of any such data;
• risks related to our international operations, including compliance with the Foreign Corrupt Practices Act and similar anti-corruption laws as well asrisks relating to the master franchisor model that we deploy internationally;
• risks associated with our substantial indebtedness and interest obligations and restrictions contained in our debt agreements, including risks relatingto having to dedicate a significant portion of our cash flows from operations to service our debt;
• risks relating to our ability to refinance or repay our indebtedness, incur additional indebtedness or return capital to stockholders;
• changes in corporate relocation practices resulting in fewer employee relocations, reduced relocation benefits or the loss of one or more significantAffinity clients;
2
Table of Contents
• an increase in the claims rate of our title underwriter and an increase in mortgage rates could adversely impact the revenue of our title and settlementservices segment;
• our inability to securitize certain assets of our relocation business, which would require us to find an alternative source of liquidity that may not beavailable, or if available, may not be on favorable terms;
• risks that could materially adversely impact our equity investment in PHH Home Loans LLC, our joint venture with PHH Corporation ("PHH")including increases in mortgage rates, the impact of joint venture operational or liquidity risks, regulatory changes, litigation, investigations andinquiries and termination of the venture;
• any remaining resolutions or outcomes with respect to contingent liabilities of our former parent, Cendant Corporation ("Cendant"), under theSeparation and Distribution Agreement and the Tax Sharing Agreement (each as described in our Annual Report on Form 10-K for the year endedDecember 31, 2015), including any adverse impact on our future cash flows; and
• new types of taxes or increases in state, local or federal taxes that could diminish profitability or liquidity.
Other factors not identified above, including those described under the headings "Forward-Looking Statements," "Risk Factors" and "Management'sDiscussion and Analysis of Financial Condition and Results of Operations" in our Annual Report on Form 10-K for the year ended December 31, 2015 (the"2015 Form 10-K"), filed with the Securities and Exchange Commission ("SEC"), may also cause actual results to differ materially from those described inour forward-looking statements. Most of these factors are difficult to anticipate and are generally beyond our control. You should consider these factors inconnection with any forward-looking statements that may be made by us and our businesses generally.
Except for our ongoing obligations to disclose material information under the federal securities laws, we undertake no obligation to release publicly anyrevisions to any forward-looking statements, to report events or to report the occurrence of unanticipated events unless we are required to do so by law. Forany forward-looking statement contained in this Report, our public filings or other public statements, we claim the protection of the safe harbor for forward-looking statements contained in the Private Securities Litigation Reform Act of 1995.
3

Table of Contents
PART I - FINANCIAL INFORMATION
Item 1. Financial Statements.
REPORT OF INDEPENDENT REGISTERED PUBLIC ACCOUNTING FIRM
To the Board of Directors and Stockholders of Realogy Holdings Corp.:
We have reviewed the accompanying condensed consolidated balance sheet of Realogy Holdings Corp. and its subsidiaries as of September 30, 2016,and the related condensed consolidated statements of operations and comprehensive income for the three and nine-month periods ended September 30, 2016and September 30, 2015 and the condensed consolidated statements of cash flows for the nine-month periods ended September 30, 2016 and September 30,2015. These interim financial statements are the responsibility of the Company's management.
We conducted our review in accordance with the standards of the Public Company Accounting Oversight Board (United States). A review of interimfinancial information consists principally of applying analytical procedures and making inquiries of persons responsible for financial and accounting matters.It is substantially less in scope than an audit conducted in accordance with the standards of the Public Company Accounting Oversight Board (United States),the objective of which is the expression of an opinion regarding the financial statements taken as a whole. Accordingly, we do not express such an opinion.
Based on our review, we are not aware of any material modifications that should be made to the accompanying condensed consolidated interim financialstatements for them to be in conformity with accounting principles generally accepted in the United States of America.
We previously audited, in accordance with the standards of the Public Company Accounting Oversight Board (United States), the consolidated balancesheet as of December 31, 2015, and the related consolidated statements of operations, comprehensive income, equity, and cash flows for the year then ended(not presented herein), and in our report dated February 24, 2016, we expressed an unqualified opinion on those consolidated financial statements whichincluded a paragraph that described the change in the manner of accounting for the presentation of debt issuance costs and the balance sheet classification ofdeferred taxes in 2015 and retrospectively for prior years. In our opinion, the information set forth in the accompanying condensed consolidated balance sheetas of December 31, 2015, is fairly stated in all material respects in relation to the consolidated balance sheet from which it has been derived.
/s/ PricewaterhouseCoopers LLPFlorham Park, New JerseyNovember 4, 2016
4

Table of Contents
REPORT OF INDEPENDENT REGISTERED PUBLIC ACCOUNTING FIRM
To the Board of Directors and Stockholder of Realogy Group LLC:
We have reviewed the accompanying condensed consolidated balance sheet of Realogy Group LLC and its subsidiaries as of September 30, 2016, andthe related condensed consolidated statements of operations and comprehensive income for the three and nine-month periods ended September 30, 2016 andSeptember 30, 2015 and the condensed consolidated statements of cash flows for the nine-month periods ended September 30, 2016 and September 30, 2015.These interim financial statements are the responsibility of the Company's management.
We conducted our review in accordance with the standards of the Public Company Accounting Oversight Board (United States) and in accordance withauditing standards generally accepted in the United States of America applicable to reviews of interim financial information. A review of interim financialinformation consists principally of applying analytical procedures and making inquiries of persons responsible for financial and accounting matters. It issubstantially less in scope than an audit conducted in accordance with the standards of the Public Company Accounting Oversight Board (United States) or inaccordance with auditing standards generally accepted in the United States of America, the objective of which is the expression of an opinion regarding thefinancial statements taken as a whole. Accordingly, we do not express such an opinion.
Based on our review, we are not aware of any material modifications that should be made to the accompanying condensed consolidated interim financialstatements for them to be in conformity with accounting principles generally accepted in the United States of America.
We previously audited, in accordance with the standards of the Public Company Accounting Oversight Board (United States), the consolidated balancesheet as of December 31, 2015, and the related consolidated statements of operations, comprehensive income, equity, and cash flows for the year then ended(not presented herein), and in our report dated February 24, 2016, we expressed an unqualified opinion on those consolidated financial statements whichincluded a paragraph that described the change in the manner of accounting for the presentation of debt issuance costs and the balance sheet classification ofdeferred taxes in 2015 and retrospectively for prior years. In our opinion, the information set forth in the accompanying condensed consolidated balance sheetas of December 31, 2015, is fairly stated in all material respects in relation to the consolidated balance sheet from which it has been derived.
/s/ PricewaterhouseCoopers LLPFlorham Park, New JerseyNovember 4, 2016
5
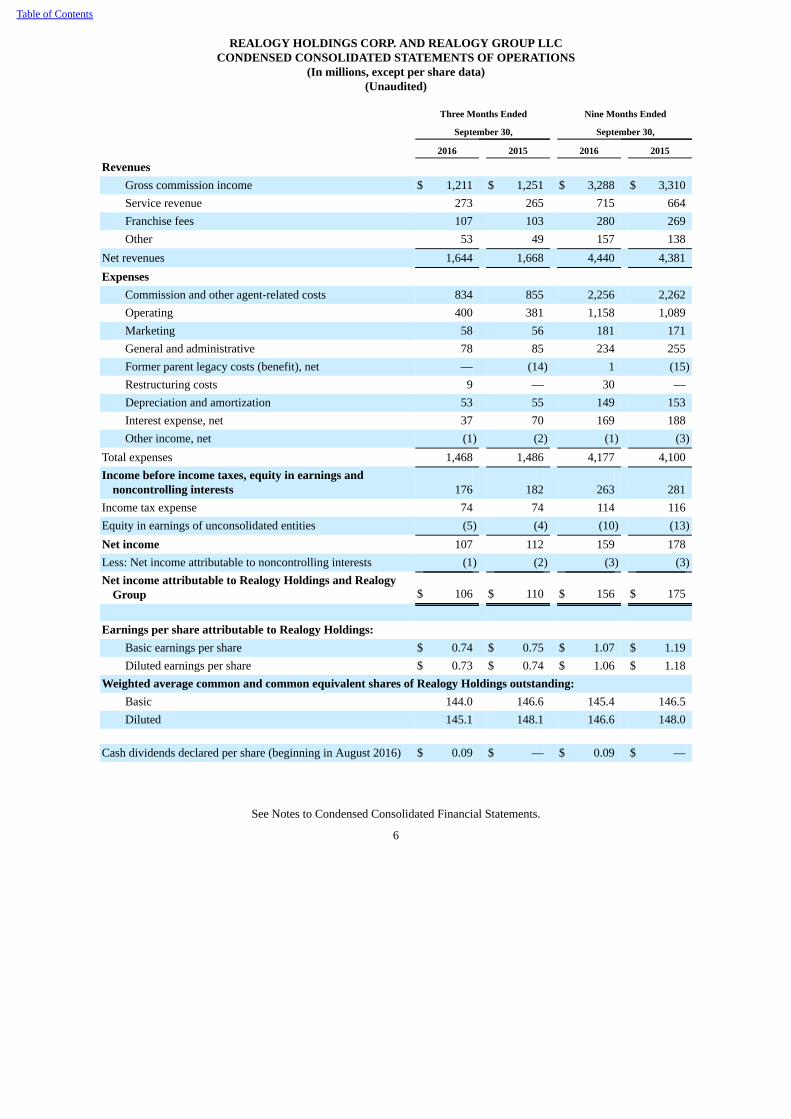
Table of Contents
REALOGY HOLDINGS CORP. AND REALOGY GROUP LLCCONDENSED CONSOLIDATED STATEMENTS OF OPERATIONS
(In millions, except per share data)(Unaudited)
Three Months Ended Nine Months Ended
September 30, September 30,
2016 2015 2016 2015
Revenues Gross commission income $ 1,211 $ 1,251 $ 3,288 $ 3,310Service revenue 273 265 715 664Franchise fees 107 103 280 269Other 53 49 157 138
Net revenues 1,644 1,668 4,440 4,381Expenses
Commission and other agent-related costs 834 855 2,256 2,262Operating 400 381 1,158 1,089Marketing 58 56 181 171General and administrative 78 85 234 255Former parent legacy costs (benefit), net — (14) 1 (15)Restructuring costs 9 — 30 —Depreciation and amortization 53 55 149 153Interest expense, net 37 70 169 188Other income, net (1) (2) (1) (3)
Total expenses 1,468 1,486 4,177 4,100Income before income taxes, equity in earnings and
noncontrolling interests 176 182 263 281Income tax expense 74 74 114 116Equity in earnings of unconsolidated entities (5) (4) (10) (13)Net income 107 112 159 178Less: Net income attributable to noncontrolling interests (1) (2) (3) (3)Net income attributable to Realogy Holdings and Realogy
Group $ 106 $ 110 $ 156 $ 175
Earnings per share attributable to Realogy Holdings:
Basic earnings per share $ 0.74 $ 0.75 $ 1.07 $ 1.19Diluted earnings per share $ 0.73 $ 0.74 $ 1.06 $ 1.18
Weighted average common and common equivalent shares of Realogy Holdings outstanding:Basic 144.0 146.6 145.4 146.5Diluted 145.1 148.1 146.6 148.0
Cash dividends declared per share (beginning in August 2016) $ 0.09 $ — $ 0.09 $ —
See Notes to Condensed Consolidated Financial Statements.
6
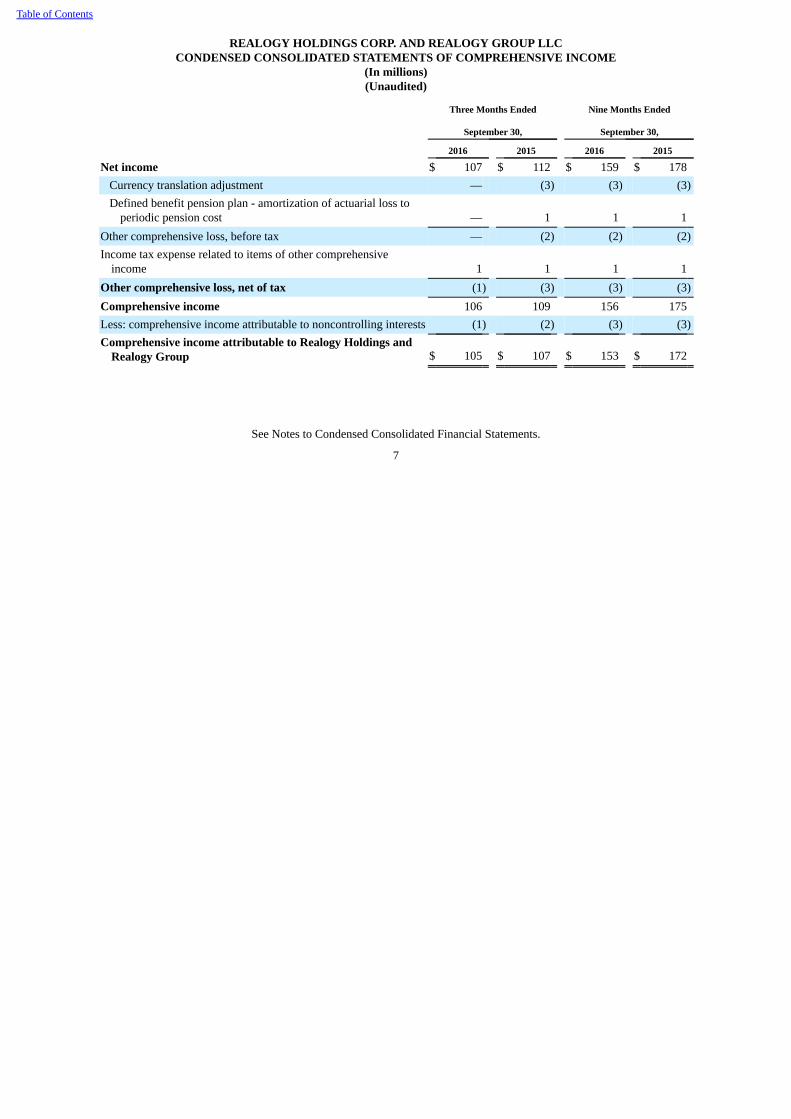
Table of Contents
REALOGY HOLDINGS CORP. AND REALOGY GROUP LLCCONDENSED CONSOLIDATED STATEMENTS OF COMPREHENSIVE INCOME
(In millions)(Unaudited)
Three Months Ended Nine Months Ended
September 30, September 30,
2016 2015 2016 2015
Net income $ 107 $ 112 $ 159 $ 178Currency translation adjustment — (3) (3) (3)Defined benefit pension plan - amortization of actuarial loss to
periodic pension cost — 1 1 1Other comprehensive loss, before tax — (2) (2) (2)Income tax expense related to items of other comprehensive
income 1 1 1 1Other comprehensive loss, net of tax (1) (3) (3) (3)Comprehensive income 106 109 156 175Less: comprehensive income attributable to noncontrolling interests (1) (2) (3) (3)Comprehensive income attributable to Realogy Holdings and
Realogy Group $ 105 $ 107 $ 153 $ 172
See Notes to Condensed Consolidated Financial Statements.
7
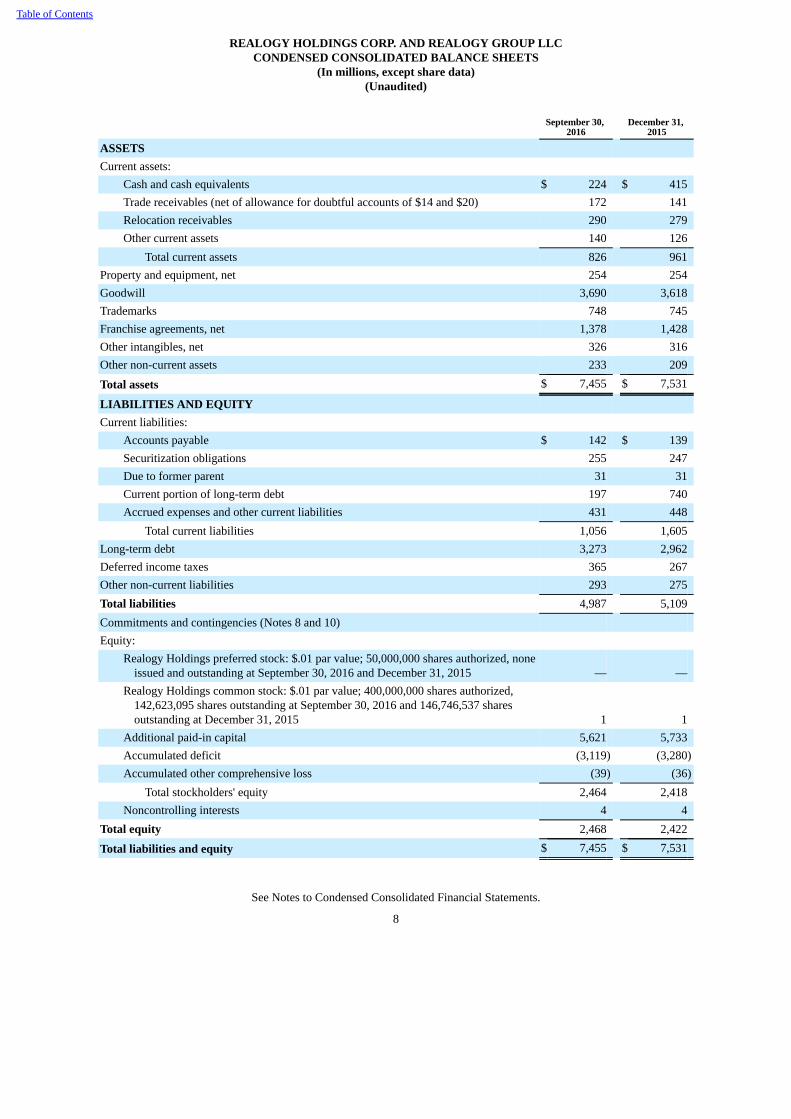
Table of Contents
REALOGY HOLDINGS CORP. AND REALOGY GROUP LLCCONDENSED CONSOLIDATED BALANCE SHEETS
(In millions, except share data)(Unaudited)
September 30,
2016
December 31,
2015 ASSETS Current assets:
Cash and cash equivalents $ 224 $ 415Trade receivables (net of allowance for doubtful accounts of $14 and $20) 172 141Relocation receivables 290 279Other current assets 140 126
Total current assets 826 961Property and equipment, net 254 254Goodwill 3,690 3,618Trademarks 748 745Franchise agreements, net 1,378 1,428Other intangibles, net 326 316Other non-current assets 233 209
Total assets $ 7,455 $ 7,531
LIABILITIES AND EQUITY Current liabilities:
Accounts payable $ 142 $ 139Securitization obligations 255 247Due to former parent 31 31Current portion of long-term debt 197 740Accrued expenses and other current liabilities 431 448
Total current liabilities 1,056 1,605Long-term debt 3,273 2,962Deferred income taxes 365 267Other non-current liabilities 293 275Total liabilities 4,987 5,109Commitments and contingencies (Notes 8 and 10) Equity:
Realogy Holdings preferred stock: $.01 par value; 50,000,000 shares authorized, noneissued and outstanding at September 30, 2016 and December 31, 2015 — —
Realogy Holdings common stock: $.01 par value; 400,000,000 shares authorized,142,623,095 shares outstanding at September 30, 2016 and 146,746,537 sharesoutstanding at December 31, 2015 1 1
Additional paid-in capital 5,621 5,733Accumulated deficit (3,119) (3,280)Accumulated other comprehensive loss (39) (36)
Total stockholders' equity 2,464 2,418Noncontrolling interests 4 4
Total equity 2,468 2,422
Total liabilities and equity $ 7,455 $ 7,531
See Notes to Condensed Consolidated Financial Statements.
8
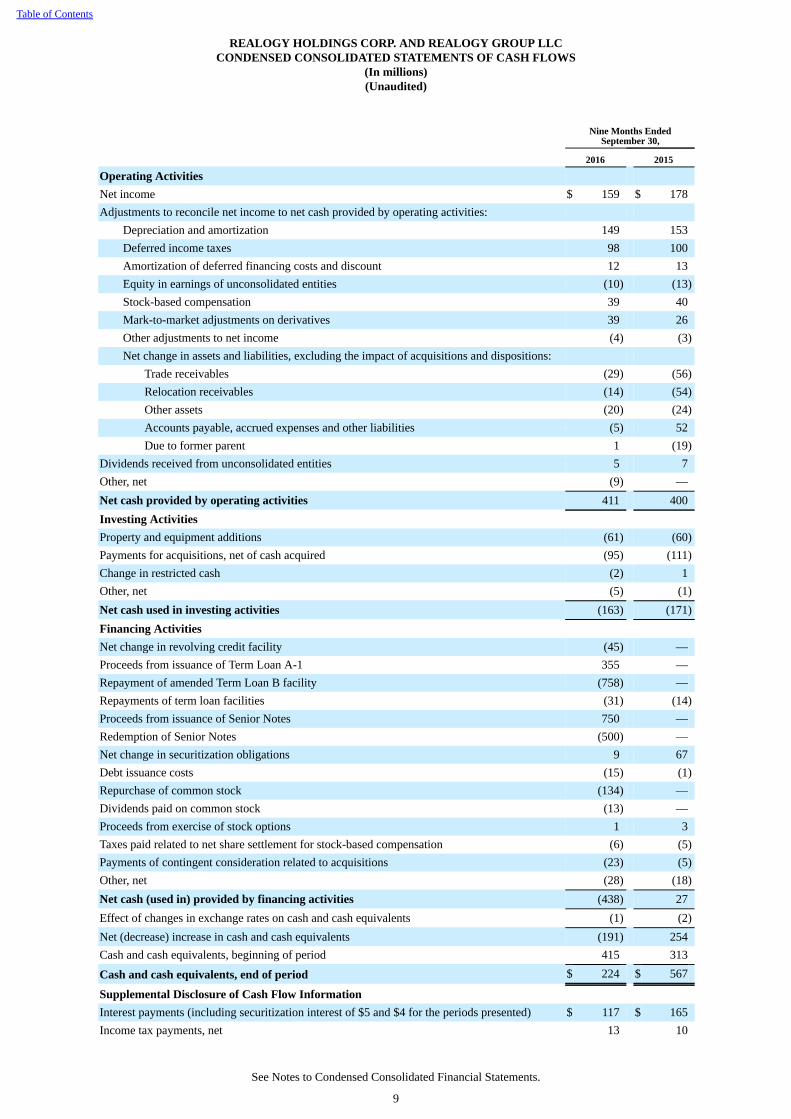
Table of Contents
REALOGY HOLDINGS CORP. AND REALOGY GROUP LLCCONDENSED CONSOLIDATED STATEMENTS OF CASH FLOWS
(In millions)(Unaudited)
Nine Months Ended
September 30,
2016 2015
Operating Activities Net income $ 159 $ 178Adjustments to reconcile net income to net cash provided by operating activities:
Depreciation and amortization 149 153Deferred income taxes 98 100Amortization of deferred financing costs and discount 12 13Equity in earnings of unconsolidated entities (10) (13)Stock-based compensation 39 40Mark-to-market adjustments on derivatives 39 26Other adjustments to net income (4) (3)Net change in assets and liabilities, excluding the impact of acquisitions and dispositions:
Trade receivables (29) (56)Relocation receivables (14) (54)Other assets (20) (24)Accounts payable, accrued expenses and other liabilities (5) 52Due to former parent 1 (19)
Dividends received from unconsolidated entities 5 7Other, net (9) —Net cash provided by operating activities 411 400Investing Activities Property and equipment additions (61) (60)Payments for acquisitions, net of cash acquired (95) (111)Change in restricted cash (2) 1Other, net (5) (1)Net cash used in investing activities (163) (171)Financing Activities Net change in revolving credit facility (45) —Proceeds from issuance of Term Loan A-1 355 —Repayment of amended Term Loan B facility (758) —Repayments of term loan facilities (31) (14)Proceeds from issuance of Senior Notes 750 —Redemption of Senior Notes (500) —Net change in securitization obligations 9 67Debt issuance costs (15) (1)Repurchase of common stock (134) —Dividends paid on common stock (13) —Proceeds from exercise of stock options 1 3Taxes paid related to net share settlement for stock-based compensation (6) (5)Payments of contingent consideration related to acquisitions (23) (5)Other, net (28) (18)Net cash (used in) provided by financing activities (438) 27Effect of changes in exchange rates on cash and cash equivalents (1) (2)Net (decrease) increase in cash and cash equivalents (191) 254Cash and cash equivalents, beginning of period 415 313
Cash and cash equivalents, end of period $ 224 $ 567
Supplemental Disclosure of Cash Flow Information Interest payments (including securitization interest of $5 and $4 for the periods presented) $ 117 $ 165Income tax payments, net 13 10
See Notes to Condensed Consolidated Financial Statements.
9

Table of Contents
REALOGY HOLDINGS CORP. AND REALOGY GROUP LLCNOTES TO CONDENSED CONSOLIDATED FINANCIAL STATEMENTS
(Unless otherwise noted, all amounts are in millions)(Unaudited)
1. BASIS OF PRESENTATION
Realogy Holdings Corp. ("Realogy Holdings", "Realogy" or the "Company") is a holding company for its consolidated subsidiaries including RealogyIntermediate Holdings LLC ("Realogy Intermediate") and Realogy Group LLC ("Realogy Group") and its consolidated subsidiaries. Realogy through itssubsidiaries is a global provider of residential real estate services. Neither Realogy Holdings, the indirect parent of Realogy Group, nor Realogy Intermediate,the direct parent company of Realogy Group, conducts any operations other than with respect to its respective direct or indirect ownership of Realogy Group.As a result, the consolidated financial positions, results of operations, comprehensive income and cash flows of Realogy Holdings, Realogy Intermediate andRealogy Group are the same.
The accompanying Condensed Consolidated Financial Statements include the financial statements of Realogy Holdings and Realogy Group. RealogyHoldings' only asset is its investment in the common stock of Realogy Intermediate, and Realogy Intermediate's only asset is its investment in RealogyGroup. Realogy Holdings' only obligations are its guarantees of certain borrowings and certain franchise obligations of Realogy Group. All expenses incurredby Realogy Holdings and Realogy Intermediate are for the benefit of Realogy Group and have been reflected in Realogy Group's Condensed ConsolidatedFinancial Statements.
The Condensed Consolidated Financial Statements have been prepared in accordance with accounting principles generally accepted in the United Statesof America and with Article 10 of Regulation S-X. Interim results may not be indicative of full year performance because of seasonal and short-termvariations. The Company has eliminated all material intercompany transactions and balances between entities consolidated in these financial statements. Inpresenting the Condensed Consolidated Financial Statements, management makes estimates and assumptions that affect the amounts reported and the relateddisclosures. Estimates, by their nature, are based on judgment and available information. Accordingly, actual results could differ materially from thoseestimates.
In management's opinion, the accompanying Condensed Consolidated Financial Statements reflect all normal and recurring adjustments necessary topresent fairly Realogy Holdings and Realogy Group's financial position as of September 30, 2016 and the results of operations and comprehensive income forthe three and nine months ended September 30, 2016 and 2015 and cash flows for the nine months ended September 30, 2016 and 2015. As the interimCondensed Consolidated Financial Statements are prepared using the same accounting principles and policies used to prepare the annual consolidatedfinancial statements, they should be read in conjunction with the Consolidated Financial Statements for the year ended December 31, 2015 included in theAnnual Report on Form 10-K for the year ended December 31, 2015.
Fair Value Measurements
The following tables present the Company’s assets and liabilities that are measured at fair value on a recurring basis and are categorized using the fairvalue hierarchy. The fair value hierarchy has three levels based on the reliability of the inputs used to determine fair value.
Level Input: Input Definitions:
Level I
Inputs are unadjusted, quoted prices for identical assets or liabilities in active markets at themeasurement date.
Level II
Inputs other than quoted prices included in Level I that are observable for the asset or liability throughcorroboration with market data at the measurement date.
Level III
Unobservable inputs that reflect management’s best estimate of what market participants would use inpricing the asset or liability at the measurement date.
The availability of observable inputs can vary from asset to asset and is affected by a wide variety of factors, including, for example, the type of asset,whether the asset is new and not yet established in the marketplace, and other characteristics particular to the transaction. To the extent that valuation is basedon models or inputs that are less observable or unobservable in the market, the determination of fair value requires more judgment. Accordingly, the degree ofjudgment exercised by the Company in determining fair value is greatest for instruments categorized in Level III. In certain cases, the
10
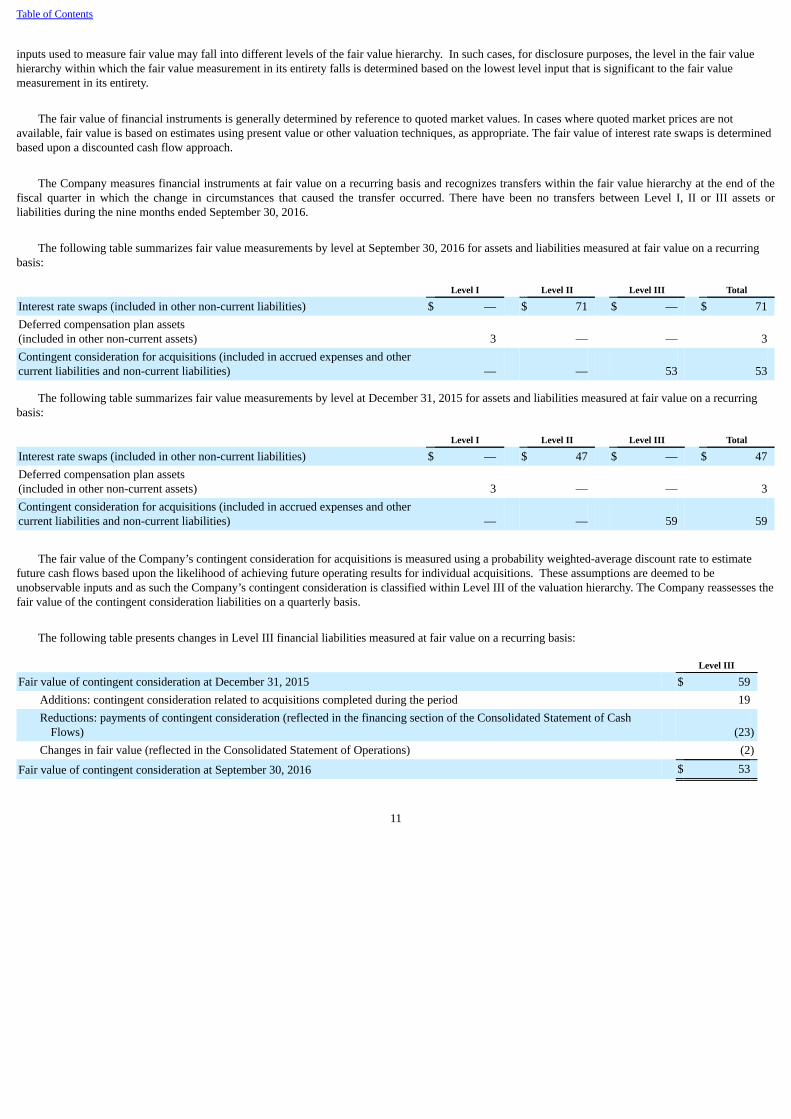
Table of Contents
inputs used to measure fair value may fall into different levels of the fair value hierarchy. In such cases, for disclosure purposes, the level in the fair valuehierarchy within which the fair value measurement in its entirety falls is determined based on the lowest level input that is significant to the fair valuemeasurement in its entirety.
The fair value of financial instruments is generally determined by reference to quoted market values. In cases where quoted market prices are notavailable, fair value is based on estimates using present value or other valuation techniques, as appropriate. The fair value of interest rate swaps is determinedbased upon a discounted cash flow approach.
The Company measures financial instruments at fair value on a recurring basis and recognizes transfers within the fair value hierarchy at the end of thefiscal quarter in which the change in circumstances that caused the transfer occurred. There have been no transfers between Level I, II or III assets orliabilities during the nine months ended September 30, 2016.
The following table summarizes fair value measurements by level at September 30, 2016 for assets and liabilities measured at fair value on a recurringbasis:
Level I Level II Level III Total
Interest rate swaps (included in other non-current liabilities) $ — $ 71 $ — $ 71Deferred compensation plan assets(included in other non-current assets) 3 — — 3Contingent consideration for acquisitions (included in accrued expenses and othercurrent liabilities and non-current liabilities) — — 53 53
The following table summarizes fair value measurements by level at December 31, 2015 for assets and liabilities measured at fair value on a recurringbasis:
Level I Level II Level III Total
Interest rate swaps (included in other non-current liabilities) $ — $ 47 $ — $ 47Deferred compensation plan assets(included in other non-current assets) 3 — — 3Contingent consideration for acquisitions (included in accrued expenses and othercurrent liabilities and non-current liabilities) — — 59 59
The fair value of the Company’s contingent consideration for acquisitions is measured using a probability weighted-average discount rate to estimatefuture cash flows based upon the likelihood of achieving future operating results for individual acquisitions. These assumptions are deemed to beunobservable inputs and as such the Company’s contingent consideration is classified within Level III of the valuation hierarchy. The Company reassesses thefair value of the contingent consideration liabilities on a quarterly basis.
The following table presents changes in Level III financial liabilities measured at fair value on a recurring basis:
Level III
Fair value of contingent consideration at December 31, 2015 $ 59Additions: contingent consideration related to acquisitions completed during the period 19Reductions: payments of contingent consideration (reflected in the financing section of the Consolidated Statement of Cash
Flows) (23)Changes in fair value (reflected in the Consolidated Statement of Operations) (2)
Fair value of contingent consideration at September 30, 2016 $ 53
11
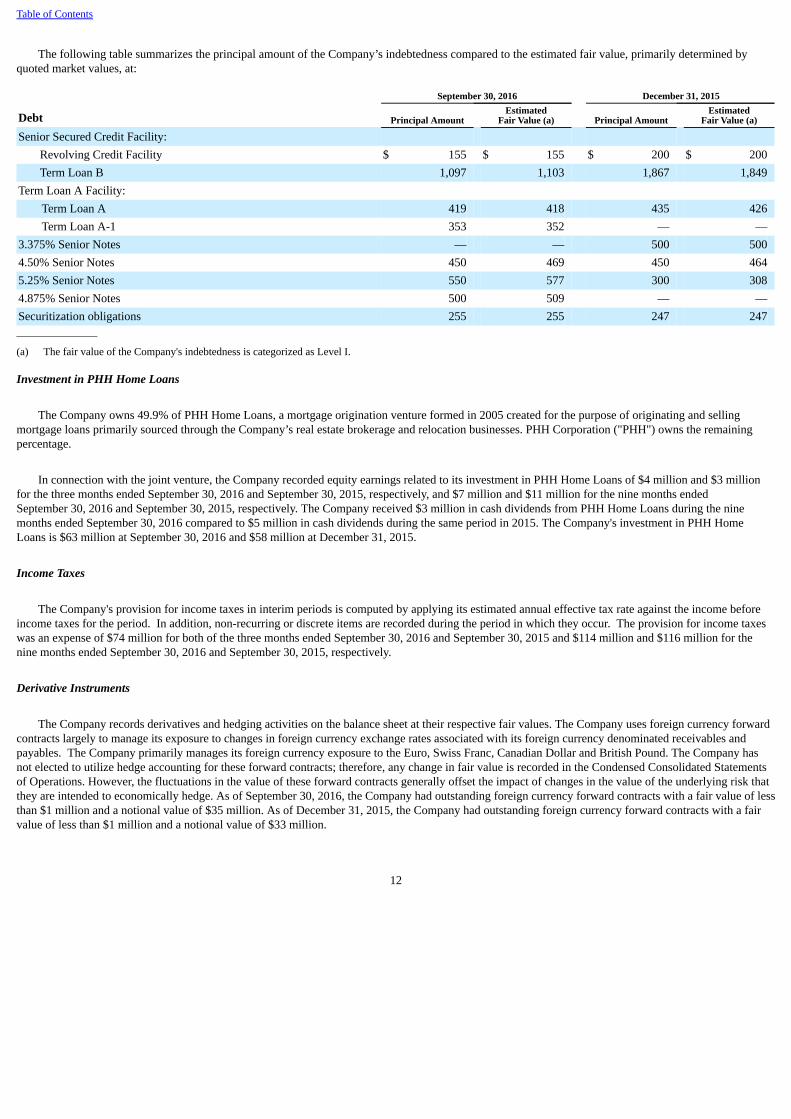
Table of Contents
The following table summarizes the principal amount of the Company’s indebtedness compared to the estimated fair value, primarily determined byquoted market values, at:
September 30, 2016 December 31, 2015
Debt Principal Amount Estimated
Fair Value (a) Principal Amount Estimated
Fair Value (a)
Senior Secured Credit Facility: Revolving Credit Facility $ 155 $ 155 $ 200 $ 200Term Loan B 1,097 1,103 1,867 1,849
Term Loan A Facility: Term Loan A 419 418 435 426Term Loan A-1 353 352 — —
3.375% Senior Notes — — 500 5004.50% Senior Notes 450 469 450 4645.25% Senior Notes 550 577 300 3084.875% Senior Notes 500 509 — —Securitization obligations 255 255 247 247_______________
(a) The fair value of the Company's indebtedness is categorized as Level I.
Investment in PHH Home Loans
The Company owns 49.9% of PHH Home Loans, a mortgage origination venture formed in 2005 created for the purpose of originating and sellingmortgage loans primarily sourced through the Company’s real estate brokerage and relocation businesses. PHH Corporation ("PHH") owns the remainingpercentage.
In connection with the joint venture, the Company recorded equity earnings related to its investment in PHH Home Loans of $4 million and $3 millionfor the three months ended September 30, 2016 and September 30, 2015, respectively, and $7 million and $11 million for the nine months endedSeptember 30, 2016 and September 30, 2015, respectively. The Company received $3 million in cash dividends from PHH Home Loans during the ninemonths ended September 30, 2016 compared to $5 million in cash dividends during the same period in 2015. The Company's investment in PHH HomeLoans is $63 million at September 30, 2016 and $58 million at December 31, 2015.
Income Taxes
The Company's provision for income taxes in interim periods is computed by applying its estimated annual effective tax rate against the income beforeincome taxes for the period. In addition, non-recurring or discrete items are recorded during the period in which they occur. The provision for income taxeswas an expense of $74 million for both of the three months ended September 30, 2016 and September 30, 2015 and $114 million and $116 million for thenine months ended September 30, 2016 and September 30, 2015, respectively.
Derivative Instruments
The Company records derivatives and hedging activities on the balance sheet at their respective fair values. The Company uses foreign currency forwardcontracts largely to manage its exposure to changes in foreign currency exchange rates associated with its foreign currency denominated receivables andpayables. The Company primarily manages its foreign currency exposure to the Euro, Swiss Franc, Canadian Dollar and British Pound. The Company hasnot elected to utilize hedge accounting for these forward contracts; therefore, any change in fair value is recorded in the Condensed Consolidated Statementsof Operations. However, the fluctuations in the value of these forward contracts generally offset the impact of changes in the value of the underlying risk thatthey are intended to economically hedge. As of September 30, 2016, the Company had outstanding foreign currency forward contracts with a fair value of lessthan $1 million and a notional value of $35 million. As of December 31, 2015, the Company had outstanding foreign currency forward contracts with a fairvalue of less than $1 million and a notional value of $33 million.
12
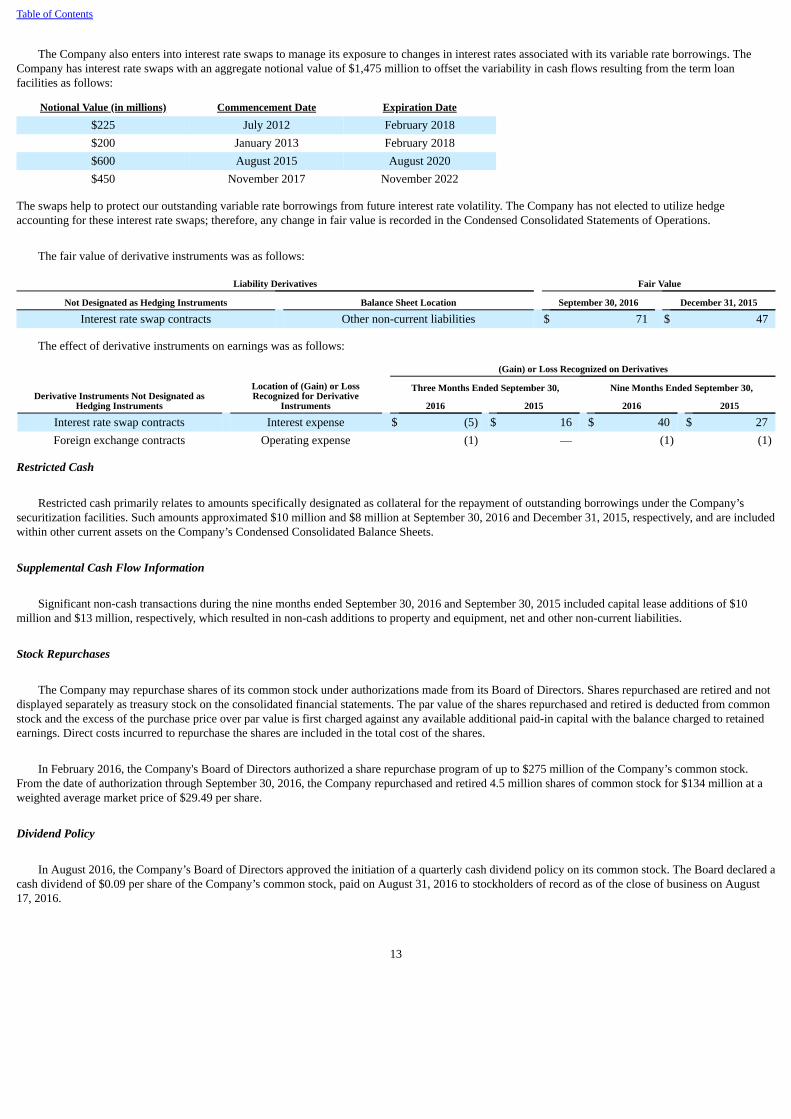
Table of Contents
The Company also enters into interest rate swaps to manage its exposure to changes in interest rates associated with its variable rate borrowings. TheCompany has interest rate swaps with an aggregate notional value of $1,475 million to offset the variability in cash flows resulting from the term loanfacilities as follows:
Notional Value (in millions) Commencement Date Expiration Date
$225 July 2012 February 2018$200 January 2013 February 2018$600 August 2015 August 2020$450 November 2017 November 2022
The swaps help to protect our outstanding variable rate borrowings from future interest rate volatility. The Company has not elected to utilize hedgeaccounting for these interest rate swaps; therefore, any change in fair value is recorded in the Condensed Consolidated Statements of Operations.
The fair value of derivative instruments was as follows:
Liability Derivatives Fair Value
Not Designated as Hedging Instruments Balance Sheet Location September 30, 2016 December 31, 2015
Interest rate swap contracts Other non-current liabilities $ 71 $ 47
The effect of derivative instruments on earnings was as follows:
Derivative Instruments Not Designated asHedging Instruments
Location of (Gain) or LossRecognized for Derivative
Instruments
(Gain) or Loss Recognized on Derivatives
Three Months Ended September 30, Nine Months Ended September 30,
2016 2015 2016 2015
Interest rate swap contracts Interest expense $ (5) $ 16 $ 40 $ 27Foreign exchange contracts Operating expense (1) — (1) (1)
Restricted Cash
Restricted cash primarily relates to amounts specifically designated as collateral for the repayment of outstanding borrowings under the Company’ssecuritization facilities. Such amounts approximated $10 million and $8 million at September 30, 2016 and December 31, 2015, respectively, and are includedwithin other current assets on the Company’s Condensed Consolidated Balance Sheets.
Supplemental Cash Flow Information
Significant non-cash transactions during the nine months ended September 30, 2016 and September 30, 2015 included capital lease additions of $10million and $13 million, respectively, which resulted in non-cash additions to property and equipment, net and other non-current liabilities.
Stock Repurchases
The Company may repurchase shares of its common stock under authorizations made from its Board of Directors. Shares repurchased are retired and notdisplayed separately as treasury stock on the consolidated financial statements. The par value of the shares repurchased and retired is deducted from commonstock and the excess of the purchase price over par value is first charged against any available additional paid-in capital with the balance charged to retainedearnings. Direct costs incurred to repurchase the shares are included in the total cost of the shares.
In February 2016, the Company's Board of Directors authorized a share repurchase program of up to $275 million of the Company’s common stock.From the date of authorization through September 30, 2016, the Company repurchased and retired 4.5 million shares of common stock for $134 million at aweighted average market price of $29.49 per share.
Dividend Policy
In August 2016, the Company’s Board of Directors approved the initiation of a quarterly cash dividend policy on its common stock. The Board declared acash dividend of $0.09 per share of the Company’s common stock, paid on August 31, 2016 to stockholders of record as of the close of business on August17, 2016.
13
Table of Contents
The declaration and payment of any future dividend will be subject to the discretion of the Board of Directors and will depend on a variety of factors,including the Company’s financial condition and results of operations, contractual restrictions, including restrictive covenants contained in the Company’scredit agreements, and the indentures governing the Company’s outstanding debt securities, capital requirements and other factors that the Board of Directorsdeems relevant.
Pursuant to the Company’s policy, the dividends payable in cash are treated as a reduction of additional paid-in capital since the Company is currently ina retained deficit position.
Recently Adopted Accounting Pronouncements
In March 2016, the Financial Accounting Standards Board (the "FASB") issued Accounting Standards Update ("ASU") —Improvements to EmployeeShare-Based Payment Accounting, amending guidance related to employee share-based payment accounting. The Company elected to early adopt this ASU inthe third quarter of 2016 using a modified retrospective approach, effective as if adopted the first day of the fiscal year, January 1, 2016. Adoption of the newguidance resulted in the following:
• The new ASU requires all income tax effects of awards to be recognized in the income statement when the awards vest or are settled and will beapplied on a prospective basis. Any excess tax benefits that were not previously recognized because the related tax deduction had not reduced currenttaxes payable are to be recorded on a modified retrospective basis through a cumulative effect adjustment to retained earnings as of the beginning ofthe period in which the new guidance is adopted. The Company recorded a cumulative increase of $5 million to its January 1, 2016 accumulateddeficit balance with a corresponding decrease in deferred tax liabilities related to the prior years' unrecognized excess tax benefits.
• Furthermore, the guidance requires that income taxes paid by the Company related to the net share settlement for stock-based compensation bepresented as a financing activity on the statement of cash flows and requires retrospective application. The Company applied this cash flowpresentation change which resulted in the reclassification of $6 million and $5 million of taxes paid related to net share settlements of stock-basedcompensation awards from operating activities to financing activities during the nine months ended September 30, 2016 and 2015, respectively.
• In addition, the Company elected to account for forfeitures on share-based payment awards in compensation cost as they occur as opposed toestimating forfeitures. The cumulative impact for the forfeiture change was immaterial and was recorded as a decrease to the January 1, 2016accumulated deficit balance. The current year impact for the change was immaterial and was recognized in the third quarter of 2016.
Recently Issued Accounting Pronouncements
The Company considers the applicability and impact of all Accounting Standards Updates. ASUs not listed below were assessed and determined to beeither not applicable or are expected to have minimal impact on our consolidated financial position or results of operations.
In August 2016, the FASB issued a new standard on classification of cash receipts and payments on the statement of cash flows intending to reducediversity in practice on how certain transactions are classified. The new standard is effective for annual periods beginning after December 15, 2017 and willrequire a retrospective application at the beginning of the earliest comparative period presented in the year of adoption. The Company is currently evaluatingthe impact of the standard on its consolidated financial statements.
In February 2016, the FASB issued its new standard on leases which requires virtually all leases to be recognized on the balance sheet. Lessees willrecognize a right-of-use asset and a lease liability for all leases (other than leases that meet the definition of a short-term lease). The liability will be equal tothe present value of lease payments. The asset will be based on the liability, subject to adjustment, such as for initial direct costs. For income statementpurposes, the FASB retained a dual model, requiring leases to be classified as either operating or finance leases. Operating leases will result in straight-lineexpense, similar to current operating leases, while finance leases will result in a front-loaded expense pattern, similar to current capital leases. Classificationwill be based on criteria that are largely similar to those applied in current lease accounting, but without explicit bright lines. The new standard is effective forannual periods beginning after December 15, 2018. Early adoption is permitted. The new leasing standard requires modified retrospective transition, whichrequires application of the new guidance at the beginning of the earliest comparative period presented in the year of adoption. The Company is currentlyevaluating the impact of the standard on its consolidated financial statements.
14
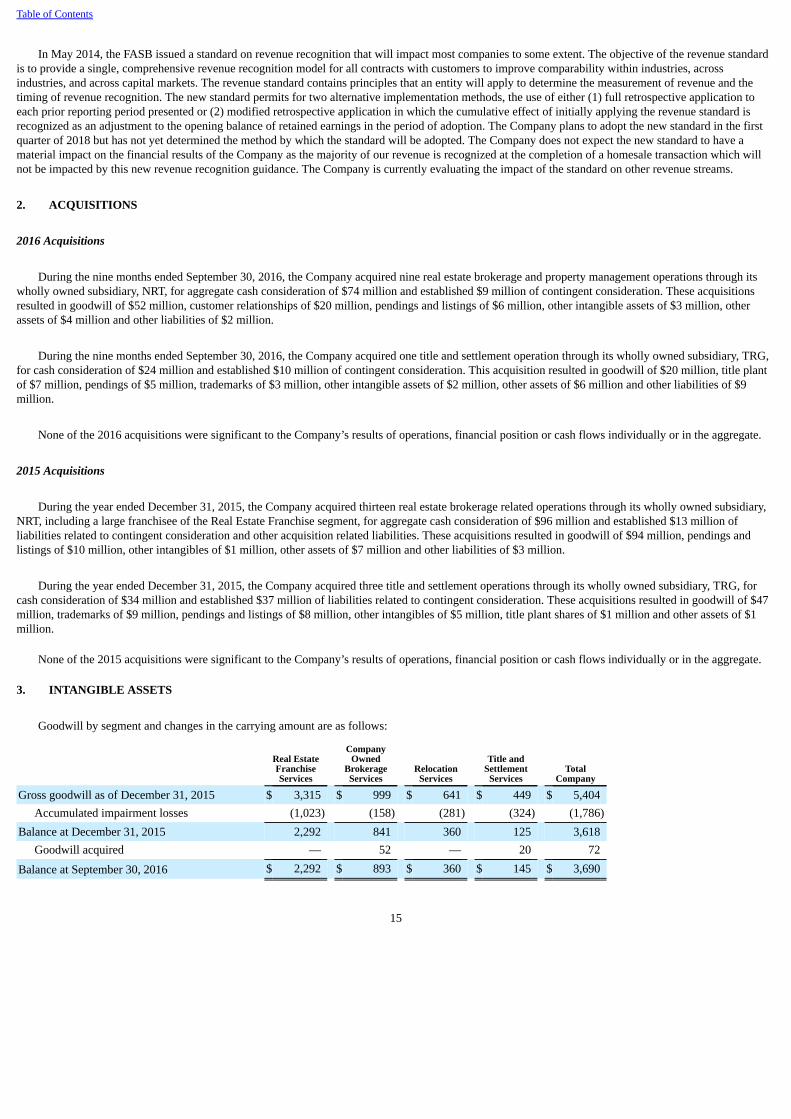
Table of Contents
In May 2014, the FASB issued a standard on revenue recognition that will impact most companies to some extent. The objective of the revenue standardis to provide a single, comprehensive revenue recognition model for all contracts with customers to improve comparability within industries, acrossindustries, and across capital markets. The revenue standard contains principles that an entity will apply to determine the measurement of revenue and thetiming of revenue recognition. The new standard permits for two alternative implementation methods, the use of either (1) full retrospective application toeach prior reporting period presented or (2) modified retrospective application in which the cumulative effect of initially applying the revenue standard isrecognized as an adjustment to the opening balance of retained earnings in the period of adoption. The Company plans to adopt the new standard in the firstquarter of 2018 but has not yet determined the method by which the standard will be adopted. The Company does not expect the new standard to have amaterial impact on the financial results of the Company as the majority of our revenue is recognized at the completion of a homesale transaction which willnot be impacted by this new revenue recognition guidance. The Company is currently evaluating the impact of the standard on other revenue streams.
2. ACQUISITIONS
2016 Acquisitions
During the nine months ended September 30, 2016, the Company acquired nine real estate brokerage and property management operations through itswholly owned subsidiary, NRT, for aggregate cash consideration of $74 million and established $9 million of contingent consideration. These acquisitionsresulted in goodwill of $52 million, customer relationships of $20 million, pendings and listings of $6 million, other intangible assets of $3 million, otherassets of $4 million and other liabilities of $2 million.
During the nine months ended September 30, 2016, the Company acquired one title and settlement operation through its wholly owned subsidiary, TRG,for cash consideration of $24 million and established $10 million of contingent consideration. This acquisition resulted in goodwill of $20 million, title plantof $7 million, pendings of $5 million, trademarks of $3 million, other intangible assets of $2 million, other assets of $6 million and other liabilities of $9million.
None of the 2016 acquisitions were significant to the Company’s results of operations, financial position or cash flows individually or in the aggregate.
2015 Acquisitions
During the year ended December 31, 2015, the Company acquired thirteen real estate brokerage related operations through its wholly owned subsidiary,NRT, including a large franchisee of the Real Estate Franchise segment, for aggregate cash consideration of $96 million and established $13 million ofliabilities related to contingent consideration and other acquisition related liabilities. These acquisitions resulted in goodwill of $94 million, pendings andlistings of $10 million, other intangibles of $1 million, other assets of $7 million and other liabilities of $3 million.
During the year ended December 31, 2015, the Company acquired three title and settlement operations through its wholly owned subsidiary, TRG, forcash consideration of $34 million and established $37 million of liabilities related to contingent consideration. These acquisitions resulted in goodwill of $47million, trademarks of $9 million, pendings and listings of $8 million, other intangibles of $5 million, title plant shares of $1 million and other assets of $1million.
None of the 2015 acquisitions were significant to the Company’s results of operations, financial position or cash flows individually or in the aggregate.
3. INTANGIBLE ASSETS
Goodwill by segment and changes in the carrying amount are as follows:
Real EstateFranchiseServices
CompanyOwned
BrokerageServices
RelocationServices
Title andSettlement
Services Total
Company
Gross goodwill as of December 31, 2015 $ 3,315 $ 999 $ 641 $ 449 $ 5,404Accumulated impairment losses (1,023) (158) (281) (324) (1,786)
Balance at December 31, 2015 2,292 841 360 125 3,618Goodwill acquired — 52 — 20 72
Balance at September 30, 2016 $ 2,292 $ 893 $ 360 $ 145 $ 3,690
15
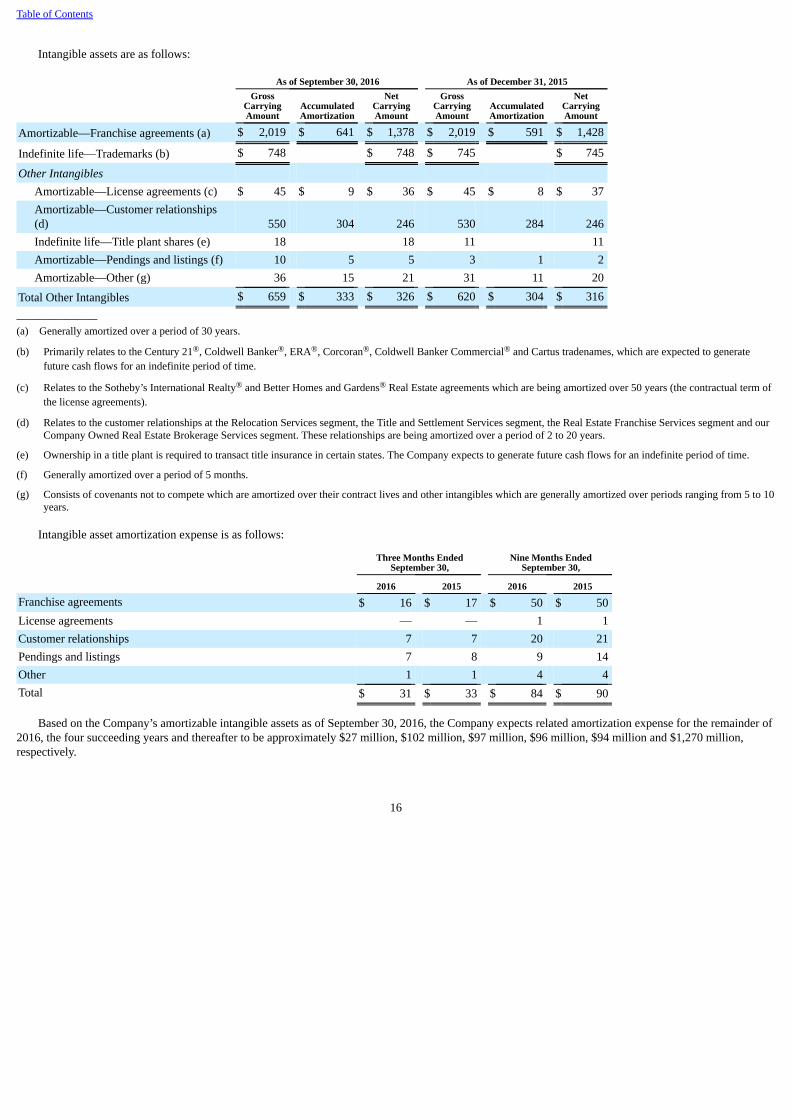
Table of Contents
Intangible assets are as follows:
As of September 30, 2016 As of December 31, 2015
Gross
CarryingAmount
AccumulatedAmortization
NetCarryingAmount
GrossCarryingAmount
AccumulatedAmortization
NetCarryingAmount
Amortizable—Franchise agreements (a) $ 2,019 $ 641 $ 1,378 $ 2,019 $ 591 $ 1,428
Indefinite life—Trademarks (b) $ 748 $ 748 $ 745 $ 745
Other Intangibles Amortizable—License agreements (c) $ 45 $ 9 $ 36 $ 45 $ 8 $ 37Amortizable—Customer relationships(d) 550 304 246 530 284 246Indefinite life—Title plant shares (e) 18 18 11 11Amortizable—Pendings and listings (f) 10 5 5 3 1 2Amortizable—Other (g) 36 15 21 31 11 20
Total Other Intangibles $ 659 $ 333 $ 326 $ 620 $ 304 $ 316_______________(a) Generally amortized over a period of 30 years.
(b) Primarily relates to the Century 21®, Coldwell Banker®, ERA®, Corcoran®, Coldwell Banker Commercial® and Cartus tradenames, which are expected to generatefuture cash flows for an indefinite period of time.
(c) Relates to the Sotheby’s International Realty® and Better Homes and Gardens® Real Estate agreements which are being amortized over 50 years (the contractual term ofthe license agreements).
(d) Relates to the customer relationships at the Relocation Services segment, the Title and Settlement Services segment, the Real Estate Franchise Services segment and ourCompany Owned Real Estate Brokerage Services segment. These relationships are being amortized over a period of 2 to 20 years.
(e) Ownership in a title plant is required to transact title insurance in certain states. The Company expects to generate future cash flows for an indefinite period of time.
(f) Generally amortized over a period of 5 months.
(g) Consists of covenants not to compete which are amortized over their contract lives and other intangibles which are generally amortized over periods ranging from 5 to 10years.
Intangible asset amortization expense is as follows:
Three Months Ended
September 30, Nine Months Ended
September 30,
2016 2015 2016 2015
Franchise agreements $ 16 $ 17 $ 50 $ 50License agreements — — 1 1Customer relationships 7 7 20 21Pendings and listings 7 8 9 14Other 1 1 4 4Total $ 31 $ 33 $ 84 $ 90
Based on the Company’s amortizable intangible assets as of September 30, 2016, the Company expects related amortization expense for the remainder of2016, the four succeeding years and thereafter to be approximately $27 million, $102 million, $97 million, $96 million, $94 million and $1,270 million,respectively.
16
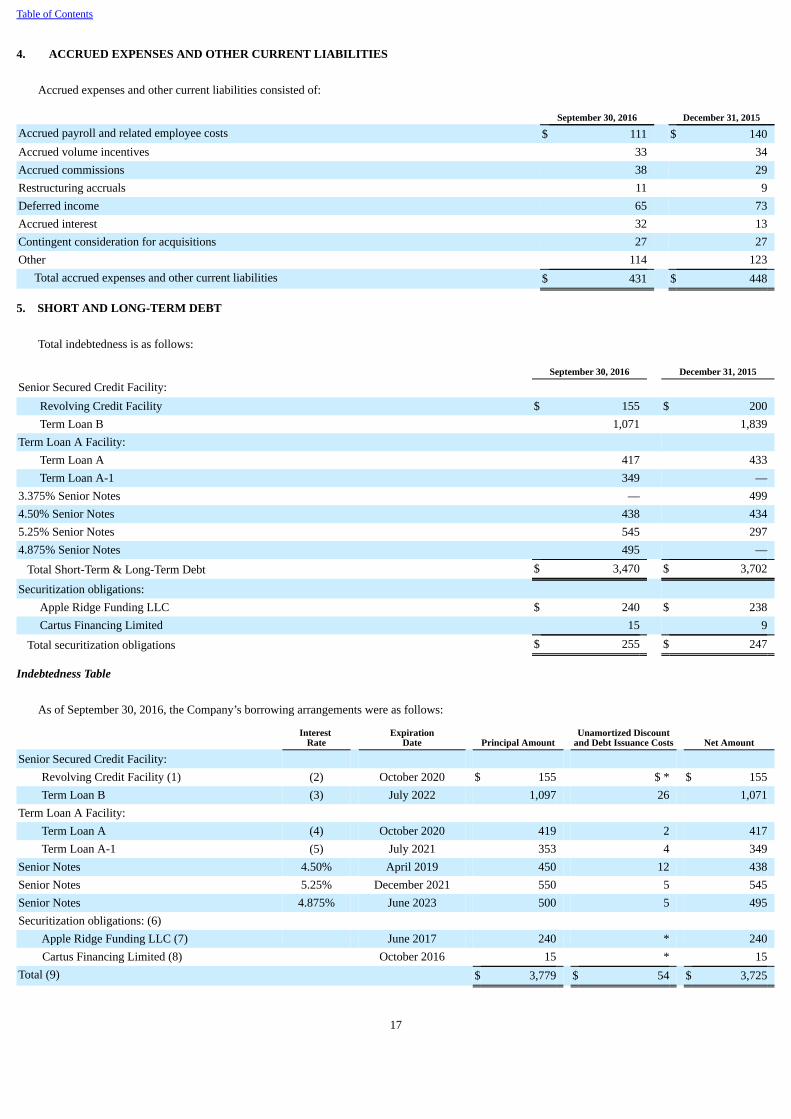
Table of Contents
4. ACCRUED EXPENSES AND OTHER CURRENT LIABILITIES
Accrued expenses and other current liabilities consisted of:
September 30, 2016 December 31, 2015
Accrued payroll and related employee costs $ 111 $ 140Accrued volume incentives 33 34Accrued commissions 38 29Restructuring accruals 11 9Deferred income 65 73Accrued interest 32 13Contingent consideration for acquisitions 27 27Other 114 123
Total accrued expenses and other current liabilities $ 431 $ 448
5. SHORT AND LONG-TERM DEBT
Total indebtedness is as follows:
September 30, 2016 December 31, 2015
Senior Secured Credit Facility: Revolving Credit Facility $ 155 $ 200Term Loan B 1,071 1,839
Term Loan A Facility: Term Loan A 417 433Term Loan A-1 349 —
3.375% Senior Notes — 4994.50% Senior Notes 438 4345.25% Senior Notes 545 2974.875% Senior Notes 495 —
Total Short-Term & Long-Term Debt $ 3,470 $ 3,702
Securitization obligations: Apple Ridge Funding LLC $ 240 $ 238Cartus Financing Limited 15 9
Total securitization obligations $ 255 $ 247
Indebtedness Table
As of September 30, 2016, the Company’s borrowing arrangements were as follows:
Interest
Rate Expiration
Date Principal Amount Unamortized Discount
and Debt Issuance Costs Net Amount
Senior Secured Credit Facility: Revolving Credit Facility (1) (2) October 2020 $ 155 $ * $ 155Term Loan B (3) July 2022 1,097 26 1,071
Term Loan A Facility: Term Loan A (4) October 2020 419 2 417Term Loan A-1 (5) July 2021 353 4 349
Senior Notes 4.50% April 2019 450 12 438Senior Notes 5.25% December 2021 550 5 545Senior Notes 4.875% June 2023 500 5 495Securitization obligations: (6) Apple Ridge Funding LLC (7) June 2017 240 * 240 Cartus Financing Limited (8) October 2016 15 * 15Total (9) $ 3,779 $ 54 $ 3,725
17
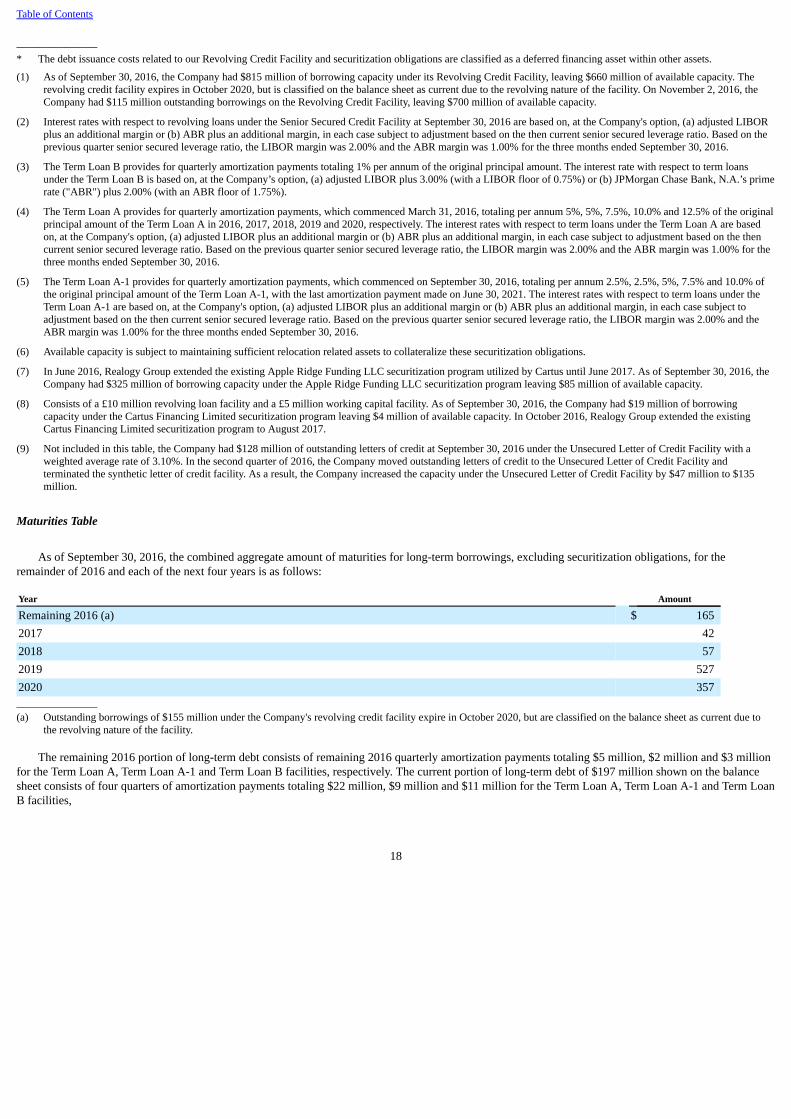
Table of Contents
_______________* The debt issuance costs related to our Revolving Credit Facility and securitization obligations are classified as a deferred financing asset within other assets.
(1) As of September 30, 2016, the Company had $815 million of borrowing capacity under its Revolving Credit Facility, leaving $660 million of available capacity. Therevolving credit facility expires in October 2020, but is classified on the balance sheet as current due to the revolving nature of the facility. On November 2, 2016, theCompany had $115 million outstanding borrowings on the Revolving Credit Facility, leaving $700 million of available capacity.
(2) Interest rates with respect to revolving loans under the Senior Secured Credit Facility at September 30, 2016 are based on, at the Company's option, (a) adjusted LIBORplus an additional margin or (b) ABR plus an additional margin, in each case subject to adjustment based on the then current senior secured leverage ratio. Based on theprevious quarter senior secured leverage ratio, the LIBOR margin was 2.00% and the ABR margin was 1.00% for the three months ended September 30, 2016.
(3) The Term Loan B provides for quarterly amortization payments totaling 1% per annum of the original principal amount. The interest rate with respect to term loansunder the Term Loan B is based on, at the Company’s option, (a) adjusted LIBOR plus 3.00% (with a LIBOR floor of 0.75%) or (b) JPMorgan Chase Bank, N.A.’s primerate ("ABR") plus 2.00% (with an ABR floor of 1.75%).
(4) The Term Loan A provides for quarterly amortization payments, which commenced March 31, 2016, totaling per annum 5%, 5%, 7.5%, 10.0% and 12.5% of the originalprincipal amount of the Term Loan A in 2016, 2017, 2018, 2019 and 2020, respectively. The interest rates with respect to term loans under the Term Loan A are basedon, at the Company's option, (a) adjusted LIBOR plus an additional margin or (b) ABR plus an additional margin, in each case subject to adjustment based on the thencurrent senior secured leverage ratio. Based on the previous quarter senior secured leverage ratio, the LIBOR margin was 2.00% and the ABR margin was 1.00% for thethree months ended September 30, 2016.
(5) The Term Loan A-1 provides for quarterly amortization payments, which commenced on September 30, 2016, totaling per annum 2.5%, 2.5%, 5%, 7.5% and 10.0% ofthe original principal amount of the Term Loan A-1, with the last amortization payment made on June 30, 2021. The interest rates with respect to term loans under theTerm Loan A-1 are based on, at the Company's option, (a) adjusted LIBOR plus an additional margin or (b) ABR plus an additional margin, in each case subject toadjustment based on the then current senior secured leverage ratio. Based on the previous quarter senior secured leverage ratio, the LIBOR margin was 2.00% and theABR margin was 1.00% for the three months ended September 30, 2016.
(6) Available capacity is subject to maintaining sufficient relocation related assets to collateralize these securitization obligations.
(7) In June 2016, Realogy Group extended the existing Apple Ridge Funding LLC securitization program utilized by Cartus until June 2017. As of September 30, 2016, theCompany had $325 million of borrowing capacity under the Apple Ridge Funding LLC securitization program leaving $85 million of available capacity.
(8) Consists of a £10 million revolving loan facility and a £5 million working capital facility. As of September 30, 2016, the Company had $19 million of borrowingcapacity under the Cartus Financing Limited securitization program leaving $4 million of available capacity. In October 2016, Realogy Group extended the existingCartus Financing Limited securitization program to August 2017.
(9) Not included in this table, the Company had $128 million of outstanding letters of credit at September 30, 2016 under the Unsecured Letter of Credit Facility with aweighted average rate of 3.10%. In the second quarter of 2016, the Company moved outstanding letters of credit to the Unsecured Letter of Credit Facility andterminated the synthetic letter of credit facility. As a result, the Company increased the capacity under the Unsecured Letter of Credit Facility by $47 million to $135million.
Maturities Table
As of September 30, 2016, the combined aggregate amount of maturities for long-term borrowings, excluding securitization obligations, for theremainder of 2016 and each of the next four years is as follows:
Year Amount
Remaining 2016 (a) $ 1652017 422018 572019 5272020 357_______________
(a) Outstanding borrowings of $155 million under the Company's revolving credit facility expire in October 2020, but are classified on the balance sheet as current due tothe revolving nature of the facility.
The remaining 2016 portion of long-term debt consists of remaining 2016 quarterly amortization payments totaling $5 million, $2 million and $3 millionfor the Term Loan A, Term Loan A-1 and Term Loan B facilities, respectively. The current portion of long-term debt of $197 million shown on the balancesheet consists of four quarters of amortization payments totaling $22 million, $9 million and $11 million for the Term Loan A, Term Loan A-1 and Term LoanB facilities,
18
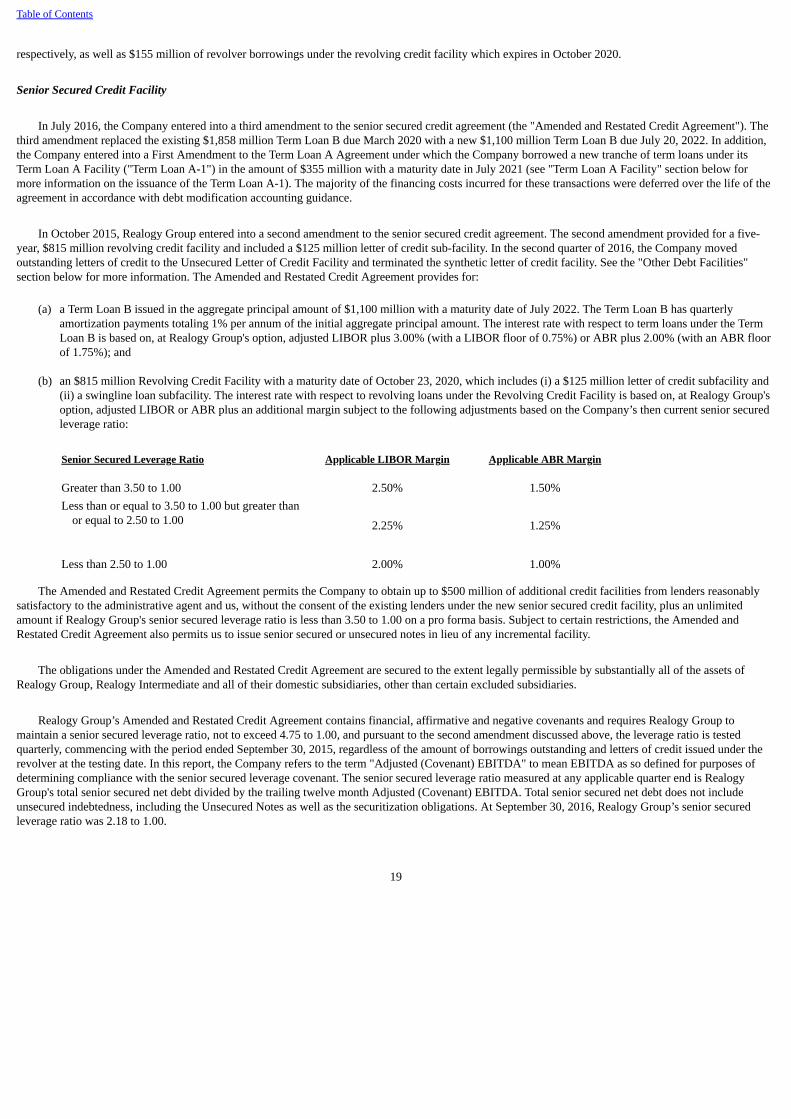
Table of Contents
respectively, as well as $155 million of revolver borrowings under the revolving credit facility which expires in October 2020.
Senior Secured Credit Facility
In July 2016, the Company entered into a third amendment to the senior secured credit agreement (the "Amended and Restated Credit Agreement"). Thethird amendment replaced the existing $1,858 million Term Loan B due March 2020 with a new $1,100 million Term Loan B due July 20, 2022. In addition,the Company entered into a First Amendment to the Term Loan A Agreement under which the Company borrowed a new tranche of term loans under itsTerm Loan A Facility ("Term Loan A-1") in the amount of $355 million with a maturity date in July 2021 (see "Term Loan A Facility" section below formore information on the issuance of the Term Loan A-1). The majority of the financing costs incurred for these transactions were deferred over the life of theagreement in accordance with debt modification accounting guidance.
In October 2015, Realogy Group entered into a second amendment to the senior secured credit agreement. The second amendment provided for a five-year, $815 million revolving credit facility and included a $125 million letter of credit sub-facility. In the second quarter of 2016, the Company movedoutstanding letters of credit to the Unsecured Letter of Credit Facility and terminated the synthetic letter of credit facility. See the "Other Debt Facilities"section below for more information. The Amended and Restated Credit Agreement provides for:
(a) a Term Loan B issued in the aggregate principal amount of $1,100 million with a maturity date of July 2022. The Term Loan B has quarterlyamortization payments totaling 1% per annum of the initial aggregate principal amount. The interest rate with respect to term loans under the TermLoan B is based on, at Realogy Group's option, adjusted LIBOR plus 3.00% (with a LIBOR floor of 0.75%) or ABR plus 2.00% (with an ABR floorof 1.75%); and
(b) an $815 million Revolving Credit Facility with a maturity date of October 23, 2020, which includes (i) a $125 million letter of credit subfacility and(ii) a swingline loan subfacility. The interest rate with respect to revolving loans under the Revolving Credit Facility is based on, at Realogy Group'soption, adjusted LIBOR or ABR plus an additional margin subject to the following adjustments based on the Company’s then current senior securedleverage ratio:
Senior Secured Leverage Ratio Applicable LIBOR Margin Applicable ABR Margin
Greater than 3.50 to 1.00 2.50% 1.50%Less than or equal to 3.50 to 1.00 but greater than
or equal to 2.50 to 1.00 2.25% 1.25%
Less than 2.50 to 1.00 2.00% 1.00%
The Amended and Restated Credit Agreement permits the Company to obtain up to $500 million of additional credit facilities from lenders reasonablysatisfactory to the administrative agent and us, without the consent of the existing lenders under the new senior secured credit facility, plus an unlimitedamount if Realogy Group's senior secured leverage ratio is less than 3.50 to 1.00 on a pro forma basis. Subject to certain restrictions, the Amended andRestated Credit Agreement also permits us to issue senior secured or unsecured notes in lieu of any incremental facility.
The obligations under the Amended and Restated Credit Agreement are secured to the extent legally permissible by substantially all of the assets ofRealogy Group, Realogy Intermediate and all of their domestic subsidiaries, other than certain excluded subsidiaries.
Realogy Group’s Amended and Restated Credit Agreement contains financial, affirmative and negative covenants and requires Realogy Group tomaintain a senior secured leverage ratio, not to exceed 4.75 to 1.00, and pursuant to the second amendment discussed above, the leverage ratio is testedquarterly, commencing with the period ended September 30, 2015, regardless of the amount of borrowings outstanding and letters of credit issued under therevolver at the testing date. In this report, the Company refers to the term "Adjusted (Covenant) EBITDA" to mean EBITDA as so defined for purposes ofdetermining compliance with the senior secured leverage covenant. The senior secured leverage ratio measured at any applicable quarter end is RealogyGroup's total senior secured net debt divided by the trailing twelve month Adjusted (Covenant) EBITDA. Total senior secured net debt does not includeunsecured indebtedness, including the Unsecured Notes as well as the securitization obligations. At September 30, 2016, Realogy Group’s senior securedleverage ratio was 2.18 to 1.00.
19
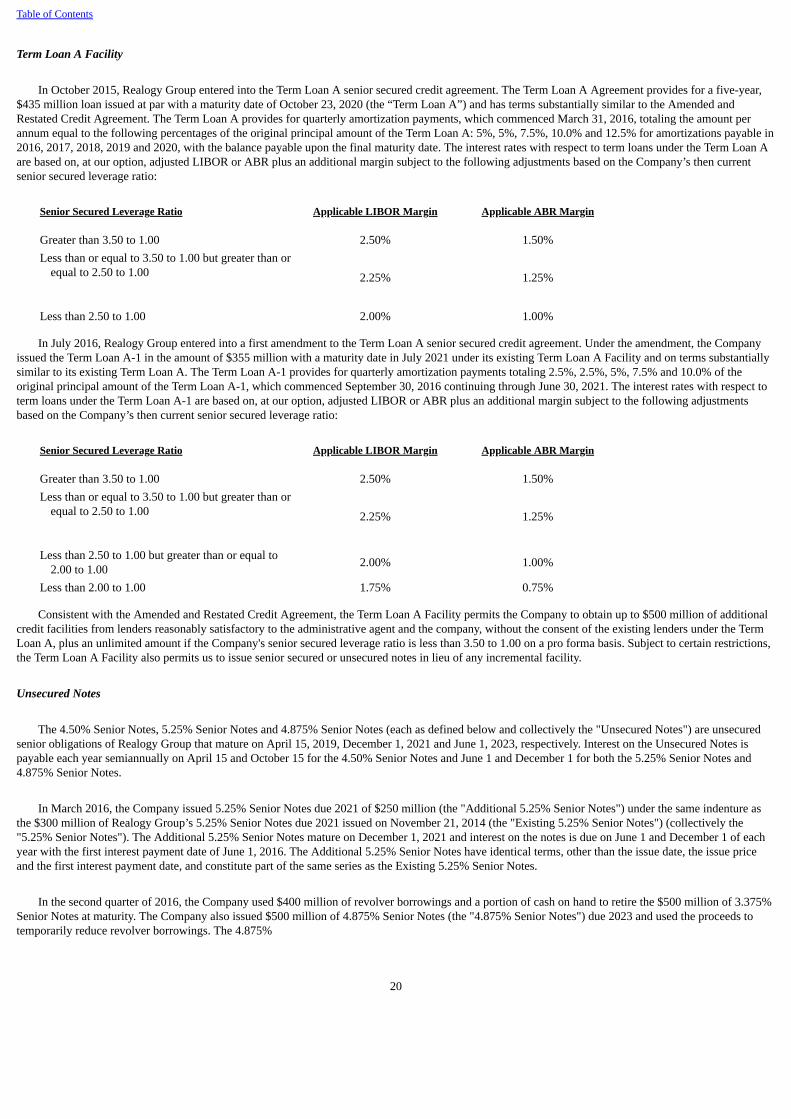
Table of Contents
Term Loan A Facility
In October 2015, Realogy Group entered into the Term Loan A senior secured credit agreement. The Term Loan A Agreement provides for a five-year,$435 million loan issued at par with a maturity date of October 23, 2020 (the “Term Loan A”) and has terms substantially similar to the Amended andRestated Credit Agreement. The Term Loan A provides for quarterly amortization payments, which commenced March 31, 2016, totaling the amount perannum equal to the following percentages of the original principal amount of the Term Loan A: 5%, 5%, 7.5%, 10.0% and 12.5% for amortizations payable in2016, 2017, 2018, 2019 and 2020, with the balance payable upon the final maturity date. The interest rates with respect to term loans under the Term Loan Aare based on, at our option, adjusted LIBOR or ABR plus an additional margin subject to the following adjustments based on the Company’s then currentsenior secured leverage ratio:
Senior Secured Leverage Ratio Applicable LIBOR Margin Applicable ABR Margin
Greater than 3.50 to 1.00 2.50% 1.50%Less than or equal to 3.50 to 1.00 but greater than or
equal to 2.50 to 1.00 2.25% 1.25%
Less than 2.50 to 1.00 2.00% 1.00%
In July 2016, Realogy Group entered into a first amendment to the Term Loan A senior secured credit agreement. Under the amendment, the Companyissued the Term Loan A-1 in the amount of $355 million with a maturity date in July 2021 under its existing Term Loan A Facility and on terms substantiallysimilar to its existing Term Loan A. The Term Loan A-1 provides for quarterly amortization payments totaling 2.5%, 2.5%, 5%, 7.5% and 10.0% of theoriginal principal amount of the Term Loan A-1, which commenced September 30, 2016 continuing through June 30, 2021. The interest rates with respect toterm loans under the Term Loan A-1 are based on, at our option, adjusted LIBOR or ABR plus an additional margin subject to the following adjustmentsbased on the Company’s then current senior secured leverage ratio:
Senior Secured Leverage Ratio Applicable LIBOR Margin Applicable ABR Margin
Greater than 3.50 to 1.00 2.50% 1.50%Less than or equal to 3.50 to 1.00 but greater than or
equal to 2.50 to 1.00 2.25% 1.25%
Less than 2.50 to 1.00 but greater than or equal to2.00 to 1.00 2.00% 1.00%
Less than 2.00 to 1.00 1.75% 0.75%
Consistent with the Amended and Restated Credit Agreement, the Term Loan A Facility permits the Company to obtain up to $500 million of additionalcredit facilities from lenders reasonably satisfactory to the administrative agent and the company, without the consent of the existing lenders under the TermLoan A, plus an unlimited amount if the Company's senior secured leverage ratio is less than 3.50 to 1.00 on a pro forma basis. Subject to certain restrictions,the Term Loan A Facility also permits us to issue senior secured or unsecured notes in lieu of any incremental facility.
Unsecured Notes
The 4.50% Senior Notes, 5.25% Senior Notes and 4.875% Senior Notes (each as defined below and collectively the "Unsecured Notes") are unsecuredsenior obligations of Realogy Group that mature on April 15, 2019, December 1, 2021 and June 1, 2023, respectively. Interest on the Unsecured Notes ispayable each year semiannually on April 15 and October 15 for the 4.50% Senior Notes and June 1 and December 1 for both the 5.25% Senior Notes and4.875% Senior Notes.
In March 2016, the Company issued 5.25% Senior Notes due 2021 of $250 million (the "Additional 5.25% Senior Notes") under the same indenture asthe $300 million of Realogy Group’s 5.25% Senior Notes due 2021 issued on November 21, 2014 (the "Existing 5.25% Senior Notes") (collectively the"5.25% Senior Notes"). The Additional 5.25% Senior Notes mature on December 1, 2021 and interest on the notes is due on June 1 and December 1 of eachyear with the first interest payment date of June 1, 2016. The Additional 5.25% Senior Notes have identical terms, other than the issue date, the issue priceand the first interest payment date, and constitute part of the same series as the Existing 5.25% Senior Notes.
In the second quarter of 2016, the Company used $400 million of revolver borrowings and a portion of cash on hand to retire the $500 million of 3.375%Senior Notes at maturity. The Company also issued $500 million of 4.875% Senior Notes (the "4.875% Senior Notes") due 2023 and used the proceeds totemporarily reduce revolver borrowings. The 4.875%
20

Table of Contents
Senior Notes mature on June 1, 2023 and interest on the 4.875% Notes is due on June 1 and December 1 of each year with the first interest payment date ofDecember 1, 2016.
The Unsecured Notes are guaranteed on an unsecured senior basis by each domestic subsidiary of Realogy Group that is a guarantor under the SeniorSecured Credit Facility and Realogy Group's outstanding debt securities and are guaranteed by Realogy Holdings on an unsecured senior subordinated basis.
Other Debt Facilities
The Company has an Unsecured Letter of Credit Facility to provide for the issuance of letters of credit required for general corporate purposes by theCompany. In the second quarter of 2016, the Company increased the capacity under the facility by $47 million from $88 million to $135 million. Thefacility's expiration dates are as follows:
Capacity (in millions) Expiration Date
$53 June 2017$16 September 2018$66 December 2019
The fixed pricing to the Company is based on a spread above the credit default swap rate for senior unsecured debt obligations of the Company over theapplicable letter of credit period. Realogy Group's obligations under the Unsecured Letter of Credit Facility are guaranteed on an unsecured senior basis byeach domestic subsidiary of Realogy Group that is a guarantor under the Senior Secured Credit Facility and Realogy Group's outstanding debt securities. Asof September 30, 2016, $128 million of the Facility is being utilized.
Securitization Obligations
Realogy Group has secured obligations through Apple Ridge Funding LLC under a securitization program. In June 2016, Realogy Group extended theprogram until June 2017. The program has a capacity of $325 million. At September 30, 2016, Realogy Group has $240 million of outstanding borrowingsunder the facility.
Realogy Group, through a special purpose entity known as Cartus Financing Limited, has agreements providing for a £10 million revolving loan facilityand a £5 million working capital facility, both of which expire on October 31, 2016. In October 2016, Realogy Group extended the facility to August 2017.There are $15 million of outstanding borrowings on the facilities at September 30, 2016. These Cartus Financing Limited facilities are secured by therelocation assets of a U.K. government contract in this special purpose entity and are therefore classified as permitted securitization financings as defined inRealogy Group’s Senior Secured Credit Facility and the indentures governing the Unsecured Notes.
The Apple Ridge entities and the Cartus Financing Limited entity are consolidated special purpose entities that are utilized to securitize relocationreceivables and related assets. These assets are generated from advancing funds on behalf of clients of Realogy Group’s relocation business in order tofacilitate the relocation of their employees. Assets of these special purpose entities are not available to pay Realogy Group’s general obligations. Under theApple Ridge program, provided no termination or amortization event has occurred, any new receivables generated under the designated relocationmanagement agreements are sold into the securitization program and as new eligible relocation management agreements are entered into, the new agreementsare designated to the program. The Apple Ridge program has restrictive covenants and trigger events, including performance triggers linked to the age andquality of the underlying assets, foreign obligor limits, multicurrency limits, financial reporting requirements, restrictions on mergers and change of control,any uncured breach of Realogy Group’s senior secured leverage ratio under Realogy Group’s Senior Secured Credit Facility, and cross-defaults to RealogyGroup’s material indebtedness. The occurrence of a trigger event under the Apple Ridge securitization facility could restrict our ability to access new orexisting funding under this facility or result in termination of the facility, either of which would adversely affect the operation of our relocation business.
Certain of the funds that Realogy Group receives from relocation receivables and related assets must be utilized to repay securitization obligations. Theseobligations were collateralized by $282 million and $281 million of underlying relocation receivables and other related relocation assets at September 30,2016 and December 31, 2015, respectively. Substantially all relocation related assets are realized in less than twelve months from the transaction date.Accordingly, all of Realogy Group’s securitization obligations are classified as current in the accompanying Condensed Consolidated Balance Sheets.
21
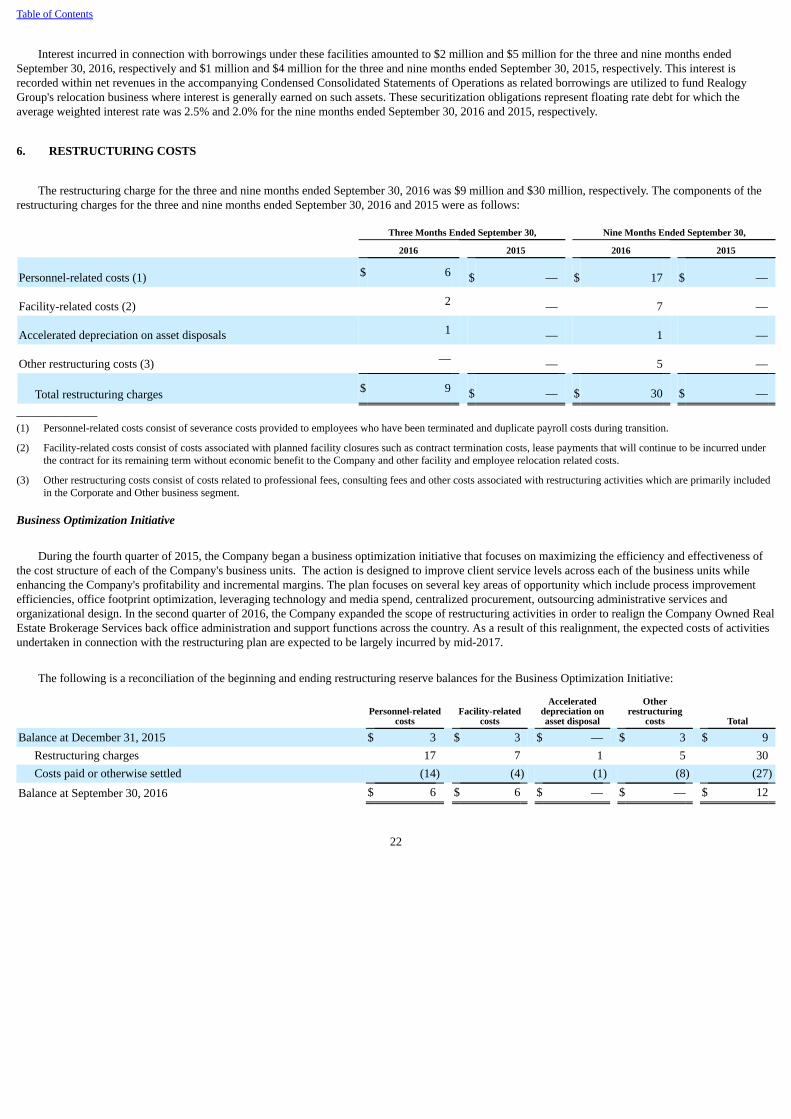
Table of Contents
Interest incurred in connection with borrowings under these facilities amounted to $2 million and $5 million for the three and nine months endedSeptember 30, 2016, respectively and $1 million and $4 million for the three and nine months ended September 30, 2015, respectively. This interest isrecorded within net revenues in the accompanying Condensed Consolidated Statements of Operations as related borrowings are utilized to fund RealogyGroup's relocation business where interest is generally earned on such assets. These securitization obligations represent floating rate debt for which theaverage weighted interest rate was 2.5% and 2.0% for the nine months ended September 30, 2016 and 2015, respectively.
6. RESTRUCTURING COSTS
The restructuring charge for the three and nine months ended September 30, 2016 was $9 million and $30 million, respectively. The components of therestructuring charges for the three and nine months ended September 30, 2016 and 2015 were as follows:
Three Months Ended September 30, Nine Months Ended September 30,
2016 2015 2016 2015
Personnel-related costs (1) $ 6 $ — $ 17 $ —
Facility-related costs (2) 2 — 7 —
Accelerated depreciation on asset disposals 1 — 1 —
Other restructuring costs (3) — — 5 —
Total restructuring charges $ 9 $ — $ 30 $ —_______________(1) Personnel-related costs consist of severance costs provided to employees who have been terminated and duplicate payroll costs during transition.
(2) Facility-related costs consist of costs associated with planned facility closures such as contract termination costs, lease payments that will continue to be incurred underthe contract for its remaining term without economic benefit to the Company and other facility and employee relocation related costs.
(3) Other restructuring costs consist of costs related to professional fees, consulting fees and other costs associated with restructuring activities which are primarily includedin the Corporate and Other business segment.
Business Optimization Initiative
During the fourth quarter of 2015, the Company began a business optimization initiative that focuses on maximizing the efficiency and effectiveness ofthe cost structure of each of the Company's business units. The action is designed to improve client service levels across each of the business units whileenhancing the Company's profitability and incremental margins. The plan focuses on several key areas of opportunity which include process improvementefficiencies, office footprint optimization, leveraging technology and media spend, centralized procurement, outsourcing administrative services andorganizational design. In the second quarter of 2016, the Company expanded the scope of restructuring activities in order to realign the Company Owned RealEstate Brokerage Services back office administration and support functions across the country. As a result of this realignment, the expected costs of activitiesundertaken in connection with the restructuring plan are expected to be largely incurred by mid-2017.
The following is a reconciliation of the beginning and ending restructuring reserve balances for the Business Optimization Initiative:
Personnel-related
costs Facility-related
costs Accelerated
depreciation onasset disposal
Otherrestructuring
costs Total
Balance at December 31, 2015 $ 3 $ 3 $ — $ 3 $ 9Restructuring charges 17 7 1 5 30Costs paid or otherwise settled (14) (4) (1) (8) (27)
Balance at September 30, 2016 $ 6 $ 6 $ — $ — $ 12
22
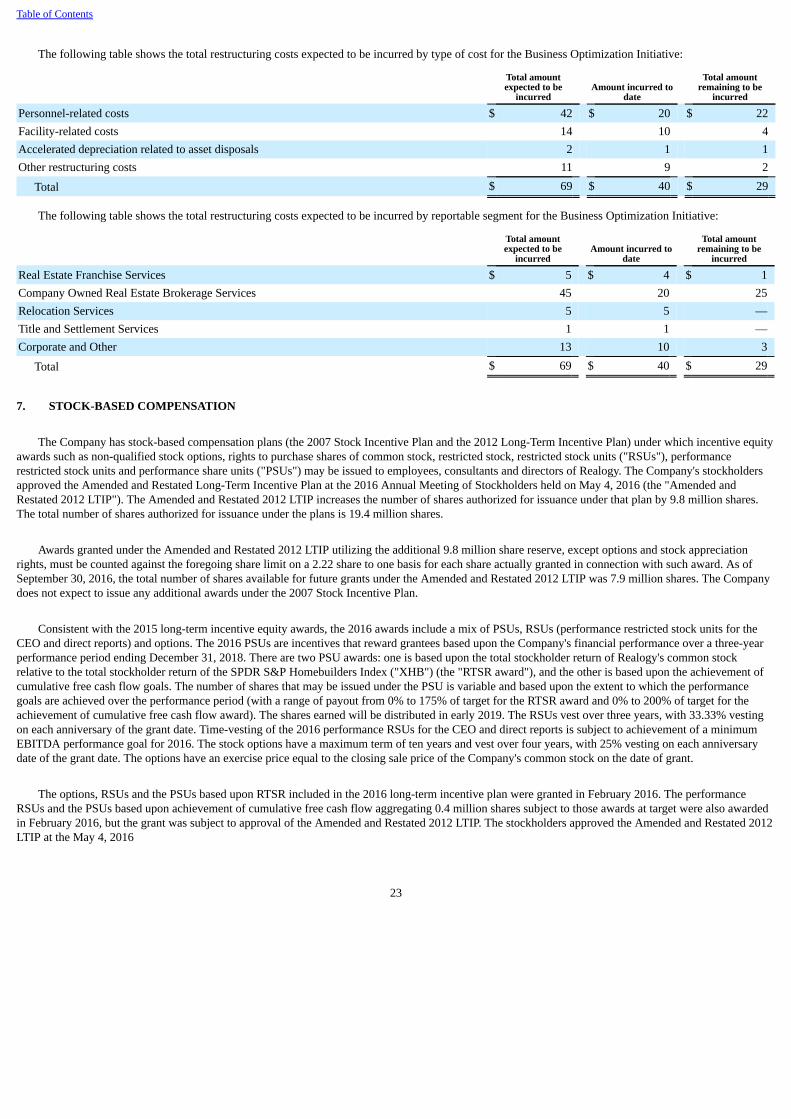
Table of Contents
The following table shows the total restructuring costs expected to be incurred by type of cost for the Business Optimization Initiative:
Total amountexpected to be
incurred Amount incurred to
date
Total amountremaining to be
incurred
Personnel-related costs $ 42 $ 20 $ 22Facility-related costs 14 10 4Accelerated depreciation related to asset disposals 2 1 1Other restructuring costs 11 9 2
Total $ 69 $ 40 $ 29
The following table shows the total restructuring costs expected to be incurred by reportable segment for the Business Optimization Initiative:
Total amountexpected to be
incurred Amount incurred to
date
Total amountremaining to be
incurred
Real Estate Franchise Services $ 5 $ 4 $ 1Company Owned Real Estate Brokerage Services 45 20 25Relocation Services 5 5 —Title and Settlement Services 1 1 —Corporate and Other 13 10 3
Total $ 69 $ 40 $ 29
7. STOCK-BASED COMPENSATION
The Company has stock-based compensation plans (the 2007 Stock Incentive Plan and the 2012 Long-Term Incentive Plan) under which incentive equityawards such as non-qualified stock options, rights to purchase shares of common stock, restricted stock, restricted stock units ("RSUs"), performancerestricted stock units and performance share units ("PSUs") may be issued to employees, consultants and directors of Realogy. The Company's stockholdersapproved the Amended and Restated Long-Term Incentive Plan at the 2016 Annual Meeting of Stockholders held on May 4, 2016 (the "Amended andRestated 2012 LTIP"). The Amended and Restated 2012 LTIP increases the number of shares authorized for issuance under that plan by 9.8 million shares.The total number of shares authorized for issuance under the plans is 19.4 million shares.
Awards granted under the Amended and Restated 2012 LTIP utilizing the additional 9.8 million share reserve, except options and stock appreciationrights, must be counted against the foregoing share limit on a 2.22 share to one basis for each share actually granted in connection with such award. As ofSeptember 30, 2016, the total number of shares available for future grants under the Amended and Restated 2012 LTIP was 7.9 million shares. The Companydoes not expect to issue any additional awards under the 2007 Stock Incentive Plan.
Consistent with the 2015 long-term incentive equity awards, the 2016 awards include a mix of PSUs, RSUs (performance restricted stock units for theCEO and direct reports) and options. The 2016 PSUs are incentives that reward grantees based upon the Company's financial performance over a three-yearperformance period ending December 31, 2018. There are two PSU awards: one is based upon the total stockholder return of Realogy's common stockrelative to the total stockholder return of the SPDR S&P Homebuilders Index ("XHB") (the "RTSR award"), and the other is based upon the achievement ofcumulative free cash flow goals. The number of shares that may be issued under the PSU is variable and based upon the extent to which the performancegoals are achieved over the performance period (with a range of payout from 0% to 175% of target for the RTSR award and 0% to 200% of target for theachievement of cumulative free cash flow award). The shares earned will be distributed in early 2019. The RSUs vest over three years, with 33.33% vestingon each anniversary of the grant date. Time-vesting of the 2016 performance RSUs for the CEO and direct reports is subject to achievement of a minimumEBITDA performance goal for 2016. The stock options have a maximum term of ten years and vest over four years, with 25% vesting on each anniversarydate of the grant date. The options have an exercise price equal to the closing sale price of the Company's common stock on the date of grant.
The options, RSUs and the PSUs based upon RTSR included in the 2016 long-term incentive plan were granted in February 2016. The performanceRSUs and the PSUs based upon achievement of cumulative free cash flow aggregating 0.4 million shares subject to those awards at target were also awardedin February 2016, but the grant was subject to approval of the Amended and Restated 2012 LTIP. The stockholders approved the Amended and Restated 2012LTIP at the May 4, 2016
23
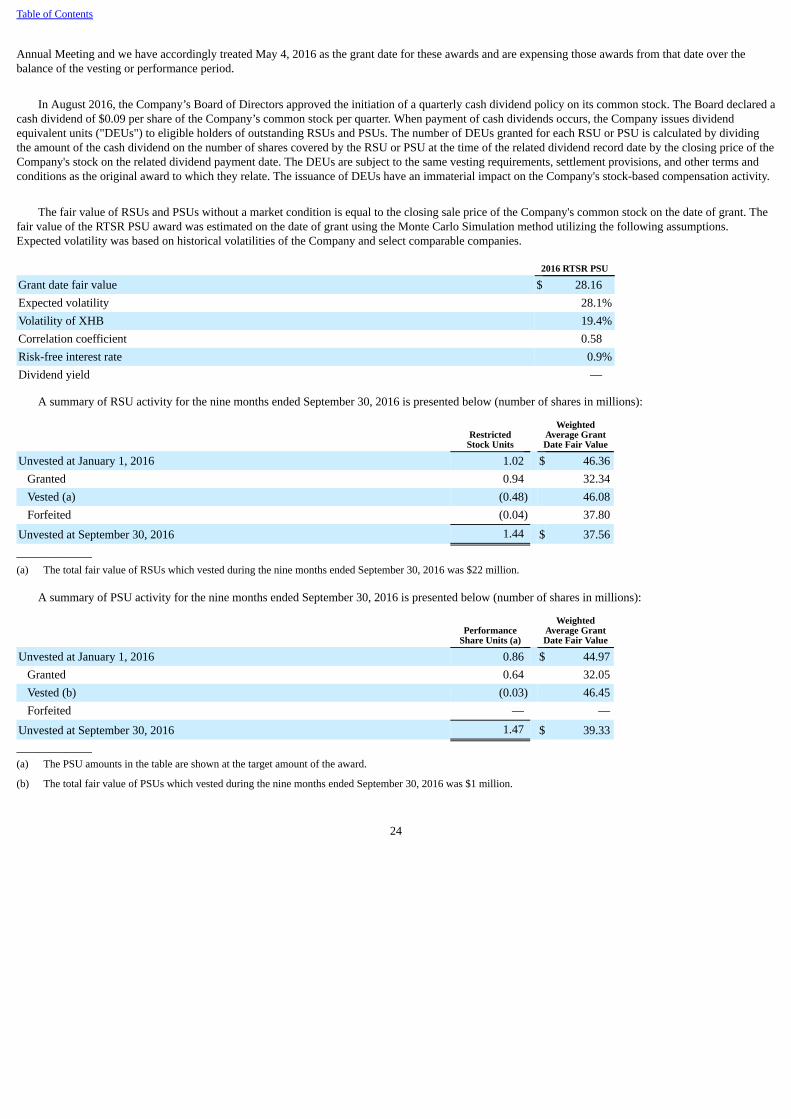
Table of Contents
Annual Meeting and we have accordingly treated May 4, 2016 as the grant date for these awards and are expensing those awards from that date over thebalance of the vesting or performance period.
In August 2016, the Company’s Board of Directors approved the initiation of a quarterly cash dividend policy on its common stock. The Board declared acash dividend of $0.09 per share of the Company’s common stock per quarter. When payment of cash dividends occurs, the Company issues dividendequivalent units ("DEUs") to eligible holders of outstanding RSUs and PSUs. The number of DEUs granted for each RSU or PSU is calculated by dividingthe amount of the cash dividend on the number of shares covered by the RSU or PSU at the time of the related dividend record date by the closing price of theCompany's stock on the related dividend payment date. The DEUs are subject to the same vesting requirements, settlement provisions, and other terms andconditions as the original award to which they relate. The issuance of DEUs have an immaterial impact on the Company's stock-based compensation activity.
The fair value of RSUs and PSUs without a market condition is equal to the closing sale price of the Company's common stock on the date of grant. Thefair value of the RTSR PSU award was estimated on the date of grant using the Monte Carlo Simulation method utilizing the following assumptions.Expected volatility was based on historical volatilities of the Company and select comparable companies.
2016 RTSR PSU
Grant date fair value $ 28.16Expected volatility 28.1%Volatility of XHB 19.4%Correlation coefficient 0.58Risk-free interest rate 0.9%Dividend yield —
A summary of RSU activity for the nine months ended September 30, 2016 is presented below (number of shares in millions):
Restricted
Stock Units Weighted
Average GrantDate Fair Value
Unvested at January 1, 2016 1.02 $ 46.36Granted 0.94 32.34Vested (a) (0.48) 46.08Forfeited (0.04) 37.80
Unvested at September 30, 2016 1.44 $ 37.56______________(a) The total fair value of RSUs which vested during the nine months ended September 30, 2016 was $22 million.
A summary of PSU activity for the nine months ended September 30, 2016 is presented below (number of shares in millions):
Performance
Share Units (a) Weighted
Average GrantDate Fair Value
Unvested at January 1, 2016 0.86 $ 44.97Granted 0.64 32.05Vested (b) (0.03) 46.45Forfeited — —
Unvested at September 30, 2016 1.47 $ 39.33______________(a) The PSU amounts in the table are shown at the target amount of the award.
(b) The total fair value of PSUs which vested during the nine months ended September 30, 2016 was $1 million.
24
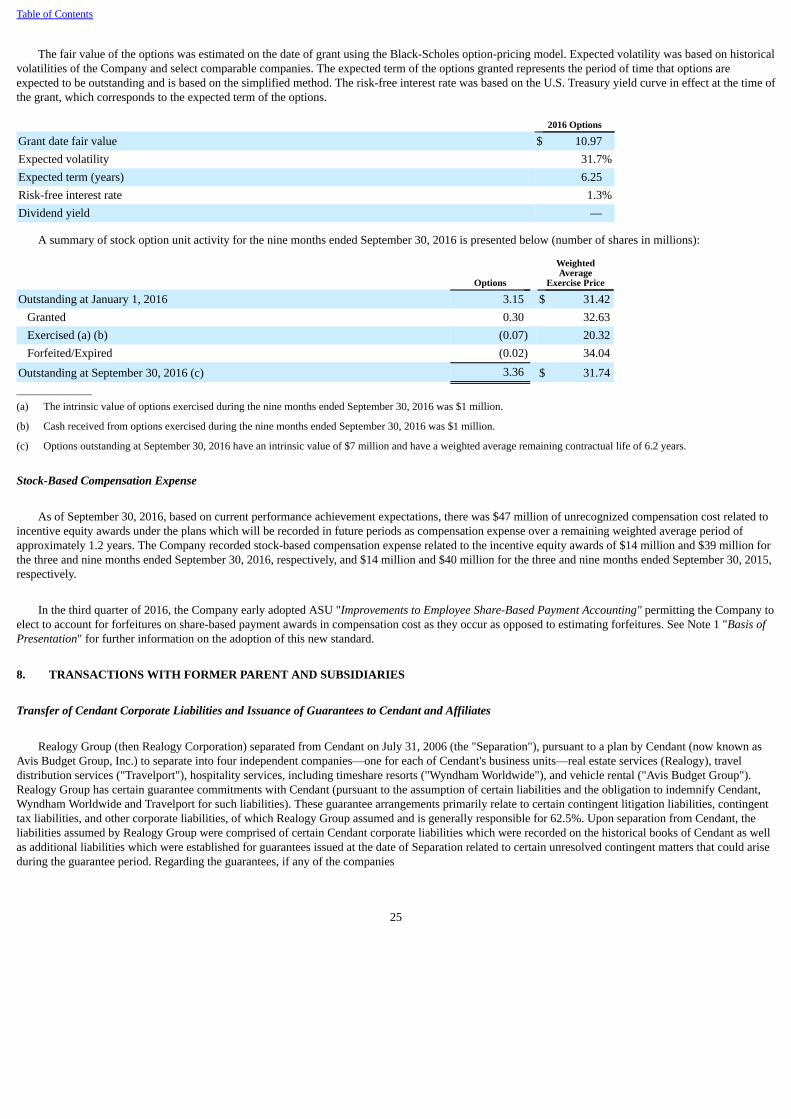
Table of Contents
The fair value of the options was estimated on the date of grant using the Black-Scholes option-pricing model. Expected volatility was based on historicalvolatilities of the Company and select comparable companies. The expected term of the options granted represents the period of time that options areexpected to be outstanding and is based on the simplified method. The risk-free interest rate was based on the U.S. Treasury yield curve in effect at the time ofthe grant, which corresponds to the expected term of the options.
2016 Options
Grant date fair value $ 10.97Expected volatility 31.7%Expected term (years) 6.25Risk-free interest rate 1.3%Dividend yield —
A summary of stock option unit activity for the nine months ended September 30, 2016 is presented below (number of shares in millions):
Options WeightedAverage
Exercise Price
Outstanding at January 1, 2016 3.15 $ 31.42Granted 0.30 32.63Exercised (a) (b) (0.07) 20.32Forfeited/Expired (0.02) 34.04
Outstanding at September 30, 2016 (c) 3.36 $ 31.74______________(a) The intrinsic value of options exercised during the nine months ended September 30, 2016 was $1 million.
(b) Cash received from options exercised during the nine months ended September 30, 2016 was $1 million.
(c) Options outstanding at September 30, 2016 have an intrinsic value of $7 million and have a weighted average remaining contractual life of 6.2 years.
Stock-Based Compensation Expense
As of September 30, 2016, based on current performance achievement expectations, there was $47 million of unrecognized compensation cost related toincentive equity awards under the plans which will be recorded in future periods as compensation expense over a remaining weighted average period ofapproximately 1.2 years. The Company recorded stock-based compensation expense related to the incentive equity awards of $14 million and $39 million forthe three and nine months ended September 30, 2016, respectively, and $14 million and $40 million for the three and nine months ended September 30, 2015,respectively.
In the third quarter of 2016, the Company early adopted ASU "Improvements to Employee Share-Based Payment Accounting" permitting the Company toelect to account for forfeitures on share-based payment awards in compensation cost as they occur as opposed to estimating forfeitures. See Note 1 "Basis ofPresentation" for further information on the adoption of this new standard.
8. TRANSACTIONS WITH FORMER PARENT AND SUBSIDIARIES
Transfer of Cendant Corporate Liabilities and Issuance of Guarantees to Cendant and Affiliates
Realogy Group (then Realogy Corporation) separated from Cendant on July 31, 2006 (the "Separation"), pursuant to a plan by Cendant (now known asAvis Budget Group, Inc.) to separate into four independent companies—one for each of Cendant's business units—real estate services (Realogy), traveldistribution services ("Travelport"), hospitality services, including timeshare resorts ("Wyndham Worldwide"), and vehicle rental ("Avis Budget Group").Realogy Group has certain guarantee commitments with Cendant (pursuant to the assumption of certain liabilities and the obligation to indemnify Cendant,Wyndham Worldwide and Travelport for such liabilities). These guarantee arrangements primarily relate to certain contingent litigation liabilities, contingenttax liabilities, and other corporate liabilities, of which Realogy Group assumed and is generally responsible for 62.5%. Upon separation from Cendant, theliabilities assumed by Realogy Group were comprised of certain Cendant corporate liabilities which were recorded on the historical books of Cendant as wellas additional liabilities which were established for guarantees issued at the date of Separation related to certain unresolved contingent matters that could ariseduring the guarantee period. Regarding the guarantees, if any of the companies
25
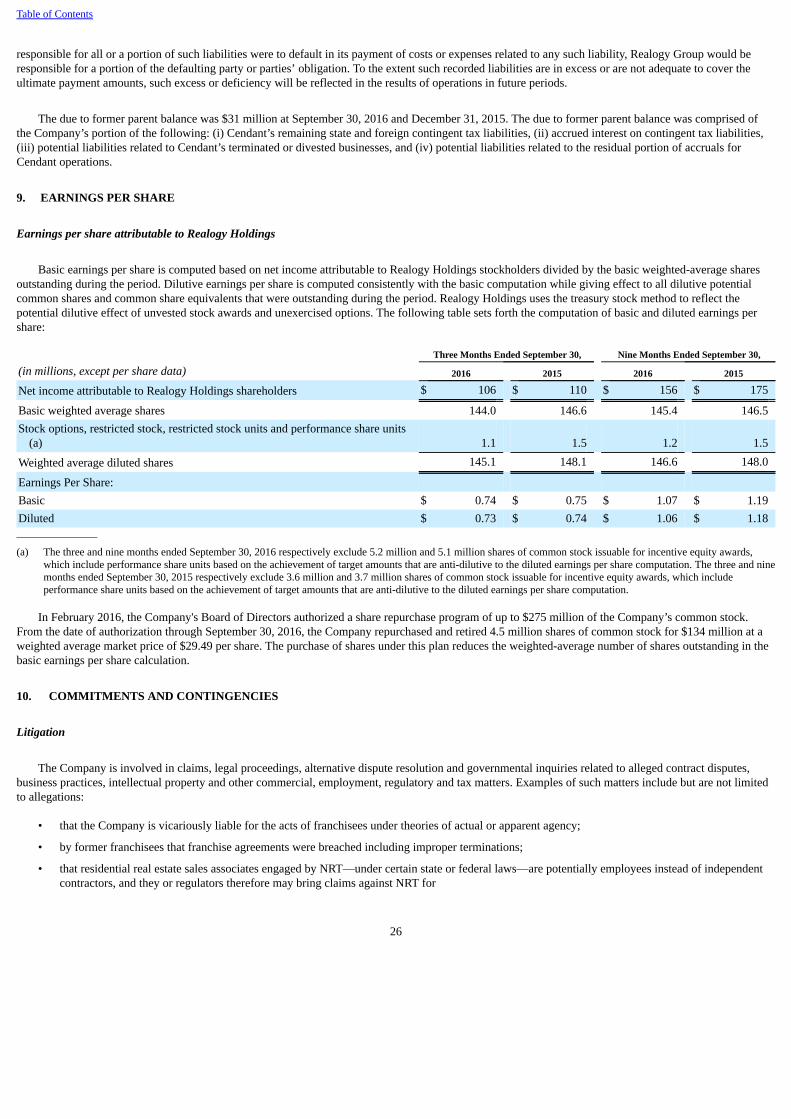
Table of Contents
responsible for all or a portion of such liabilities were to default in its payment of costs or expenses related to any such liability, Realogy Group would beresponsible for a portion of the defaulting party or parties’ obligation. To the extent such recorded liabilities are in excess or are not adequate to cover theultimate payment amounts, such excess or deficiency will be reflected in the results of operations in future periods.
The due to former parent balance was $31 million at September 30, 2016 and December 31, 2015. The due to former parent balance was comprised ofthe Company’s portion of the following: (i) Cendant’s remaining state and foreign contingent tax liabilities, (ii) accrued interest on contingent tax liabilities,(iii) potential liabilities related to Cendant’s terminated or divested businesses, and (iv) potential liabilities related to the residual portion of accruals forCendant operations.
9. EARNINGS PER SHARE
Earnings per share attributable to Realogy Holdings
Basic earnings per share is computed based on net income attributable to Realogy Holdings stockholders divided by the basic weighted-average sharesoutstanding during the period. Dilutive earnings per share is computed consistently with the basic computation while giving effect to all dilutive potentialcommon shares and common share equivalents that were outstanding during the period. Realogy Holdings uses the treasury stock method to reflect thepotential dilutive effect of unvested stock awards and unexercised options. The following table sets forth the computation of basic and diluted earnings pershare:
Three Months Ended September 30, Nine Months Ended September 30,
(in millions, except per share data) 2016 2015 2016 2015
Net income attributable to Realogy Holdings shareholders $ 106 $ 110 $ 156 $ 175
Basic weighted average shares 144.0 146.6 145.4 146.5Stock options, restricted stock, restricted stock units and performance share units
(a) 1.1 1.5 1.2 1.5
Weighted average diluted shares 145.1 148.1 146.6 148.0
Earnings Per Share: Basic $ 0.74 $ 0.75 $ 1.07 $ 1.19Diluted $ 0.73 $ 0.74 $ 1.06 $ 1.18_______________
(a) The three and nine months ended September 30, 2016 respectively exclude 5.2 million and 5.1 million shares of common stock issuable for incentive equity awards,which include performance share units based on the achievement of target amounts that are anti-dilutive to the diluted earnings per share computation. The three and ninemonths ended September 30, 2015 respectively exclude 3.6 million and 3.7 million shares of common stock issuable for incentive equity awards, which includeperformance share units based on the achievement of target amounts that are anti-dilutive to the diluted earnings per share computation.
In February 2016, the Company's Board of Directors authorized a share repurchase program of up to $275 million of the Company’s common stock.From the date of authorization through September 30, 2016, the Company repurchased and retired 4.5 million shares of common stock for $134 million at aweighted average market price of $29.49 per share. The purchase of shares under this plan reduces the weighted-average number of shares outstanding in thebasic earnings per share calculation.
10. COMMITMENTS AND CONTINGENCIES
Litigation
The Company is involved in claims, legal proceedings, alternative dispute resolution and governmental inquiries related to alleged contract disputes,business practices, intellectual property and other commercial, employment, regulatory and tax matters. Examples of such matters include but are not limitedto allegations:
• that the Company is vicariously liable for the acts of franchisees under theories of actual or apparent agency;
• by former franchisees that franchise agreements were breached including improper terminations;
• that residential real estate sales associates engaged by NRT—under certain state or federal laws—are potentially employees instead of independentcontractors, and they or regulators therefore may bring claims against NRT for
26
Table of Contents
breach of contract, wage and hour classification claims, wrongful discharge, unemployment and workers' compensation and could obtain benefits,back wages, overtime, indemnification, penalties related to classification practices and expense reimbursement available to employees;
• concerning claims for alleged RESPA or state real estate law violations including but not limited to claims challenging the validity of sales associatesindemnification, and administrative fees;
• concerning claims generally against the company owned brokerage operations for negligence, misrepresentation or breach of fiduciary duty inconnection with the performance of real estate brokerage or other professional services as well as other brokerage claims associated with listinginformation and property history;
• concerning claims generally against the title company contending that, as the escrow company, the company knew or should have known that atransaction was fraudulent or concerning other title defects or settlement errors; and
• concerning information security and cyber crime.
Real Estate Business Litigation
Strader, et al. and Hall v. PHH Corporation, et al. (U.S. District Court for the Central District of California). This is a purported class action brought byfour California residents against 15 defendants, including Realogy and certain of its subsidiaries, PHH Corporation and PHH Home Loans, LLC (a jointventure between Realogy and PHH), alleging violations of Section 8(a) of RESPA. Plaintiffs seek to represent two subclasses comprised of all persons in theUnited States who, since January 31, 2005, (1) obtained a RESPA-covered mortgage loan from either (a) PHH Home Loans, LLC or one of its subsidiaries, or(b) one of the mortgage services managed by PHH Corporation for other lenders, and (2) paid a fee for title insurance or settlement services to TRG or one ofits subsidiaries. Plaintiffs allege, among other things, that PHH Home Loans, LLC operates in violation of RESPA and that the other defendants violateRESPA by referring business to one another under agreements or arrangements. Plaintiffs seek treble damages and an award of attorneys’ fees, costs anddisbursements. On February 5, 2016, the defendants filed a motion to dismiss the case claiming that not only do the claims lack merit, but they are time-barred under RESPA's one-year statute of limitations. On April 5, 2016, the court granted defendants' motion to dismiss with leave for the plaintiffs to amendtheir complaint. Plaintiffs filed a second amended complaint on April 21, 2016, and a third amended complaint on May 12, 2016. Defendants filed a motionto dismiss the third amended complaint. The Court denied the motion on October 6, 2016, without prejudice to defendants’ ability to move for summaryjudgment after discovery. The parties are proceeding with discovery.
The case raises significant claims and rests in part on certain interpretations of RESPA by the Consumer Financial Protection Bureau ("CFPB"), whichare the subject of pending industry litigation in various jurisdictions. As with all class action litigation, the case is inherently complex and subject to manyuncertainties. We believe that we and the joint venture have complied with RESPA, the regulations promulgated thereunder and existing regulatory guidance.There can be no assurance, however, that if the action continues and a large class is subsequently certified, the plaintiffs will not seek a substantial damageaward, penalties and other remedies. Given the early stage of this case and the novel claims and issues presented, we cannot estimate a range of reasonablypotential losses for this litigation. The Company will vigorously defend this action.
The Company is involved in certain other claims and legal actions arising in the ordinary course of our business. Such litigation, regulatory actions andother proceedings may include, but are not limited to, actions relating to intellectual property, commercial arrangements, franchising arrangements, actionsagainst our title company alleging it knew or should have known that others were committing mortgage fraud, standard brokerage disputes like the failure todisclose hidden defects in the property such as mold, vicarious liability based upon conduct of individuals or entities outside of our control, includingfranchisees and independent sales associates, antitrust and anti-competition claims, general fraud claims, employment law claims, including claimschallenging the classification of our sales associates as independent contractors, wage and hour classification claims, and claims alleging violations of RESPAor state consumer fraud statutes. While the results of such claims and legal actions cannot be predicted with certainty, we do not believe based on informationcurrently available to us that the final outcome of current proceedings against the Company will have a material adverse effect on our consolidated financialposition, results of operations or cash flows.
Cendant Corporate Litigation
Pursuant to the Separation and Distribution Agreement dated as of July 27, 2006 among Cendant, Realogy Group, Wyndham Worldwide and Travelport,each of Realogy Group, Wyndham Worldwide and Travelport have assumed certain contingent and other corporate liabilities (and related costs and expenses),which are primarily related to each of their respective businesses. In addition, Realogy Group has assumed 62.5% and Wyndham Worldwide has assumed37.5% of
27

Table of Contents
certain contingent and other corporate liabilities (and related costs and expenses) of Cendant or its subsidiaries, which are not primarily related to any of therespective businesses of Realogy Group, Wyndham Worldwide, Travelport and/or Cendant’s vehicle rental operations, in each case incurred or allegedlyincurred on or prior to the date of the separation of Travelport from Cendant.
* * *
The Company believes that it has adequately accrued for legal matters as appropriate. The Company records litigation accruals for legal matters whichare both probable and estimable.
Litigation and other disputes are inherently unpredictable and subject to substantial uncertainties and unfavorable resolutions could occur. In addition,class action lawsuits can be costly to defend and, depending on the class size and claims, could be costly to settle. As such, the Company could incurjudgments or enter into settlements of claims with liability that are materially in excess of amounts accrued and these settlements could have a materialadverse effect on the Company’s financial condition, results of operations or cash flows in any particular period.
Tax Matters
The Company is subject to income taxes in the United States and several foreign jurisdictions. Significant judgment is required in determining theworldwide provision for income taxes and recording related assets and liabilities. In the ordinary course of business, there are many transactions andcalculations where the ultimate tax determination is uncertain. The Company is regularly under audit by tax authorities whereby the outcome of the audits isuncertain. The Company believes there is appropriate support for positions taken on its tax returns. The liabilities that have been recorded represent the bestestimates of the probable loss on certain positions and are adequate for all open years based on an assessment of many factors including past experience andinterpretations of tax law applied to the facts of each matter. However, the outcomes of tax audits are inherently uncertain.
Under the Tax Sharing Agreement with Cendant, Wyndham Worldwide and Travelport, the Company is generally responsible for 62.5% of paymentsmade to settle claims with respect to tax periods ending on or prior to December 31, 2006 that relate to income taxes imposed on Cendant and certain of itssubsidiaries, the operations (or former operations) of which were determined by Cendant not to relate specifically to the respective businesses of Realogy,Wyndham Worldwide, Avis Budget or Travelport.
With respect to any remaining legacy Cendant tax liabilities, the Company and its former parent believe there is appropriate support for the positionstaken on Cendant’s tax returns. However, tax audits and any related litigation, including disputes or litigation on the allocation of tax liabilities betweenparties under the Tax Sharing Agreement, could result in outcomes for the Company that are different from those reflected in the Company’s historicalfinancial statements.
Contingent Liability Letter of Credit
In April 2007, the Company established a standby irrevocable letter of credit for the benefit of Avis Budget Group in accordance with the Separation andDistribution Agreement. The synthetic letter of credit was utilized to support the Company’s payment obligations with respect to its share of Cendantcontingent and other corporate liabilities. The stated amount of the standby irrevocable letter of credit is subject to periodic adjustment to reflect the thencurrent estimate of Cendant contingent and other liabilities. The letter of credit was $53 million at September 30, 2016 and December 31, 2015. The standbyirrevocable letter of credit will be terminated if (i) the Company’s senior unsecured credit rating is raised to BB by Standard and Poor’s or Ba2 by Moody’s or(ii) the aggregate value of the former parent contingent liabilities falls below $30 million.
Escrow and Trust Deposits
As a service to its customers, the Company administers escrow and trust deposits which represent undisbursed amounts received for the settlement of realestate transactions. Deposits at FDIC-insured institutions are insured up to $250 thousand. These escrow and trust deposits totaled $449 million atSeptember 30, 2016 and $308 million at December 31, 2015. These escrow and trust deposits are not assets of the Company and, therefore, are excluded fromthe accompanying Condensed Consolidated Balance Sheets. However, the Company remains contingently liable for the disposition of these deposits.
28
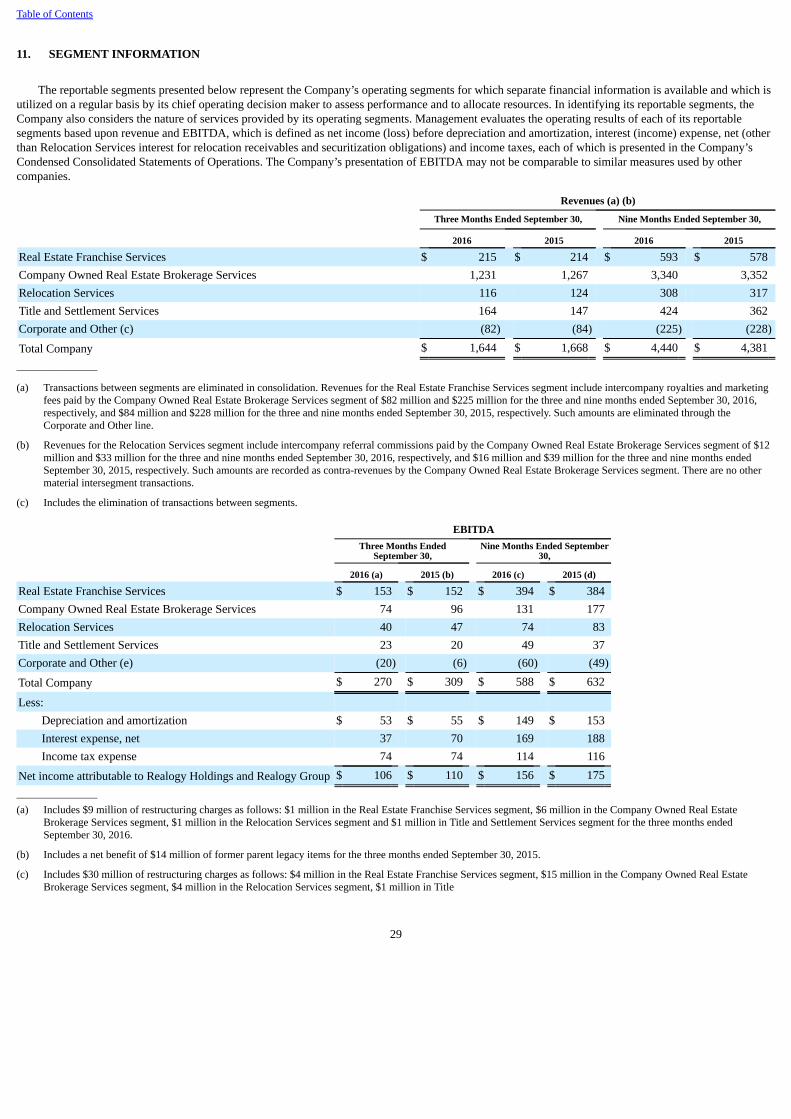
Table of Contents
11. SEGMENT INFORMATION
The reportable segments presented below represent the Company’s operating segments for which separate financial information is available and which isutilized on a regular basis by its chief operating decision maker to assess performance and to allocate resources. In identifying its reportable segments, theCompany also considers the nature of services provided by its operating segments. Management evaluates the operating results of each of its reportablesegments based upon revenue and EBITDA, which is defined as net income (loss) before depreciation and amortization, interest (income) expense, net (otherthan Relocation Services interest for relocation receivables and securitization obligations) and income taxes, each of which is presented in the Company’sCondensed Consolidated Statements of Operations. The Company’s presentation of EBITDA may not be comparable to similar measures used by othercompanies.
Revenues (a) (b)
Three Months Ended September 30, Nine Months Ended September 30,
2016 2015 2016 2015
Real Estate Franchise Services $ 215 $ 214 $ 593 $ 578Company Owned Real Estate Brokerage Services 1,231 1,267 3,340 3,352Relocation Services 116 124 308 317Title and Settlement Services 164 147 424 362Corporate and Other (c) (82) (84) (225) (228)
Total Company $ 1,644 $ 1,668 $ 4,440 $ 4,381_______________
(a) Transactions between segments are eliminated in consolidation. Revenues for the Real Estate Franchise Services segment include intercompany royalties and marketingfees paid by the Company Owned Real Estate Brokerage Services segment of $82 million and $225 million for the three and nine months ended September 30, 2016,respectively, and $84 million and $228 million for the three and nine months ended September 30, 2015, respectively. Such amounts are eliminated through theCorporate and Other line.
(b) Revenues for the Relocation Services segment include intercompany referral commissions paid by the Company Owned Real Estate Brokerage Services segment of $12million and $33 million for the three and nine months ended September 30, 2016, respectively, and $16 million and $39 million for the three and nine months endedSeptember 30, 2015, respectively. Such amounts are recorded as contra-revenues by the Company Owned Real Estate Brokerage Services segment. There are no othermaterial intersegment transactions.
(c) Includes the elimination of transactions between segments.
EBITDA
Three Months Ended
September 30, Nine Months Ended September
30,
2016 (a) 2015 (b) 2016 (c) 2015 (d)
Real Estate Franchise Services $ 153 $ 152 $ 394 $ 384Company Owned Real Estate Brokerage Services 74 96 131 177Relocation Services 40 47 74 83Title and Settlement Services 23 20 49 37Corporate and Other (e) (20) (6) (60) (49)
Total Company $ 270 $ 309 $ 588 $ 632
Less: Depreciation and amortization $ 53 $ 55 $ 149 $ 153Interest expense, net 37 70 169 188Income tax expense 74 74 114 116
Net income attributable to Realogy Holdings and Realogy Group $ 106 $ 110 $ 156 $ 175_______________(a) Includes $9 million of restructuring charges as follows: $1 million in the Real Estate Franchise Services segment, $6 million in the Company Owned Real Estate
Brokerage Services segment, $1 million in the Relocation Services segment and $1 million in Title and Settlement Services segment for the three months endedSeptember 30, 2016.
(b) Includes a net benefit of $14 million of former parent legacy items for the three months ended September 30, 2015.
(c) Includes $30 million of restructuring charges as follows: $4 million in the Real Estate Franchise Services segment, $15 million in the Company Owned Real EstateBrokerage Services segment, $4 million in the Relocation Services segment, $1 million in Title
29

Table of Contents
and Settlement Services segment and $6 million in Corporate and Other, and a net cost of $1 million of former parent legacy items included in Corporate and Other forthe nine months ended September 30, 2016.
(d) Includes a net benefit of $15 million of former parent legacy items for the nine months ended September 30, 2015.
(e) Includes the elimination of transactions between segments.
30
Table of Contents
Item 2. Management's Discussion and Analysis of Financial Condition and Results of Operations.
The following discussion and analysis should be read in conjunction with our Condensed Consolidated Financial Statements and accompanying notesthereto included elsewhere herein and with our Consolidated Financial Statements and accompanying notes included in the 2015 Form 10-K. Unlessotherwise noted, all dollar amounts in tables are in millions. Neither Realogy Holdings, the indirect parent of Realogy Group, nor Realogy Intermediate, thedirect parent company of Realogy Group, conducts any operations other than with respect to its respective direct or indirect ownership of Realogy Group. Asa result, the condensed consolidated financial positions, results of operations and cash flows of Realogy Holdings, Realogy Intermediate and Realogy Groupare the same. This Management's Discussion and Analysis of Financial Condition and Results of Operations contain forward-looking statements. See"Forward-Looking Statements" in this report and "Forward-Looking Statements" and "Risk Factors" in our 2015 Form 10-K for a discussion of theuncertainties, risks and assumptions associated with these statements. Actual results may differ materially from those contained in any forward-lookingstatements.
OVERVIEW
We are a global provider of real estate and relocation services and report our operations in the following four segments:
• Real Estate Franchise Services (known as Realogy Franchise Group or RFG)—franchises the Century 21®, Coldwell Banker®, Coldwell BankerCommercial®, ERA®, Sotheby's International Realty® and Better Homes and Gardens® Real Estate brand names. As of September 30, 2016, ourfranchise systems had approximately 13,650 franchised and company owned offices and approximately 268,000 independent sales associatesoperating under our franchise and proprietary brands in the U.S. and 110 other countries and territories around the world, which includedapproximately 800 of our company owned and operated brokerage offices with approximately 48,000 independent sales associates. Our wholly-owned subsidiary, ZapLabs is a developer of a proprietary technology platform for real estate brokerages, independent sales associates andcustomers. Through the first nine months of 2016, we have rolled out ZapLabs' comprehensive, integrated ZAPSM technology platform toapproximately 1,200 of our approximately 2,600 franchisees and, consistent with our previously disclosed plan, anticipate rolling this product out toa broader franchisee base over the next two years. We believe the ZAP technology platform will increase the value proposition to our franchisees,their independent sales associates and their customers.
• Company Owned Real Estate Brokerage Services (known as NRT)—operates a full-service real estate brokerage business principally under theColdwell Banker®, Corcoran®, Sotheby’s International Realty®, Citi HabitatsSM and ZipRealty® brand names in more than 50 of the 100 largestmetropolitan areas in the U.S. This segment also includes the Company's share of earnings for our PHH Home Loans venture.
• Relocation Services (known as Cartus®)—primarily offers clients employee relocation services such as homesale assistance, providing home equityadvances to transferees (generally guaranteed by the client), home finding and other destination services, expense processing, relocation policycounseling and consulting services, arranging household goods moving services, coordinating visa and immigration support, intercultural andlanguage training and group move management services. In addition, we provide home buying and selling assistance to members of affinity clients.
• Title and Settlement Services (known as Title Resource Group or TRG)—provides full-service title and settlement services to real estatecompanies, affinity groups, corporations and financial institutions with many of these services provided in connection with the Company's real estatebrokerage and relocation services business.
RECENT DEVELOPMENTS
Business Optimization Initiative
During the fourth quarter of 2015, the Company began a business optimization initiative that focuses on maximizing the efficiency and effectiveness ofthe cost structure of each of the Company's business units. The action is designed to improve client service levels across each of the business units whileenhancing the Company's profitability and incremental margins. The plan focuses on several key areas of opportunity which include process improvementefficiencies, office footprint optimization, leveraging technology and media spend, centralized procurement, outsourcing administrative services andorganizational design. In the second quarter of 2016, the Company expanded the scope of restructuring activities in order to realign the Company Owned RealEstate Brokerage Services back office administration and support functions across the country. As a result of this realignment, the expected costs of activitiesundertaken in connection with the restructuring plan are expected to be largely completed by mid-2017. Total expected restructuring costs of approximately$69 million are currently anticipated to be incurred.
31
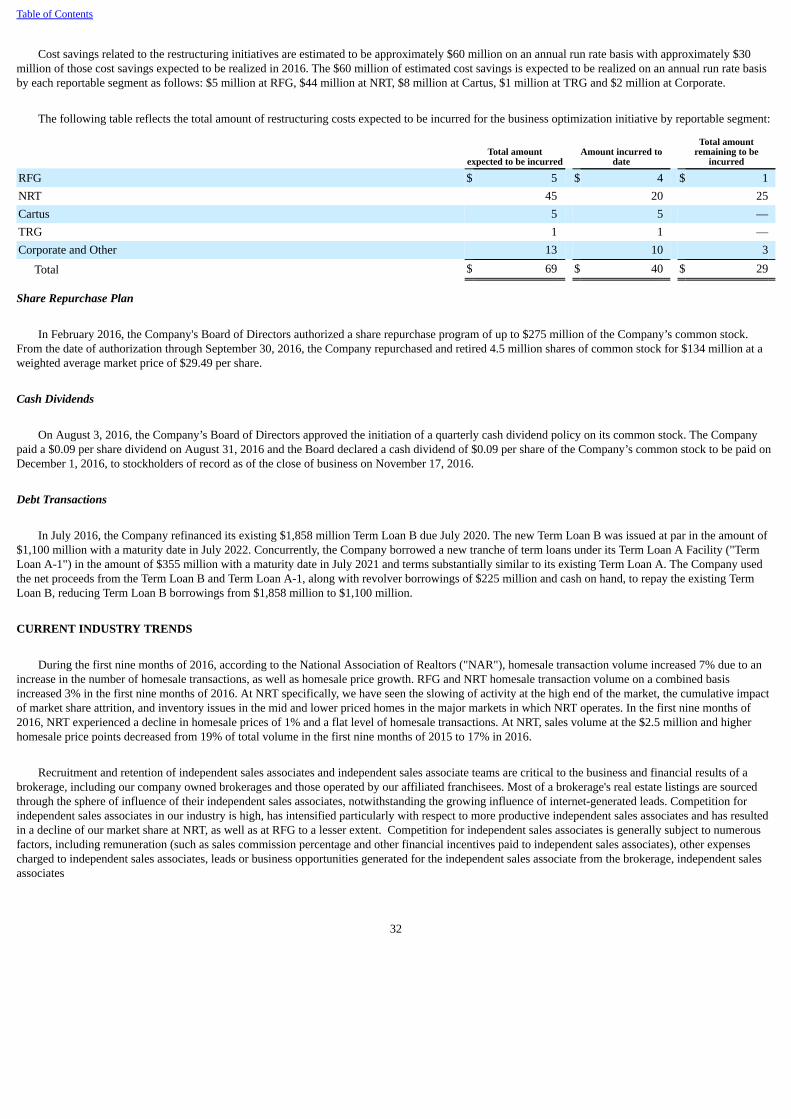
Table of Contents
Cost savings related to the restructuring initiatives are estimated to be approximately $60 million on an annual run rate basis with approximately $30million of those cost savings expected to be realized in 2016. The $60 million of estimated cost savings is expected to be realized on an annual run rate basisby each reportable segment as follows: $5 million at RFG, $44 million at NRT, $8 million at Cartus, $1 million at TRG and $2 million at Corporate.
The following table reflects the total amount of restructuring costs expected to be incurred for the business optimization initiative by reportable segment:
Total amount
expected to be incurred Amount incurred to
date
Total amountremaining to be
incurred
RFG $ 5 $ 4 $ 1NRT 45 20 25Cartus 5 5 —TRG 1 1 —Corporate and Other 13 10 3
Total $ 69 $ 40 $ 29
Share Repurchase Plan
In February 2016, the Company's Board of Directors authorized a share repurchase program of up to $275 million of the Company’s common stock.From the date of authorization through September 30, 2016, the Company repurchased and retired 4.5 million shares of common stock for $134 million at aweighted average market price of $29.49 per share.
Cash Dividends
On August 3, 2016, the Company’s Board of Directors approved the initiation of a quarterly cash dividend policy on its common stock. The Companypaid a $0.09 per share dividend on August 31, 2016 and the Board declared a cash dividend of $0.09 per share of the Company’s common stock to be paid onDecember 1, 2016, to stockholders of record as of the close of business on November 17, 2016.
Debt Transactions
In July 2016, the Company refinanced its existing $1,858 million Term Loan B due July 2020. The new Term Loan B was issued at par in the amount of$1,100 million with a maturity date in July 2022. Concurrently, the Company borrowed a new tranche of term loans under its Term Loan A Facility ("TermLoan A-1") in the amount of $355 million with a maturity date in July 2021 and terms substantially similar to its existing Term Loan A. The Company usedthe net proceeds from the Term Loan B and Term Loan A-1, along with revolver borrowings of $225 million and cash on hand, to repay the existing TermLoan B, reducing Term Loan B borrowings from $1,858 million to $1,100 million.
CURRENT INDUSTRY TRENDS
During the first nine months of 2016, according to the National Association of Realtors ("NAR"), homesale transaction volume increased 7% due to anincrease in the number of homesale transactions, as well as homesale price growth. RFG and NRT homesale transaction volume on a combined basisincreased 3% in the first nine months of 2016. At NRT specifically, we have seen the slowing of activity at the high end of the market, the cumulative impactof market share attrition, and inventory issues in the mid and lower priced homes in the major markets in which NRT operates. In the first nine months of2016, NRT experienced a decline in homesale prices of 1% and a flat level of homesale transactions. At NRT, sales volume at the $2.5 million and higherhomesale price points decreased from 19% of total volume in the first nine months of 2015 to 17% in 2016.
Recruitment and retention of independent sales associates and independent sales associate teams are critical to the business and financial results of abrokerage, including our company owned brokerages and those operated by our affiliated franchisees. Most of a brokerage's real estate listings are sourcedthrough the sphere of influence of their independent sales associates, notwithstanding the growing influence of internet-generated leads. Competition forindependent sales associates in our industry is high, has intensified particularly with respect to more productive independent sales associates and has resultedin a decline of our market share at NRT, as well as at RFG to a lesser extent. Competition for independent sales associates is generally subject to numerousfactors, including remuneration (such as sales commission percentage and other financial incentives paid to independent sales associates), other expensescharged to independent sales associates, leads or business opportunities generated for the independent sales associate from the brokerage, independent salesassociates
32
Table of Contents
perception of the value of the broker's brand affiliation, marketing and advertising efforts by the brokerage, the office manager, staff and fellow independentsales associates with whom they collaborate daily and technology, continuing professional education, and other services provided by the brokerage. Webelieve that the influence of independent sales associates and independent sales associate teams has increased during the housing recovery and, together withthe increasing competition from other brokerages, has negatively impacted the recruitment and retention of independent sales associates and put pressure oncommission rate splits. See "Key Drivers" for the Company's incremental actions that are being undertaken to address the competition for independent salesassociates.
According to NAR, the inventory of existing homes for sale in the U.S. was 2.0 million homes at the end of September 2016. The September 2016inventory represents a national average supply of 4.5 months at the current homesales pace which is significantly below the 6.3 month 25-year average.
As reported by NAR, the housing affordability index has continued to be at historically favorable levels. An index above 100 signifies that a familyearning the median income has sufficient income to purchase a median-priced home, assuming a 20 percent down payment and ability to qualify for amortgage. The composite housing affordability index was 168 for September 2016 and 166 for 2015. The housing affordability index remains significantlyhigher than the average of 126 for the period from 1970 through 2015.
Mortgage rates continue to be at low levels by historical standards, which we believe has helped stimulate demand in the residential real estate market.According to Freddie Mac, mortgage rates on commitments for a 30-year, conventional, fixed-rate first mortgage averaged 3.9% for 2015 and the rate atSeptember 30, 2016 was 3.5%. To the extent that mortgage rates increase, consumers continue to have financing alternatives such as adjustable ratemortgages or shorter term mortgages which can be utilized to obtain a lower mortgage rate than a 30-year fixed-rate mortgage.
Partially offsetting the positive impact of low mortgage rates are low housing inventory levels and the ongoing rise in home prices, conservativemortgage underwriting standards and certain homeowners having limited or negative equity in homes. Mortgage credit conditions tightened significantlyduring the recent housing downturn, with banks limiting credit availability to more creditworthy borrowers and requiring larger down payments, stricterappraisal standards, and more extensive mortgage documentation. Although mortgage credit conditions appear to be easing, mortgages remain less availableto some borrowers and it frequently takes longer to close a homesale transaction due to current mortgage and underwriting requirements.
Beginning on October 3, 2015, CFPB's new three-day advance closing disclosure rule, known as TILA-RESPA Integrated Disclosure ("TRID"), becameeffective for new loan applications and is a significant change for the industry. The new regulations have caused closing delays throughout the industry,including at Realogy for both its company-owned and franchised operations. The National Association of Realtors Economists’ Outlook report published onOctober 12, 2016 reported that the additional time from contract-to-close for U.S. homesales reached the peak at 5.7 days in December 2015 and has eased to3.4 days in September 2016.
RESPA has become a greater challenge in recent years for most industry participants offering settlement services, including mortgage companies, titlecompanies and brokerages, because of changes in the regulatory environment. With the passage of Dodd-Frank in 2010, primary responsibility forenforcement of RESPA has shifted to the CFPB. The CFPB has taken a much stricter approach toward interpretation of RESPA and related regulations thanthe prior regulatory authority (the Department of Housing and Urban Development) and has significantly increased the use of enforcement proceedings. Inthe face of this changing regulatory landscape, various industry participants, while disagreeing with the CFPB’s narrow interpretation of RESPA, havenevertheless decided to modify or terminate long-standing business arrangements to avoid the risk of protracted and costly litigation defending sucharrangements. While we have made, and may make, other changes to our RESPA-related business practices, we do not expect these changes to have amaterial impact on our operations.
Existing Homesales
According to NAR, existing homesale transactions for 2015 increased to 5.3 million homes, or up 6% compared to 2014, while homesale transactionsincreased 5% on a combined basis for RFG and NRT.
For the quarters ended March 31, 2016, June 30, 2016 and September 30, 2016, compared to the same periods in 2015, NAR existing homesaletransactions increased 6%, 4% and 1%, respectively. For the quarters ended March 31, 2016, June 30, 2016 and September 30, 2016, RFG and NRT homesaletransactions on a combined basis increased 4%, 3% and remained flat, respectively, compared to the same periods in 2015. Our homesale transactions wereimpacted by a slowing
33
Table of Contents
of activity in the high-end markets served by NRT, the cumulative impact of market share attrition and inventory issues in the mid and lower priced homes inmany of the markets served by NRT. The annual and quarterly year-over-year trends in homesale transactions are as follows:
2016 vs. 2015
Number of Existing HomesalesFull Year 2015 vs.
2014 First
Quarter Second Quarter
Third Quarter
Fourth Quarter Forecast
Full Year Forecast
2016 vs. 2015 Industry
NAR 6% (a) 6% (a) 4 % (a) 1 % (a) 1% (b) 2% (b)
Fannie Mae (c) 6% 5% 4 % (1)% 2% 2% Realogy
RFG and NRT Combined 5% 4% 3% —% RFG 3% (d) 3% (d) 4% 1% NRT 9% (d) 7% (d) (1%) (4%)
_______________(a) Historical existing homesale data is as of the most recent NAR press release, which is subject to sampling error.
(b) Forecasted existing homesale data, on a seasonally adjusted basis, is as of the most recent NAR forecast.
(c) Forecasted existing homesale data, on a seasonally adjusted basis, is as of the most recent Fannie Mae press release.
(d) In April 2015, NRT acquired Coldwell Banker United, a large franchisee of RFG, and as a result the drivers of Coldwell Banker United shifted from RFG to NRT. Inaddition, NRT homesale sides include transactions from the acquisition of ZipRealty in August 2014. The year-over-year change in homesale sides, excluding the impactof these acquisitions, would have been as follows:
Full Year
2015 vs. 2014 First Quarter 2016 vs. 2015
RFG 5% 4%
NRT 2% 1%
Since the acquisition of Coldwell Banker United occurred during the beginning of the second quarter of 2015, it did not impact the comparability of homesaletransactions during the second and third quarters of 2016 compared to the second and third quarters of 2015.
As of their most recent releases, both NAR and Fannie Mae are forecasting an increase of 2% in existing homesale transactions for 2017 compared to2016.
Existing Homesale Price
In 2015, NAR existing homesale average price increased 4% compared to the same period in 2014, while average homesale price increased 3% on acombined basis for RFG and NRT.
For the quarters ended March 31, 2016, June 30, 2016 and September 30, 2016, compared to the same periods in 2015, NAR existing homesale averageprice increased 4%, 3% and 4%, respectively. For the quarters ended March 31, 2016, June 30, 2016 and September 30, 2016, RFG and NRT averagehomesale price on a combined basis increased 2%, 1% and 2%, respectively, compared to the same periods in 2015. The combined average homesale priceincrease was due to a modest shift in homesale transaction activity from higher-price homes to lower and mid-priced homes across RFG and NRT. Homes atthe low to mid-price points are also experiencing continued constrained inventory levels. The annual and quarterly year-over-year trends in the price of homesare as follows:
2016 vs. 2015
Price of Existing HomesFull Year 2015 vs.
2014 First
Quarter Second Quarter
Third Quarter
Fourth Quarter Forecast
Full Year Forecast
2016 vs. 2015 Industry
NAR 4 % (a) 4 % (a) 3 % (a) 4% (a) 4% (b) 4% (b)
Fannie Mae (c) 6 % 6 % 5 % 5% 5% 5% Realogy
RFG and NRT Combined 3 % 2% 1% 2% RFG 5 % (d) 3% (d) 3% 3% NRT (2)% (d) (2%) (d) (2%) 1%
34
Table of Contents
_______________(a) Historical homesale price data is for existing homesale average price and is as of the most recent NAR press release.
(b) Forecasted homesale price data is for median price and is as of the most recent NAR forecast.
(c) Existing homesale price data is for median price and is as of the most recent Fannie Mae press release.
(d) In April 2015, NRT acquired Coldwell Banker United, a large franchisee of RFG, and as a result the drivers of Coldwell Banker United shifted from RFG to NRT. Inaddition, NRT homesale price includes transactions from the acquisition of ZipRealty in August 2014. The acquisition of Coldwell Banker United did not have asignificant impact on the average homesale price for RFG. The year-over-year change in average homesale price for NRT, excluding the impact of these acquisitions,would have been as follows:
Full Year
2015 vs. 2014 First Quarter 2016 vs. 2015
NRT 1% 1%
Since the acquisition of Coldwell Banker United occurred at the beginning of the second quarter of 2015, it did not impact the comparability of average homesale priceduring the second and third quarters of 2016 compared to the second and third quarters of 2015.
As of their most recent releases, NAR and Fannie Mae are forecasting a 3% and 5% increase in the 2017 median existing homesale price compared to2016, respectively.
* * *
We believe that long-term demand for housing and the growth of our industry are primarily driven by the affordability of housing, the economic health ofthe U.S. economy, positive demographic trends such as population growth, the increase in household formation, mortgage rate levels and mortgageavailability, certain tax benefits, job growth, the inherent attributes of homeownership versus renting and the influence of local housing dynamics of supplyversus demand. At this time, these factors are generally trending favorably. Factors that may negatively affect a sustained housing recovery include:
• higher mortgage rates due to increases in long-term interest rates as well as reduced availability of mortgage financing;
• insufficient inventory levels leading to lower unit sales;
• changing attitudes towards home ownership, particularly among potential first-time homebuyers who may delay, or decide not to, purchase homes;
• the impact of limited or negative equity of current homeowners, as well as the lack of available inventory may limit their proclivity to purchase analternative home;
• reduced affordability of homes;
• high levels of unemployment and associated lack of consumer confidence;
• unsustainable economic recovery in the U.S. or a weak recovery resulting in only modest economic growth;
• a decline in home ownership levels in the U.S.;
• geopolitical and economic instability; and
• legislative or regulatory reform, including but not limited to reform that adversely impacts the financing of the U.S. housing market or amends theInternal Revenue Code in a manner that negatively impacts home ownership such as reform that reduces the amount that certain taxpayers would beallowed to deduct for home mortgage interest.
Many of the trends impacting our businesses that derive revenue from homesales also impact Cartus, which is a global provider of outsourced employeerelocation services. In addition to general residential housing trends, key drivers of Cartus are global corporate spending on relocation services, which has notreturned to levels that existed prior to the most recent recession and changes in employment relocation trends. Cartus is subject to a competitive pricingenvironment and lower average revenue per relocation as a result of a shift in the mix of services and number of services being delivered per move. Thesefactors have, and may continue to, put pressure on the growth and profitability of this segment.
* * *
35

Table of Contents
While data provided by NAR and Fannie Mae are two indicators of the direction of the residential housing market, we believe that homesale statisticswill continue to vary between us and NAR and Fannie Mae because:
• they use survey data and estimates in their historical reports and forecasting models, which are subject to sampling error, whereas we use data basedon actual reported results;
• there are geographical differences and concentrations in the markets in which we operate versus the national market. For example, many of ourcompany owned brokerage offices are geographically located where average homesale prices are generally higher than the national average andtherefore NAR survey data will not correlate with NRT's results;
• comparability is also impaired due to NAR’s utilization of seasonally adjusted annualized rates whereas we report actual period-over-period changesand their use of median price for their forecasts compared to our average price;
• NAR historical data is subject to periodic review and revision and these revisions have been, and could be material in the future; and
• NAR and Fannie Mae generally update their forecasts on a monthly basis and a subsequent forecast may change materially from a forecast that waspreviously issued.
While we believe that the industry data presented herein is derived from the most widely recognized sources for reporting U.S. residential housing marketstatistical data, we do not endorse or suggest reliance on this data alone. We also note that forecasts are inherently uncertain or speculative in nature andactual results for any period could materially differ.
KEY DRIVERS OF OUR BUSINESSES
Within RFG and NRT, we measure operating performance using the following key operating statistics: (i) closed homesale sides, which represents eitherthe "buy" side or the "sell" side of a homesale transaction, (ii) average homesale price, which represents the average selling price of closed homesaletransactions, (iii) average homesale broker commission rate, which represents the average commission rate earned on either the "buy" side or "sell" side of ahomesale transaction and (iv) net effective royalty rate which represents the average percentage of our franchisees’ commission revenues payable to RFG, netof volume incentives achieved.
From 2007 through December 2013, the average homesale broker commission rate remained fairly stable; however, in 2014 and 2015 we experienced amodest decline in the average broker commission rate. We expect that over the long term the average brokerage commission rates could modestly decline as aresult of increases in average homesale prices and, to a lesser extent, competitors providing fewer services for a reduced fee. This is particularly relevant inperiods when there is constrained housing inventory. A continuing housing recovery should result in an increase in our revenues, although such increasescould be offset by modestly declining brokerage commission rates and competitive pressures.
In general, most of our third-party franchisees are entitled to volume incentives, which are calculated for each franchisee as a progressive percentage ofeach franchisee's annual gross revenues. These incentives decrease during times of declining homesale transaction volumes and increase during marketrecoveries when there is a corresponding increase in homesale transaction volume. As a result, the net effective royalty rate may be impacted by the cyclicalresidential housing market. We expect that over the long term the net effective royalty rate will modestly decline as a result of increases in homesaletransaction volume and, to a lesser extent, other market pressures. In addition, several of our larger franchisees have a flat royalty rate, which will modestlyreduce the Company's net effective royalty rate if their homesale transaction volume increases.
Royalty fees are charged to all franchisees pursuant to the terms of the relevant franchise agreements and are included in each of the real estate brands'franchise disclosure documents. Non-standard incentives may be used as consideration for new or renewing franchisees. Most of our franchisees do notreceive these non-standard incentives and in contrast to royalties and volume incentives, they are not homesale transaction based. We have accordinglyexcluded the non-standard incentives from the calculation of the net effective royalty rate. Had these non-standard incentives been included, the net effectiveroyalty rate would be lower by approximately 21 and 18 basis points for the years ended December 31, 2015 and 2014, respectively. We expect that the trendof increasing non-standard incentives by 3 to 4 basis points a year will continue in the future in order to attract and retain certain large franchisees.
NRT has a significant concentration of real estate brokerage offices and transactions in geographic regions where home prices are at the higher end of theU.S. real estate market, particularly the east and west coasts, while RFG has franchised offices that are more widely dispersed across the United States.Accordingly, operating results and homesale statistics may differ between NRT and RFG based upon geographic presence and the corresponding homesaleactivity in each geographic
36
Table of Contents
region. In addition, the share of commissions earned by sales associates directly impacts the margin earned by NRT. Such share of commissions earned bysales associates varies by region and commission schedules are generally progressive to incentivize sales associates to achieve higher levels of production.The level of commissions earned by sales associates is generally subject to review and resets on the anniversary of the sales associates' engagement with thebroker. We expect that they will continue to be subject to upward pressure because of the increased bargaining power of independent sales associates as wellas more aggressive recruitment activities taken by our competitors.
As described above under "Current Industry Trends," competition for independent sales associates in our industry has intensified and we expect thiscompetition will continue particularly with respect to more productive independent sales associates which has impacted NRT's market share and results ofoperations, as well as RFG to a lesser extent. Currently, there are several different compensation models being utilized by real estate brokerages tocompensate their independent sales associates. The most common models are as follows: (1) a graduated commission plan, sometimes referred to as the"traditional model" where the independent sales associate receives a percentage of the brokerage commission that increases as the independent sales associateincreases his or her volume of homesale transactions and the brokerage frequently provides independent sales associates with a broad set of support offeringsand promotion of properties, (2) a desk rental or 100% plan, where the independent sales associate is entitled to all or nearly all of the broker commission andpays the broker on both a monthly and transaction basis for office space, tools, technology and support while also being responsible for the promotion ofproperties and other items, (3) a capped model, which generally blends aspects of the first two models described herein, and (4) a fixed transaction fee modelwhere the sales associate is entitled to all of the broker commission and pays a fixed fee per homesale transaction and often receives very limited supportfrom the brokerage. Most brokerages focus primarily on one compensation model though some may offer one or more of these models to their salesassociates. Increasingly, independent sales associates have affiliated with brokerages that offer fewer services to the independent sales associates, allowing theindependent sales associate to retain a greater percentage of the commission. However, there are long-term trade-offs in the level of support independent salesassociates receive in areas such as marketing, technology and professional education.
While NRT has historically compensated its independent sales associates using a traditional model, utilizing elements of other models depending uponthe geographic market, we are placing an even greater focus on the quality of our services and our use of financial incentives to strengthen our recruiting andretention of independent sales associates and teams. These actions include a more aggressive strategy to recruit top performing sales associates and retain topperforming sales associates with the overall goal of sustaining or growing market share in various markets, improving NRT's overall profitability. In addition,there will be an enhanced focus on the value proposition offered to independent sales associate teams. Results of these recruiting efforts are not expected to berealized for at least 12 to 18 months as the benefits from recruiting new independent sales associates relate mainly to new listings, not pending listings. Whilewe expect near-term moderate pressure on costs and margin from these initiatives, the expected increase in revenue should more than offset the related costs.
Within Cartus, we measure operating performance using the following key operating statistics: (i) initiations, which represent the total number of newtransferees and the total number of real estate closings for affinity members and (ii) referrals, which represent the number of referrals from which we earnrevenue from real estate brokers.
In TRG, operating performance is evaluated using the following key metrics: (i) purchase title and closing units, which represent the number of title andclosing units we process as a result of home purchases, (ii) refinance title and closing units, which represent the number of title and closing units we processas a result of homeowners refinancing their home loans, and (iii) average fee per closing unit, which represents the average fee we earn on purchase title andrefinancing title sides. An increase or decrease in homesale transactions will impact the financial results of TRG; however, the financial results are notsignificantly impacted by a change in homesale price. In addition, although the average mortgage rate continued to decline in 2015 and 2016 and refinancingtransactions increased as a result, we believe that an increase in mortgage rates in the future will most likely have a negative impact on refinancing title andclosing units.
A decline in the number of homesale transactions and decline in homesale prices could adversely affect our results of operations by: (i) reducing theroyalties we receive from our franchisees, (ii) reducing the commissions our company owned brokerage operations earn, (iii) reducing the demand for ourtitle and settlement services, and (iv) reducing the referral fees we earn in our relocation services business. Our results could also be negatively affected by adecline in commission rates charged by brokers or greater commission payments to sales associates.
37
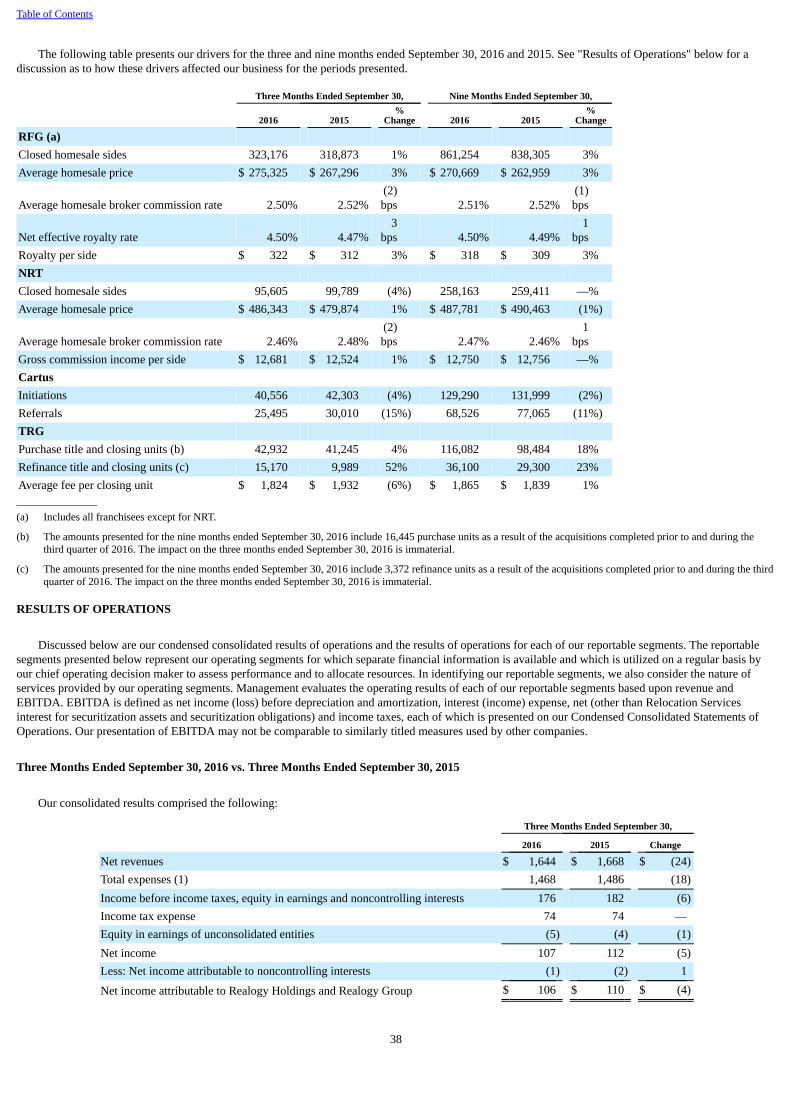
Table of Contents
The following table presents our drivers for the three and nine months ended September 30, 2016 and 2015. See "Results of Operations" below for adiscussion as to how these drivers affected our business for the periods presented.
Three Months Ended September 30, Nine Months Ended September 30,
2016 2015 %
Change 2016 2015 %
Change
RFG (a) Closed homesale sides 323,176 318,873 1% 861,254 838,305 3%Average homesale price $ 275,325 $ 267,296 3% $ 270,669 $ 262,959 3%
Average homesale broker commission rate 2.50% 2.52% (2)bps 2.51% 2.52%
(1)bps
Net effective royalty rate 4.50% 4.47% 3
bps 4.50% 4.49% 1
bpsRoyalty per side $ 322 $ 312 3% $ 318 $ 309 3%NRT Closed homesale sides 95,605 99,789 (4%) 258,163 259,411 —%Average homesale price $ 486,343 $ 479,874 1% $ 487,781 $ 490,463 (1%)
Average homesale broker commission rate 2.46% 2.48% (2)bps 2.47% 2.46%
1bps
Gross commission income per side $ 12,681 $ 12,524 1% $ 12,750 $ 12,756 —%Cartus Initiations 40,556 42,303 (4%) 129,290 131,999 (2%)Referrals 25,495 30,010 (15%) 68,526 77,065 (11%)TRG Purchase title and closing units (b) 42,932 41,245 4% 116,082 98,484 18%Refinance title and closing units (c) 15,170 9,989 52% 36,100 29,300 23%Average fee per closing unit $ 1,824 $ 1,932 (6%) $ 1,865 $ 1,839 1%_______________(a) Includes all franchisees except for NRT.
(b) The amounts presented for the nine months ended September 30, 2016 include 16,445 purchase units as a result of the acquisitions completed prior to and during thethird quarter of 2016. The impact on the three months ended September 30, 2016 is immaterial.
(c) The amounts presented for the nine months ended September 30, 2016 include 3,372 refinance units as a result of the acquisitions completed prior to and during the thirdquarter of 2016. The impact on the three months ended September 30, 2016 is immaterial.
RESULTS OF OPERATIONS
Discussed below are our condensed consolidated results of operations and the results of operations for each of our reportable segments. The reportablesegments presented below represent our operating segments for which separate financial information is available and which is utilized on a regular basis byour chief operating decision maker to assess performance and to allocate resources. In identifying our reportable segments, we also consider the nature ofservices provided by our operating segments. Management evaluates the operating results of each of our reportable segments based upon revenue andEBITDA. EBITDA is defined as net income (loss) before depreciation and amortization, interest (income) expense, net (other than Relocation Servicesinterest for securitization assets and securitization obligations) and income taxes, each of which is presented on our Condensed Consolidated Statements ofOperations. Our presentation of EBITDA may not be comparable to similarly titled measures used by other companies.
Three Months Ended September 30, 2016 vs. Three Months Ended September 30, 2015
Our consolidated results comprised the following:
Three Months Ended September 30,
2016 2015 Change
Net revenues $ 1,644 $ 1,668 $ (24)Total expenses (1) 1,468 1,486 (18)Income before income taxes, equity in earnings and noncontrolling interests 176 182 (6)Income tax expense 74 74 —Equity in earnings of unconsolidated entities (5) (4) (1)Net income 107 112 (5)Less: Net income attributable to noncontrolling interests (1) (2) 1
Net income attributable to Realogy Holdings and Realogy Group $ 106 $ 110 $ (4)
38
Table of Contents
_______________
(1) Total expenses for the three months ended September 30, 2016 includes $9 million of restructuring charges. Total expenses for the three months ended September 30,2015 includes a net benefit of $14 million of former parent legacy items.
Net revenues decreased $24 million or 1% for the three months ended September 30, 2016 compared with the three months ended September 30, 2015,principally due to the decrease in revenues at NRT.
Total expenses decreased $18 million or 1% primarily due to:
• a $33 million net decrease in interest expense to $37 million in the third quarter of 2016 from $70 million in the third quarter of 2015. Before themark-to-market adjustments for our interest rate swaps, interest expense decreased $12 million to $42 million in 2016 from $54 million in 2015 as aresult of a reduction in total outstanding indebtedness and a lower weighted average interest rate. Mark-to-market adjustments for our interest rateswaps resulted in gains of $5 million in the third quarter of 2016 compared to losses of $16 million in the same period of 2015; and
• a $21 million decrease in commission and other sales associate-related costs due to a decrease in homesale transaction volume at NRT;
partially offset by,• a $12 million increase in operating and general and administrative expenses primarily driven by:
◦ a $6 million increase in variable operating costs at TRG primarily related to volume increases as a result of acquisitions;
◦ $6 million of additional employee-related costs associated with acquisitions completed after the third quarter of 2015; and
◦ a $2 million increase in employee-related costs primarily due to $9 million of salary, benefits and other increases, partially offset by a $7 milliondecrease in employee-related costs due to lower incentive accruals;
• the absence in 2016 of a net benefit of former parent legacy items due to the reduction of a tax liability of $14 million during the three months endedSeptember 30, 2015; and
• $9 million in restructuring charges for the Company's business optimization initiative.
Equity in earnings of unconsolidated entities improved $1 million due to an increase in earnings from PHH Home Loans.
During the fourth quarter of 2015, the Company began a business optimization initiative that focuses on maximizing the efficiency and effectiveness ofthe cost structure of each of the Company's business units. The action is designed to improve client service levels across each of the business units whileenhancing the Company's profitability and incremental margins. The plan focuses on several key areas of opportunity which include process improvementefficiencies, office footprint optimization, leveraging technology and media spend, centralized procurement, outsourcing administrative services andorganizational design. The Company incurred $9 million of restructuring charges during the third quarter of 2016 which consisted of personnel-related costsand facility-related costs. See Note 6, "Restructuring Costs", in the consolidated financial statements for additional information.
The Company's provision for income taxes in interim periods is computed by applying its estimated annual effective tax rate against the income or lossbefore income taxes for the period. In addition, non-recurring or discrete items are recorded during the period in which they occur. The provision for incometaxes was $74 million for the three months ended September 30, 2016 compared to $74 million for the three months ended September 30, 2015. Our federaland state blended statutory rate is estimated to be 40% for 2016. Our effective tax rate for the three months ended September 30, 2016 and 2015 was 41% and40%, respectively.
39
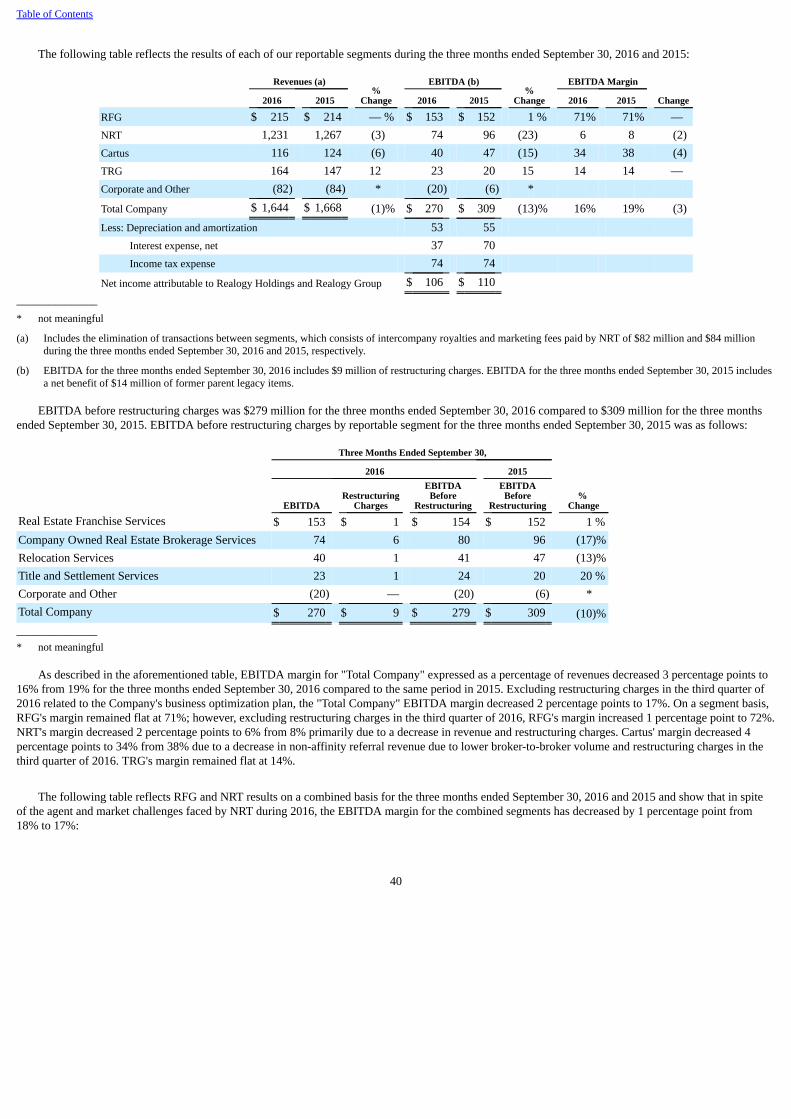
Table of Contents
The following table reflects the results of each of our reportable segments during the three months ended September 30, 2016 and 2015:
Revenues (a) %
Change
EBITDA (b) %
Change
EBITDA Margin
Change 2016 2015 2016 2015 2016 2015 RFG $ 215 $ 214 — % $ 153 $ 152 1 % 71% 71% —NRT 1,231 1,267 (3) 74 96 (23) 6 8 (2)Cartus 116 124 (6) 40 47 (15) 34 38 (4)TRG 164 147 12 23 20 15 14 14 —Corporate and Other (82) (84) * (20) (6) *
Total Company $ 1,644 $ 1,668 (1)% $ 270 $ 309 (13)% 16% 19% (3)Less: Depreciation and amortization 53 55
Interest expense, net 37 70 Income tax expense 74 74
Net income attributable to Realogy Holdings and Realogy Group $ 106 $ 110 _______________
* not meaningful
(a) Includes the elimination of transactions between segments, which consists of intercompany royalties and marketing fees paid by NRT of $82 million and $84 millionduring the three months ended September 30, 2016 and 2015, respectively.
(b) EBITDA for the three months ended September 30, 2016 includes $9 million of restructuring charges. EBITDA for the three months ended September 30, 2015 includesa net benefit of $14 million of former parent legacy items.
EBITDA before restructuring charges was $279 million for the three months ended September 30, 2016 compared to $309 million for the three monthsended September 30, 2015. EBITDA before restructuring charges by reportable segment for the three months ended September 30, 2015 was as follows:
Three Months Ended September 30, 2016 2015
EBITDA Restructuring
Charges EBITDA
BeforeRestructuring
EBITDABefore
Restructuring %
Change
Real Estate Franchise Services $ 153 $ 1 $ 154 $ 152 1 %Company Owned Real Estate Brokerage Services 74 6 80 96 (17)%Relocation Services 40 1 41 47 (13)%Title and Settlement Services 23 1 24 20 20 %Corporate and Other (20) — (20) (6) *Total Company $ 270 $ 9 $ 279 $ 309 (10)%_______________* not meaningful
As described in the aforementioned table, EBITDA margin for "Total Company" expressed as a percentage of revenues decreased 3 percentage points to16% from 19% for the three months ended September 30, 2016 compared to the same period in 2015. Excluding restructuring charges in the third quarter of2016 related to the Company's business optimization plan, the "Total Company" EBITDA margin decreased 2 percentage points to 17%. On a segment basis,RFG's margin remained flat at 71%; however, excluding restructuring charges in the third quarter of 2016, RFG's margin increased 1 percentage point to 72%.NRT's margin decreased 2 percentage points to 6% from 8% primarily due to a decrease in revenue and restructuring charges. Cartus' margin decreased 4percentage points to 34% from 38% due to a decrease in non-affinity referral revenue due to lower broker-to-broker volume and restructuring charges in thethird quarter of 2016. TRG's margin remained flat at 14%.
The following table reflects RFG and NRT results on a combined basis for the three months ended September 30, 2016 and 2015 and show that in spiteof the agent and market challenges faced by NRT during 2016, the EBITDA margin for the combined segments has decreased by 1 percentage point from18% to 17%:
40
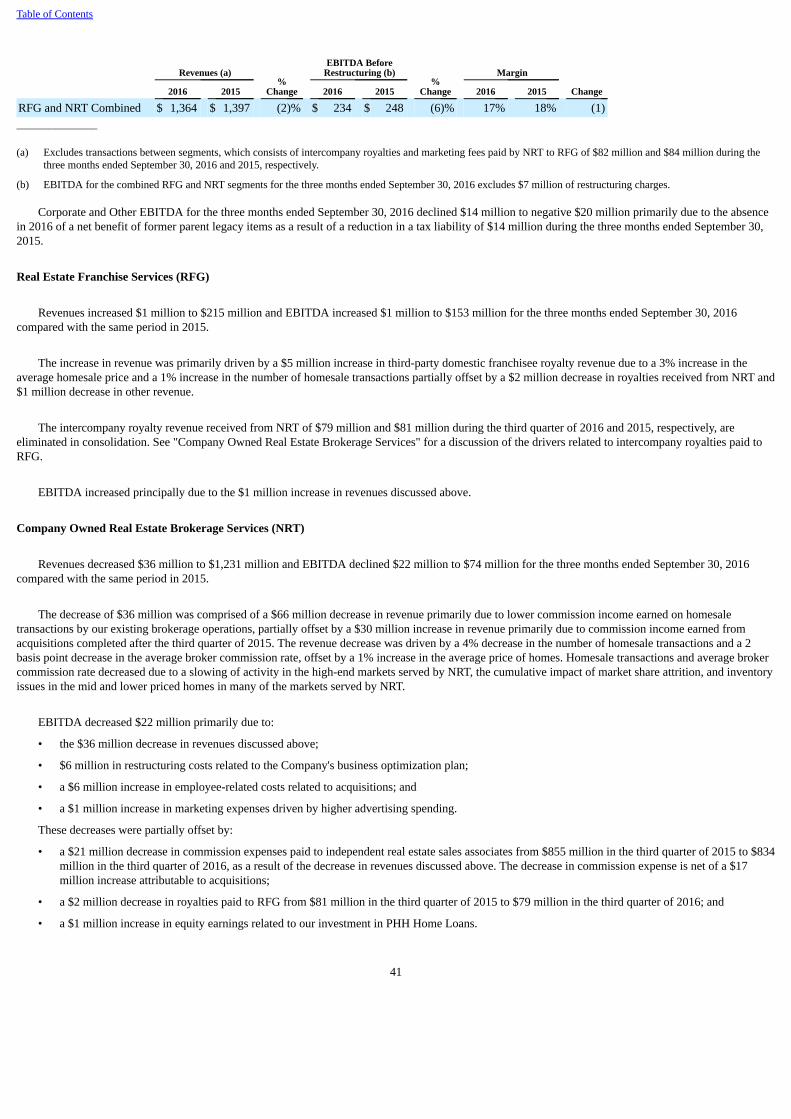
Table of Contents
Revenues (a) %
Change
EBITDA Before
Restructuring (b) %
Change
Margin
Change 2016 2015 2016 2015 2016 2015 RFG and NRT Combined $ 1,364 $ 1,397 (2)% $ 234 $ 248 (6)% 17% 18% (1)_______________
(a) Excludes transactions between segments, which consists of intercompany royalties and marketing fees paid by NRT to RFG of $82 million and $84 million during thethree months ended September 30, 2016 and 2015, respectively.
(b) EBITDA for the combined RFG and NRT segments for the three months ended September 30, 2016 excludes $7 million of restructuring charges.
Corporate and Other EBITDA for the three months ended September 30, 2016 declined $14 million to negative $20 million primarily due to the absencein 2016 of a net benefit of former parent legacy items as a result of a reduction in a tax liability of $14 million during the three months ended September 30,2015.
Real Estate Franchise Services (RFG)
Revenues increased $1 million to $215 million and EBITDA increased $1 million to $153 million for the three months ended September 30, 2016compared with the same period in 2015.
The increase in revenue was primarily driven by a $5 million increase in third-party domestic franchisee royalty revenue due to a 3% increase in theaverage homesale price and a 1% increase in the number of homesale transactions partially offset by a $2 million decrease in royalties received from NRT and$1 million decrease in other revenue.
The intercompany royalty revenue received from NRT of $79 million and $81 million during the third quarter of 2016 and 2015, respectively, areeliminated in consolidation. See "Company Owned Real Estate Brokerage Services" for a discussion of the drivers related to intercompany royalties paid toRFG.
EBITDA increased principally due to the $1 million increase in revenues discussed above.
Company Owned Real Estate Brokerage Services (NRT)
Revenues decreased $36 million to $1,231 million and EBITDA declined $22 million to $74 million for the three months ended September 30, 2016compared with the same period in 2015.
The decrease of $36 million was comprised of a $66 million decrease in revenue primarily due to lower commission income earned on homesaletransactions by our existing brokerage operations, partially offset by a $30 million increase in revenue primarily due to commission income earned fromacquisitions completed after the third quarter of 2015. The revenue decrease was driven by a 4% decrease in the number of homesale transactions and a 2basis point decrease in the average broker commission rate, offset by a 1% increase in the average price of homes. Homesale transactions and average brokercommission rate decreased due to a slowing of activity in the high-end markets served by NRT, the cumulative impact of market share attrition, and inventoryissues in the mid and lower priced homes in many of the markets served by NRT.
EBITDA decreased $22 million primarily due to:
• the $36 million decrease in revenues discussed above;
• $6 million in restructuring costs related to the Company's business optimization plan;
• a $6 million increase in employee-related costs related to acquisitions; and
• a $1 million increase in marketing expenses driven by higher advertising spending.
These decreases were partially offset by:
• a $21 million decrease in commission expenses paid to independent real estate sales associates from $855 million in the third quarter of 2015 to $834million in the third quarter of 2016, as a result of the decrease in revenues discussed above. The decrease in commission expense is net of a $17million increase attributable to acquisitions;
• a $2 million decrease in royalties paid to RFG from $81 million in the third quarter of 2015 to $79 million in the third quarter of 2016; and
• a $1 million increase in equity earnings related to our investment in PHH Home Loans.
41
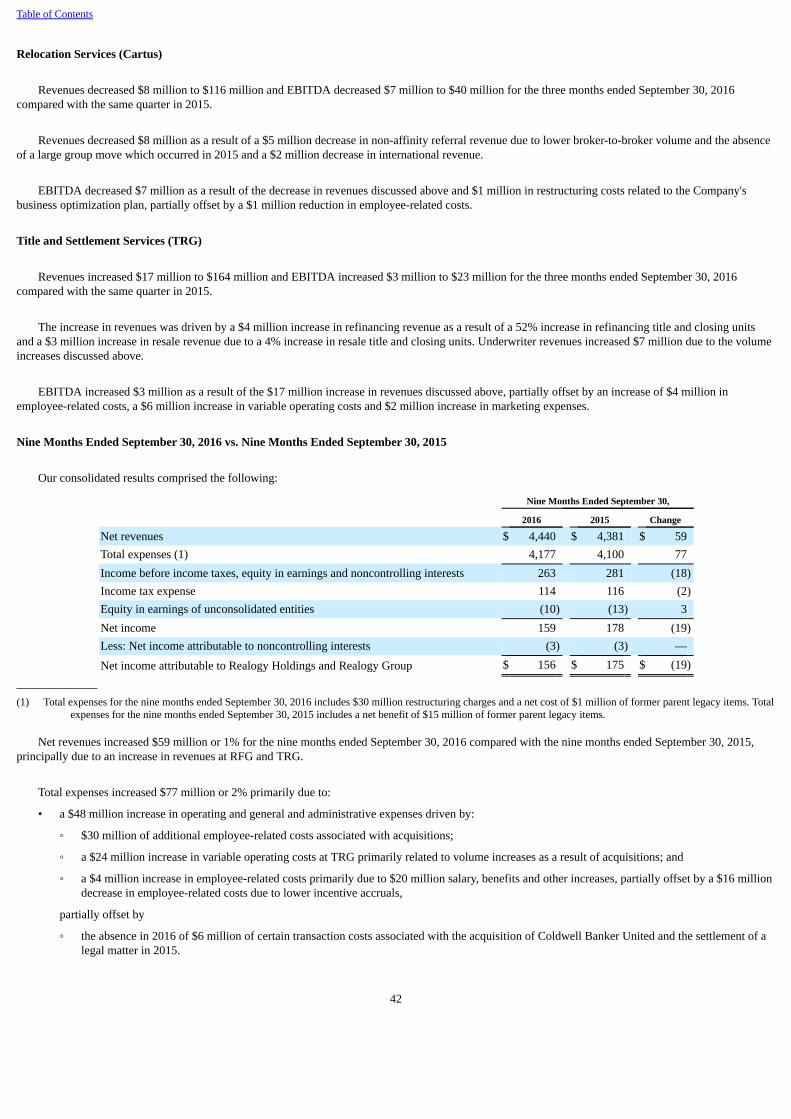
Table of Contents
Relocation Services (Cartus)
Revenues decreased $8 million to $116 million and EBITDA decreased $7 million to $40 million for the three months ended September 30, 2016compared with the same quarter in 2015.
Revenues decreased $8 million as a result of a $5 million decrease in non-affinity referral revenue due to lower broker-to-broker volume and the absenceof a large group move which occurred in 2015 and a $2 million decrease in international revenue.
EBITDA decreased $7 million as a result of the decrease in revenues discussed above and $1 million in restructuring costs related to the Company'sbusiness optimization plan, partially offset by a $1 million reduction in employee-related costs.
Title and Settlement Services (TRG)
Revenues increased $17 million to $164 million and EBITDA increased $3 million to $23 million for the three months ended September 30, 2016compared with the same quarter in 2015.
The increase in revenues was driven by a $4 million increase in refinancing revenue as a result of a 52% increase in refinancing title and closing unitsand a $3 million increase in resale revenue due to a 4% increase in resale title and closing units. Underwriter revenues increased $7 million due to the volumeincreases discussed above.
EBITDA increased $3 million as a result of the $17 million increase in revenues discussed above, partially offset by an increase of $4 million inemployee-related costs, a $6 million increase in variable operating costs and $2 million increase in marketing expenses.
Nine Months Ended September 30, 2016 vs. Nine Months Ended September 30, 2015
Our consolidated results comprised the following:
Nine Months Ended September 30,
2016 2015 Change
Net revenues $ 4,440 $ 4,381 $ 59Total expenses (1) 4,177 4,100 77Income before income taxes, equity in earnings and noncontrolling interests 263 281 (18)Income tax expense 114 116 (2)Equity in earnings of unconsolidated entities (10) (13) 3Net income 159 178 (19)Less: Net income attributable to noncontrolling interests (3) (3) —
Net income attributable to Realogy Holdings and Realogy Group $ 156 $ 175 $ (19)
_______________
(1) Total expenses for the nine months ended September 30, 2016 includes $30 million restructuring charges and a net cost of $1 million of former parent legacy items. Totalexpenses for the nine months ended September 30, 2015 includes a net benefit of $15 million of former parent legacy items.
Net revenues increased $59 million or 1% for the nine months ended September 30, 2016 compared with the nine months ended September 30, 2015,principally due to an increase in revenues at RFG and TRG.
Total expenses increased $77 million or 2% primarily due to:
• a $48 million increase in operating and general and administrative expenses driven by:
◦ $30 million of additional employee-related costs associated with acquisitions;
◦ a $24 million increase in variable operating costs at TRG primarily related to volume increases as a result of acquisitions; and
◦ a $4 million increase in employee-related costs primarily due to $20 million salary, benefits and other increases, partially offset by a $16 milliondecrease in employee-related costs due to lower incentive accruals,
partially offset by
◦ the absence in 2016 of $6 million of certain transaction costs associated with the acquisition of Coldwell Banker United and the settlement of alegal matter in 2015.
42
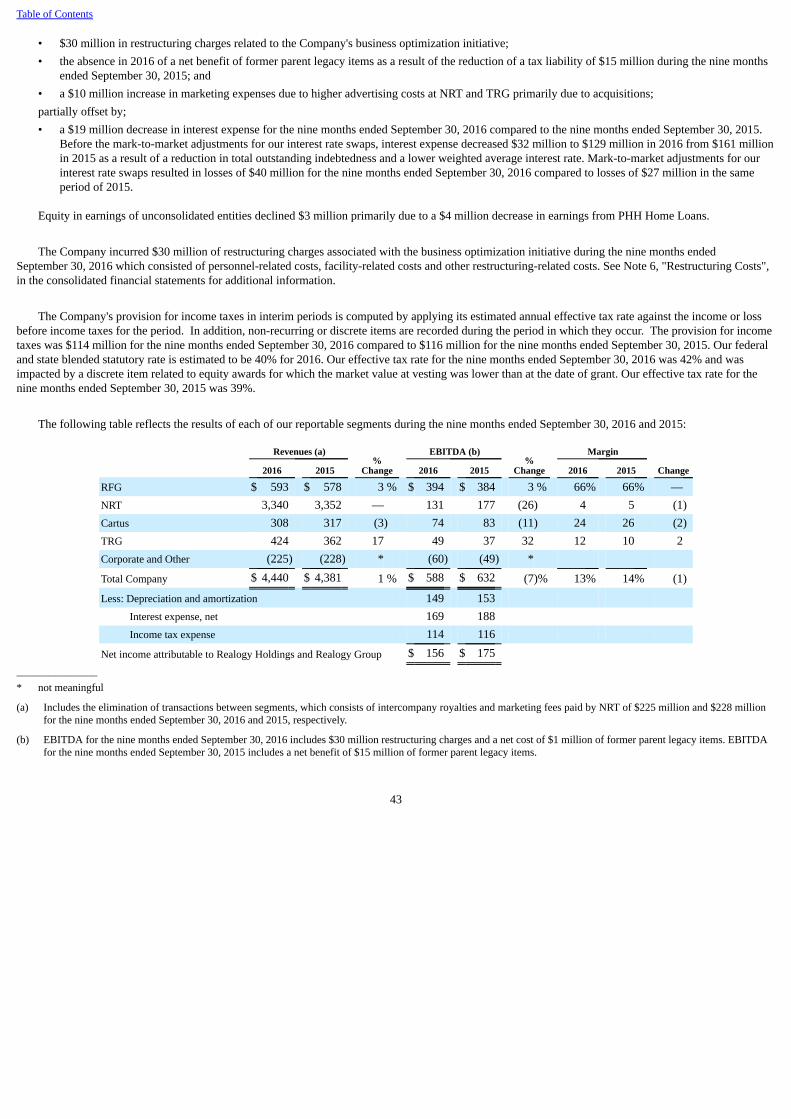
Table of Contents
• $30 million in restructuring charges related to the Company's business optimization initiative;• the absence in 2016 of a net benefit of former parent legacy items as a result of the reduction of a tax liability of $15 million during the nine months
ended September 30, 2015; and• a $10 million increase in marketing expenses due to higher advertising costs at NRT and TRG primarily due to acquisitions;partially offset by;• a $19 million decrease in interest expense for the nine months ended September 30, 2016 compared to the nine months ended September 30, 2015.
Before the mark-to-market adjustments for our interest rate swaps, interest expense decreased $32 million to $129 million in 2016 from $161 millionin 2015 as a result of a reduction in total outstanding indebtedness and a lower weighted average interest rate. Mark-to-market adjustments for ourinterest rate swaps resulted in losses of $40 million for the nine months ended September 30, 2016 compared to losses of $27 million in the sameperiod of 2015.
Equity in earnings of unconsolidated entities declined $3 million primarily due to a $4 million decrease in earnings from PHH Home Loans.
The Company incurred $30 million of restructuring charges associated with the business optimization initiative during the nine months endedSeptember 30, 2016 which consisted of personnel-related costs, facility-related costs and other restructuring-related costs. See Note 6, "Restructuring Costs",in the consolidated financial statements for additional information.
The Company's provision for income taxes in interim periods is computed by applying its estimated annual effective tax rate against the income or lossbefore income taxes for the period. In addition, non-recurring or discrete items are recorded during the period in which they occur. The provision for incometaxes was $114 million for the nine months ended September 30, 2016 compared to $116 million for the nine months ended September 30, 2015. Our federaland state blended statutory rate is estimated to be 40% for 2016. Our effective tax rate for the nine months ended September 30, 2016 was 42% and wasimpacted by a discrete item related to equity awards for which the market value at vesting was lower than at the date of grant. Our effective tax rate for thenine months ended September 30, 2015 was 39%.
The following table reflects the results of each of our reportable segments during the nine months ended September 30, 2016 and 2015:
Revenues (a) %
Change
EBITDA (b) %
Change
Margin
Change 2016 2015 2016 2015 2016 2015 RFG $ 593 $ 578 3 % $ 394 $ 384 3 % 66% 66% —NRT 3,340 3,352 — 131 177 (26) 4 5 (1)Cartus 308 317 (3) 74 83 (11) 24 26 (2)TRG 424 362 17 49 37 32 12 10 2Corporate and Other (225) (228) * (60) (49) *
Total Company $ 4,440 $ 4,381 1 % $ 588 $ 632 (7)% 13% 14% (1)
Less: Depreciation and amortization 149 153 Interest expense, net 169 188 Income tax expense 114 116
Net income attributable to Realogy Holdings and Realogy Group $ 156 $ 175 _______________* not meaningful
(a) Includes the elimination of transactions between segments, which consists of intercompany royalties and marketing fees paid by NRT of $225 million and $228 millionfor the nine months ended September 30, 2016 and 2015, respectively.
(b) EBITDA for the nine months ended September 30, 2016 includes $30 million restructuring charges and a net cost of $1 million of former parent legacy items. EBITDAfor the nine months ended September 30, 2015 includes a net benefit of $15 million of former parent legacy items.
43
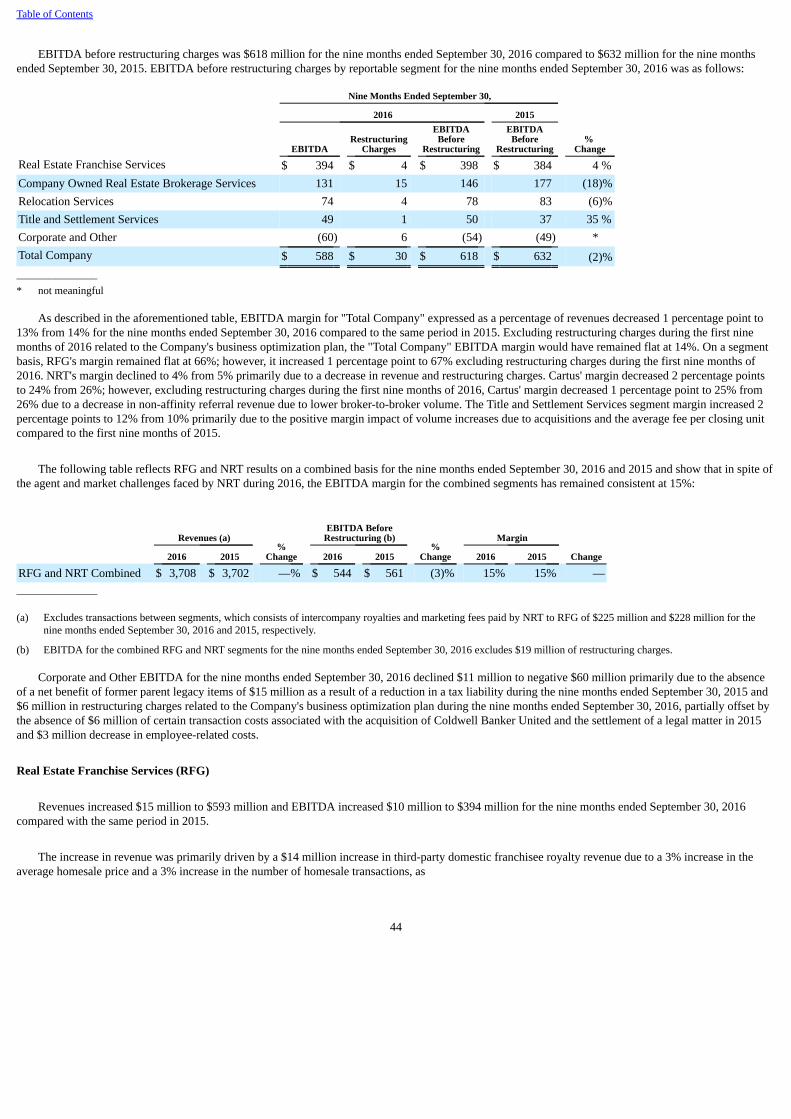
Table of Contents
EBITDA before restructuring charges was $618 million for the nine months ended September 30, 2016 compared to $632 million for the nine monthsended September 30, 2015. EBITDA before restructuring charges by reportable segment for the nine months ended September 30, 2016 was as follows:
Nine Months Ended September 30, 2016 2015
EBITDA Restructuring
Charges EBITDA
BeforeRestructuring
EBITDABefore
Restructuring %
Change
Real Estate Franchise Services $ 394 $ 4 $ 398 $ 384 4 %Company Owned Real Estate Brokerage Services 131 15 146 177 (18)%Relocation Services 74 4 78 83 (6)%Title and Settlement Services 49 1 50 37 35 %Corporate and Other (60) 6 (54) (49) *Total Company $ 588 $ 30 $ 618 $ 632 (2)%_______________* not meaningful
As described in the aforementioned table, EBITDA margin for "Total Company" expressed as a percentage of revenues decreased 1 percentage point to13% from 14% for the nine months ended September 30, 2016 compared to the same period in 2015. Excluding restructuring charges during the first ninemonths of 2016 related to the Company's business optimization plan, the "Total Company" EBITDA margin would have remained flat at 14%. On a segmentbasis, RFG's margin remained flat at 66%; however, it increased 1 percentage point to 67% excluding restructuring charges during the first nine months of2016. NRT's margin declined to 4% from 5% primarily due to a decrease in revenue and restructuring charges. Cartus' margin decreased 2 percentage pointsto 24% from 26%; however, excluding restructuring charges during the first nine months of 2016, Cartus' margin decreased 1 percentage point to 25% from26% due to a decrease in non-affinity referral revenue due to lower broker-to-broker volume. The Title and Settlement Services segment margin increased 2percentage points to 12% from 10% primarily due to the positive margin impact of volume increases due to acquisitions and the average fee per closing unitcompared to the first nine months of 2015.
The following table reflects RFG and NRT results on a combined basis for the nine months ended September 30, 2016 and 2015 and show that in spite ofthe agent and market challenges faced by NRT during 2016, the EBITDA margin for the combined segments has remained consistent at 15%:
Revenues (a) %
Change
EBITDA Before
Restructuring (b) %
Change
Margin
Change 2016 2015 2016 2015 2016 2015 RFG and NRT Combined $ 3,708 $ 3,702 —% $ 544 $ 561 (3)% 15% 15% —_______________
(a) Excludes transactions between segments, which consists of intercompany royalties and marketing fees paid by NRT to RFG of $225 million and $228 million for thenine months ended September 30, 2016 and 2015, respectively.
(b) EBITDA for the combined RFG and NRT segments for the nine months ended September 30, 2016 excludes $19 million of restructuring charges.
Corporate and Other EBITDA for the nine months ended September 30, 2016 declined $11 million to negative $60 million primarily due to the absenceof a net benefit of former parent legacy items of $15 million as a result of a reduction in a tax liability during the nine months ended September 30, 2015 and$6 million in restructuring charges related to the Company's business optimization plan during the nine months ended September 30, 2016, partially offset bythe absence of $6 million of certain transaction costs associated with the acquisition of Coldwell Banker United and the settlement of a legal matter in 2015and $3 million decrease in employee-related costs.
Real Estate Franchise Services (RFG)
Revenues increased $15 million to $593 million and EBITDA increased $10 million to $394 million for the nine months ended September 30, 2016compared with the same period in 2015.
The increase in revenue was primarily driven by a $14 million increase in third-party domestic franchisee royalty revenue due to a 3% increase in theaverage homesale price and a 3% increase in the number of homesale transactions, as
44
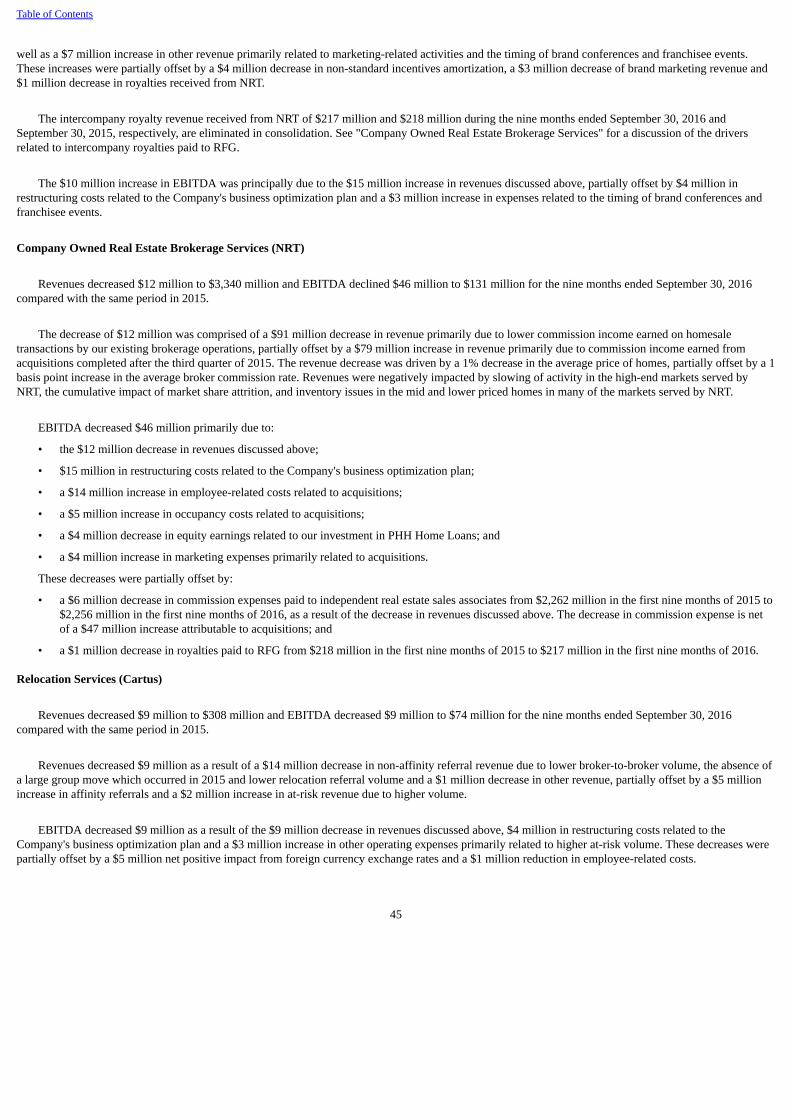
Table of Contents
well as a $7 million increase in other revenue primarily related to marketing-related activities and the timing of brand conferences and franchisee events.These increases were partially offset by a $4 million decrease in non-standard incentives amortization, a $3 million decrease of brand marketing revenue and$1 million decrease in royalties received from NRT.
The intercompany royalty revenue received from NRT of $217 million and $218 million during the nine months ended September 30, 2016 andSeptember 30, 2015, respectively, are eliminated in consolidation. See "Company Owned Real Estate Brokerage Services" for a discussion of the driversrelated to intercompany royalties paid to RFG.
The $10 million increase in EBITDA was principally due to the $15 million increase in revenues discussed above, partially offset by $4 million inrestructuring costs related to the Company's business optimization plan and a $3 million increase in expenses related to the timing of brand conferences andfranchisee events.
Company Owned Real Estate Brokerage Services (NRT)
Revenues decreased $12 million to $3,340 million and EBITDA declined $46 million to $131 million for the nine months ended September 30, 2016compared with the same period in 2015.
The decrease of $12 million was comprised of a $91 million decrease in revenue primarily due to lower commission income earned on homesaletransactions by our existing brokerage operations, partially offset by a $79 million increase in revenue primarily due to commission income earned fromacquisitions completed after the third quarter of 2015. The revenue decrease was driven by a 1% decrease in the average price of homes, partially offset by a 1basis point increase in the average broker commission rate. Revenues were negatively impacted by slowing of activity in the high-end markets served byNRT, the cumulative impact of market share attrition, and inventory issues in the mid and lower priced homes in many of the markets served by NRT.
EBITDA decreased $46 million primarily due to:
• the $12 million decrease in revenues discussed above;
• $15 million in restructuring costs related to the Company's business optimization plan;
• a $14 million increase in employee-related costs related to acquisitions;
• a $5 million increase in occupancy costs related to acquisitions;
• a $4 million decrease in equity earnings related to our investment in PHH Home Loans; and
• a $4 million increase in marketing expenses primarily related to acquisitions.
These decreases were partially offset by:
• a $6 million decrease in commission expenses paid to independent real estate sales associates from $2,262 million in the first nine months of 2015 to$2,256 million in the first nine months of 2016, as a result of the decrease in revenues discussed above. The decrease in commission expense is netof a $47 million increase attributable to acquisitions; and
• a $1 million decrease in royalties paid to RFG from $218 million in the first nine months of 2015 to $217 million in the first nine months of 2016.
Relocation Services (Cartus)
Revenues decreased $9 million to $308 million and EBITDA decreased $9 million to $74 million for the nine months ended September 30, 2016compared with the same period in 2015.
Revenues decreased $9 million as a result of a $14 million decrease in non-affinity referral revenue due to lower broker-to-broker volume, the absence ofa large group move which occurred in 2015 and lower relocation referral volume and a $1 million decrease in other revenue, partially offset by a $5 millionincrease in affinity referrals and a $2 million increase in at-risk revenue due to higher volume.
EBITDA decreased $9 million as a result of the $9 million decrease in revenues discussed above, $4 million in restructuring costs related to theCompany's business optimization plan and a $3 million increase in other operating expenses primarily related to higher at-risk volume. These decreases werepartially offset by a $5 million net positive impact from foreign currency exchange rates and a $1 million reduction in employee-related costs.
45
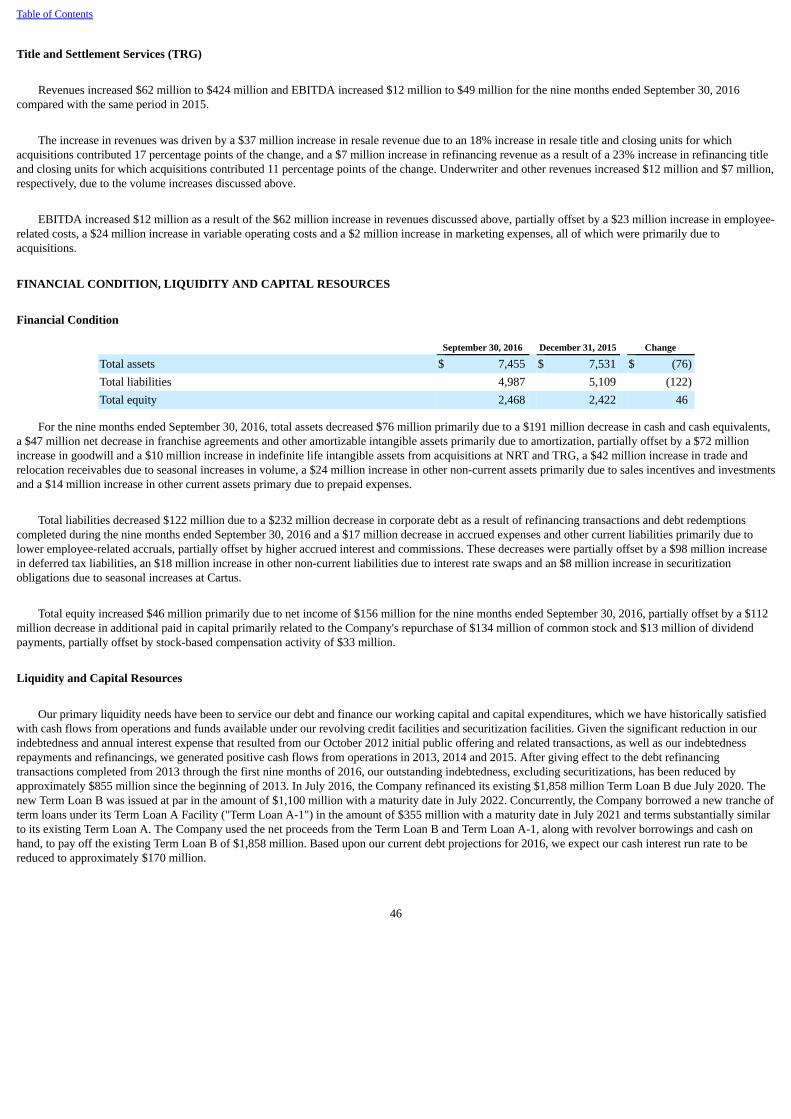
Table of Contents
Title and Settlement Services (TRG)
Revenues increased $62 million to $424 million and EBITDA increased $12 million to $49 million for the nine months ended September 30, 2016compared with the same period in 2015.
The increase in revenues was driven by a $37 million increase in resale revenue due to an 18% increase in resale title and closing units for whichacquisitions contributed 17 percentage points of the change, and a $7 million increase in refinancing revenue as a result of a 23% increase in refinancing titleand closing units for which acquisitions contributed 11 percentage points of the change. Underwriter and other revenues increased $12 million and $7 million,respectively, due to the volume increases discussed above.
EBITDA increased $12 million as a result of the $62 million increase in revenues discussed above, partially offset by a $23 million increase in employee-related costs, a $24 million increase in variable operating costs and a $2 million increase in marketing expenses, all of which were primarily due toacquisitions.
FINANCIAL CONDITION, LIQUIDITY AND CAPITAL RESOURCES
Financial Condition
September 30, 2016 December 31, 2015 Change
Total assets $ 7,455 $ 7,531 $ (76)Total liabilities 4,987 5,109 (122)Total equity 2,468 2,422 46
For the nine months ended September 30, 2016, total assets decreased $76 million primarily due to a $191 million decrease in cash and cash equivalents,a $47 million net decrease in franchise agreements and other amortizable intangible assets primarily due to amortization, partially offset by a $72 millionincrease in goodwill and a $10 million increase in indefinite life intangible assets from acquisitions at NRT and TRG, a $42 million increase in trade andrelocation receivables due to seasonal increases in volume, a $24 million increase in other non-current assets primarily due to sales incentives and investmentsand a $14 million increase in other current assets primary due to prepaid expenses.
Total liabilities decreased $122 million due to a $232 million decrease in corporate debt as a result of refinancing transactions and debt redemptionscompleted during the nine months ended September 30, 2016 and a $17 million decrease in accrued expenses and other current liabilities primarily due tolower employee-related accruals, partially offset by higher accrued interest and commissions. These decreases were partially offset by a $98 million increasein deferred tax liabilities, an $18 million increase in other non-current liabilities due to interest rate swaps and an $8 million increase in securitizationobligations due to seasonal increases at Cartus.
Total equity increased $46 million primarily due to net income of $156 million for the nine months ended September 30, 2016, partially offset by a $112million decrease in additional paid in capital primarily related to the Company's repurchase of $134 million of common stock and $13 million of dividendpayments, partially offset by stock-based compensation activity of $33 million.
Liquidity and Capital Resources
Our primary liquidity needs have been to service our debt and finance our working capital and capital expenditures, which we have historically satisfiedwith cash flows from operations and funds available under our revolving credit facilities and securitization facilities. Given the significant reduction in ourindebtedness and annual interest expense that resulted from our October 2012 initial public offering and related transactions, as well as our indebtednessrepayments and refinancings, we generated positive cash flows from operations in 2013, 2014 and 2015. After giving effect to the debt refinancingtransactions completed from 2013 through the first nine months of 2016, our outstanding indebtedness, excluding securitizations, has been reduced byapproximately $855 million since the beginning of 2013. In July 2016, the Company refinanced its existing $1,858 million Term Loan B due July 2020. Thenew Term Loan B was issued at par in the amount of $1,100 million with a maturity date in July 2022. Concurrently, the Company borrowed a new tranche ofterm loans under its Term Loan A Facility ("Term Loan A-1") in the amount of $355 million with a maturity date in July 2021 and terms substantially similarto its existing Term Loan A. The Company used the net proceeds from the Term Loan B and Term Loan A-1, along with revolver borrowings and cash onhand, to pay off the existing Term Loan B of $1,858 million. Based upon our current debt projections for 2016, we expect our cash interest run rate to bereduced to approximately $170 million.
46
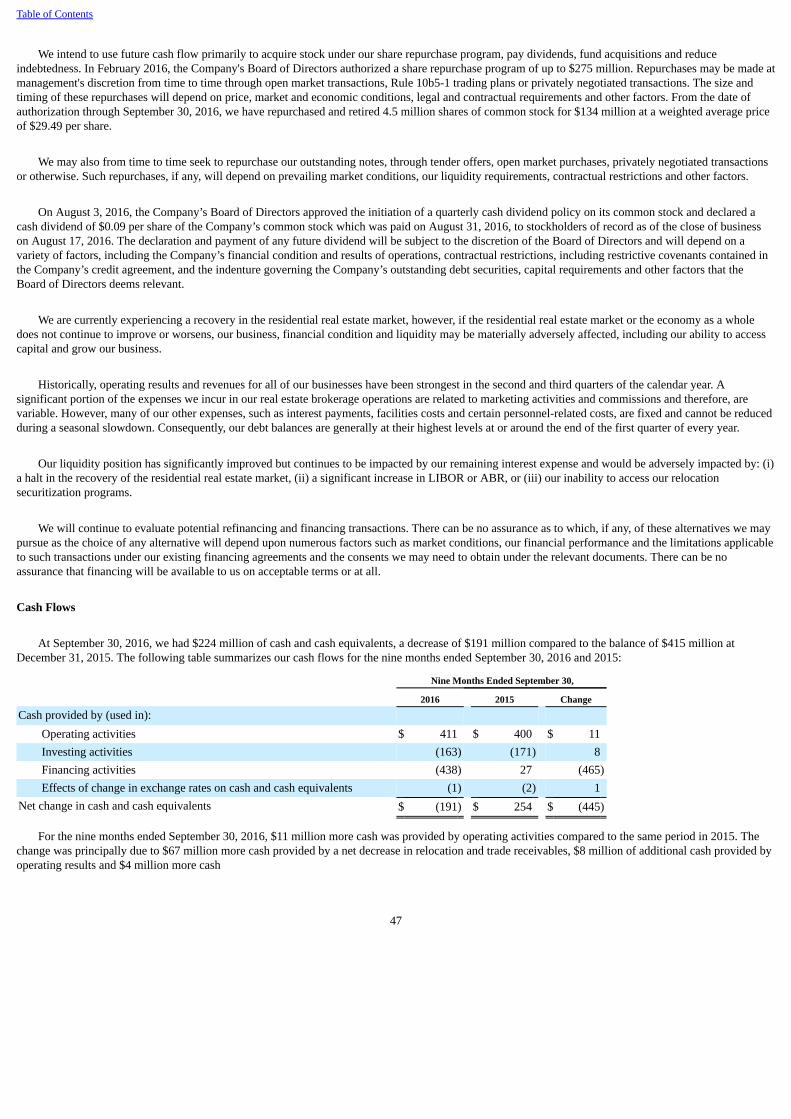
Table of Contents
We intend to use future cash flow primarily to acquire stock under our share repurchase program, pay dividends, fund acquisitions and reduceindebtedness. In February 2016, the Company's Board of Directors authorized a share repurchase program of up to $275 million. Repurchases may be made atmanagement's discretion from time to time through open market transactions, Rule 10b5-1 trading plans or privately negotiated transactions. The size andtiming of these repurchases will depend on price, market and economic conditions, legal and contractual requirements and other factors. From the date ofauthorization through September 30, 2016, we have repurchased and retired 4.5 million shares of common stock for $134 million at a weighted average priceof $29.49 per share.
We may also from time to time seek to repurchase our outstanding notes, through tender offers, open market purchases, privately negotiated transactionsor otherwise. Such repurchases, if any, will depend on prevailing market conditions, our liquidity requirements, contractual restrictions and other factors.
On August 3, 2016, the Company’s Board of Directors approved the initiation of a quarterly cash dividend policy on its common stock and declared acash dividend of $0.09 per share of the Company’s common stock which was paid on August 31, 2016, to stockholders of record as of the close of businesson August 17, 2016. The declaration and payment of any future dividend will be subject to the discretion of the Board of Directors and will depend on avariety of factors, including the Company’s financial condition and results of operations, contractual restrictions, including restrictive covenants contained inthe Company’s credit agreement, and the indenture governing the Company’s outstanding debt securities, capital requirements and other factors that theBoard of Directors deems relevant.
We are currently experiencing a recovery in the residential real estate market, however, if the residential real estate market or the economy as a wholedoes not continue to improve or worsens, our business, financial condition and liquidity may be materially adversely affected, including our ability to accesscapital and grow our business.
Historically, operating results and revenues for all of our businesses have been strongest in the second and third quarters of the calendar year. Asignificant portion of the expenses we incur in our real estate brokerage operations are related to marketing activities and commissions and therefore, arevariable. However, many of our other expenses, such as interest payments, facilities costs and certain personnel-related costs, are fixed and cannot be reducedduring a seasonal slowdown. Consequently, our debt balances are generally at their highest levels at or around the end of the first quarter of every year.
Our liquidity position has significantly improved but continues to be impacted by our remaining interest expense and would be adversely impacted by: (i)a halt in the recovery of the residential real estate market, (ii) a significant increase in LIBOR or ABR, or (iii) our inability to access our relocationsecuritization programs.
We will continue to evaluate potential refinancing and financing transactions. There can be no assurance as to which, if any, of these alternatives we maypursue as the choice of any alternative will depend upon numerous factors such as market conditions, our financial performance and the limitations applicableto such transactions under our existing financing agreements and the consents we may need to obtain under the relevant documents. There can be noassurance that financing will be available to us on acceptable terms or at all.
Cash Flows
At September 30, 2016, we had $224 million of cash and cash equivalents, a decrease of $191 million compared to the balance of $415 million atDecember 31, 2015. The following table summarizes our cash flows for the nine months ended September 30, 2016 and 2015:
Nine Months Ended September 30,
2016 2015 Change
Cash provided by (used in): Operating activities $ 411 $ 400 $ 11Investing activities (163) (171) 8Financing activities (438) 27 (465)Effects of change in exchange rates on cash and cash equivalents (1) (2) 1
Net change in cash and cash equivalents $ (191) $ 254 $ (445)
For the nine months ended September 30, 2016, $11 million more cash was provided by operating activities compared to the same period in 2015. Thechange was principally due to $67 million more cash provided by a net decrease in relocation and trade receivables, $8 million of additional cash provided byoperating results and $4 million more cash
47
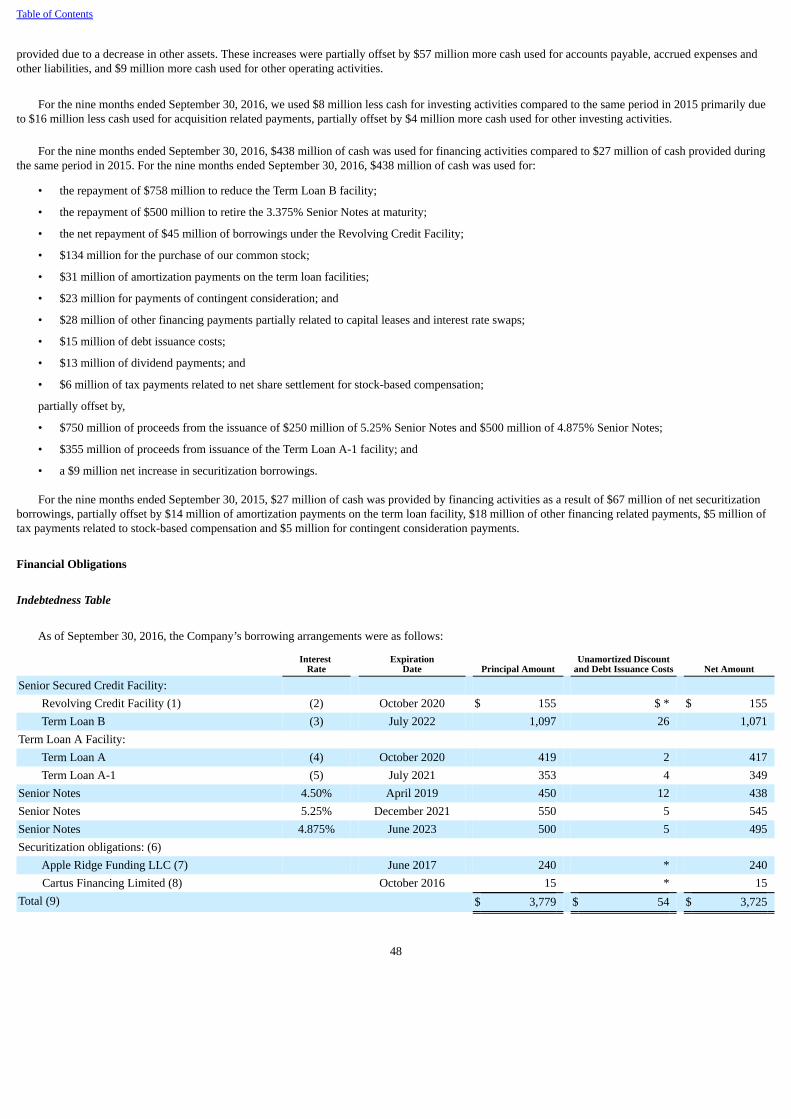
Table of Contents
provided due to a decrease in other assets. These increases were partially offset by $57 million more cash used for accounts payable, accrued expenses andother liabilities, and $9 million more cash used for other operating activities.
For the nine months ended September 30, 2016, we used $8 million less cash for investing activities compared to the same period in 2015 primarily dueto $16 million less cash used for acquisition related payments, partially offset by $4 million more cash used for other investing activities.
For the nine months ended September 30, 2016, $438 million of cash was used for financing activities compared to $27 million of cash provided duringthe same period in 2015. For the nine months ended September 30, 2016, $438 million of cash was used for:
• the repayment of $758 million to reduce the Term Loan B facility;
• the repayment of $500 million to retire the 3.375% Senior Notes at maturity;
• the net repayment of $45 million of borrowings under the Revolving Credit Facility;
• $134 million for the purchase of our common stock;
• $31 million of amortization payments on the term loan facilities;
• $23 million for payments of contingent consideration; and
• $28 million of other financing payments partially related to capital leases and interest rate swaps;
• $15 million of debt issuance costs;
• $13 million of dividend payments; and
• $6 million of tax payments related to net share settlement for stock-based compensation;
partially offset by,
• $750 million of proceeds from the issuance of $250 million of 5.25% Senior Notes and $500 million of 4.875% Senior Notes;
• $355 million of proceeds from issuance of the Term Loan A-1 facility; and
• a $9 million net increase in securitization borrowings.
For the nine months ended September 30, 2015, $27 million of cash was provided by financing activities as a result of $67 million of net securitizationborrowings, partially offset by $14 million of amortization payments on the term loan facility, $18 million of other financing related payments, $5 million oftax payments related to stock-based compensation and $5 million for contingent consideration payments.
Financial Obligations
Indebtedness Table
As of September 30, 2016, the Company’s borrowing arrangements were as follows:
Interest
Rate Expiration
Date Principal Amount Unamortized Discount
and Debt Issuance Costs Net Amount
Senior Secured Credit Facility: Revolving Credit Facility (1) (2) October 2020 $ 155 $ * $ 155Term Loan B (3) July 2022 1,097 26 1,071
Term Loan A Facility: Term Loan A (4) October 2020 419 2 417Term Loan A-1 (5) July 2021 353 4 349
Senior Notes 4.50% April 2019 450 12 438Senior Notes 5.25% December 2021 550 5 545Senior Notes 4.875% June 2023 500 5 495Securitization obligations: (6) Apple Ridge Funding LLC (7) June 2017 240 * 240 Cartus Financing Limited (8) October 2016 15 * 15Total (9) $ 3,779 $ 54 $ 3,725
48
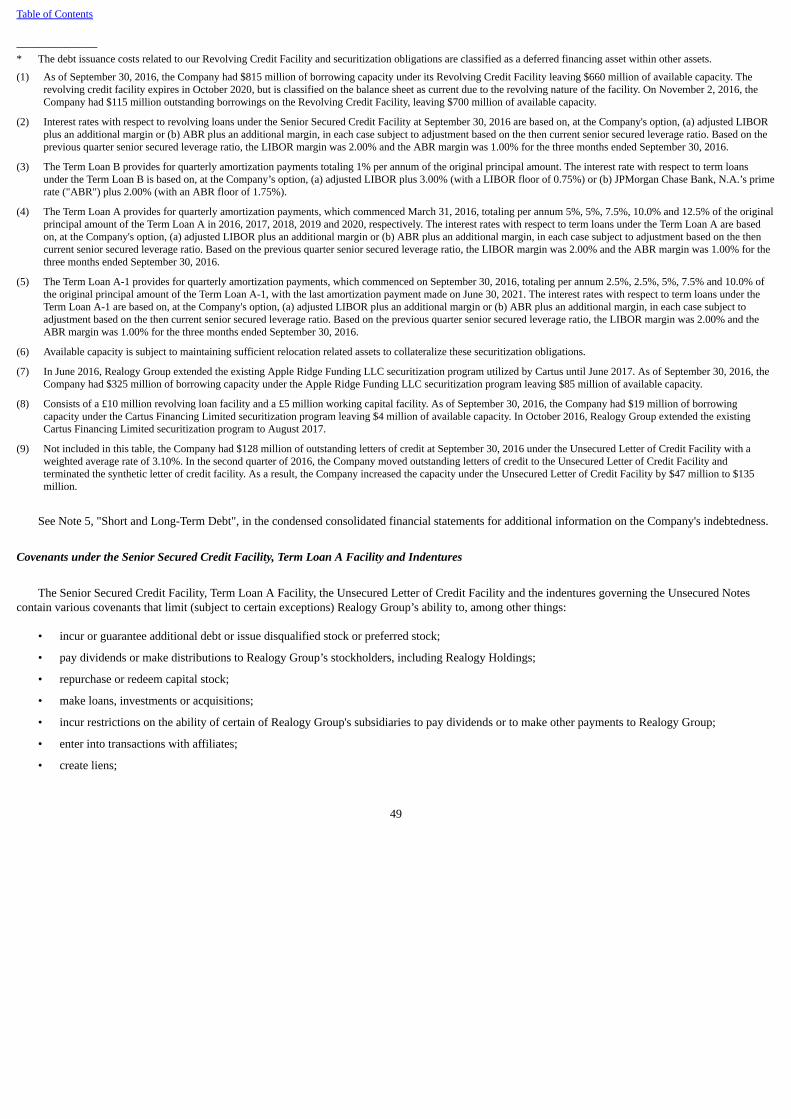
Table of Contents
_______________* The debt issuance costs related to our Revolving Credit Facility and securitization obligations are classified as a deferred financing asset within other assets.
(1) As of September 30, 2016, the Company had $815 million of borrowing capacity under its Revolving Credit Facility leaving $660 million of available capacity. Therevolving credit facility expires in October 2020, but is classified on the balance sheet as current due to the revolving nature of the facility. On November 2, 2016, theCompany had $115 million outstanding borrowings on the Revolving Credit Facility, leaving $700 million of available capacity.
(2) Interest rates with respect to revolving loans under the Senior Secured Credit Facility at September 30, 2016 are based on, at the Company's option, (a) adjusted LIBORplus an additional margin or (b) ABR plus an additional margin, in each case subject to adjustment based on the then current senior secured leverage ratio. Based on theprevious quarter senior secured leverage ratio, the LIBOR margin was 2.00% and the ABR margin was 1.00% for the three months ended September 30, 2016.
(3) The Term Loan B provides for quarterly amortization payments totaling 1% per annum of the original principal amount. The interest rate with respect to term loansunder the Term Loan B is based on, at the Company’s option, (a) adjusted LIBOR plus 3.00% (with a LIBOR floor of 0.75%) or (b) JPMorgan Chase Bank, N.A.’s primerate ("ABR") plus 2.00% (with an ABR floor of 1.75%).
(4) The Term Loan A provides for quarterly amortization payments, which commenced March 31, 2016, totaling per annum 5%, 5%, 7.5%, 10.0% and 12.5% of the originalprincipal amount of the Term Loan A in 2016, 2017, 2018, 2019 and 2020, respectively. The interest rates with respect to term loans under the Term Loan A are basedon, at the Company's option, (a) adjusted LIBOR plus an additional margin or (b) ABR plus an additional margin, in each case subject to adjustment based on the thencurrent senior secured leverage ratio. Based on the previous quarter senior secured leverage ratio, the LIBOR margin was 2.00% and the ABR margin was 1.00% for thethree months ended September 30, 2016.
(5) The Term Loan A-1 provides for quarterly amortization payments, which commenced on September 30, 2016, totaling per annum 2.5%, 2.5%, 5%, 7.5% and 10.0% ofthe original principal amount of the Term Loan A-1, with the last amortization payment made on June 30, 2021. The interest rates with respect to term loans under theTerm Loan A-1 are based on, at the Company's option, (a) adjusted LIBOR plus an additional margin or (b) ABR plus an additional margin, in each case subject toadjustment based on the then current senior secured leverage ratio. Based on the previous quarter senior secured leverage ratio, the LIBOR margin was 2.00% and theABR margin was 1.00% for the three months ended September 30, 2016.
(6) Available capacity is subject to maintaining sufficient relocation related assets to collateralize these securitization obligations.
(7) In June 2016, Realogy Group extended the existing Apple Ridge Funding LLC securitization program utilized by Cartus until June 2017. As of September 30, 2016, theCompany had $325 million of borrowing capacity under the Apple Ridge Funding LLC securitization program leaving $85 million of available capacity.
(8) Consists of a £10 million revolving loan facility and a £5 million working capital facility. As of September 30, 2016, the Company had $19 million of borrowingcapacity under the Cartus Financing Limited securitization program leaving $4 million of available capacity. In October 2016, Realogy Group extended the existingCartus Financing Limited securitization program to August 2017.
(9) Not included in this table, the Company had $128 million of outstanding letters of credit at September 30, 2016 under the Unsecured Letter of Credit Facility with aweighted average rate of 3.10%. In the second quarter of 2016, the Company moved outstanding letters of credit to the Unsecured Letter of Credit Facility andterminated the synthetic letter of credit facility. As a result, the Company increased the capacity under the Unsecured Letter of Credit Facility by $47 million to $135million.
See Note 5, "Short and Long-Term Debt", in the condensed consolidated financial statements for additional information on the Company's indebtedness.
Covenants under the Senior Secured Credit Facility, Term Loan A Facility and Indentures
The Senior Secured Credit Facility, Term Loan A Facility, the Unsecured Letter of Credit Facility and the indentures governing the Unsecured Notescontain various covenants that limit (subject to certain exceptions) Realogy Group’s ability to, among other things:
• incur or guarantee additional debt or issue disqualified stock or preferred stock;
• pay dividends or make distributions to Realogy Group’s stockholders, including Realogy Holdings;
• repurchase or redeem capital stock;
• make loans, investments or acquisitions;
• incur restrictions on the ability of certain of Realogy Group's subsidiaries to pay dividends or to make other payments to Realogy Group;
• enter into transactions with affiliates;
• create liens;
49

Table of Contents
• merge or consolidate with other companies or transfer all or substantially all of Realogy Group's and its material subsidiaries' assets;
• transfer or sell assets, including capital stock of subsidiaries; and
• prepay, redeem or repurchase subordinated indebtedness.
As a result of the covenants to which we remain subject, we are limited in the manner in which we conduct our business and we may be unable to engagein favorable business activities or finance future operations or capital needs. In addition, the Senior Secured Credit Facility and Term Loan A Facility requireus to maintain a senior secured leverage ratio.
The senior secured leverage ratio, not to exceed 4.75 to 1.00, is tested quarterly. In this report, the Company refers to the term "Adjusted (Covenant)EBITDA" to mean EBITDA as so defined for purposes of determining compliance with the senior secured leverage covenant. The senior secured leverageratio measured at any applicable quarter end is Realogy Group's total senior secured net debt divided by the trailing twelve month Adjusted (Covenant)EBITDA. Total senior secured net debt does not include unsecured indebtedness, including the Unsecured Notes, as well as the securitization obligations.
See Note 5, "Short and Long-Term Debt—Senior Secured Credit Facility" and "Short and Long-Term Debt—Term Loan A Facility" in the condensedconsolidated financial statements for additional information.
Non-GAAP Financial Measures
The SEC has adopted rules to regulate the use in filings with the SEC and in public disclosures of "non-GAAP financial measures," such as EBITDA,Operating EBITDA and Adjusted (Covenant) EBITDA and the ratios related thereto. These measures are derived on the basis of methodologies other than inaccordance with GAAP.
EBITDA is defined by us as net income (loss) before depreciation and amortization, interest expense, net (other than relocation services interest forsecuritization assets and securitization obligations) and income taxes and is our primary non-GAAP measure.
Operating EBITDA is defined by us as EBITDA before restructuring, early extinguishment of debt and legacy items and is used as a supplementaryfinancial measure. Operating EBITDA calculated for a twelve-month period is presented because the Company believes these items do not directly affect theoperating results of the Company and accordingly should be excluded in comparing operating results. Operating EBITDA does not include pro-formaadjustments for business optimization initiatives and acquisitions or non-cash adjustments such as stock-based compensation expense, used to calculateAdjusted (Covenant) EBITDA in the Senior Secured Credit Facility and the Term Loan A Facility senior secured leverage ratio.
Adjusted (Covenant) EBITDA calculated for a twelve-month period is presented to demonstrate our compliance with the senior secured leverage ratiocovenant in the Senior Secured Credit Facility and the Term Loan A Facility. Adjusted (Covenant) EBITDA calculated for a twelve-month periodcorresponds to the definition of "EBITDA," calculated on a "pro forma basis," used in the Senior Secured Credit Facility and the Term Loan A Facility tocalculate the senior secured leverage ratio. Adjusted (Covenant) EBITDA includes adjustments to EBITDA for restructuring costs, former parent legacy cost(benefit) items, net, loss on the early extinguishment of debt, non-cash charges and incremental securitization interest costs, as well as pro forma cost savingsfor restructuring initiatives, the pro forma effect of business optimization initiatives and the pro forma effect of acquisitions and new franchisees, in each casecalculated as of the beginning of the twelve-month period.
We present EBITDA, Operating EBITDA and Adjusted (Covenant) EBITDA because we believe EBITDA, Operating EBITDA and Adjusted (Covenant)EBITDA are useful as supplemental measures in evaluating the performance of our operating businesses and provide greater transparency into our results ofoperations. Our management, including our chief operating decision maker, uses EBITDA as a factor in evaluating the performance of our business.EBITDA, Operating EBITDA and Adjusted (Covenant) EBITDA should not be considered in isolation or as a substitute for net income or other statement ofoperations data prepared in accordance with GAAP.
We believe EBITDA facilitates company-to-company operating performance comparisons by backing out potential differences caused by variations incapital structures (affecting net interest expense), taxation, the age and book depreciation of facilities (affecting relative depreciation expense) and theamortization of intangibles, which may vary for different companies for reasons unrelated to operating performance. We further believe that EBITDA isfrequently used by securities
50
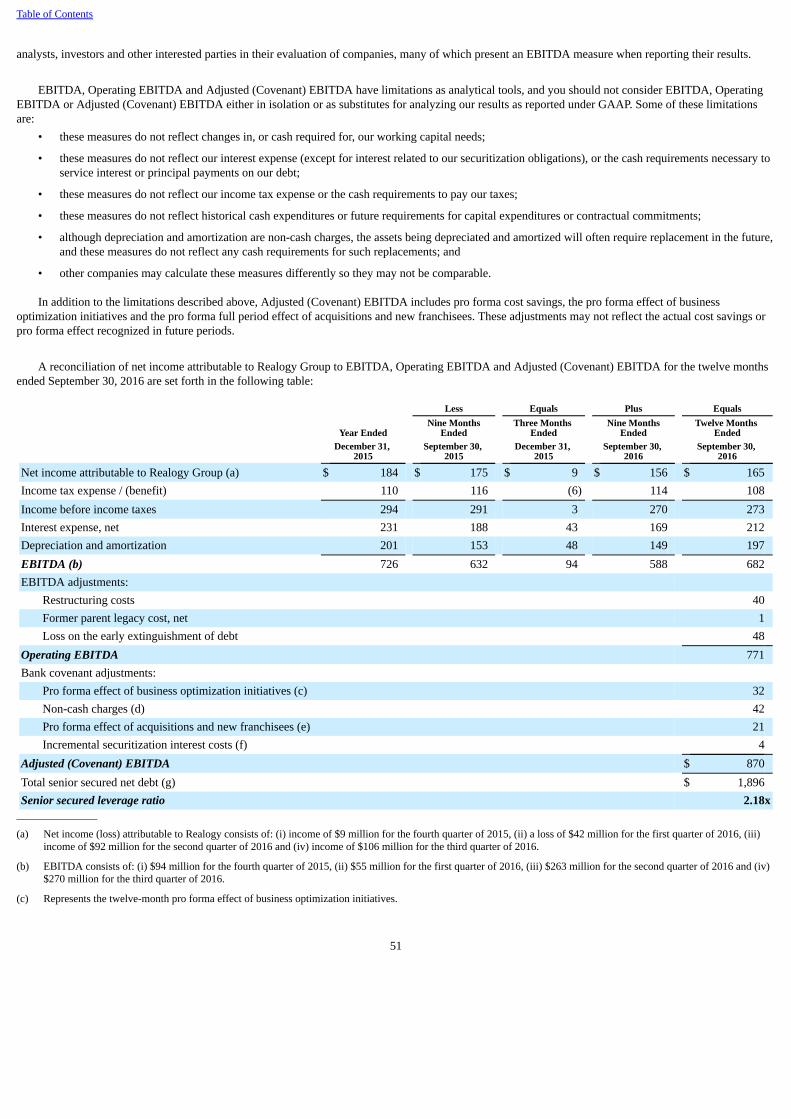
Table of Contents
analysts, investors and other interested parties in their evaluation of companies, many of which present an EBITDA measure when reporting their results.
EBITDA, Operating EBITDA and Adjusted (Covenant) EBITDA have limitations as analytical tools, and you should not consider EBITDA, OperatingEBITDA or Adjusted (Covenant) EBITDA either in isolation or as substitutes for analyzing our results as reported under GAAP. Some of these limitationsare:
• these measures do not reflect changes in, or cash required for, our working capital needs;
• these measures do not reflect our interest expense (except for interest related to our securitization obligations), or the cash requirements necessary toservice interest or principal payments on our debt;
• these measures do not reflect our income tax expense or the cash requirements to pay our taxes;
• these measures do not reflect historical cash expenditures or future requirements for capital expenditures or contractual commitments;
• although depreciation and amortization are non-cash charges, the assets being depreciated and amortized will often require replacement in the future,and these measures do not reflect any cash requirements for such replacements; and
• other companies may calculate these measures differently so they may not be comparable.
In addition to the limitations described above, Adjusted (Covenant) EBITDA includes pro forma cost savings, the pro forma effect of businessoptimization initiatives and the pro forma full period effect of acquisitions and new franchisees. These adjustments may not reflect the actual cost savings orpro forma effect recognized in future periods.
A reconciliation of net income attributable to Realogy Group to EBITDA, Operating EBITDA and Adjusted (Covenant) EBITDA for the twelve monthsended September 30, 2016 are set forth in the following table:
Less Equals Plus Equals
Year Ended
Nine MonthsEnded
Three Months Ended
Nine MonthsEnded
Twelve Months Ended
December 31,
2015September 30,
2015December 31,
2015September 30,
2016September 30,
2016
Net income attributable to Realogy Group (a) $ 184 $ 175 $ 9 $ 156 $ 165Income tax expense / (benefit) 110 116 (6) 114 108Income before income taxes 294 291 3 270 273Interest expense, net 231 188 43 169 212Depreciation and amortization 201 153 48 149 197EBITDA (b) 726 632 94 588 682EBITDA adjustments:
Restructuring costs 40Former parent legacy cost, net 1Loss on the early extinguishment of debt 48
Operating EBITDA 771Bank covenant adjustments:
Pro forma effect of business optimization initiatives (c) 32Non-cash charges (d) 42Pro forma effect of acquisitions and new franchisees (e) 21Incremental securitization interest costs (f) 4
Adjusted (Covenant) EBITDA $ 870Total senior secured net debt (g) $ 1,896Senior secured leverage ratio 2.18x
_______________
(a) Net income (loss) attributable to Realogy consists of: (i) income of $9 million for the fourth quarter of 2015, (ii) a loss of $42 million for the first quarter of 2016, (iii)income of $92 million for the second quarter of 2016 and (iv) income of $106 million for the third quarter of 2016.
(b) EBITDA consists of: (i) $94 million for the fourth quarter of 2015, (ii) $55 million for the first quarter of 2016, (iii) $263 million for the second quarter of 2016 and (iv)$270 million for the third quarter of 2016.
(c) Represents the twelve-month pro forma effect of business optimization initiatives.
51
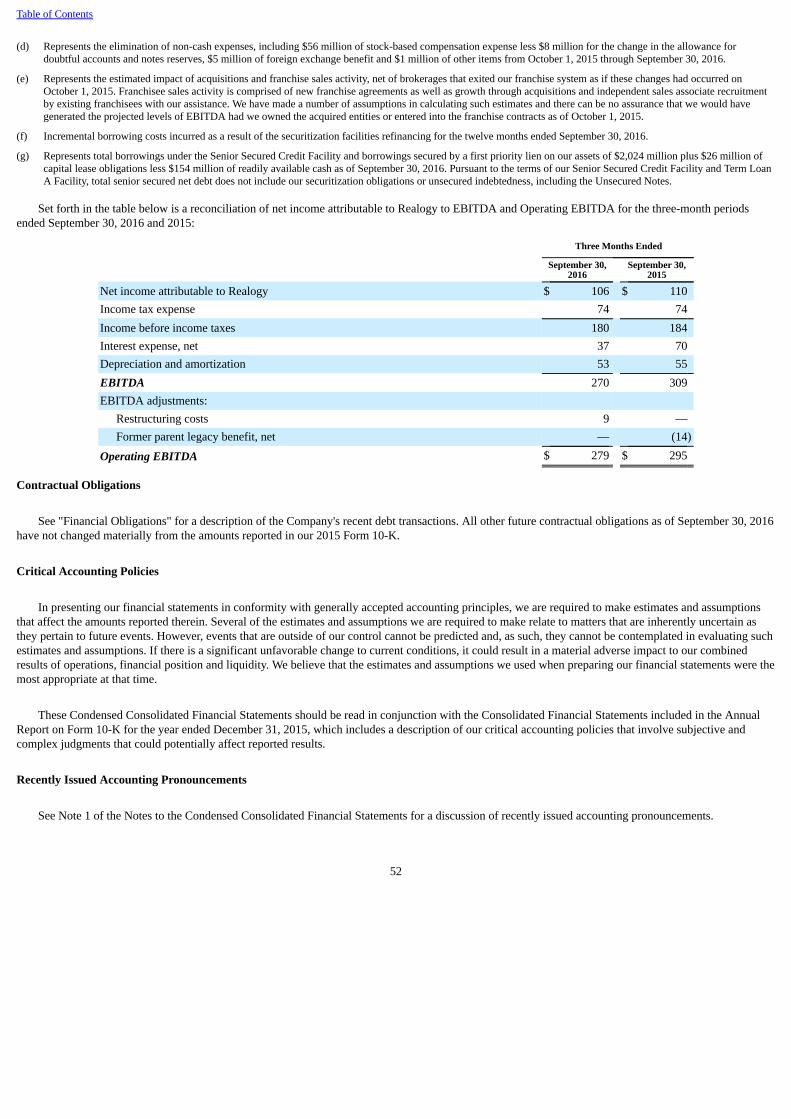
Table of Contents
(d) Represents the elimination of non-cash expenses, including $56 million of stock-based compensation expense less $8 million for the change in the allowance fordoubtful accounts and notes reserves, $5 million of foreign exchange benefit and $1 million of other items from October 1, 2015 through September 30, 2016.
(e) Represents the estimated impact of acquisitions and franchise sales activity, net of brokerages that exited our franchise system as if these changes had occurred onOctober 1, 2015. Franchisee sales activity is comprised of new franchise agreements as well as growth through acquisitions and independent sales associate recruitmentby existing franchisees with our assistance. We have made a number of assumptions in calculating such estimates and there can be no assurance that we would havegenerated the projected levels of EBITDA had we owned the acquired entities or entered into the franchise contracts as of October 1, 2015.
(f) Incremental borrowing costs incurred as a result of the securitization facilities refinancing for the twelve months ended September 30, 2016.
(g) Represents total borrowings under the Senior Secured Credit Facility and borrowings secured by a first priority lien on our assets of $2,024 million plus $26 million ofcapital lease obligations less $154 million of readily available cash as of September 30, 2016. Pursuant to the terms of our Senior Secured Credit Facility and Term LoanA Facility, total senior secured net debt does not include our securitization obligations or unsecured indebtedness, including the Unsecured Notes.
Set forth in the table below is a reconciliation of net income attributable to Realogy to EBITDA and Operating EBITDA for the three-month periodsended September 30, 2016 and 2015:
Three Months Ended
September 30,
2016 September 30,
2015
Net income attributable to Realogy $ 106 $ 110Income tax expense 74 74Income before income taxes 180 184Interest expense, net 37 70Depreciation and amortization 53 55EBITDA 270 309EBITDA adjustments:
Restructuring costs 9 —Former parent legacy benefit, net — (14)
Operating EBITDA $ 279 $ 295
Contractual Obligations
See "Financial Obligations" for a description of the Company's recent debt transactions. All other future contractual obligations as of September 30, 2016have not changed materially from the amounts reported in our 2015 Form 10-K.
Critical Accounting Policies
In presenting our financial statements in conformity with generally accepted accounting principles, we are required to make estimates and assumptionsthat affect the amounts reported therein. Several of the estimates and assumptions we are required to make relate to matters that are inherently uncertain asthey pertain to future events. However, events that are outside of our control cannot be predicted and, as such, they cannot be contemplated in evaluating suchestimates and assumptions. If there is a significant unfavorable change to current conditions, it could result in a material adverse impact to our combinedresults of operations, financial position and liquidity. We believe that the estimates and assumptions we used when preparing our financial statements were themost appropriate at that time.
These Condensed Consolidated Financial Statements should be read in conjunction with the Consolidated Financial Statements included in the AnnualReport on Form 10-K for the year ended December 31, 2015, which includes a description of our critical accounting policies that involve subjective andcomplex judgments that could potentially affect reported results.
Recently Issued Accounting Pronouncements
See Note 1 of the Notes to the Condensed Consolidated Financial Statements for a discussion of recently issued accounting pronouncements.
52
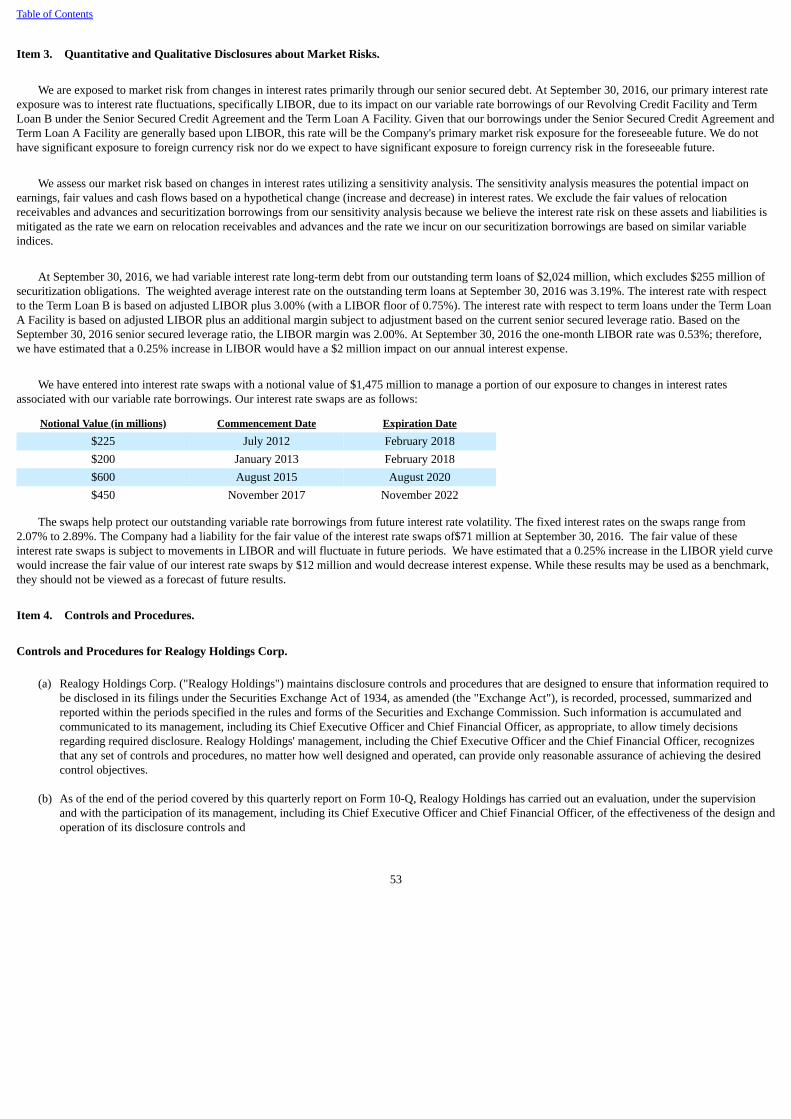
Table of Contents
Item 3. Quantitative and Qualitative Disclosures about Market Risks.
We are exposed to market risk from changes in interest rates primarily through our senior secured debt. At September 30, 2016, our primary interest rateexposure was to interest rate fluctuations, specifically LIBOR, due to its impact on our variable rate borrowings of our Revolving Credit Facility and TermLoan B under the Senior Secured Credit Agreement and the Term Loan A Facility. Given that our borrowings under the Senior Secured Credit Agreement andTerm Loan A Facility are generally based upon LIBOR, this rate will be the Company's primary market risk exposure for the foreseeable future. We do nothave significant exposure to foreign currency risk nor do we expect to have significant exposure to foreign currency risk in the foreseeable future.
We assess our market risk based on changes in interest rates utilizing a sensitivity analysis. The sensitivity analysis measures the potential impact onearnings, fair values and cash flows based on a hypothetical change (increase and decrease) in interest rates. We exclude the fair values of relocationreceivables and advances and securitization borrowings from our sensitivity analysis because we believe the interest rate risk on these assets and liabilities ismitigated as the rate we earn on relocation receivables and advances and the rate we incur on our securitization borrowings are based on similar variableindices.
At September 30, 2016, we had variable interest rate long-term debt from our outstanding term loans of $2,024 million, which excludes $255 million ofsecuritization obligations. The weighted average interest rate on the outstanding term loans at September 30, 2016 was 3.19%. The interest rate with respectto the Term Loan B is based on adjusted LIBOR plus 3.00% (with a LIBOR floor of 0.75%). The interest rate with respect to term loans under the Term LoanA Facility is based on adjusted LIBOR plus an additional margin subject to adjustment based on the current senior secured leverage ratio. Based on theSeptember 30, 2016 senior secured leverage ratio, the LIBOR margin was 2.00%. At September 30, 2016 the one-month LIBOR rate was 0.53%; therefore,we have estimated that a 0.25% increase in LIBOR would have a $2 million impact on our annual interest expense.
We have entered into interest rate swaps with a notional value of $1,475 million to manage a portion of our exposure to changes in interest ratesassociated with our variable rate borrowings. Our interest rate swaps are as follows:
Notional Value (in millions) Commencement Date Expiration Date
$225 July 2012 February 2018$200 January 2013 February 2018$600 August 2015 August 2020$450 November 2017 November 2022
The swaps help protect our outstanding variable rate borrowings from future interest rate volatility. The fixed interest rates on the swaps range from2.07% to 2.89%. The Company had a liability for the fair value of the interest rate swaps of$71 million at September 30, 2016. The fair value of theseinterest rate swaps is subject to movements in LIBOR and will fluctuate in future periods. We have estimated that a 0.25% increase in the LIBOR yield curvewould increase the fair value of our interest rate swaps by $12 million and would decrease interest expense. While these results may be used as a benchmark,they should not be viewed as a forecast of future results.
Item 4. Controls and Procedures.
Controls and Procedures for Realogy Holdings Corp.
(a) Realogy Holdings Corp. ("Realogy Holdings") maintains disclosure controls and procedures that are designed to ensure that information required tobe disclosed in its filings under the Securities Exchange Act of 1934, as amended (the "Exchange Act"), is recorded, processed, summarized andreported within the periods specified in the rules and forms of the Securities and Exchange Commission. Such information is accumulated andcommunicated to its management, including its Chief Executive Officer and Chief Financial Officer, as appropriate, to allow timely decisionsregarding required disclosure. Realogy Holdings' management, including the Chief Executive Officer and the Chief Financial Officer, recognizesthat any set of controls and procedures, no matter how well designed and operated, can provide only reasonable assurance of achieving the desiredcontrol objectives.
(b) As of the end of the period covered by this quarterly report on Form 10-Q, Realogy Holdings has carried out an evaluation, under the supervisionand with the participation of its management, including its Chief Executive Officer and Chief Financial Officer, of the effectiveness of the design andoperation of its disclosure controls and
53
Table of Contents
procedures. Based upon that evaluation, the Chief Executive Officer and Chief Financial Officer concluded that Realogy Holdings' disclosurecontrols and procedures are effective at the "reasonable assurance" level.
(c) There has not been any change in Realogy Holdings' internal control over financial reporting during the period covered by this quarterly report onForm 10-Q that has materially affected, or is reasonably likely to materially affect, its internal control over financial reporting.
Controls and Procedures for Realogy Group LLC
(a) Realogy Group LLC ("Realogy Group") maintains disclosure controls and procedures that are designed to ensure that information required to bedisclosed in its filings under the Securities Exchange Act of 1934, as amended (the "Exchange Act"), is recorded, processed, summarized andreported within the periods specified in the rules and forms of the Securities and Exchange Commission. Such information is accumulated andcommunicated to its management, including its Chief Executive Officer and Chief Financial Officer, as appropriate, to allow timely decisionsregarding required disclosure. Realogy Group's management, including the Chief Executive Officer and the Chief Financial Officer, recognizes thatany set of controls and procedures, no matter how well designed and operated, can provide only reasonable assurance of achieving the desiredcontrol objectives.
(b) As of the end of the period covered by this quarterly report on Form 10-Q, Realogy Group has carried out an evaluation, under the supervision andwith the participation of its management, including its Chief Executive Officer and Chief Financial Officer, of the effectiveness of the design andoperation of its disclosure controls and procedures. Based upon that evaluation, the Chief Executive Officer and Chief Financial Officer concludedthat Realogy Group's disclosure controls and procedures are effective at the "reasonable assurance" level.
(c) There has not been any change in Realogy Group's internal control over financial reporting during the period covered by this quarterly report onForm 10-Q that has materially affected, or is reasonably likely to materially affect, its internal control over financial reporting.
Other Financial Information
The Condensed Consolidated Financial Statements as of September 30, 2016 and for the three and nine-month periods ended September 30, 2016 and2015 have been reviewed by PricewaterhouseCoopers LLP, an independent registered public accounting firm. Their reports, dated November 4, 2016, areincluded on pages 4 and 5. The reports of PricewaterhouseCoopers LLP state that they did not audit and they do not express an opinion on that unauditedfinancial information. Accordingly, the degree of reliance on their report on such information should be restricted in light of the limited nature of the reviewprocedures applied. PricewaterhouseCoopers LLP is not subject to the liability provisions of Section 11 of the Securities Act of 1933 (the "Act") for theirreport on the unaudited financial information because that report is not a "report" or a "part" of the registration statement prepared or certified byPricewaterhouseCoopers LLP within the meaning of Sections 7 and 11 of the Act.
54
Table of Contents
PART II - OTHER INFORMATION
Item 1. Legal Proceedings.
Legal—Real Estate Business
Strader, et al. and Hall v. PHH Corporation, et al. (U.S. District Court for the Central District of California). This is a purported class action brought byfour California residents against 15 defendants, including Realogy and certain of its subsidiaries, PHH Corporation and PHH Home Loans, LLC (a jointventure between Realogy and PHH), alleging violations of Section 8(a) of RESPA. Plaintiffs seek to represent two subclasses comprised of all persons in theUnited States who, since January 31, 2005, (1) obtained a RESPA-covered mortgage loan from either (a) PHH Home Loans, LLC or one of its subsidiaries, or(b) one of the mortgage services managed by PHH Corporation for other lenders, and (2) paid a fee for title insurance or settlement services to TRG or one ofits subsidiaries. Plaintiffs allege, among other things, that PHH Home Loans, LLC operates in violation of RESPA and that the other defendants violateRESPA by referring business to one another under agreements or arrangements. Plaintiffs seek treble damages and an award of attorneys’ fees, costs anddisbursements. On February 5, 2016, the defendants filed a motion to dismiss the case claiming that not only do the claims lack merit, but they are time-barred under RESPA's one-year statute of limitations. On April 5, 2016, the court granted defendants' motion to dismiss with leave for the plaintiffs to amendtheir complaint. Plaintiffs filed a second amended complaint on April 21, 2016, and a third amended complaint on May 12, 2016. Defendants filed a motionto dismiss the third amended complaint. The Court denied the motion on October 6, 2016, without prejudice to defendants’ ability to move for summaryjudgment after discovery. The parties are proceeding with discovery.
The case raises significant claims and rests in part on certain interpretations of RESPA by the Consumer Financial Protection Bureau ("CFPB"), whichare the subject of pending industry litigation in various jurisdictions. As with all class action litigation, the case is inherently complex and subject to manyuncertainties. We believe that we and the joint venture have complied with RESPA, the regulations promulgated thereunder and existing regulatory guidance.There can be no assurance, however, that if the action continues and a large class is subsequently certified, the plaintiffs will not seek a substantial damageaward, penalties and other remedies. Given the early stage of this case and the novel claims and issues presented, we cannot estimate a range of reasonablypotential losses for this litigation. The Company will vigorously defend this action.
The Company is involved in certain other claims and legal actions arising in the ordinary course of our business. Such litigation and other proceedingsmay include, but are not limited to, actions relating to intellectual property, commercial arrangements, franchising arrangements, actions against our titlecompany alleging it knew or should have known that others were committing mortgage fraud, brokerage disputes like the failure to disclose hidden defects inthe property such as mold, other brokerage claims associated with listing information and property history, vicarious liability based upon conduct ofindividuals or entities outside of our control, including franchisees and independent sales associates, antitrust and anti-competition claims, general fraudclaims, employment law claims, including claims challenging the classification of our sales associates as independent contractors, wage and hourclassification claims, and claims alleging violations of RESPA or state consumer fraud statutes. While the results of such claims and legal actions cannot bepredicted with certainty, we do not believe based on information currently available to us that the final outcome of current proceedings against the Companywill have a material adverse effect on our consolidated financial position, results of operations or cash flows.
Legal—Cendant Corporate Litigation
Pursuant to the Separation and Distribution Agreement dated as of July 27, 2006 among Cendant, Realogy Group, Wyndham Worldwide and Travelport,each of Realogy Group, Wyndham Worldwide and Travelport have assumed certain contingent and other corporate liabilities (and related costs and expenses),which are primarily related to each of their respective businesses. In addition, Realogy Group has assumed 62.5% and Wyndham Worldwide has assumed37.5% of certain contingent and other corporate liabilities (and related costs and expenses) of Cendant or its subsidiaries, which are not primarily related toany of the respective businesses of Realogy Group, Wyndham Worldwide, Travelport and/or Cendant’s vehicle rental operations, in each case incurred orallegedly incurred on or prior to the date of the separation of Travelport from Cendant.
* * *
The Company believes that it has adequately accrued for legal matters as appropriate. The Company records litigation accruals for legal matters whichare both probable and estimable.
55
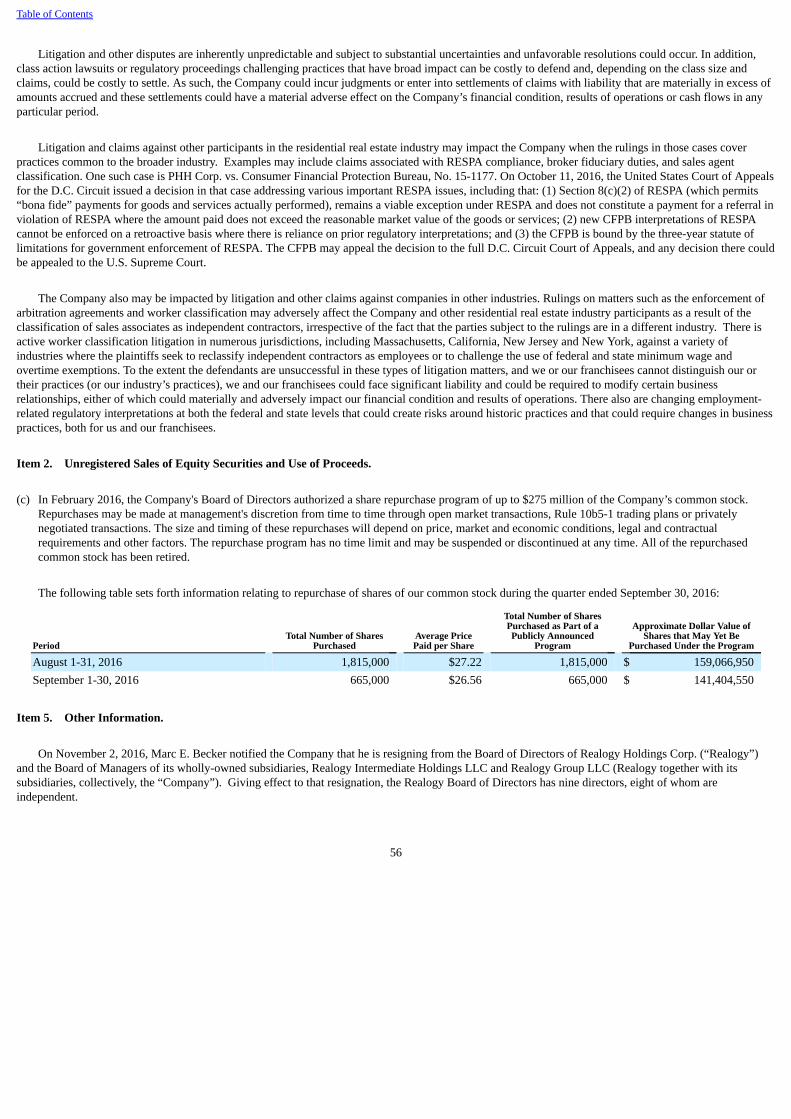
Table of Contents
Litigation and other disputes are inherently unpredictable and subject to substantial uncertainties and unfavorable resolutions could occur. In addition,class action lawsuits or regulatory proceedings challenging practices that have broad impact can be costly to defend and, depending on the class size andclaims, could be costly to settle. As such, the Company could incur judgments or enter into settlements of claims with liability that are materially in excess ofamounts accrued and these settlements could have a material adverse effect on the Company’s financial condition, results of operations or cash flows in anyparticular period.
Litigation and claims against other participants in the residential real estate industry may impact the Company when the rulings in those cases coverpractices common to the broader industry. Examples may include claims associated with RESPA compliance, broker fiduciary duties, and sales agentclassification. One such case is PHH Corp. vs. Consumer Financial Protection Bureau, No. 15-1177. On October 11, 2016, the United States Court of Appealsfor the D.C. Circuit issued a decision in that case addressing various important RESPA issues, including that: (1) Section 8(c)(2) of RESPA (which permits“bona fide” payments for goods and services actually performed), remains a viable exception under RESPA and does not constitute a payment for a referral inviolation of RESPA where the amount paid does not exceed the reasonable market value of the goods or services; (2) new CFPB interpretations of RESPAcannot be enforced on a retroactive basis where there is reliance on prior regulatory interpretations; and (3) the CFPB is bound by the three-year statute oflimitations for government enforcement of RESPA. The CFPB may appeal the decision to the full D.C. Circuit Court of Appeals, and any decision there couldbe appealed to the U.S. Supreme Court.
The Company also may be impacted by litigation and other claims against companies in other industries. Rulings on matters such as the enforcement ofarbitration agreements and worker classification may adversely affect the Company and other residential real estate industry participants as a result of theclassification of sales associates as independent contractors, irrespective of the fact that the parties subject to the rulings are in a different industry. There isactive worker classification litigation in numerous jurisdictions, including Massachusetts, California, New Jersey and New York, against a variety ofindustries where the plaintiffs seek to reclassify independent contractors as employees or to challenge the use of federal and state minimum wage andovertime exemptions. To the extent the defendants are unsuccessful in these types of litigation matters, and we or our franchisees cannot distinguish our ortheir practices (or our industry’s practices), we and our franchisees could face significant liability and could be required to modify certain businessrelationships, either of which could materially and adversely impact our financial condition and results of operations. There also are changing employment-related regulatory interpretations at both the federal and state levels that could create risks around historic practices and that could require changes in businesspractices, both for us and our franchisees.
Item 2. Unregistered Sales of Equity Securities and Use of Proceeds.
(c) In February 2016, the Company's Board of Directors authorized a share repurchase program of up to $275 million of the Company’s common stock.Repurchases may be made at management's discretion from time to time through open market transactions, Rule 10b5-1 trading plans or privatelynegotiated transactions. The size and timing of these repurchases will depend on price, market and economic conditions, legal and contractualrequirements and other factors. The repurchase program has no time limit and may be suspended or discontinued at any time. All of the repurchasedcommon stock has been retired.
The following table sets forth information relating to repurchase of shares of our common stock during the quarter ended September 30, 2016:
Period Total Number of Shares
Purchased Average PricePaid per Share
Total Number of SharesPurchased as Part of aPublicly Announced
Program Approximate Dollar Value of
Shares that May Yet BePurchased Under the Program
August 1-31, 2016 1,815,000 $27.22 1,815,000 $ 159,066,950September 1-30, 2016 665,000 $26.56 665,000 $ 141,404,550
Item 5. Other Information.
On November 2, 2016, Marc E. Becker notified the Company that he is resigning from the Board of Directors of Realogy Holdings Corp. (“Realogy”)and the Board of Managers of its wholly-owned subsidiaries, Realogy Intermediate Holdings LLC and Realogy Group LLC (Realogy together with itssubsidiaries, collectively, the “Company”). Giving effect to that resignation, the Realogy Board of Directors has nine directors, eight of whom areindependent.
56

Table of Contents
Mr. Becker, a partner of Apollo Management LP, served as a member of the Board of Directors of Realogy for nearly 10 years, which commenced uponApollo’s acquisition of the Company in April 2007 and continued through the sale of Apollo's equity interest in the Company in 2013. To provide continuityto the Board following the Apollo sale, Mr. Becker agreed to continue to serve on the Board while it appointed four new independent directors, three of whomjoined the Board this year. With that transition having been made, Mr. Becker tendered his resignation, effective immediately. His resignation was not relatedto any disagreement with the Company on any matter relating to the Company’s operations, policies or practices.
Item 6. Exhibits.
See Exhibit Index.
57
Table of Contents
SIGNATURES
Pursuant to the requirements of the Securities Exchange Act of 1934, the registrants have duly caused this report to be signed on its behalf by theundersigned thereunto duly authorized.
REALOGY HOLDINGS CORP.and
REALOGY GROUP LLC(Registrants)
Date: November 4, 2016/S/ ANTHONY E. HULL Anthony E. HullExecutive Vice President andChief Financial Officer
Date: November 4, 2016 /S/ TIMOTHY B. GUSTAVSON Timothy B. GustavsonSenior Vice President,Chief Accounting Officer andController
58
Table of Contents
EXHIBIT INDEX
Exhibit Description 10.1 First Amendment, dated as of July 20, 2016, to the Term Loan Agreement, dated as of October 23, 2015, among Realogy Intermediate Holdings
LLC, Realogy Group LLC, the several lenders from time to time parties thereto, JPMorgan Chase Bank, N.A., as administrative agent and theother agents parties thereto (Incorporated by reference to Exhibit 10.1 to the Registrants' Current Report on Form 8-K filed with the Securities andExchange Commission on July 22, 2016).
10.2 Third Amendment, dated as of July 20, 2016, to the Amended and Restated Credit Agreement, dated as of March 5, 2013, among RealogyIntermediate Holdings LLC, Realogy Group LLC, the several lenders from time to time parties thereto, JPMorgan Chase Bank, N.A., asadministrative agent and the other agents parties thereto (Incorporated by reference to Exhibit 10.2 to the Registrants' Current Report on Form 8-Kfiled with the Securities and Exchange Commission on July 22, 2016).
15.1* Letter Regarding Unaudited Interim Financial Statements.
31.1* Certification of the Chief Executive Officer of Realogy Holdings Corp. pursuant to Rules 13(a)-14(a) and 15(d)-14(a) promulgated under theSecurities Exchange Act of 1934, as amended.
31.2* Certification of the Chief Financial Officer of Realogy Holdings Corp. pursuant to Rules 13(a)-14(a) and 15(d)-14(a) promulgated under theSecurities Exchange Act of 1934, as amended.
31.3* Certification of the Chief Executive Officer of Realogy Group LLC pursuant to Rules 13(a)-14(a) and 15(d)-14(a) promulgated under theSecurities Exchange Act of 1934, as amended.
31.4* Certification of the Chief Financial Officer of Realogy Group LLC pursuant to Rules 13(a)-14(a) and 15(d)-14(a) promulgated under the SecuritiesExchange Act of 1934, as amended.
32.1* Certification for Realogy Holdings Corp. pursuant to 18 U.S.C. Section 1350, as adopted pursuant to Section 906 of the Sarbanes-Oxley Act of2002.
32.2* Certification for Realogy Group LLC pursuant to 18 U.S.C. Section 1350, as adopted pursuant to Section 906 of the Sarbanes-Oxley Act of 2002.
101.INS ^ XBRL Instance Document.
101.SCH ^ XBRL Taxonomy Extension Schema Document.
101.CAL^ XBRL Taxonomy Extension Calculation Linkbase Document.
101.DEF ^ XBRL Taxonomy Extension Definition Linkbase Document.
101.LAB ^ XBRL Taxonomy Extension Label Linkbase Document.
101.PRE ^ XBRL Taxonomy Extension Presentation Linkbase Document.______________
* Filed herewith.
^ Furnished electronically with this report.
59

Exhibit 15.1
November 4, 2016
Securities and Exchange Commission100 F Street, N.E.Washington, DC 20549
Commissioners:
We are aware that our report dated November 4, 2016 on our review of interim financial information of Realogy Holdings Corp. and its subsidiaries (the“Company”) for the three and nine-month periods ended September 30, 2016 and September 30, 2015 and included in the Company's quarterly report onForm 10-Q for the quarter ended September 30, 2016 is incorporated by reference in its Registration Statements on Form S-8 dated October 12, 2012 (No.333 - 184383) and May 5, 2016 (No. 333 - 211160), respectively and Form S-3 dated April 9, 2013 (No. 333 - 187816).
Very truly yours,
/s/ PricewaterhouseCoopers LLP
Exhibit 31.1
CERTIFICATION
I, Richard A. Smith, certify that:
1. I have reviewed this quarterly report on Form 10-Q of Realogy Holdings Corp.;
2. Based on my knowledge, this report does not contain any untrue statement of a material fact or omit to state a material fact necessary to make thestatements made, in light of the circumstances under which such statements were made, not misleading with respect to the period covered by thisreport;
3. Based on my knowledge, the financial statements, and other financial information included in this report, fairly present in all material respects thefinancial condition, results of operations and cash flows of the registrant as of, and for, the periods presented in this report;
4. The registrant’s other certifying officer and I are responsible for establishing and maintaining disclosure controls and procedures (as defined inExchange Act Rules 13a-15(e) and 15d-15(e)) and internal control over financial reporting (as defined in Exchange Act Rules 13a-15(f) and 15d-15(f)) for the registrant and have:
a) Designed such disclosure controls and procedures, or caused such disclosure controls and procedures to be designed under our supervision,to ensure that material information relating to the registrant, including its consolidated subsidiaries, is made known to us by others withinthose entities, particularly during the period in which this report is being prepared;
b) Designed such internal control over financial reporting, or caused such internal control over financial reporting to be designed under oursupervision, to provide reasonable assurance regarding the reliability of financial reporting and the preparation of financial statements forexternal purposes in accordance with generally accepted accounting principles;
c) Evaluated the effectiveness of the registrant’s disclosure controls and procedures and presented in this report our conclusions about theeffectiveness of the disclosure controls and procedures, as of the end of the period covered by this report based on such evaluation; and
d) Disclosed in this report any change in the registrant’s internal control over financial reporting that occurred during the registrant’s mostrecent fiscal quarter (the registrant’s fourth fiscal quarter in the case of an annual report) that has materially affected, or is reasonably likelyto materially affect, the registrant’s internal control over financial reporting; and
5. The registrant’s other certifying officer and I have disclosed, based on our most recent evaluation of internal control over financial reporting, to theregistrant’s auditors and the audit committee of the registrant’s Board of Directors (or persons performing the equivalent functions):
a) All significant deficiencies and material weaknesses in the design or operation of internal control over financial reporting which arereasonably likely to adversely affect the registrant’s ability to record, process, summarize and report financial information; and
b) Any fraud, whether or not material, that involves management or other employees who have a significant role in the registrant’s internal
control over financial reporting.
Date: November 4, 2016
/s/ RICHARD A. SMITH CHIEF EXECUTIVE OFFICER
Exhibit 31.2
CERTIFICATION
I, Anthony E. Hull, certify that:
1. I have reviewed this quarterly report on Form 10-Q of Realogy Holdings Corp.;
2. Based on my knowledge, this report does not contain any untrue statement of a material fact or omit to state a material fact necessary to make thestatements made, in light of the circumstances under which such statements were made, not misleading with respect to the period covered by thisreport;
3. Based on my knowledge, the financial statements, and other financial information included in this report, fairly present in all material respects thefinancial condition, results of operations and cash flows of the registrant as of, and for, the periods presented in this report;
4. The registrant’s other certifying officer and I are responsible for establishing and maintaining disclosure controls and procedures (as defined inExchange Act Rules 13a-15(e) and 15d-15(e)) and internal control over financial reporting (as defined in Exchange Act Rules 13a-15(f) and 15d-15(f)) for the registrant and have:
a) Designed such disclosure controls and procedures, or caused such disclosure controls and procedures to be designed under our supervision,to ensure that material information relating to the registrant, including its consolidated subsidiaries, is made known to us by others withinthose entities, particularly during the period in which this report is being prepared;
b) Designed such internal control over financial reporting, or caused such internal control over financial reporting to be designed under oursupervision, to provide reasonable assurance regarding the reliability of financial reporting and the preparation of financial statements forexternal purposes in accordance with generally accepted accounting principles;
c) Evaluated the effectiveness of the registrant’s disclosure controls and procedures and presented in this report our conclusions about theeffectiveness of the disclosure controls and procedures, as of the end of the period covered by this report based on such evaluation; and
d) Disclosed in this report any change in the registrant’s internal control over financial reporting that occurred during the registrant’s mostrecent fiscal quarter (the registrant’s fourth fiscal quarter in the case of an annual report) that has materially affected, or is reasonably likelyto materially affect, the registrant’s internal control over financial reporting; and
5. The registrant’s other certifying officer and I have disclosed, based on our most recent evaluation of internal control over financial reporting, to theregistrant’s auditors and the audit committee of the registrant’s Board of Directors (or persons performing the equivalent functions):
a) All significant deficiencies and material weaknesses in the design or operation of internal control over financial reporting which arereasonably likely to adversely affect the registrant’s ability to record, process, summarize and report financial information; and
b) Any fraud, whether or not material, that involves management or other employees who have a significant role in the registrant’s internalcontrol over financial reporting.
Date: November 4, 2016
/s/ ANTHONY E. HULL CHIEF FINANCIAL OFFICER

Exhibit 31.3
CERTIFICATION
I, Richard A. Smith, certify that:
1. I have reviewed this quarterly report on Form 10-Q of Realogy Group LLC;
2. Based on my knowledge, this report does not contain any untrue statement of a material fact or omit to state a material fact necessary to make thestatements made, in light of the circumstances under which such statements were made, not misleading with respect to the period covered by thisreport;
3. Based on my knowledge, the financial statements, and other financial information included in this report, fairly present in all material respects thefinancial condition, results of operations and cash flows of the registrant as of, and for, the periods presented in this report;
4. The registrant’s other certifying officer and I are responsible for establishing and maintaining disclosure controls and procedures (as defined inExchange Act Rules 13a-15(e) and 15d-15(e)) and internal control over financial reporting (as defined in Exchange Act Rules 13a-15(f) and 15d-15(f)) for the registrant and have:
a) Designed such disclosure controls and procedures, or caused such disclosure controls and procedures to be designed under our supervision,to ensure that material information relating to the registrant, including its consolidated subsidiaries, is made known to us by others withinthose entities, particularly during the period in which this report is being prepared;
b) Designed such internal control over financial reporting, or caused such internal control over financial reporting to be designed under our
supervision, to provide reasonable assurance regarding the reliability of financial reporting and the preparation of financial statements forexternal purposes in accordance with generally accepted accounting principles;
c) Evaluated the effectiveness of the registrant’s disclosure controls and procedures and presented in this report our conclusions about theeffectiveness of the disclosure controls and procedures, as of the end of the period covered by this report based on such evaluation; and
d) Disclosed in this report any change in the registrant’s internal control over financial reporting that occurred during the registrant’s mostrecent fiscal quarter (the registrant’s fourth fiscal quarter in the case of an annual report) that has materially affected, or is reasonably likelyto materially affect, the registrant’s internal control over financial reporting; and
5. The registrant’s other certifying officer and I have disclosed, based on our most recent evaluation of internal control over financial reporting, to theregistrant’s auditors and the audit committee of the registrant’s Board of Directors (or persons performing the equivalent functions):
a) All significant deficiencies and material weaknesses in the design or operation of internal control over financial reporting which arereasonably likely to adversely affect the registrant’s ability to record, process, summarize and report financial information; and
b) Any fraud, whether or not material, that involves management or other employees who have a significant role in the registrant’s internal
control over financial reporting.
Date: November 4, 2016
/s/ RICHARD A. SMITH CHIEF EXECUTIVE OFFICER
Exhibit 31.4
CERTIFICATION
I, Anthony E. Hull, certify that:
1. I have reviewed this quarterly report on Form 10-Q of Realogy Group LLC;
2. Based on my knowledge, this report does not contain any untrue statement of a material fact or omit to state a material fact necessary to make thestatements made, in light of the circumstances under which such statements were made, not misleading with respect to the period covered by thisreport;
3. Based on my knowledge, the financial statements, and other financial information included in this report, fairly present in all material respects thefinancial condition, results of operations and cash flows of the registrant as of, and for, the periods presented in this report;
4. The registrant’s other certifying officer and I are responsible for establishing and maintaining disclosure controls and procedures (as defined inExchange Act Rules 13a-15(e) and 15d-15(e)) and internal control over financial reporting (as defined in Exchange Act Rules 13a-15(f) and 15d-15(f)) for the registrant and have:
a) Designed such disclosure controls and procedures, or caused such disclosure controls and procedures to be designed under our supervision,to ensure that material information relating to the registrant, including its consolidated subsidiaries, is made known to us by others withinthose entities, particularly during the period in which this report is being prepared;
b) Designed such internal control over financial reporting, or caused such internal control over financial reporting to be designed under oursupervision, to provide reasonable assurance regarding the reliability of financial reporting and the preparation of financial statements forexternal purposes in accordance with generally accepted accounting principles;
c) Evaluated the effectiveness of the registrant’s disclosure controls and procedures and presented in this report our conclusions about theeffectiveness of the disclosure controls and procedures, as of the end of the period covered by this report based on such evaluation; and
d) Disclosed in this report any change in the registrant’s internal control over financial reporting that occurred during the registrant’s mostrecent fiscal quarter (the registrant’s fourth fiscal quarter in the case of an annual report) that has materially affected, or is reasonably likelyto materially affect, the registrant’s internal control over financial reporting; and
5. The registrant’s other certifying officer and I have disclosed, based on our most recent evaluation of internal control over financial reporting, to theregistrant’s auditors and the audit committee of the registrant’s Board of Directors (or persons performing the equivalent functions):
a) All significant deficiencies and material weaknesses in the design or operation of internal control over financial reporting which arereasonably likely to adversely affect the registrant’s ability to record, process, summarize and report financial information; and
b) Any fraud, whether or not material, that involves management or other employees who have a significant role in the registrant’s internalcontrol over financial reporting.
Date: November 4, 2016
/s/ ANTHONY E. HULL CHIEF FINANCIAL OFFICER

Exhibit 32.1CERTIFICATION OF CEO AND CFO PURSUANT TO
18 U.S.C. SECTION 1350,AS ADOPTED PURSUANT TO
SECTION 906 OF THE SARBANES-OXLEY ACT OF 2002
In connection with the Quarterly Report of Realogy Holdings Corp. (the “Company”) on Form 10-Q for the period ended September 30, 2016, as filed withthe Securities and Exchange Commission on the date hereof (the “Report”), Richard A. Smith, as Chief Executive Officer of the Company, and Anthony E.Hull, as Chief Financial Officer of the Company, each hereby certifies, pursuant to 18 U.S.C. Section 1350, as adopted pursuant to Section 906 of theSarbanes-Oxley Act of 2002, that, to the best of his knowledge:
(1) The Report fully complies with the requirements of Section 13(a) or 15(d) of the Securities Exchange Act of 1934; and (2) The information contained in the Report fairly presents, in all material respects, the financial condition and results of operations of the
Company.
This certification accompanies the Report pursuant to Section 906 of the Sarbanes-Oxley Act of 2002 and shall not, except to the extent required by theSarbanes-Oxley Act of 2002 be deemed filed by the Company for purposes of Section 18 of the Securities Exchange Act of 1934, as amended.
/S/ RICHARD A. SMITH RICHARD A. SMITHCHIEF EXECUTIVE OFFICERNovember 4, 2016
/S/ ANTHONY E. HULL ANTHONY E. HULLEXECUTIVE VICE PRESIDENT ANDCHIEF FINANCIAL OFFICERNovember 4, 2016

Exhibit 32.2CERTIFICATION OF CEO AND CFO PURSUANT TO
18 U.S.C. SECTION 1350,AS ADOPTED PURSUANT TO
SECTION 906 OF THE SARBANES-OXLEY ACT OF 2002
In connection with the Quarterly Report of Realogy Group LLC (the “Company”) on Form 10-Q for the period ended September 30, 2016, as filed with theSecurities and Exchange Commission on the date hereof (the “Report”), Richard A. Smith, as Chief Executive Officer of the Company, and Anthony E. Hull,as Chief Financial Officer of the Company, each hereby certifies, pursuant to 18 U.S.C. Section 1350, as adopted pursuant to Section 906 of the Sarbanes-Oxley Act of 2002, that, to the best of his knowledge:
(1) The Report fully complies with the requirements of Section 13(a) or 15(d) of the Securities Exchange Act of 1934; and (2) The information contained in the Report fairly presents, in all material respects, the financial condition and results of operations of the
Company.
This certification accompanies the Report pursuant to Section 906 of the Sarbanes-Oxley Act of 2002 and shall not, except to the extent required by theSarbanes-Oxley Act of 2002 be deemed filed by the Company for purposes of Section 18 of the Securities Exchange Act of 1934, as amended.
/S/ RICHARD A. SMITH RICHARD A. SMITHCHIEF EXECUTIVE OFFICERNovember 4, 2016
/S/ ANTHONY E. HULL ANTHONY E. HULLEXECUTIVE VICE PRESIDENT ANDCHIEF FINANCIAL OFFICERNovember 4, 2016
Recommended


![A : K L : G O : E U ; : G D 1 : © : A : K L : G O : E U ... · A : K L : G O : E U ; : G D 1 : © : A : K L : G O : E U ... ... d * :, ] ^ _](https://img.pdfslide.us/doc/110x75/5ec3fe024c2a08537c4d0132/a-k-l-g-o-e-u-g-d-1-a-k-l-g-o-e-u-a-k-l-g-o-e-u.jpg)