Quick Start Expectations1. Fill in planner and HWRS
HW: CS p. 53, #9, #12, 13 a, c2.Get a signature on HWRS3. On desk: journal, calculator, textbook4. Warm Up: What do these algorithms represent?
Answer this question using the algorithm:
400 = 12(33.33)
p. 45

Both rows increase by 13Entries in delivery line are $5 more than pick upPick Up line can be scaled up Delivery line cannot be scaled up!
p. 46

The 13 in the equation shows up in the increase in the pick up line.This does NOT show up in the delivery line.That equation would be:

b. How are the graphs similar?How are they different?
Both graphs are straight lines
The lines are parallel
The pick up line starts at (0, 0)
The delivery line starts at (0, 5)

One Pizza
Delivery:(1, 18)
Pick Up:(1, 13)
Zero Pizza
Delivery:(0, 5)
Pick Up:(0, 0)

p.47
Vocab toolkit!

Vocab toolkit!


p. 48


n = 5C C = 0.2n$0.20 per orange5 oranges per dollar


(1, 5) = 5 oranges for $1 (1, 0.20) = $0.20 for one orange

d miles1 gallon
600 miles20 gallons
= d = 30 miles
1 mileg gallons
600 miles20 gallons
= g = gallon

Unit Rate:30 miles per gallon

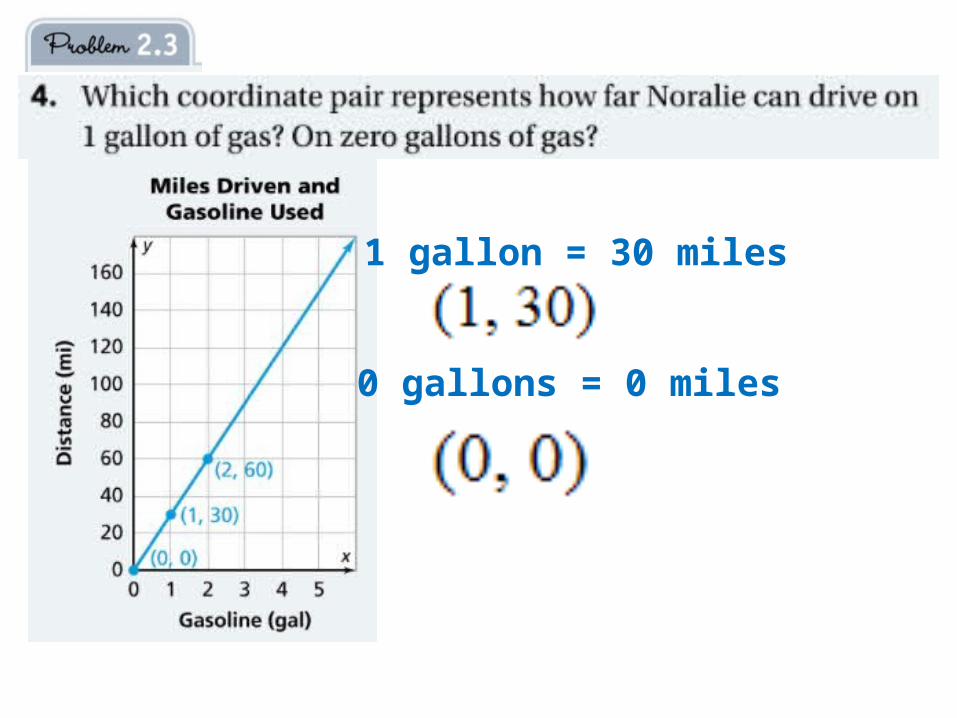
1 gallon = 30 miles
0 gallons = 0 miles

600 miles20 gallons
= x = 120 miles
600 miles20 gallons
=
x miles4 gallons
x miles 1 gallon
30 miles 1 gallon=
120 miles 4 gallons=
Both are correct!
You could also look at the graph, make a rate table, or use the equation, d = 30g and substitute 4 for g!
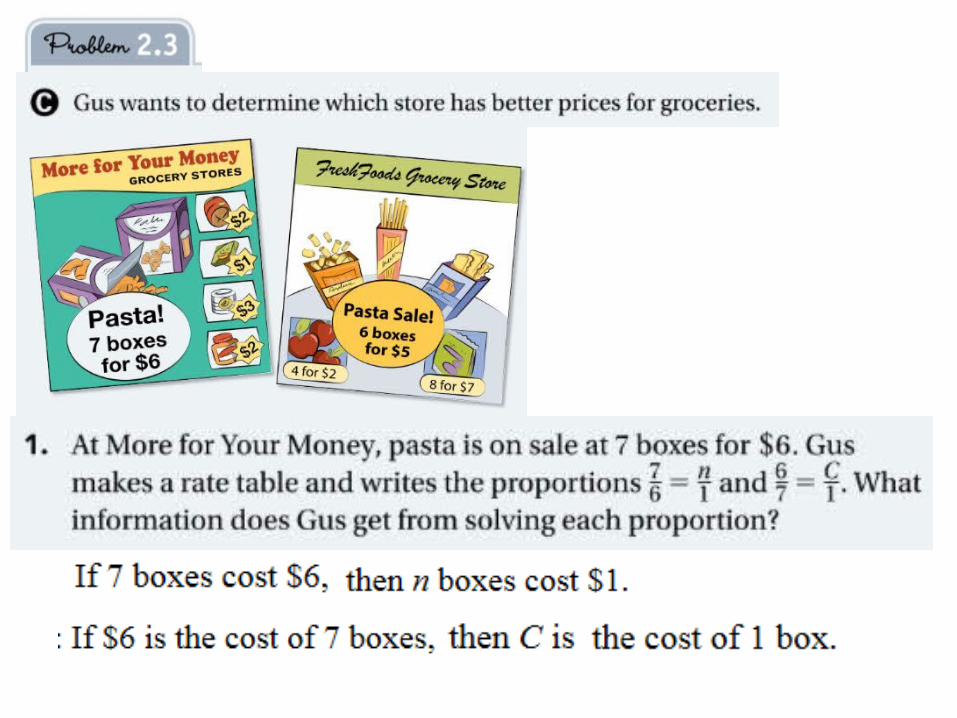

FreshFoods! $0.83 for one box ($0.03 less than MFYM)
Recommended