Quenching H2O2 Residuals Using Granular Activated Carbon:
Effect of pH and Biodegradation
By
Anmol Ratna Singh
Thesis submitted in conformity with the requirements
for degree of Masters in Applied Sciences (MASc.)
Graduate Department of Civil Engineering
University of Toronto
Copyright Anmol Ratna Singh 2014©
ii
Quenching H2O2 Residuals Using Granular Activated Carbon:
Effect of pH and Biodegradation
Anmol Ratna Singh
Master of Applied Science Degree
Department of Civil Engineering
University of Toronto
Abstract
This thesis has two parts:
Part I
Residual H2O2, dissolved oxygen and pH data were observed for quenching of H2O2 by virgin, 1
year and 2 years old GAC in pilot columns. All GACs completely quenched 4 mg/L of H2O2 but
not 10 mg/L H2O2. Active reaction sites in the columns were concentrated near the top for virgin
and middle for aged GAC.
Part II
Pseudo first order reaction constant, k, for H2O2 quenching was measured for six different
GACs, at three different age levels, in the pH range: 6.50 - 12.50. We observed a marked
increase in k values above pH 11.00.
H2O2 quenching by sand showed an increase from ~5% to ~10% in k value and from
~3% to ~10% in percentage quenching between week 3 and week 10 of bench scale experiments
suggesting that biofilm was able to induce H2O2 quenching ability in an otherwise inert media.
iii
Acknowledgements
I would like to thank University of Toronto for providing me this wonderful opportunity to learn
about the field of Civil Engineering and complete a M.A.Sc. degree.
I would also like to thank my supervisor Dr. Arash Zamyadi for his continuous guidance
throughout my masters program. I would like to express my gratitude to my friends who have
always been an encouraging influence during my studies. Lastly I would like to thank my family
for their unconditional support and blessings.
iv
Table of Contents
Abstract ......................................................................................................................................................... ii
Acknowledgements ...................................................................................................................................... iii
List of Figures ............................................................................................................................................. vii
List of Tables ............................................................................................................................................. viii
1. Research objectives and organization of chapters ............................................................................... 1
1.1 Objective .......................................................................................................................................... 1
1.2 Organization of chapters .................................................................................................................. 1
2. Assessing service life of GAC using pilot scale testing .......................................................................... 2
2.1 Abstract ............................................................................................................................................ 2
2.2 Introduction ...................................................................................................................................... 3
2.3 Materials and methods ..................................................................................................................... 4
2.3.1 Pilot-scale setup of columns ..................................................................................................... 4
2.3.2 Description of quenching, dissolved oxygen and pH profile .................................................... 4
2.4 Results and discussion ..................................................................................................................... 5
2.4.1 Effect of column height on H2O2 quenching by GAC .............................................................. 5
2.4.2 Effect of column height on dissolved oxygen profile of H2O2 quenching by GAC.................. 7
2.4.3 Effect of column height on pH profile of H2O2 quenching by GAC ........................................ 9
2.4.4 Comparison of quenched H2O2 between virgin, 1 and 2 years (operationally) old GAC ....... 11
2.4.5 Comparison of dissolved oxygen for H2O2 quenching by GAC between virgin, 1 and
2 years (operationally) old GAC ......................................................................................................... 13
2.4.6 Comparison of pH for H2O2 quenching by GAC between virgin, 1 and
2 years (operationally) old GAC ......................................................................................................... 14
2.5 Conclusion and recommendations for future work ......................................................................... 15
2.6 References ...................................................................................................................................... 16
3. Effect of pH, water matrix and biofilm on quenching of H2O2 by GAC .............................................. 20
3.1 Abstract .......................................................................................................................................... 20
3.2 Introduction .................................................................................................................................... 21
3.2.1 Reaction constant k in quenching reaction ................................................................................. 21
3.2.2 Biofilm growth ........................................................................................................................... 24
3.3 Materials and methods ................................................................................................................... 25

v
3.3.1 Bench-scale setup for analyzing effects of pH on kinetics ...................................................... 25
3.3.2 Description of kinetic reaction constant calculation ................................................................ 26
3.3.3 Bench –scale setup for analyzing biofilm effects .................................................................... 27
3.3.4 Description of reaction constant -k, quenching percentage and ATP value calculations .......... 28
3.4 Results and discussion ................................................................................................................... 29
3.4.1 Effect of pH on quenching hydrogen peroxide by virgin GAC ............................................... 29
3.4.2 Effect of pH on quenching hydrogen peroxide by GAC aged with NOM ............................... 31
3.4.3 Effect of pH on quenching hydrogen peroxide by GAC aged with NOM + H2O2 .................. 32
3.4.5 Variation in reaction constant – k of GAC and sand due to biofilm growth ............................ 40
3.4.6 Variation in quenching percentage of H2O2 due to biofilm growth ......................................... 41
3.4.7 Variation in ATP values of GAC and sand due to biofilm growth .......................................... 43
3.5 Conclusion and recommendations for future work ........................................................................ 44
3.5.1 Reaction constant value - k ........................................................................................................ 44
3.5.2 Biofilm growth ........................................................................................................................... 45
3.6 References ...................................................................................................................................... 47
A.1.1 K values of Virgin ADCAT .......................................................................................................... 51
A.1.2 K values of ADCAT aged with NOM ........................................................................................... 53
A.1.3 K values of ADCAT aged with NOM + H2O2 ............................................................................. 55
A.2.1 K values of Virgin Centaur ........................................................................................................... 57
A.2.2 K values of Centaur aged with NOM ............................................................................................ 59
A.2.3 K values of Centaur aged with NOM + H2O2 ............................................................................... 61
A.3.1 K values of Virgin F-300 .............................................................................................................. 63
A.3.2 K values of F-300 aged with NOM ............................................................................................... 65
A.3.3 K values of F-300 aged with NOM + H2O2 .................................................................................. 67
A.4.1 K values of virgin GAC-300 ......................................................................................................... 69
A.4.2 K values of GAC-300 aged with NOM ......................................................................................... 71
A.4.3 K values of GAC-300 aged with NOM + H2O2 ............................................................................ 73
A.5.1 K values of Virgin HD-3000 ......................................................................................................... 75
A.5.2 K values of HD-3000 aged with NOM ......................................................................................... 77
A.5.3 K values of HD-3000 aged with NOM + H2O2 ............................................................................. 79
A.6.1 K values of Virgin TN-5 ............................................................................................................... 81
A.6.2 K values of TN-5 aged with NOM ................................................................................................ 83
vi
A.6.3 K values of TN-5 aged with NOM + H2O2 ................................................................................... 85
A.7.1 K values of GAC in week 3 of biofilm experiment ...................................................................... 87
A.7.2 K values of GAC in week 10 of biofilm experiment .................................................................... 89
A.8.1 K values of Sand media in week 3 of biofilm experiment ............................................................ 91
A.8.2 K values of Sand media in week 10 of biofilm experiment .......................................................... 93
Appendix B ................................................................................................................................................. 95
SOP for hydrogen peroxide analysis ....................................................................................................... 95
SOP for ATP analysis (Lumin-ultra test kit instructions) ....................................................................... 97
Appendix C ................................................................................................................................................. 99
Spectrophotometer details: ...................................................................................................................... 99
vii
List of Figures
Figure 1: H2O2 quenching by virgin, 1 and 2 year old GAC. Inlet H2O2 = 4 mg/L ....................................... 6
Figure 2: H2O2 quenching by virgin, 1 and 2 year old GAC. Inlet H2O2 = 10 mg/L ..................................... 6
Figure 3: DO profile for virgin, 1 and 2 year old GAC. Inlet H2O2 = 4 mg/L .............................................. 8
Figure 4: DO profile for virgin, 1 and 2 year old GAC. Inlet H2O2 = 10 mg/L ............................................ 8
Figure 5: pH profile for virgin, 1 and 2 year old GAC. Inlet H2O2 = 4 mg/L ............................................. 10
Figure 6: pH profile for virgin, 1 and 2 year old GAC. Inlet H2O2 = 10 mg/L ........................................... 10
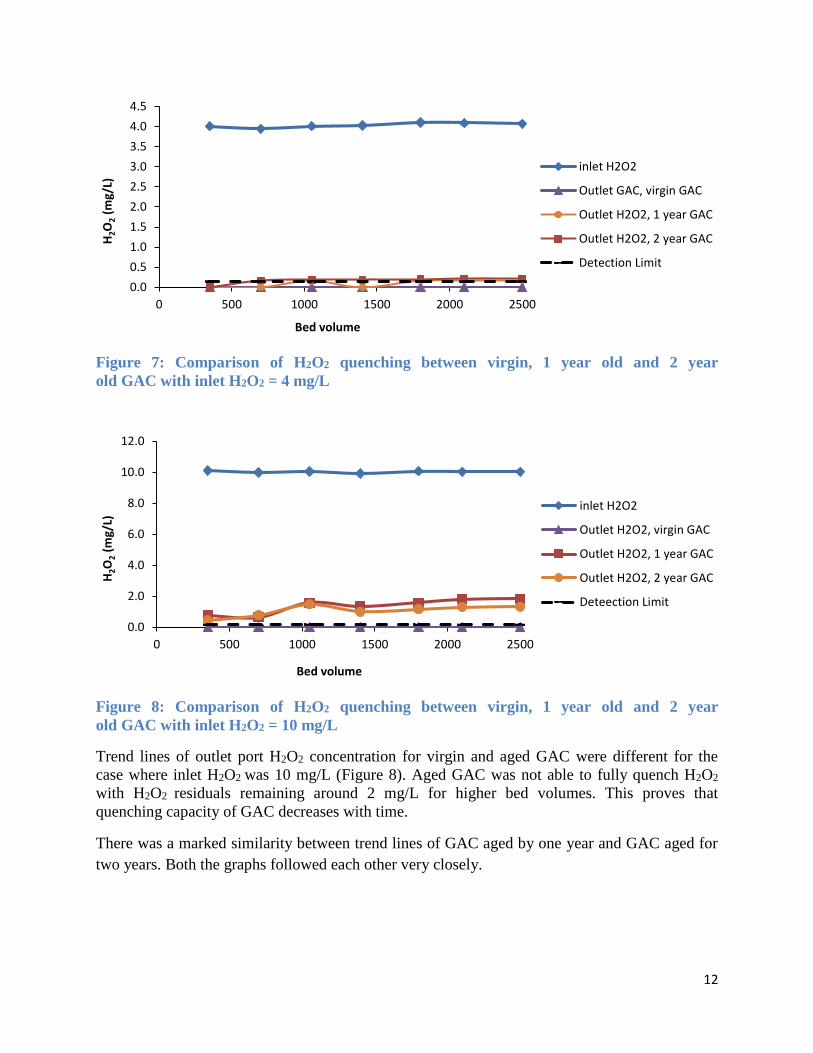
Figure 7: Comparison of H2O2 quenching between virgin, 1 year old and 2 year
old GAC with inlet H2O2 = 4 mg/L ............................................................................................................. 12
Figure 8: Comparison of H2O2 quenching between virgin, 1 year old and 2 year
old GAC with inlet H2O2 = 10 mg/L ........................................................................................................... 12
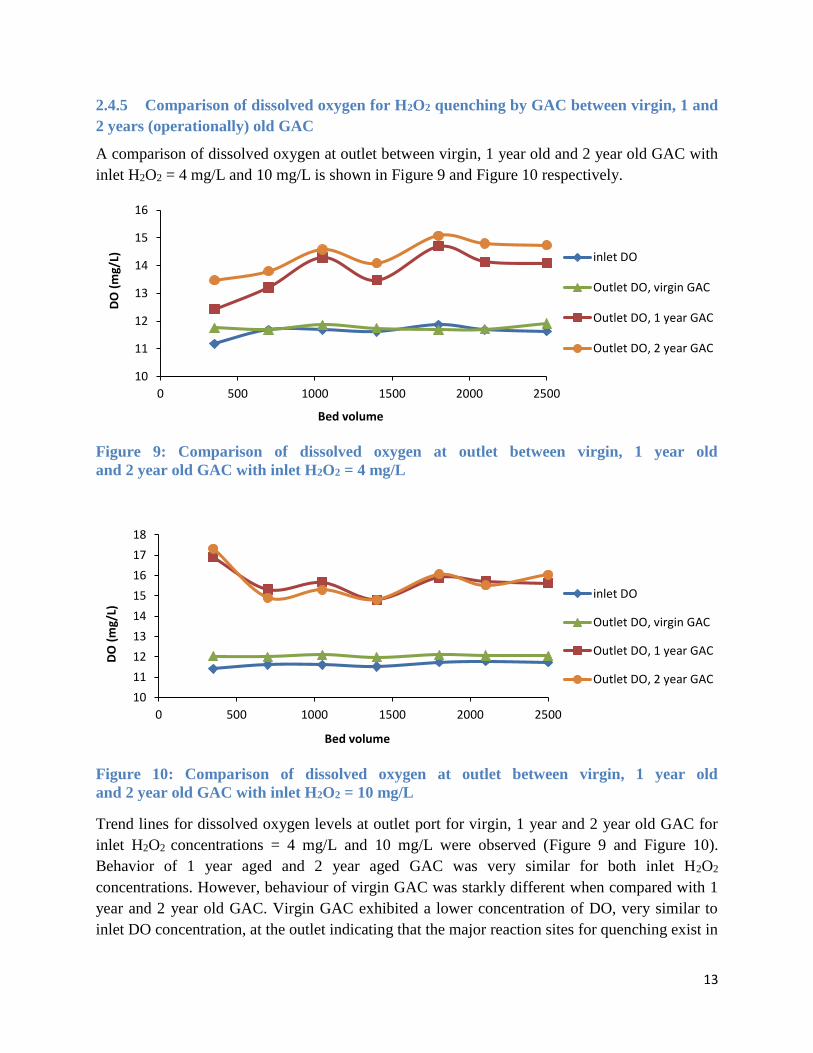
Figure 9: Comparison of dissolved oxygen at outlet between virgin, 1 year old
and 2 year old GAC with inlet H2O2 = 4 mg/L ........................................................................................... 13
Figure 10: Comparison of dissolved oxygen at outlet between virgin, 1 year old
and 2 year old GAC with inlet H2O2 = 10 mg/L ......................................................................................... 13
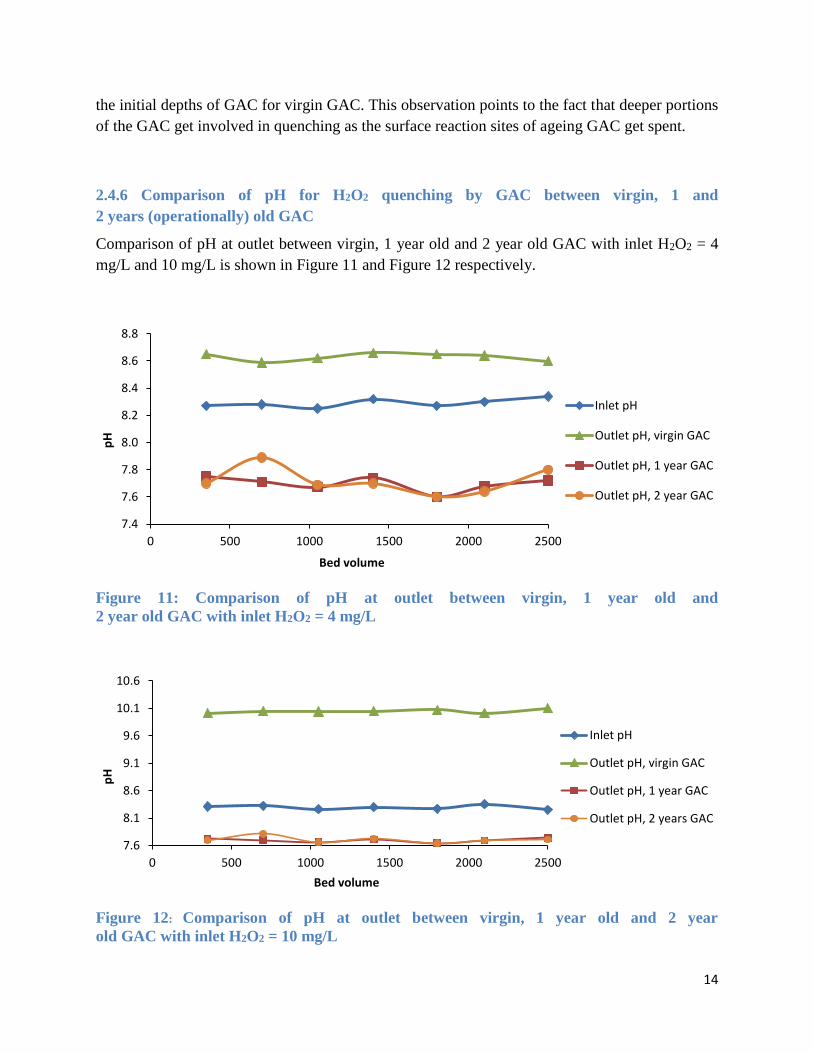
Figure 11: Comparison of pH at outlet between virgin, 1 year old and
2 year old GAC with inlet H2O2 = 4 mg/L .................................................................................................. 14
Figure 12: Comparison of pH at outlet between virgin, 1 year old and 2 year
old GAC with inlet H2O2 = 10 mg/L ........................................................................................................... 14
Figure 13: pH dependence of kinetic reaction constant for virgin GACs ................................................... 30
Figure 14: pH dependence of kinetic reaction constant for GACs aged
with 45000 bed volumes of water containing NOM ................................................................................... 31
Figure 15: pH dependence of kinetic reaction constant for GACs aged
with 45000 bed volumes of water containing NOM + H2O2 ...................................................................... 32
Figure 16: Comparison of Virgin GAC, GAC aged with 45000 bed volumes
of water containing NOM and GAC aged with 45000 bed volumes of water
containingNOM+H2O2 ................................................................................................................................ 34
Figure 17: Variation of reaction constant (k) of GAC Centaur and sand ................................................... 41
Figure 18: Variation of quenching ability of GAC and sand for H2O2 ....................................................... 42
Figure 19: Variation of ATP for GAC Centaur and sand due to biofilm .................................................... 43
viii
List of Tables
Table 1: Concentration of species at different pH values ........................................................................... 24
Table 2: GAC properties ............................................................................................................................. 25
Table 3: Buffers .......................................................................................................................................... 26
Table 4: Chemicals used for fortification of water ..................................................................................... 28
Table 5: Lower limit of UV transmission for common solvents ................................................................ 99
1
1. Research objectives and organization of chapters
1.1 Objective
The objective of this study was to gain insight about the quenching reaction of H2O2 by granular
activated carbon (GAC). Ageing of Centaur GAC due to quenching of hydrogen peroxide (H2O2)
was examined in the first part of the thesis. In the second part of the study, pH dependence of
quenching reaction and biofilm formation on GAC and sand media surface was studied.
1.2 Organization of chapters
There are two research chapters in this thesis:
Chapter 2
Pilot-scale study of service life of GAC on the basis of its ability to quench H2O2.
Lorne Park water treatment plant in Mississauga, Ontario (Canada) has full-scale GAC
contactors to periodically quench H2O2. These contactors include GAC that are 1 or 2
years old. We collected core samples from the full-scale GAC contactors, inserted them
into pilot columns and then spiked them with H2O2 to monitor H2O2 concentration as a
function of depth. To understand ageing of Centaur due to quenching of H2O2, we
investigated residual H2O2 concentration, dissolved oxygen and pH profiles on the basis
of depth of GAC in the pilot column and their change with continuously increasing bed
volumes of water passing through the pilot columns.
Chapter 3
Study of kinetic reaction constant k for bench scale setup of six different GACs at six
different values of pH. Three types of aged GACs were used in the experiment: virgin,
ageing by water matrix containing NOM, and ageing by water matrix containing NOM +
H2O2 ageing.
Biofilm growth on the surface of GAC and sand was investigated for a bench scale setup.
Kinetic reaction constant k, quenched percentage of H2O2 and ATP values for biofilm
were studied.
2
2. Assessing service life of GAC using pilot scale testing
2.1 Abstract
Quenching reaction between H2O2 and Centaur granular activated carbon (GAC) was examined
in a pilot scale setup. 128 cm long glass columns with 4 ports at heights of 25, 50, 75 and 100 cm
from the top were used for the experiments. The height of the column was modelled after the
depth of the GAC bed contactor at the Lorne Park water treatment plant in Mississauga, Ontario.
Residual H2O2, dissolved oxygen (DO) and pH data were measured at each port for three types
of GAC: virgin, 1 year, and 2 years old. Two inlet H2O2 concentrations of 4 mg/L and 10 mg/L
were used. The experiment was conducted continuously for 7 days. One set of observations was
taken every day, with each day equivalent to ~350 bed volumes.
Virgin GAC was seen to be better at quenching H2O2 than aged GAC. Neither virgin GAC nor
aged GAC were able to completely quench 10 mg/L H2O2, however, both were able to
completely quench 4 mg/L of H2O2. pH and DO proved that active reaction sites were
concentrated near the top and middle of the column for virgin GAC. Similar reactive sites
continued until the lower end of the column for aged GAC proving that reaction sites at the top
had been eliminated.
3
2.2 Introduction
The Lorne Park drinking water treatment plant in the region of Peel provides drinking water to
the adjoining population of Mississauga (Ontario, Canada). It employs granular activated carbon
contactors (GACCs) to quench excess H2O2 residuals after advanced oxidation process involving
UV irradiation. The advanced oxidation process is a part of its treatment train to prevent the
occurrence of taste and odor compounds in tap water. Quenching of H2O2 by GACC is the last
treatment process before chlorination therefore it is very important that the process achieves its
goals definitively. In case of inadequate quenching of H2O2 by GACC, H2O2 being an oxidizing
agent will react with chlorine. It is important to understand that it is mandated by law to have a
specific amount of chlorine in the treated water reaching the public. In the backdrop of these
circumstances, quenching of H2O2 by GAC assumes importance in the overall treatment train of
drinking water treatment plants.
GAC has been known to act as a catalyst in the decomposition of H2O2 (Khalil et al., 2001) and
has been used in a number of drinking water treatment plants due to its ability to quench H2O2
(Cotton et al.., 2010). Two major theories have been put forward for quenching mechanism of
hydrogen peroxide by GAC (Kurniawan et al., 2009 and Bach et al., 2011). The hypothesis by
Kurniawan et al. (2009) is given as follows:
𝑨𝑪 + 𝑯𝟐𝑶𝟐 → 𝑨𝑪+ + 𝑶𝑯− + ⦁𝑶𝑯 Equation 1. 1 𝑨𝑪+ → 𝑨𝑪 + 𝑯+ + ⦁𝑶𝑶𝑯 Equation 1. 2 The ⦁OOH and ⦁OH would combine to give H2O and O2 thus completing the decomposition
process. The second hypothesis by Bach et al. (2011) is given as follows:
𝑯𝟐𝑶𝟐 ⇌ 𝑯+ + 𝑯𝑶𝟐− (𝒑𝑲𝒂 = 𝟏𝟏. 𝟕𝟓) Equation 1. 3
𝑨𝑪 − 𝑶𝑯 + 𝑯+𝑯𝑶𝟐− → 𝑨𝑪 − 𝑶𝑶𝑯 + 𝑯𝟐𝑶 Equation 1. 4
𝑨𝑪 − 𝑶𝑶𝑯 + 𝑯𝟐𝑶𝟐 → 𝑨𝑪 − 𝑶𝑯 + 𝑶𝟐 + 𝑯𝟐𝑶 Equation 1. 5
We can observe that both the mechanisms involve use of H+ ion and formation of oxygen gas.
Despite the use of GACCs in treatment plant operations, factors affecting service life of GACCs
are mostly unknown. Taking into consideration the reaction mechanism and energetics of
decomposition of H2O2 we decided to investigate hydrogen peroxide quenching by GAC by
analyzing the following three reaction parameters in a pilot scale experimental setup:
Residual H2O2 concentration in reacting water
Dissolved oxygen in reacting water aliquots and its comparison with dissolved oxygen of
water (containing H2O2) entering the system
pH of reacting water aliquots and its comparison with pH of water (containing H2O2)
entering the system.
4
2.3 Materials and methods
2.3.1 Pilot-scale setup of columns
The pilot scale setup at Lorne park drinking water treatment plant consisted of three vertical
glass columns. Height of columns was 128 cm, as the columns were modeled after full-scale
GAC media contactors which had a depth of 128 cm. Each of the three columns had a different
age of Centaur GAC – virgin, one year and two years in operation. GAC from respective
contactors containing one and two year old GAC was removed from the contactors and
transferred into columns using a Wilson sampler. The sampler allows removal of GAC from the
contactor while maintaining its properties based on stratification. Lorne park GAC contactors
have an empty bed contact time of 4.12 minutes. To keep our results as similar to the existing
facility as possible, we used an EBCT of 4.12 minutes for our columns experiments. Besides
inlet and outlet, each column had four ports for sampling at depths of 25cm, 50 cm, 75 cm and
100 cm. Inflowing water into the columns consisted of ultra-filter membrane permeate, while the
waste was allowed to flow into a waste tank at the plant.
2.3.2 Description of quenching, dissolved oxygen and pH profile
There were two tests conducted on three different kinds of GACs – virgin, operationally active
for one and operationally active for two years. The general procedure was to measure different
GAC parameters at two different concentrations of H2O2 – 4 mg/L and 10 mg/L. This
concentration of H2O2 was added to the water from membrane permeate tanks of the drinking
water treatment plant at Lorne Park. Measured GAC parameters include residual H2O2
concentration in the column as a function of depth, dissolved oxygen in the GAC column as a
function of depth and pH in the column as a function of depth. Depth profiles for these
parameters were observed using outflow from the four ports and also from the inlet and outlet
points. Water was allowed to flow continuously with one observation taken every day at a fixed
time over a course of 7 days. This allowed us to compile data at seven different bed volumes,
with one day being an equivalent of roughly 350 bed volumes of water.
Measurement of H2O2 residuals was done using the ferric thiocyanate method (Wells, 1984). The
method involves use of ammonium thiocyanate + ferrous ion solution in vacu-vials. When these
vacu-vials are exposed to H2O2 solution, ferrous oxidizes to ferric combining with thiocyanate to
form coloured ferric thiocyanate as shown below:
𝟐 [𝑵𝑯𝟒+ 𝑺− − 𝑪 ≡ 𝑵] ⇌ 𝟐 𝑵𝑯𝟑 + 𝟐 𝑯+(𝒂𝒒) + 𝟐 [𝑺− − 𝑪 ≡ 𝑵] Equation 1. 6
𝟐 𝑭𝒆𝟐+ + 𝑯𝟐𝑶𝟐 + 𝟐 𝑯+(𝒂𝒒) → 𝟐 𝑭𝒆𝟑+ + 𝟐 𝑯𝟐𝑶 Equation 1. 7
𝑭𝒆𝟑+ + 𝟔 [𝑺− − 𝑪 ≡ 𝑵] → [𝑭𝒆(𝑺𝑪𝑵)𝟔]𝟑− (𝑹𝒆𝒅 𝒄𝒐𝒍𝒐𝒖𝒓𝒆𝒅) Equation 1. 8
5
Absorbance of ferric thiocyanate at a wavelength of 470 nm is proportional to the concentration
of H2O2 in solution.
The formula used was:
𝑯𝟐𝑶𝟐 (𝒊𝒏 𝒎𝒈
𝑳) = 𝟒. 𝟑𝟗 × 𝑨𝒃𝒔. (𝒂𝒕 𝟒𝟕𝟎 𝒏𝒎) − 𝟎. 𝟎𝟑 Equation 1. 9
On partially breaking the nib of the vacu-vial solution in a solution, liquid gets drawn into the
vacu-vial due to suction. Colourless ammonium ferro-thiocyanate solution inside the vacu-vials
converts into red coloured ferric thiocyanate if H2O2 is present in the tested solution. Absorbance
of this red coloured ferric thiocyanate at 470 nm on a spectrophotometer gives us the
concentration of H2O2. We used a mobile spectrophotometer for our analysis.
Measurement of dissolved oxygen was done using electrochemical dissolved oxygen sensing
technique (American Public Health Association 1998) using a dissolved oxygen probe. pH was
measured using a standard pH meter.
2.4 Results and discussion
2.4.1 Effect of column height on H2O2 quenching by GAC
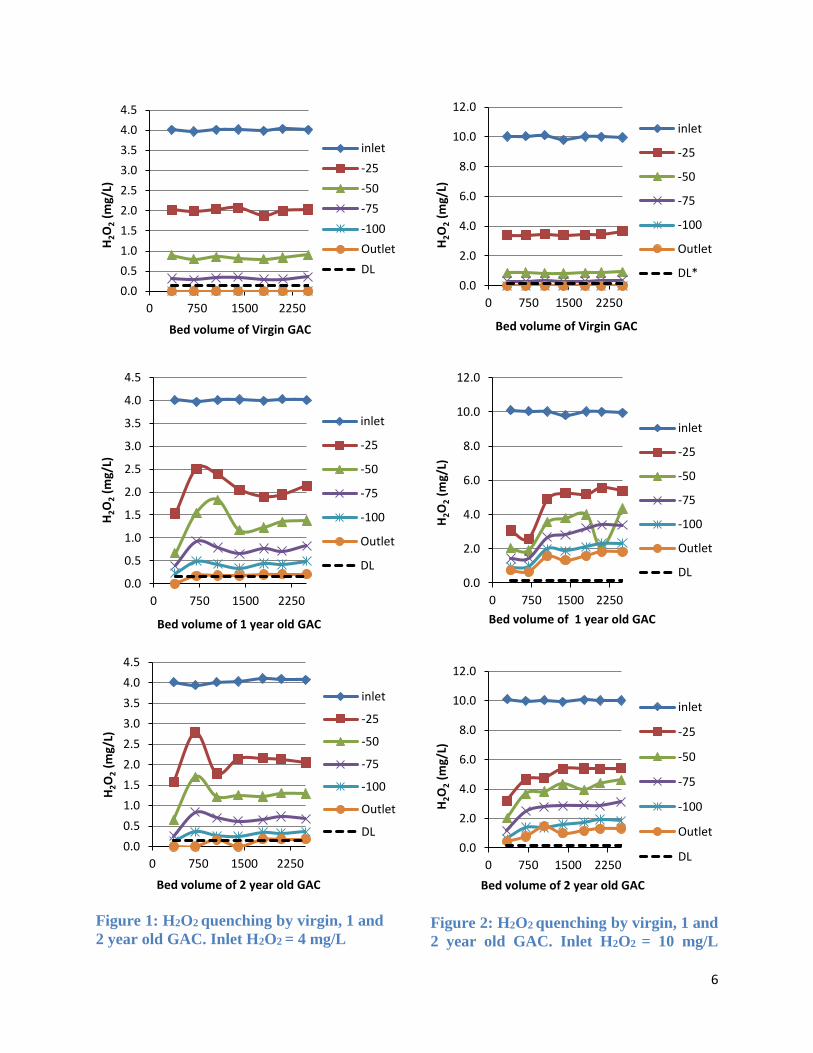
H2O2 quenching by virgin, 1 and 2 year old GAC for inlet H2O2 = 4 mg/L and 10 mg/L is shown
in Figure 1 and Figure 2 respectively
6
Figure 1: H2O2 quenching by virgin, 1 and
2 year old GAC. Inlet H2O2 = 4 mg/L
Figure 2: H2O2 quenching by virgin, 1 and
2 year old GAC. Inlet H2O2 = 10 mg/L
0.0
0.5
1.0
1.5
2.0
2.5
3.0
3.5
4.0
4.5
0 750 1500 2250
H2O
2(m
g/L)
Bed volume of Virgin GAC
inlet
-25
-50
-75
-100
Outlet
DL
0.0
0.5
1.0
1.5
2.0
2.5
3.0
3.5
4.0
4.5
0 750 1500 2250
H2O
2(m
g/L)
Bed volume of 1 year old GAC
inlet
-25
-50
-75
-100
Outlet
DL
0.0
0.5
1.0
1.5
2.0
2.5
3.0
3.5
4.0
4.5
0 750 1500 2250
H2O
2(m
g/L)
Bed volume of 2 year old GAC
inlet
-25
-50
-75
-100
Outlet
DL
0.0
2.0
4.0
6.0
8.0
10.0
12.0
0 750 1500 2250
H2O
2(m
g/L)
Bed volume of Virgin GAC
inlet
-25
-50
-75
-100
Outlet
DL*
0.0
2.0
4.0
6.0
8.0
10.0
12.0
0 750 1500 2250
H2O
2(m
g/L)
Bed volume of 1 year old GAC
inlet
-25
-50
-75
-100
Outlet
DL
0.0
2.0
4.0
6.0
8.0
10.0
12.0
0 750 1500 2250
H2O
2(m
g/L)
Bed volume of 2 year old GAC
inlet
-25
-50
-75
-100
Outlet
DL

7
DL in Figure 1and Figure 2 denotes detection limit. The trend lines for GACs with inlet = 4
mg/L of H2O2 showed very consistent behavior where amount of H2O2 left at 25 cm < 50 cm <
75 cm < outlet. This was expected as H2O2 would be quenched more with increasing depth of the
column. We were able to observe a peak formation at around 750 bed volumes region of the
graph for the outlets at depth of 25 cm and 50 cm. We also observed that the peak became more
prominent as we moved from virgin to one year old to two year old GAC. The decreasing
quenching ability of GAC between 0 and 750 bed volumes, which is the crest of the peak, points
to the fact that the GAC media near the top of the column was exhausted with usage and became
less capable of quenching H2O2. The rising quenching ability of the GAC between 750 and 1000
bed volumes, which is the trough of the peak, could point to the onset of biofilm growth on the
GAC. However, since biological activity was not measured in the GACs, we are not in a position
to make a conclusive statement on the growth of biofilm here. The observation may even
indicate a measurement error.
Trend lines for GACs with inlet = 10 mg/L H2O2 also show very consistent patterns. Again,
concentration of H2O2 can be seen to decrease continuously with increasing depth of GAC
media. The climbing graphs in one and two year old GAC prove that H2O2 quenching ability of
GAC decreases with time. Another important observation for one and two year old GACs is that
the final H2O2 concentration at the outlet is not very close to 0 but close to 2 mg/L. This proves
that old GACs may not be adequate to quench H2O2 residuals from advanced oxidation processes
if applied H2O2 concentrations happen to be as high as 10 mg/L. However, lower H2O2
concentrations of 4 mg/L can be easily handled by GAC which is operationally even two years
old.
On comparing the 4 mg/L and 10 mg/L graphs we observed that GAC quenching 10 mg/L of
H2O2 had higher concentration of H2O2 at all ports as compared to the values obtained at similar
ports for GAC quenching 4 mg/L H2O2.
It is visible that quenching ability of virgin GAC is much more than that of 1 year and 2 year old
GAC. It is noteworthy that 1 and 2 year old GAC have very similar quenching ability. In order to
reach H2O2 concentration of 0.5 mg/L down from 4 mg/L at inlet, virgin GAC requires
somewhere between 50 – 75 cm of GAC bed depth while 1 and 2 year old GACs require
somewhere between 75 – 100 cm of GAC bed depth.
2.4.2 Effect of column height on dissolved oxygen profile of H2O2 quenching by GAC
The DO profile for virgin, 1 and 2 year old GAC for inlet H2O2 = 4 mg/L and 10 mg/L is shown
in Figure 3 and Figure 4 respectively.

8
Figure 3: DO profile for virgin, 1 and 2
year old GAC. Inlet H2O2 = 4 mg/L
Figure 4: DO profile for virgin, 1 and 2
year old GAC. Inlet H2O2 = 10 mg/L
10
11
12
13
14
0 750 1500 2250
DO
(m
g/L)
Bed volume of virgin GAC
inlet
-25
-50
-75
-100
Outlet
10
11
12
13
14
15
16
0 750 1500 2250
DO
(m
g/L)
Bed volume of 1 year old GAC
inlet
-25
-50
-75
-100
Outlet
10
11
12
13
14
15
16
0 750 1500 2250
DO
(m
g/L)
Bed volume of 2 year old GAC
inlet
-25
-50
-75
-100
Outlet
10
11
12
13
14
15
16
17
18
0 750 1500 2250
DO
(mg/
L)
Bed volume of Virgin GAC
inlet
-25
-50
-75
-100
Outlet
10
11
12
13
14
15
16
17
18
0 750 1500 2250
DO
(m
g/L)
Bed volume of 1 year old GAC
inlet
-25
-50
-75
-100
Outlet
10
11
12
13
14
15
16
17
18
19
0 750 1500 2250
DO
(m
g/L)
Bed volume of 2 year old GAC
inlet
-25
-50
-75
-100
Outlet
9
Figure 3 and Figure 4 show dissolved oxygen (DO) values obtained at the outlet ports of the
columns containing GAC. As oxygen is a by-product of H2O2 quenching, it is an indirect
measure of quenching activity. The DO probe used in our experiment was capable of measuring
oxygen bubbles only qualitatively. However, oxygen dissolved in water was measured
quantitatively. The saturation concentration of oxygen at 10oC, which was the temperature while
conducting the experiment, is 11.27 mg/L. As all values in Figure 3 and Figure 4 are above
11.27, they point to the presence of oxygen bubbles.
In case of inlet H2O2 = 4 mg/L we saw that one year old GAC and two year old GAC trends were
similar, however, they were different as compared to the trends in virgin GAC graph. The basic
difference was that in virgin GAC we see high DO levels around the top of the column while in
old GACs we saw high DO levels around the bottom of the column. This observation points to
the fact that as GAC ages, the sites of quenching reaction shift to the more reactive depths of the
GAC volume.
In case of H2O2 = 10 mg/L we saw very similar trends as those in case of inlet H2O2 = 4 mg/L.
The observation of quenching reaction moving to deeper active sites of GAC held true for inlet
H2O2 = 10 mg/L as well. We observed very high DO values during the first few bed volumes for
all ports of the columns. This was because when a high concentration of H2O2 was made to come
into contact with the GAC it was actively quenched by the reactive sites. However as the reactive
sites got spent, intensity of reaction decreased. This resulted in a decrease of the observed DO
levels.
When we compared observations with inlet H2O2 = 4 mg/L with the observations for inlet H2O2 =
10 mg/L we were able to observe few differences. Firstly, the variability for DO levels observed
for inlet H2O2 = 4 mg/L case was much lower than in case of inlet H2O2 = 10 mg/L. Secondly,
the DO levels at all ports were substantially higher for inlet H2O2 = 10 mg/L case as more H2O2
requires more quenching, hence higher observed DO levels. Lastly, the DO levels were seen to
be highest for the first few bed volumes for GAC with inlet H2O2 = 10 mg/L, while, for GAC
with inlet H2O2 = 4 mg/L similar DO levels were lowest. This could point towards growing
biofilm. With increasing biofilm the intensity of quenching reaction would increase resulting in
higher DO levels. However, lack of growth of biofilm would result in continuously decreasing
DO levels with increasing bed volumes. As no formal testing of the presence of biofilm was
done, we cannot be certain about the reason for maxima and minima of individual trend lines.
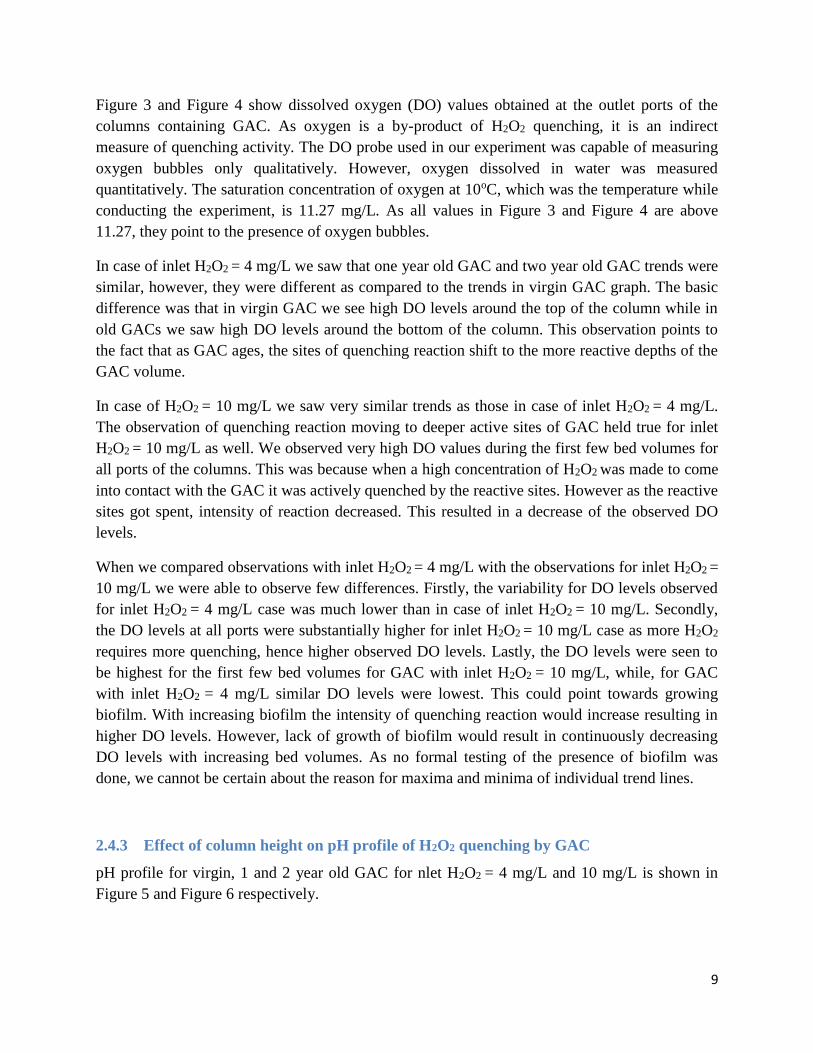
2.4.3 Effect of column height on pH profile of H2O2 quenching by GAC
pH profile for virgin, 1 and 2 year old GAC for nlet H2O2 = 4 mg/L and 10 mg/L is shown in
Figure 5 and Figure 6 respectively.
10
Figure 5: pH profile for virgin, 1 and 2
year old GAC. Inlet H2O2 = 4 mg/L
Figure 6: pH profile for virgin, 1 and 2
year old GAC. Inlet H2O2 = 10 mg/L
7.8
7.9
8.0
8.1
8.2
8.3
8.4
8.5
8.6
8.7
0 750 1500 2250
pH
Bed volume of Virgin GAC
inlet
-25
-50
-75
-100
Outlet
7.5
7.6
7.7
7.8
7.9
8.0
8.1
8.2
8.3
8.4
0 750 1500 2250
pH
Bed volume of 1 year old GAC
inlet
-25
-50
-75
-100
Outlet
7.5
7.6
7.7
7.8
7.9
8.0
8.1
8.2
8.3
8.4
8.5
0 750 1500 2250
pH
Bed volume of 2 year old GAC
inlet
-25
-50
-75
-100
Outlet
8.0
8.5
9.0
9.5
10.0
10.5
0 750 1500 2250
pH
Bed volume of Virgin GAC
inlet
-25
-50
-75
-100
Outlet
7.6
7.7
7.8
7.9
8.0
8.1
8.2
8.3
8.4
8.5
0 750 1500 2250
pH
Bed volume of 1 year old GAC
inlet
-25
-50
-75
-100
Outlet
7.6
7.7
7.8
7.9
8.0
8.1
8.2
8.3
8.4
8.5
0 750 1500 2250
pH
Bed volume of 2 year old GAC
inlet
-25
-50
-75
-100
Outlet
11
Figure 5 depicts pH trends in virgin, 1 year old and 2 year old GAC with inlet H2O2 = 4 mg/L.
Our observations on the study of pH pointed towards a shift in trend lines as we moved from
virgin GAC to aged GAC. The virgin GAC pH trend lines showed lowest pH values for aliquots
taken at ports around the top of the column. While the aged GAC pH trend lines show lowest pH
values for aliquots taken at the lower end of the column. The reaction of H2O2 with GAC results
in release of H+ ions, therefore more active site of quenching reaction tend to have the lower pH.
With this information, we can clearly state that the observations in Figure 5 point to the fact that
with increasing age of GAC the actual site of quenching reaction moves towards more reactive
sites in GAC which occur at increasingly greater depths with the passage of time.
Figure 6 depicts pH trends in virgin, 1 year old and 2 year old GAC with inlet H2O2 = 10 mg/L.
All the trends for inlet H2O2 = 4 mg/L hold true for inlet H2O2 = 10 mg/L case too. An important
observation in the inlet H2O2 = 10 mg/L case is that the graph for virgin GAC exhibits
remarkably high pH values. This observation points to low intensity of quenching reaction for
virgin GAC at all port depths as quenching of H2O2 on the surface of GAC results in release of
H+ ion. A probable explanation for this observation could be that the reaction intensity was
highest somewhere between inlet and the first port at a depth of 25 cm. However, as there were
no observations made before the inlet and the first port at 25 cm, it is hard to zero in on the exact
cause behind this behavior of virgin GAC.
A comparison of respective pH values for inlet H2O2 = 4 mg/L case and inlet H2O2 = 10 mg/L
case pointed to the difference in pH trends of virgin GAC. Virgin GAC in case of inlet H2O2 = 10
mg/L showed markedly higher values when compared with inlet H2O2 = 4 mg/L. The reason for
this observation could be attributed to the high intensity of quenching reaction between inlet and
the first port. However, as the first port of observation was at 25 cm, we cannot say anything
conclusively about this observation.
2.4.4 Comparison of quenched H2O2 between virgin, 1 and 2 years (operationally) old
GAC
A comparison of H2O2 quenching between virgin, 1 year old and 2 year old
GAC with inlet H2O2 = 4 mg/L and 10 mg/L can be seen in Figure 7 and Figure 8 respectively.
12
Figure 7: Comparison of H2O2 quenching between virgin, 1 year old and 2 year
old GAC with inlet H2O2 = 4 mg/L
Figure 8: Comparison of H2O2 quenching between virgin, 1 year old and 2 year
old GAC with inlet H2O2 = 10 mg/L
Trend lines of outlet port H2O2 concentration for virgin and aged GAC were different for the
case where inlet H2O2 was 10 mg/L (Figure 8). Aged GAC was not able to fully quench H2O2
with H2O2 residuals remaining around 2 mg/L for higher bed volumes. This proves that
quenching capacity of GAC decreases with time.
There was a marked similarity between trend lines of GAC aged by one year and GAC aged for
two years. Both the graphs followed each other very closely.
0.0
0.5
1.0
1.5
2.0
2.5
3.0
3.5
4.0
4.5
0 500 1000 1500 2000 2500
H2O
2(m
g/L)
Bed volume
inlet H2O2
Outlet GAC, virgin GAC
Outlet H2O2, 1 year GAC
Outlet H2O2, 2 year GAC
Detection Limit
0.0
2.0
4.0
6.0
8.0
10.0
12.0
0 500 1000 1500 2000 2500
H2O
2(m
g/L)
Bed volume
inlet H2O2
Outlet H2O2, virgin GAC
Outlet H2O2, 1 year GAC
Outlet H2O2, 2 year GAC
Deteection Limit
13
2.4.5 Comparison of dissolved oxygen for H2O2 quenching by GAC between virgin, 1 and
2 years (operationally) old GAC
A comparison of dissolved oxygen at outlet between virgin, 1 year old and 2 year old GAC with
inlet H2O2 = 4 mg/L and 10 mg/L is shown in Figure 9 and Figure 10 respectively.
Figure 9: Comparison of dissolved oxygen at outlet between virgin, 1 year old
and 2 year old GAC with inlet H2O2 = 4 mg/L
Figure 10: Comparison of dissolved oxygen at outlet between virgin, 1 year old
and 2 year old GAC with inlet H2O2 = 10 mg/L
Trend lines for dissolved oxygen levels at outlet port for virgin, 1 year and 2 year old GAC for
inlet H2O2 concentrations = 4 mg/L and 10 mg/L were observed (Figure 9 and Figure 10).
Behavior of 1 year aged and 2 year aged GAC was very similar for both inlet H2O2
concentrations. However, behaviour of virgin GAC was starkly different when compared with 1
year and 2 year old GAC. Virgin GAC exhibited a lower concentration of DO, very similar to
inlet DO concentration, at the outlet indicating that the major reaction sites for quenching exist in
10
11
12
13
14
15
16
0 500 1000 1500 2000 2500
DO
(m
g/L)
Bed volume
inlet DO
Outlet DO, virgin GAC
Outlet DO, 1 year GAC
Outlet DO, 2 year GAC
10
11
12
13
14
15
16
17
18
0 500 1000 1500 2000 2500
DO
(m
g/L)
Bed volume
inlet DO
Outlet DO, virgin GAC
Outlet DO, 1 year GAC
Outlet DO, 2 year GAC
14
the initial depths of GAC for virgin GAC. This observation points to the fact that deeper portions
of the GAC get involved in quenching as the surface reaction sites of ageing GAC get spent.
2.4.6 Comparison of pH for H2O2 quenching by GAC between virgin, 1 and
2 years (operationally) old GAC
Comparison of pH at outlet between virgin, 1 year old and 2 year old GAC with inlet H2O2 = 4
mg/L and 10 mg/L is shown in Figure 11 and Figure 12 respectively.
Figure 11: Comparison of pH at outlet between virgin, 1 year old and
2 year old GAC with inlet H2O2 = 4 mg/L
Figure 12: Comparison of pH at outlet between virgin, 1 year old and 2 year
old GAC with inlet H2O2 = 10 mg/L
7.4
7.6
7.8
8.0
8.2
8.4
8.6
8.8
0 500 1000 1500 2000 2500
pH
Bed volume
Inlet pH
Outlet pH, virgin GAC
Outlet pH, 1 year GAC
Outlet pH, 2 year GAC
7.6
8.1
8.6
9.1
9.6
10.1
10.6
0 500 1000 1500 2000 2500
pH
Bed volume
Inlet pH
Outlet pH, virgin GAC
Outlet pH, 1 year GAC
Outlet pH, 2 years GAC
15
Graphs of pH profile at outlet port for virgin, 1 year old and 2 year old GAC exhibited uniform
behavior except for virgin GAC with 10 mg/L as inlet H2O2 concentration. Aged GAC showed
lower pH values than pH at inlet or pH for virgin GAC. This proves that H2O2 was quenched
actively near the outlet port in case of aged GAC as quenching reaction results in production of
H+ ion. Higher pH values at outlet port in case virgin GAC denote lack of quenching activity
near the outlet region. This proves that in case of virgin GAC most of the quenching happens
near the top the column or the top surface of a GAC contact bed.
2.5 Conclusion and recommendations for future work
The experiments performed on GAC centaur in pilot columns setup in Lorne Park drinking water
treatment plant unambiguously point to the fact that virgin GAC was better at quenching H2O2
residuals as compared to one year and two year old GAC. Results for virgin GAC were quite
different from aged GACs, however, the two forms of aged GACs – one year old and two year
old showed surprisingly similar trends in all aspects of measured quenching reaction parameters
viz. residual H2O2 concentration, dissolved oxygen (DO) concentration and pH value. In case of
virgin GAC, reaction sites were concentrated towards the top portion of the column. While, data
from one and two year old GAC points to more reaction sites in the middle and the lower portion
of the column as most of the reaction sites at the top had been spent with age. The column was
analogous to a GAC bed contactor with top portion of the column signifying the exposed top
surface of the GAC bed and the middle and bottom portion of the column being same as the
deeper unexposed portions of GAC bed.
Quenching reaction involving 10 mg/L of H2O2 resulted in 0 mg/L H2O2 residuals in case of
virgin GAC. However, one year old and two year old GAC had residual H2O2 concentrations in
the range of 0.5 mg/L to 2 mg/L, for the applied empty bed contact time (EBCT) of 4.1 minutes.
This is of significance for treatment plants using GAC to quench H2O2 as quenching percentage
varied between 80% and 95% for high concentration H2O2 dose.
There are a number of areas which need to be explored in the quenching of H2O2 by GAC:
Maximum possible concentration of H2O2 that can be quenched by a particular GAC as a
function of the age of GAC and empty bed contact time (EBCT)
Continuous pilot project involving monitoring of residual H2O2, dissolved oxygen (DO)
and pH measurements continuously for at least two years to gain understanding about
ageing of GAC and deactivation of its reactive sites
More accurate dissolved oxygen measurement technique which would allow quantitative
measurement of bubble + dissolved form of oxygen
Analysis of exhausted GAC surface with virgin GAC surface can give us important
information about the reaction mechanism of the quenching process between H2O2 and
GAC.
16
2.6 References
Aguinaco, A., Pocostales, J.P. , García-Araya, J.F., and Beltran, F.J., 2011. Decomposition of
hydrogen peroxide in the pesence of activated carbons with different characteristics.
Journal of Chemical Technology & Biotechnology.
Alasri, A., Roques, C. and Michel, G. , 1992. Bactericidal Properties of Peracetic Acid and
Hydrogen Peroxide, Alone and in Combination, Chlorine and Formaldehyde Against .
Bacterial Water Strains 38, no. 7: 635.
Alvarez, P.M., García-Araya , J.F., Beltran, F.J., Giraldez, I., Jaramillo, J., Gómez-Serrano, V.,
2006. The influence of various factors on aqueous ozone decomposition by granular
activated carbons and the development of a mechanistic approach. Carbon 44 (14): 3102–
3112.
American Public Health Association, American Water Works Association, Water Environmental
Federation, APHA-AWWA-WEF, 1998. Standard Methods for the Examination of Water
and Wastewater . Washington D.C.
Bach, A., and Semiat, R., 2011. The role of activated carbon as a catalyst in GAC/iron
oxide/H2O2 oxidation process. Desalination. 273 (1) .
Bielski, B.H.J., Cabelli, D.E., Arudi, R.L., and Ross, A.B., 1985. Reactivity of HO2 / O2(-)
radicals in aqueous solution. (J Phys Chem Ref Data) 14(4):1041–100.
Buxton, G.V., Greenstock, C.L., Helman, W.P., and Ross, A.B., 1988. Critical review of rate
constants for reactions of hydrated electrons, hydrogen atoms and hydroxyl radicals
(HO./O.-) in aqueous solution. J Phys Chem Ref Data, 17(2):513–886 ed.
Calgon-Carbon. Centaur HSL 8X20, 2011. Pittsburgh: Calgon Carbon.
Calgon-Carbon. Filtrasorb 300, 2012. Pittsburgh: Calgon Carbon.
Calgon-Carbon. TN-5 8X30, 2011. Pittsburgh: Calgon Carbon.
Campbell, J.E., and Kimmick, R.L., 1966. Effect of 3% Hydrogen Peroxide on viability of
Serratia Marcescens. (Journal Bacteriology) 91:3:925.
Castro, C.S., Oliveira, L.C.A., and Guerreiro, M.C., 2009. Effect of hydrogen treatment on the
catalytic activity of iron oxide based materials dispersed over activated carbon:
investigations toward hydrogen peroxide decomposition. Catalysis Letters.
Cotton, C., Jousset, S., Linden, K., and Collins, J., 2010. Applying UV-AOP at an existing WTP:
effects on disinfection strategy and DBP formation. (AWWA WQTC).
17
Crittenden, J.C., Hu, S., Hand, J.W., Green, S.A., 1999. A kinetic model for H2O2/ UV process
in a completely mixed batch reactor. Water Research 33(10): 2315.
Dotson, A., Corwin, C., Rowley, C., Downs, M. and Linden, K., 2010. Dynamic bench-scale
quenching of H2O2 by GAC. AWWA WQTC (AWWA WQTC).
Elliot, A.J., and Buxton, G.V., 1992. Temperature dependence of the reactions OH + O2(-) and
OH + HO2 in water upto 200 degrees celcius. Faraday Trans .
Evans, M.G., and Uri, N., 1949. The dissociation constant of hydrogen peroxide and electron
afficnity of HO2 radical. Trans Faraday Society: 224-230.
Gogate, P.R., and Pandit, A.B., 2004. A review of imperative technologies for wastewater
treatment I: oxidation technologies at ambient conditions. Adv Environ Res.
Gomes, H.T., Miranda, S.M., Sampaio, M.J., Silva, A.M.T., and Faria, J.L., 2010. Activated
carbons treated with sulphuric acid: catalysts forcatalytic wet peroxide oxidation. Catal
Today, 151(1-2): 153 - 8 ed.
Granular activated carbon used as catalyst or catalyst support, 1987. Calgon Carbon Corporation.
Hage, R., and Lienke, A., 2006 Applications of transition-metal catalysts to textile and wood-
pulp bleaching. Angew Chem Int Ed.
Huang, H.H., Lu, M.C., Chen, J.N., Lee, C.T., 2003. Catalytic decomposition of hydrogen
peroxide and 4-chlorophenol in the presence of modified activated carbons. Chemosphere
51 , no. 9: 935–943.
Ingle, J. D. J., Crouch, S. R., 1988. Spectrochemical Analysis. New Jersey: Prentice Hall.
Khalil, L.B., Girgis, B.S., and Tawfik, T.A., 2001. Decomposition of H2O2 on activated carbon
obtained from olive stones. Journal of Chemical Technology and Biotechnology.
Klassem, N., Marchington, D., McGowan, H., 1994. H2O2 determination by I3(-) method and
by KMnO4 titration. 66, 2921-2925.
Koppenol, W.H., Butler, J., and Van Leeuwen, J.W., 1978. The Haber-Weiss cycle.
Photochemistry Photobiology, 28(4–5):655–8 ed.
Krejci, D., Woschnak, A., Scharlemann, C., Ponweiser, C., 2011. Hydrogen Peroxide
Decomposition for Micro Propulsion: Simulation and Experimental Verification. ASEE.
Kurniawan, T.A., and Lo, W.H., 2009. Removal of refractory compounds from stable landfill
leachate using an integrated H2O2 oxidation treatment and GAC adsorption treatment.
Water Research 43, no. 16: 4079 - 4091.
18
Lee, H.J., Ho, M.R., Bhuwan, M., Hsu, C.Y., Huang, M.S., Peng, H.L., Chang, H.Y., 2010.
Enhancing ATP-based bacteria and biofilm detection by enzymatic pyrophosphate
regeneration. Analytical Biochemistry.
Lucking, F., Koser, H., Jank, M., and Ritter, A, 1998. Iron powder, graphite and activated carbon
as catalysts for the oxidation of 4- chlorophenol with hydrogen peroxide in aqueous
solution. Water Res, 32(9):2607–14. ed.
Jans, U., and Hoigné, J., 1998. Activated carbon and carbon black catalyzed transformation of
aqueous ozone into OH-radicals. Ozone: Science & Engineering. The Journal of the
International Ozone Association 20: 67-90.
Jones, C.W., 1999. Application of Hydrogen Peroxide and Derivatives. The Royal Society of
Chemistry.
Lide, Dr. C.R.C., 2006. Handbook of Chemistry and Physics. Boca Raton, FL: CRC Press,
Taylor and Francis Group.
Linden, K.G., Mohseni, M., 2014. Comprehensive Water Quality and Purification, Advanced
Oxidation Processes: Applications in Drinking Water Treatment. Earth Systems and
Environmental Science.
Linden, K.G., Sharpless, C.M., Andrews, S.A., Atasi, K.Z., Korategere, V., and Stefan, M.,
2005. Innovative UV Technologies to Oxidize Organic and Organoleptic Chemicals.
London UK: IWA Publishing.
Li, J., 2013. Quenching H2O2 Residuals After UV/ H2O2 Drinking Water Treatment Using
Granular Activated Carbon. Toronto.
McKay, G., Sjelin, B., Chagnon, M., Ishida, K.B., Mezyk, S.B., 2013. Kinetic study of the
reactions between chloramine disinfectants and hydrogen peroxide: temperature
dependence and reaction mechanism. Chemosphere 92 (11): 1417–1422.
Michaud, J.P., 1991. A citizen's guide to understanding and monitoring lakes and streams. Vol.
1. Department of Ecology publications office.
National Institute for Occupational Safety and Health (NIOSH), 2010, Revised March 2012.
NIOSH pocket guide to chemical hazards: hydrogen peroxide.
Norit. GAC 300, 2013. Billerica: Norit.
Norit. Hydrodarco 3000, 2013. Billerica: Norit.
Ontario, Legislative Assembly of. Safe Drinking Water Act 2002. (Govt. of Ontario) 2002.
Philippe, S., and Figueiredo, J.L., 2009. Carbon Materials for Catalysis. Wiley.

19
Raffellini, S., Schenk, M., Guerrero, S., and Alzamora, S.M., 2011. Kinetics of Escherichia coli
inactivation employing hydrogen peroxide at varying temperatures, pH and
concentration. (Food Control) 22(6):920-32.
Rebeiro, R.S., Silva, A.M.T., Figueiredo, J.L., Faria, J.L., and Gomes, H.T., 2012. The influence
of stucture and surface chemistry of carbon materials on the decomposition of hydrogen
peroxide. Elsevier.
Rey, A., Zazo, J.A., Casas, J.A., Bahamonde, A. and Rodriguez, J.J., 2011. Influence of the
structural and surface characteristics of activated carbon on the catalytic decomposition
of hydrogen peroxide. Applied Catalysis A, General 402, 146–155 ed.
Robinson, R.A., and Stokes, R.H., 1968. Electrolyte solution. London: Butterworths.
Schlegel, H.G., 1977. Aeration without Air: Oxygen supply by hydrogen peroxide.
Biotechnology Bioengineering.
Skibinski, B., Müller, S., Uhl, W., 2009. Removal of free and combined chlorine at GAC
surfaces and impact on pool water quality. Swimming Pool & Spa International
Conference. London: PWTAG.
Suidan, M.T., Sneyink, V.L., Schmitz, R.A., 1977. Reduction of aqueous free chlorine with
granular activated carbon-pH and temperature effects. Environmental Science &
Technology 11 (8): 785-789.
Urfer, D., Huck, P.M., 1997. Effect of Hydrogen Peroxide on Biologically Active Filters. Ozone
Science and Engineering.
USATSDR. 2011. Medical Management guideleines for hydrogen peroxide. Atlanta, US.
Watts, M.J., Hofmann, R., Rosenfeldt, E.J. Low-pressure UV/Cl2 for advanced oxidation of taste
and odor. Journal American Water Works Association, n.d.: 104(1), 47-48.
Weinstein, J., and Bielski, B.H.J., 1979. Kinetics of the interaction of perhydroxy and superoxide
radicals with hydrogen peroxide, the Haber Weiss reaction. (Junior American Chemial
Society) 101(1):58–62.
Wells, A.F., 1984. Structural Inorganic Chemistry. Oxford, U.K.: Oxford University Press.
20
3. Effect of pH, water matrix and biofilm on quenching of H2O2 by GAC
3.1 Abstract
Quenching reaction between H2O2 and GAC was examined at bench-scale. The pseudo first
order reaction constant k for the quenching reaction was calculated at six different values of pH:
6.50, 7.00, 8.50, 11.00, 11.75 and 12.50, and for six different GACs: ADCAT, Centaur, F-300,
Norit GAC-300, HD-3000 and TN-5. Each GAC had been exposed to three different types of
ageing: virgin, exposed to 45000 bed volumes of natural organic matter (NOM) and exposed to
45000 bed volumes of NOM + H2O2. Results suggested that virgin GAC was faster at quenching
H2O2 as compared to aged GAC. Both types of aged GACs quenched H2O2 at almost similar
rates. There was a marked increase in the rate of quenching beyond a pH value of 11.00 with
virgin GAC showing a sharper rise than aged GACs.
Biofilm growth and its effect on quenching ability of virgin GAC Centaur and sand (inert media)
was investigated for a duration of 10 weeks by performing bench-scale experiments. Reaction
rates showed an increase between week 3 and week 10 suggesting a positive influence of biofilm
on the quenching ability of GAC. Sand showed an increase from ~5% to ~10% in reaction
constant k values between week 3 and week 10 suggesting that biofilm growth had induced a
quenching ability in an otherwise inert media like sand.
21
3.2 Introduction
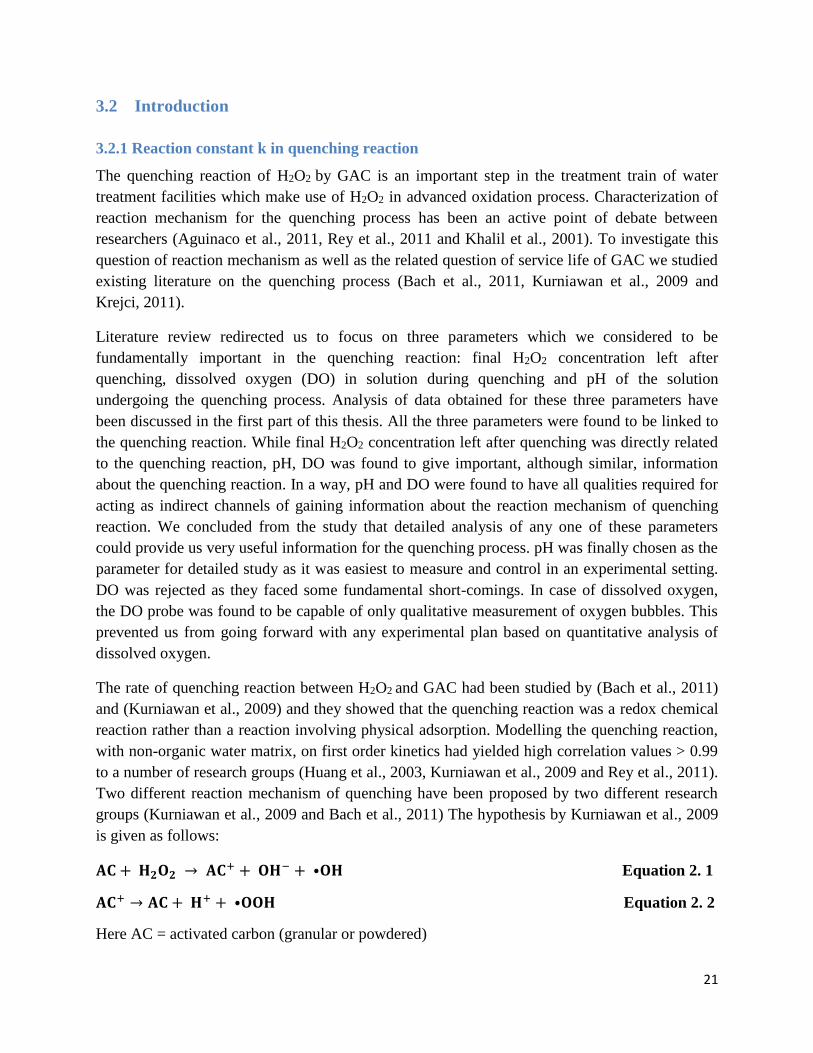
3.2.1 Reaction constant k in quenching reaction
The quenching reaction of H2O2 by GAC is an important step in the treatment train of water
treatment facilities which make use of H2O2 in advanced oxidation process. Characterization of
reaction mechanism for the quenching process has been an active point of debate between
researchers (Aguinaco et al., 2011, Rey et al., 2011 and Khalil et al., 2001). To investigate this
question of reaction mechanism as well as the related question of service life of GAC we studied
existing literature on the quenching process (Bach et al., 2011, Kurniawan et al., 2009 and
Krejci, 2011).
Literature review redirected us to focus on three parameters which we considered to be
fundamentally important in the quenching reaction: final H2O2 concentration left after
quenching, dissolved oxygen (DO) in solution during quenching and pH of the solution
undergoing the quenching process. Analysis of data obtained for these three parameters have
been discussed in the first part of this thesis. All the three parameters were found to be linked to
the quenching reaction. While final H2O2 concentration left after quenching was directly related
to the quenching reaction, pH, DO was found to give important, although similar, information
about the quenching reaction. In a way, pH and DO were found to have all qualities required for
acting as indirect channels of gaining information about the reaction mechanism of quenching
reaction. We concluded from the study that detailed analysis of any one of these parameters
could provide us very useful information for the quenching process. pH was finally chosen as the
parameter for detailed study as it was easiest to measure and control in an experimental setting.
DO was rejected as they faced some fundamental short-comings. In case of dissolved oxygen,
the DO probe was found to be capable of only qualitative measurement of oxygen bubbles. This
prevented us from going forward with any experimental plan based on quantitative analysis of
dissolved oxygen.
The rate of quenching reaction between H2O2 and GAC had been studied by (Bach et al., 2011)
and (Kurniawan et al., 2009) and they showed that the quenching reaction was a redox chemical
reaction rather than a reaction involving physical adsorption. Modelling the quenching reaction,
with non-organic water matrix, on first order kinetics had yielded high correlation values > 0.99
to a number of research groups (Huang et al., 2003, Kurniawan et al., 2009 and Rey et al., 2011).
Two different reaction mechanism of quenching have been proposed by two different research
groups (Kurniawan et al., 2009 and Bach et al., 2011) The hypothesis by Kurniawan et al., 2009
is given as follows:
𝐀𝐂 + 𝐇𝟐𝐎𝟐 → 𝐀𝐂+ + 𝐎𝐇− + ⦁𝐎𝐇 Equation 2. 1
𝐀𝐂+ → 𝐀𝐂 + 𝐇+ + ⦁𝐎𝐎𝐇 Equation 2. 2
Here AC = activated carbon (granular or powdered)
22
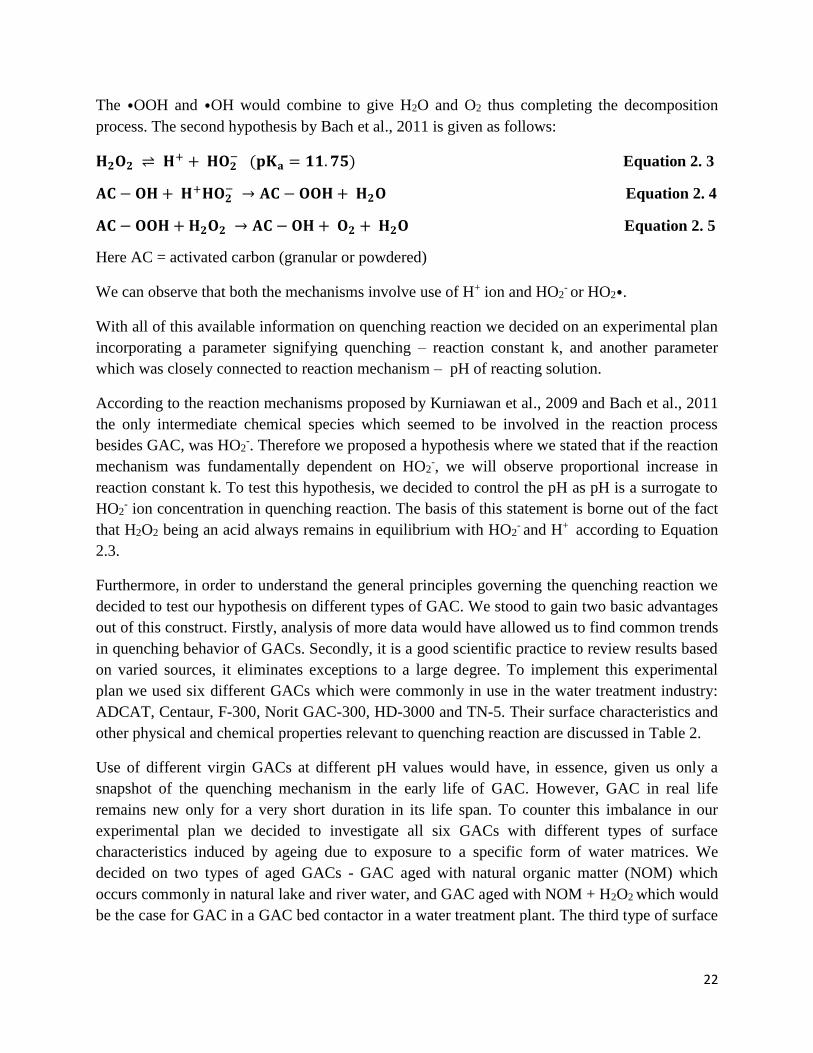
The ⦁OOH and ⦁OH would combine to give H2O and O2 thus completing the decomposition
process. The second hypothesis by Bach et al., 2011 is given as follows:
𝐇𝟐𝐎𝟐 ⇌ 𝐇+ + 𝐇𝐎𝟐− (𝐩𝐊𝐚 = 𝟏𝟏. 𝟕𝟓) Equation 2. 3
𝐀𝐂 − 𝐎𝐇 + 𝐇+𝐇𝐎𝟐− → 𝐀𝐂 − 𝐎𝐎𝐇 + 𝐇𝟐𝐎 Equation 2. 4
𝐀𝐂 − 𝐎𝐎𝐇 + 𝐇𝟐𝐎𝟐 → 𝐀𝐂 − 𝐎𝐇 + 𝐎𝟐 + 𝐇𝟐𝐎 Equation 2. 5
Here AC = activated carbon (granular or powdered)
We can observe that both the mechanisms involve use of H+ ion and HO2- or HO2⦁.
With all of this available information on quenching reaction we decided on an experimental plan
incorporating a parameter signifying quenching – reaction constant k, and another parameter
which was closely connected to reaction mechanism – pH of reacting solution.
According to the reaction mechanisms proposed by Kurniawan et al., 2009 and Bach et al., 2011
the only intermediate chemical species which seemed to be involved in the reaction process
besides GAC, was HO2-. Therefore we proposed a hypothesis where we stated that if the reaction
mechanism was fundamentally dependent on HO2-, we will observe proportional increase in
reaction constant k. To test this hypothesis, we decided to control the pH as pH is a surrogate to
HO2- ion concentration in quenching reaction. The basis of this statement is borne out of the fact
that H2O2 being an acid always remains in equilibrium with HO2- and H+ according to Equation
2.3.
Furthermore, in order to understand the general principles governing the quenching reaction we
decided to test our hypothesis on different types of GAC. We stood to gain two basic advantages
out of this construct. Firstly, analysis of more data would have allowed us to find common trends
in quenching behavior of GACs. Secondly, it is a good scientific practice to review results based
on varied sources, it eliminates exceptions to a large degree. To implement this experimental
plan we used six different GACs which were commonly in use in the water treatment industry:
ADCAT, Centaur, F-300, Norit GAC-300, HD-3000 and TN-5. Their surface characteristics and
other physical and chemical properties relevant to quenching reaction are discussed in Table 2.
Use of different virgin GACs at different pH values would have, in essence, given us only a
snapshot of the quenching mechanism in the early life of GAC. However, GAC in real life
remains new only for a very short duration in its life span. To counter this imbalance in our
experimental plan we decided to investigate all six GACs with different types of surface
characteristics induced by ageing due to exposure to a specific form of water matrices. We
decided on two types of aged GACs - GAC aged with natural organic matter (NOM) which
occurs commonly in natural lake and river water, and GAC aged with NOM + H2O2 which would
be the case for GAC in a GAC bed contactor in a water treatment plant. The third type of surface
23
was chosen to be unaltered virgin GAC. Finally, virgin, NOM aged and NOM + H2O2 aged GAC
were decided as reactant media for testing our hypothesis.
Given the materials and defined reactant conditions for our hypothesis, we needed to find
concentration of HO2- ion over a range of pH values and obtain k values for H2O2 quenching by
GAC at those given pH values. If the k values from the reaction are found to increase
proportionally with HO2- then our hypothesis will be true and HO2
- will prove to be a
fundamentally important factor in the quenching reaction mechanism. However, if the k values
are found to be independent of HO2- ion concentration then our hypothesis will prove to be false.
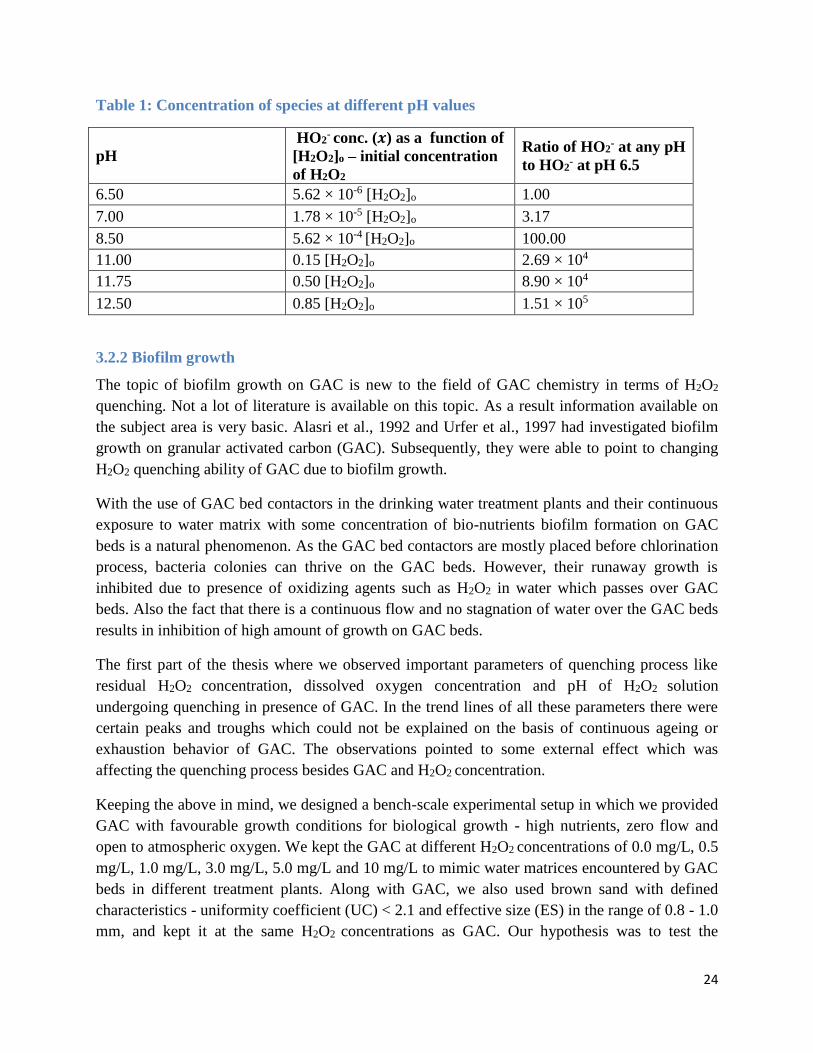
To test our hypothesis six pH values were selected: 6.50, 7.00, 8.50, 11.00, 11.75 and 12.50. pH
values around 11.75, which is also the pKa of hydrogen peroxide (Evans et al., 1949), were
chosen so that we may be able to understand the effect of high HO2- ion concentration on k
values. Criteria for selecting lower pH values around 7.00 was based on observing effect on k
value of the quenching process at pH values which are observed commonly at treatment
facilities.
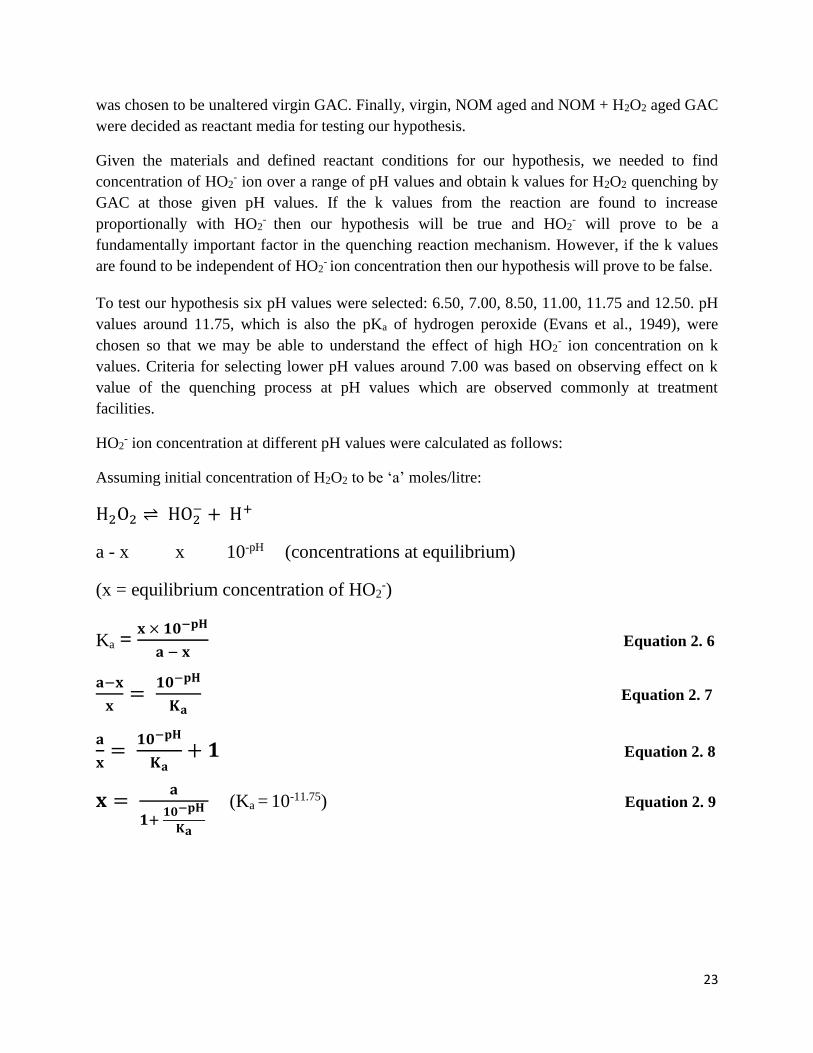
HO2- ion concentration at different pH values were calculated as follows:
Assuming initial concentration of H2O2 to be ‘a’ moles/litre:
H2O2 ⇌ HO2− + H+
a - x x 10-pH (concentrations at equilibrium)
(x = equilibrium concentration of HO2-)
Ka = 𝐱 × 𝟏𝟎−𝐩𝐇
𝐚 − 𝐱 Equation 2. 6
𝐚−𝐱
𝐱=
𝟏𝟎−𝐩𝐇
𝐊𝐚 Equation 2. 7
𝐚
𝐱=
𝟏𝟎−𝐩𝐇
𝐊𝐚+ 𝟏 Equation 2. 8
𝐱 = 𝐚
𝟏+ 𝟏𝟎−𝐩𝐇
𝐊𝐚 (Ka =
10-11.75) Equation 2. 9
24
Table 1: Concentration of species at different pH values
pH
HO2- conc. (𝒙) as a function of
[H2O2]o – initial concentration
of H2O2
Ratio of HO2- at any pH
to HO2- at pH 6.5
6.50 5.62 × 10⁻⁶ [H2O2]o 1.00
7.00 1.78 × 10⁻⁵ [H2O2]o 3.17
8.50 5.62 × 10⁻⁴ [H2O2]o 100.00
11.00 0.15 [H2O2]o 2.69 × 10⁴
11.75 0.50 [H2O2]o 8.90 × 10⁴
12.50 0.85 [H2O2]o 1.51 × 10⁵
3.2.2 Biofilm growth
The topic of biofilm growth on GAC is new to the field of GAC chemistry in terms of H2O2
quenching. Not a lot of literature is available on this topic. As a result information available on
the subject area is very basic. Alasri et al., 1992 and Urfer et al., 1997 had investigated biofilm
growth on granular activated carbon (GAC). Subsequently, they were able to point to changing
H2O2 quenching ability of GAC due to biofilm growth.
With the use of GAC bed contactors in the drinking water treatment plants and their continuous
exposure to water matrix with some concentration of bio-nutrients biofilm formation on GAC
beds is a natural phenomenon. As the GAC bed contactors are mostly placed before chlorination
process, bacteria colonies can thrive on the GAC beds. However, their runaway growth is
inhibited due to presence of oxidizing agents such as H2O2 in water which passes over GAC
beds. Also the fact that there is a continuous flow and no stagnation of water over the GAC beds
results in inhibition of high amount of growth on GAC beds.
The first part of the thesis where we observed important parameters of quenching process like
residual H2O2 concentration, dissolved oxygen concentration and pH of H2O2 solution
undergoing quenching in presence of GAC. In the trend lines of all these parameters there were
certain peaks and troughs which could not be explained on the basis of continuous ageing or
exhaustion behavior of GAC. The observations pointed to some external effect which was
affecting the quenching process besides GAC and H2O2 concentration.
Keeping the above in mind, we designed a bench-scale experimental setup in which we provided
GAC with favourable growth conditions for biological growth - high nutrients, zero flow and
open to atmospheric oxygen. We kept the GAC at different H2O2 concentrations of 0.0 mg/L, 0.5
mg/L, 1.0 mg/L, 3.0 mg/L, 5.0 mg/L and 10 mg/L to mimic water matrices encountered by GAC
beds in different treatment plants. Along with GAC, we also used brown sand with defined
characteristics - uniformity coefficient (UC) < 2.1 and effective size (ES) in the range of 0.8 - 1.0
mm, and kept it at the same H2O2 concentrations as GAC. Our hypothesis was to test the

25
contribution of biofilm to quenching H2O2 by GAC. If biofilm growth was a major contributor to
quenching H2O2 in aged GAC, then with sufficient growth of biofilm on sand we should be able
to see similar amount of quenching between biofilm covered sand and biofilm covered GAC.
Observations showing similar quenching results for sand and GAC would prove our hypothesis
to be correct, else our hypothesis would stand rejected.
3.3 Materials and methods
The properties of GAC used in the bench scale test for analyzing first order kinetic reaction
constant k for quenching reaction between H2O2 and GAC are listed in Table 2. Information was
compiled using product release from companies and works of Li et al., 2013.
Table 2: GAC properties
GAC
Type
Relative
Density
(g/mL)
Iodine
No.
(mg/g)
Moisture
(% by
wt)
Effective
Size
(mm)
Uniformity
Coefficient
US
Sieve
Size
Manufacturer
HD
3000 0.38 500 8 0.7 – 0.9 2.1 (max) 8X30 Norit
Centaur 0.53 1044 4 0.8 – 1.0 2.1 (max) 8X30 Calgon
F-300 0.56 900 2 0.8 – 1.0 2.1 (max) 8X30 Calgon
GAC-
300 0.52 900 2 0.8 – 1.0 2.1 (max) 8X30 Norit
ADCAT 0.485 956 2 0.8 – 1.0 2.1 (max) 8X30 Carbotech
TN-5 0.60 861 2 0.8 – 1.0 2.1 (max) 8X30 Calgon
3.3.1 Bench-scale setup for analyzing effects of pH on kinetics
The general procedure for these bench-scale experiments was to conduct continuously-stirred
batch reactor tests in which the rate of H2O2 decay in the presence of a fixed amount of GAC
was monitored. H2O2 decay was always observed to follow pseudo first-order kinetics (data
presented in Appendix A), so a first-order decay coefficient, k, was obtained from each test. The
decay tests were carried out over a period of five hours, with the concentration of hydrogen
peroxide measured every hour. Each test was done in duplicate to ascertain the reproducibility
and precision of the method. An experimental control was also conducted in the absence of
GAC, to confirm that there was negligible loss of hydrogen peroxide.
In each test, one litre bottles were filled with 490 (±2) mL of water, 10 (± 1) mL of 50 mM
buffer and 0.25 (± 0.005) g of GAC. To initiate the reaction, 50 (±0.5) µl of 30% (w/w)
hydrogen peroxide was injected into the GAC+water+buffer solution. The reaction bottle was
26
then put into an orbital shaker assembly, with an rpm value of 180, for the full duration of the
experiment. This ensured good contact between the entire solution of H2O2 and the GAC
particles. At the end of every hour, the reaction bottle was removed from the shaker assembly
and an aliquot of the solution was removed to measure hydrogen peroxide concentration.
3.3.2 Description of kinetic reaction constant calculation
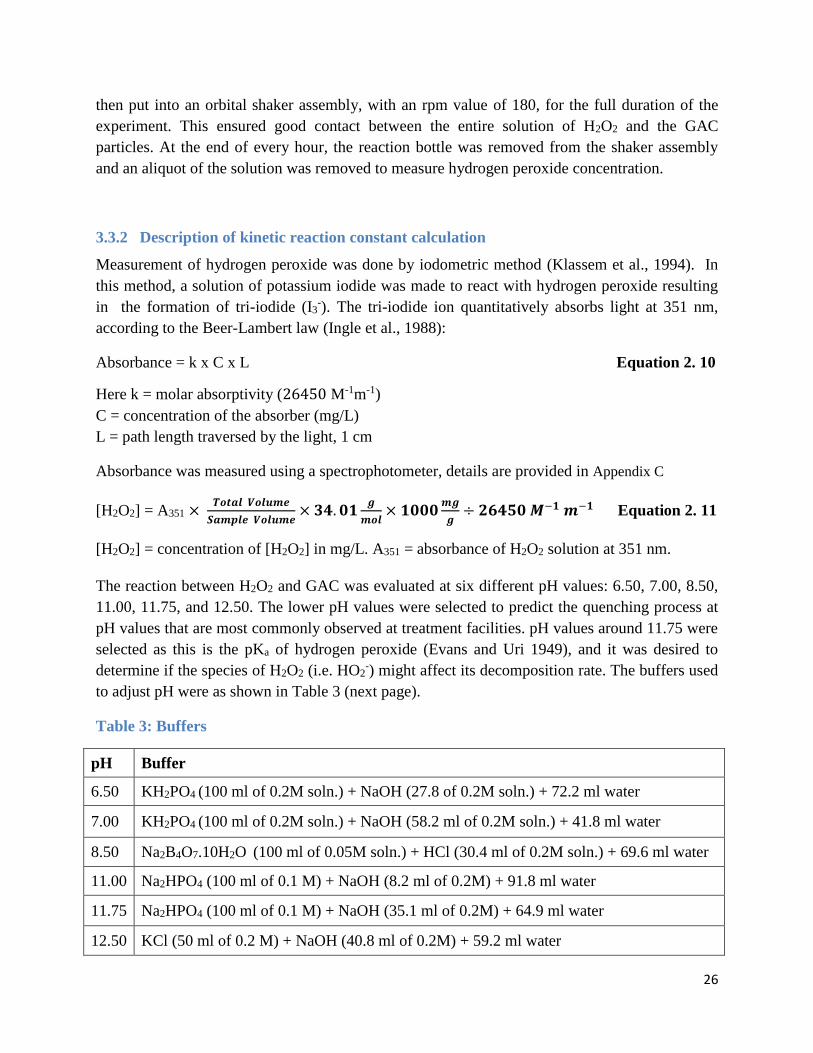
Measurement of hydrogen peroxide was done by iodometric method (Klassem et al., 1994). In
this method, a solution of potassium iodide was made to react with hydrogen peroxide resulting
in the formation of tri-iodide (I3-). The tri-iodide ion quantitatively absorbs light at 351 nm,
according to the Beer-Lambert law (Ingle et al., 1988):
Absorbance = k x C x L Equation 2. 10
Here k = molar absorptivity (26450 M-1m-1)
C = concentration of the absorber (mg/L)
L = path length traversed by the light, 1 cm
Absorbance was measured using a spectrophotometer, details are provided in Appendix C
[H2O2] = A351 × 𝑻𝒐𝒕𝒂𝒍 𝑽𝒐𝒍𝒖𝒎𝒆
𝑺𝒂𝒎𝒑𝒍𝒆 𝑽𝒐𝒍𝒖𝒎𝒆× 𝟑𝟒. 𝟎𝟏
𝒈
𝒎𝒐𝒍× 𝟏𝟎𝟎𝟎
𝒎𝒈
𝒈÷ 𝟐𝟔𝟒𝟓𝟎 𝑴−𝟏 𝒎−𝟏 Equation 2. 11
[H2O2] = concentration of [H2O2] in mg/L. A351 = absorbance of H2O2 solution at 351 nm.
The reaction between H2O2 and GAC was evaluated at six different pH values: 6.50, 7.00, 8.50,
11.00, 11.75, and 12.50. The lower pH values were selected to predict the quenching process at
pH values that are most commonly observed at treatment facilities. pH values around 11.75 were
selected as this is the pKa of hydrogen peroxide (Evans and Uri 1949), and it was desired to
determine if the species of H2O2 (i.e. HO2-) might affect its decomposition rate. The buffers used
to adjust pH were as shown in Table 3 (next page).
Table 3: Buffers
pH Buffer
6.50 KH2PO4 (100 ml of 0.2M soln.) + NaOH (27.8 of 0.2M soln.) + 72.2 ml water
7.00 KH2PO4 (100 ml of 0.2M soln.) + NaOH (58.2 ml of 0.2M soln.) + 41.8 ml water
8.50 Na2B4O7.10H2O (100 ml of 0.05M soln.) + HCl (30.4 ml of 0.2M soln.) + 69.6 ml water
11.00 Na2HPO4 (100 ml of 0.1 M) + NaOH (8.2 ml of 0.2M) + 91.8 ml water
11.75 Na2HPO4 (100 ml of 0.1 M) + NaOH (35.1 ml of 0.2M) + 64.9 ml water
12.50 KCl (50 ml of 0.2 M) + NaOH (40.8 ml of 0.2M) + 59.2 ml water
27
All experiments were conducted at a temp of 220C. Individual graphs (Appendix A) from which
each k value point was obtained point conclusively to a first order reaction between H2O2 and
GAC. Truth of this statement is borne by the fact that modelling kinetic reaction data points on
first order kinetics gives us a correlation value > 0.99 for every k value (Appendix A). And this
was true for the full range of pH values from 6.5 to 12.5.
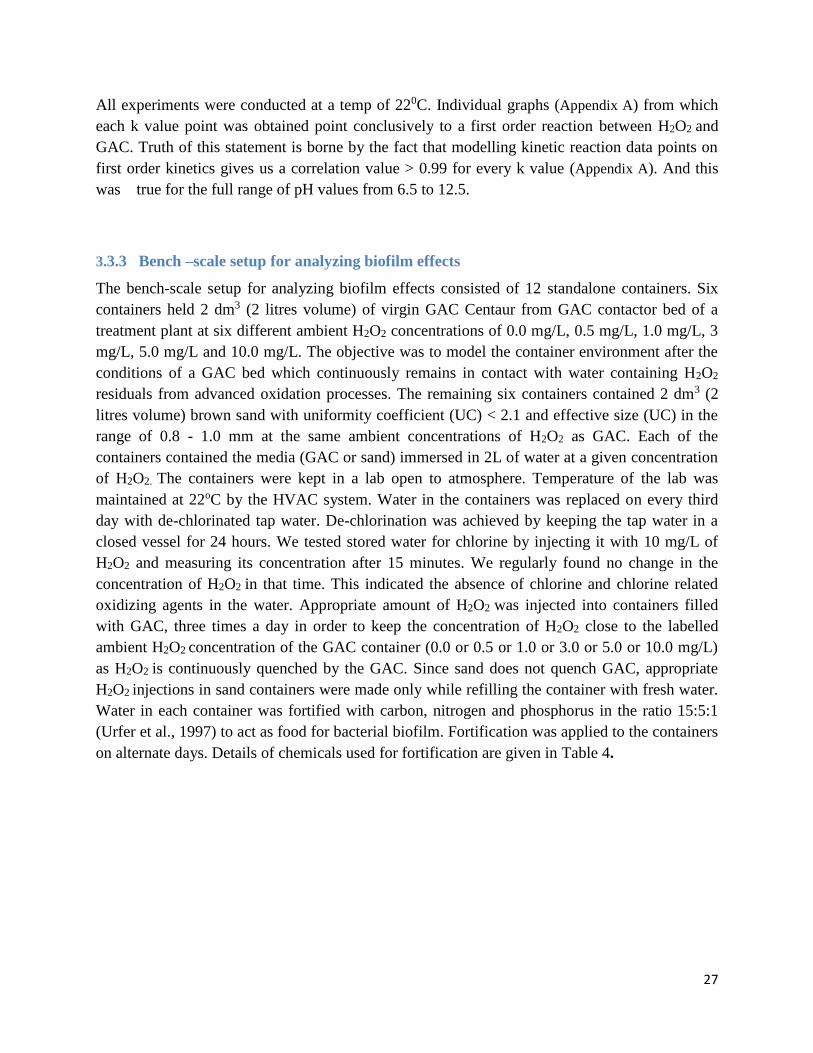
3.3.3 Bench –scale setup for analyzing biofilm effects
The bench-scale setup for analyzing biofilm effects consisted of 12 standalone containers. Six
containers held 2 dm3 (2 litres volume) of virgin GAC Centaur from GAC contactor bed of a
treatment plant at six different ambient H2O2 concentrations of 0.0 mg/L, 0.5 mg/L, 1.0 mg/L, 3
mg/L, 5.0 mg/L and 10.0 mg/L. The objective was to model the container environment after the
conditions of a GAC bed which continuously remains in contact with water containing H2O2
residuals from advanced oxidation processes. The remaining six containers contained 2 dm3 (2
litres volume) brown sand with uniformity coefficient (UC) < 2.1 and effective size (UC) in the
range of 0.8 - 1.0 mm at the same ambient concentrations of H2O2 as GAC. Each of the
containers contained the media (GAC or sand) immersed in 2L of water at a given concentration
of H2O2. The containers were kept in a lab open to atmosphere. Temperature of the lab was
maintained at 22oC by the HVAC system. Water in the containers was replaced on every third
day with de-chlorinated tap water. De-chlorination was achieved by keeping the tap water in a
closed vessel for 24 hours. We tested stored water for chlorine by injecting it with 10 mg/L of
H2O2 and measuring its concentration after 15 minutes. We regularly found no change in the
concentration of H2O2 in that time. This indicated the absence of chlorine and chlorine related
oxidizing agents in the water. Appropriate amount of H2O2 was injected into containers filled
with GAC, three times a day in order to keep the concentration of H2O2 close to the labelled
ambient H2O2 concentration of the GAC container (0.0 or 0.5 or 1.0 or 3.0 or 5.0 or 10.0 mg/L)
as H2O2 is continuously quenched by the GAC. Since sand does not quench GAC, appropriate
H2O2 injections in sand containers were made only while refilling the container with fresh water.
Water in each container was fortified with carbon, nitrogen and phosphorus in the ratio 15:5:1
(Urfer et al., 1997) to act as food for bacterial biofilm. Fortification was applied to the containers
on alternate days. Details of chemicals used for fortification are given in Table 4.
28
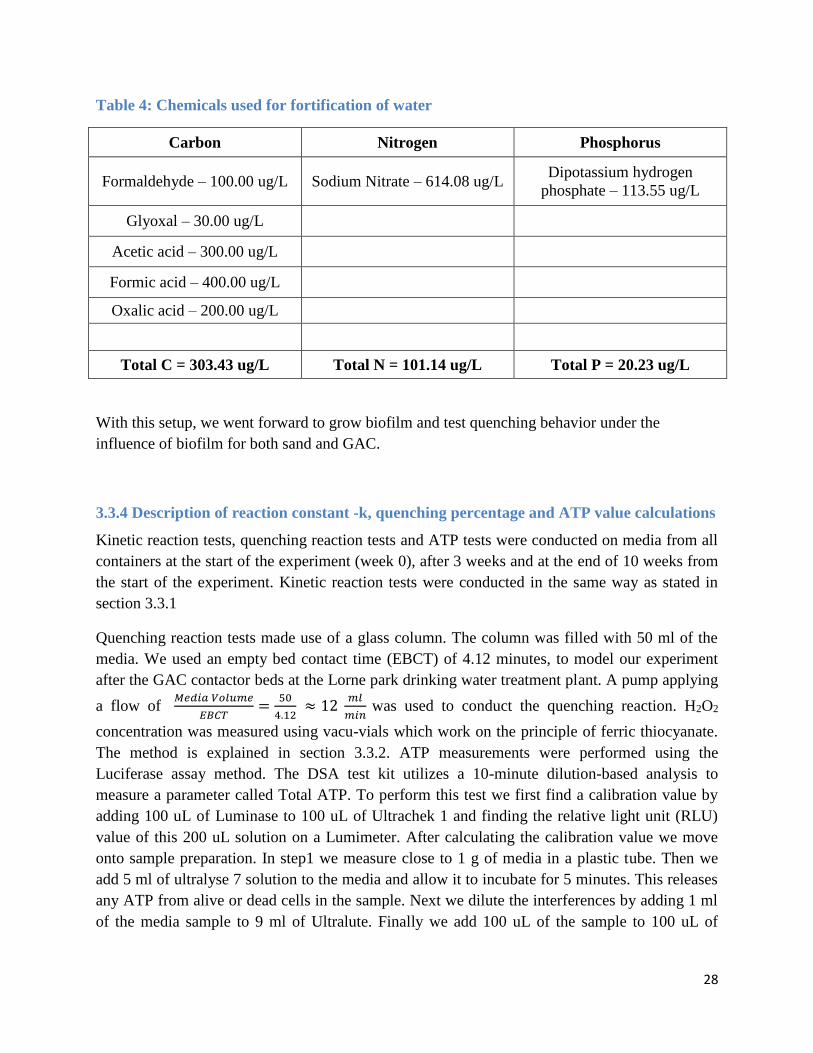
Table 4: Chemicals used for fortification of water
Carbon Nitrogen Phosphorus
Formaldehyde – 100.00 ug/L Sodium Nitrate – 614.08 ug/L Dipotassium hydrogen
phosphate – 113.55 ug/L
Glyoxal – 30.00 ug/L
Acetic acid – 300.00 ug/L
Formic acid – 400.00 ug/L
Oxalic acid – 200.00 ug/L
Total C = 303.43 ug/L Total N = 101.14 ug/L Total P = 20.23 ug/L
With this setup, we went forward to grow biofilm and test quenching behavior under the
influence of biofilm for both sand and GAC.
3.3.4 Description of reaction constant -k, quenching percentage and ATP value calculations
Kinetic reaction tests, quenching reaction tests and ATP tests were conducted on media from all
containers at the start of the experiment (week 0), after 3 weeks and at the end of 10 weeks from
the start of the experiment. Kinetic reaction tests were conducted in the same way as stated in
section 3.3.1
Quenching reaction tests made use of a glass column. The column was filled with 50 ml of the
media. We used an empty bed contact time (EBCT) of 4.12 minutes, to model our experiment
after the GAC contactor beds at the Lorne park drinking water treatment plant. A pump applying
a flow of 𝑀𝑒𝑑𝑖𝑎 𝑉𝑜𝑙𝑢𝑚𝑒
𝐸𝐵𝐶𝑇=
50
4.12 ≈ 12
𝑚𝑙
𝑚𝑖𝑛 was used to conduct the quenching reaction. H2O2
concentration was measured using vacu-vials which work on the principle of ferric thiocyanate.
The method is explained in section 3.3.2. ATP measurements were performed using the
Luciferase assay method. The DSA test kit utilizes a 10-minute dilution-based analysis to
measure a parameter called Total ATP. To perform this test we first find a calibration value by
adding 100 uL of Luminase to 100 uL of Ultrachek 1 and finding the relative light unit (RLU)
value of this 200 uL solution on a Lumimeter. After calculating the calibration value we move
onto sample preparation. In step1 we measure close to 1 g of media in a plastic tube. Then we
add 5 ml of ultralyse 7 solution to the media and allow it to incubate for 5 minutes. This releases
any ATP from alive or dead cells in the sample. Next we dilute the interferences by adding 1 ml
of the media sample to 9 ml of Ultralute. Finally we add 100 uL of the sample to 100 uL of
29
Luminase and find out the relative light units (RLU) value of the 200 uL solution via a
Lumimeter.
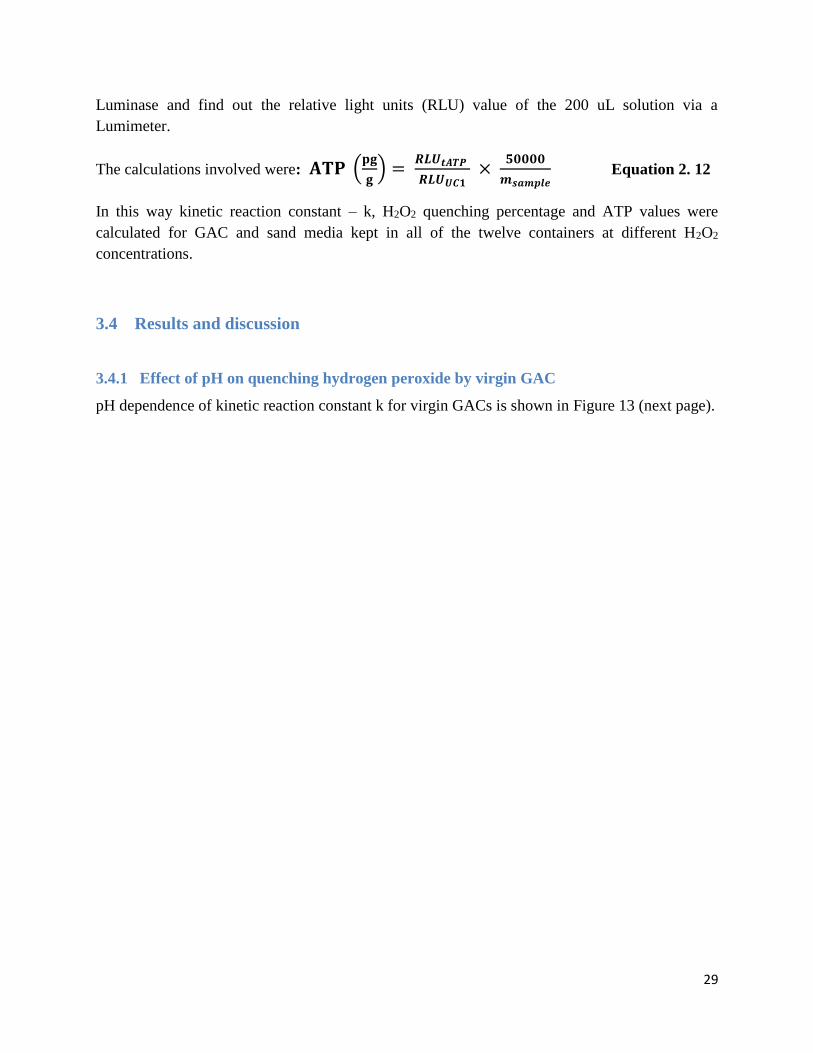
The calculations involved were: 𝐀𝐓𝐏 (𝐩𝐠
𝐠) =
𝑹𝑳𝑼𝒕𝑨𝑻𝑷
𝑹𝑳𝑼𝑼𝑪𝟏 ×
𝟓𝟎𝟎𝟎𝟎
𝒎𝒔𝒂𝒎𝒑𝒍𝒆 Equation 2. 12
In this way kinetic reaction constant – k, H2O2 quenching percentage and ATP values were
calculated for GAC and sand media kept in all of the twelve containers at different H2O2
concentrations.
3.4 Results and discussion
3.4.1 Effect of pH on quenching hydrogen peroxide by virgin GAC
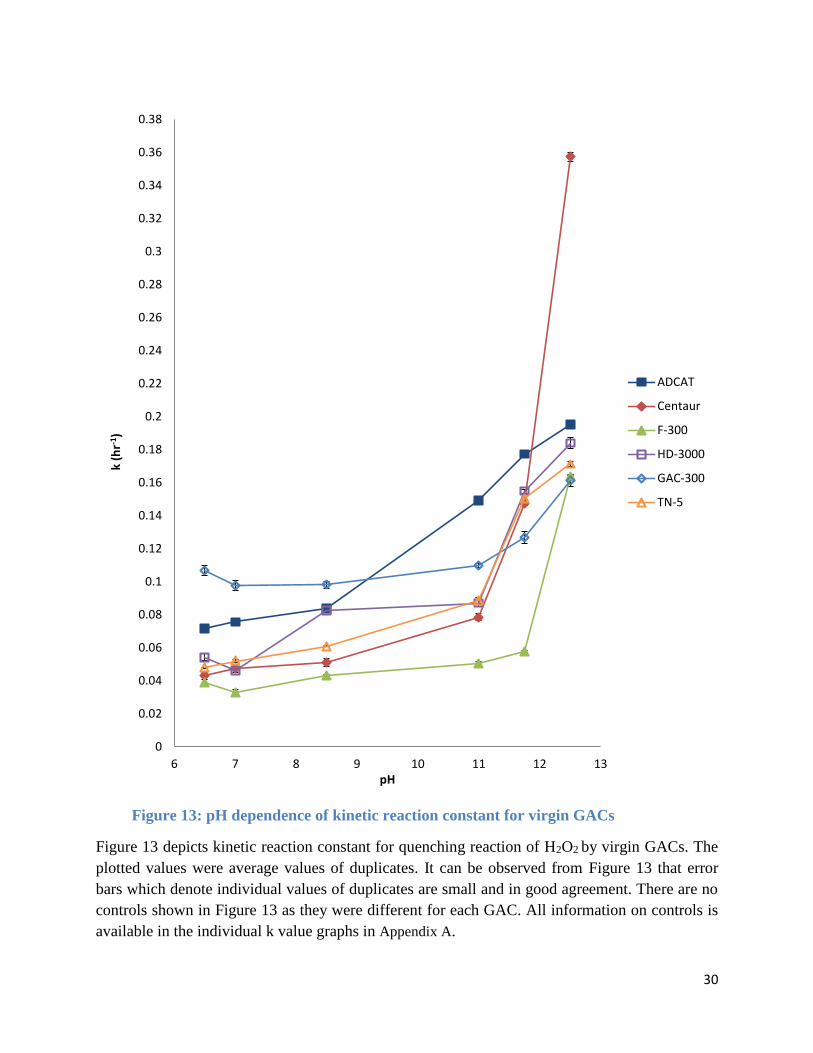
pH dependence of kinetic reaction constant k for virgin GACs is shown in Figure 13 (next page).
30
Figure 13: pH dependence of kinetic reaction constant for virgin GACs
Figure 13 depicts kinetic reaction constant for quenching reaction of H2O2 by virgin GACs. The
plotted values were average values of duplicates. It can be observed from Figure 13 that error
bars which denote individual values of duplicates are small and in good agreement. There are no
controls shown in Figure 13 as they were different for each GAC. All information on controls is
available in the individual k value graphs in Appendix A.
0
0.02
0.04
0.06
0.08
0.1
0.12
0.14
0.16
0.18
0.2
0.22
0.24
0.26
0.28
0.3
0.32
0.34
0.36
0.38
6 7 8 9 10 11 12 13
k (h
r-1)
pH
ADCAT
Centaur
F-300
HD-3000
GAC-300
TN-5
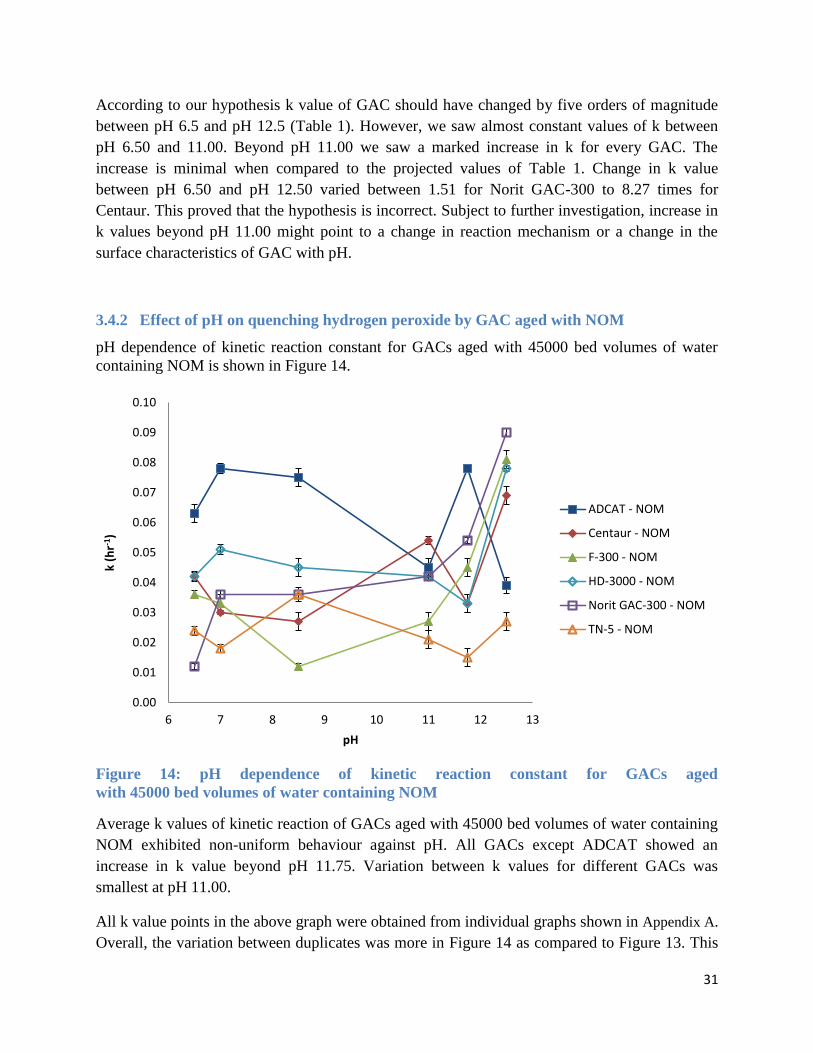
31
According to our hypothesis k value of GAC should have changed by five orders of magnitude
between pH 6.5 and pH 12.5 (Table 1). However, we saw almost constant values of k between
pH 6.50 and 11.00. Beyond pH 11.00 we saw a marked increase in k for every GAC. The
increase is minimal when compared to the projected values of Table 1. Change in k value
between pH 6.50 and pH 12.50 varied between 1.51 for Norit GAC-300 to 8.27 times for
Centaur. This proved that the hypothesis is incorrect. Subject to further investigation, increase in
k values beyond pH 11.00 might point to a change in reaction mechanism or a change in the
surface characteristics of GAC with pH.
3.4.2 Effect of pH on quenching hydrogen peroxide by GAC aged with NOM
pH dependence of kinetic reaction constant for GACs aged with 45000 bed volumes of water
containing NOM is shown in Figure 14.
Figure 14: pH dependence of kinetic reaction constant for GACs aged
with 45000 bed volumes of water containing NOM
Average k values of kinetic reaction of GACs aged with 45000 bed volumes of water containing
NOM exhibited non-uniform behaviour against pH. All GACs except ADCAT showed an
increase in k value beyond pH 11.75. Variation between k values for different GACs was
smallest at pH 11.00.
All k value points in the above graph were obtained from individual graphs shown in Appendix A.
Overall, the variation between duplicates was more in Figure 14 as compared to Figure 13. This
0.00
0.01
0.02
0.03
0.04
0.05
0.06
0.07
0.08
0.09
0.10
6 7 8 9 10 11 12 13
k (h
r-1)
pH
ADCAT - NOM
Centaur - NOM
F-300 - NOM
HD-3000 - NOM
Norit GAC-300 - NOM
TN-5 - NOM
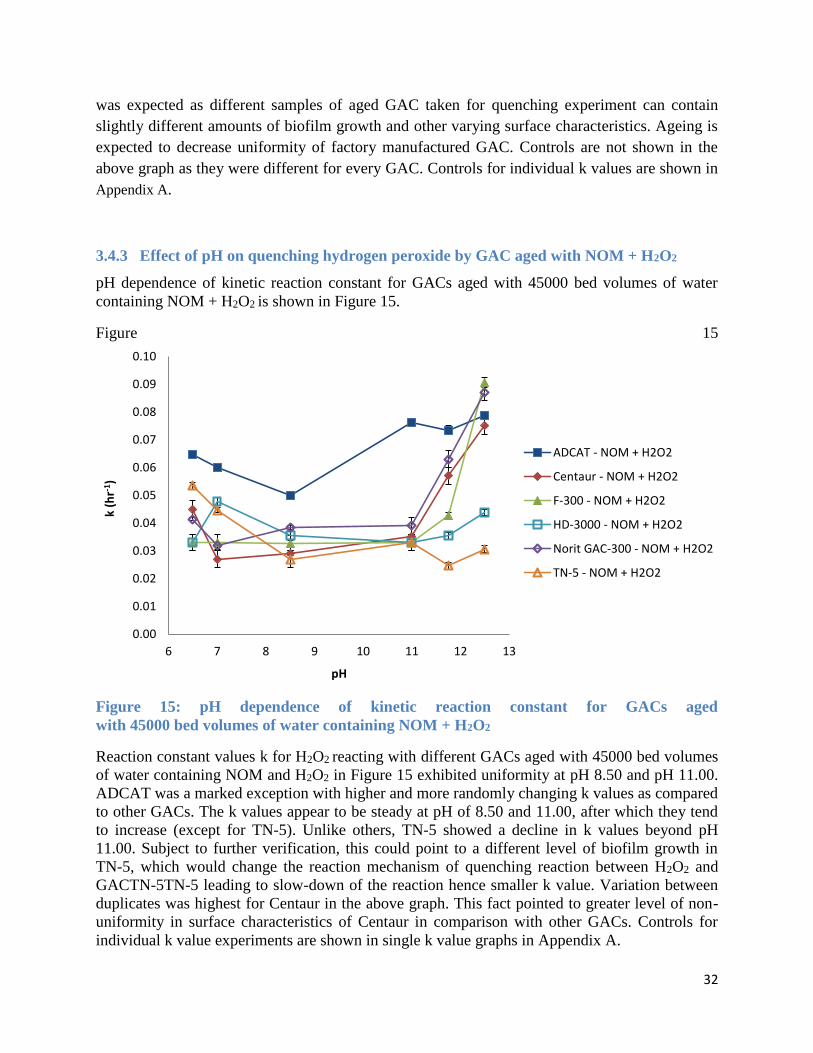
32
was expected as different samples of aged GAC taken for quenching experiment can contain
slightly different amounts of biofilm growth and other varying surface characteristics. Ageing is
expected to decrease uniformity of factory manufactured GAC. Controls are not shown in the
above graph as they were different for every GAC. Controls for individual k values are shown in
Appendix A.
3.4.3 Effect of pH on quenching hydrogen peroxide by GAC aged with NOM + H2O2
pH dependence of kinetic reaction constant for GACs aged with 45000 bed volumes of water
containing NOM + H2O2 is shown in Figure 15.
Figure 15
Figure 15: pH dependence of kinetic reaction constant for GACs aged
with 45000 bed volumes of water containing NOM + H2O2
Reaction constant values k for H2O2 reacting with different GACs aged with 45000 bed volumes
of water containing NOM and H2O2 in Figure 15 exhibited uniformity at pH 8.50 and pH 11.00.
ADCAT was a marked exception with higher and more randomly changing k values as compared
to other GACs. The k values appear to be steady at pH of 8.50 and 11.00, after which they tend
to increase (except for TN-5). Unlike others, TN-5 showed a decline in k values beyond pH
11.00. Subject to further verification, this could point to a different level of biofilm growth in
TN-5, which would change the reaction mechanism of quenching reaction between H2O2 and
GACTN-5TN-5 leading to slow-down of the reaction hence smaller k value. Variation between
duplicates was highest for Centaur in the above graph. This fact pointed to greater level of non-
uniformity in surface characteristics of Centaur in comparison with other GACs. Controls for
individual k value experiments are shown in single k value graphs in Appendix A.
0.00
0.01
0.02
0.03
0.04
0.05
0.06
0.07
0.08
0.09
0.10
6 7 8 9 10 11 12 13
k (h
r-1)
pH
ADCAT - NOM + H2O2
Centaur - NOM + H2O2
F-300 - NOM + H2O2
HD-3000 - NOM + H2O2
Norit GAC-300 - NOM + H2O2
TN-5 - NOM + H2O2

33
3.4.4 Comparison of kinetic reaction constant for virgin GAC, GAC aged with NOM and
GAC aged with NOM + H2O2 at different pH values
Comparison of Virgin GAC, GAC aged with 45000 bed volumes of water containing NOM and
GAC aged with 45000 bed volumes of water containing NOM+H2O2 is shown in Figure 16 (next
page).
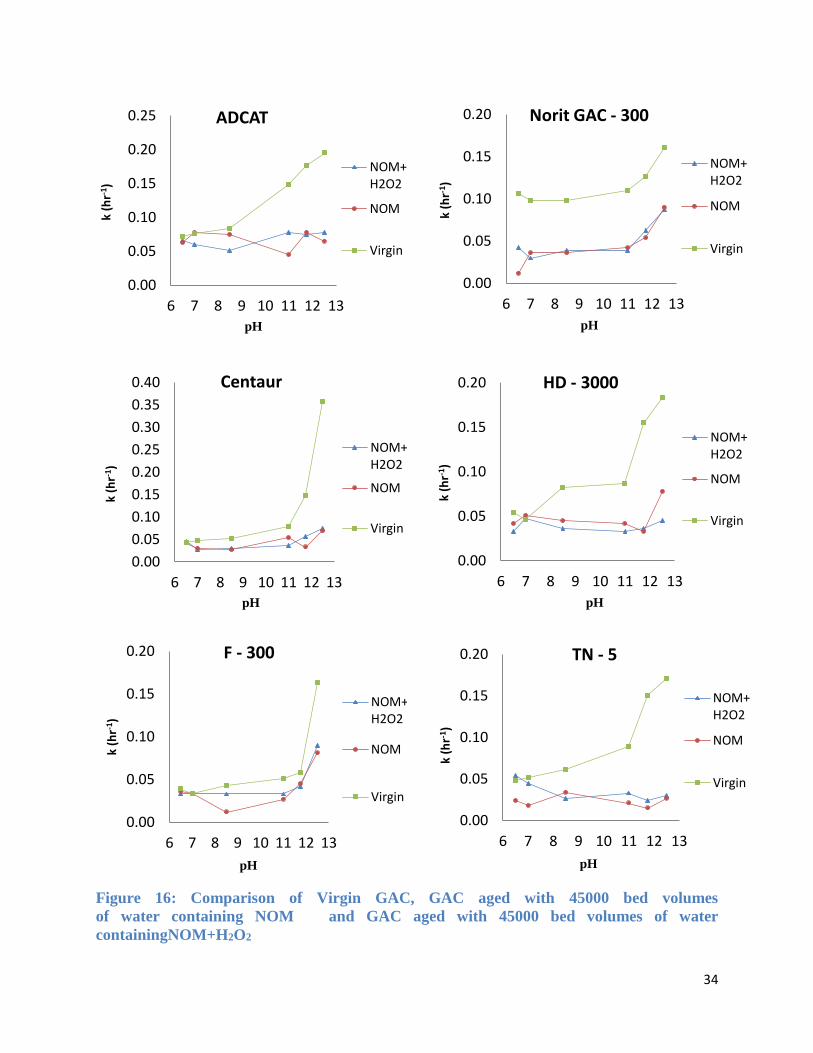
34
Figure 16: Comparison of Virgin GAC, GAC aged with 45000 bed volumes
of water containing NOM and GAC aged with 45000 bed volumes of water
containingNOM+H2O2
0.00
0.05
0.10
0.15
0.20
0.25
6 7 8 9 10 11 12 13
k (h
r-1)
pH
ADCAT
NOM+H2O2
NOM
Virgin
0.00
0.05
0.10
0.15
0.20
0.25
0.30
0.35
0.40
6 7 8 9 10 11 12 13
k (h
r-1)
pH
Centaur
NOM+H2O2
NOM
Virgin
0.00
0.05
0.10
0.15
0.20
6 7 8 9 10 11 12 13
k (h
r-1)
pH
F - 300
NOM+H2O2
NOM
Virgin
0.00
0.05
0.10
0.15
0.20
6 7 8 9 10 11 12 13
k (h
r-1)
pH
Norit GAC - 300
NOM+H2O2
NOM
Virgin
0.00
0.05
0.10
0.15
0.20
6 7 8 9 10 11 12 13
k (h
r-1)
pH
HD - 3000
NOM+H2O2
NOM
Virgin
0.00
0.05
0.10
0.15
0.20
6 7 8 9 10 11 12 13
k (h
r-1)
pH
TN - 5
NOM+H2O2
NOM
Virgin
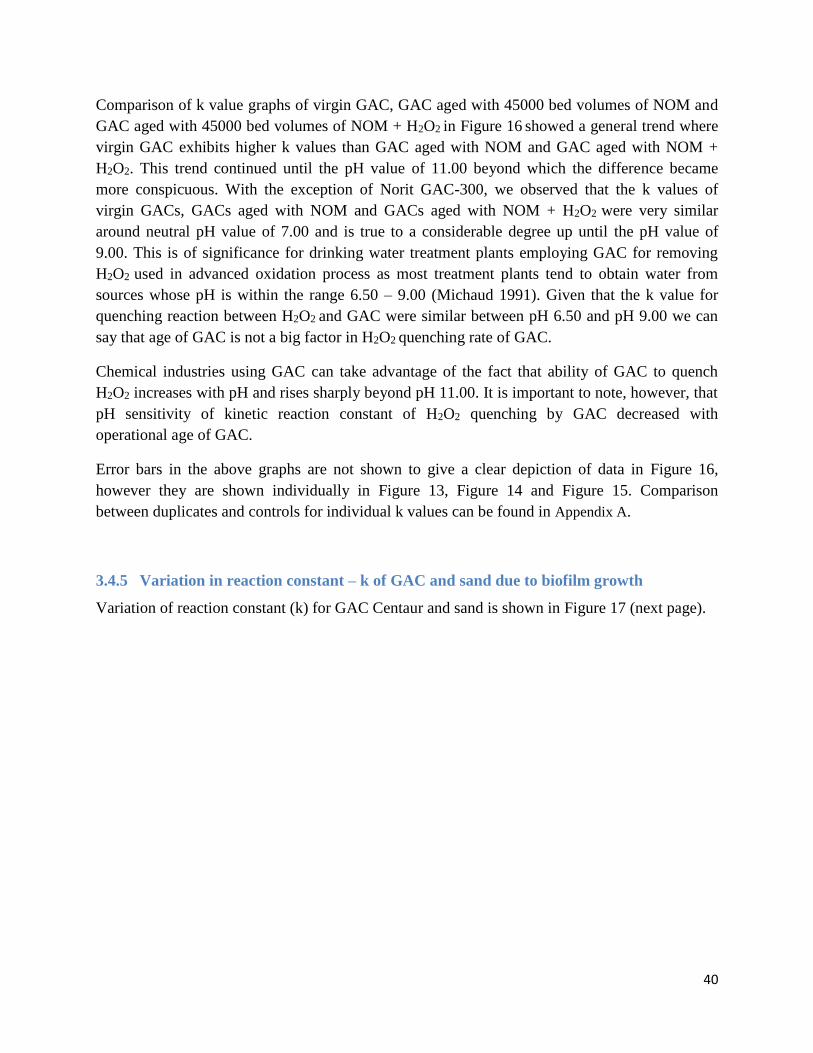
40
Comparison of k value graphs of virgin GAC, GAC aged with 45000 bed volumes of NOM and
GAC aged with 45000 bed volumes of NOM + H2O2 in Figure 16 showed a general trend where
virgin GAC exhibits higher k values than GAC aged with NOM and GAC aged with NOM +
H2O2. This trend continued until the pH value of 11.00 beyond which the difference became
more conspicuous. With the exception of Norit GAC-300, we observed that the k values of
virgin GACs, GACs aged with NOM and GACs aged with NOM + H2O2 were very similar
around neutral pH value of 7.00 and is true to a considerable degree up until the pH value of
9.00. This is of significance for drinking water treatment plants employing GAC for removing
H2O2 used in advanced oxidation process as most treatment plants tend to obtain water from
sources whose pH is within the range 6.50 – 9.00 (Michaud 1991). Given that the k value for
quenching reaction between H2O2 and GAC were similar between pH 6.50 and pH 9.00 we can
say that age of GAC is not a big factor in H2O2 quenching rate of GAC.
Chemical industries using GAC can take advantage of the fact that ability of GAC to quench
H2O2 increases with pH and rises sharply beyond pH 11.00. It is important to note, however, that
pH sensitivity of kinetic reaction constant of H2O2 quenching by GAC decreased with
operational age of GAC.
Error bars in the above graphs are not shown to give a clear depiction of data in Figure 16,
however they are shown individually in Figure 13, Figure 14 and Figure 15. Comparison
between duplicates and controls for individual k values can be found in Appendix A.
3.4.5 Variation in reaction constant – k of GAC and sand due to biofilm growth
Variation of reaction constant (k) for GAC Centaur and sand is shown in Figure 17 (next page).
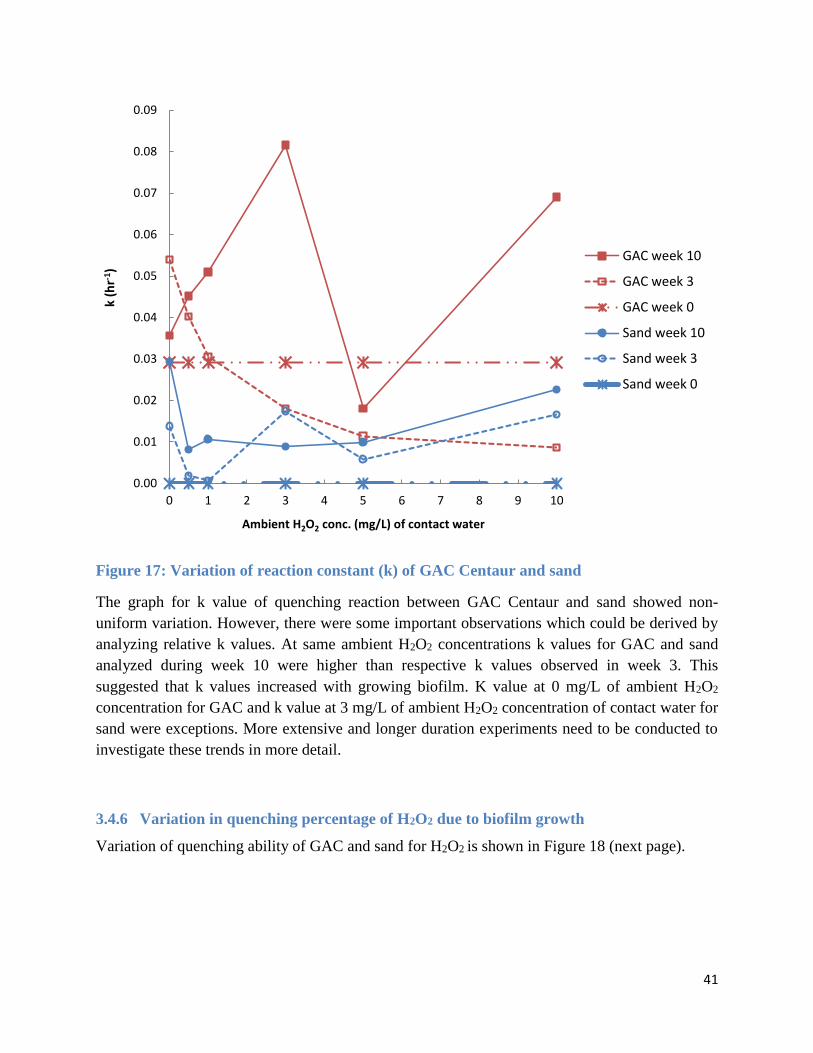
41
Figure 17: Variation of reaction constant (k) of GAC Centaur and sand
The graph for k value of quenching reaction between GAC Centaur and sand showed non-
uniform variation. However, there were some important observations which could be derived by
analyzing relative k values. At same ambient H2O2 concentrations k values for GAC and sand
analyzed during week 10 were higher than respective k values observed in week 3. This
suggested that k values increased with growing biofilm. K value at 0 mg/L of ambient H2O2
concentration for GAC and k value at 3 mg/L of ambient H2O2 concentration of contact water for
sand were exceptions. More extensive and longer duration experiments need to be conducted to
investigate these trends in more detail.
3.4.6 Variation in quenching percentage of H2O2 due to biofilm growth
Variation of quenching ability of GAC and sand for H2O2 is shown in Figure 18 (next page).
0.00
0.01
0.02
0.03
0.04
0.05
0.06
0.07
0.08
0.09
0 1 2 3 4 5 6 7 8 9 10
k (h
r-1)
Ambient H2O2 conc. (mg/L) of contact water
GAC week 10
GAC week 3
GAC week 0
Sand week 10
Sand week 3
Sand week 0
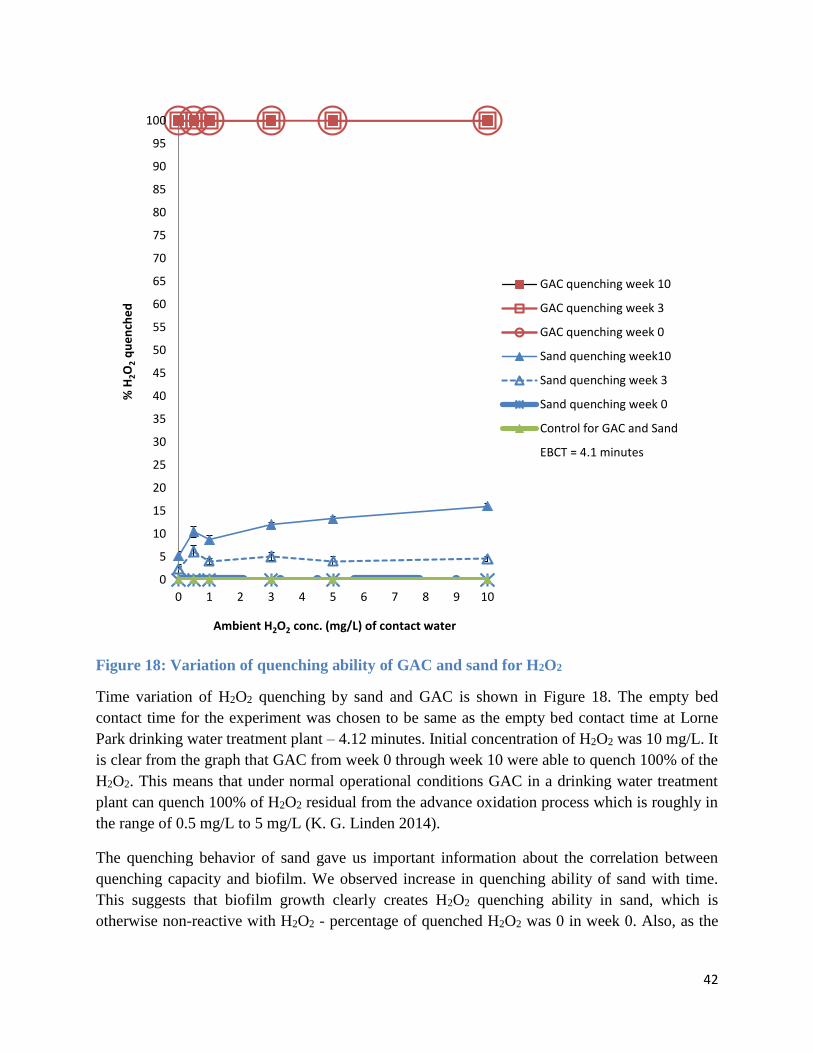
42
Figure 18: Variation of quenching ability of GAC and sand for H2O2
Time variation of H2O2 quenching by sand and GAC is shown in Figure 18. The empty bed
contact time for the experiment was chosen to be same as the empty bed contact time at Lorne
Park drinking water treatment plant – 4.12 minutes. Initial concentration of H2O2 was 10 mg/L. It
is clear from the graph that GAC from week 0 through week 10 were able to quench 100% of the
H2O2. This means that under normal operational conditions GAC in a drinking water treatment
plant can quench 100% of H2O2 residual from the advance oxidation process which is roughly in
the range of 0.5 mg/L to 5 mg/L (K. G. Linden 2014).
The quenching behavior of sand gave us important information about the correlation between
quenching capacity and biofilm. We observed increase in quenching ability of sand with time.
This suggests that biofilm growth clearly creates H2O2 quenching ability in sand, which is
otherwise non-reactive with H2O2 - percentage of quenched H2O2 was 0 in week 0. Also, as the
0
5
10
15
20
25
30
35
40
45
50
55
60
65
70
75
80
85
90
95
100
0 1 2 3 4 5 6 7 8 9 10
%H
2O
2q
ue
nch
ed
Ambient H2O2 conc. (mg/L) of contact water
GAC quenching week 10
GAC quenching week 3
GAC quenching week 0
Sand quenching week10
Sand quenching week 3
Sand quenching week 0
Control for GAC and Sand
EBCT = 4.1 minutes
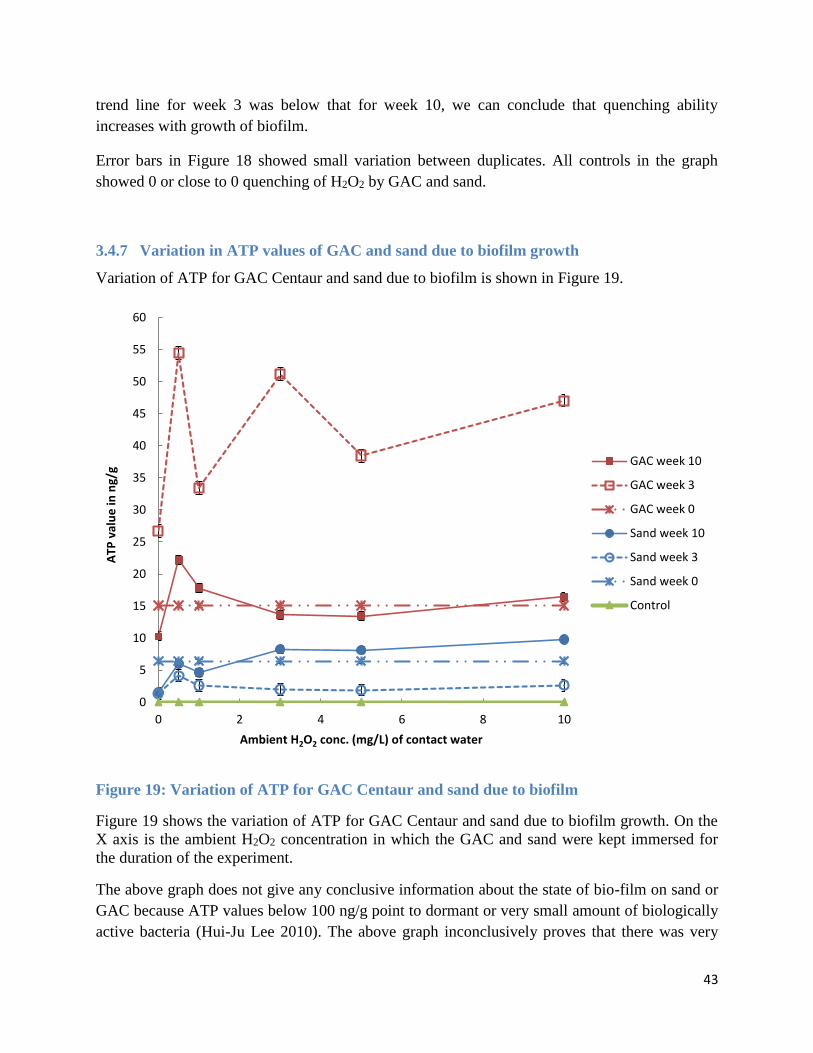
43
trend line for week 3 was below that for week 10, we can conclude that quenching ability
increases with growth of biofilm.
Error bars in Figure 18 showed small variation between duplicates. All controls in the graph
showed 0 or close to 0 quenching of H2O2 by GAC and sand.
3.4.7 Variation in ATP values of GAC and sand due to biofilm growth
Variation of ATP for GAC Centaur and sand due to biofilm is shown in Figure 19.
Figure 19: Variation of ATP for GAC Centaur and sand due to biofilm
Figure 19 shows the variation of ATP for GAC Centaur and sand due to biofilm growth. On the
X axis is the ambient H2O2 concentration in which the GAC and sand were kept immersed for
the duration of the experiment.
The above graph does not give any conclusive information about the state of bio-film on sand or
GAC because ATP values below 100 ng/g point to dormant or very small amount of biologically
active bacteria (Hui-Ju Lee 2010). The above graph inconclusively proves that there was very
0
5
10
15
20
25
30
35
40
45
50
55
60
0 2 4 6 8 10
ATP
val
ue
in n
g/g
Ambient H2O2 conc. (mg/L) of contact water
GAC week 10
GAC week 3
GAC week 0
Sand week 10
Sand week 3
Sand week 0
Control
44
limited biological growth on the GAC in the 10 week period in which the GAC was kept
immersed in water containing a certain concentration of H2O2.
However, there are a few important observations that can be derived from Figure 19 for GAC.
The ATP value for GAC kept at 0 mg/L was always the lowest amongst all other data points of
the set, however, ATP value for GAC kept in 0.5 mg/L H2O2 was the highest. This indicates that
a small concentration of H2O2 is the best dosage to promote growth of biofilm on GAC (Daniel
Urfer 1997). The trend line for ATP values for week 10 was higher than the trend line for week
3. This proves that there was biological growth on GAC between week 3 and week 10.
Behavior of sand in the above graph was quite different from GAC. Sand showed almost
constant ATP value with increasing concentration of H2O2, between 3 mg/L and 10 mg/L H2O2.
This conveys that biofilm growth on sand or any non-adsorbing and non-reactive media is not
affected with higher concentration of H2O2 in the range of 3 mg/L H2O2 to 10 mg/L H2O2. ATP
values for sand in week 10 were higher than in week 3. This again proves that there was non-
zero biofilm growth between week 3 and week 10.
The error bars depict deviation between the ATP values of duplicates. A small difference as was
observed for GAC and sand. This underlines consistency in the observed data. Control values for
GAC and sand gave ATP observations equalling 0.
3.5 Conclusion and recommendations for future work
3.5.1 Reaction constant value - k
We studied the kinetic reaction constant for quenching reaction of H2O2 by six different GACs -
ADCAT, Centaur, F-300, HD-3000, Norit GAC-300 and TN-5 at six different pH values - 6.50,
7.00, 8.50, 11.00, 11.75 and 12.50. We observed that k values for virgin GACs, GACs aged with
45000 bed volumes of water containing NOM and GACs aged with 45000 bed volumes of water
containing NOM + H2O2 exhibited very similar behavior between pH values of 6.50 and 8.50,
with only a couple of exceptions in the form of Norit GAC – 300 and HD-3000. This proves that
rate of quenching with the pH range of 6.50 to 8.50 is pretty much independent of the age of
GAC (unless GAC is totally exhausted). It was also observed that NOM aged and NOM + H2O2
aged GAC showed very similar trends in k value for the full range of pH values.
Beyond the pH value of 11.00 a majority of the aged GACs and all of the virgin GACs showed a
sharp rise in k value. Our hypothesis that k value was dependent on HO2- concentration turned
out to be wrong as the k value did not increase in proportion to increase in HO2- concentration
with pH for any of the GACs. This observation may actually point towards a change in reaction
mechanism or change in surface characteristics of the GAC beyond pH 11.00. The fact that k
value for virgin GAC increases swiftly beyond pH 11.00 could be of use in an industry using
45
virgin GAC as reducing agent for H2O2 as its rate of reducing H2O2. It is important to mention
here that the rise in k value of aged GACs beyond pH value of 11.00 was not as sharp as that for
virgin GAC proving that sensitivity of k value of GAC against pH (beyond pH 11.00) decreases
with its age.
In the subject area of pH dependence of reaction constant k for quenching reaction of H2O2 by
GAC there are a number of questions which need further research:
Analysis of k value trends below pH 6.50, between pH 8.50 and 11.00 and beyond pH
value of 12.50. It may give us useful information about the quenching reaction
mechanism.
Replication of k value experiments using different buffers than the ones used in this study
to find out if there was any interference due to buffers
K value trend analysis of same GACs aged by very different water matrices
K value analysis at H2O2 concentrations higher than 100 mg/L to see if quenching rates
of GAC are dependent on H2O2 concentration
pH dependence of k value for GAC which are close to full exhaustion, and whether k
value trends for such GAC exhibit a rise in k value beyond pH 11.00
3.5.2 Biofilm growth
Experiments involving biofilm growth gave us important information related to quenching of
H2O2 by GAC Centaur as well as sand. Biofilm related experiments were done in three parts –
kinetic reactions, quenching reactions and ATP reactions at three different timelines of week 0,
week 3 and week 10. Our hypothesis that biofilm growth is a contributor to quenching of H2O2
by GAC or any inert media like sand came out to be true. However, further investigations need
to be done to figure out the actual percentage contribution of biofilm to the quenching process.
An important conclusion from biofilm experiments was that biofilm growth, on an otherwise un-
reactive media - sand, was able to induce H2O2 quenching capacity in the media. This statement
is based on sand observations which showed increasing H2O2 quenching percentages from week
3 to week 10 and also increasing k value between week 3 and week 10. ATP values, however,
did not increase, between week 0 and week 10, to levels that anything conclusive about biofilm
growth could be stated. In conclusion, we can state with a high level of confidence that it is hard
to justify increasing k value and higher quenching percentages if we discount growth of biofilm
on sand. Therefore, in all probability, biofilm was established on sand which had contributed
positively to quenching H2O2.
In case of GAC, the increase in observed k values between week 3 and week 10 does point
towards growing biofilm. The H2O2 quenching percentage for GAC in week 0, week 3 and week
10 was 100% which meant that the quenching experiments were basically redundant. ATP values
46
changed over a small range which means that nothing conclusive can be stated about biofilm
growth on GAC. However, with changing increasing k values between week 0 and week 10, we
can say that a small amount of biofilm growth did take place on the GAC which enhanced the
H2O2 quenching ability of GAC.
The field of biofilm growth on drinking water filter media is open to a number of investigations:
Investigation of methods other than ATP value analysis to establish biofilm growth on
filter media
Use of continuous flow reactors instead of static water containers (as used in this study)
to model biofilm growth in actual GAC beds in treatment plants
Comparative studies on methods which can be employed to enhance biofilm growth
Finding appropriate seed bacteria, which would grow into a biofilm that can mimic bio-
colonies on GAC beds in treatment plants
Characterization of bacteria involved in the eco-system in bio-colonies in GAC beds of
treatment plants

47
3.6 References
Aguinaco, A., Pocostales, J.P. , García-Araya, J.F., and Beltran, F.J., 2011. Decomposition of
hydrogen peroxide in the pesence of activated carbons with different characteristics.
Journal of Chemical Technology & Biotechnology.
Alasri, A., Roques, C. and Michel, G. , 1992. Bactericidal Properties of Peracetic Acid and
Hydrogen Peroxide, Alone and in Combination, Chlorine and Formaldehyde Against .
Bacterial Water Strains 38, no. 7: 635.
Alvarez, P.M., García-Araya , J.F., Beltran, F.J., Giraldez, I., Jaramillo, J., Gómez-Serrano, V.,
2006. The influence of various factors on aqueous ozone decomposition by granular
activated carbons and the development of a mechanistic approach. Carbon 44 (14): 3102–
3112.
American Public Health Association, American Water Works Association, Water Environmental
Federation, APHA-AWWA-WEF, 1998. Standard Methods for the Examination of Water
and Wastewater . Washington D.C.
Bach, A., and Semiat, R., 2011. The role of activated carbon as a catalyst in GAC/iron
oxide/H2O2 oxidation process. Desalination. 273 (1) .
Bielski, B.H.J., Cabelli, D.E., Arudi, R.L., and Ross, A.B., 1985. Reactivity of HO2 / O2(-)
radicals in aqueous solution. (J Phys Chem Ref Data) 14(4):1041–100.
Buxton, G.V., Greenstock, C.L., Helman, W.P., and Ross, A.B., 1988. Critical review of rate
constants for reactions of hydrated electrons, hydrogen atoms and hydroxyl radicals
(HO./O.-) in aqueous solution. J Phys Chem Ref Data, 17(2):513–886 ed.
Calgon-Carbon. Centaur HSL 8X20, 2011. Pittsburgh: Calgon Carbon.
Calgon-Carbon. Filtrasorb 300, 2012. Pittsburgh: Calgon Carbon.
Calgon-Carbon. TN-5 8X30, 2011. Pittsburgh: Calgon Carbon.
Campbell, J.E., and Kimmick, R.L., 1966. Effect of 3% Hydrogen Peroxide on viability of
Serratia Marcescens. (Journal Bacteriology) 91:3:925.
Castro, C.S., Oliveira, L.C.A., and Guerreiro, M.C., 2009. Effect of hydrogen treatment on the
catalytic activity of iron oxide based materials dispersed over activated carbon:
investigations toward hydrogen peroxide decomposition. Catalysis Letters.
Cotton, C., Jousset, S., Linden, K., and Collins, J., 2010. Applying UV-AOP at an existing WTP:
effects on disinfection strategy and DBP formation. (AWWA WQTC).

48
Crittenden, J.C., Hu, S., Hand, J.W., Green, S.A., 1999. A kinetic model for H2O2/ UV process
in a completely mixed batch reactor. Water Research 33(10): 2315.
Dotson, A., Corwin, C., Rowley, C., Downs, M. and Linden, K., 2010. Dynamic bench-scale
quenching of H2O2 by GAC. AWWA WQTC (AWWA WQTC).
Elliot, A.J., and Buxton, G.V., 1992. Temperature dependence of the reactions OH + O2(-) and
OH + HO2 in water upto 200 degrees celcius. Faraday Trans .
Evans, M.G., and Uri, N., 1949. The dissociation constant of hydrogen peroxide and electron
afficnity of HO2 radical. Trans Faraday Society: 224-230.
Gogate, P.R., and Pandit, A.B., 2004. A review of imperative technologies for wastewater
treatment I: oxidation technologies at ambient conditions. Adv Environ Res.
Gomes, H.T., Miranda, S.M., Sampaio, M.J., Silva, A.M.T., and Faria, J.L., 2010. Activated
carbons treated with sulphuric acid: catalysts forcatalytic wet peroxide oxidation. Catal
Today, 151(1-2): 153 - 8 ed.
Granular activated carbon used as catalyst or catalyst support, 1987. Calgon Carbon Corporation.
Hage, R., and Lienke, A., 2006 Applications of transition-metal catalysts to textile and wood-
pulp bleaching. Angew Chem Int Ed.
Huang, H.H., Lu, M.C., Chen, J.N., Lee, C.T., 2003. Catalytic decomposition of hydrogen
peroxide and 4-chlorophenol in the presence of modified activated carbons. Chemosphere
51 , no. 9: 935–943.
Ingle, J. D. J., Crouch, S. R., 1988. Spectrochemical Analysis. New Jersey: Prentice Hall.
Khalil, L.B., Girgis, B.S., and Tawfik, T.A., 2001. Decomposition of H2O2 on activated carbon
obtained from olive stones. Journal of Chemical Technology and Biotechnology.
Klassem, N., Marchington, D., McGowan, H., 1994. H2O2 determination by I3(-) method and
by KMnO4 titration. 66, 2921-2925.
Koppenol, W.H., Butler, J., and Van Leeuwen, J.W., 1978. The Haber-Weiss cycle.
Photochemistry Photobiology, 28(4–5):655–8 ed.
Krejci, D., Woschnak, A., Scharlemann, C., Ponweiser, C., 2011. Hydrogen Peroxide
Decomposition for Micro Propulsion: Simulation and Experimental Verification. ASEE.
Kurniawan, T.A., and Lo, W.H., 2009. Removal of refractory compounds from stable landfill
leachate using an integrated H2O2 oxidation treatment and GAC adsorption treatment.
Water Research 43, no. 16: 4079 - 4091.

49
Lee, H.J., Ho, M.R., Bhuwan, M., Hsu, C.Y., Huang, M.S., Peng, H.L., Chang, H.Y., 2010.
Enhancing ATP-based bacteria and biofilm detection by enzymatic pyrophosphate
regeneration. Analytical Biochemistry.
Lucking, F., Koser, H., Jank, M., and Ritter, A, 1998. Iron powder, graphite and activated carbon
as catalysts for the oxidation of 4- chlorophenol with hydrogen peroxide in aqueous
solution. Water Res, 32(9):2607–14. ed.
Jans, U., and Hoigné, J., 1998. Activated carbon and carbon black catalyzed transformation of
aqueous ozone into OH-radicals. Ozone: Science & Engineering. The Journal of the
International Ozone Association 20: 67-90.
Jones, C.W., 1999. Application of Hydrogen Peroxide and Derivatives. The Royal Society of
Chemistry.
Lide, Dr. C.R.C., 2006. Handbook of Chemistry and Physics. Boca Raton, FL: CRC Press,
Taylor and Francis Group.
Linden, K.G., Mohseni, M., 2014. Comprehensive Water Quality and Purification, Advanced
Oxidation Processes: Applications in Drinking Water Treatment. Earth Systems and
Environmental Science.
Linden, K.G., Sharpless, C.M., Andrews, S.A., Atasi, K.Z., Korategere, V., and Stefan, M.,
2005. Innovative UV Technologies to Oxidize Organic and Organoleptic Chemicals.
London UK: IWA Publishing.
Li, J., 2013. Quenching H2O2 Residuals After UV/ H2O2 Drinking Water Treatment Using
Granular Activated Carbon. Toronto.
McKay, G., Sjelin, B., Chagnon, M., Ishida, K.B., Mezyk, S.B., 2013. Kinetic study of the
reactions between chloramine disinfectants and hydrogen peroxide: temperature
dependence and reaction mechanism. Chemosphere 92 (11): 1417–1422.
Michaud, J.P., 1991. A citizen's guide to understanding and monitoring lakes and streams. Vol.
1. Department of Ecology publications office.
National Institute for Occupational Safety and Health (NIOSH), 2010, Revised March 2012.
NIOSH pocket guide to chemical hazards: hydrogen peroxide.
Norit. GAC 300, 2013. Billerica: Norit.
Norit. Hydrodarco 3000, 2013. Billerica: Norit.
Ontario, Legislative Assembly of. Safe Drinking Water Act 2002. (Govt. of Ontario) 2002.
Philippe, S., and Figueiredo, J.L., 2009. Carbon Materials for Catalysis. Wiley.
50
Raffellini, S., Schenk, M., Guerrero, S., and Alzamora, S.M., 2011. Kinetics of Escherichia coli
inactivation employing hydrogen peroxide at varying temperatures, pH and
concentration. (Food Control) 22(6):920-32.
Rebeiro, R.S., Silva, A.M.T., Figueiredo, J.L., Faria, J.L., and Gomes, H.T., 2012. The influence
of stucture and surface chemistry of carbon materials on the decomposition of hydrogen
peroxide. Elsevier.
Rey, A., Zazo, J.A., Casas, J.A., Bahamonde, A. and Rodriguez, J.J., 2011. Influence of the
structural and surface characteristics of activated carbon on the catalytic decomposition
of hydrogen peroxide. Applied Catalysis A, General 402, 146–155 ed.
Robinson, R.A., and Stokes, R.H., 1968. Electrolyte solution. London: Butterworths.
Schlegel, H.G., 1977. Aeration without Air: Oxygen supply by hydrogen peroxide.
Biotechnology Bioengineering.
Skibinski, B., Müller, S., Uhl, W., 2009. Removal of free and combined chlorine at GAC
surfaces and impact on pool water quality. Swimming Pool & Spa International
Conference. London: PWTAG.
Suidan, M.T., Sneyink, V.L., Schmitz, R.A., 1977. Reduction of aqueous free chlorine with
granular activated carbon-pH and temperature effects. Environmental Science &
Technology 11 (8): 785-789.
Urfer, D., Huck, P.M., 1997. Effect of Hydrogen Peroxide on Biologically Active Filters. Ozone
Science and Engineering.
USATSDR. 2011. Medical Management guideleines for hydrogen peroxide. Atlanta, US.
Watts, M.J., Hofmann, R., Rosenfeldt, E.J. Low-pressure UV/Cl2 for advanced oxidation of taste
and odor. Journal American Water Works Association, n.d.: 104(1), 47-48.
Weinstein, J., and Bielski, B.H.J., 1979. Kinetics of the interaction of perhydroxy and superoxide
radicals with hydrogen peroxide, the Haber Weiss reaction. (Junior American Chemial
Society) 101(1):58–62.
Wells, A.F., 1984. Structural Inorganic Chemistry. Oxford, U.K.: Oxford University Press.
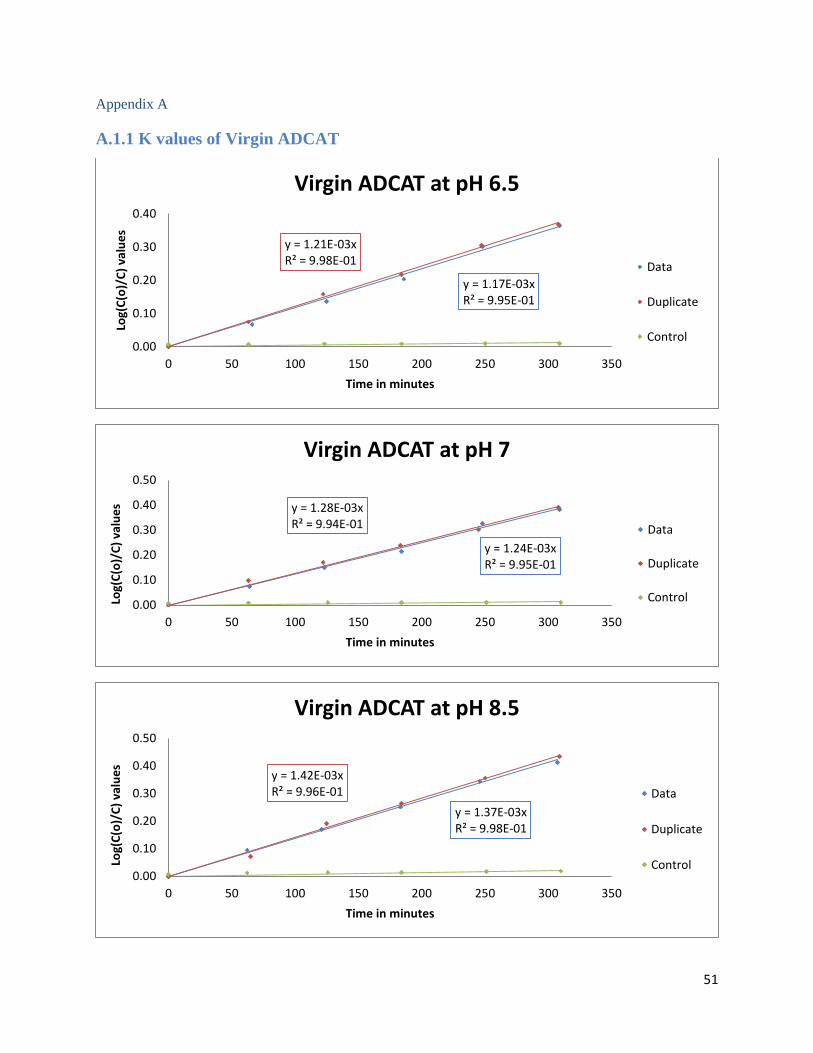
51
Appendix A
A.1.1 K values of Virgin ADCAT
y = 1.17E-03xR² = 9.95E-01
y = 1.21E-03xR² = 9.98E-01
0.00
0.10
0.20
0.30
0.40
0 50 100 150 200 250 300 350
Log(
C(o
)/C
) va
lue
s
Time in minutes
Virgin ADCAT at pH 6.5
Data
Duplicate
Control
y = 1.24E-03xR² = 9.95E-01
y = 1.28E-03xR² = 9.94E-01
0.00
0.10
0.20
0.30
0.40
0.50
0 50 100 150 200 250 300 350
Log(
C(o
)/C
) va
lue
s
Time in minutes
Virgin ADCAT at pH 7
Data
Duplicate
Control
y = 1.37E-03xR² = 9.98E-01
y = 1.42E-03xR² = 9.96E-01
0.00
0.10
0.20
0.30
0.40
0.50
0 50 100 150 200 250 300 350
Log(
C(o
)/C
) va
lue
s
Time in minutes
Virgin ADCAT at pH 8.5
Data
Duplicate
Control

52
y = 2.45E-03xR² = 9.99E-01
y = 2.52E-03xR² = 9.98E-01
0.0
0.2
0.4
0.6
0.8
1.0
0 50 100 150 200 250 300 350
Log(
C(o
)/C
) va
lue
s
Time in minutes
Virgin ADCAT at pH 11
Data
Duplicate
Control
y = 2.98E-03xR² = 1.00E+00
y = 2.93E-03xR² = 9.98E-01
0.0
0.2
0.4
0.6
0.8
1.0
0 50 100 150 200 250 300 350
Log(
C(o
)/C
) va
lue
s
Time in minutes
Virgin ADCAT at pH 11.75
Data
Duplicate
Control
y = 3.22E-03xR² = 1.00E+00
y = 3.28E-03xR² = 1.00E+00
0.0
0.2
0.4
0.6
0.8
1.0
1.2
0 50 100 150 200 250 300 350
Log(
C(o
)/C
) va
lue
s
Time in minutes
Data at pH 12.5
Data
Duplicate
Control
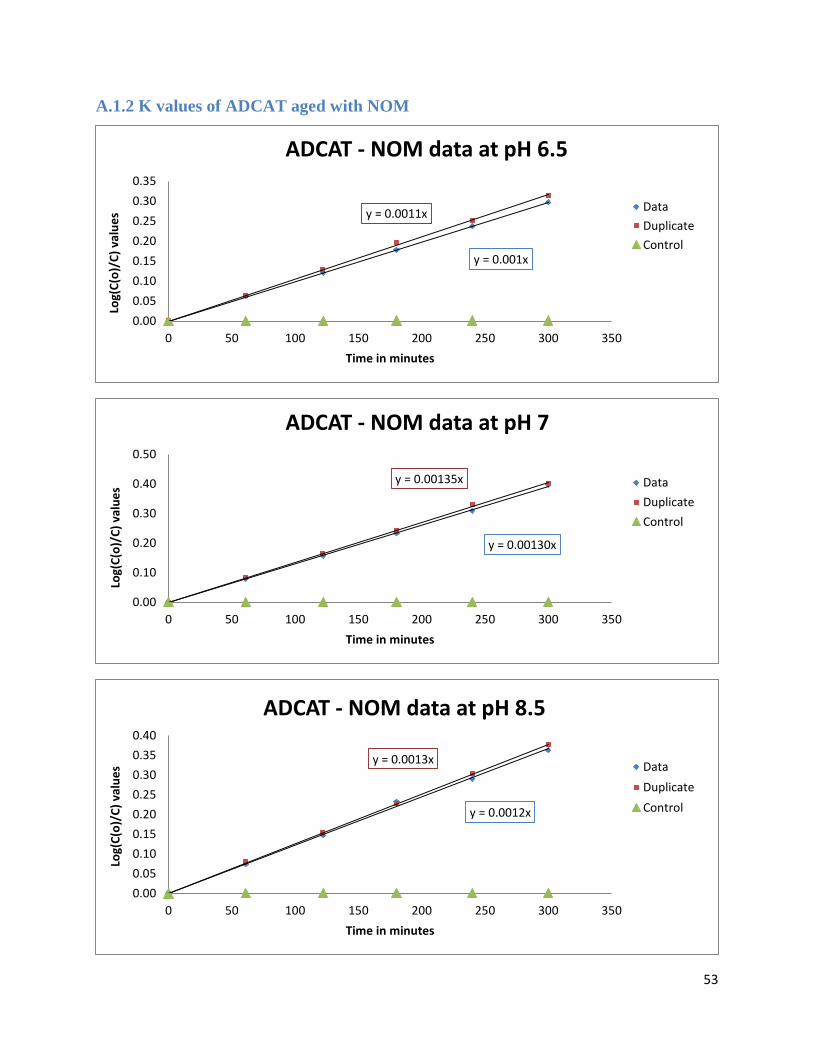
53
A.1.2 K values of ADCAT aged with NOM
y = 0.001x
y = 0.0011x
0.00
0.05
0.10
0.15
0.20
0.25
0.30
0.35
0 50 100 150 200 250 300 350
Log(
C(o
)/C
) va
lue
s
Time in minutes
ADCAT - NOM data at pH 6.5
Data
Duplicate
Control
y = 0.00130x
y = 0.00135x
0.00
0.10
0.20
0.30
0.40
0.50
0 50 100 150 200 250 300 350
Log(
C(o
)/C
) va
lue
s
Time in minutes
ADCAT - NOM data at pH 7
Data
Duplicate
Control
y = 0.0012x
y = 0.0013x
0.00
0.05
0.10
0.15
0.20
0.25
0.30
0.35
0.40
0 50 100 150 200 250 300 350
Log(
C(o
)/C
) va
lue
s
Time in minutes
ADCAT - NOM data at pH 8.5
Data
Duplicate
Control
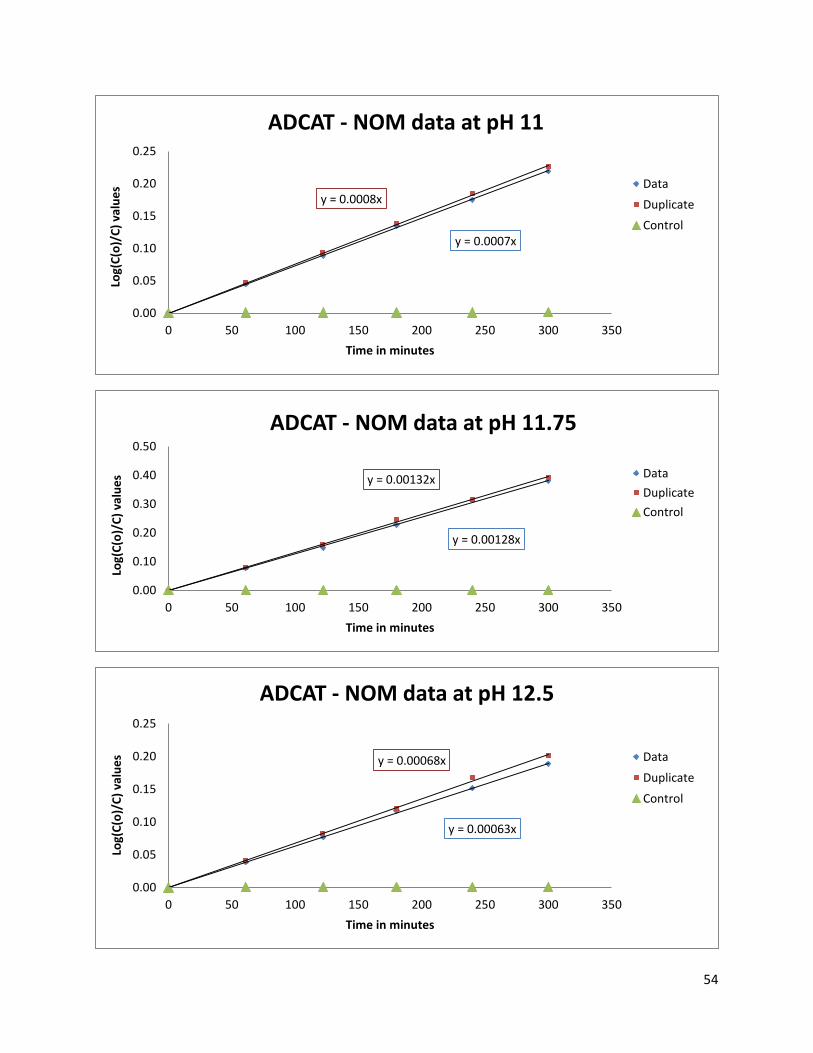
54
y = 0.0007x
y = 0.0008x
0.00
0.05
0.10
0.15
0.20
0.25
0 50 100 150 200 250 300 350
Log(
C(o
)/C
) va
lue
s
Time in minutes
ADCAT - NOM data at pH 11
Data
Duplicate
Control
y = 0.00128x
y = 0.00132x
0.00
0.10
0.20
0.30
0.40
0.50
0 50 100 150 200 250 300 350
Log(
C(o
)/C
) va
lue
s
Time in minutes
ADCAT - NOM data at pH 11.75
Data
Duplicate
Control
y = 0.00063x
y = 0.00068x
0.00
0.05
0.10
0.15
0.20
0.25
0 50 100 150 200 250 300 350
Log(
C(o
)/C
) va
lue
s
Time in minutes
ADCAT - NOM data at pH 12.5
Data
Duplicate
Control
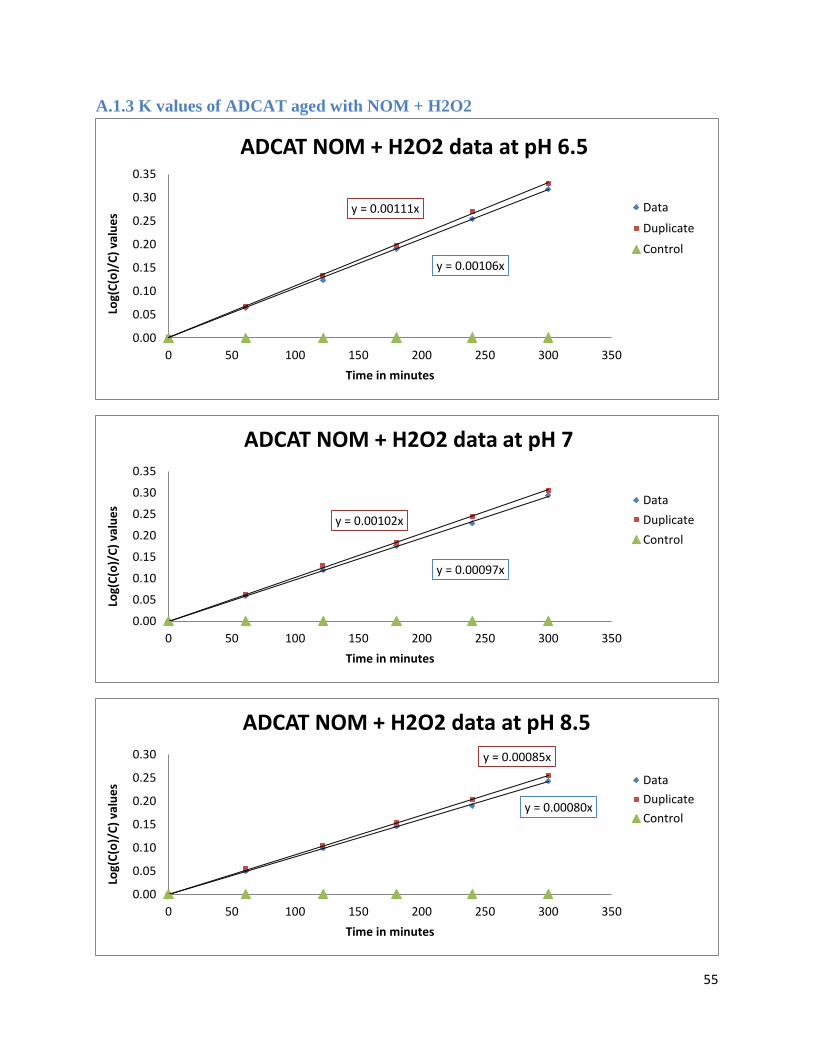
55
A.1.3 K values of ADCAT aged with NOM + H2O2
y = 0.00106x
y = 0.00111x
0.00
0.05
0.10
0.15
0.20
0.25
0.30
0.35
0 50 100 150 200 250 300 350
Log(
C(o
)/C
) va
lue
s
Time in minutes
ADCAT NOM + H2O2 data at pH 6.5
Data
Duplicate
Control
y = 0.00097x
y = 0.00102x
0.00
0.05
0.10
0.15
0.20
0.25
0.30
0.35
0 50 100 150 200 250 300 350
Log(
C(o
)/C
) va
lue
s
Time in minutes
ADCAT NOM + H2O2 data at pH 7
Data
Duplicate
Control
y = 0.00080x
y = 0.00085x
0.00
0.05
0.10
0.15
0.20
0.25
0.30
0 50 100 150 200 250 300 350
Log(
C(o
)/C
) va
lue
s
Time in minutes
ADCAT NOM + H2O2 data at pH 8.5
Data
Duplicate
Control
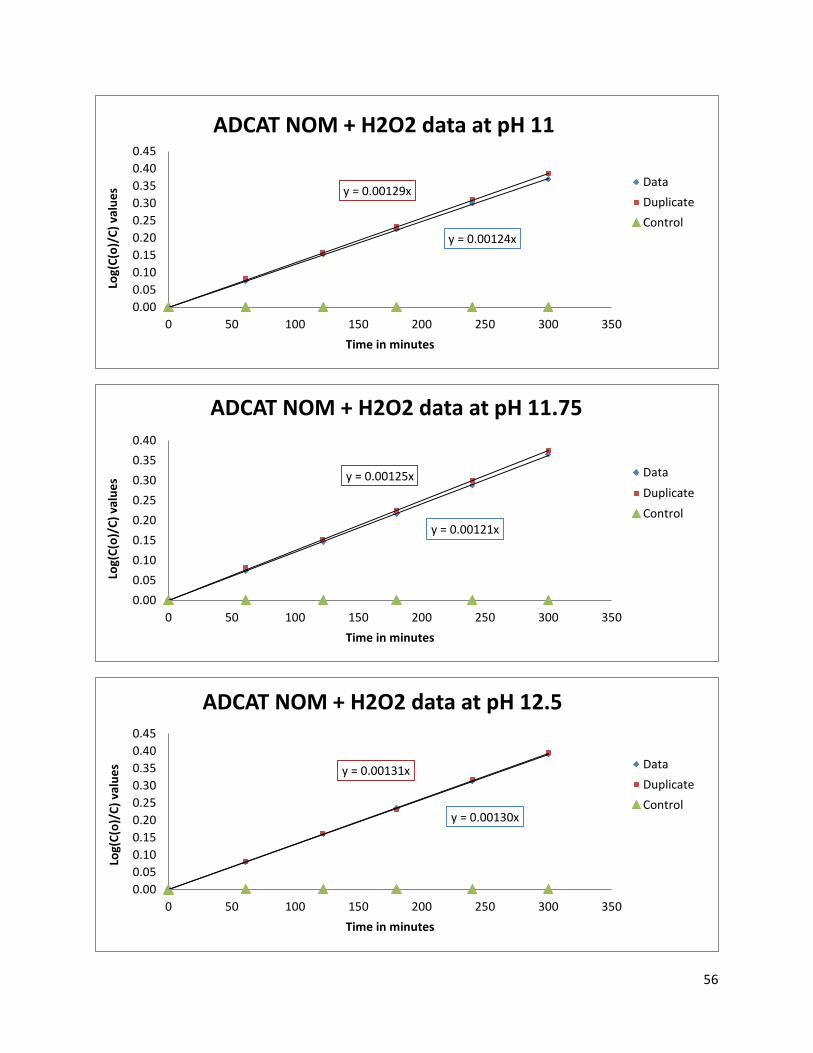
56
y = 0.00124x
y = 0.00129x
0.00
0.05
0.10
0.15
0.20
0.25
0.30
0.35
0.40
0.45
0 50 100 150 200 250 300 350
Log(
C(o
)/C
) va
lue
s
Time in minutes
ADCAT NOM + H2O2 data at pH 11
Data
Duplicate
Control
y = 0.00121x
y = 0.00125x
0.00
0.05
0.10
0.15
0.20
0.25
0.30
0.35
0.40
0 50 100 150 200 250 300 350
Log(
C(o
)/C
) va
lue
s
Time in minutes
ADCAT NOM + H2O2 data at pH 11.75
Data
Duplicate
Control
y = 0.00130x
y = 0.00131x
0.00
0.05
0.10
0.15
0.20
0.25
0.30
0.35
0.40
0.45
0 50 100 150 200 250 300 350
Log(
C(o
)/C
) va
lue
s
Time in minutes
ADCAT NOM + H2O2 data at pH 12.5
Data
Duplicate
Control
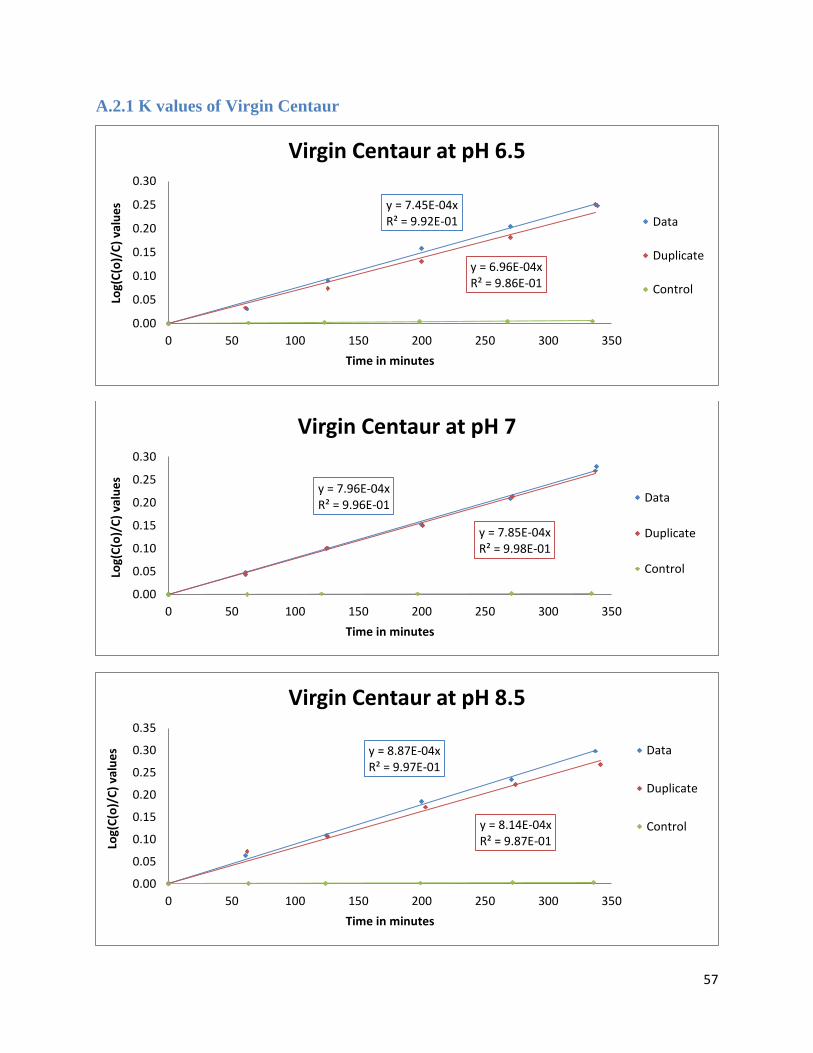
57
A.2.1 K values of Virgin Centaur
y = 7.45E-04xR² = 9.92E-01
y = 6.96E-04xR² = 9.86E-01
0.00
0.05
0.10
0.15
0.20
0.25
0.30
0 50 100 150 200 250 300 350
Log(
C(o
)/C
) va
lue
s
Time in minutes
Virgin Centaur at pH 6.5
Data
Duplicate
Control
y = 7.96E-04xR² = 9.96E-01
y = 7.85E-04xR² = 9.98E-01
0.00
0.05
0.10
0.15
0.20
0.25
0.30
0 50 100 150 200 250 300 350
Log(
C(o
)/C
) va
lue
s
Time in minutes
Virgin Centaur at pH 7
Data
Duplicate
Control
y = 8.87E-04xR² = 9.97E-01
y = 8.14E-04xR² = 9.87E-01
0.00
0.05
0.10
0.15
0.20
0.25
0.30
0.35
0 50 100 150 200 250 300 350
Log(
C(o
)/C
) va
lue
s
Time in minutes
Virgin Centaur at pH 8.5
Data
Duplicate
Control
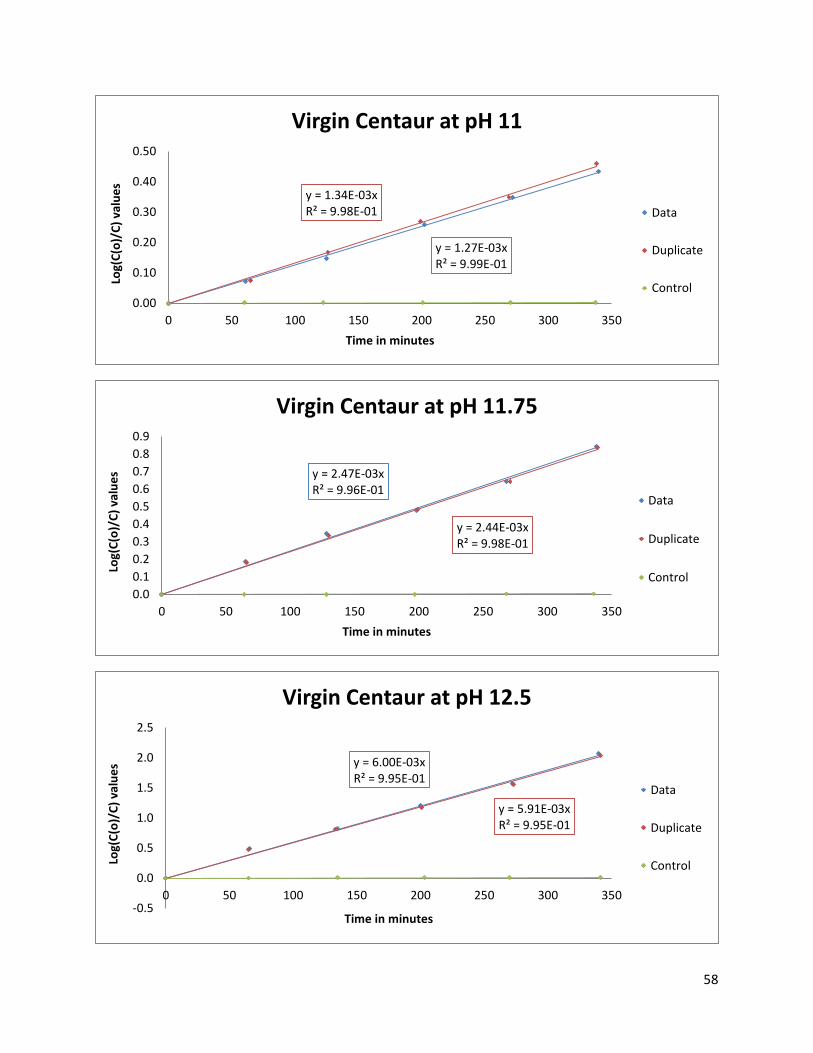
58
y = 1.27E-03xR² = 9.99E-01
y = 1.34E-03xR² = 9.98E-01
0.00
0.10
0.20
0.30
0.40
0.50
0 50 100 150 200 250 300 350
Log(
C(o
)/C
) va
lue
s
Time in minutes
Virgin Centaur at pH 11
Data
Duplicate
Control
y = 2.47E-03xR² = 9.96E-01
y = 2.44E-03xR² = 9.98E-01
0.0
0.1
0.2
0.3
0.4
0.5
0.6
0.7
0.8
0.9
0 50 100 150 200 250 300 350
Log(
C(o
)/C
) va
lue
s
Time in minutes
Virgin Centaur at pH 11.75
Data
Duplicate
Control
y = 6.00E-03xR² = 9.95E-01
y = 5.91E-03xR² = 9.95E-01
-0.5
0.0
0.5
1.0
1.5
2.0
2.5
0 50 100 150 200 250 300 350
Log(
C(o
)/C
) va
lue
s
Time in minutes
Virgin Centaur at pH 12.5
Data
Duplicate
Control
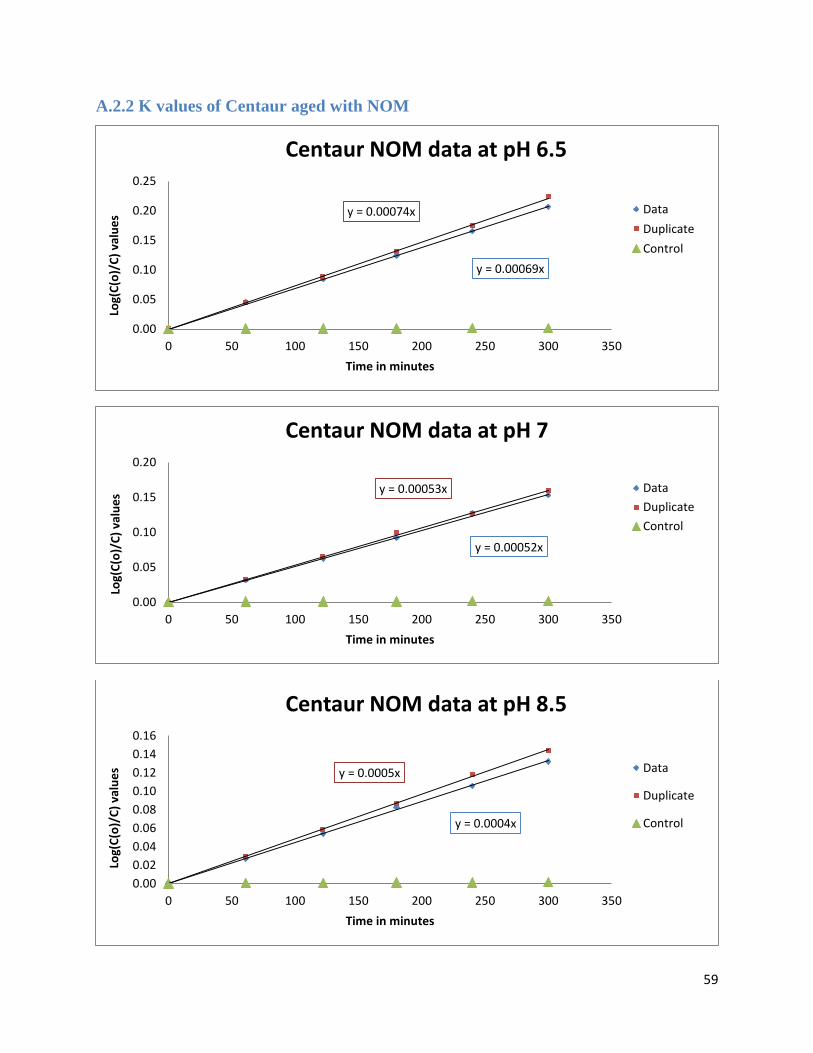
59
A.2.2 K values of Centaur aged with NOM
y = 0.00069x
y = 0.00074x
0.00
0.05
0.10
0.15
0.20
0.25
0 50 100 150 200 250 300 350
Log(
C(o
)/C
) va
lue
s
Time in minutes
Centaur NOM data at pH 6.5
Data
Duplicate
Control
y = 0.00052x
y = 0.00053x
0.00
0.05
0.10
0.15
0.20
0 50 100 150 200 250 300 350
Log(
C(o
)/C
) va
lue
s
Time in minutes
Centaur NOM data at pH 7
Data
Duplicate
Control
y = 0.0004x
y = 0.0005x
0.00
0.02
0.04
0.06
0.08
0.10
0.12
0.14
0.16
0 50 100 150 200 250 300 350
Log(
C(o
)/C
) va
lue
s
Time in minutes
Centaur NOM data at pH 8.5
Data
Duplicate
Control
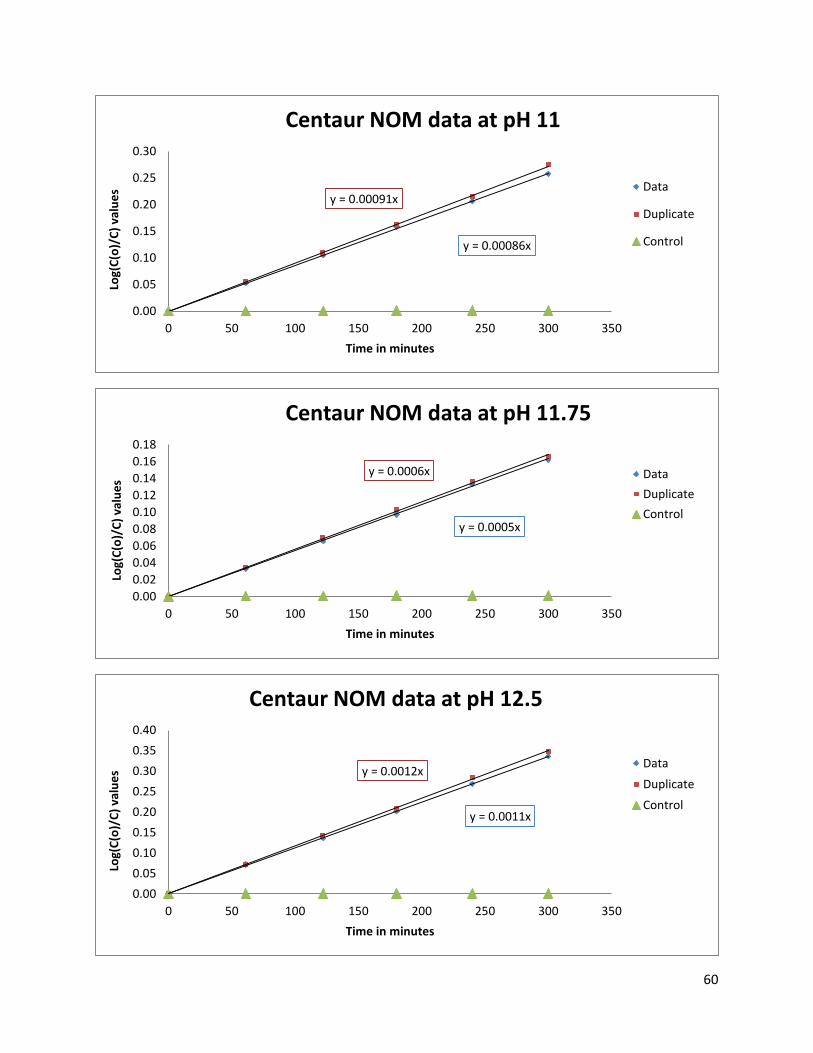
60
y = 0.00086x
y = 0.00091x
0.00
0.05
0.10
0.15
0.20
0.25
0.30
0 50 100 150 200 250 300 350
Log(
C(o
)/C
) va
lue
s
Time in minutes
Centaur NOM data at pH 11
Data
Duplicate
Control
y = 0.0005x
y = 0.0006x
0.00
0.02
0.04
0.06
0.08
0.10
0.12
0.14
0.16
0.18
0 50 100 150 200 250 300 350
Log(
C(o
)/C
) va
lue
s
Time in minutes
Centaur NOM data at pH 11.75
Data
Duplicate
Control
y = 0.0011x
y = 0.0012x
0.00
0.05
0.10
0.15
0.20
0.25
0.30
0.35
0.40
0 50 100 150 200 250 300 350
Log(
C(o
)/C
) va
lue
s
Time in minutes
Centaur NOM data at pH 12.5
Data
Duplicate
Control
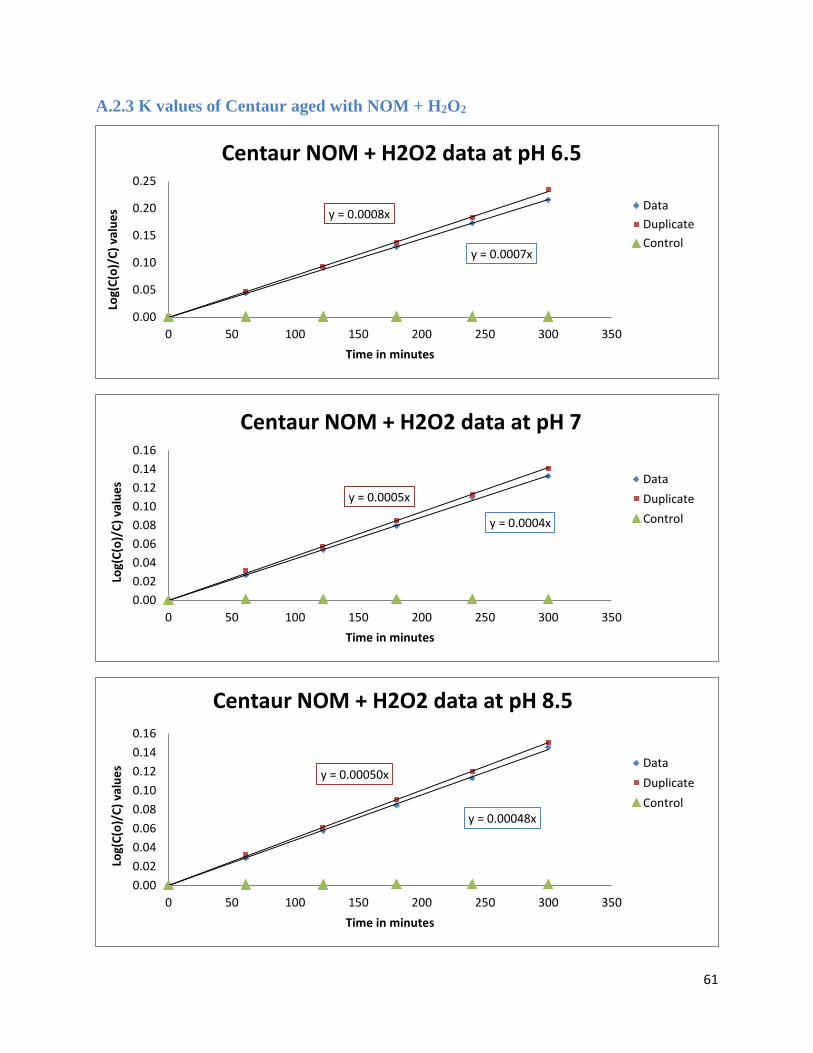
61
A.2.3 K values of Centaur aged with NOM + H2O2
y = 0.0007x
y = 0.0008x
0.00
0.05
0.10
0.15
0.20
0.25
0 50 100 150 200 250 300 350
Log(
C(o
)/C
) va
lue
s
Time in minutes
Centaur NOM + H2O2 data at pH 6.5
Data
Duplicate
Control
y = 0.0004x
y = 0.0005x
0.00
0.02
0.04
0.06
0.08
0.10
0.12
0.14
0.16
0 50 100 150 200 250 300 350
Log(
C(o
)/C
) va
lue
s
Time in minutes
Centaur NOM + H2O2 data at pH 7
Data
Duplicate
Control
y = 0.00048x
y = 0.00050x
0.00
0.02
0.04
0.06
0.08
0.10
0.12
0.14
0.16
0 50 100 150 200 250 300 350
Log(
C(o
)/C
) va
lue
s
Time in minutes
Centaur NOM + H2O2 data at pH 8.5
Data
Duplicate
Control
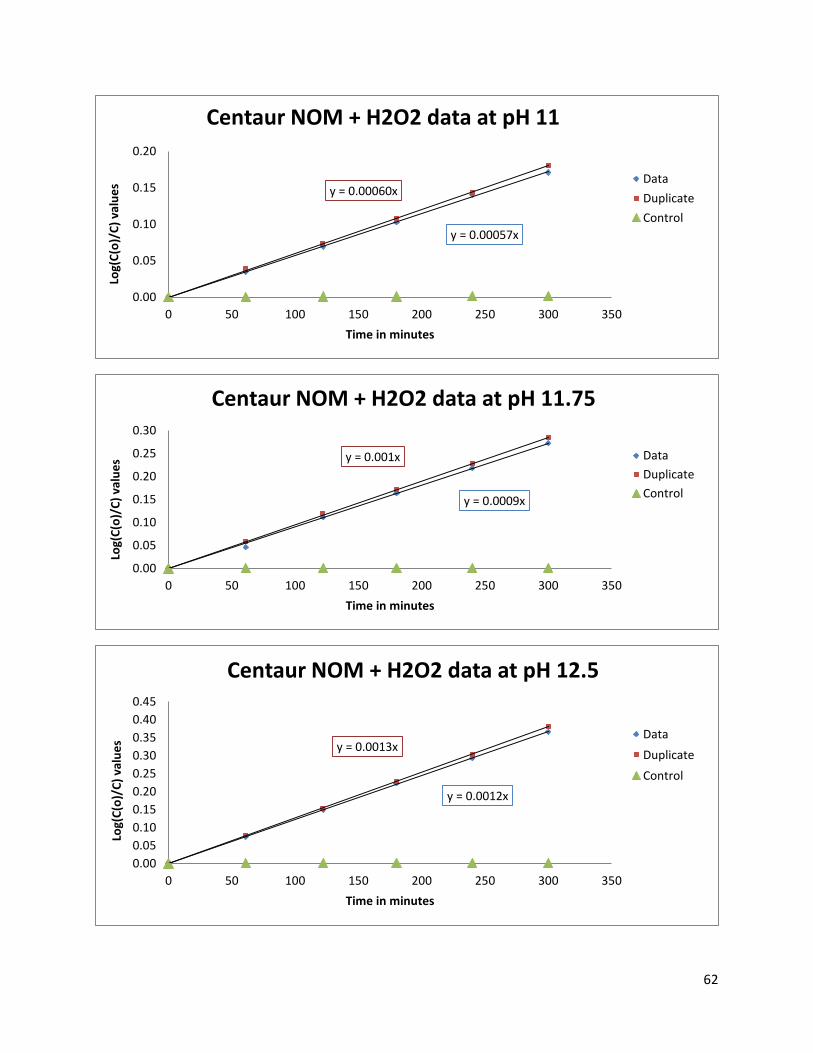
62
y = 0.00057x
y = 0.00060x
0.00
0.05
0.10
0.15
0.20
0 50 100 150 200 250 300 350
Log(
C(o
)/C
) va
lue
s
Time in minutes
Centaur NOM + H2O2 data at pH 11
Data
Duplicate
Control
y = 0.0009x
y = 0.001x
0.00
0.05
0.10
0.15
0.20
0.25
0.30
0 50 100 150 200 250 300 350
Log(
C(o
)/C
) va
lue
s
Time in minutes
Centaur NOM + H2O2 data at pH 11.75
Data
Duplicate
Control
y = 0.0012x
y = 0.0013x
0.00
0.05
0.10
0.15
0.20
0.25
0.30
0.35
0.40
0.45
0 50 100 150 200 250 300 350
Log(
C(o
)/C
) va
lue
s
Time in minutes
Centaur NOM + H2O2 data at pH 12.5
Data
Duplicate
Control
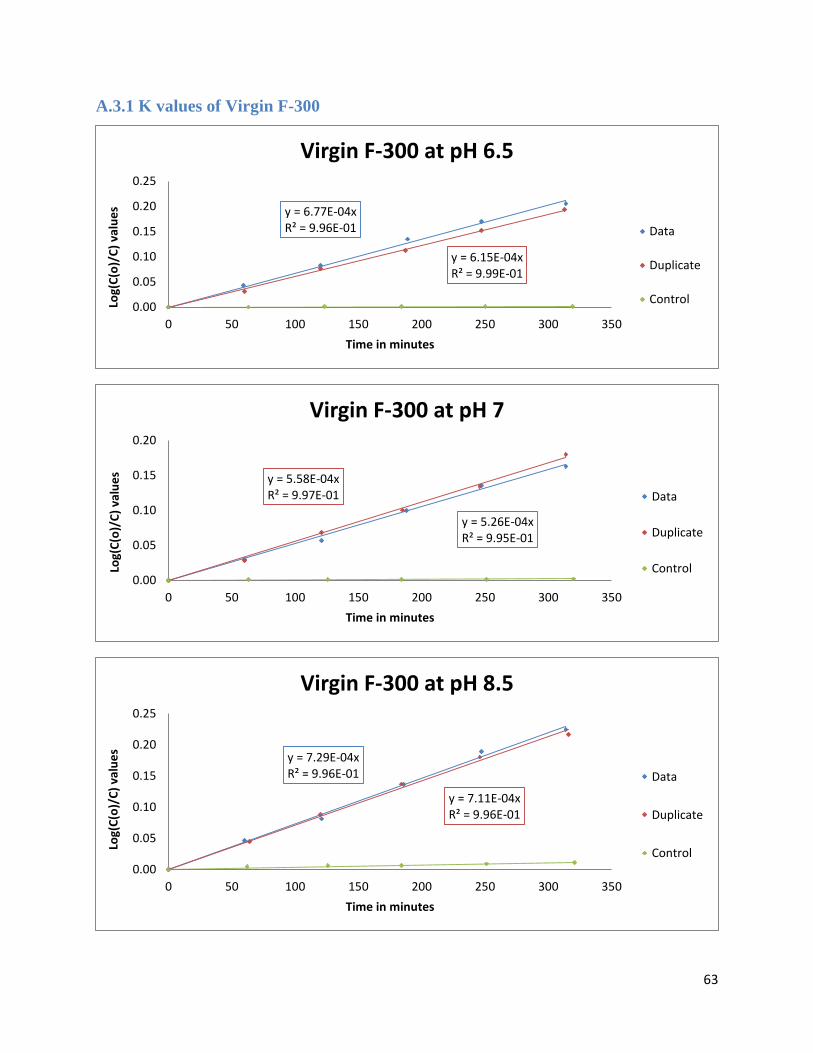
63
A.3.1 K values of Virgin F-300
y = 6.77E-04xR² = 9.96E-01
y = 6.15E-04xR² = 9.99E-01
0.00
0.05
0.10
0.15
0.20
0.25
0 50 100 150 200 250 300 350
Log(
C(o
)/C
) va
lue
s
Time in minutes
Virgin F-300 at pH 6.5
Data
Duplicate
Control
y = 5.26E-04xR² = 9.95E-01
y = 5.58E-04xR² = 9.97E-01
0.00
0.05
0.10
0.15
0.20
0 50 100 150 200 250 300 350
Log(
C(o
)/C
) va
lue
s
Time in minutes
Virgin F-300 at pH 7
Data
Duplicate
Control
y = 7.29E-04xR² = 9.96E-01
y = 7.11E-04xR² = 9.96E-01
0.00
0.05
0.10
0.15
0.20
0.25
0 50 100 150 200 250 300 350
Log(
C(o
)/C
) va
lue
s
Time in minutes
Virgin F-300 at pH 8.5
Data
Duplicate
Control

64
y = 8.36E-04xR² = 9.99E-01
y = 8.50E-04xR² = 9.99E-01
-0.05
0.00
0.05
0.10
0.15
0.20
0.25
0.30
0 50 100 150 200 250 300 350
Log(
C(o
)/C
) va
lue
s
Time in minutes
Virgin F-300 at pH 11
Data
Duplicate
Control
y = 9.86E-04xR² = 9.94E-01
y = 9.39E-04xR² = 1.00E+00
0.00
0.05
0.10
0.15
0.20
0.25
0.30
0.35
0 50 100 150 200 250 300 350
Log(
C(o
)/C
) va
lue
s
Time in minutes
Virgin F-300 at pH 11.75
Data
Duplicate
Control
y = 2.70E-03xR² = 9.97E-01
y = 2.75E-03xR² = 9.99E-01
0.0
0.2
0.4
0.6
0.8
1.0
1.2
0 50 100 150 200 250 300 350
Log(
C(o
)/C
) va
lue
s
Time in minutes
Virgin F-300 at pH 12.5
Data
Duplicate
Control
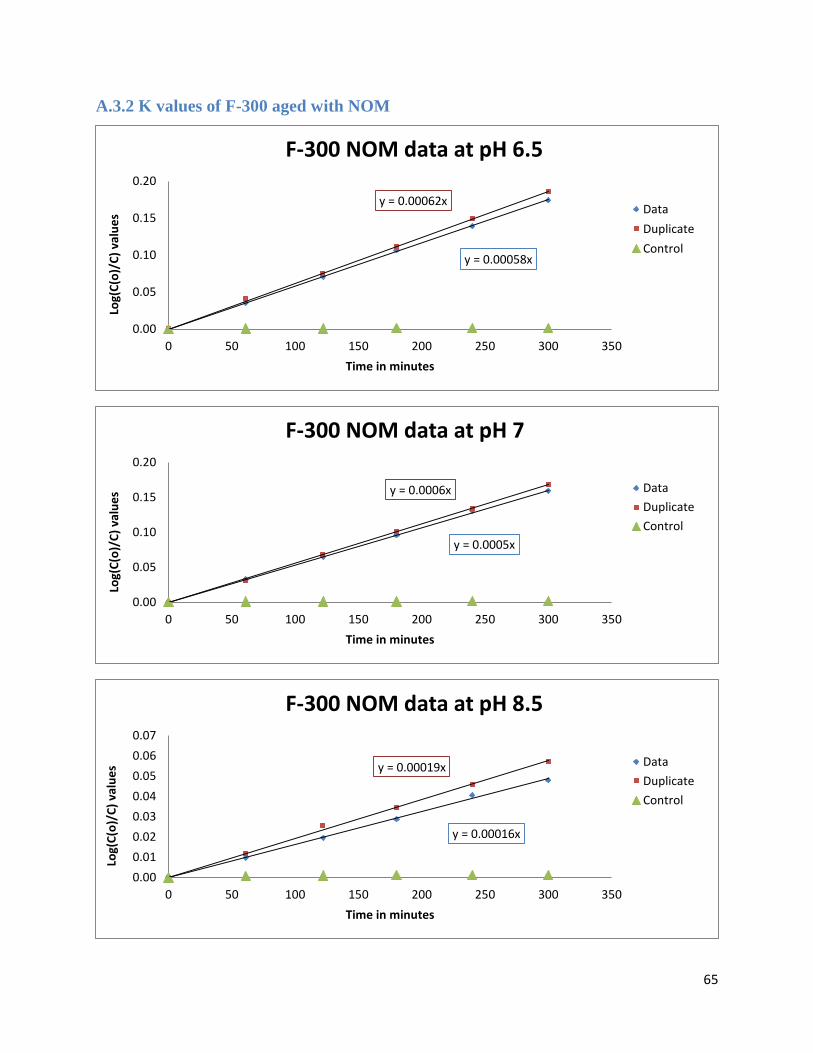
65
A.3.2 K values of F-300 aged with NOM
y = 0.00058x
y = 0.00062x
0.00
0.05
0.10
0.15
0.20
0 50 100 150 200 250 300 350
Log(
C(o
)/C
) va
lue
s
Time in minutes
F-300 NOM data at pH 6.5
Data
Duplicate
Control
y = 0.0005x
y = 0.0006x
0.00
0.05
0.10
0.15
0.20
0 50 100 150 200 250 300 350
Log(
C(o
)/C
) va
lue
s
Time in minutes
F-300 NOM data at pH 7
Data
Duplicate
Control
y = 0.00016x
y = 0.00019x
0.00
0.01
0.02
0.03
0.04
0.05
0.06
0.07
0 50 100 150 200 250 300 350
Log(
C(o
)/C
) va
lue
s
Time in minutes
F-300 NOM data at pH 8.5
Data
Duplicate
Control
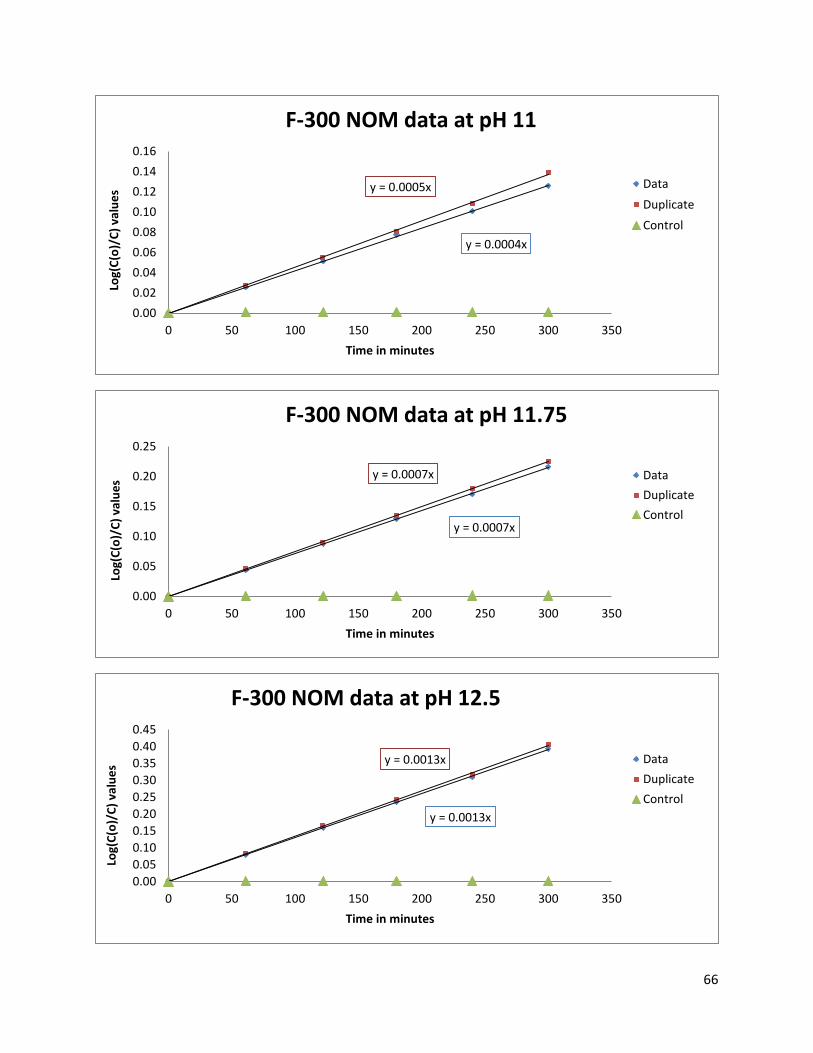
66
y = 0.0004x
y = 0.0005x
0.00
0.02
0.04
0.06
0.08
0.10
0.12
0.14
0.16
0 50 100 150 200 250 300 350
Log(
C(o
)/C
) va
lue
s
Time in minutes
F-300 NOM data at pH 11
Data
Duplicate
Control
y = 0.0007x
y = 0.0007x
0.00
0.05
0.10
0.15
0.20
0.25
0 50 100 150 200 250 300 350
Log(
C(o
)/C
) va
lue
s
Time in minutes
F-300 NOM data at pH 11.75
Data
Duplicate
Control
y = 0.0013x
y = 0.0013x
0.00
0.05
0.10
0.15
0.20
0.25
0.30
0.35
0.40
0.45
0 50 100 150 200 250 300 350
Log(
C(o
)/C
) va
lue
s
Time in minutes
F-300 NOM data at pH 12.5
Data
Duplicate
Control
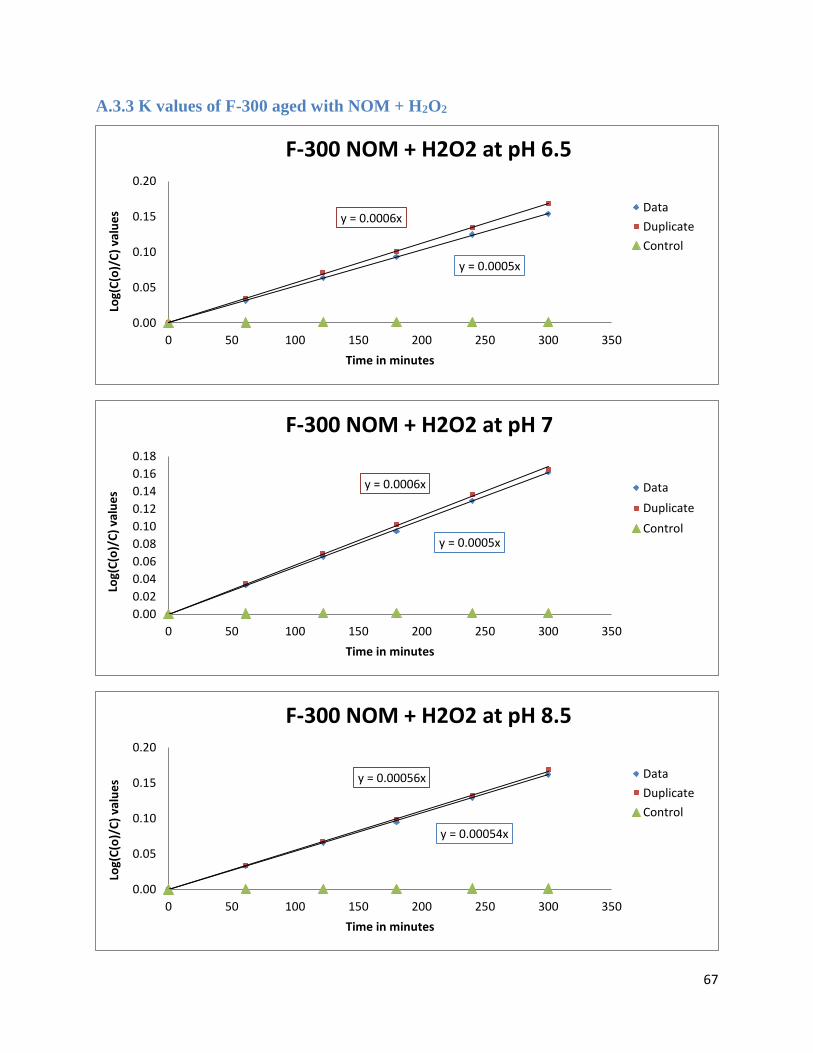
67
A.3.3 K values of F-300 aged with NOM + H2O2
y = 0.0005x
y = 0.0006x
0.00
0.05
0.10
0.15
0.20
0 50 100 150 200 250 300 350
Log(
C(o
)/C
) va
lue
s
Time in minutes
F-300 NOM + H2O2 at pH 6.5
Data
Duplicate
Control
y = 0.0005x
y = 0.0006x
0.00
0.02
0.04
0.06
0.08
0.10
0.12
0.14
0.16
0.18
0 50 100 150 200 250 300 350
Log(
C(o
)/C
) va
lue
s
Time in minutes
F-300 NOM + H2O2 at pH 7
Data
Duplicate
Control
y = 0.00054x
y = 0.00056x
0.00
0.05
0.10
0.15
0.20
0 50 100 150 200 250 300 350
Log(
C(o
)/C
) va
lue
s
Time in minutes
F-300 NOM + H2O2 at pH 8.5
Data
Duplicate
Control
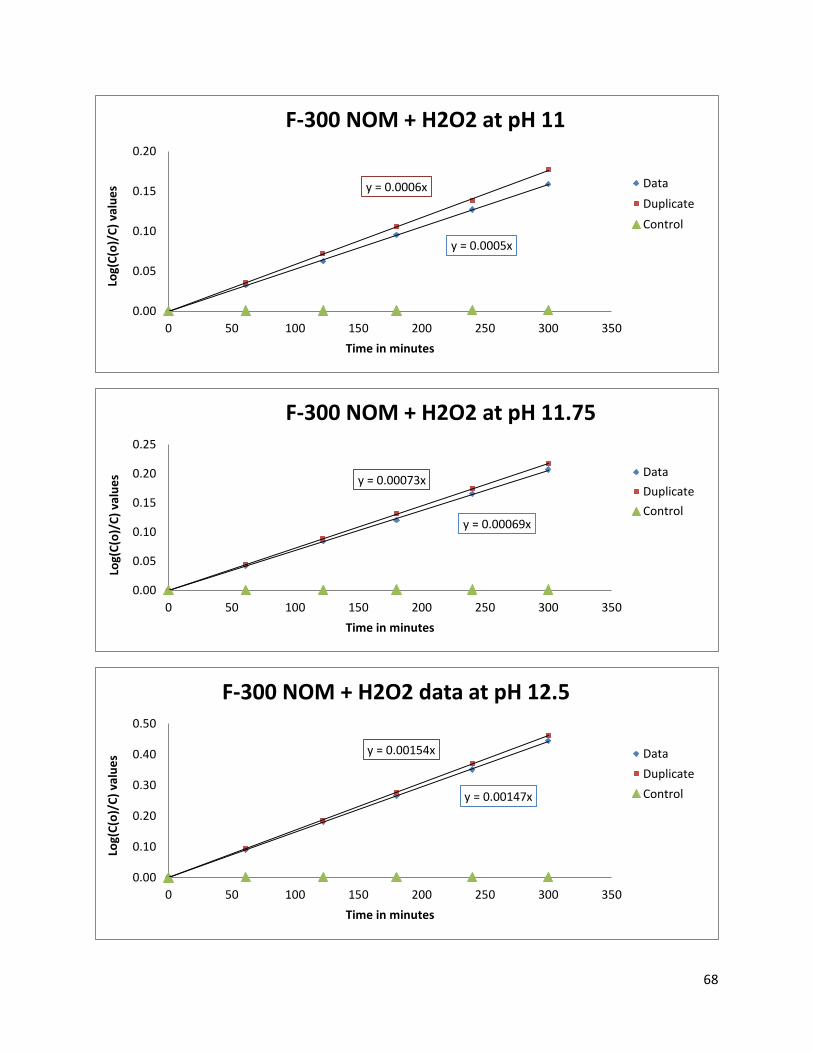
68
y = 0.0005x
y = 0.0006x
0.00
0.05
0.10
0.15
0.20
0 50 100 150 200 250 300 350
Log(
C(o
)/C
) va
lue
s
Time in minutes
F-300 NOM + H2O2 at pH 11
Data
Duplicate
Control
y = 0.00069x
y = 0.00073x
0.00
0.05
0.10
0.15
0.20
0.25
0 50 100 150 200 250 300 350
Log(
C(o
)/C
) va
lue
s
Time in minutes
F-300 NOM + H2O2 at pH 11.75
Data
Duplicate
Control
y = 0.00147x
y = 0.00154x
0.00
0.10
0.20
0.30
0.40
0.50
0 50 100 150 200 250 300 350
Log(
C(o
)/C
) va
lue
s
Time in minutes
F-300 NOM + H2O2 data at pH 12.5
Data
Duplicate
Control
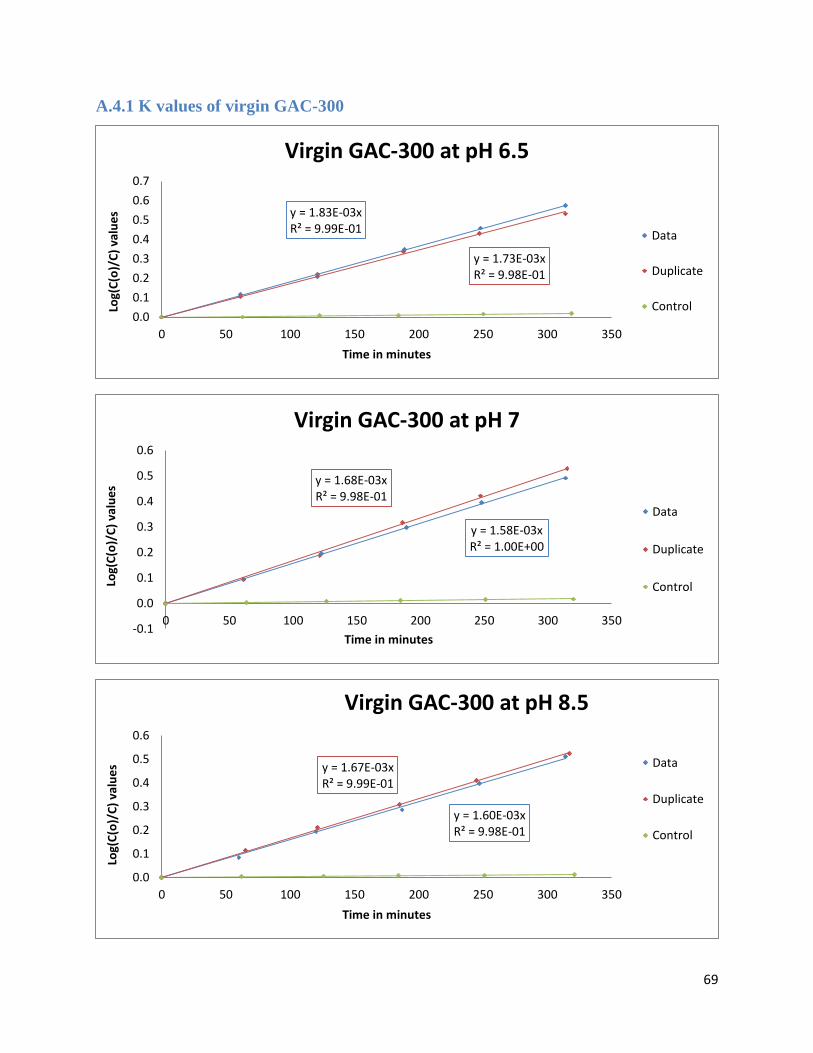
69
A.4.1 K values of virgin GAC-300
y = 1.83E-03xR² = 9.99E-01
y = 1.73E-03xR² = 9.98E-01
0.0
0.1
0.2
0.3
0.4
0.5
0.6
0.7
0 50 100 150 200 250 300 350
Log(
C(o
)/C
) va
lue
s
Time in minutes
Virgin GAC-300 at pH 6.5
Data
Duplicate
Control
y = 1.58E-03xR² = 1.00E+00
y = 1.68E-03xR² = 9.98E-01
-0.1
0.0
0.1
0.2
0.3
0.4
0.5
0.6
0 50 100 150 200 250 300 350
Log(
C(o
)/C
) va
lue
s
Time in minutes
Virgin GAC-300 at pH 7
Data
Duplicate
Control
y = 1.60E-03xR² = 9.98E-01
y = 1.67E-03xR² = 9.99E-01
0.0
0.1
0.2
0.3
0.4
0.5
0.6
0 50 100 150 200 250 300 350
Log(
C(o
)/C
) va
lue
s
Time in minutes
Virgin GAC-300 at pH 8.5
Data
Duplicate
Control
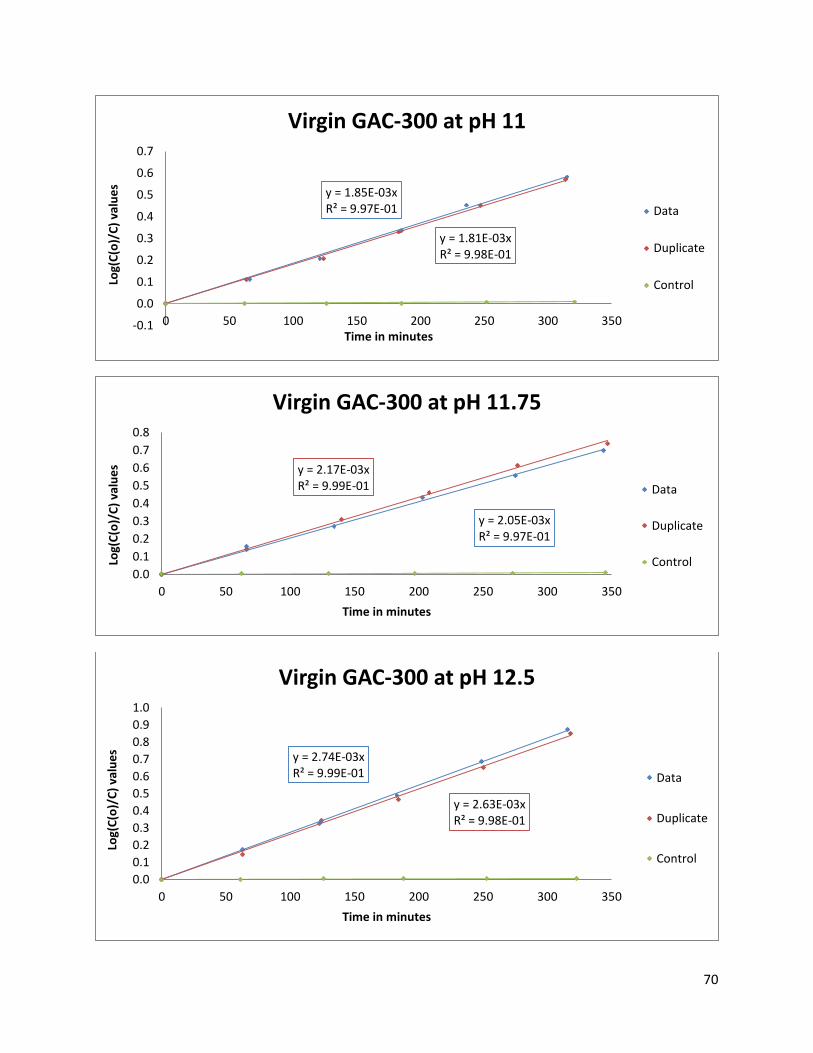
70
y = 1.85E-03xR² = 9.97E-01
y = 1.81E-03xR² = 9.98E-01
-0.1
0.0
0.1
0.2
0.3
0.4
0.5
0.6
0.7
0 50 100 150 200 250 300 350
Log(
C(o
)/C
) va
lue
s
Time in minutes
Virgin GAC-300 at pH 11
Data
Duplicate
Control
y = 2.05E-03xR² = 9.97E-01
y = 2.17E-03xR² = 9.99E-01
0.0
0.1
0.2
0.3
0.4
0.5
0.6
0.7
0.8
0 50 100 150 200 250 300 350
Log(
C(o
)/C
) va
lue
s
Time in minutes
Virgin GAC-300 at pH 11.75
Data
Duplicate
Control
y = 2.74E-03xR² = 9.99E-01
y = 2.63E-03xR² = 9.98E-01
0.0
0.1
0.2
0.3
0.4
0.5
0.6
0.7
0.8
0.9
1.0
0 50 100 150 200 250 300 350
Log(
C(o
)/C
) va
lue
s
Time in minutes
Virgin GAC-300 at pH 12.5
Data
Duplicate
Control
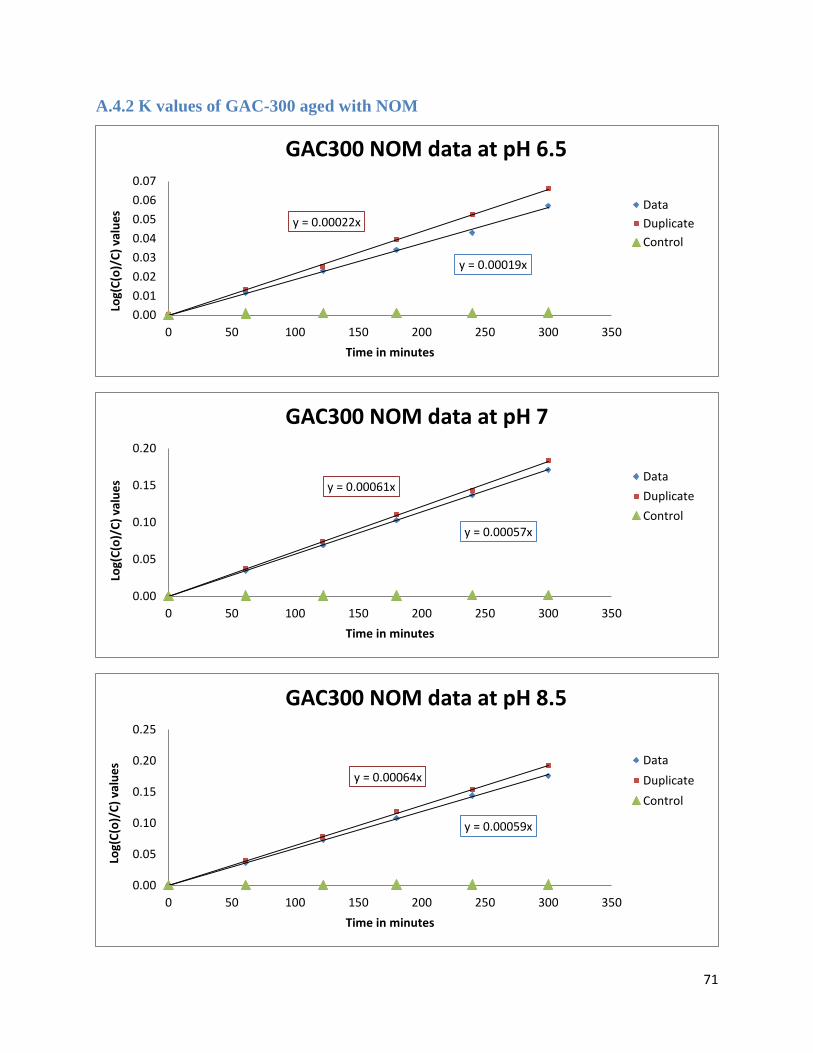
71
A.4.2 K values of GAC-300 aged with NOM
y = 0.00019x
y = 0.00022x
0.00
0.01
0.02
0.03
0.04
0.05
0.06
0.07
0 50 100 150 200 250 300 350
Log(
C(o
)/C
) va
lue
s
Time in minutes
GAC300 NOM data at pH 6.5
Data
Duplicate
Control
y = 0.00057x
y = 0.00061x
0.00
0.05
0.10
0.15
0.20
0 50 100 150 200 250 300 350
Log(
C(o
)/C
) va
lue
s
Time in minutes
GAC300 NOM data at pH 7
Data
Duplicate
Control
y = 0.00059x
y = 0.00064x
0.00
0.05
0.10
0.15
0.20
0.25
0 50 100 150 200 250 300 350
Log(
C(o
)/C
) va
lue
s
Time in minutes
GAC300 NOM data at pH 8.5
Data
Duplicate
Control
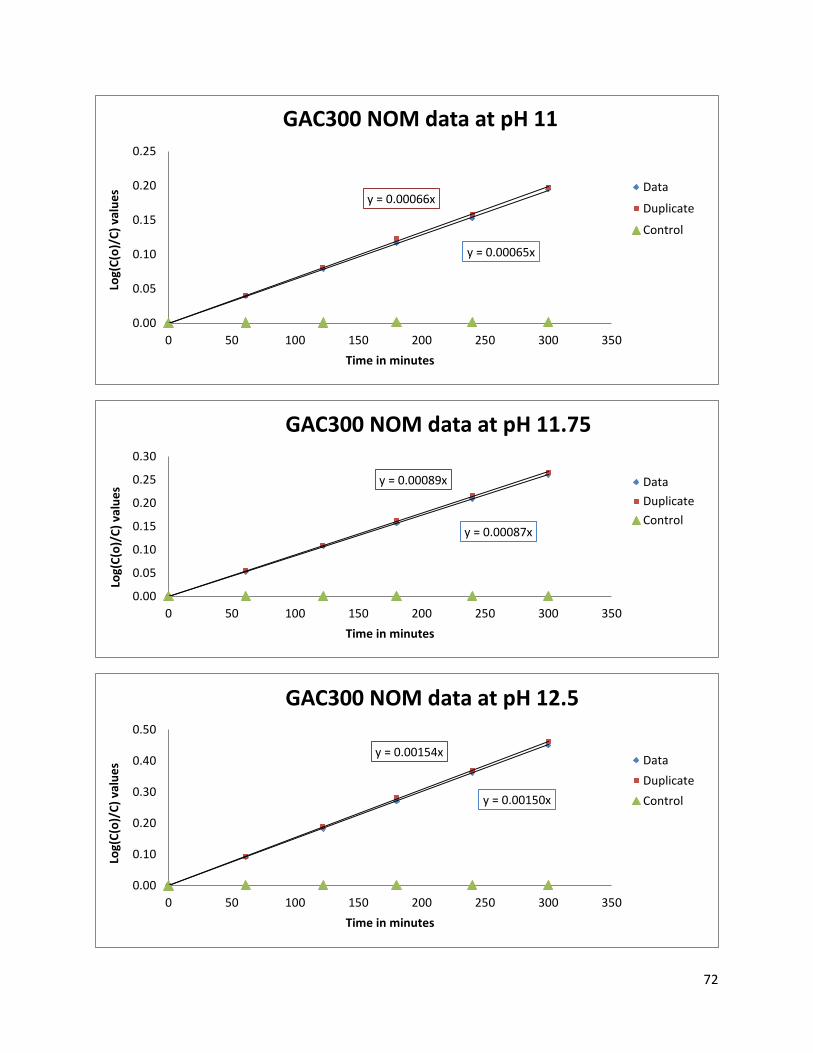
72
y = 0.00065x
y = 0.00066x
0.00
0.05
0.10
0.15
0.20
0.25
0 50 100 150 200 250 300 350
Log(
C(o
)/C
) va
lue
s
Time in minutes
GAC300 NOM data at pH 11
Data
Duplicate
Control
y = 0.00087x
y = 0.00089x
0.00
0.05
0.10
0.15
0.20
0.25
0.30
0 50 100 150 200 250 300 350
Log(
C(o
)/C
) va
lue
s
Time in minutes
GAC300 NOM data at pH 11.75
Data
Duplicate
Control
y = 0.00150x
y = 0.00154x
0.00
0.10
0.20
0.30
0.40
0.50
0 50 100 150 200 250 300 350
Log(
C(o
)/C
) va
lue
s
Time in minutes
GAC300 NOM data at pH 12.5
Data
Duplicate
Control
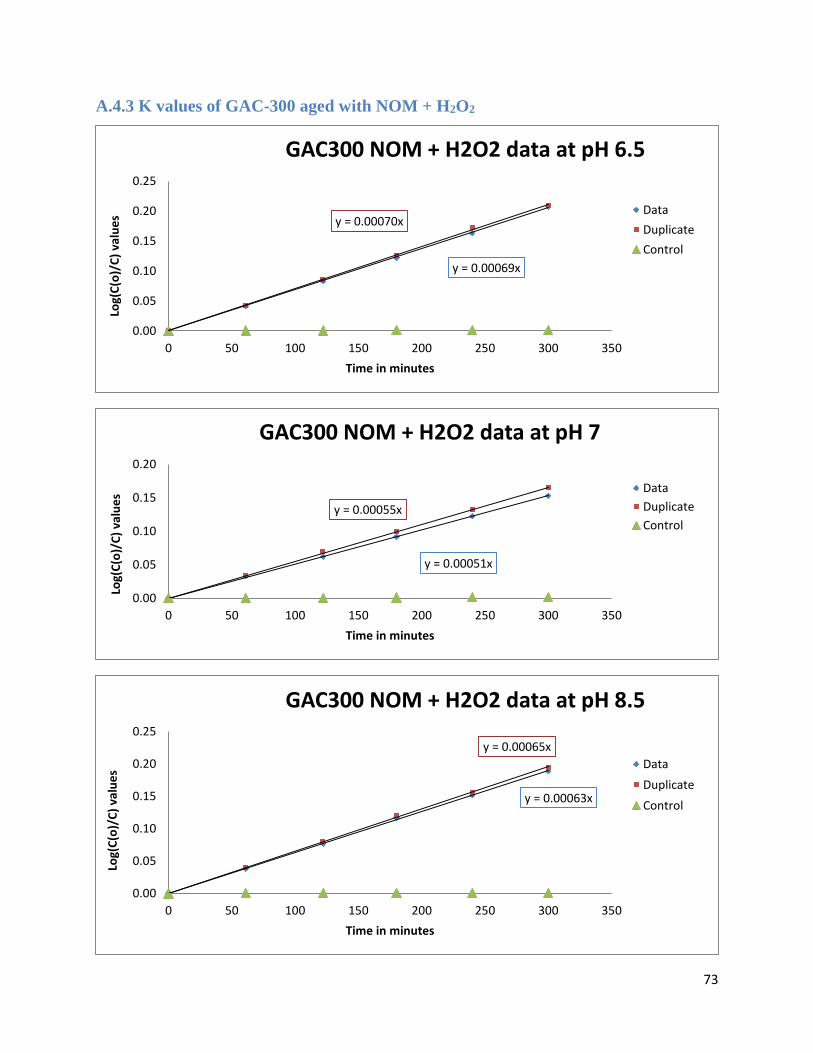
73
A.4.3 K values of GAC-300 aged with NOM + H2O2
y = 0.00069x
y = 0.00070x
0.00
0.05
0.10
0.15
0.20
0.25
0 50 100 150 200 250 300 350
Log(
C(o
)/C
) va
lue
s
Time in minutes
GAC300 NOM + H2O2 data at pH 6.5
Data
Duplicate
Control
y = 0.00051x
y = 0.00055x
0.00
0.05
0.10
0.15
0.20
0 50 100 150 200 250 300 350
Log(
C(o
)/C
) va
lue
s
Time in minutes
GAC300 NOM + H2O2 data at pH 7
Data
Duplicate
Control
y = 0.00063x
y = 0.00065x
0.00
0.05
0.10
0.15
0.20
0.25
0 50 100 150 200 250 300 350
Log(
C(o
)/C
) va
lue
s
Time in minutes
GAC300 NOM + H2O2 data at pH 8.5
Data
Duplicate
Control
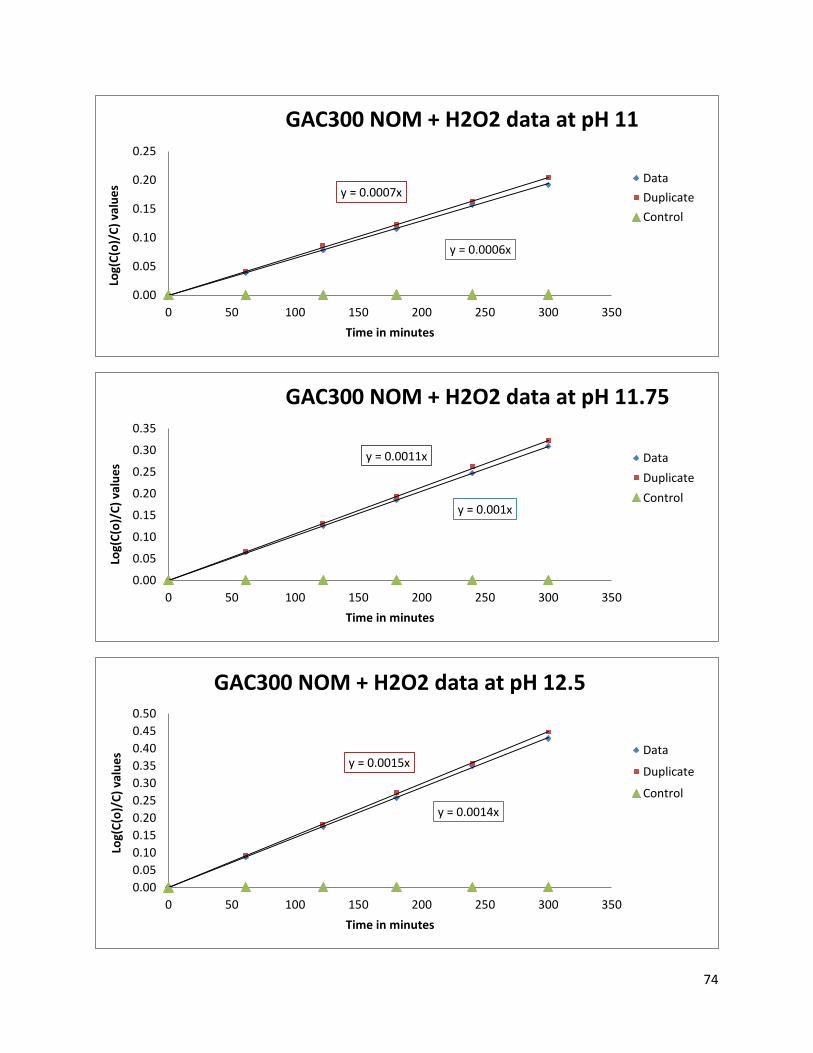
74
y = 0.0006x
y = 0.0007x
0.00
0.05
0.10
0.15
0.20
0.25
0 50 100 150 200 250 300 350
Log(
C(o
)/C
) va
lue
s
Time in minutes
GAC300 NOM + H2O2 data at pH 11
Data
Duplicate
Control
y = 0.001x
y = 0.0011x
0.00
0.05
0.10
0.15
0.20
0.25
0.30
0.35
0 50 100 150 200 250 300 350
Log(
C(o
)/C
) va
lue
s
Time in minutes
GAC300 NOM + H2O2 data at pH 11.75
Data
Duplicate
Control
y = 0.0014x
y = 0.0015x
0.00
0.05
0.10
0.15
0.20
0.25
0.30
0.35
0.40
0.45
0.50
0 50 100 150 200 250 300 350
Log(
C(o
)/C
) va
lue
s
Time in minutes
GAC300 NOM + H2O2 data at pH 12.5
Data
Duplicate
Control
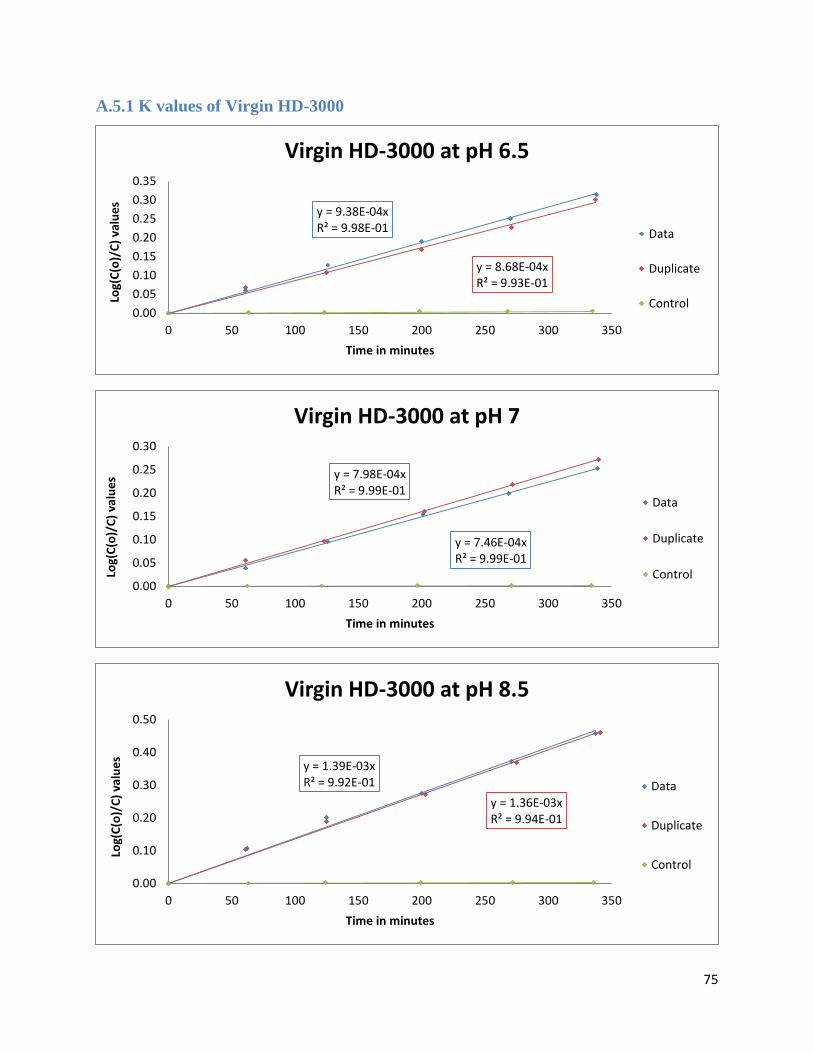
75
A.5.1 K values of Virgin HD-3000
y = 9.38E-04xR² = 9.98E-01
y = 8.68E-04xR² = 9.93E-01
0.00
0.05
0.10
0.15
0.20
0.25
0.30
0.35
0 50 100 150 200 250 300 350
Log(
C(o
)/C
) va
lue
s
Time in minutes
Virgin HD-3000 at pH 6.5
Data
Duplicate
Control
y = 7.46E-04xR² = 9.99E-01
y = 7.98E-04xR² = 9.99E-01
0.00
0.05
0.10
0.15
0.20
0.25
0.30
0 50 100 150 200 250 300 350
Log(
C(o
)/C
) va
lue
s
Time in minutes
Virgin HD-3000 at pH 7
Data
Duplicate
Control
y = 1.39E-03xR² = 9.92E-01
y = 1.36E-03xR² = 9.94E-01
0.00
0.10
0.20
0.30
0.40
0.50
0 50 100 150 200 250 300 350
Log(
C(o
)/C
) va
lue
s
Time in minutes
Virgin HD-3000 at pH 8.5
Data
Duplicate
Control
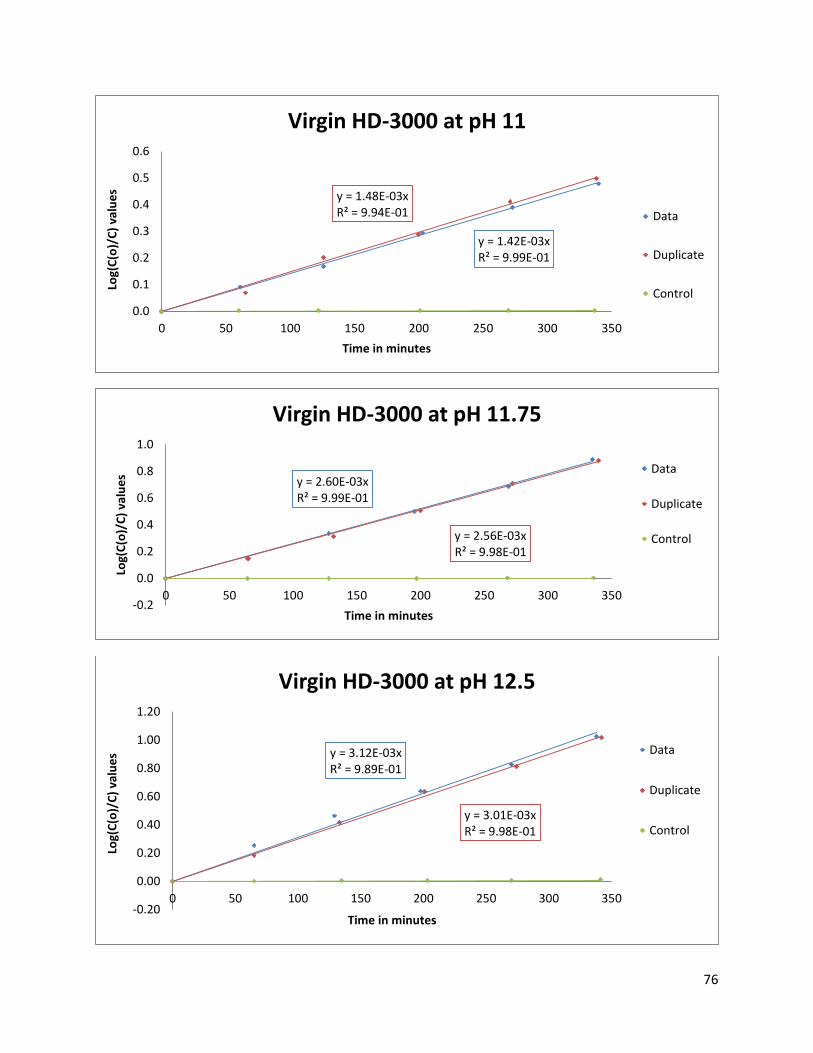
76
y = 1.42E-03xR² = 9.99E-01
y = 1.48E-03xR² = 9.94E-01
0.0
0.1
0.2
0.3
0.4
0.5
0.6
0 50 100 150 200 250 300 350
Log(
C(o
)/C
) va
lue
s
Time in minutes
Virgin HD-3000 at pH 11
Data
Duplicate
Control
y = 2.60E-03xR² = 9.99E-01
y = 2.56E-03xR² = 9.98E-01
-0.2
0.0
0.2
0.4
0.6
0.8
1.0
0 50 100 150 200 250 300 350
Log(
C(o
)/C
) va
lue
s
Time in minutes
Virgin HD-3000 at pH 11.75
Data
Duplicate
Control
y = 3.12E-03xR² = 9.89E-01
y = 3.01E-03xR² = 9.98E-01
-0.20
0.00
0.20
0.40
0.60
0.80
1.00
1.20
0 50 100 150 200 250 300 350
Log(
C(o
)/C
) va
lue
s
Time in minutes
Virgin HD-3000 at pH 12.5
Data
Duplicate
Control
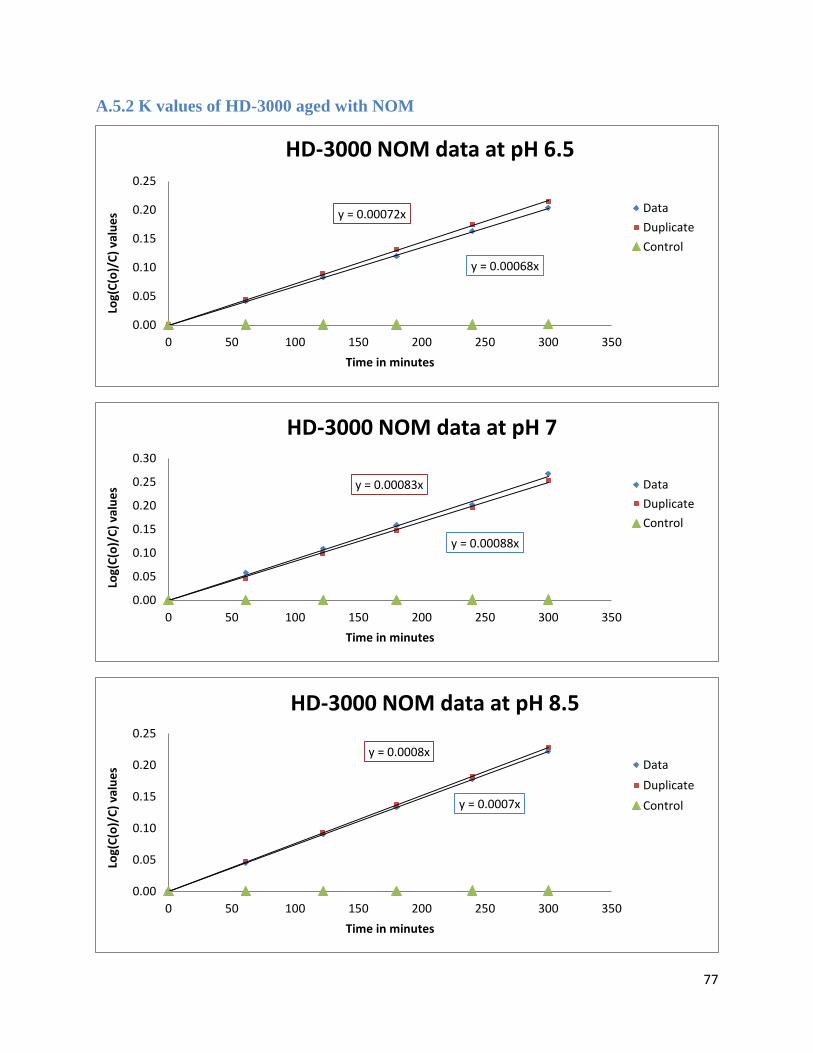
77
A.5.2 K values of HD-3000 aged with NOM
y = 0.00068x
y = 0.00072x
0.00
0.05
0.10
0.15
0.20
0.25
0 50 100 150 200 250 300 350
Log(
C(o
)/C
) va
lue
s
Time in minutes
HD-3000 NOM data at pH 6.5
Data
Duplicate
Control
y = 0.00088x
y = 0.00083x
0.00
0.05
0.10
0.15
0.20
0.25
0.30
0 50 100 150 200 250 300 350
Log(
C(o
)/C
) va
lue
s
Time in minutes
HD-3000 NOM data at pH 7
Data
Duplicate
Control
y = 0.0007x
y = 0.0008x
0.00
0.05
0.10
0.15
0.20
0.25
0 50 100 150 200 250 300 350
Log(
C(o
)/C
) va
lue
s
Time in minutes
HD-3000 NOM data at pH 8.5
Data
Duplicate
Control
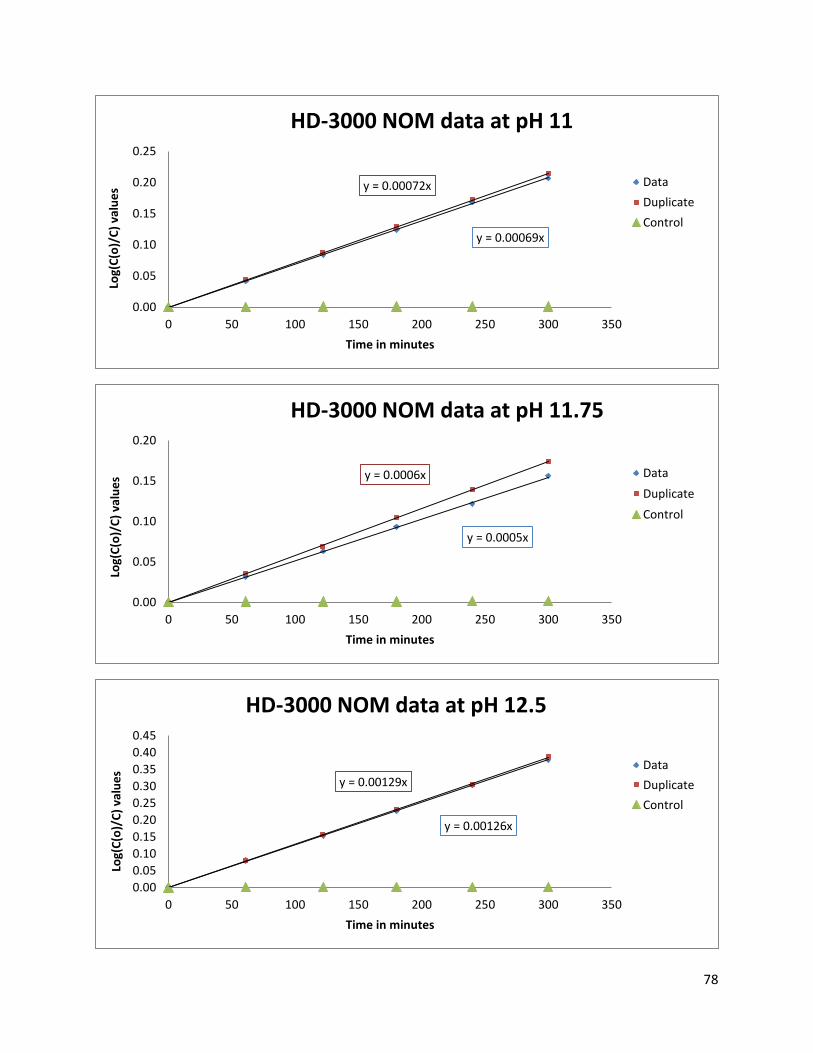
78
y = 0.00069x
y = 0.00072x
0.00
0.05
0.10
0.15
0.20
0.25
0 50 100 150 200 250 300 350
Log(
C(o
)/C
) va
lue
s
Time in minutes
HD-3000 NOM data at pH 11
Data
Duplicate
Control
y = 0.0005x
y = 0.0006x
0.00
0.05
0.10
0.15
0.20
0 50 100 150 200 250 300 350
Log(
C(o
)/C
) va
lue
s
Time in minutes
HD-3000 NOM data at pH 11.75
Data
Duplicate
Control
y = 0.00126x
y = 0.00129x
0.00
0.05
0.10
0.15
0.20
0.25
0.30
0.35
0.40
0.45
0 50 100 150 200 250 300 350
Log(
C(o
)/C
) va
lue
s
Time in minutes
HD-3000 NOM data at pH 12.5
Data
Duplicate
Control
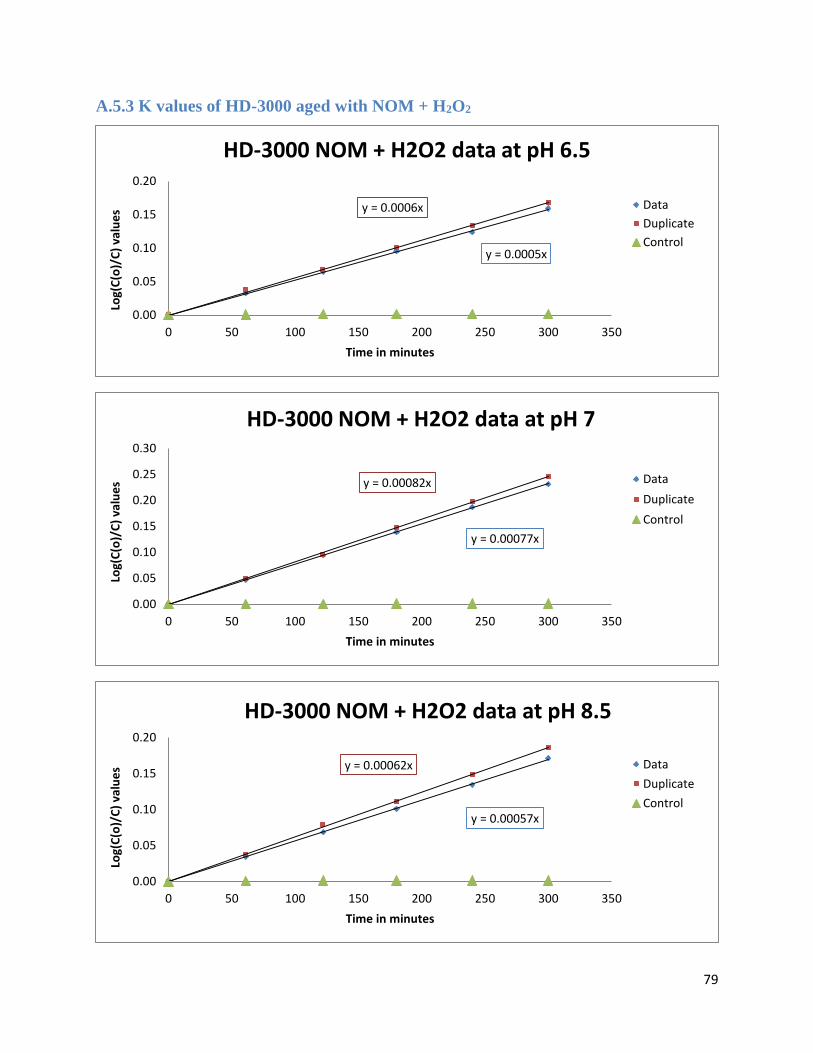
79
A.5.3 K values of HD-3000 aged with NOM + H2O2
y = 0.0005x
y = 0.0006x
0.00
0.05
0.10
0.15
0.20
0 50 100 150 200 250 300 350
Log(
C(o
)/C
) va
lue
s
Time in minutes
HD-3000 NOM + H2O2 data at pH 6.5
Data
Duplicate
Control
y = 0.00077x
y = 0.00082x
0.00
0.05
0.10
0.15
0.20
0.25
0.30
0 50 100 150 200 250 300 350
Log(
C(o
)/C
) va
lue
s
Time in minutes
HD-3000 NOM + H2O2 data at pH 7
Data
Duplicate
Control
y = 0.00057x
y = 0.00062x
0.00
0.05
0.10
0.15
0.20
0 50 100 150 200 250 300 350
Log(
C(o
)/C
) va
lue
s
Time in minutes
HD-3000 NOM + H2O2 data at pH 8.5
Data
Duplicate
Control
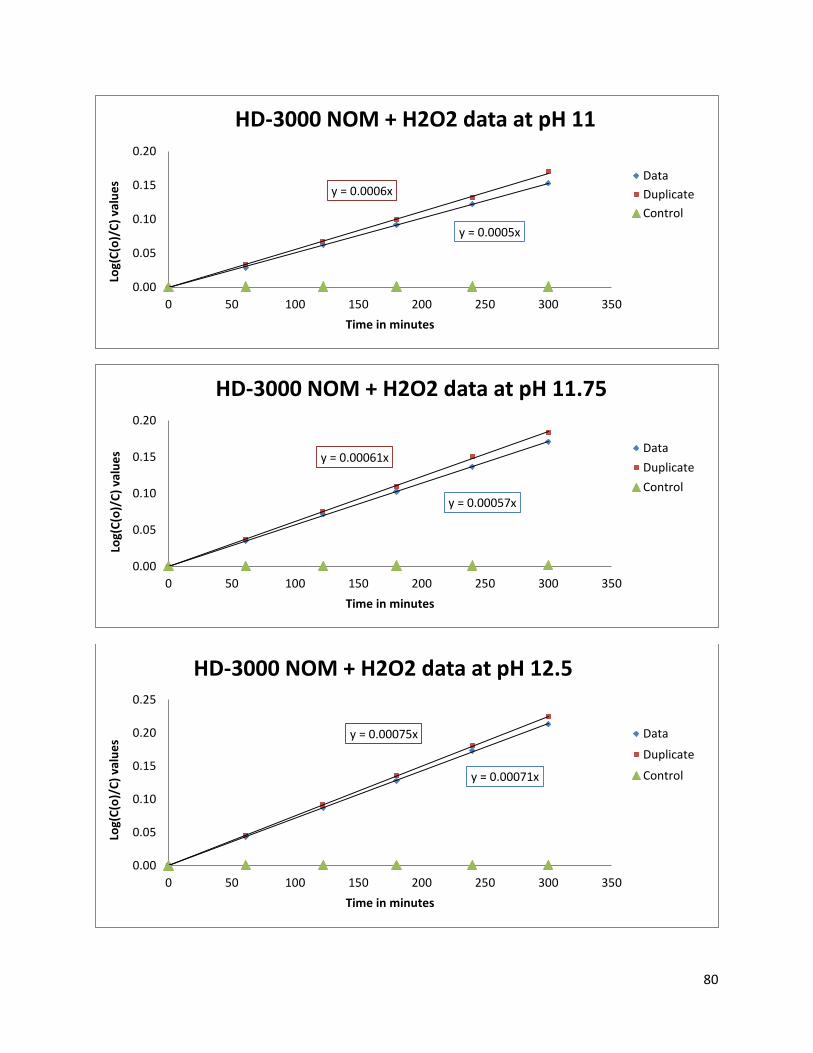
80
y = 0.0005x
y = 0.0006x
0.00
0.05
0.10
0.15
0.20
0 50 100 150 200 250 300 350
Log(
C(o
)/C
) va
lue
s
Time in minutes
HD-3000 NOM + H2O2 data at pH 11
Data
Duplicate
Control
y = 0.00057x
y = 0.00061x
0.00
0.05
0.10
0.15
0.20
0 50 100 150 200 250 300 350
Log(
C(o
)/C
) va
lue
s
Time in minutes
HD-3000 NOM + H2O2 data at pH 11.75
Data
Duplicate
Control
y = 0.00071x
y = 0.00075x
0.00
0.05
0.10
0.15
0.20
0.25
0 50 100 150 200 250 300 350
Log(
C(o
)/C
) va
lue
s
Time in minutes
HD-3000 NOM + H2O2 data at pH 12.5
Data
Duplicate
Control
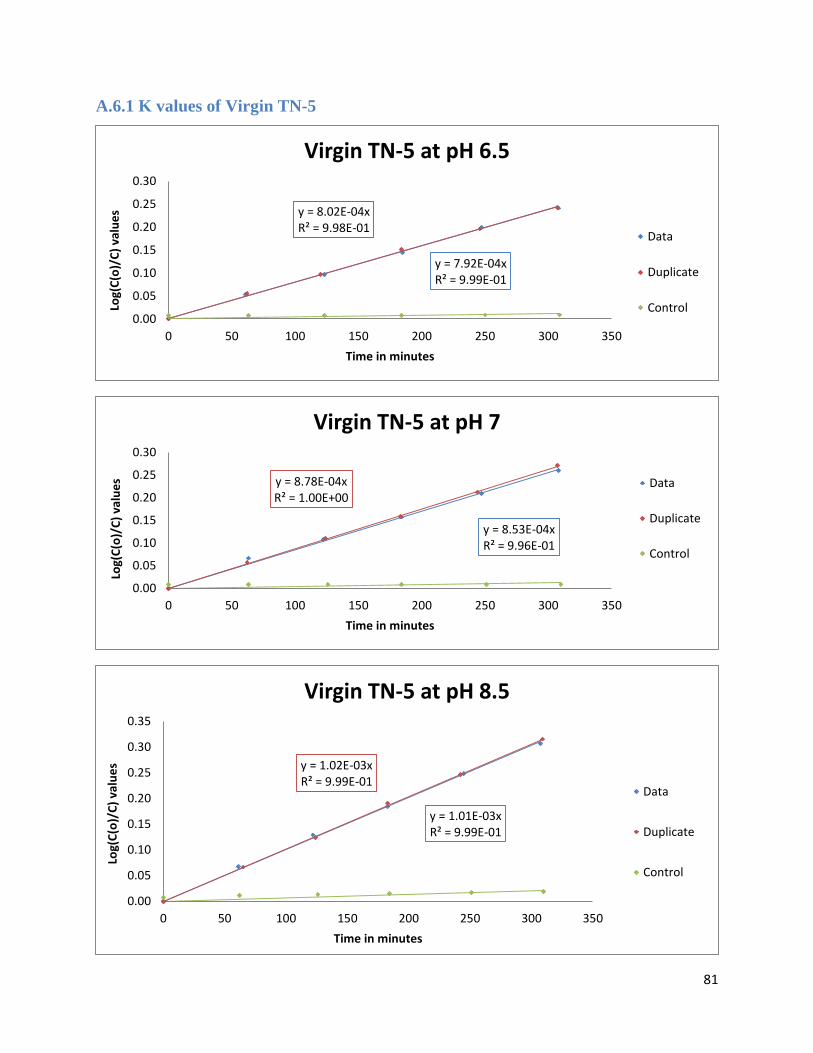
81
A.6.1 K values of Virgin TN-5
y = 7.92E-04xR² = 9.99E-01
y = 8.02E-04xR² = 9.98E-01
0.00
0.05
0.10
0.15
0.20
0.25
0.30
0 50 100 150 200 250 300 350
Log(
C(o
)/C
) va
lue
s
Time in minutes
Virgin TN-5 at pH 6.5
Data
Duplicate
Control
y = 8.53E-04xR² = 9.96E-01
y = 8.78E-04xR² = 1.00E+00
0.00
0.05
0.10
0.15
0.20
0.25
0.30
0 50 100 150 200 250 300 350
Log(
C(o
)/C
) va
lue
s
Time in minutes
Virgin TN-5 at pH 7
Data
Duplicate
Control
y = 1.01E-03xR² = 9.99E-01
y = 1.02E-03xR² = 9.99E-01
0.00
0.05
0.10
0.15
0.20
0.25
0.30
0.35
0 50 100 150 200 250 300 350
Log(
C(o
)/C
) va
lue
s
Time in minutes
Virgin TN-5 at pH 8.5
Data
Duplicate
Control

82
y = 1.51E-03xR² = 9.96E-01
y = 1.45E-03xR² = 9.94E-01
0.00
0.10
0.20
0.30
0.40
0.50
0 50 100 150 200 250 300 350
Log(
C(o
)/C
) va
lue
s
Time in minutes
Virgin TN-5 at pH 11
Data
Duplicate
Control
y = 2.47E-03xR² = 9.99E-01
y = 2.55E-03xR² = 9.99E-01
0.0
0.1
0.2
0.3
0.4
0.5
0.6
0.7
0.8
0.9
0 50 100 150 200 250 300 350
Log(
C(o
)/C
) va
lue
s
Time in minutes
Virgin TN-5 at pH 11.75
Data
Duplicate
Control
y = 2.88E-03xR² = 9.99E-01
y = 2.83E-03xR² = 9.99E-01
0.0
0.2
0.4
0.6
0.8
1.0
0 50 100 150 200 250 300 350
Log(
C(o
)/C
) va
lue
s
Time in minutes
Virgin TN-5 at pH 12.5
Data
Duplicate
Control
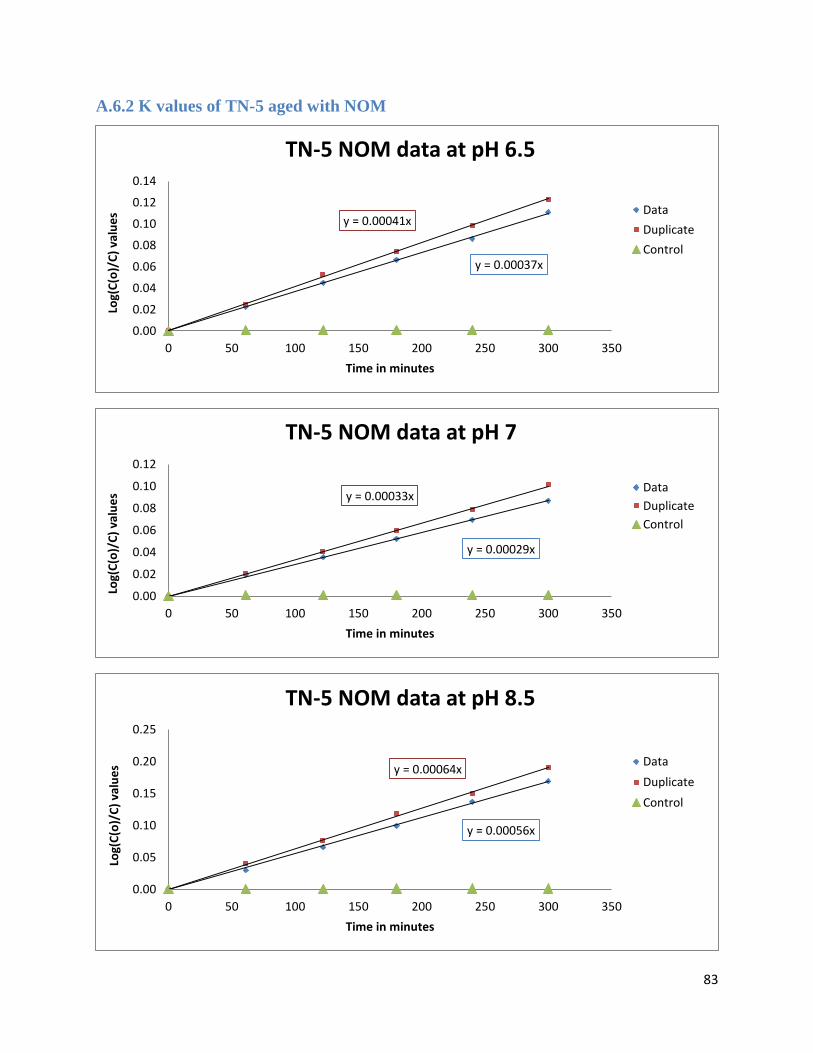
83
A.6.2 K values of TN-5 aged with NOM
y = 0.00037x
y = 0.00041x
0.00
0.02
0.04
0.06
0.08
0.10
0.12
0.14
0 50 100 150 200 250 300 350
Log(
C(o
)/C
) va
lue
s
Time in minutes
TN-5 NOM data at pH 6.5
Data
Duplicate
Control
y = 0.00029x
y = 0.00033x
0.00
0.02
0.04
0.06
0.08
0.10
0.12
0 50 100 150 200 250 300 350
Log(
C(o
)/C
) va
lue
s
Time in minutes
TN-5 NOM data at pH 7
Data
Duplicate
Control
y = 0.00056x
y = 0.00064x
0.00
0.05
0.10
0.15
0.20
0.25
0 50 100 150 200 250 300 350
Log(
C(o
)/C
) va
lue
s
Time in minutes
TN-5 NOM data at pH 8.5
Data
Duplicate
Control
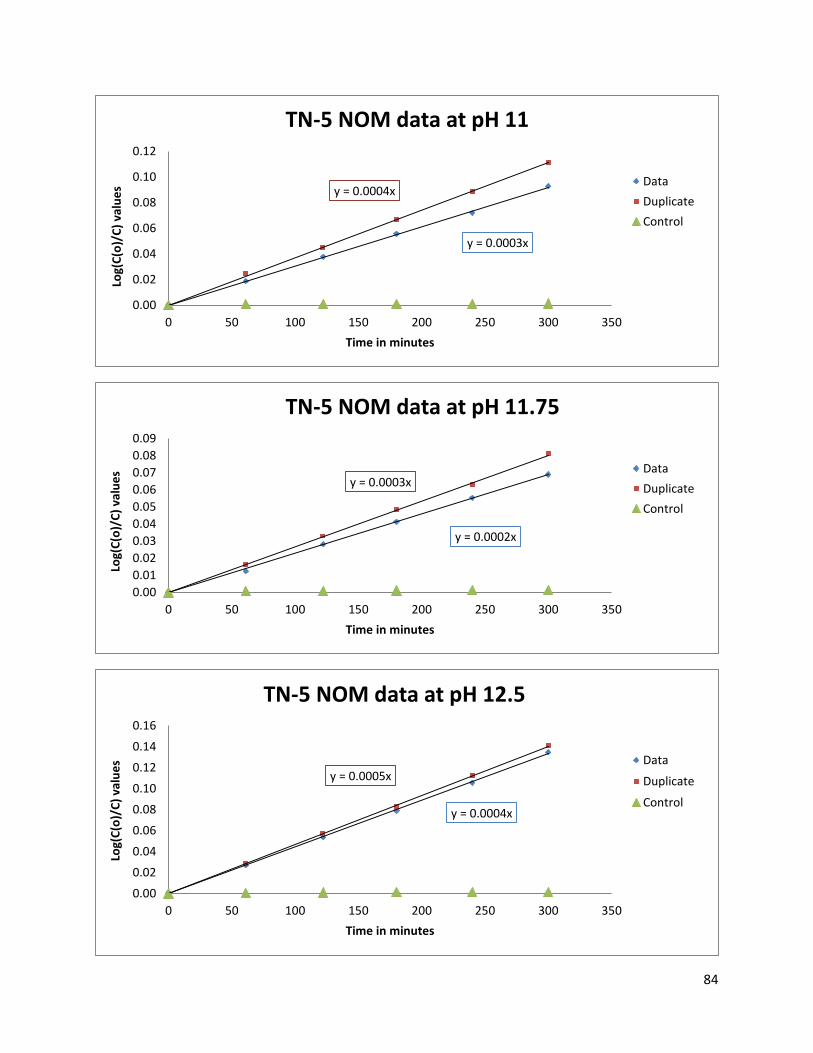
84
y = 0.0003x
y = 0.0004x
0.00
0.02
0.04
0.06
0.08
0.10
0.12
0 50 100 150 200 250 300 350
Log(
C(o
)/C
) va
lue
s
Time in minutes
TN-5 NOM data at pH 11
Data
Duplicate
Control
y = 0.0002x
y = 0.0003x
0.00
0.01
0.02
0.03
0.04
0.05
0.06
0.07
0.08
0.09
0 50 100 150 200 250 300 350
Log(
C(o
)/C
) va
lue
s
Time in minutes
TN-5 NOM data at pH 11.75
Data
Duplicate
Control
y = 0.0004x
y = 0.0005x
0.00
0.02
0.04
0.06
0.08
0.10
0.12
0.14
0.16
0 50 100 150 200 250 300 350
Log(
C(o
)/C
) va
lue
s
Time in minutes
TN-5 NOM data at pH 12.5
Data
Duplicate
Control
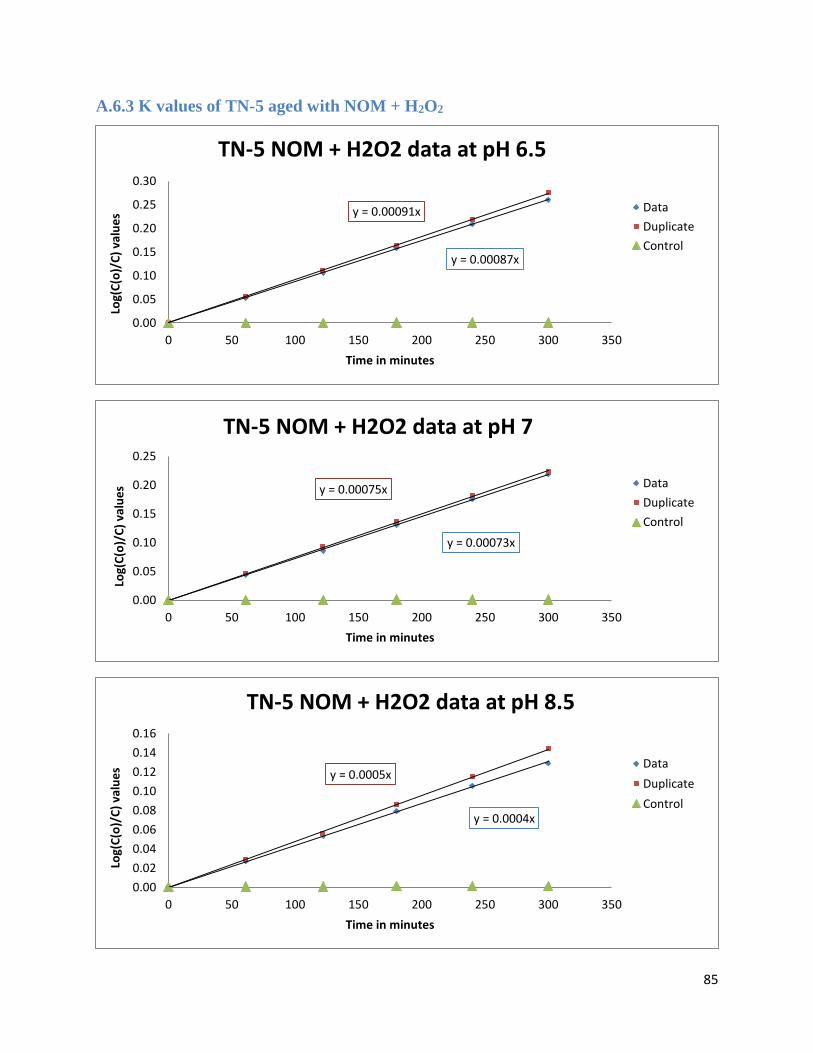
85
A.6.3 K values of TN-5 aged with NOM + H2O2
y = 0.00087x
y = 0.00091x
0.00
0.05
0.10
0.15
0.20
0.25
0.30
0 50 100 150 200 250 300 350
Log(
C(o
)/C
) va
lue
s
Time in minutes
TN-5 NOM + H2O2 data at pH 6.5
Data
Duplicate
Control
y = 0.00073x
y = 0.00075x
0.00
0.05
0.10
0.15
0.20
0.25
0 50 100 150 200 250 300 350
Log(
C(o
)/C
) va
lue
s
Time in minutes
TN-5 NOM + H2O2 data at pH 7
Data
Duplicate
Control
y = 0.0004x
y = 0.0005x
0.00
0.02
0.04
0.06
0.08
0.10
0.12
0.14
0.16
0 50 100 150 200 250 300 350
Log(
C(o
)/C
) va
lue
s
Time in minutes
TN-5 NOM + H2O2 data at pH 8.5
Data
Duplicate
Control
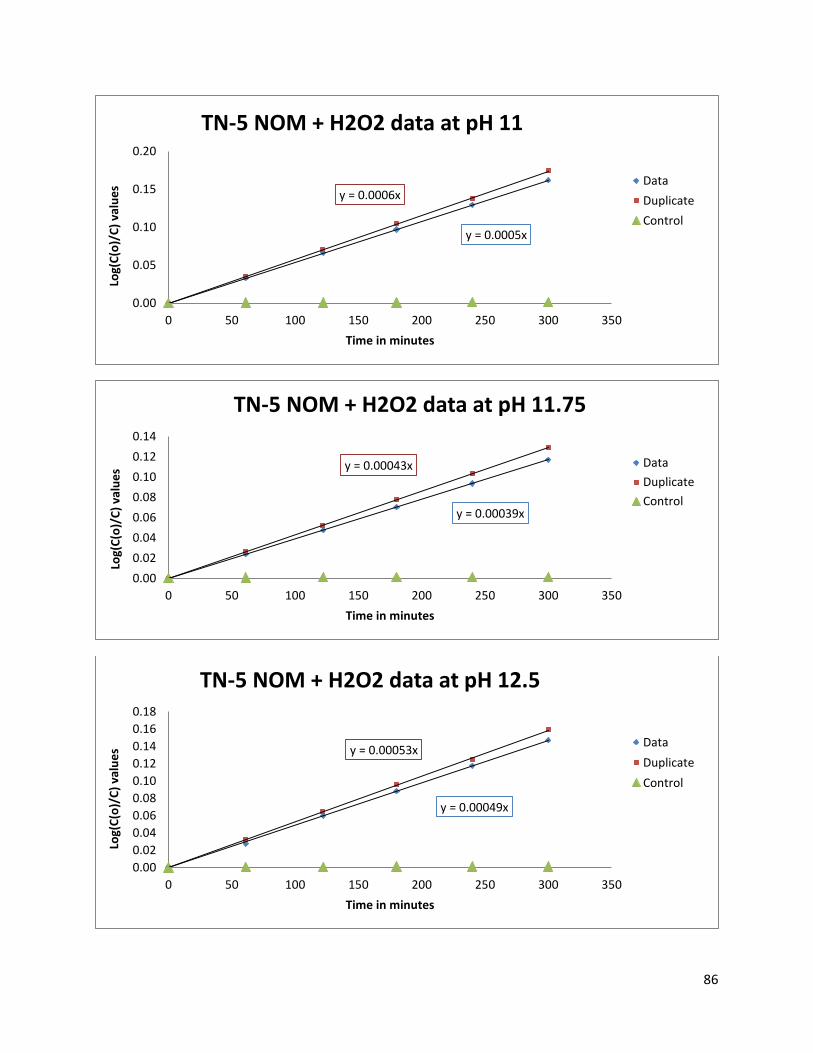
86
y = 0.0005x
y = 0.0006x
0.00
0.05
0.10
0.15
0.20
0 50 100 150 200 250 300 350
Log(
C(o
)/C
) va
lue
s
Time in minutes
TN-5 NOM + H2O2 data at pH 11
Data
Duplicate
Control
y = 0.00039x
y = 0.00043x
0.00
0.02
0.04
0.06
0.08
0.10
0.12
0.14
0 50 100 150 200 250 300 350
Log(
C(o
)/C
) va
lue
s
Time in minutes
TN-5 NOM + H2O2 data at pH 11.75
Data
Duplicate
Control
y = 0.00049x
y = 0.00053x
0.00
0.02
0.04
0.06
0.08
0.10
0.12
0.14
0.16
0.18
0 50 100 150 200 250 300 350
Log(
C(o
)/C
) va
lue
s
Time in minutes
TN-5 NOM + H2O2 data at pH 12.5
Data
Duplicate
Control
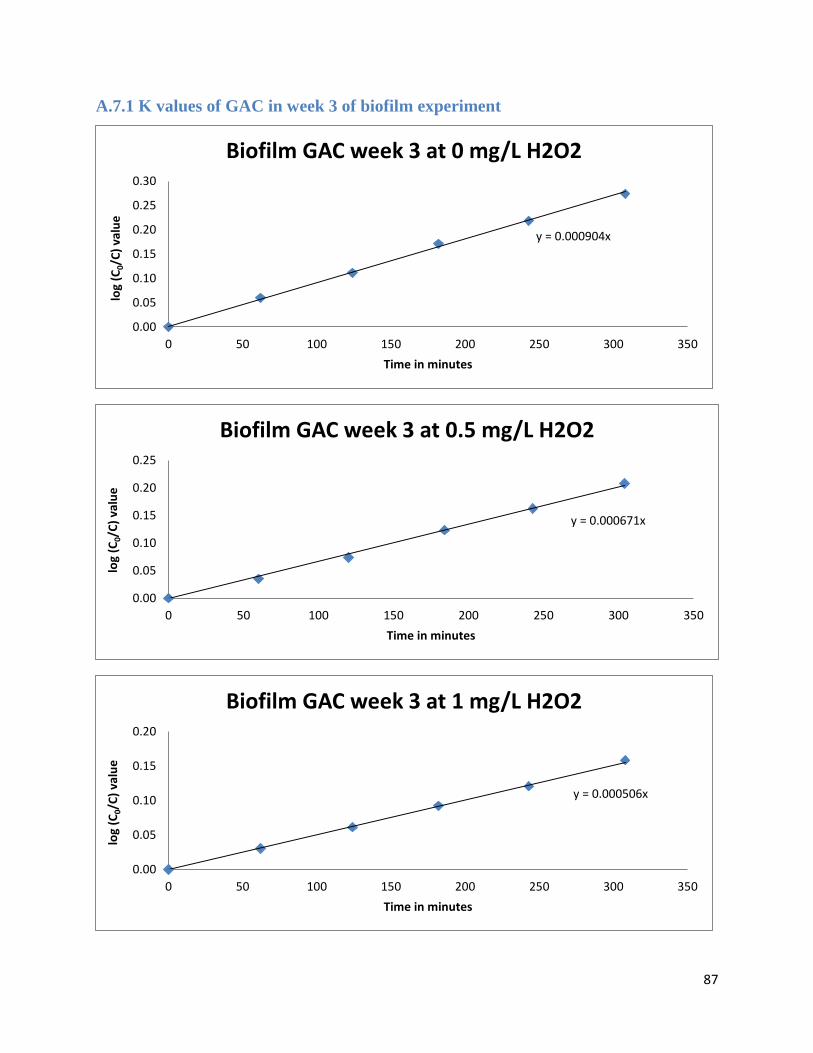
87
A.7.1 K values of GAC in week 3 of biofilm experiment
y = 0.000904x
0.00
0.05
0.10
0.15
0.20
0.25
0.30
0 50 100 150 200 250 300 350
log
(C0/C
) va
lue
Time in minutes
Biofilm GAC week 3 at 0 mg/L H2O2
y = 0.000671x
0.00
0.05
0.10
0.15
0.20
0.25
0 50 100 150 200 250 300 350
log
(C0/
C)
valu
e
Time in minutes
Biofilm GAC week 3 at 0.5 mg/L H2O2
y = 0.000506x
0.00
0.05
0.10
0.15
0.20
0 50 100 150 200 250 300 350
log
(C0/C
) va
lue
Time in minutes
Biofilm GAC week 3 at 1 mg/L H2O2
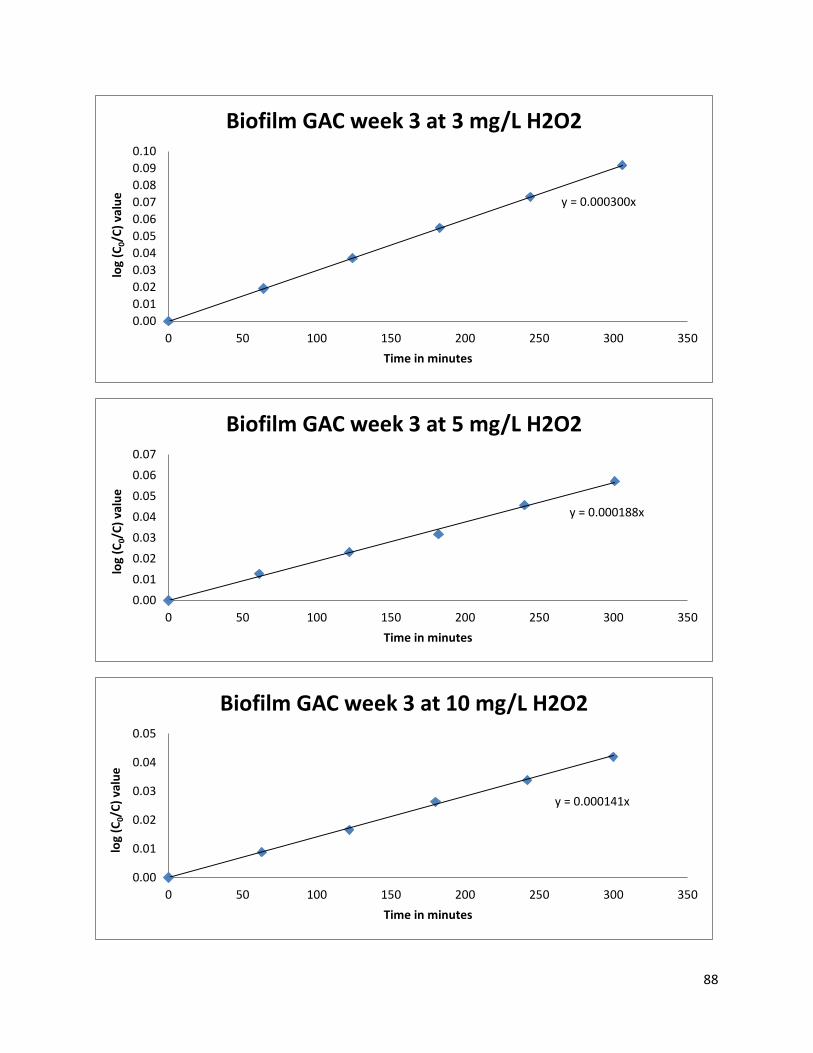
88
y = 0.000300x
0.00
0.01
0.02
0.03
0.04
0.05
0.06
0.07
0.08
0.09
0.10
0 50 100 150 200 250 300 350
log
(C0/
C)
valu
e
Time in minutes
Biofilm GAC week 3 at 3 mg/L H2O2
y = 0.000188x
0.00
0.01
0.02
0.03
0.04
0.05
0.06
0.07
0 50 100 150 200 250 300 350
log
(C0/C
) va
lue
Time in minutes
Biofilm GAC week 3 at 5 mg/L H2O2
y = 0.000141x
0.00
0.01
0.02
0.03
0.04
0.05
0 50 100 150 200 250 300 350
log
(C0/
C)
valu
e
Time in minutes
Biofilm GAC week 3 at 10 mg/L H2O2
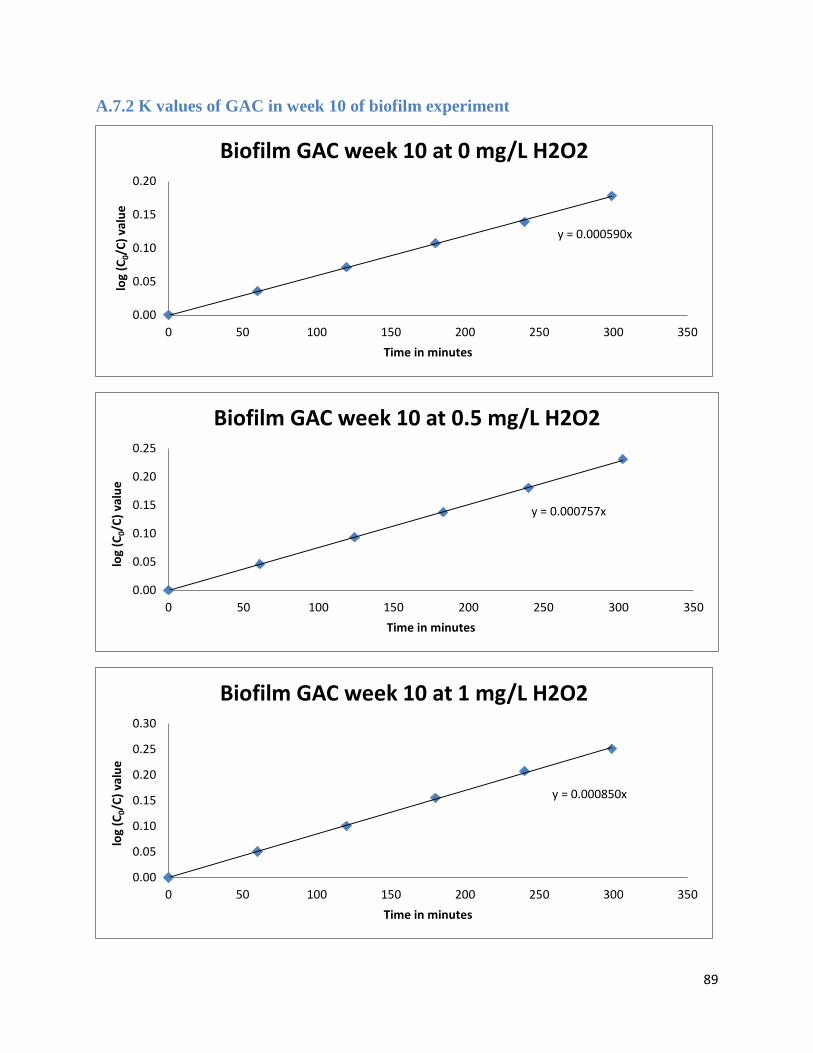
89
A.7.2 K values of GAC in week 10 of biofilm experiment
y = 0.000590x
0.00
0.05
0.10
0.15
0.20
0 50 100 150 200 250 300 350
log
(C0/
C)
valu
e
Time in minutes
Biofilm GAC week 10 at 0 mg/L H2O2
y = 0.000757x
0.00
0.05
0.10
0.15
0.20
0.25
0 50 100 150 200 250 300 350
log
(C0/
C)
valu
e
Time in minutes
Biofilm GAC week 10 at 0.5 mg/L H2O2
y = 0.000850x
0.00
0.05
0.10
0.15
0.20
0.25
0.30
0 50 100 150 200 250 300 350
log
(C0/
C)
valu
e
Time in minutes
Biofilm GAC week 10 at 1 mg/L H2O2

90
y = 0.001357x
0.00
0.10
0.20
0.30
0.40
0.50
0 50 100 150 200 250 300 350
log
(C0/
C)
valu
e
Time in minutes
Biofilm GAC week 10 at 3 mg/L H2O2
y = 0.000301x
0.00
0.02
0.04
0.06
0.08
0.10
0 50 100 150 200 250 300 350
log
(C0/
C)
valu
e
Time in minutes
Biofilm GAC week 10 at 5 mg/L H2O2
y = 0.0012x
0.00
0.05
0.10
0.15
0.20
0.25
0.30
0.35
0.40
0 50 100 150 200 250 300 350
log
(C0/
C)
valu
e
Time in minutes
Biofilm GAC week 10 at 10 mg/L H2O2
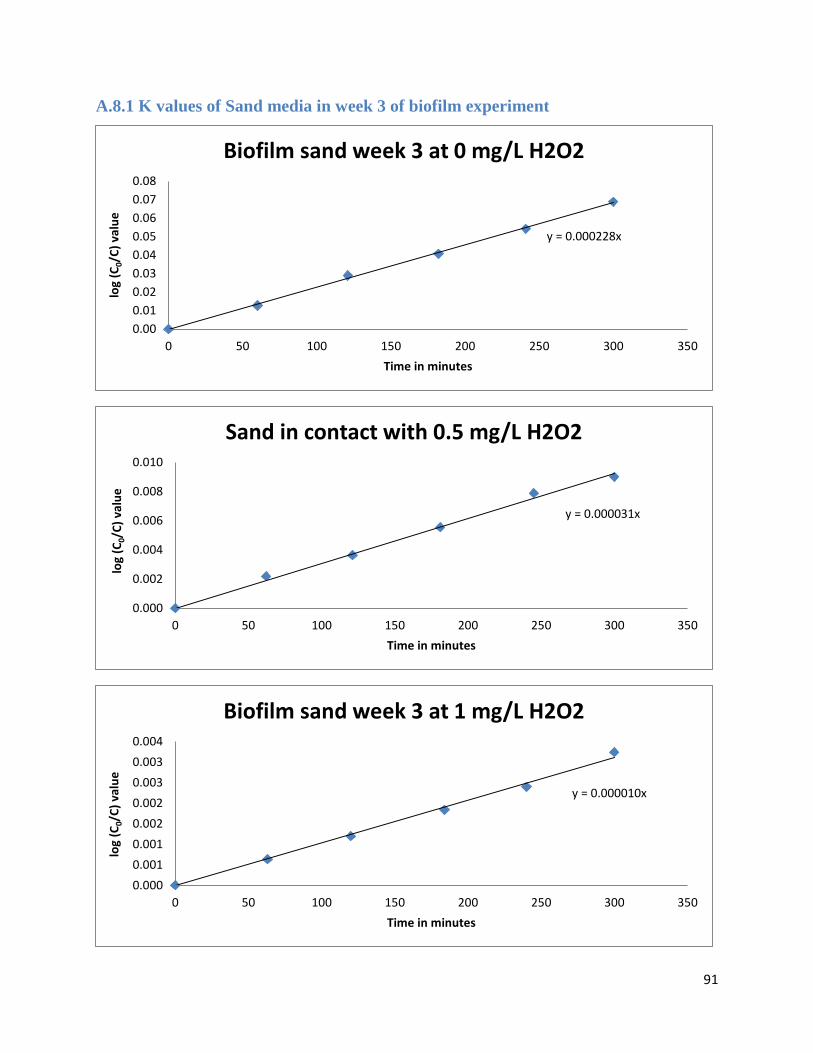
91
A.8.1 K values of Sand media in week 3 of biofilm experiment
y = 0.000228x
0.00
0.01
0.02
0.03
0.04
0.05
0.06
0.07
0.08
0 50 100 150 200 250 300 350
log
(C0/
C)
valu
e
Time in minutes
Biofilm sand week 3 at 0 mg/L H2O2
y = 0.000031x
0.000
0.002
0.004
0.006
0.008
0.010
0 50 100 150 200 250 300 350
log
(C0/
C)
valu
e
Time in minutes
Sand in contact with 0.5 mg/L H2O2
y = 0.000010x
0.000
0.001
0.001
0.002
0.002
0.003
0.003
0.004
0 50 100 150 200 250 300 350
log
(C0/
C)
valu
e
Time in minutes
Biofilm sand week 3 at 1 mg/L H2O2
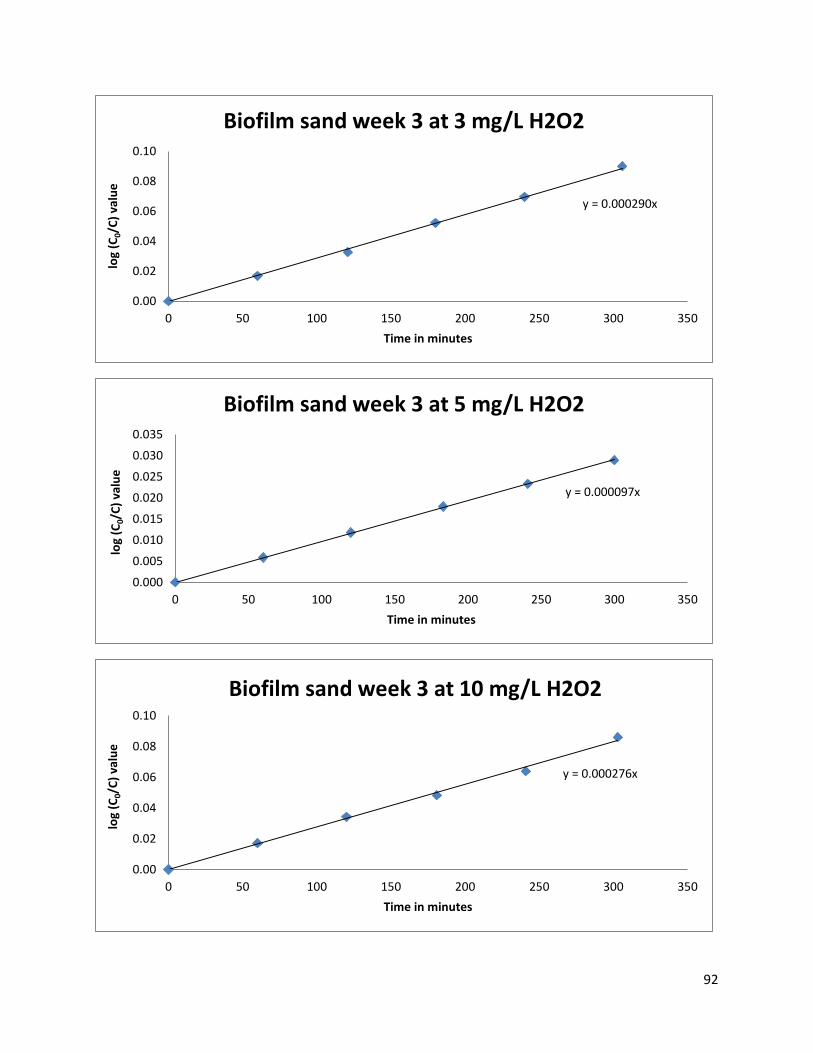
92
y = 0.000290x
0.00
0.02
0.04
0.06
0.08
0.10
0 50 100 150 200 250 300 350
log
(C0/
C)
valu
e
Time in minutes
Biofilm sand week 3 at 3 mg/L H2O2
y = 0.000097x
0.000
0.005
0.010
0.015
0.020
0.025
0.030
0.035
0 50 100 150 200 250 300 350
log
(C0/C
) va
lue
Time in minutes
Biofilm sand week 3 at 5 mg/L H2O2
y = 0.000276x
0.00
0.02
0.04
0.06
0.08
0.10
0 50 100 150 200 250 300 350
log
(C0/
C)
valu
e
Time in minutes
Biofilm sand week 3 at 10 mg/L H2O2

93
A.8.2 K values of Sand media in week 10 of biofilm experiment
y = 0.000493x
0.00
0.02
0.04
0.06
0.08
0.10
0.12
0.14
0.16
0 50 100 150 200 250 300 350
log
(C0/C
) va
lue
Time in minutes
Biofilm GAC week 10 at 0 mg/L H2O2
y = 0.000133x
0.00
0.01
0.02
0.03
0.04
0.05
0 50 100 150 200 250 300 350
log
(C0/C
) va
lue
Time in minutes
Biofilm GAC week 10 at 0.5 mg/L H2O2
y = 0.000179x
0.00
0.01
0.02
0.03
0.04
0.05
0.06
0 50 100 150 200 250 300 350
log
(C0/
C)
valu
e
Time in minutes
Biofilm GAC week 10 at 1 mg/L H2O2
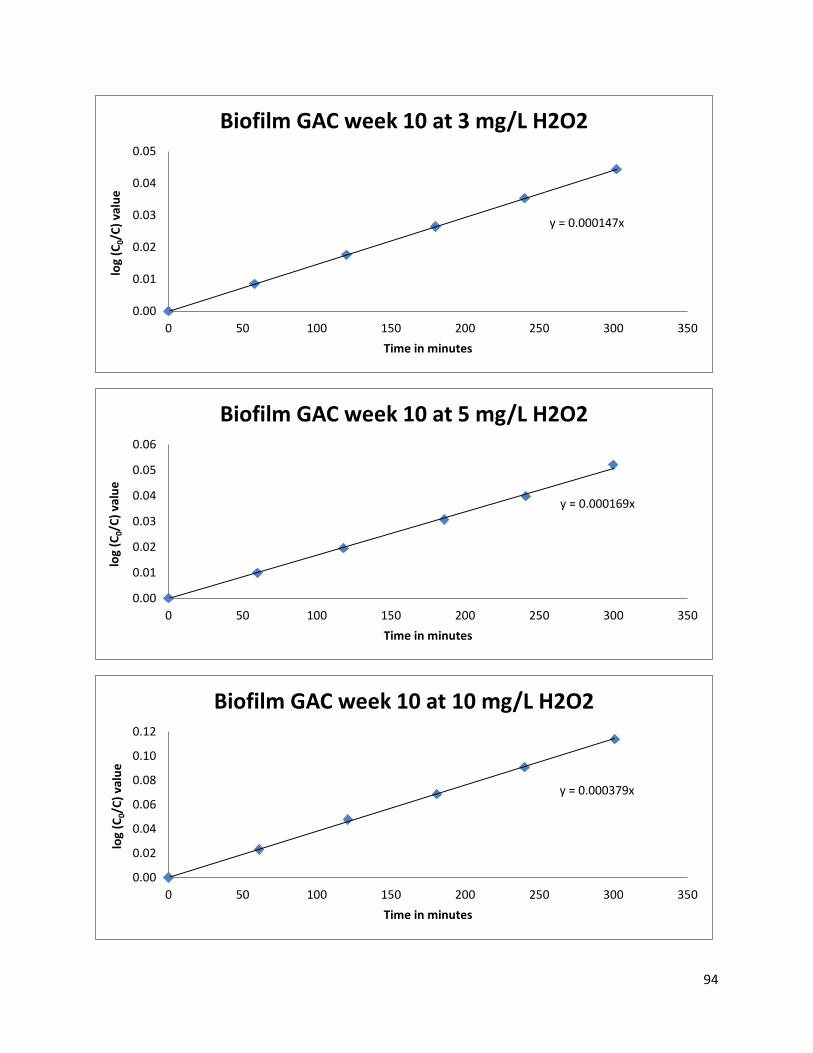
94
y = 0.000147x
0.00
0.01
0.02
0.03
0.04
0.05
0 50 100 150 200 250 300 350
log
(C0/
C)
valu
e
Time in minutes
Biofilm GAC week 10 at 3 mg/L H2O2
y = 0.000169x
0.00
0.01
0.02
0.03
0.04
0.05
0.06
0 50 100 150 200 250 300 350
log
(C0/C
) va
lue
Time in minutes
Biofilm GAC week 10 at 5 mg/L H2O2
y = 0.000379x
0.00
0.02
0.04
0.06
0.08
0.10
0.12
0 50 100 150 200 250 300 350
log
(C0/
C)
valu
e
Time in minutes
Biofilm GAC week 10 at 10 mg/L H2O2
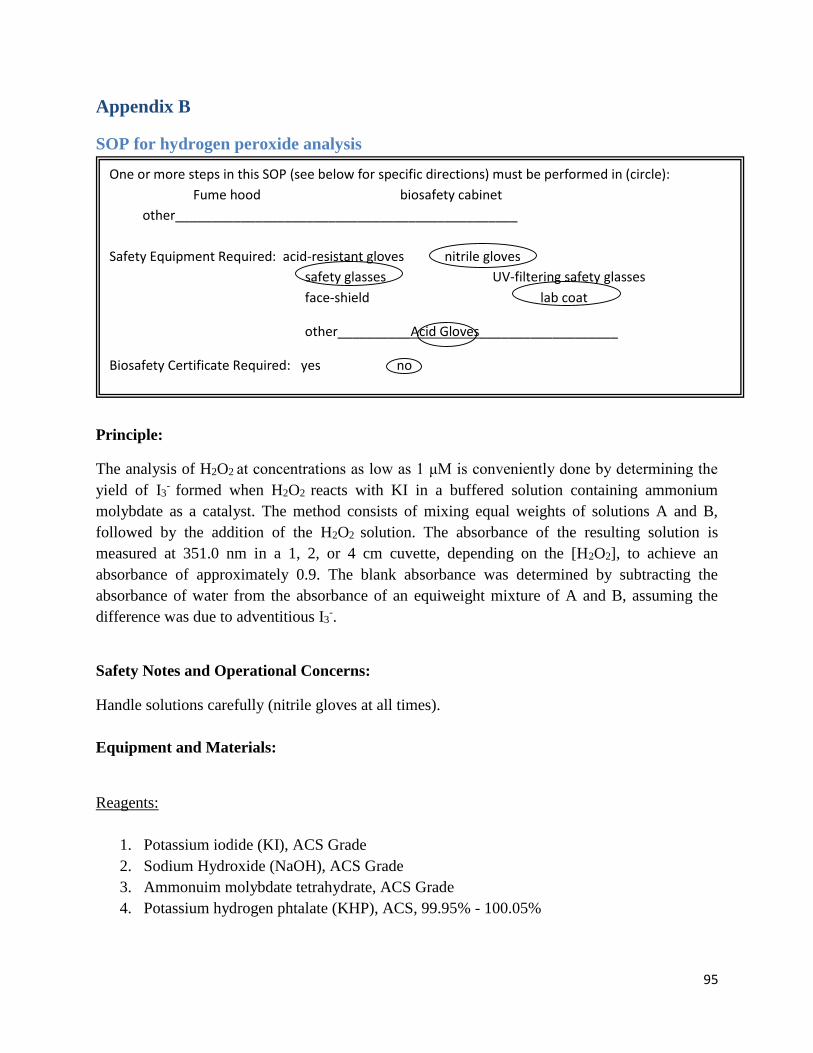
95
Appendix B
SOP for hydrogen peroxide analysis
Principle:
The analysis of H2O2 at concentrations as low as 1 μM is conveniently done by determining the
yield of I3-
formed when H2O2 reacts with KI in a buffered solution containing ammonium
molybdate as a catalyst. The method consists of mixing equal weights of solutions A and B,
followed by the addition of the H2O2 solution. The absorbance of the resulting solution is
measured at 351.0 nm in a 1, 2, or 4 cm cuvette, depending on the [H2O2], to achieve an
absorbance of approximately 0.9. The blank absorbance was determined by subtracting the
absorbance of water from the absorbance of an equiweight mixture of A and B, assuming the
difference was due to adventitious I3-.
Safety Notes and Operational Concerns:
Handle solutions carefully (nitrile gloves at all times).
Equipment and Materials:
Reagents:
1. Potassium iodide (KI), ACS Grade
2. Sodium Hydroxide (NaOH), ACS Grade
3. Ammonuim molybdate tetrahydrate, ACS Grade
4. Potassium hydrogen phtalate (KHP), ACS, 99.95% - 100.05%
One or more steps in this SOP (see below for specific directions) must be performed in (circle):
Fume hood biosafety cabinet
other_______________________________________________
Safety Equipment Required: acid-resistant gloves nitrile gloves
safety glasses UV-filtering safety glasses
face-shield lab coat
other__________Acid Gloves___________________
Biosafety Certificate Required: yes no
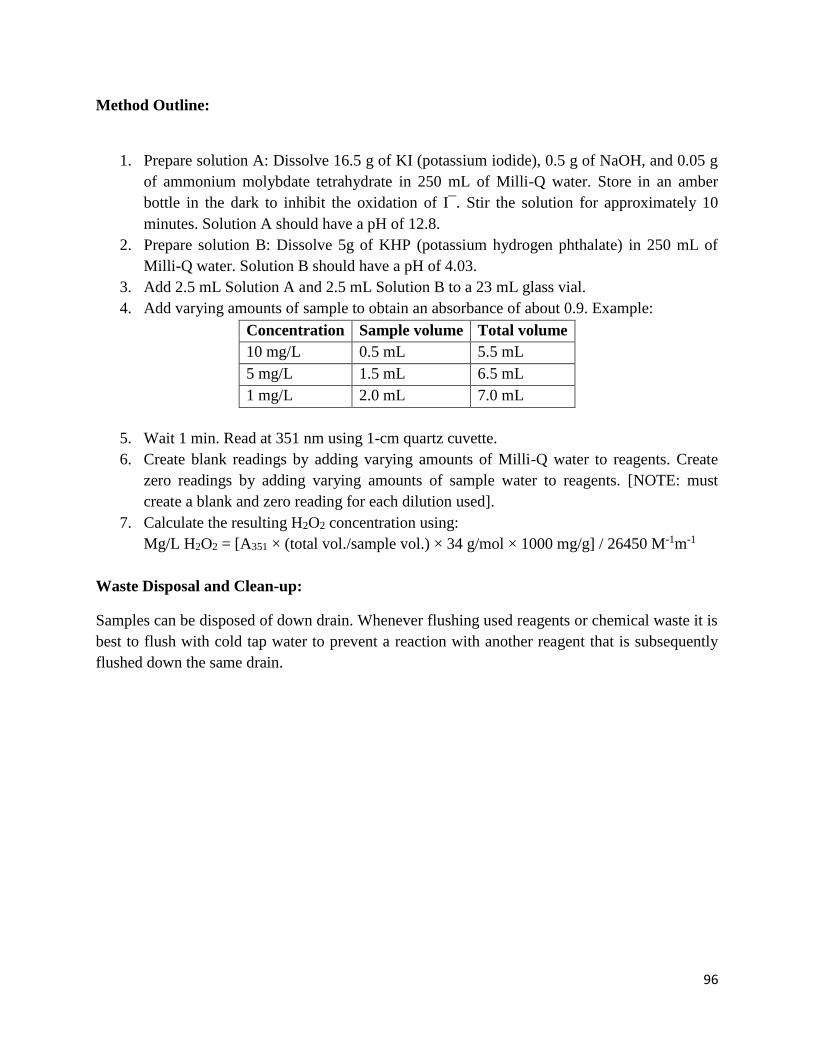
96
Method Outline:
1. Prepare solution A: Dissolve 16.5 g of KI (potassium iodide), 0.5 g of NaOH, and 0.05 g
of ammonium molybdate tetrahydrate in 250 mL of Milli-Q water. Store in an amber
bottle in the dark to inhibit the oxidation of I¯. Stir the solution for approximately 10
minutes. Solution A should have a pH of 12.8.
2. Prepare solution B: Dissolve 5g of KHP (potassium hydrogen phthalate) in 250 mL of
Milli-Q water. Solution B should have a pH of 4.03.
3. Add 2.5 mL Solution A and 2.5 mL Solution B to a 23 mL glass vial.
4. Add varying amounts of sample to obtain an absorbance of about 0.9. Example:
Concentration Sample volume Total volume
10 mg/L 0.5 mL 5.5 mL
5 mg/L 1.5 mL 6.5 mL
1 mg/L 2.0 mL 7.0 mL
5. Wait 1 min. Read at 351 nm using 1-cm quartz cuvette.
6. Create blank readings by adding varying amounts of Milli-Q water to reagents. Create
zero readings by adding varying amounts of sample water to reagents. [NOTE: must
create a blank and zero reading for each dilution used].
7. Calculate the resulting H2O2 concentration using:
Mg/L H2O2 = [A351 × (total vol./sample vol.) × 34 g/mol × 1000 mg/g] / 26450 M-1m-1
Waste Disposal and Clean-up:
Samples can be disposed of down drain. Whenever flushing used reagents or chemical waste it is
best to flush with cold tap water to prevent a reaction with another reagent that is subsequently
flushed down the same drain.
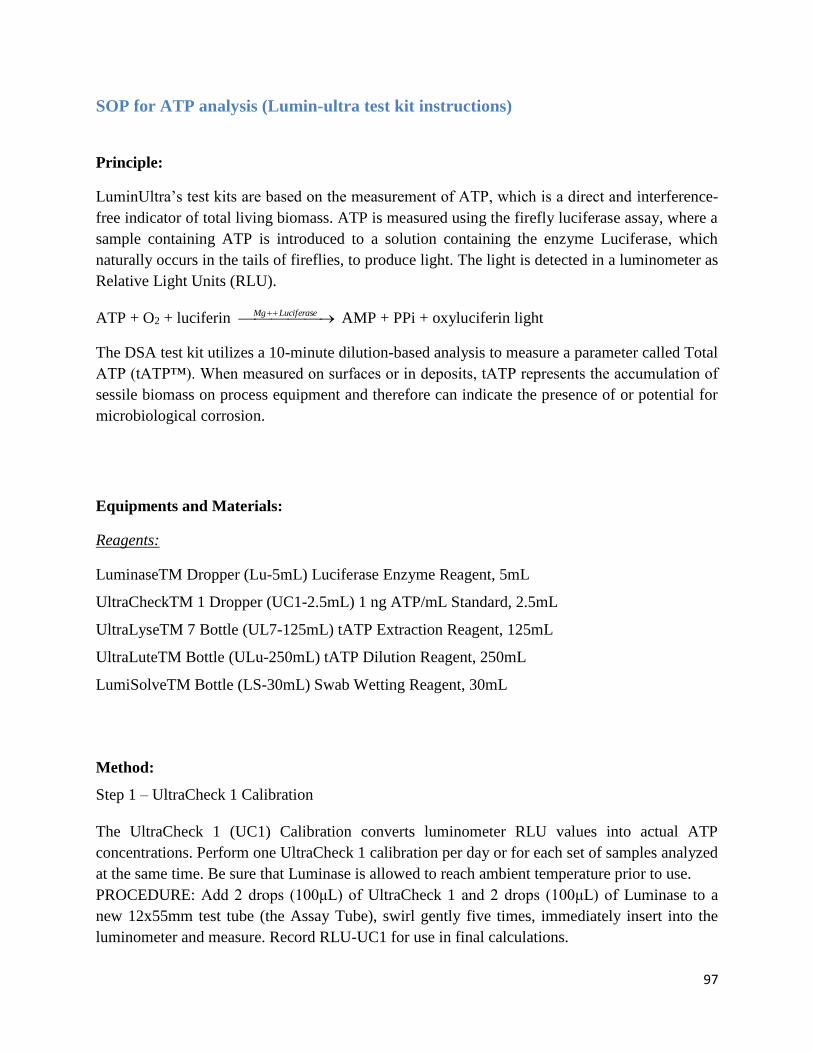
97
SOP for ATP analysis (Lumin-ultra test kit instructions)
Principle:
LuminUltra’s test kits are based on the measurement of ATP, which is a direct and interference-
free indicator of total living biomass. ATP is measured using the firefly luciferase assay, where a
sample containing ATP is introduced to a solution containing the enzyme Luciferase, which
naturally occurs in the tails of fireflies, to produce light. The light is detected in a luminometer as
Relative Light Units (RLU).
ATP + O2 + luciferin LuciferaseMg AMP + PPi + oxyluciferin light
The DSA test kit utilizes a 10-minute dilution-based analysis to measure a parameter called Total
ATP (tATP™). When measured on surfaces or in deposits, tATP represents the accumulation of
sessile biomass on process equipment and therefore can indicate the presence of or potential for
microbiological corrosion.
Equipments and Materials:
Reagents:
LuminaseTM Dropper (Lu-5mL) Luciferase Enzyme Reagent, 5mL
UltraCheckTM 1 Dropper (UC1-2.5mL) 1 ng ATP/mL Standard, 2.5mL
UltraLyseTM 7 Bottle (UL7-125mL) tATP Extraction Reagent, 125mL
UltraLuteTM Bottle (ULu-250mL) tATP Dilution Reagent, 250mL
LumiSolveTM Bottle (LS-30mL) Swab Wetting Reagent, 30mL
Method:
Step 1 – UltraCheck 1 Calibration
The UltraCheck 1 (UC1) Calibration converts luminometer RLU values into actual ATP
concentrations. Perform one UltraCheck 1 calibration per day or for each set of samples analyzed
at the same time. Be sure that Luminase is allowed to reach ambient temperature prior to use.
PROCEDURE: Add 2 drops (100μL) of UltraCheck 1 and 2 drops (100μL) of Luminase to a
new 12x55mm test tube (the Assay Tube), swirl gently five times, immediately insert into the
luminometer and measure. Record RLU-UC1 for use in final calculations.
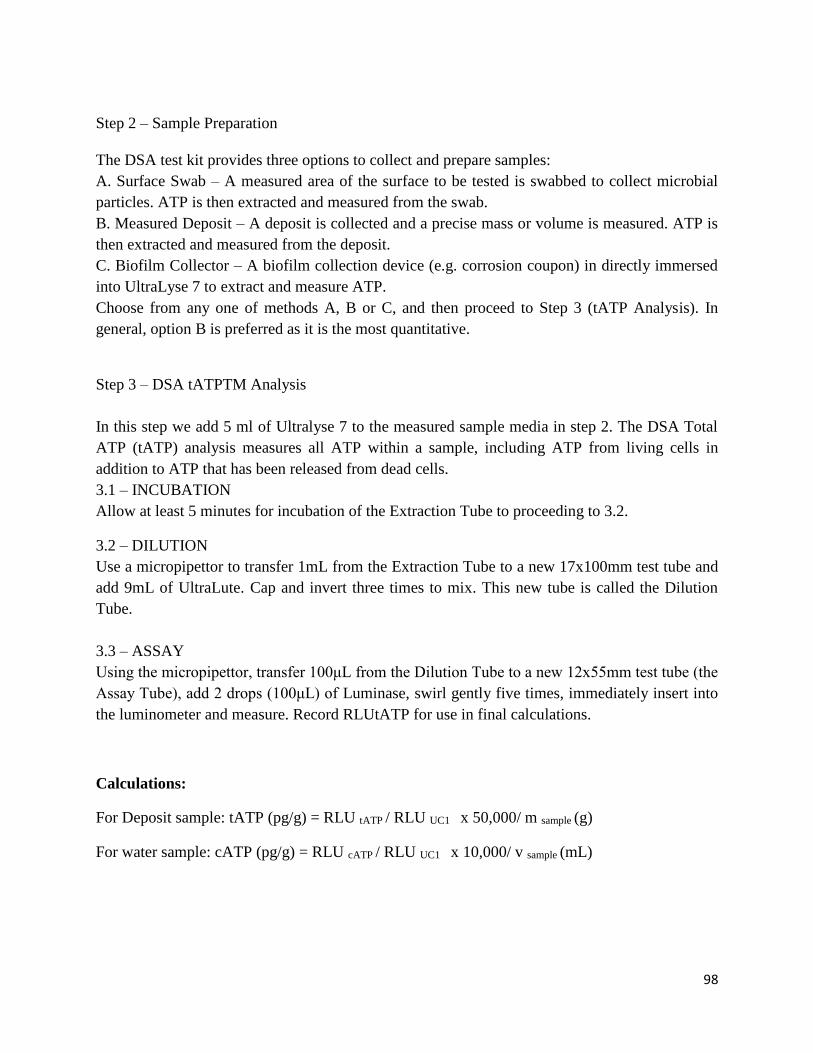
98
Step 2 – Sample Preparation
The DSA test kit provides three options to collect and prepare samples:
A. Surface Swab – A measured area of the surface to be tested is swabbed to collect microbial
particles. ATP is then extracted and measured from the swab.
B. Measured Deposit – A deposit is collected and a precise mass or volume is measured. ATP is
then extracted and measured from the deposit.
C. Biofilm Collector – A biofilm collection device (e.g. corrosion coupon) in directly immersed
into UltraLyse 7 to extract and measure ATP.
Choose from any one of methods A, B or C, and then proceed to Step 3 (tATP Analysis). In
general, option B is preferred as it is the most quantitative.
Step 3 – DSA tATPTM Analysis
In this step we add 5 ml of Ultralyse 7 to the measured sample media in step 2. The DSA Total
ATP (tATP) analysis measures all ATP within a sample, including ATP from living cells in
addition to ATP that has been released from dead cells.
3.1 – INCUBATION
Allow at least 5 minutes for incubation of the Extraction Tube to proceeding to 3.2.
3.2 – DILUTION
Use a micropipettor to transfer 1mL from the Extraction Tube to a new 17x100mm test tube and
add 9mL of UltraLute. Cap and invert three times to mix. This new tube is called the Dilution
Tube.
3.3 – ASSAY
Using the micropipettor, transfer 100μL from the Dilution Tube to a new 12x55mm test tube (the
Assay Tube), add 2 drops (100μL) of Luminase, swirl gently five times, immediately insert into
the luminometer and measure. Record RLUtATP for use in final calculations.
Calculations:
For Deposit sample: tATP (pg/g) = RLU tATP / RLU UC1 x 50,000/ m sample (g)
For water sample: cATP (pg/g) = RLU cATP / RLU UC1 x 10,000/ v sample (mL)
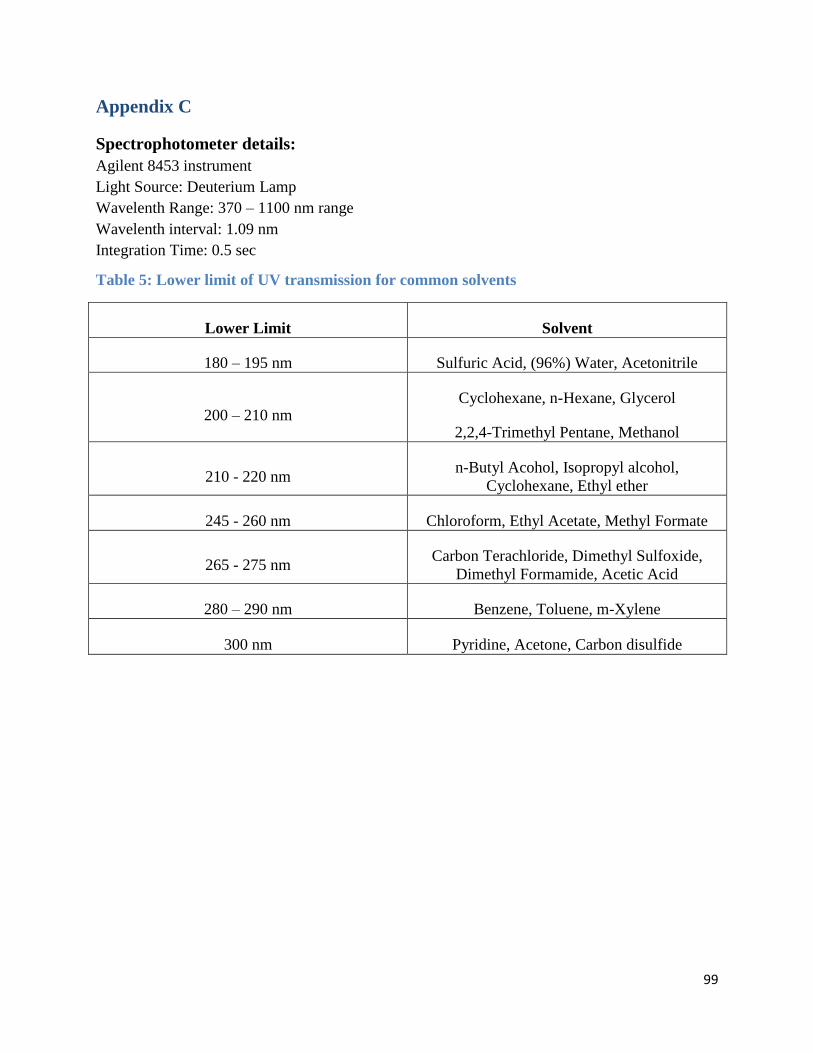
99
Appendix C
Spectrophotometer details:
Agilent 8453 instrument
Light Source: Deuterium Lamp
Wavelenth Range: 370 – 1100 nm range
Wavelenth interval: 1.09 nm
Integration Time: 0.5 sec
Table 5: Lower limit of UV transmission for common solvents
Lower Limit Solvent
180 – 195 nm Sulfuric Acid, (96%) Water, Acetonitrile
200 – 210 nm Cyclohexane, n-Hexane, Glycerol
2,2,4-Trimethyl Pentane, Methanol
210 - 220 nm n-Butyl Acohol, Isopropyl alcohol,
Cyclohexane, Ethyl ether
245 - 260 nm Chloroform, Ethyl Acetate, Methyl Formate
265 - 275 nm Carbon Terachloride, Dimethyl Sulfoxide,
Dimethyl Formamide, Acetic Acid
280 – 290 nm Benzene, Toluene, m-Xylene
300 nm Pyridine, Acetone, Carbon disulfide
Recommended