Quantitative PCR Session 3: Instrument and Software
Presented by:
Robert O'BrienTraining Specialist – Forensic Biology

Quantitative PCRSession 3- Instrument and Software
Instrument Operation AB 7500
Processing Multicomponent data
Initial Instrument Set up
Software Set-up
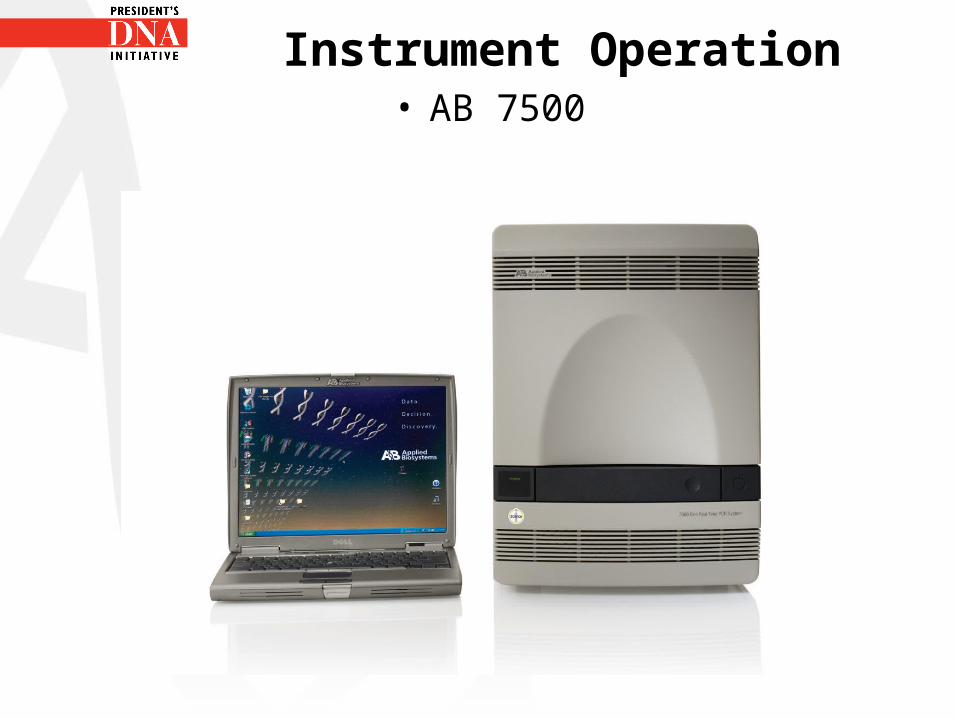
Instrument Operation• AB 7500
Instrument Operation
Basic Principle
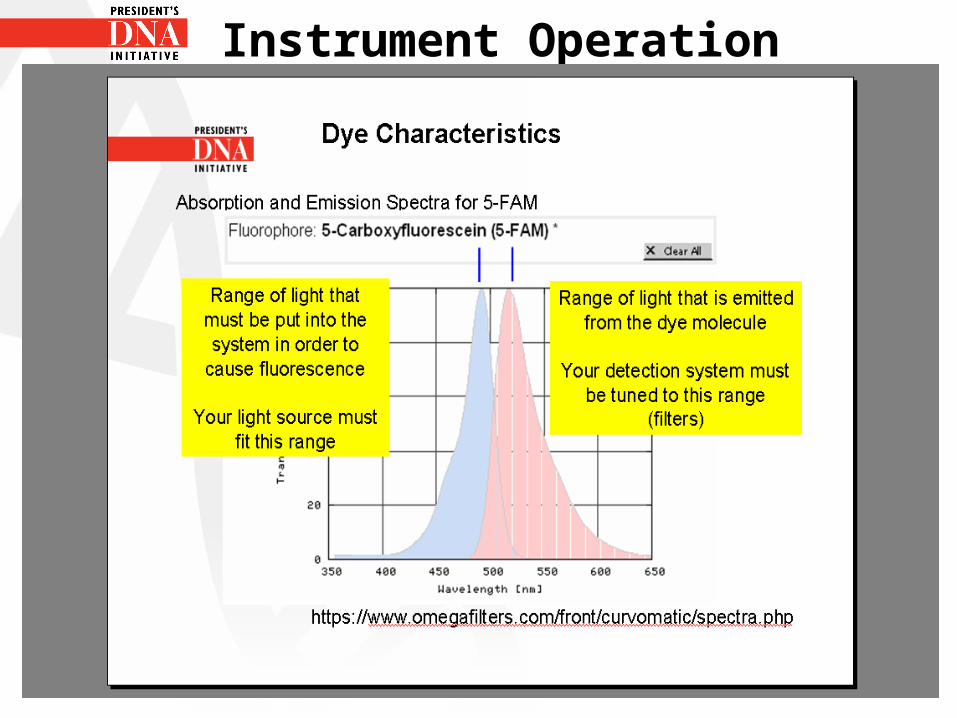
• Light hits a tube/ vessel containing the PCR reaction once per cycle
• Fluorescent dyes if activated emit light corresponding to their spectral characteristics
• Emitted light is focused on a detector• Computer software interface interprets the
detector signal
Instrument Operation
• For AB 7500 light source is a tungsten halogen lamp
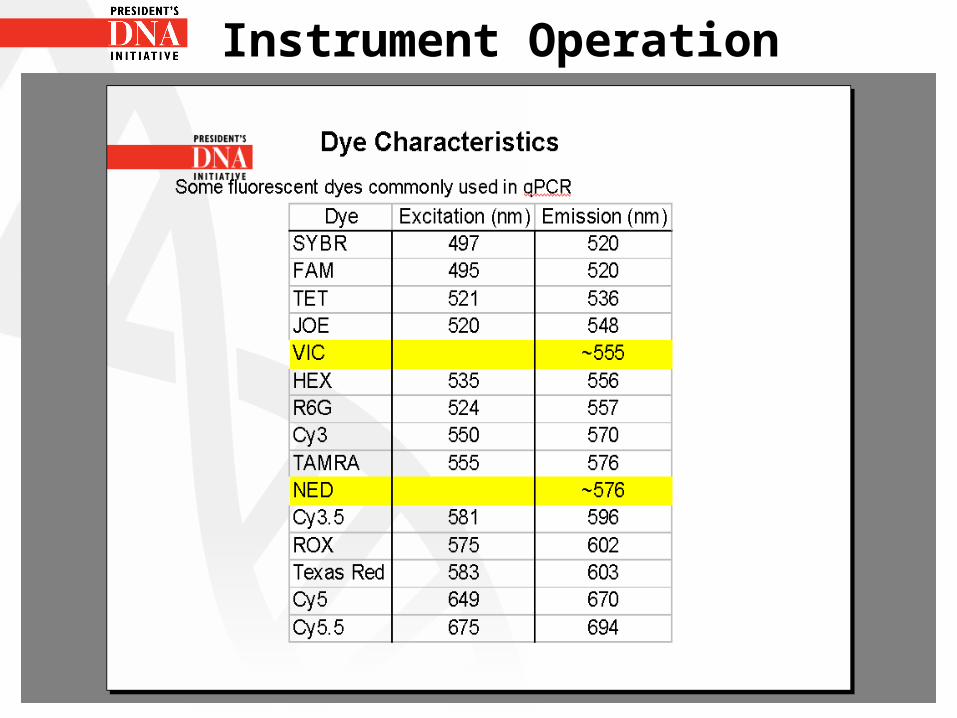
• Fluorescent dyes have wavelengths in 500nm to 700nm range
• Filters are in place which allow light of a specific wavelength onto the detector
• The detector is a CCD camera (CCD- charged couple device).
Instrument Operation
CCD- Charged couple device is a light sensitive integrated circuit that stores and displays data for an image in such a way that each pixel in the image is converted into an electrical signal.
The electrical signal is read by the software
Instrument Operation
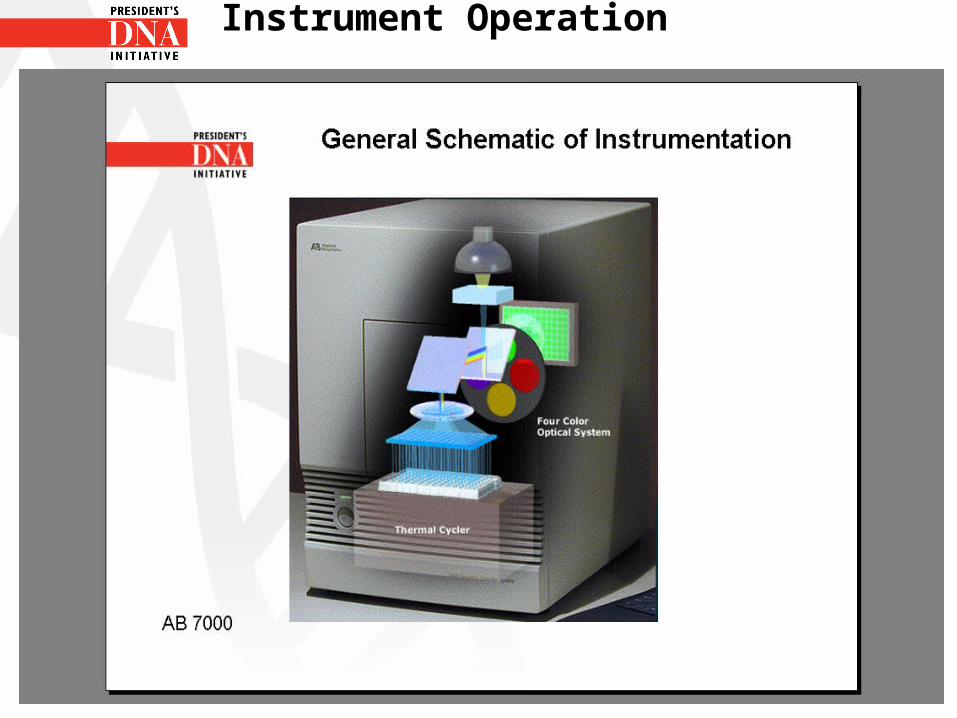
• The AB 7500 has a thermal block which is needed for the heating and cooling that is required for the PCR reaction
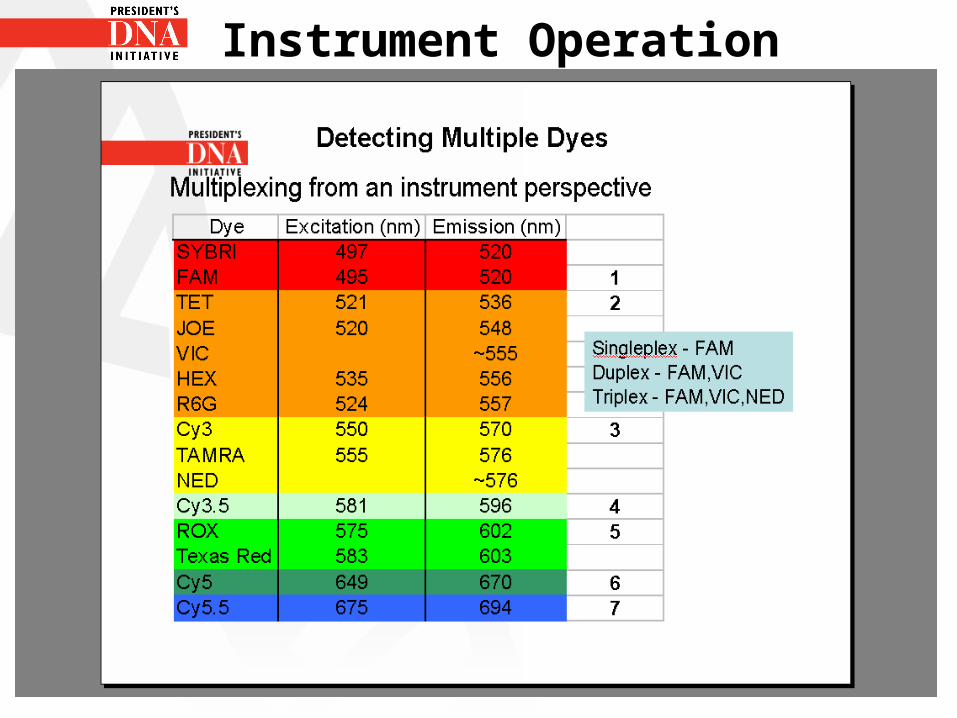
• The filter the light passes through allows for multiplexing of different dyes as mentioned earlier FAM dye for DNA sample, VIC dye for IPC
Instrument Operation
Instrument Operation
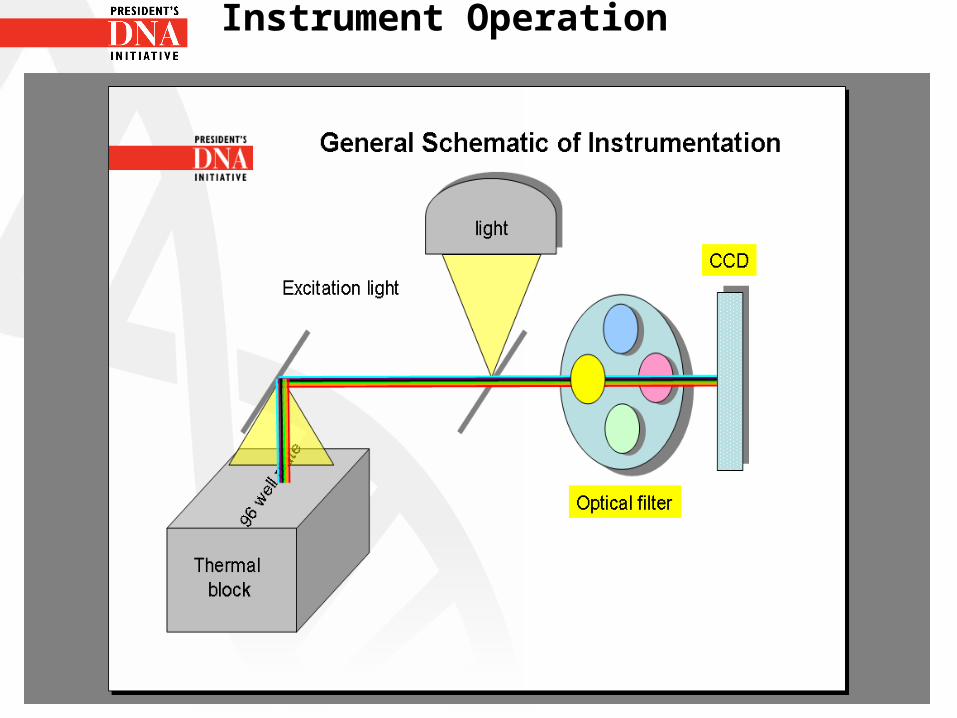
PCR detection system• Tungsten halogen lamp directs light to each well
of a 96 well optical plate• Light passes through the optical adhesive cover
and excites the fluorescent dyes in the samples• A system of lenses, filters, and a dichroic mirror
focuses the fluorescence emission into a charge-coupled device (CCD) camera.
• Based on the wavelength the filters separate the light into a predictably spaced pattern across the CCD camera
Instrument Operation
Instrument Operation
PCR Detection system
• During the run the CCD camera detects wavelengths between 500nm and 660nm from each well
• The SDS (Sequence Detection Systems) software obtains the fluorescence emission data from the CCD camera and applies data analysis algorithms
Instrument Operation
Instrument Operation
Instrument Operation
Processing multicomponent data
• During the multicomponent transformation the SDS software uses algorithms to determine the contribution of each dye.
• Before the contribution of the individual dyes are assessed other contributions to the composite spectrum of the dyes must be taken into account.
Quantitative PCR

Processing multicomponent data
• An algorithm removes the background component stored in the background calibration file
• A background calibration run is done when the instrument is first set up.
• The background calibration run determines how much background signal the instrument produces during a quantifiler run.
Processing multicomponent data
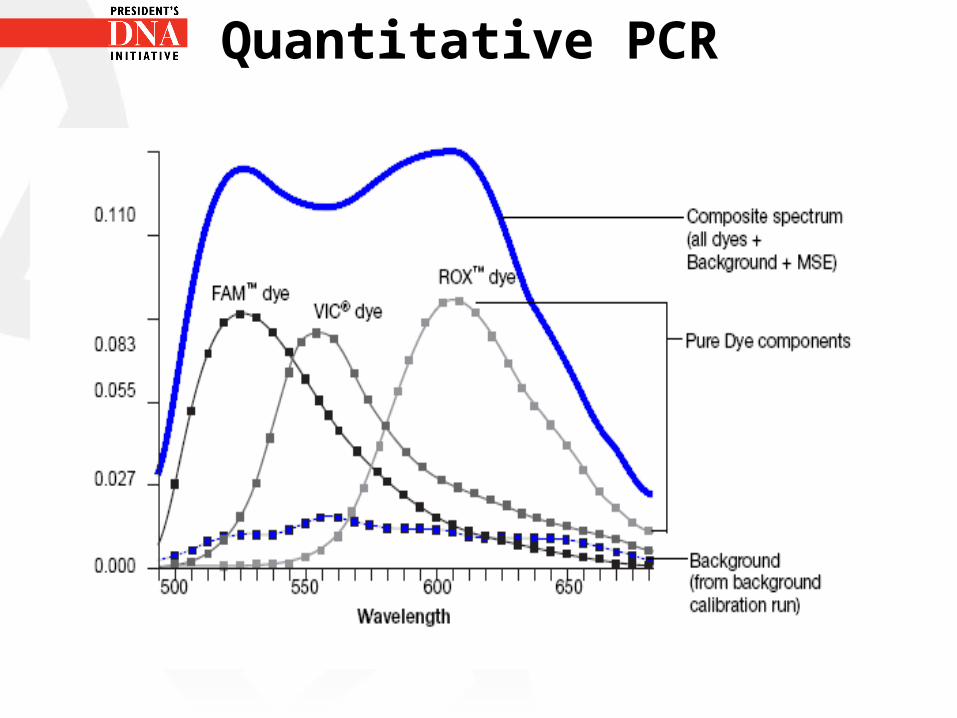
• Pure dye standards are run during initial instrument set up
• The software is able to use the extracted pure dye standards to express the composite spectrum in terms of the pure dye components
• Once the composite spectrum is broken down into its pure dye components an algorithm applies matrix calculations to determine the contributions of each dye component
Processing multicomponent data
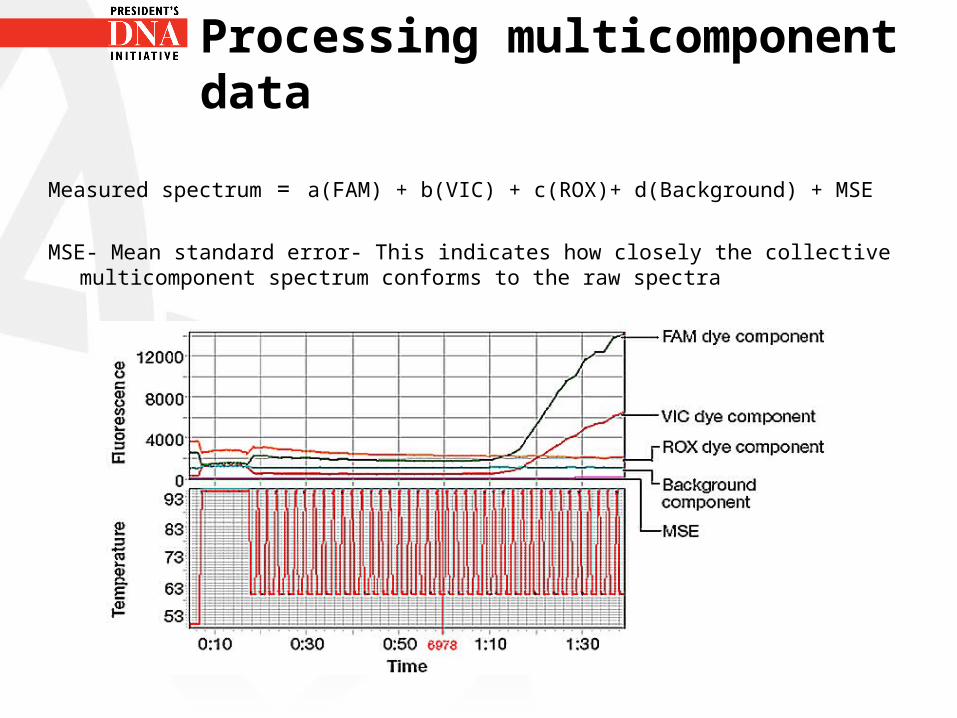
Measured spectrum = a(FAM) + b(VIC) + c(ROX)+ d(Background) + MSE
MSE- Mean standard error- This indicates how closely the collective multicomponent spectrum conforms to the raw spectra
Processing multicomponent data
Purpose of ROX
ROX- a passive reference dye
It is not involved in the PCR reaction
It is used to normalize the reporter signal
Processing multicomponent data
•ROX reporter dye is present in every well so it is exposed to the same conditions as the samples in the well
•Therefore if there are fluctuations in the signals produced by the dyes that may be related to electrical fluctuations for example, the ROX dye will also experience these fluctuations which are taken into account when interpreting the strength of the signal and in turn the quantity of DNA.
Processing multicomponent data
• The SDS software normalizes each reporter signal by dividing it by the fluorescent signal of the passive reference
• Rn (normalized reporter signal)= Reporter fluorescence Passive reporter fluorescence
Normalizing the reporter signal allows the software to make better well to well comparisons of reporter signal
During real-time PCR the Rn is increasing as the amount of specific amplified product increases
Processing multicomponent data
• Background – is the fluorescence given off during the first few cycles of the PCR reaction.
• Baseline is set during the first few cycles usually between 6 and 15
• Software then calculates the ΔRn• ΔRn = Rn value – baseline• Cycle where ΔRn value crosses the threshold is
the CT value.
Initial Instrument Set-up
When the AB 7500 first arrives in the lab several calibrations must be done before the instrument can be used to run samples
Region of Interest calibration (ROI)
Background calibration
Pure Dye Calibrations
Instrument verification run
Initial Instrument Set-up
• Even though only a few people will have to be involved in the initial instrument set-up it is important that everyone knows what occurs during this process. Also the same calibrations performed during set up also need to be done as part of the regular maintenance.
Initial Instrument Set-up
Region of Interest calibration (ROI)
ROI – This is mapping the positions of the wells on the sample block so that the software can associate increases in fluorescence with different wells
The instrument uses a set of optic filters to distinguish the fluorescence emissions gathered during the runs
ROI generates a calibration image for each individual filter to account for minor differences in the optical path
Initial Instrument Set-up
Region of Interest calibration (ROI)
•It is expected there will be minor fluctuations throughout a plate from well to well
•The instrument must know what these fluctuations are so they are not included in what the instrument is reading as fluorescence from the samples in the wells
ROI normalizes the wells
Since you are dealing with very small amounts of DNA minor fluctuations can change final quantity readings
Initial Instrument Set-upBackground calibration
• Purpose of background calibration is to measure the amount of background fluorescence in the instrument
• The measure of the background fluorescence is important so in future runs this value can be subtracted out of the fluorescent signals from the samples
Sources of background fluorescence• Background electronic signal• Contaminants in sample block• Plastic consumables (plates and caps)

Initial Instrument Set-up
Background calibration
• If contamination is detected in the sample block then the wells where the contamination was identified should be cleaned and the background calibration run again.
• During runs it is very important not to introduce any new contamination. This is why it is important that the base of optical plate is not handled or does not touch the counter surface.
• Contamination from handling may be incorrectly recorded as low levels of DNA in blank sample wells.
Initial Instrument Set-up
Pure Dye Calibrations
•Purpose- to provide the software with a way to distinguish the fluorescent signals from each dye
This is important because during a run the fluorescence from all the dyes come off together in a collective fluorescence
The software must have a way to separate out the individual contributions of the dyes in order to interpret their signal and the resulting quantities that will be calculated based on their fluorescence
Initial Instrument Set-up
Pure Dye Calibrations
• Pure dye calibration- collects spectral data from a series of pure dye standards. It then stores the spectral information in the pure spectra run file which is a calibration file in the SDS directory.
• Software can then use the pure spectra data during subsequent runs to characterize pure dyes and distinguish the individual contribution of each dye in the collective fluorescence.
Initial Instrument Set-up
Pure Dye Calibrations
• A pure dye calibration is done for each dye in a separate plate.
• The pure dye plates are supplied by Applied Biosystems and they include all the dyes that are used for sample and IPC detection during a quantifiler run.
Initial Instrument Set-up
Instrument verification run
• Purpose- To test the system after all the calibrations have been performed and before samples and standards are manually set up
• This run uses a RNase P plate which is preloaded with the reagents necessary for the detection and quantitation of genomic copies of the human RNase P gene
• RNase P gene is a single copy gene encoding the RNase moiety of the RNase P enzyme

Initial Instrument Set-up
Instrument verification run
Each well of the plate used for instrument verification contains :1x Taqman Universal PCR Master MixRNase P primersFAM dye labeled probeKnown concentrations of human genomic DNA template
All these components are preloaded in the plate so any problems with the run will be due to the instrument and not due to plate set up which can happen if plate was set up in house.
Initial Instrument Set-up
Instrument verification run
• After the run is complete the SDS software generates a standard curve from the averaged cycle (CT) values of the replicate groups of standards
• The SDS software then calculates the concentrations of two unknown sets of samples using the standard curve.
• Then it calculates the mean quantity and standard deviation for the different unknown sample populations to assess the instrument’s performance.
Initial Instrument Set-up
Instrument verification run
• The instrument passes the verification if the analyzed data demonstrates that the instrument distinguishes between the unknown genome equivalents with 99.7% confidence level.
Software set- up
•The software must be set up before the instrument can be used to run any samples
•The software used in quantifiler is SDS software – •SDS- Sequence Detection System
This set up should only need to be done one time and then the information saved so it can be used for future runs
The following must be set up
Plate documents
Thermal cycler conditions
Software set- up
Plate Documents
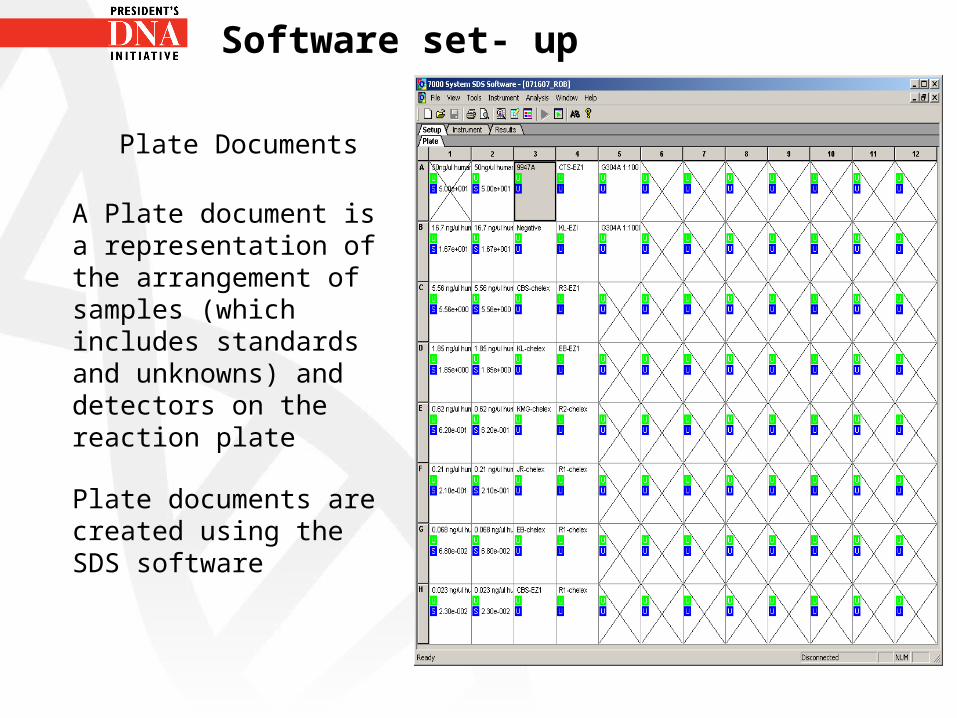
A Plate document is a representation of the arrangement of samples (which includes standards and unknowns) and detectors on the reaction plate
Plate documents are created using the SDS software
Software set- up
Plate Documents
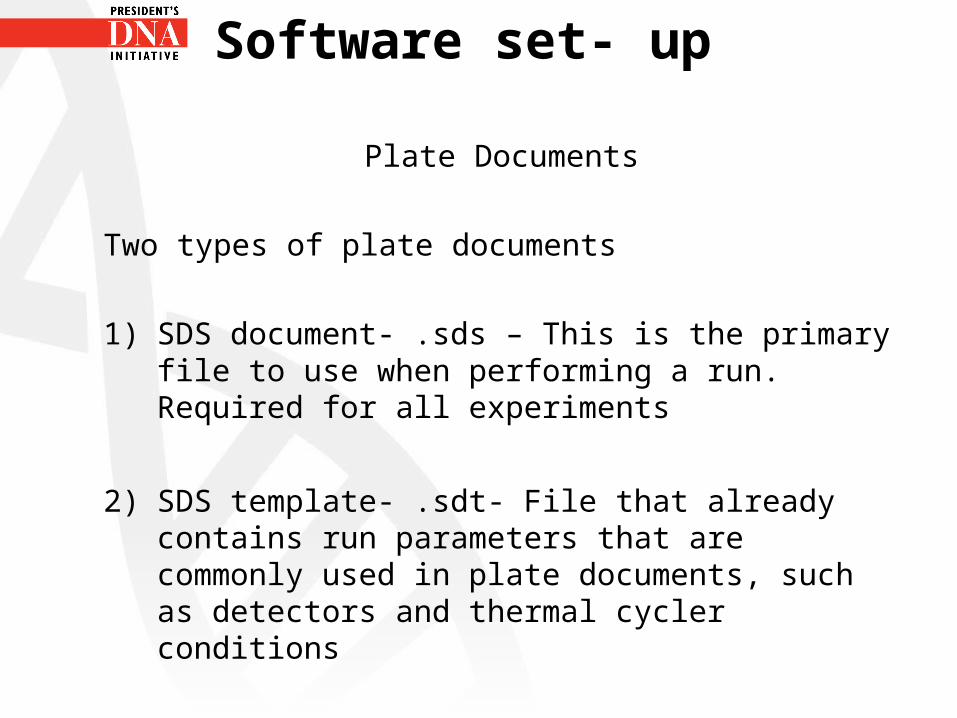
Two types of plate documents
1) SDS document- .sds – This is the primary file to use when performing a run. Required for all experiments
2) SDS template- .sdt- File that already contains run parameters that are commonly used in plate documents, such as detectors and thermal cycler conditions
Software set- upPlate Documents
A Plate document must be set up so that it corresponds exactly to the arrangement of the standards and unknown samples in the reaction plate.
Software set- upPlate Documents
Setting up a Plate document
To create a new plate document
AB Prism 7500
Go to AB Prism 7500 SDS Software
Once it is opened then go to File New
The next step will be to create detectors.
This is only done the first time the plate document is created.
Software set- upPlate Documents
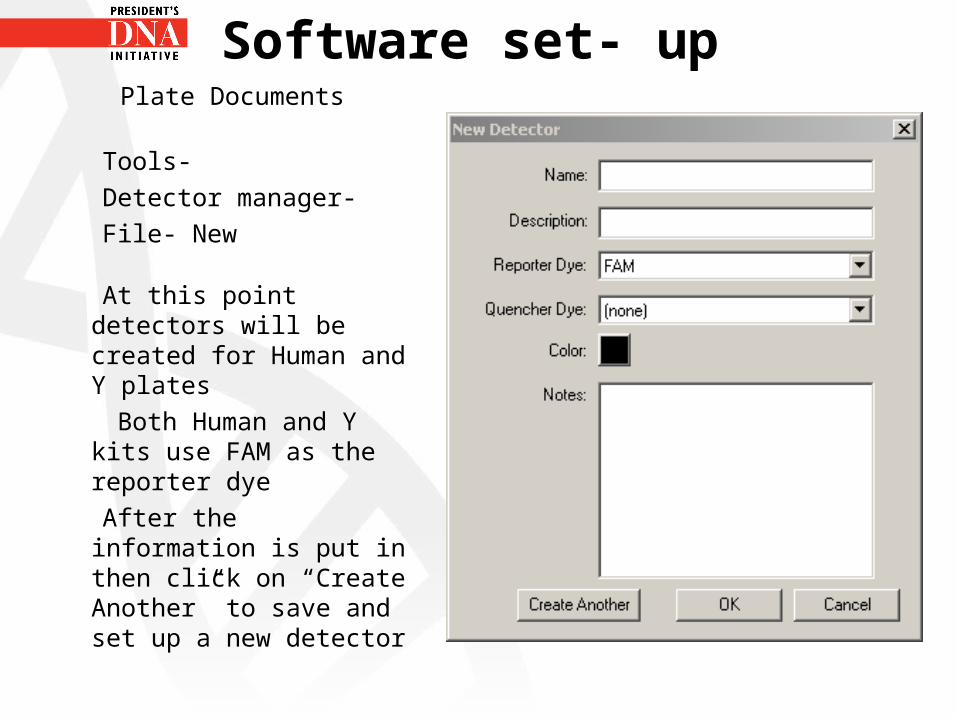
Tools-
Detector manager-
File- New
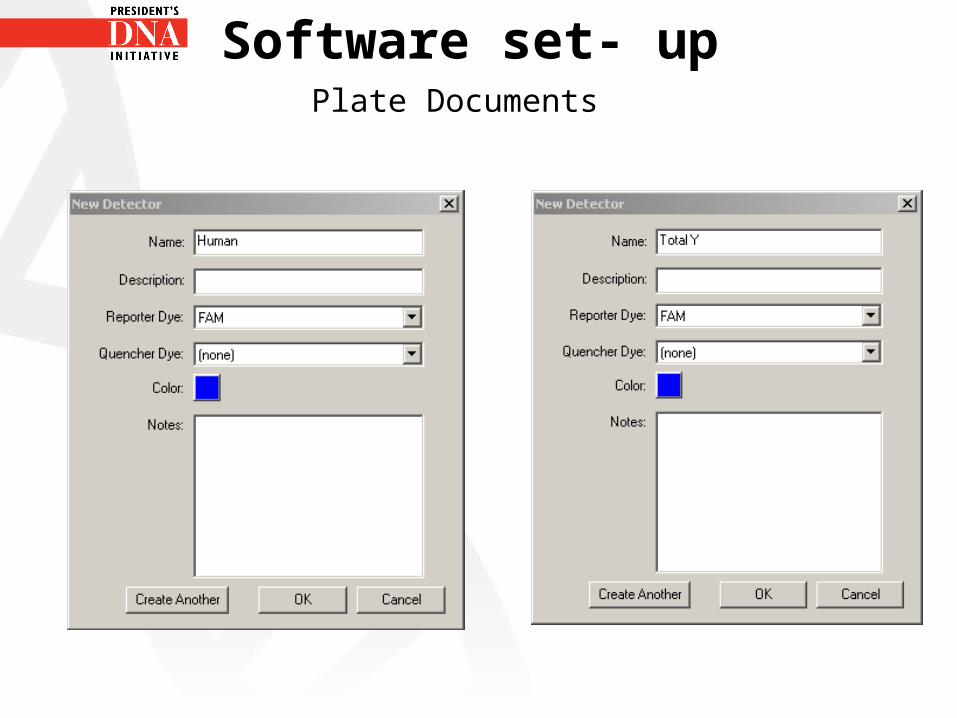
At this point detectors will be created for Human and Y plates
Both Human and Y kits use FAM as the reporter dye
After the information is put in then click on “Create Another” to save and set up a new detector
Software set- upPlate Documents
For Human and Y detectors the name must be entered
The dye selected is the same FAM
Description can be left blank
Quencher dye is left at default none
Color is selected to represent FAM
Same color can be chosen for both since one sample will not have both human and Y in same well
Software set- upPlate Documents
Software set- upPlate Documents
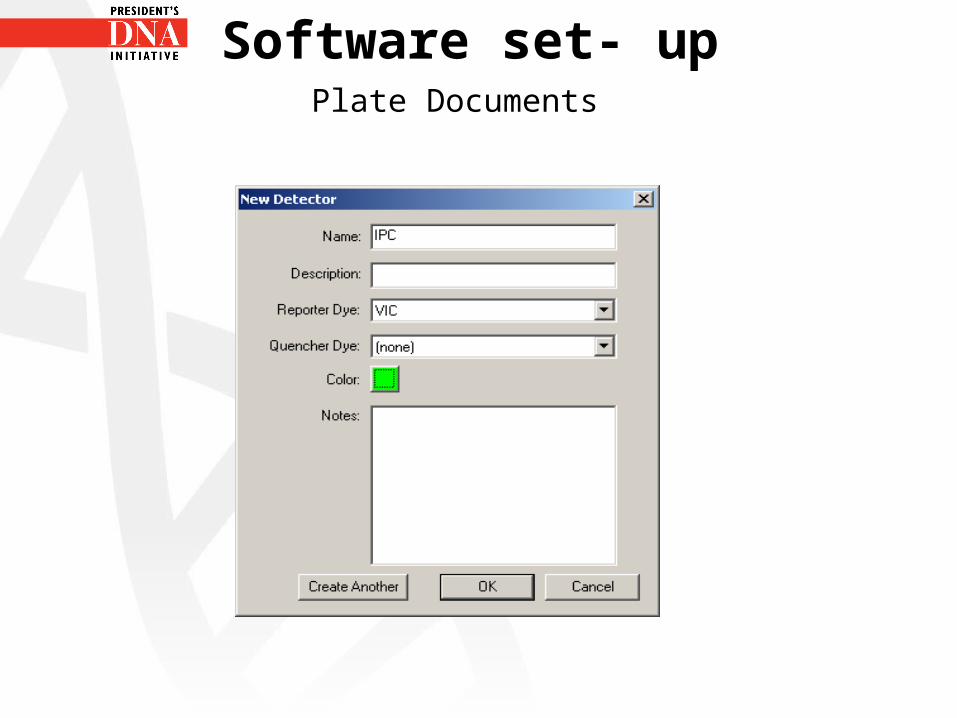
After Human and Y detectors are set up then a detector is set up for the IPC
The IPC reporter dye is VIC not FAM
Quencher dye is left at the default (none)
Color chosen to represent IPC is different from the color chosen for FAM
At the end of this click OK to add the IPC detector and to return to Detector manager dialog box
Software set- upPlate Documents
Software set- upPlate Documents
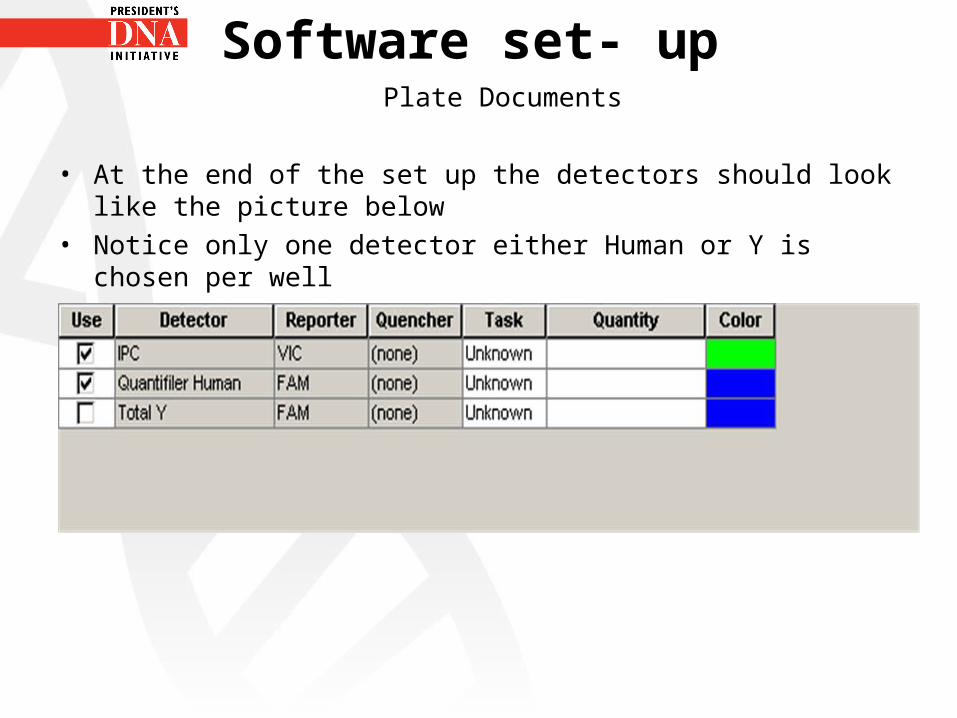
• At the end of the set up the detectors should look like the picture below
• Notice only one detector either Human or Y is chosen per well
Software set- upPlate Documents
Once the detectors are created they can be added to the Plate document
Under Tools go to Detector manager then select Quantifiler Human, Y and IPC detectors by clicking them while pressing CTRL key
Then click ADD to Plate Document
Click Done

Software set- upPlate Documents
Now that the detectors have been set up they must now be applied to all the standards
View- Well Inspector- Then select the wells that the standards will be put into.
Most laboratories will always put the standards in the same wells on the plate
Also all standards are run in duplicate so the same information must be entered for both wells corresponding to the standards
Software set- upPlate Documents
Select Wells used for first standard by holding down CTRL while selecting them
Open the well with Well inspector under Views
First name the Standard
Either numbers 1-8 or letters A-H are generally used
Then under Task menu use drop down menu to select Standard
Then under quantity put in the quantity of the standard
No units are entered but it is assumed to be ng/µl
Software set- upPlate Documents
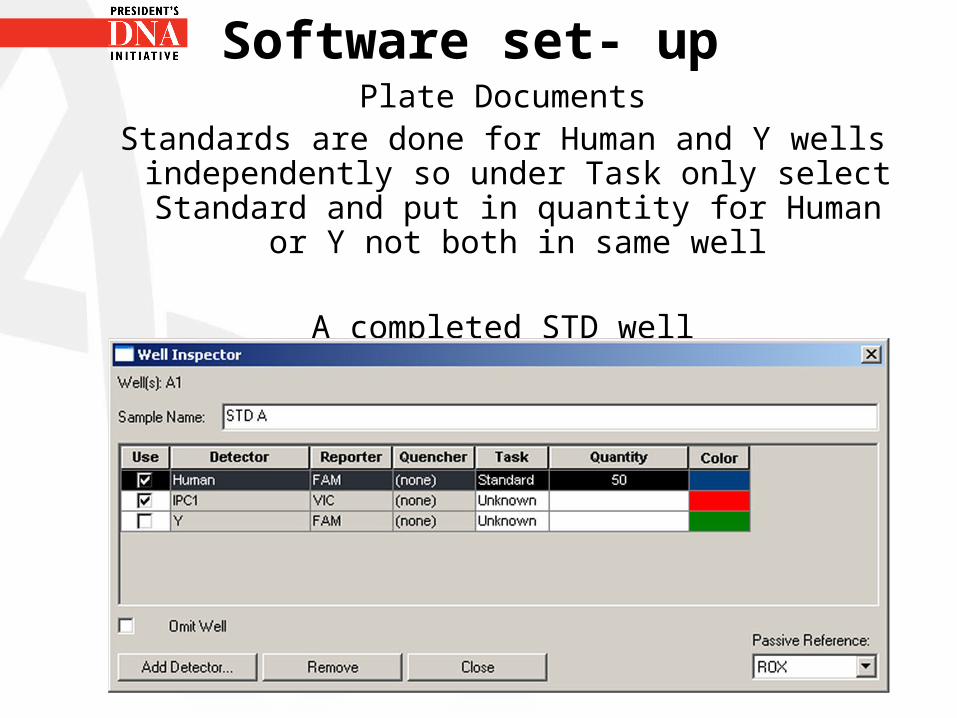
Standards are done for Human and Y wells independently so under Task only select Standard
and put in quantity for Human or Y not both in same well
A completed STD well
Software set- upPlate Documents
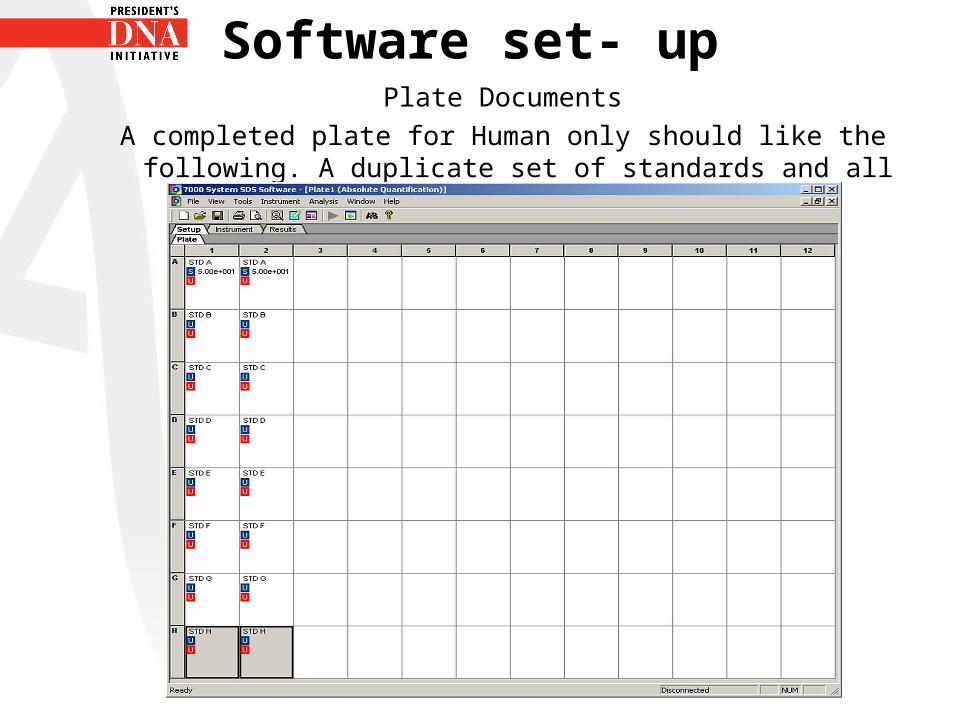
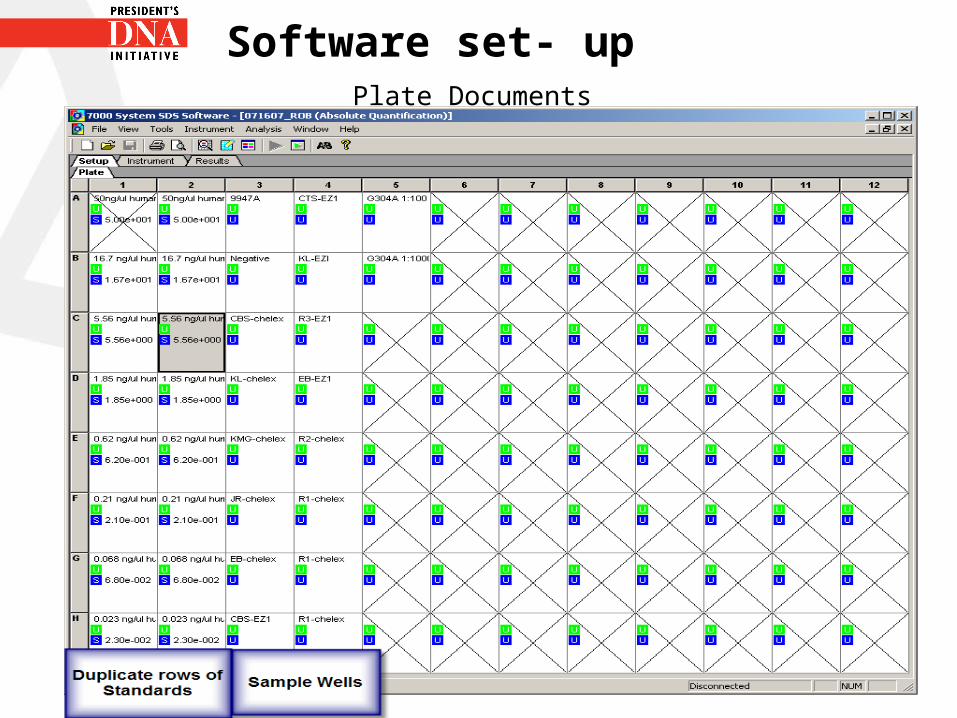
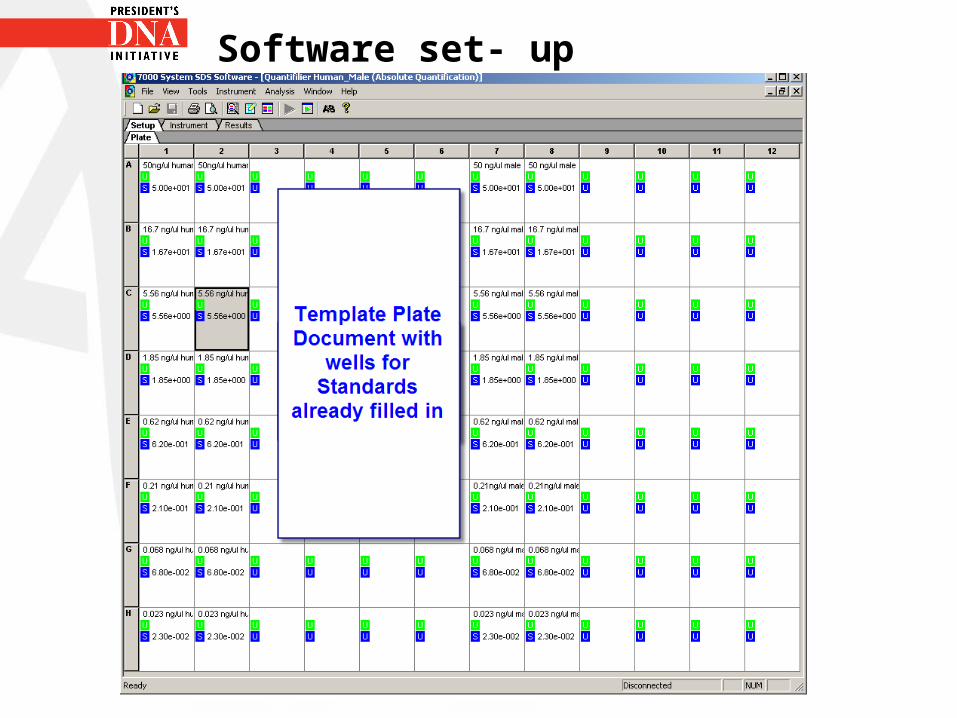
A completed plate for Human only should like the following. A duplicate set of standards and all the wells labeled
Software set- up
Plate Documents
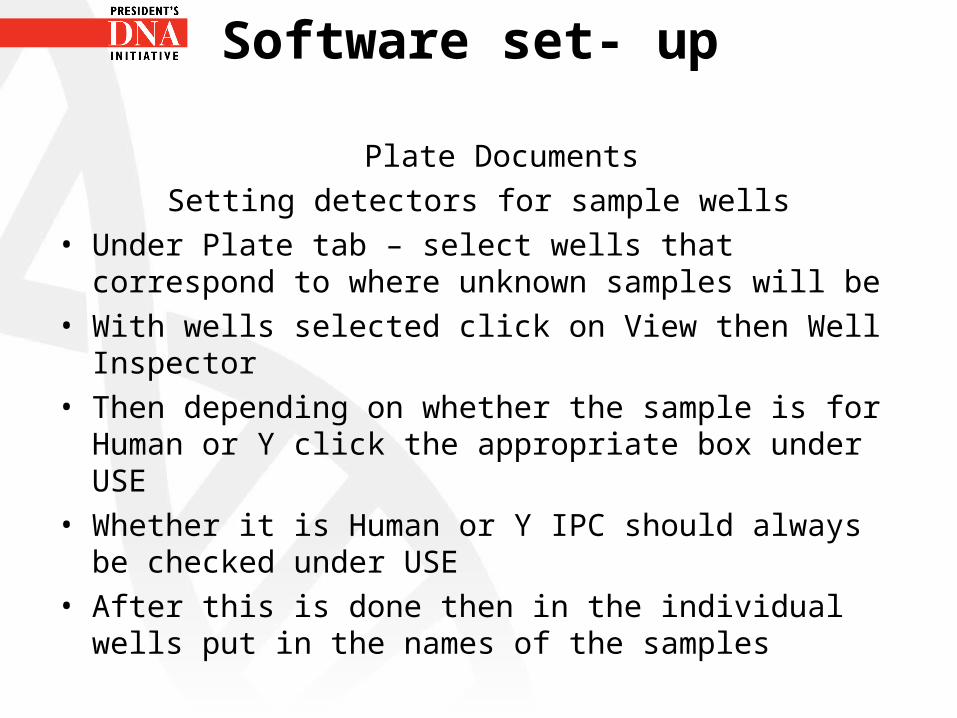
Setting detectors for sample wells• Under Plate tab – select wells that correspond to where
unknown samples will be• With wells selected click on View then Well Inspector• Then depending on whether the sample is for Human or
Y click the appropriate box under USE• Whether it is Human or Y IPC should always be checked
under USE• After this is done then in the individual wells put in the
names of the samples
Software set- upPlate Documents
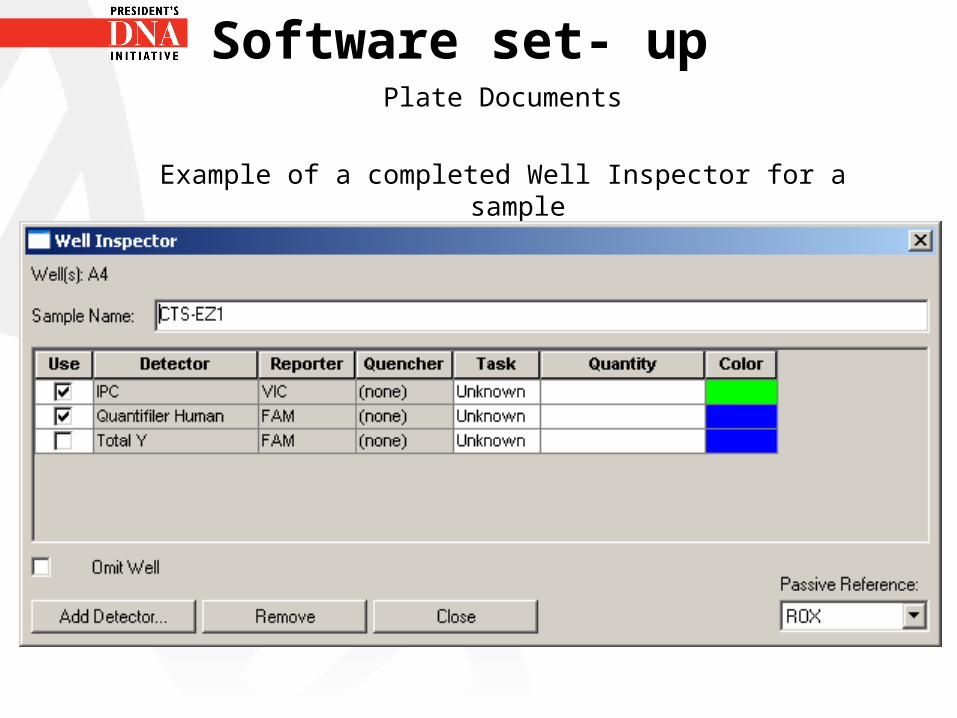
Example of a completed Well Inspector for a sample
Software set- upPlate Documents
Software set- up• Thermal cycler conditions
• Before using the AB 7500 two changes must be made to the thermal cycler conditions. The Thermal profile and sample volume must be adjusted
• Thermal Profile- First stage in thermal profile the HOLD stage must be deleted
• Sample volume should be changed to 25µl and the 9600 Emulation should be checked
• Checking 9600 emulation box reduces the amp rate
Software set- up• Thermalcycler conditions
• Instrument tab• Press shift key and click on stage 1 which is the HOLD
stage• After HOLD step is selected press the delete key• After this is done the first stage should be 1 Rep at 95ºC
for 10 mins
• This is the same step in hot start PCR which is used to activate the Ampli Taq Gold DNA polymerase
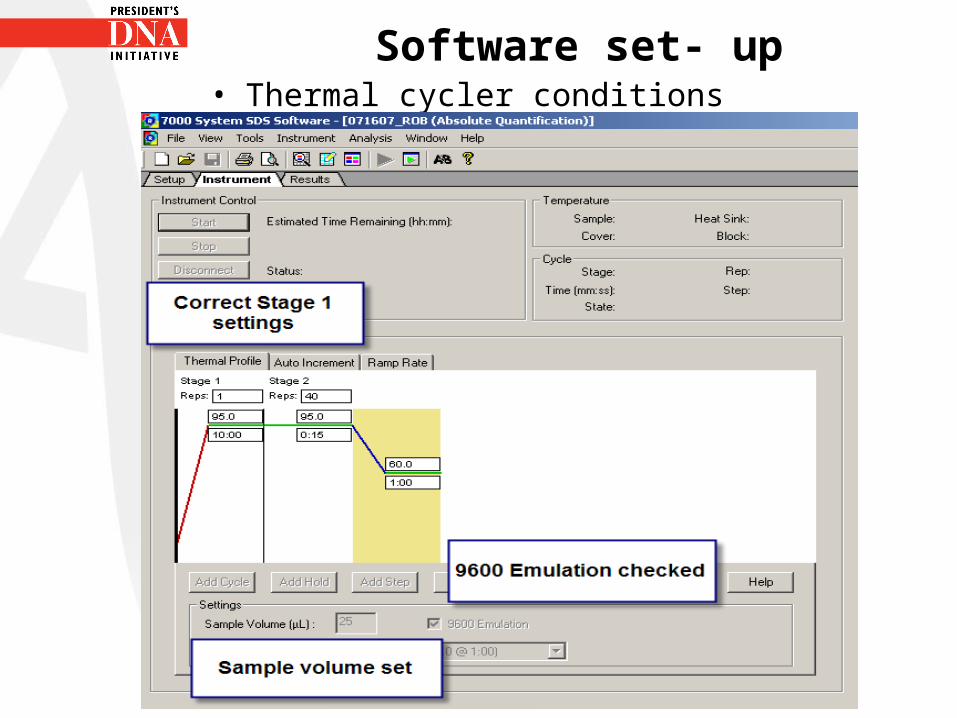
Software set- up• Thermal cycler conditions
Software set- up
• After the Plate document is completed it is saved as a .sds file
• FILE- SAVE (select location where it will be saved)• Enter a file name save as type select SDS document • .sds• Click save
Software set- up
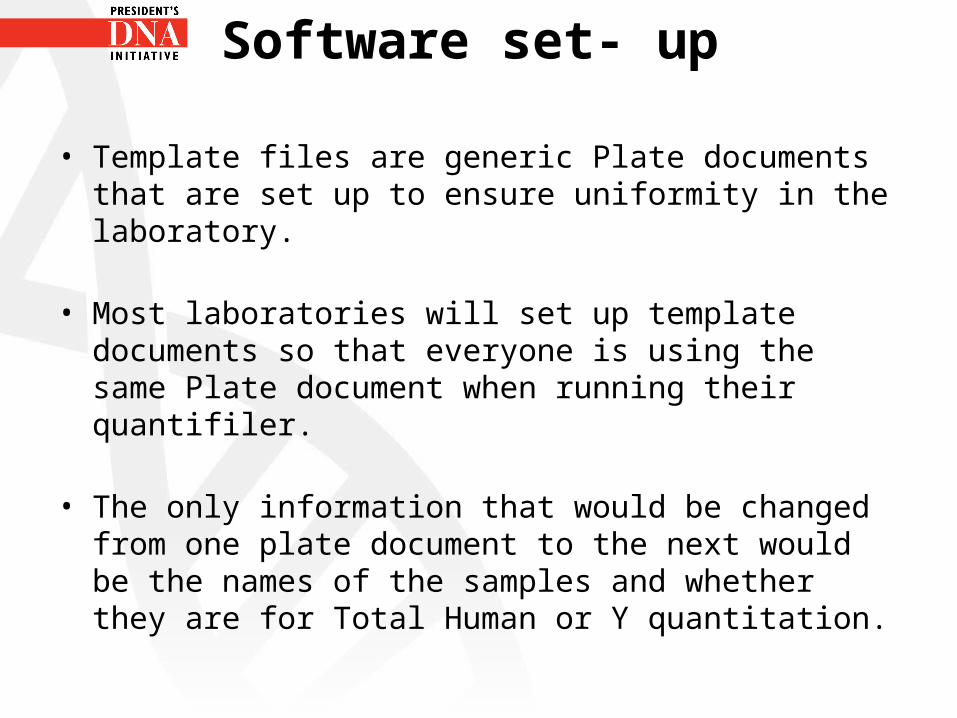
• Template files are generic Plate documents that are set up to ensure uniformity in the laboratory.
• Most laboratories will set up template documents so that everyone is using the same Plate document when running their quantifiler.
• The only information that would be changed from one plate document to the next would be the names of the samples and whether they are for Total Human or Y quantitation.
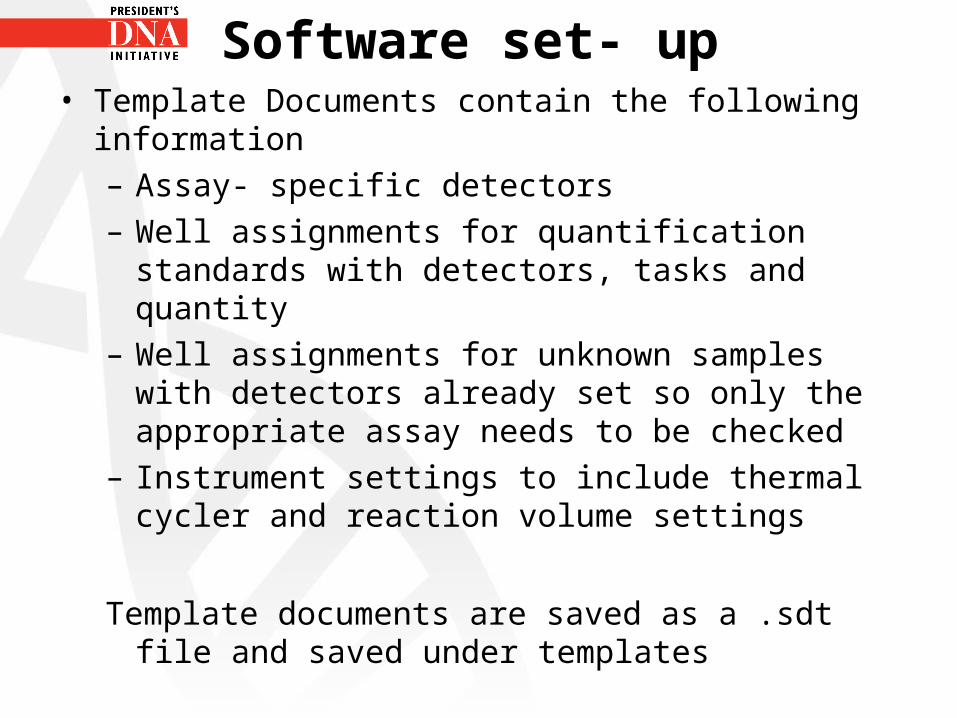
Software set- up• Template Documents contain the following information
– Assay- specific detectors– Well assignments for quantification standards with
detectors, tasks and quantity– Well assignments for unknown samples with
detectors already set so only the appropriate assay needs to be checked
– Instrument settings to include thermal cycler and reaction volume settings
Template documents are saved as a .sdt file and saved under templates
Software set- up
Software set- up
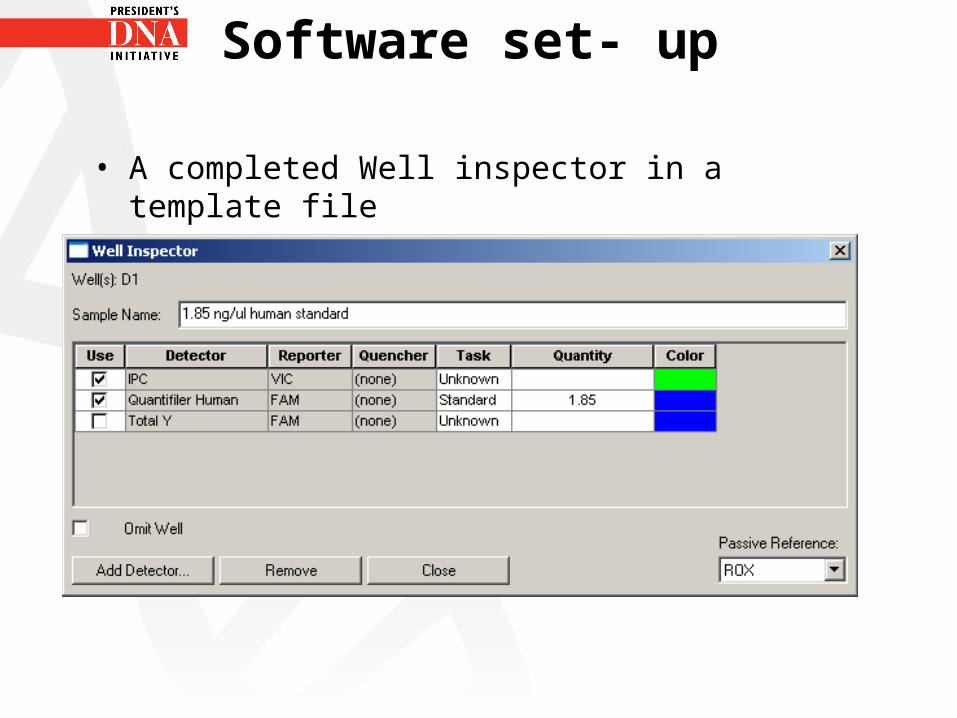
• A completed Well inspector in a template file
Recommended