Qatar Infrastructure
Statistics
… An Overview
Economic Statistics and National Accounts Department
Qatar Statistics Authority, DOHA
May, 2012

Qatar Infrastructure Statistics-An overview
2
FOREWORD
The key driver of the inclusive growth of the State of Qatar is its rapid
Infrastructure development. It is a critical enabler for economic growth and contributes
significantly to human development, and the attainment of the Millennium Development
Goals (MDG). The winning of the World cup hosting bid for 2022 is a strategic event that
would further boost the Qatar’s infrastructure in the coming years. Measuring
infrastructure performance is thus a challenge for decision making process to improve the
availability and capacity of existing infrastructure and extend it in other directions as well.
Comprehensive and reliable statistics on the infrastructure sectors would play a
prime role for the policy makers to determine infrastructure priorities, track progress on
infrastructure development, benchmark performance against peers, and evaluate the impact
of past investments. This report presents an overview of infrastructure statistics
requirement of the State of Qatar.
The Economic Statistics and National Accounts Division of Qatar Statistics
Authority have been producing some of the contemporary economic statistics that influence
decisions of government, business, and individuals. This present document will help readers
gaining interesting insight in respect of the infrastructure statistics development for the
State of Qatar.
Qatar Statistics Authority places its deep appreciation for the efforts of all staff
members of Economic Statistics and National Accounts Department in bringing out this
Report.
Sheikh Hamad Bin Jabor bin Jassim Al Thani
President, Qatar Statistics Authority

Qatar Infrastructure Statistics-An overview
3
Contents
S.
No.
Subjects Page
No.
Foreword 02
Abbreviations 05
01. Infrastructure Statistics Development 06
02. Infrastructure Statistics-Core Statistics 08
03. Concept and Coverage of Infrastructure Sector Statistics 11
04. Characteristics of Infrastructure Subsectors 16
05. Infrastructure Statistics 20
06. Qatar Infrastructure Projects…A Tail Piece 50
Tables
5.1. GDP at constant (2004) and current prices-Infrastructure sectors 21
5.2. Contribution of Infrastructure sectors in Qatar Economy 22
5.3 GDP by Expenditure approach, 2004-2010 22
5.4 Employed Population (15+) by age, sex, and main occupations 23
5.5 Employed Population (15 years and above) by status in employment 24
5.6 Employed Population (15 years and above) by sex, age and main industry 25
5.7. Population (15+) by age , sex, and relation to workforce 26
5.8 Households by type of housing units and municipalities 27
5.9 Residentail Buildings by municipalities and their connections public utility
networks-April 2010
27
5.10 Number of new projects evaluated for their impacts on environment- April 2010 28
5.11 Number of recorded territorial violations-2010 28
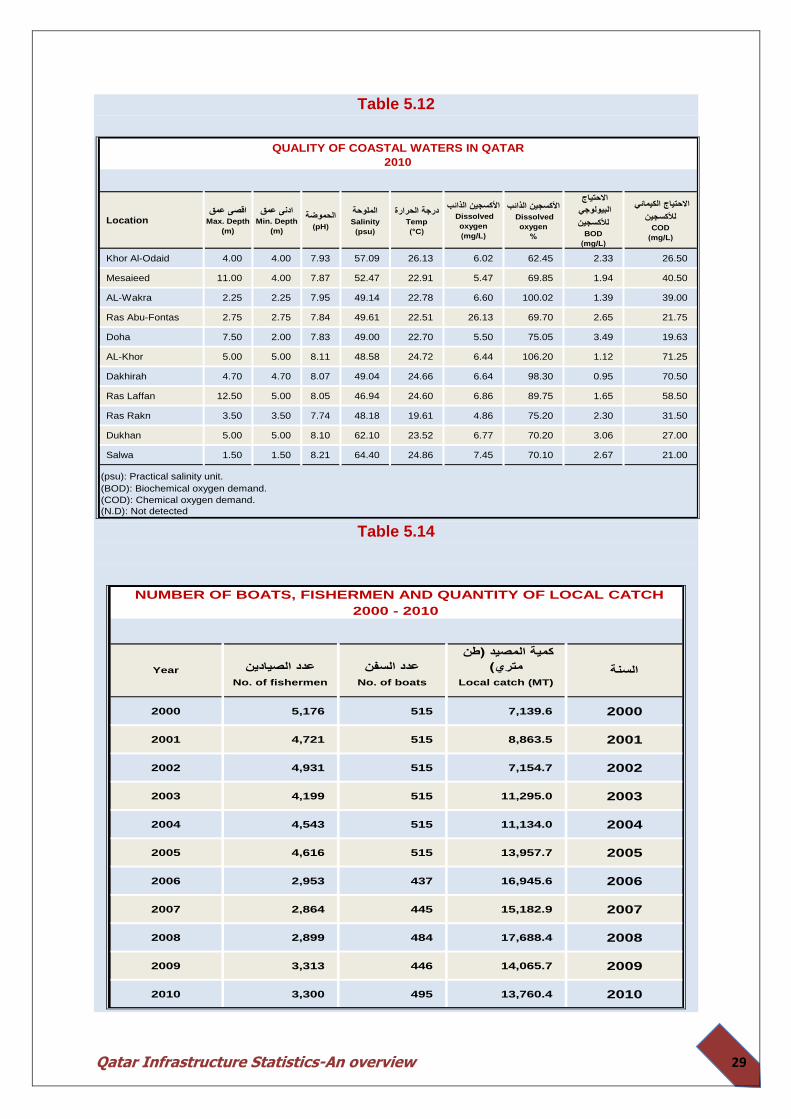
5.12 Quality of coastal water in Qatar-2010
29
5.13 Number of Boats, fishermen and quantity of local catch 29
5.14 Population of 10 years and above by age, sex and education attainments- April
2010
30
5.15 Population of 15 years and above by age, sex and education attainments- April
2010
31
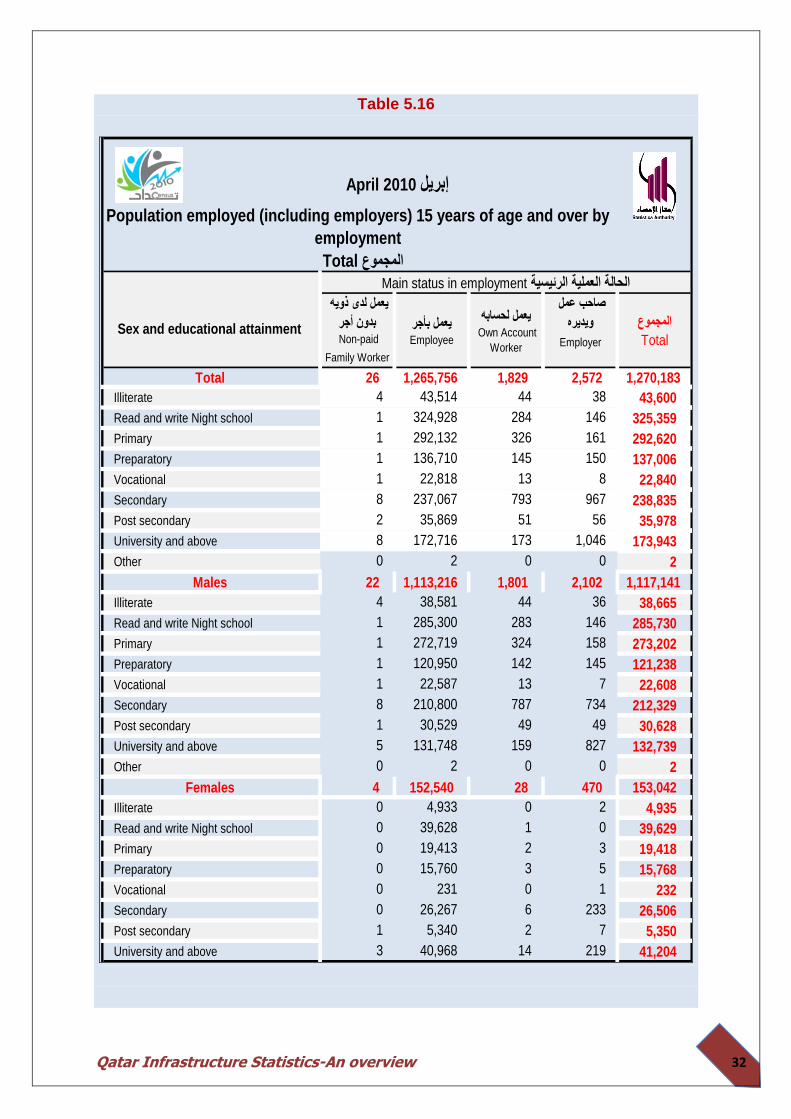
5.16 Population employed (including employers) 15 years and above- April 2010 32
5.17 Students, Schools, Classes and Teachers by level of education-2010 33
5.18 Government Schools and Class rooms 33
5.19 Hotels by number of suits, rooms, beds and by Class-2010 34
5.20 Hotels by number of suits, rooms, beds and by Class-2010 34
Qatar Infrastructure Statistics-An overview
4
S.
No.
Subjects Page
No.
5.21 Hotel Activity by Hotel Class, 2011 35
5.22 Number of Mosques, role of Koranic, Imam, Khateeb by type of Municipality,
2010
35
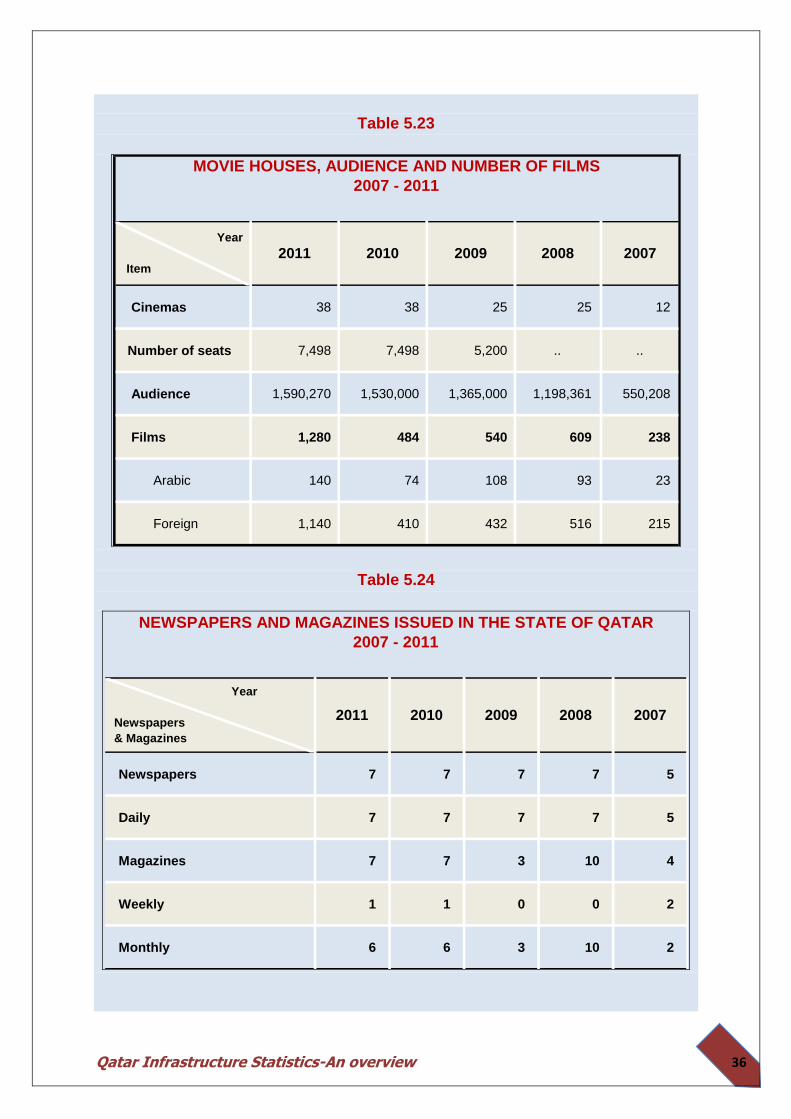
5.23 Movie Houses, audience and Number of films, 2011 36
5.24 Newspapers and Magazines issued from Qatar, 2011 36
5.25 Public libraries, available books and periodicals 2007 to 2011 37
5.26 QOC sports facility by type 2010-11 37
5.27 Referees registered at Sports federations by type of sports activity, nationality
and grade 2010-11
38
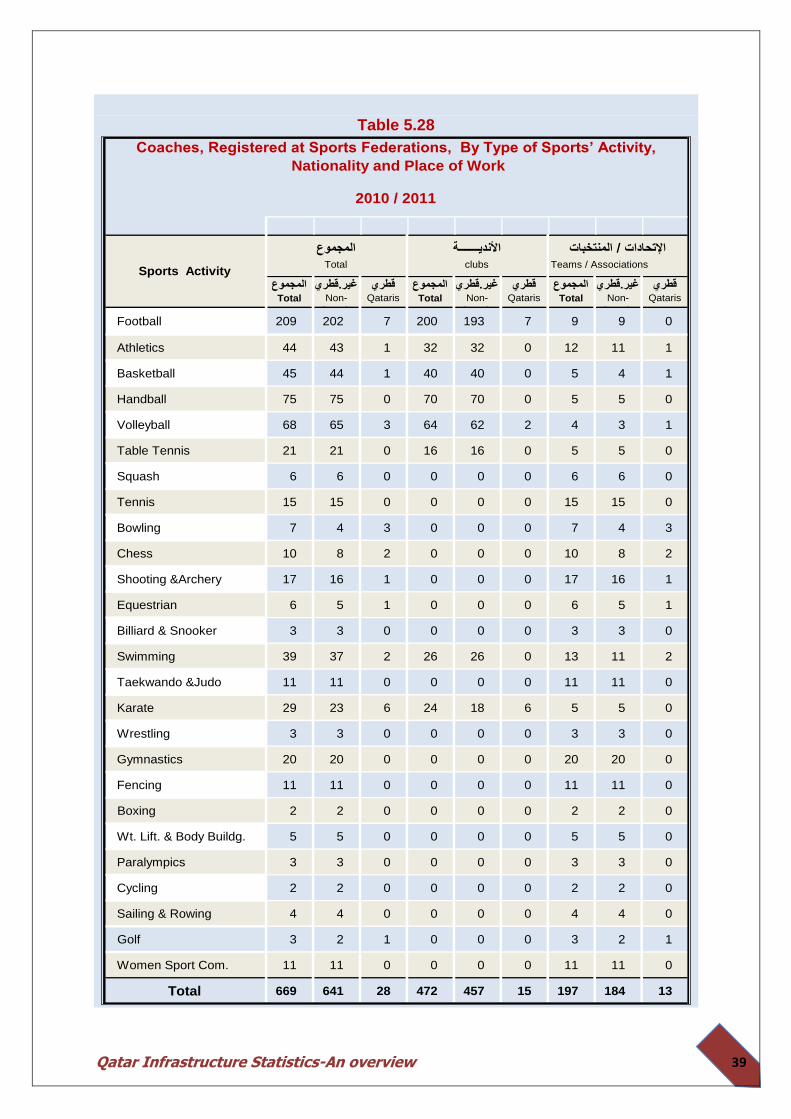
5.28 Coaches registered at Sports federations by type of sports activity, nationality
and grade 2010-11
39
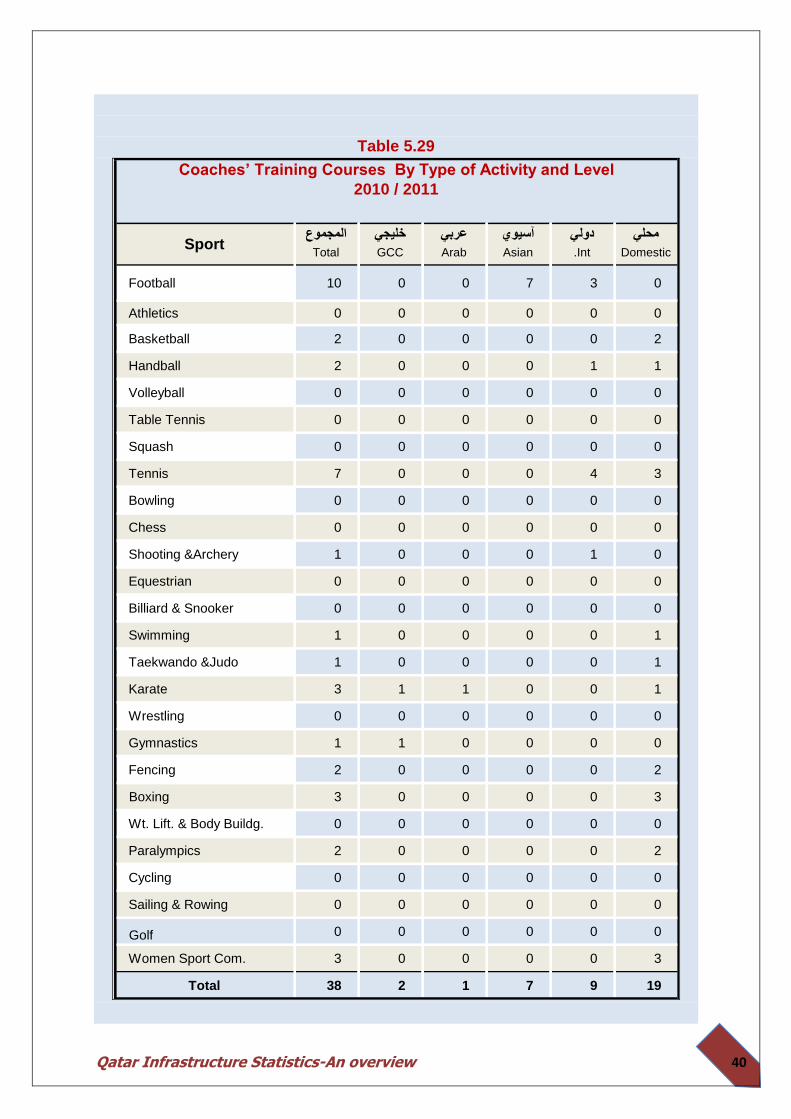
5.29 Coaches training courses by type of activity and levels, 2010-11 40
5.30 Domestic championships according to sports activity and athlete age
groups,2010-11
41
5.31 International championships according to sports activity and athlete age
groups,2010-11
42
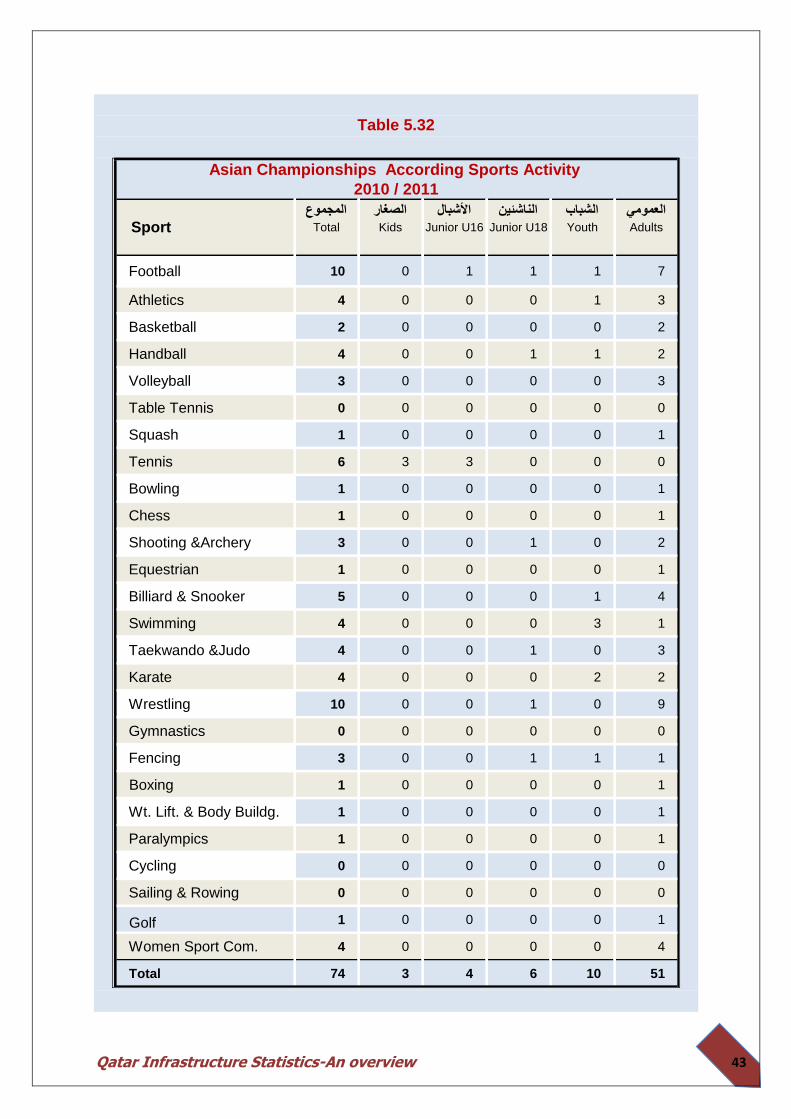
5.32 Asian championships according to sports activity and athlete age groups,2010-11 43
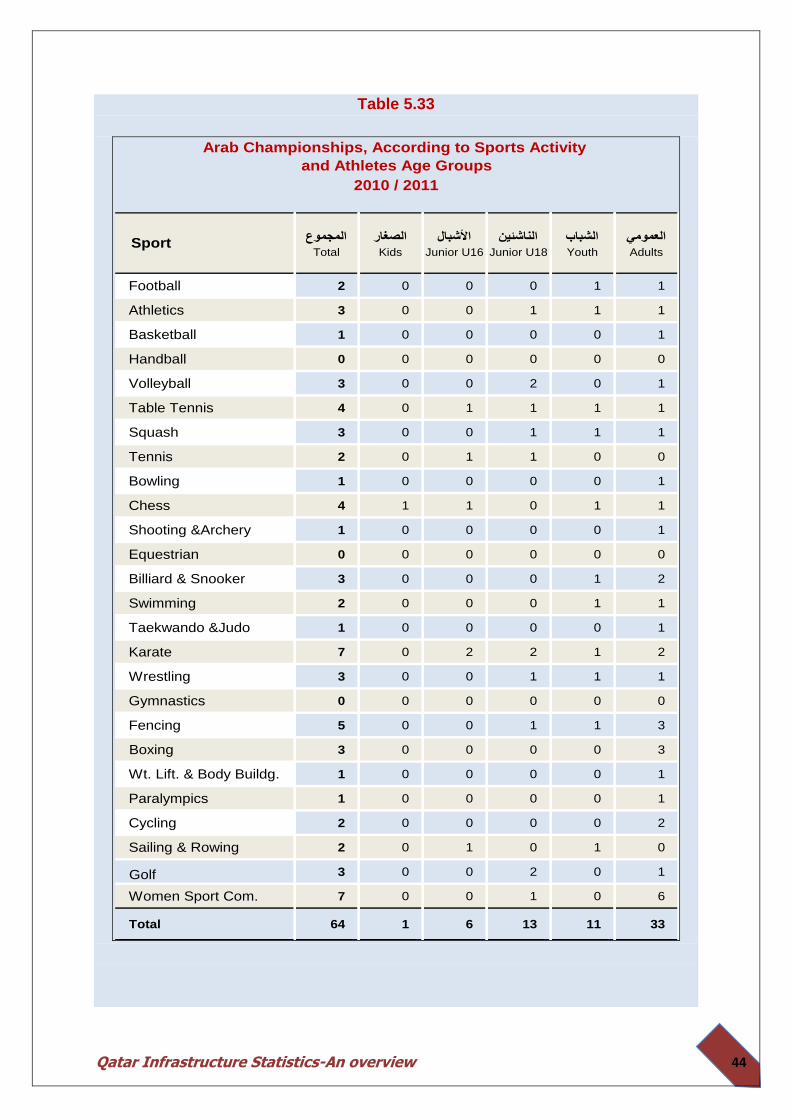
5.33 Arab championships according to sports activity and athlete age groups,2010-11 44
5.34 GCC championships according to sports activity and athlete age groups,2010-11 45
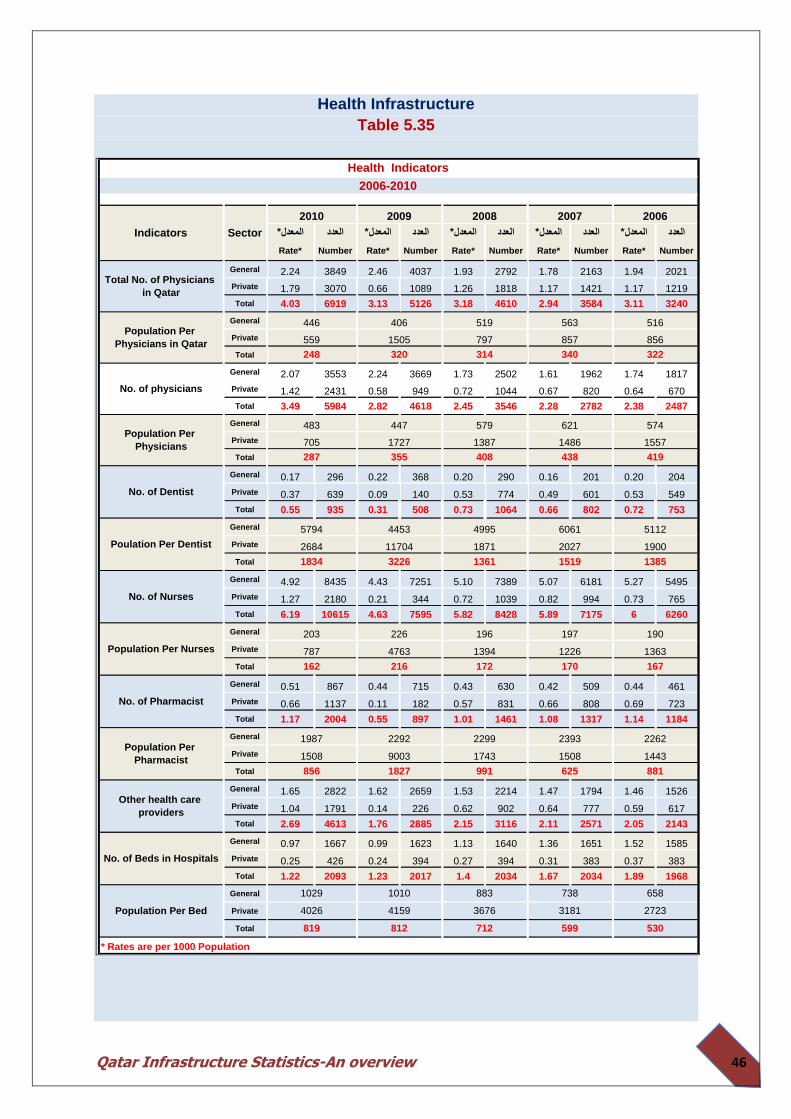
5.35 Health Indicators, 2006-2010 46
5.36 Hospitals, health centres, clinics and pharmacies, 2006-10 47
5.37 In patients, Beds in Hospitals by specializations, 2006-10 48
5.38 Physicians working in Government Sector by field of practice, 2006-2010 49
Charts
5.1 Gross capital formation share in GDP, 2004-2010 23
***

Qatar Infrastructure Statistics-An overview
5
Abbreviations
GFC Gross fixed capital Formation GDP Gross Domestic Product GSDP General Secretariat for Development
Planning QR Qatari Riyal QOC Qatar Olympic Committee QSA Qatar Statistics Authority

Qatar Infrastructure Statistics-An overview
6
Chapter 1
Infrastructure Development
Qatar Infrastructure Statistics-An overview
7
CHAPTER 1 INFRASTRUCTURE DEVELOPMENT
Introduction
Extensive and efficient infrastructure is critical for ensuring the real functioning of the
economy, as it is an important factor determining the location of economic activity and the
kinds of activities or sectors that can develop in a particular economy. Poor infrastructure
impedes a nation’s economic growth and international competitiveness. Infrastructure
development is a key driver of the inclusive growth of the State of Qatar. It is a critical
enabler for economic growth and contributes significantly to human development, and the
attainment of the Millennium Development Goals (MDG).
Without dependable statistics on the infrastructure sectors it is difficult for policy
makers to determine infrastructure priorities, track progress on infrastructure development,
benchmark performance against peers, and evaluate the impact of past investments. The
need for comprehensive, comparable and reliable information on infrastructure is widely
recognized.
The productivity growth has been higher in countries with an adequate and efficient
supply of infrastructure services. Provision of infrastructure services to meet the demands of
business, households and other users is one of the major challenges of economic
development. In many surveys conducted by World Bank Group, private investors have cited
reliable infrastructure services as an important consideration in their investment decisions.
The report also points out that “infrastructure capacity grows step by step with economic
output – a one percent increase in the stock of infrastructure is associated with a one
percent increase in gross domestic product (GDP) across all countries”. In an increasingly
recognized world, availability of good quality infrastructure is a crucial factor in attracting
foreign investments. Availability and accessibility of adequate infrastructure in a country on
par with international community is an indicator of the presence of high quality of life.
Role of infrastructure in fostering economic growth has been supported by the
empirical literature. A number of studies have highlighted the importance of physical
infrastructure as a determinant of economic growth.
A country’s development is strongly linked to its infrastructure strength and its ability to
expand trade, cope with population growth, reduce poverty etc.;
Infrastructure is important for the services it provides. Infrastructure provides people with
the services they need and want;
Infrastructure is an input to production and raises the productivity of other factors.
Infrastructure connects goods to the markets, workers to industry, people to services,
and the poor in rural areas to urban growth centres;
Infrastructure lowers costs, enlarges markets, and facilitates trade; and
Thus, Infrastructure provides services that support economic growth by increasing the
productivity of labour and capital thereby reducing the costs of production and raising
profitability, production, income and employment.
***

Qatar Infrastructure Statistics-An overview
8
Chapter 2
Infrastructure Statistics-the core statistics
Qatar Infrastructure Statistics-An overview
9
CHAPTER 2
INFRASTRUCTURE STATISTICS-THE CORE STATISTICS
Measuring infrastructure performance is required for decision making purposes to
improve the availability and capacity of existing infrastructure and extend it in other
directions as well. Therefore to create and manage good quality infrastructure, we need to
have some measures of infrastructure. To collect meaningful statistics for measuring
infrastructure it is desirable to know why we need these statistics. In case of infrastructure
the statistics are required for following purposes:
Assess the condition of the existing assets;
Evaluate the extent to which the infrastructure meets current demand;
Assess whether infrastructure is likely to be able to meet demand in the future;
Benchmarking: to compare our infrastructure availability with others.
For assessing the existing assets and generating meaningful information from it the
infrastructure statistics are classified into five broad categories:
Access indicators: they measure the availability of infrastructure over geographic area
and the proportion of population.
Quality indicators: they measure the quality i.e. whether the available infrastructure is of
use or not.
Fiscal costs & revenue indicators: they include Budget outlay, Expenditure, Investment
and Revenue generated.
Utilization indicators: they indicate whether the infrastructure is being utilized to its full
capacity or not.
Affordability indicators: they indicate whether the infrastructure can be afforded by
people.
The infrastructure statistics are although available in dispersed manner, there is a
need to compile these statistics in a consolidated and comprehensive way that can be useful
for the policy makers and researchers. Infrastructure being a broad term, there is always a
debate on what is included and what is excluded from infrastructure.
Some of the Infrastructure definitions used internationally are based on the
Classification of Functions of Government (COFOG) in the Government Finance Statistics
Manual (GFSM) of the International Monetary Fund (IMF) and are detailed below.
• Road transport includes the administration of affairs concerning the operation, use,
construction, and maintenance of road transport systems and facilities (roads, bridges,
tunnels, parking facilities, bus terminals, and so on). It includes highways, urban and rural
roads, streets, bicycle paths, and footpaths.
Railway transport includes the administration of affairs and services concerning the
operation, use, construction, or maintenance of railway transport systems and facilities
(railway roadbeds, terminals, tunnels, bridges, embankments, cuttings, and so on). It
includes long-line and interurban railway transport systems; urban rapid transit railway
Qatar Infrastructure Statistics-An overview
10
systems, and other street railway transport systems; and the acquisition and maintenance
of rolling stock.
• Maritime transport includes the administration of affairs and services concerning the
operation, use, construction, and maintenance of inland, coastal, and ocean transport
systems and facilities (harbors, docks, navigation aids and equipment, canals, bridges,
tunnels, channels, breakwaters, piers, wharves, terminals, and so on).
• Air transport includes the administration of affairs and services concerning the operation,
use, construction, and maintenance of air transport systems and facilities (airports, runways,
terminals, hangars, navigation aids and equipment, air control amenities, and so on). It also
includes radio and satellite navigation aids; emergency rescue services; scheduled and
nonscheduled freight and passenger services; and the regulation and control of flying by
private individuals.
• Water supply includes the administration of water supply affairs, the assessment of future
needs and the determination of available resources to meet those needs, and the
supervision and regulation of all facets of portable water supply including water purity, price,
and quality controls.
• Sanitation (wastewater management) includes the administration, supervision, inspection,
operation, and support of sewerage systems and wastewater treatment;
• Electricity (power) covers both traditional sources of electricity such as thermal or
hydropower supplies and newer sources such as wind or solar; the administration of
electricity affairs and services; the construction, development, and rationalized exploitation of
electricity supplies; and the supervision and regulation of the generation, transmission,
and distribution of electricity;
• Nonelectric energy covers the administration, construction, maintenance and, operation of
nonelectric energy affairs and services, which chiefly concern the production, distribution,
and utilization of heat in the form of steam, hot water, or hot air;
• Other fuels include the administration, construction, maintenance and operation of affairs
and services involving fuels such as alcohol, wood and wood waste, bagasse, and other
noncommercial fuels;
• Information and communication technology (ICT) includes the administration of affairs
and services concerning the construction, extension, improvement, operation, and
maintenance of communication systems (postal, telephone, telegraph, wireless, and satellite
communication systems).
***
Qatar Infrastructure Statistics-An overview
11
Chapter 3
Concepts and coverage of
Infrastructure Statistics

Qatar Infrastructure Statistics-An overview
12
CHAPTER 3
CONCEPTS AND COVERAGE OF INFRASTRUCTURE SECTOR STATISTICS
The statistics related with infrastructure and the services provided by it have always
been in the administrative records, the concept itself is relatively new and is being revisited
by the Central Statistics Offices. The American Heritage Dictionary of the English Language
writes that “the term infrastructure has been used since 1927 to refer collectively to roads,
bridges, rail lines, and similar public works”. However, in The English dictionary the term did
not find any mention until 1950s. In late 80s and 90s the word became very prominent and
was discussed in almost every forum.
Though extensively discussed, standardization of the definition of infrastructure has
gained movement in the recent years. Although it is now well recognized that infrastructure
impacts the economic growth of a country, there is no unique concept in scientific literature
for defining infrastructure and determining its components. It is usually considered as basic
public infrastructure that facilitates the economy and society to operate. World Bank report
(2004) mentions infrastructure as an umbrella term for many activities. Due to various
descriptions it becomes difficult to analyze infrastructure in a comparable way and draw
meaningful conclusions.
Infrastructure is important in determining the availability of inputs that are crucial to
a wide variety of productive activities. Its non-availability will act as a severe constraint on
the productive capacities of the economy. Infrastructure is an important input for industrial
and overall economic development of a country. However, there is no clear cut definition of
infrastructure nor its characteristics defined which can differentiate infrastructure sector from
other sectors. Based on the necessity of infrastructure activities like power, transport,
telecommunication, water, sanitation, disposal of waste etc. which are central to the activities
of household and economic production, one could view these activities as essential inputs to
the economic system.
Economists and urban planners distinguish two types of infrastructure: economic
infrastructure and social infrastructure. Economic infrastructure is defined as the
infrastructure that promotes economic activity, such as roads, highways, railroads, airports,
sea ports, electricity, telecommunications, water supply and sanitation. Social infrastructure
(such as schools, libraries, universities, clinics, hospitals, courts, museums, theatres,
playgrounds, parks, fountains and statues) is defined as the infrastructure that promotes the
health, education and cultural standards of the population – activities that have both direct
and indirect impact on the welfare. In literature, following terms also find a mention:
-Hard infrastructure is what we normally have in mind: physical assets/ public works, such
as roadwork, airport, mass transit systems, stadiums, communications, satellite system,
GPS, etc.
-Soft infrastructure refers to systems and institutions needed to maintain the economic,
health, cultural and social standards of a country. It includes a range of systems, rules and
regulations relating to the financial system, the education system, the health care system,
government system.
Qatar Infrastructure Statistics-An overview
13
For us statisticians, hard infrastructure will be easily measured and valued. The soft
ones (intangibles) will be a bit difficult and challenging and it is a topic of “Measuring the Un-
Measurable”.
Infrastructure tends not to be user or user specific and typically have long-lived
engineering structures. It indicated six pertinent characteristics for identification of
infrastructure sub-sectors, viz. (a) natural monopoly; (b) non-tradability of output; (c)
bestowing externalities on society; (d) high-sunk costs or asset specificity; (e) non-rivalness
(up to congestion limits) in consumption; and, (f) possibility of price exclusion.
The sub-sectors listed below satisfy all six characteristics:
Railway tracks, signalling system, stations
Roads, bridges
Runaways and other airport facilities
Transmission and distribution of electricity
Telephone lines, telecommunications network
Pipelines for water, crude oil, slurry, etc.
Waterways, port facilities
Canal networks for irrigation
Sanitation or sewerage.
Initially, the above-listed infrastructure facilities may be taken up for data collection.
Thereafter, considering the other characteristics mentioned above namely: (d) high-sunk
costs or asset specificity; (e) Non-rivalness in consumption; and (f) Possibility of price
exclusion only, the above list of infrastructure facilities may be extended to include the
following sectors in an extended list closely corresponding with existing notion of
infrastructure:
Rolling stock on railways
Vehicles
Aircrafts
Power generating plants
Production of crude oil, purification of water
Ships and other vessels.
It may be reemphasized that there is an urgent need for a strong statistical database
on this sector due to its increasing importance in the economy. Statistics relating to various
types of infrastructure as well as its geographic distribution will be important for policy and
planning purposes, as well as in guiding investment decisions.
Qatar has a huge gap of infrastructure data and it has to approach Ashghal , GSDP,
Mega Projects Steering Committees, and other stakeholders to gather data since it is
very essential for Qatar’s future projects (2020, 2022 sports events etc.)
Qatar 2010 Census included information about infrastructure including the number,
type of (hospital, sports clubs, cinemas, towers, schools, apartments, villa, hotel, etc.),

Qatar Infrastructure Statistics-An overview
14
number of floors, and age of buildings. It also included data about electricity, water and
sewage connections to these buildings.
QSA has data on internet connections to households and establishments. However,
the Census did not cover road works, airports etc. but much of this information should be
available from various ministries and organizations responsible for these activities. QSA can
find additional data from administrative sources or from sample surveys. It has many
sample surveys in development and can adapt to fit whatever needs are defined.
The possible list of sectors to be included under infrastructure is:
Electricity (generation, transmission and distribution);
Water supply and sanitation (including solid waste management, drainage and
sewerage) and street lighting
Telecommunications
Road and bridges
Ports
Inland waterways
Airports
Railways (including rolling stock and mass transit system)-[future item]
Irrigation (including watershed development)
Storage and Ware housing
Oil and gas pipeline networks
The identified infrastructure sub-sectors may be classified, for the sake of
convenience, under five broad categories. These are: Transport; Energy; Water and
Sanitation; Communication; and Social and Commercial Infrastructure. The details are
summarized as under:
S. No Category Infrastructure sub-sectors
1. Transport Roads and bridges
Ports
Inland waterways
Airports
Railway Tracks including overhead tracks,
tunnels, bridges
Urban Public Transport (except rolling stock in
case of urban road transport)

Qatar Infrastructure Statistics-An overview
15
S. No Category Infrastructure sub-sectors
2. Energy Electricity Generation
Electricity Transmission
Electricity Distribution
Oil pipelines
Oil/Gas/Liquefied Natural Gas(LNG) storage
facility
Gas pipelines
3. Water &
Sanitation
Solid Waste Management
Water supply pipelines
Water treatment plants
Sewage collection, treatment and disposal
system
Irrigation (dams, channels, embankments etc.)
Storm Water Drainage System
4. Communication Telecommunication(Fixed network)
Telecommunication towers
5. Social and
Commercial
Infrastructure
Education Institutions(capital stock)
Hospitals(capital stock)
Star hotels
Common infrastructure for industrial parks,
SEZ, tourism facilities and agriculture markets.
Fertilizer(Capital investment)
Post-harvest storage infrastructure for
agriculture and horticultural produce including
cold storage
Soil-testing laboratories
Cold chain
The statistics for various sectors constituting infrastructure may be available with the
concerned Ministries/Departments, it is necessary to consolidate these statistics in one place
under one broad sector named as “Infrastructure”. It has been felt that infrastructure being
the backbone of all productive processes; the statistics on this sector would become a
necessity sooner or later.
The six parameters for identification of infrastructure sector and the five indicators
used for classification of infrastructure statistics are described in the next chapter.
***

Qatar Infrastructure Statistics-An overview
16
Chapter 4
Characterstics of
Infrastructure Subsectors
Qatar Infrastructure Statistics-An overview
17
CHAPTER 4
CHARACTERISTICS OF INFRASTRUCTURE SUBSECTORS
The characteristics of Infrastructure subsectors are discussed in the following
paragraphs:
Natural Monopoly
Natural monopoly reflects a situation where one firm can meet the market’s entire
demand for a goods or service at a price lower than the possible two or more firms can.
Many infrastructure facilities have a significant component characterized by declining cost
associated with increasing output throughout the range of the possible demand. This
creates a situation of natural monopoly. However, this situation can change due to technical
or structural developments. Telecom sector is the classic example of a sector which has
swung from a monopoly situation, when it was necessary to have a wire line network to a
state of competition mainly due to technology advancements in the field of wireless
telephony.
High sunk costs or asset specificity
Sunk costs are investment costs which cannot be immediately recovered by the
possible sale of the assets that were invested in. Sunk costs represent both barriers to exit
from the sector and barriers to entry into the sector. High sunk cost makes an investment
irreversible which impacts the level of investment by industry. Longer periods of gestation
and very large investment in activity specific assets that cannot be deployed elsewhere,
such as road-typical of infrastructure projects, result into higher sunk cost. Many
infrastructure services are designed to be delivered through a dedicated network. Common
examples are piped water, electric power, telecommunication towers, and sewerage and rail
services. All of these industries involve networks which distribute products or services over
geographic space and in most cases the networks are capital intensive and the investments
are durable and immobile. High sunk costs imply that the service is prone to be a natural
monopoly. If investments are durable and immobile a firm cannot exit market without losing
its investments.
Non tradability
A tradable goods or service can be sold in another location, far from where it was
produced. Different goods have different levels of tradability; the higher the cost of
movement and the time taken for Transportation and the shorter the shelf life, the less
tradable are such goods. Most infrastructure services are non-tradable in nature. In some
cases, carriage may not be tradable but the content may be. A common example is power
Transmission system which is non-tradable even though electric power itself may be
tradable. Non-tradability implies that the stock of infrastructure services cannot be readily
augmented through imports.

Qatar Infrastructure Statistics-An overview
18
Non rivalness in consumption
Public good is normally characterized by two factors – non-rivalness and non-
excludable. This means that consumption of the good by an individual does not reduce
availability of the good for consumption by others and that no one can be effectively
excluded from using the good. The characteristic of non-rivalness implies zero marginal cost
of providing benefit of a public good (infrastructure service in this case) to an additional
consumer, usually up to a certain capacity or congestion limit.
Possibility of price exclusion
Most infrastructure services however have one characteristic that is absent in the
case of pure public goods, namely, price exclusion whereby enjoyment of benefits is
contingent on payment of charges. Price exclusion is a characteristic of ‘private goods’.
Efficiency requires that the price be set at marginal cost. However, in this case, it will not be
possible to recover the cost of provision (except through taxes). Besides as capacity limits
are reached there are positive marginal costs of providing additional capacity. The pricing of
infrastructure is thus not easily amenable to market principles.
Presence of Externalities
Many infrastructure services are also characterized by the presence of externalities.
The typical example is that of improvement in public health from better water and sewerage
infrastructure. An absence of public hygiene will hurt even those who are individually
hygienic. Similarly a road could lead to an increase in the value of adjoining land. In this
sense, infrastructure creates external benefits or positive externalities. These externalities
are not remunerated. Naturally if private players do not reap all the benefits of a public good
which they have produced, their incentive to produce it voluntarily might be insufficient and
market may fail to produce efficient results.
CLASSIFICATION OF INFRASTRUCTURE STATISTICS
The infrastructure statistics are classified into five indicator groups as given below:
Access indicators
Access indicators measure the extent to which people can make use of or take
advantage of infrastructure services—it does not necessarily mean they use the service.
Geographically, it captures how far the next access point is. Time wise, it measures how
frequently the service is provided or how long does it take to be connected. Socially, it
measures if all citizens have access to services, or if services are limited to specific groups
(e.g. special tariffs, families, elderly, etc.)
Quality indicators
Quality indicators encompass both qualitative and quantitative measures. The former
are perceived quality indicators collected by asking qualitative questions (like rank from 1 to
10, the quality of the service). The latter are technical quality indicators with a low degree of
discretion involved; usually reported by the utilities or providers. Examples are electric
outages or reported phone faults.

Qatar Infrastructure Statistics-An overview
19
Fiscal and revenue indicators
These indicators provide information about the government / private budget allocated
to the infrastructure. It also provides information about the utilization of these financial
resources. Further, the revenue generated through this infrastructure is also measured by
some statistics given under these heads.
Utilization indicators
These indicators give the extent up to which the infrastructure is being utilized for the
purpose for which it has been provided. It includes statistics like passengers carried, freight
carried etc.
Affordability indicators
Affordability indicators give a sense of the extent to which infrastructure services are
provided at a reasonable price. Ideally, measures of this outcome tell the extent to which the
price of a standard consumption bundle is consistent with the ability to pay of the users.
Ideally also, these measures should be gathered from household surveys—e.g. surveys
specifying the percentage of the household income or household expenditure allocated to a
specific service for different income classes. In practice, the only information not too difficult
to collect is the average or sometimes the nominal price and occasionally, the tariff structure.
***

Qatar Infrastructure Statistics-An overview
20
Chapter 5
Infrastructure Statistics
Qatar Infrastructure Statistics-An overview
21
Chapter 5
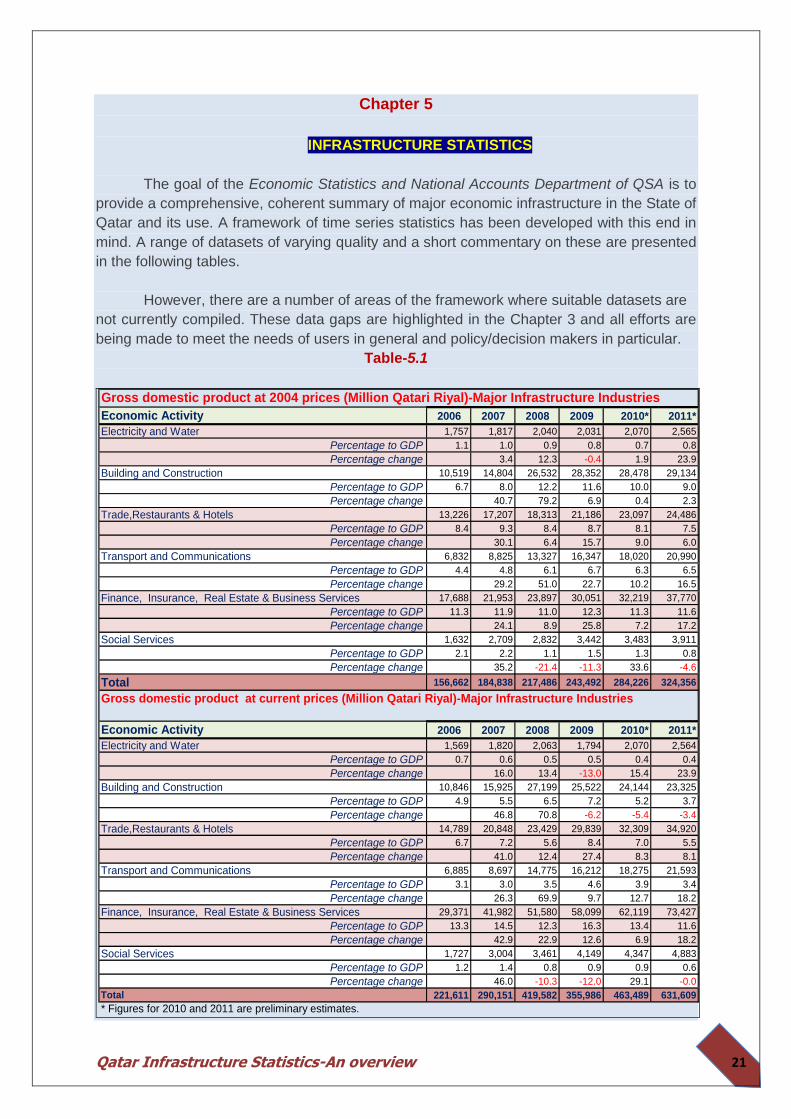
INFRASTRUCTURE STATISTICS
The goal of the Economic Statistics and National Accounts Department of QSA is to
provide a comprehensive, coherent summary of major economic infrastructure in the State of
Qatar and its use. A framework of time series statistics has been developed with this end in
mind. A range of datasets of varying quality and a short commentary on these are presented
in the following tables.
However, there are a number of areas of the framework where suitable datasets are
not currently compiled. These data gaps are highlighted in the Chapter 3 and all efforts are
being made to meet the needs of users in general and policy/decision makers in particular.
Table-5.1
Gross domestic product at 2004 prices (Million Qatari Riyal)-Major Infrastructure Industries
Economic Activity 2006 2007 2008 2009 2010* 2011*
Electricity and Water 1,757 1,817 2,040 2,031 2,070 2,565
Percentage to GDP 1.1 1.0 0.9 0.8 0.7 0.8
Percentage change 3.4 12.3 -0.4 1.9 23.9
Building and Construction 10,519 14,804 26,532 28,352 28,478 29,134
Percentage to GDP 6.7 8.0 12.2 11.6 10.0 9.0
Percentage change 40.7 79.2 6.9 0.4 2.3
Trade,Restaurants & Hotels 13,226 17,207 18,313 21,186 23,097 24,486
Percentage to GDP 8.4 9.3 8.4 8.7 8.1 7.5
Percentage change 30.1 6.4 15.7 9.0 6.0
Transport and Communications 6,832 8,825 13,327 16,347 18,020 20,990
Percentage to GDP 4.4 4.8 6.1 6.7 6.3 6.5
Percentage change 29.2 51.0 22.7 10.2 16.5
Finance, Insurance, Real Estate & Business Services 17,688 21,953 23,897 30,051 32,219 37,770
Percentage to GDP 11.3 11.9 11.0 12.3 11.3 11.6
Percentage change 24.1 8.9 25.8 7.2 17.2
Social Services 1,632 2,709 2,832 3,442 3,483 3,911
Percentage to GDP 2.1 2.2 1.1 1.5 1.3 0.8
Percentage change 35.2 -21.4 -11.3 33.6 -4.6
Total 156,662 184,838 217,486 243,492 284,226 324,356
Gross domestic product at current prices (Million Qatari Riyal)-Major Infrastructure Industries
Economic Activity 2006 2007 2008 2009 2010* 2011*
Electricity and Water 1,569 1,820 2,063 1,794 2,070 2,564
Percentage to GDP 0.7 0.6 0.5 0.5 0.4 0.4
Percentage change 16.0 13.4 -13.0 15.4 23.9
Building and Construction 10,846 15,925 27,199 25,522 24,144 23,325
Percentage to GDP 4.9 5.5 6.5 7.2 5.2 3.7
Percentage change 46.8 70.8 -6.2 -5.4 -3.4
Trade,Restaurants & Hotels 14,789 20,848 23,429 29,839 32,309 34,920
Percentage to GDP 6.7 7.2 5.6 8.4 7.0 5.5
Percentage change 41.0 12.4 27.4 8.3 8.1
Transport and Communications 6,885 8,697 14,775 16,212 18,275 21,593
Percentage to GDP 3.1 3.0 3.5 4.6 3.9 3.4
Percentage change 26.3 69.9 9.7 12.7 18.2
Finance, Insurance, Real Estate & Business Services 29,371 41,982 51,580 58,099 62,119 73,427
Percentage to GDP 13.3 14.5 12.3 16.3 13.4 11.6
Percentage change 42.9 22.9 12.6 6.9 18.2
Social Services 1,727 3,004 3,461 4,149 4,347 4,883
Percentage to GDP 1.2 1.4 0.8 0.9 0.9 0.6
Percentage change 46.0 -10.3 -12.0 29.1 -0.0
Total 221,611 290,151 419,582 355,986 463,489 631,609
* Figures for 2010 and 2011 are preliminary estimates.
Qatar Infrastructure Statistics-An overview
22
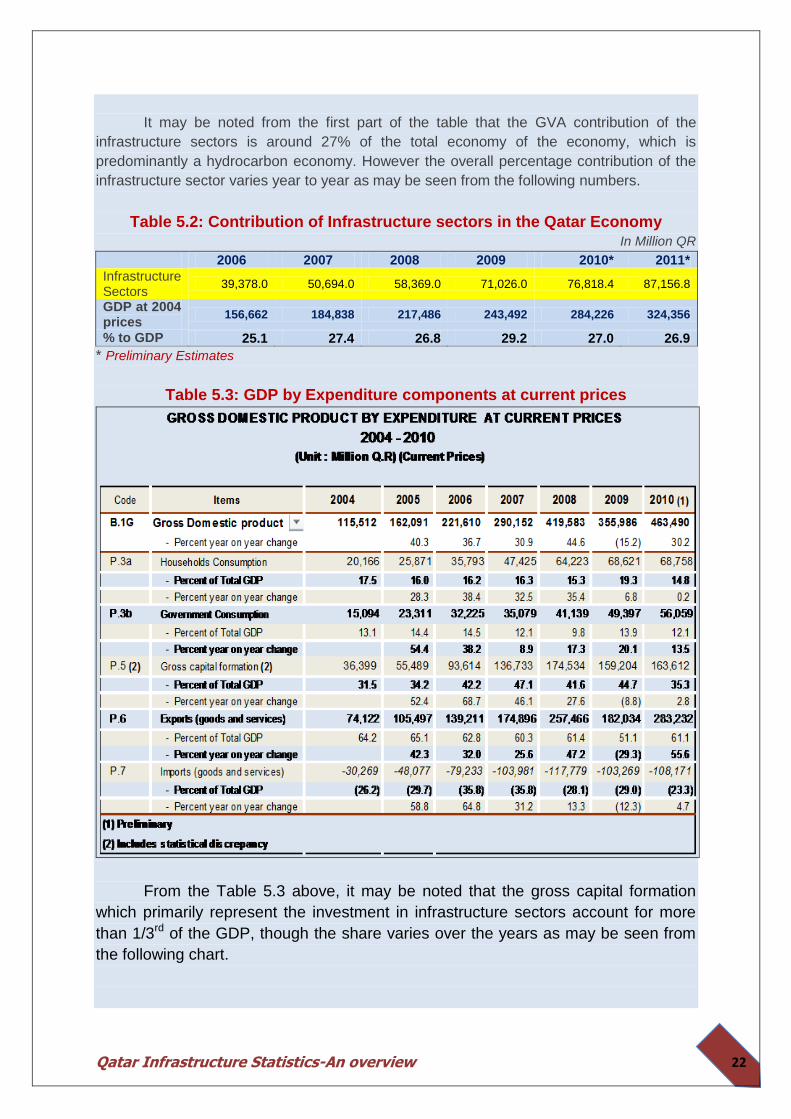
It may be noted from the first part of the table that the GVA contribution of the
infrastructure sectors is around 27% of the total economy of the economy, which is
predominantly a hydrocarbon economy. However the overall percentage contribution of the
infrastructure sector varies year to year as may be seen from the following numbers.
Table 5.2: Contribution of Infrastructure sectors in the Qatar Economy In Million QR
2006 2007 2008 2009 2010* 2011*
Infrastructure Sectors
39,378.0 50,694.0 58,369.0 71,026.0 76,818.4 87,156.8
GDP at 2004 prices
156,662 184,838 217,486 243,492 284,226 324,356
% to GDP 25.1 27.4 26.8 29.2 27.0 26.9
* Preliminary Estimates
Table 5.3: GDP by Expenditure components at current prices
From the Table 5.3 above, it may be noted that the gross capital formation
which primarily represent the investment in infrastructure sectors account for more
than 1/3rd of the GDP, though the share varies over the years as may be seen from
the following chart.

Qatar Infrastructure Statistics-An overview
23
Chart 5.1
Population and Labour Force Infrastructure
Table 5.4
2004 2005 2006 2007 2008 2009 2010
GCF share in GDP 31.5 34.2 42.2 47.1 41.6 44.7 35.3
0
5
10
15
20
25
30
35
40
45
50
Pe
rce
nta
ge
GCF share in GDP
+ 65 64 - 55 54 - 45 44 -35 34 - 25 24 -15المجموع
Total
Total 4,533 40,019 164,183 382,900 505,606 172,942 1,270,183
Males 4,351 37,161 147,848 341,745 432,102 153,934 1,117,141
Females 182 2,858 16,335 41,155 73,504 19,008 153,042
Total 549 3106 7504 9871 7832 718 29,580
Males 536 2959 6920 8845 6532 593 26,385
Females 13 147 584 1026 1300 125 3,195
Total 914 6874 19247 37370 44030 5050 113,485
Males 857 6119 15440 27124 30720 3457 83,717
Females 57 755 3807 10246 13310 1593 29,768
Total 208 2503 8498 17248 23681 7361 59,499
Males 204 2283 7485 14792 19462 6125 50,351
Females 4 220 1013 2456 4219 1236 9,148
Total 315 2214 7538 14299 23814 11077 59,257
Males 301 2022 6051 10795 17414 8042 44,625
Females 14 192 1487 3504 6400 3035 14,632
Total 445 2255 9226 20119 35399 15766 83,210
Males 415 2100 8451 18165 29456 13675 72,262
Females 30 155 775 1954 5943 2091 10,948
Total 94 402 1588 3058 4323 2239 11,704
Males 94 402 1587 3058 4323 2239 11,703
Females 0 0 1 0 0 0 1
Total 693 7872 51074 153657 194760 64115 472,171
Males 693 7858 51057 153623 194724 64105 472,060
Females 0 14 17 34 36 10 111
Total 652 8866 28268 39679 50586 15280 143,331
Males 651 8858 28207 39564 50416 15229 142,925
Females 1 8 61 115 170 51 406
Total 663 5927 31240 87599 121181 51336 297,946
Males 600 4560 22650 65779 79055 40469 213,113
Females 63 1367 8590 21820 42126 10867 84,833
April 2010 إبريل
Total المجموع
Main Occupation (ISCO-88) Sex
Age فئات العمــــــر
Employed population (15+) by age, sex and main occupation
Total
1 LEGISLATORS, SENIOR
OFFICIALS AND MANAGERS
2 PROFESSIONALS
3 TECHNICIANS AND
ASSOCIATE PROFESSIONALS
4 CLERKS
5 SERVICE WORKERS AND
SHOP AND MARKET SALES
WORKERS
9 ELEMENTARY
OCCUPATIONS
6 SKILLED AGRICULTURAL
AND FISHERY WORKERS
7 CRAFT AND RELATED
TRADES WORKERS
8 PLANT AND MACHINE
OPERATORS AND
ASSEMBLERS
Qatar Infrastructure Statistics-An overview
24
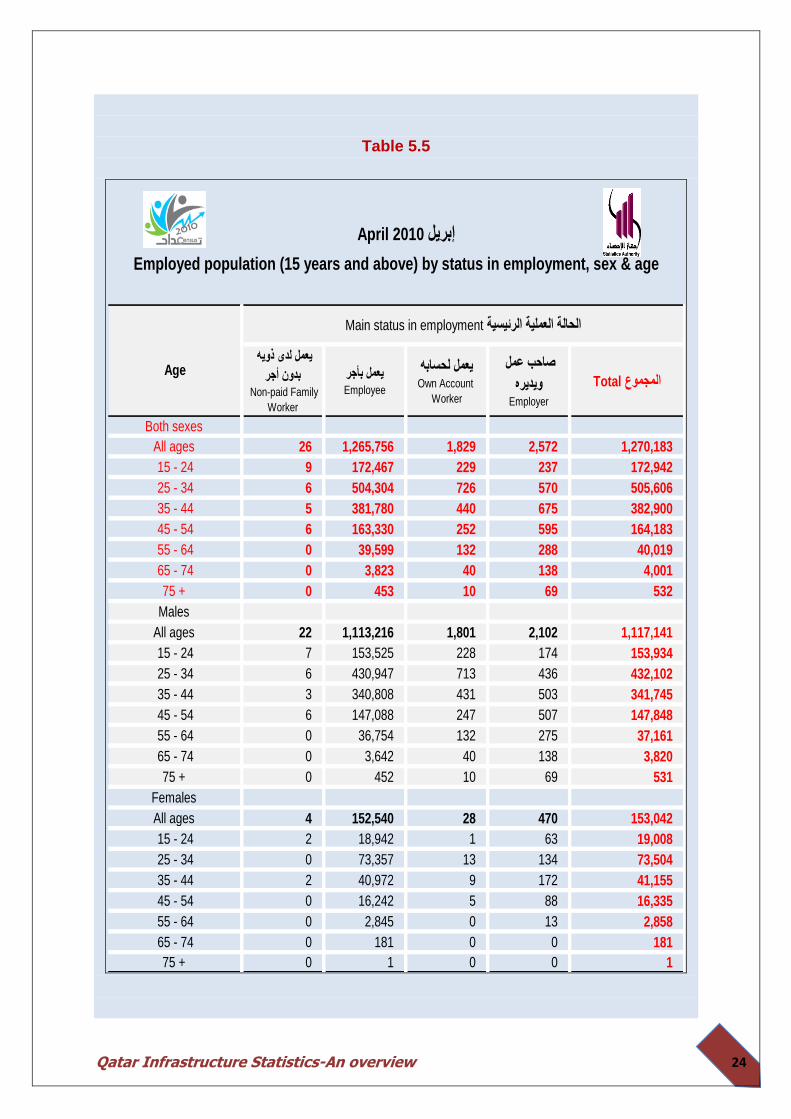
Table 5.5
يعمل لدى ذويه
بدون أجر Non-paid Family
Worker
يعمل بأجرEmployee
يعمل لحسابهOwn Account
Worker
صاحب عمل
ويديرهEmployer
Total المجموع
Both sexes
All ages 26 1,265,756 1,829 2,572 1,270,183
15 - 24 9 172,467 229 237 172,942
25 - 34 6 504,304 726 570 505,606
35 - 44 5 381,780 440 675 382,900
45 - 54 6 163,330 252 595 164,183
55 - 64 0 39,599 132 288 40,019
65 - 74 0 3,823 40 138 4,001
75 + 0 453 10 69 532
Males
All ages 22 1,113,216 1,801 2,102 1,117,141
15 - 24 7 153,525 228 174 153,934
25 - 34 6 430,947 713 436 432,102
35 - 44 3 340,808 431 503 341,745
45 - 54 6 147,088 247 507 147,848
55 - 64 0 36,754 132 275 37,161
65 - 74 0 3,642 40 138 3,820
75 + 0 452 10 69 531
Females
All ages 4 152,540 28 470 153,042
15 - 24 2 18,942 1 63 19,008
25 - 34 0 73,357 13 134 73,504
35 - 44 2 40,972 9 172 41,155
45 - 54 0 16,242 5 88 16,335
55 - 64 0 2,845 0 13 2,858
65 - 74 0 181 0 0 181
75 + 0 1 0 0 1
Main status in employment الحالة العملية الرئيسية
Employed population (15 years and above) by status in employment, sex & age
Age
April 2010 إبريل

Qatar Infrastructure Statistics-An overview
25
Table 5.6
يعمل لدى ذويه
بدون أجر Non-paid Family
Worker
يعمل بأجرEmployee
يعمل لحسابهOwn Account
Worker
صاحب عمل
ويديرهEmployer
Total المجموع
Both sexes 26 928,277 1,769 2,525 932,597
35 - 39Electricity, gas, water supply and waste
management0 4,959 0 0 4,959
41 - 43 Construction 7 504,892 987 442 506,328
45 - 47Wholesale and retail trade; repair of motor
vehicles and motorcycles18 140,860 493 1,428 142,799
49 - 53 Transportation and storage 1 33,755 67 120 33,943
55 - 56 Accommodation and food service activities 0 28,959 0 46 29,005
58 - 63 Information and communication 0 9,102 0 12 9,114
64 - 66 Financial and insurance activities 0 10,332 6 25 10,363
68 Real estate activities 0 8,505 39 82 8,626
69 - 75 Professional, scientific and technical activities 0 20,075 96 207 20,378
77 - 82 Administrative and support service activities 0 39,124 17 40 39,181
84Public administration and defence;
compulsory social security0 71,968 0 0 71,968
85 Education 0 26,277 21 36 26,334
86 - 88 Human health and social work activities 0 18,880 4 62 18,946
90 - 93 Arts, entertainment and recreation 0 5,228 3 1 5,232
94 - 96 Other service activities 0 5,361 36 24 5,421
Males 22 863,036 1,741 2,056 866,855
35 - 39Electricity, gas, water supply and waste
management0 4,675 0 0 4,675
41 - 43 Construction 7 502,243 987 409 503,646
45 - 47Wholesale and retail trade; repair of motor
vehicles and motorcycles14 135,453 489 1,197 137,153
49 - 53 Transportation and storage 1 29,589 67 72 29,729
55 - 56 Accommodation and food service activities 0 26,147 0 39 26,186
58 - 63 Information and communication 0 7,400 0 10 7,410
64 - 66 Financial and insurance activities 0 7,512 6 20 7,538
68 Real estate activities 0 8,049 39 79 8,167
69 - 75 Professional, scientific and technical activities 0 18,907 94 145 19,146
77 - 82 Administrative and support service activities 0 36,694 15 32 36,741
84Public administration and defence;
compulsory social security0 58,368 0 0 58,368
85 Education 0 10,544 12 11 10,567
86 - 88 Human health and social work activities 0 8,661 3 33 8,697
90 - 93 Arts, entertainment and recreation 0 4,531 1 1 4,533
94 - 96 Other service activities 0 4,263 28 8 4,299
Females 4 65,241 28 469 65,742
35 - 39Electricity, gas, water supply and waste
management0 284 0 0 284
41 - 43 Construction 0 2,649 0 33 2,682
45 - 47Wholesale and retail trade; repair of motor
vehicles and motorcycles4 5,407 4 231 5,646
49 - 53 Transportation and storage 0 4,166 0 48 4,214
55 - 56 Accommodation and food service activities 0 2,812 0 7 2,819
58 - 63 Information and communication 0 1,702 0 2 1,704
64 - 66 Financial and insurance activities 0 2,820 0 5 2,825
68 Real estate activities 0 456 0 3 459
69 - 75 Professional, scientific and technical activities 0 1,168 2 62 1,232
77 - 82 Administrative and support service activities 0 2,430 2 8 2,440
84Public administration and defence;
compulsory social security0 13,600 0 0 13,600
85 Education 0 15,733 9 25 15,767
86 - 88 Human health and social work activities 0 10,219 1 29 10,249
90 - 93 Arts, entertainment and recreation 0 697 2 0 699
94 - 96 Other service activities 0 1,098 8 16 1,122
(ISIC rev.4)
السكان المشتغلون ( 15 سنة فأكثر ) حسب الحالة العملية والجنس والنشاط اإلقتصادي الرئيسي
April 2010 إبريل
Main industry and sex
Main status in employment الحالة العملية الرئيسية
Employed population (15 years and above) by status in employment, sex
& main industry
Qatar Infrastructure Statistics-An overview
26
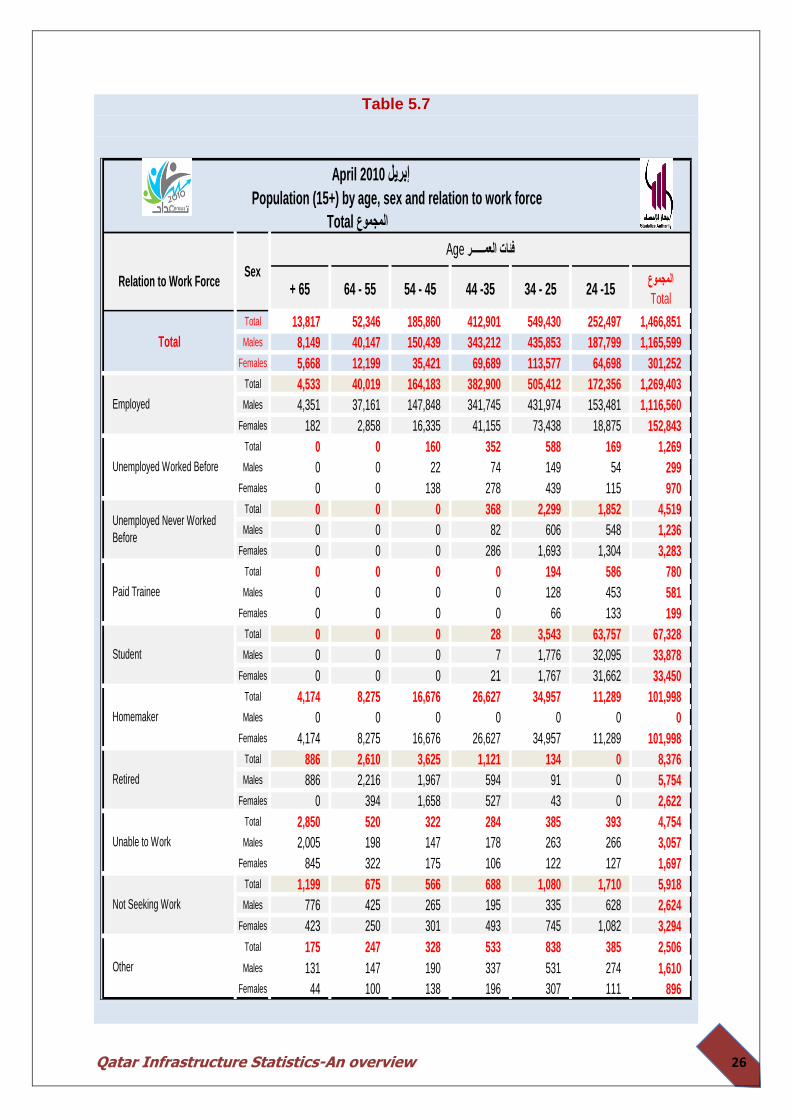
Table 5.7
April 2010 إبريل
Total المجموع
+ 65 64 - 55 54 - 45 44 -35 34 - 25 24 -15المجموع
Total
Total 13,817 52,346 185,860 412,901 549,430 252,497 1,466,851
Males 8,149 40,147 150,439 343,212 435,853 187,799 1,165,599
Females 5,668 12,199 35,421 69,689 113,577 64,698 301,252
Total 4,533 40,019 164,183 382,900 505,412 172,356 1,269,403
Males 4,351 37,161 147,848 341,745 431,974 153,481 1,116,560
Females 182 2,858 16,335 41,155 73,438 18,875 152,843
Total 0 0 160 352 588 169 1,269
Males 0 0 22 74 149 54 299
Females 0 0 138 278 439 115 970
Total 0 0 0 368 2,299 1,852 4,519
Males 0 0 0 82 606 548 1,236
Females 0 0 0 286 1,693 1,304 3,283
Total 0 0 0 0 194 586 780
Males 0 0 0 0 128 453 581
Females 0 0 0 0 66 133 199
Total 0 0 0 28 3,543 63,757 67,328
Males 0 0 0 7 1,776 32,095 33,878
Females 0 0 0 21 1,767 31,662 33,450
Total 4,174 8,275 16,676 26,627 34,957 11,289 101,998
Males 0 0 0 0 0 0 0
Females 4,174 8,275 16,676 26,627 34,957 11,289 101,998
Total 886 2,610 3,625 1,121 134 0 8,376
Males 886 2,216 1,967 594 91 0 5,754
Females 0 394 1,658 527 43 0 2,622
Total 2,850 520 322 284 385 393 4,754
Males 2,005 198 147 178 263 266 3,057
Females 845 322 175 106 122 127 1,697
Total 1,199 675 566 688 1,080 1,710 5,918
Males 776 425 265 195 335 628 2,624
Females 423 250 301 493 745 1,082 3,294
Total 175 247 328 533 838 385 2,506
Males 131 147 190 337 531 274 1,610
Females 44 100 138 196 307 111 896
Population (15+) by age, sex and relation to work force
Relation to Work Force Sex
Age فئات العمــــــر
Total
Employed
Unemployed Worked Before
Unemployed Never Worked
Before
Paid Trainee
Student
Not Seeking Work
Other
Homemaker
Retired
Unable to Work

Qatar Infrastructure Statistics-An overview
27
Housing and Environmental Infrastructure
Table 5.8
Table 5.9
Municipality
هامشى/شاليه
أخرى /Marginal
Beach house
other
جزء من منشأة Part of
establishment
جزء من
وحدة/مبنى/Part of unit
building
غرفة فى وحدةRoom of unit
حجرة
مستقلةSeparate room
شقةApartment
مبنى إضافى Additional
building
بيت عجزة
بيت شعبى
بيت عربى Elderly house
Popular house
Arabic
house
فيالVilla
المجموع
Total
Total 620 2,594 8,638 2,162 3,382 53,807 3,457 22,645 49,402 146,707
Doha 237 665 4,076 844 2,294 42,364 1,121 7,578 20,244 79,423
Al Rayyan 196 1,056 3,218 1,026 762 6,863 1,857 10,178 19,594 44,750
Al Wakra 84 247 766 180 165 2,903 156 1,757 3,326 9,584
Umm Slal 38 146 295 54 59 233 242 1,050 3,046 5,163
Al Khor and Al
Thakhira24 313 188 47 52 1,433 22 931 1,945 4,955
Al Shamal 6 98 36 4 21 6 21 419 84 695
Al Dayyan 35 69 59 7 29 5 38 732 1,163 2,137
April 2010
Households, by type of housing unit and municipality
غير متصلمتصلغير متصلمتصلغير متصلمتصل
connected Not connected connected Not connectedconnected Not connected
44,27743,96431344,08519242,3291,948 Doha
45,15743,5651,59244,93722037,3847,773 AL Rayyan
8,5578,0794788,4151426,7131,844 AL Wakra
5,1365,087495,11026305,106 Umm Slal
5,0994,3547455,09183,1761,923 AL Khor
9689036596260968 AL Shamal
2,9022,3145882,8386402,902 Al Daayen
112,096108,2663,830111,43865889,63222,464 Total
Source: The General Population, Housing & Establishments Census, 2010
Drainage
المياه
RESIDENTIAL BUILDING BY MUNICIPALITY AND THEIR CONNECTION TO THE PUBLIC UTILITIES NETWORKS
April, 2010
الصرف الصحيالكهرباء
Municipality
مجموع المباني
السكنيةTotal of residental
building
WaterElectricity
Qatar Infrastructure Statistics-An overview
28
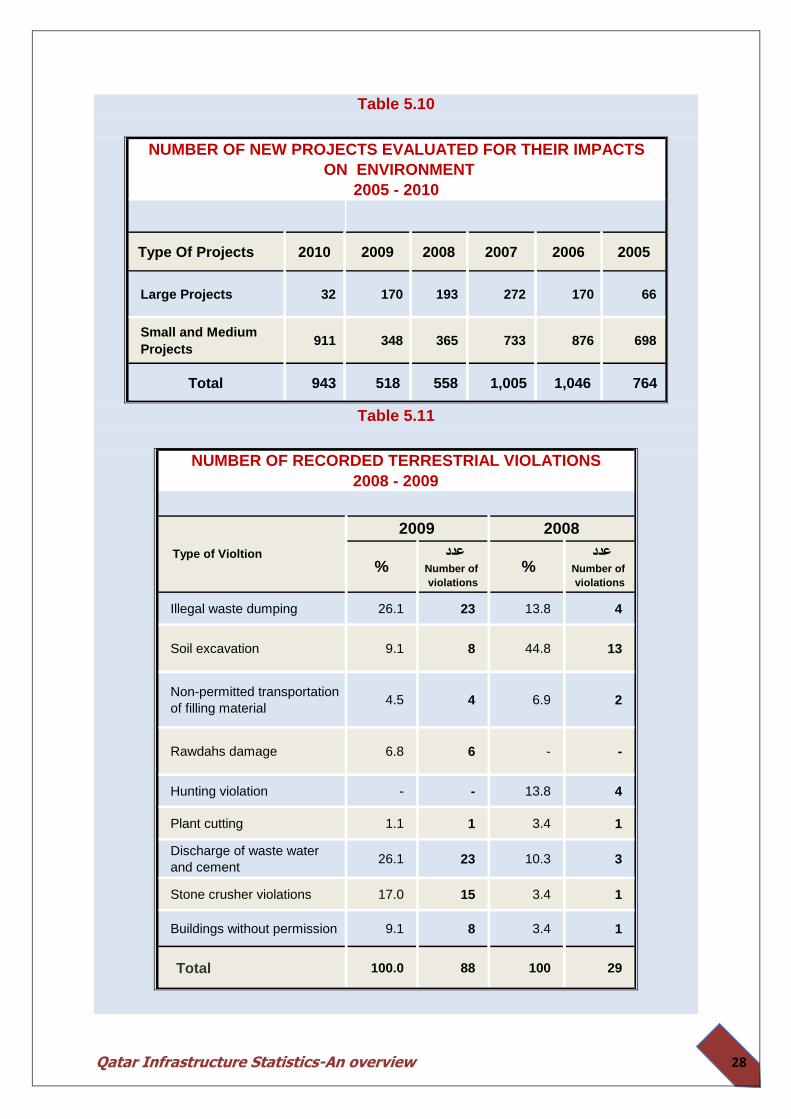
Table 5.10
Table 5.11
200520062007200820092010 Type Of Projects
66 170 272 193 170 32 Large Projects
698 876 733 365 348 911 Small and Medium
Projects
764 1,0461,005 558 518 943 Total
NUMBER OF NEW PROJECTS EVALUATED FOR THEIR IMPACTS
ON ENVIRONMENT
2005 - 2010
عدد عدد Number of
violations
Number of
violations
413.82326.1Illegal waste dumping
1344.889.1Soil excavation
26.944.5Non-permitted transportation
of filling material
--66.8Rawdahs damage
413.8--Hunting violation
13.411.1Plant cutting
310.32326.1Discharge of waste water
and cement
13.41517.0Stone crusher violations
13.489.1Buildings without permission
2910088100.0 Total
NUMBER OF RECORDED TERRESTRIAL VIOLATIONS
2008 - 2009
20082009
% Type of Violtion
%
Qatar Infrastructure Statistics-An overview
29
Table 5.12
Table 5.14
االحتياج الكيمائي
لألكسجينCOD
(mg/L)
االحتياج
البيولوجي
لألكسجينBOD
(mg/L)
األكسجين الذائب Dissolved
oxygen
%
األكسجين الذائب Dissolved
oxygen
(mg/L)
درجة الحرارةTemp
(°C)
الملوحةSalinity
(psu)
الحموضة(pH)
ادنى عمقMin. Depth
(m)
اقصى عمقMax. Depth
(m)
Location
26.502.3362.456.0226.1357.097.934.004.00 Khor Al-Odaid
40.501.9469.855.4722.9152.477.874.0011.00 Mesaieed
39.001.39100.026.6022.7849.147.952.252.25 AL-Wakra
21.752.6569.7026.1322.5149.617.842.752.75 Ras Abu-Fontas
19.633.4975.055.5022.7049.007.832.007.50 Doha
71.251.12106.206.4424.7248.588.115.005.00 AL-Khor
70.500.9598.306.6424.6649.048.074.704.70 Dakhirah
58.501.6589.756.8624.6046.948.055.0012.50 Ras Laffan
31.502.3075.204.8619.6148.187.743.503.50 Ras Rakn
27.003.0670.206.7723.5262.108.105.005.00 Dukhan
21.002.6770.107.4524.8664.408.211.501.50 Salwa
(psu): Practical salinity unit.
(BOD): Biochemical oxygen demand.
(COD): Chemical oxygen demand.
(N.D): Not detected
QUALITY OF COASTAL WATERS IN QATAR
2010
كمية المصيد )طن
عدد الصيادينعدد السفنمتري(
Local catch (MT)No. of boatsNo. of fishermen
20007,139.65155,1762000
20018,863.55154,7212001
20027,154.75154,9312002
200311,295.05154,1992003
200411,134.05154,5432004
200513,957.75154,6162005
200616,945.64372,9532006
200715,182.94452,8642007
200817,688.44842,8992008
200914,065.74463,3132009
201013,760.44953,3002010
Year السنة
2000 - 2010
NUMBER OF BOATS, FISHERMEN AND QUANTITY OF LOCAL CATCH

Qatar Infrastructure Statistics-An overview
30
Educational Infrastructure
Table 5.14
+ 65 64 - 55 54 - 45 44 -35 34 - 25 24 -15 14 - 10جميع األعمار
All ages
Total 13,817 52,346 185,860 412,901 549,430 252,497 64,991 1,531,842
Illiterate 4651 4884 7429 12496 17023 8,029 66 54,578
Read and write Night school 4034 13248 50,690 88,178 129,966 57,858 23,111 367,085
Primary 1342 7992 35,666 94,086 118,919 53,476 37,227 348,708
Preparatory 589 3378 14,710 50,578 60,875 48,474 4,439 183,043
Vocational 60 471 2359 6,140 10,093 4,148 129 23,400
Secondary 1010 7412 32,061 81,921 111,058 60,593 0 294,055
Post secondary 262 1947 6209 12,330 16,747 5,968 0 43,463
University and above 1866 13012 36,732 67,162 84,716 13,898 0 217,386
Other 3 2 4 10 33 53 19 124
Males 8,149 40,147 150,439 343,212 435,853 187,799 33,295 1,198,894
Illiterate 1729 2590 5050 9998 14389 6,904 33 40,693
Read and write Night school 2395 10067 42,035 73,718 109,925 51,331 11,887 301,358
Primary 959 6702 32,501 85,034 105,547 48,022 19,028 297,793
Preparatory 449 2654 12,170 46,358 47,525 29,735 2,207 141,098
Vocational 55 457 2307 6,019 9,920 4,099 129 22,986
Secondary 749 5748 25,778 69,694 87,509 36,291 0 225,769
Post secondary 200 1467 4620 9,290 12,073 4,124 0 31,774
University and above 1612 10462 25,977 43,100 48,945 7,261 0 137,357
Other 1 0 1 1 20 32 11 66
Females 5,668 12,199 35,421 69,689 113,577 64,698 31,696 332,948
Illiterate 2922 2294 2379 2498 2634 1,125 33 13,885
Read and write Night school 1639 3181 8,655 14,460 20,041 6,527 11,224 65,727
Primary 383 1290 3,165 9,052 13,372 5,454 18,199 50,915
Preparatory 140 724 2,540 4,220 13,350 18,739 2,232 41,945
Vocational 5 14 52 121 173 49 0 414
Secondary 261 1664 6,283 12,227 23,549 24,302 0 68,286
Post secondary 62 480 1589 3,040 4,674 1,844 0 11,689
University and above 254 2550 10,755 24,062 35,771 6,637 0 80,029
Other 2 2 3 9 13 21 8 58
April 2010
Sex and educational attainment
Age فئات العمــــــر
Population of 10 years and above by age, sex and educational attainment

Qatar Infrastructure Statistics-An overview
31
Table 5.15
April 2010 إبريل
لم يسبق له العمل Never Worked
Before
سبق له العملWorked Before
المجموع
Total
Total 190,880 4,519 1,269 5,788 1,270,183 1,466,851
Males 46,923 1,236 299 1,535 1,117,141 1,165,599
Females 143,957 3,283 970 4,253 153,042 301,252
Total 10850 55 7 62 43600 54,512
Males 1957 33 5 38 38665 40,660
Females 8893 22 2 24 4935 13,852
Total 18403 149 63 212 325359 343,974
Males 3614 66 61 127 285730 289,471
Females 14789 83 2 85 39629 54,503
Total 18426 347 88 435 292620 311,481
Males 5254 235 74 309 273202 278,765
Females 13172 112 14 126 19418 32,716
Total 41045 472 81 553 137006 178,604
Males 17372 221 60 281 121238 138,891
Females 23673 251 21 272 15768 39,713
Total 424 5 2 7 22840 23,271
Males 246 3 0 3 22608 22,857
Females 178 2 2 4 232 414
Total 53715 1330 175 1,505 238835 294,055
Males 13091 303 46 349 212329 225,769
Females 40624 1027 129 1,156 26506 68,286
Total 7376 68 41 109 35978 43,463
Males 1141 1 4 5 30628 31,774
Females 6235 67 37 104 5350 11,689
Total 40541 2092 810 2,902 173943 217,386
Males 4198 373 47 420 132739 137,357
Females 36343 1719 763 2,482 41204 80,029
Total 100 1 2 3 2 105
Males 50 1 2 3 2 55
Females 50 0 0 0 0 50
Population (15 +) by activity status, sex and educational attainment
Educational Attainment Sex
المجموع
Total
Total المجموع
Unemployed متعطلون
Primary
Preparatory
Vocational
Total
Illiterate
Read and Write & Night School
Other
غير النشيطين
اقتصاديا Not
Economically
Active
المجموع مشتغل و
متدرب براتب
Total
employed
and paid
trainee
Secondary
Post. Secondary
University and Above
Qatar Infrastructure Statistics-An overview
32
Table 5.16
Total المجموع
يعمل لدى ذويه
بدون أجر Non-paid
Family Worker
يعمل بأجرEmployee
يعمل لحسابه Own Account
Worker
صاحب عمل
ويديره
Employer
المجموع
Total
Total 26 1,265,756 1,829 2,572 1,270,183
Illiterate 4 43,514 44 38 43,600
Read and write Night school 1 324,928 284 146 325,359
Primary 1 292,132 326 161 292,620
Preparatory 1 136,710 145 150 137,006
Vocational 1 22,818 13 8 22,840
Secondary 8 237,067 793 967 238,835
Post secondary 2 35,869 51 56 35,978
University and above 8 172,716 173 1,046 173,943
Other 0 2 0 0 2
Males 22 1,113,216 1,801 2,102 1,117,141
Illiterate 4 38,581 44 36 38,665
Read and write Night school 1 285,300 283 146 285,730
Primary 1 272,719 324 158 273,202
Preparatory 1 120,950 142 145 121,238
Vocational 1 22,587 13 7 22,608
Secondary 8 210,800 787 734 212,329
Post secondary 1 30,529 49 49 30,628
University and above 5 131,748 159 827 132,739
Other 0 2 0 0 2
Females 4 152,540 28 470 153,042
Illiterate 0 4,933 0 2 4,935
Read and write Night school 0 39,628 1 0 39,629
Primary 0 19,413 2 3 19,418
Preparatory 0 15,760 3 5 15,768
Vocational 0 231 0 1 232
Secondary 0 26,267 6 233 26,506
Post secondary 1 5,340 2 7 5,350
University and above 3 40,968 14 219 41,204
April 2010 إبريل
Sex and educational attainment
Main status in employment الحالة العملية الرئيسية
Population employed (including employers) 15 years of age and over by
employment

Qatar Infrastructure Statistics-An overview
33
Table 5.17
Table 5.18
المجموعمدارس مختلطةمدارس بناتمدارس بنين
Boys Schools Girls SchoolsMixed SchoolsTotal
1518113146Schools Pre-primary
811237981002Classes
192829501781722695Student
135365487987Teachers
666173200Schoolsprimary
99698017263702Classes
23776241704077788723Student
2311286621977374Teachers
353653124Schools Preparatory
4984925851575Classes
11998118491296636813Student
933134011313404Teachers
323145108SchoolsGeneral Secondary(1)
4824624141358Classes
1211011871813032111Student
102015209943534Teachers
148146284578Schools
2057205735237637Classes
498125084079690180342Student
43996091480915299Teachers
(1) Includes specialized Secondary Stage
Total
School Type
STUDENT, SCHOOLS CLASSES AND TEACHERS, BY LEVEL OF EDUCATION
2005/20042006/20052007/20062008/20072009/20082010/2009
524844373226Boys schools
632556489398317258Classrooms
474139342926Girls Schools
623510473403342283Classrooms
23231917119Boys schools
2822421761356041Classrooms
282525201510Girls Schools
31425325719012357Classrooms
18161413126Boys schools
25722218815615126Classrooms
242220191614Girls Schools
316286272238210174Classrooms
333111Boys schools
171818444Classrooms
19517816414111692Schools
24412087187315241207843Classrooms
(*) Includes the preparatory Division of Religious Institute in year 2007/2008.
(**) Includes the Secondary Division of Religious Institute in year2007/2008.
Year
Educational Level
GOVERNMENT SCHOOLS AND CLASSROOMS
2004/2005 - 2009/2010
Total
Specialized Schools
Preparatory*
Primary
General Secondary**

Qatar Infrastructure Statistics-An overview
34
Tourism Infrastructure
Table 5.19
Table 5.20
2010
17 852 3,977 6,926 Luxury (*****)
11 475 2,129 3,501 First (****)
21 297 1,282 2,365 Second (***)
14 120 385 853 Third (**)
3 4 53 68 Fourth (*)
66 1,748 7,826 13,713 Total
عدد االسرةNo. of Beds
HOTELS BY NUMBER OF SUITES, ROOMS, BEDS AND CLASS
عدد الغرف No. of
Rooms
Item
Hotel Class
عدد الفنادقNo. of Hotels
عدد االجنحةNo. of Suites
20 562 4,488 369 7,323 Luxury (*****)
18 469 2,495 909 4,580 First (****)
21 357 1,089 81 2,679 Second (***)
12 73 386 6 662 Third (**)
3 4 53 - 68 Fourth (*)
74 1,465 8,511 1,365 15,312 Total
HOTELS BY NUMBER OF SUITES, ROOMS, BEDS AND CLASS
2011
فئة اخرى No. other
category
عدد الغرف No. of
Rooms
Item
Hotel Class
عدد الفنادقNo. of Hotels
عدد االجنحةNo. of Suites
عدد االسرةNo. of Beds

Qatar Infrastructure Statistics-An overview
35
Table 5.21
Table 5.22
(1)(2)(3)(4)=365x(1)(5)=(3÷4)x100 (6) =(3÷2)
7,323 155,181 1,117,097 2,672,895 42 7.2 Luxury (*****)
4,580 1,452,983 1,161,498 1,671,700 69 0.8 First (****)
2,679 229,060 295,738 977,835 30 1.3 Second (***)
662 62,333 101,323 241,630 42 1.6 Third (**)
68 5,743 8,690 24,820 35 1.5 Fourth (*)
15,312 1,905,300 2,684,346 5,588,880 48 1.4Total
HOTELS ACTIVITY BY HOTEL CLASS
2011
عدد النزالء No. of
Occupants
عدد الليالي
السياحية No. of
Touristic
Nights
عدد األسرة
ليالي السنةNo. of Beds
Nights Year
Item
Hotel Class
متوسط اقامة
النزيل (ليلة) Occupancy
Average Stay
(Nights)
متوسط اشغال
السرير Average of
Bed
Occupancy
عدد االسرةNo. of Beds
201 170 36 11 31 449 729 167 29 9 Doha
177 223 114 17 128 659 888 223 37 23 AL-Rayyan
42 38 5 3 23 111 131 37 5 3 AL- Wahrah
35 47 17 3 14 116 166 43 7 7 Umm Salal
31 35 7 5 36 114 119 33 2 1 AL- Khor
5 23 6 4 10 48 40 23 5 2 AL- Shamal
13 13 7 2 2 37 59 11 2 - AL-Daayen
504 549 192 45 244 1,534 2,132 537 87 45 Total
(1) Mosques Where all Prayers are Performed except Gumma.
(2) Mosques Where Prayers, Including Gumma Performed .
(3) Praying ground Where The Two Eid's Prayers are Performed.
2010
مسجد فروض
(1) Forood
Mosque
المجموعTotal
مسجد جامع
(2) Gumma
Mosque
مبنى مؤقت Temporary
Building
مصلى عيد
(3)
Eid Mosque
مسجد خاص
Private
Mosque
دور تحفيظ القران The role of
koranic
ذكور
M
عدد الخطباءKhateeb
عدد األئمة
والمؤذنين Imam And
Moathenإناث
F
Type of Mosgue
Municipality
NUMBER OF MOSQUES, ROLE OF KORANIC, IMAM & KHATEEB BY TYPE AND MUNICIPALITY
Qatar Infrastructure Statistics-An overview
36
Table 5.23
Table 5.24
12 25 25 38 38 Cinemas
....5,200 7,498 7,498 Number of seats
550,208 1,198,3611,365,000 1,530,000 1,590,270 Audience
238 609 540 484 1,280 Films
23 93 108 74 140 Arabic
215 516 432 410 1,140 Foreign
MOVIE HOUSES, AUDIENCE AND NUMBER OF FILMS
2007 - 2011
20072010 200820092011 Year
Item
57777Newspapers
57777Daily
410377Magazines
20011Weekly
210366Monthly
NEWSPAPERS AND MAGAZINES ISSUED IN THE STATE OF QATAR
2007 - 2011
2010 200820092011
Year
Newspapers
& Magazines
2007

Qatar Infrastructure Statistics-An overview
37
Table 5.25
Sports Infrastructure
Table 5.26
الدورياتالكتب االجنبيةالكتب العربيةالدورياتالكتب االجنبيةالكتب العربيةالدورياتالكتب االجنبيةالكتب العربيةالدورياتالكتب االجنبيةالكتب العربيةالدورياتالكتب االجنبيةالكتب العربية
Arabic BooksForeign
Books
Periodical
sArabic Books
Foreign
Books
Periodical
sArabic Books
Foreign
Books
Periodical
sArabic Books
Foreign
Books
Periodical
sArabic Books
Foreign
Books
Periodical
s
265,448 27,798 1,371 276,826 38,057 1,378 277,306 38,059 1,378 278,152 38,059 1,378 281,389 38,059 1,378 Qatar National Library
- - - 37,042 2,777 - 41,321 4,013 - 41,596 4,013 - 42,645 4,013 - AL-Khor Library
32,438 2,769 - 59,704 5,057 - 37,478 2,779 - 37,725 2,779 - 38,752 2,779 - AL-Shamal Library
54,220 4,978 - 41,240 4,001 - 59,904 5,061 - 60,147 5,061 - 60,455 5,061 - AL-Khanssa Library
31,516 1,929 - 35,645 2,727 - 32,877 1,940 - 33,092 1,940 - 33,953 1,940 - AL-Rayyan Library
31,792 2,719 - 32,385 1,930 - 36,159 2,728 - 36,360 2,728 - 37,096 2,728 - AL-Wakrah Library
54,241 2,790 36 61,110 3,120 36 62,630 3,840 41 47,541 1,980 28 65,500 4,015 37 SH -Ali AL -Thani
Library
469,655 42,983 1,407 543,952 57,669 1,414 547,675 58,420 1,419 534,613 56,560 1,406 559,790 58,595 1,415 Total
Books &
Periodicals
Name of Library
2008200920102011 2007
PUBLIC LIBRARIES AND AVAILABLE BOOKS AND PERIODICALS
2007-2011
10111212Staduim
78849090Pitch
18181818Swimming Pool
31323437Gymnasuim
8999Basketball Court
8101111Volleyball Court
11121212Handball Court
11111112Billiard Hall
3333Chess Hall
12131313Athletics Track
1111Camel Race Field
1111Horse Race Field
3333Car Race Ring
4444Eqestrian Field
11111111Shooting Gallery
20202020T.Tennis Hall
23232323Tennis Court
21232323Squash Court
3333Hockey Field
1111Golf Course
1111Sailing Club
1111Bowling Centre
280295305309Total
2010/2011Sport Facilities 2007/20082008/20092009/2010
QOC Sports Facilities During According to Type
(2007/2008 – 2010/2011)

Qatar Infrastructure Statistics-An overview
38
Table 5.27
غير قطريقطريغير قطريقطريغير قطريقطريغير قطريقطريغير قطريقطريQatarisNon-Qataris QatarisNon-Qataris QatarisNon-Qataris QatarisNon-Qataris QatarisNon-Qataris
90412133993812553178 Football
26248131129115056116172 Athletic
46215138141630 Basketball
7113541813312152 Handball
911676410212344 Volleyball
79010501973441 Table Tennis
00100000101Squash
061101067078794 Tennis
00030180002121 Bowling
411400005510 Chess
147040000141125Shooting &Archery
225600007815 Equestrian
112102021000233255 Billiard & Snooker
1605610181414453883 Swimming
60000001661622 Tackwando &Judo
1723100041014Karate
8006040481422 Wrestling
15600001011251742 Gymnastics
75686484272148 Fencing
20024801562531 Boxing
52000000527Wt. Lift. & Body Buildg.
00000000000Special Needs Sports
00000052752732 Cycling
00000000000 Sailing & Rowing
00030000033 Golf
1537947102641201782994426001,042Total
المجموع
Total Grade
& Nationality
Sportإجمالي
T
الدولية
International
األولى
First
الثانية
Second
الثالثة
Third
Referees, Registered at Sports Federations, By Type of Sports’ Activity , Nationality and grade
2010 / 2011
Qatar Infrastructure Statistics-An overview
39
Table 5.28
Teams / Associations
المجموعغير.قطريقطريالمجموعغير.قطريقطريالمجموعغير.قطريقطريQatarisNon-
Qataris
TotalQatarisNon-
Qataris
TotalQatarisNon-
Qataris
Total
09971932007202209Football
111120323214344Athletics
1450404014445Basketball
0550707007575Handball
1342626436568Volleyball
0550161602121Table Tennis
066000066Squash
0151500001515Tennis
347000347Bowling
28100002810Chess
1161700011617Shooting &Archery
156000156Equestrian
033000033Billiard & Snooker
211130262623739Swimming
0111100001111Taekwando &Judo
0556182462329Karate
033000033Wrestling
0202000002020Gymnastics
0111100001111Fencing
022000022Boxing
055000055Wt. Lift. & Body Buildg.
033000033Paralympics
022000022Cycling
044000044Sailing & Rowing
123000123Golf
0111100001111Women Sport Com.
131841971545747228641669Total
Coaches, Registered at Sports Federations, By Type of Sports’ Activity,
Nationality and Place of Work
2010 / 2011
المجموعاألنديـــــــةاإلتحادات / المنتخبات
Sports ActivityclubsTotal
Qatar Infrastructure Statistics-An overview
40
Table 5.29
المجموعخليجيعربيآسيويدوليمحلي
Domestic.IntAsianArabGCCTotal
0370010Football
000000Athletics
200002Basketball
110002Handball
000000Volleyball
000000Table Tennis
000000Squash
340007Tennis
000000Bowling
000000Chess
010001Shooting &Archery
000000Equestrian
000000Billiard & Snooker
100001Swimming
100001Taekwando &Judo
100113Karate
000000Wrestling
000011Gymnastics
200002Fencing
300003Boxing
000000Wt. Lift. & Body Buildg.
200002Paralympics
000000Cycling
000000Sailing & Rowing
000000Golf
300003Women Sport Com.
19971238Total
Sport
Coaches’ Training Courses By Type of Activity and Level
2010 / 2011

Qatar Infrastructure Statistics-An overview
41
Table 5.30
المجموعالصغاراألشبالالناشئينالشبابالعمومي
AdultsYouthJunior U18Junior U16KidsTotal
94331231Football
5453522Athletics
4333215Basketball
4222212Handball
4222616Volleyball
5333418Table Tennis
4866630Squash
5655021Tennis
3344317Bowling
301004Chess
404008Shooting &Archery
27151515072Equestrian
6166019Billiard & Snooker
08881236Swimming
101103Taekwando &Judo
8888840Karate
3444217Wrestling
122229Gymnastics
3333315Fencing
000000Boxing
000000Wt. Lift. & Body Buildg.
3633318Paralympics
9900018Cycling
221106Sailing & Rowing
301015Golf
401207Women Sport Com.
12093918471459Total
Sport
Domestic Championships, According to Sports Activity
and Athletes Age Groups
2010 / 2011

Qatar Infrastructure Statistics-An overview
42
Table 5.31
المجموعالصغاراألشبالالناشئينالشبابالعموميAdultsYouthJunior U18Junior U16KidsTotal
210047Football
210104Athletics
000000Basketball
300003Handball
100001Volleyball
111104Table Tennis
1455419Squash
102205Tennis
202004Bowling
503008Chess
100001Shooting &Archery
24071032Equestrian
14020016Billiard & Snooker
010001Swimming
200002Taekwando &Judo
200002Karate
000101Wrestling
100001Gymnastics
221005Fencing
500005Boxing
200002Wt. Lift. & Body Buildg.
100001Paralympics
100001Cycling
312006Sailing & Rowing
201014Golf
200002Women Sport Com.
801126119137Total
Sport
International Championships, According to Sports Activity
and Athletes Age Groups
2010 / 2011
Qatar Infrastructure Statistics-An overview
43
Table 5.32
المجموعالصغاراألشبالالناشئينالشبابالعموميAdultsYouthJunior U18Junior U16KidsTotal
7111010Football
310004Athletics
200002Basketball
211004Handball
300003Volleyball
000000Table Tennis
100001Squash
000336Tennis
100001Bowling
100001Chess
201003Shooting &Archery
100001Equestrian
410005Billiard & Snooker
130004Swimming
301004Taekwando &Judo
220004Karate
9010010Wrestling
000000Gymnastics
111003Fencing
100001Boxing
100001Wt. Lift. & Body Buildg.
100001Paralympics
000000Cycling
000000Sailing & Rowing
100001Golf
400004Women Sport Com.
511064374 Total
Sport
Asian Championships According Sports Activity
2010 / 2011
Qatar Infrastructure Statistics-An overview
44
Table 5.33
المجموعالصغاراألشبالالناشئينالشبابالعموميAdultsYouthJunior U18Junior U16KidsTotal
110002Football
111003Athletics
100001Basketball
000000Handball
102003Volleyball
111104Table Tennis
111003Squash
001102Tennis
100001Bowling
110114Chess
100001Shooting &Archery
000000Equestrian
210003Billiard & Snooker
110002Swimming
100001Taekwando &Judo
212207Karate
111003Wrestling
000000Gymnastics
311005Fencing
300003Boxing
100001Wt. Lift. & Body Buildg.
100001Paralympics
200002Cycling
010102Sailing & Rowing
102003Golf
601007Women Sport Com.
3311136164 Total
Sport
Arab Championships, According to Sports Activity
and Athletes Age Groups
2010 / 2011

Qatar Infrastructure Statistics-An overview
45
Table 5.34
المجموعالصغاراألشبالالناشئينالشبابالعموميAdultsYouthJunior U18Junior U16KidsTotal
511007Football
121105Athletics
200002Basketball
200002Handball
301004Volleyball
000000Table Tennis
010102Squash
011103Tennis
100001Bowling
000000Chess
100001Shooting &Archery
000000Equestrian
211004Billiard & Snooker
3442114Swimming
000000Taekwando &Judo
001102Karate
000000Wrestling
101103Gymnastics
411309Fencing
000000Boxing
200002Wt. Lift. & Body Buildg.
400004Paralympics
6700013Cycling
111003Sailing & Rowing
101002Golf
400004Women Sport Com.
43191410187 Total
Sport
GCC Championships According to Sports Activity
and Athletes Age Groups
2010 / 2011
Qatar Infrastructure Statistics-An overview
46
Health Infrastructure
Table 5.35
2006-2010
المعدل*العددالمعدل*العددالمعدل*العددالمعدل*العددالمعدل*العدد
NumberRate*NumberRate*NumberRate*NumberRate*NumberRate*
20211.9421631.7827921.9340372.4638492.24General
12191.1714211.1718181.2610890.6630701.79Private
32403.1135842.9446103.1851263.1369194.03Total
General
Private
Total
18171.7419621.6125021.7336692.2435532.07General
6700.648200.6710440.729490.5824311.42Private
24872.3827822.2835462.4546182.8259843.49Total
General
Private
Total
2040.202010.162900.203680.222960.17General
5490.536010.497740.531400.096390.37Private
7530.728020.6610640.735080.319350.55Total
General
Private
Total
54955.2761815.0773895.1072514.4384354.92General
7650.739940.8210390.723440.2121801.27Private
6260671755.8984285.8275954.63106156.19Total
General
Private
Total
4610.445090.426300.437150.448670.51General
7230.698080.668310.571820.1111370.66Private
11841.1413171.0814611.018970.5520041.17Total
General
Private
Total
15261.4617941.4722141.5326591.6228221.65General
6170.597770.649020.622260.1417911.04Private
21432.0525712.1131162.1528851.7646132.69Total
15851.5216511.3616401.1316230.9916670.97General
3830.373830.313940.273940.244260.25Private
19681.8920341.6720341.420171.2320931.22Total
General
Private
Total
136132261834
* Rates are per 1000 Population
No. of Dentist
51126061499544535794
Poulation Per Dentist 190020271871117042684
13851519
599712812
Population Per
Physicians 1557148613871727705
419438408355287
574621579447
314320248
483
No. of physicians
Total No. of Physicians
in Qatar
516563519406446Population Per
Physicians in Qatar 8568577971505559
322340
22921987
90031508
1827856
1443
881
2393
15081743
625991
No. of Nurses
No. of Pharmacist
4763787
216162
Population Per Nurses
Population Per
Pharmacist
190197196226203
1363
167
12261394
2262
170172
2299
Indicators
2010 2006200720082009
Sector
Health Indicators
Other health care
providers
658
No. of Beds in Hospitals
2723
73888310101029
3181367641594026Population Per Bed
530819

Qatar Infrastructure Statistics-An overview
47
Table 5.36
HOSPITALS, HEALTH CENTERS, CLINICS (1)
AND PHARMACIES
55666 Covernment Hospitals
44444 Private Hospitals
2323232222 Health Centers
55555 Children Emergencycare Centre
66666 Outpatient clinics
11111 Medical Commission
11111 Armed Forces Clinics
11111 Police Clinics
11111 Sports Medical Centre for Y.S.G.A
55555 Q.P Clinics
181219177200304 Private Sector Clinics (2)
165185188180250 Private Pharmacies
1922233336 Private Laboratories Analysis & X-Ray
(1) Location and not Functional Distribution
(2) Including Private Medical Complexes
2006-2010
Year
Particulars
20062007200820092010
Qatar Infrastructure Statistics-An overview
48
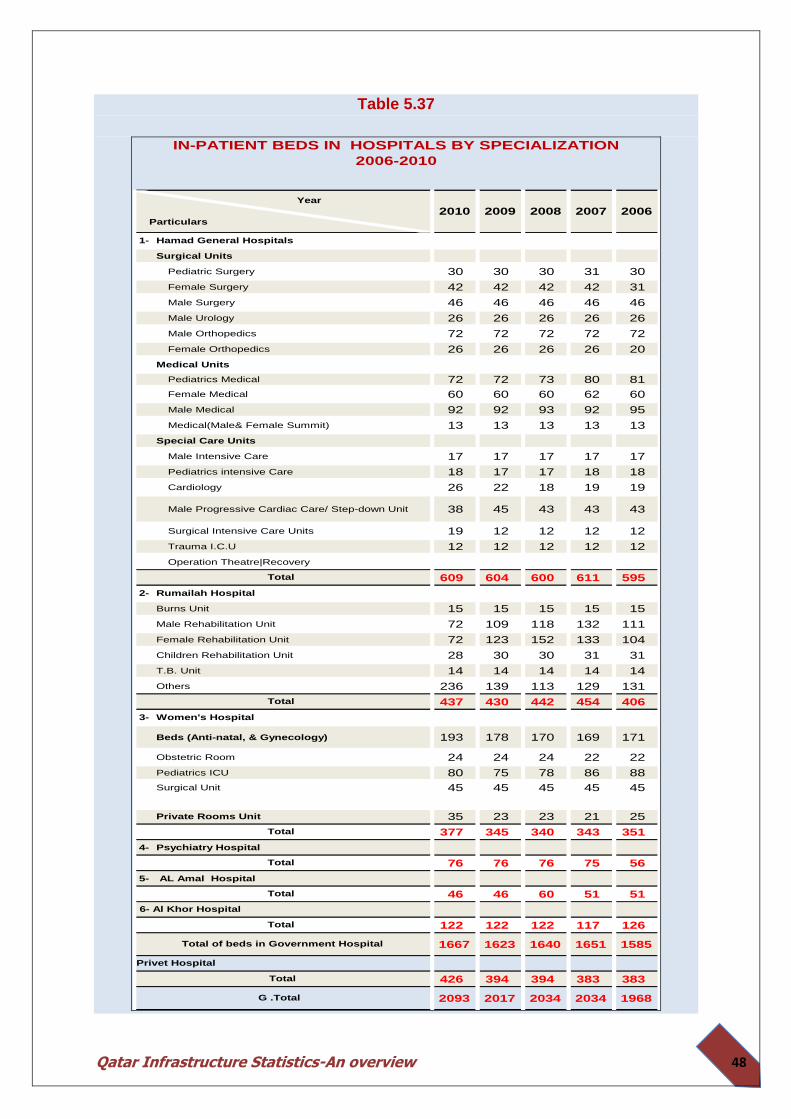
Table 5.37
Hamad General Hospitals1-
Surgical Units
3031303030Pediatric Surgery
3142424242Female Surgery
4646464646Male Surgery
2626262626Male Urology
7272727272Male Orthopedics
2026262626Female Orthopedics
Medical Units
8180737272Pediatrics Medical
6062606060Female Medical
9592939292Male Medical
1313131313Medical(Male& Female Summit)
Special Care Units
1717171717Male Intensive Care
1818171718Pediatrics intensive Care
1919182226Cardiology
4343434538Male Progressive Cardiac Care/ Step-down Unit
1212121219Surgical Intensive Care Units
1212121212Trauma I.C.U
Operation Theatre|Recovery
595611600604609
Rumailah Hospital2-
1515151515Burns Unit
11113211810972Male Rehabilitation Unit
10413315212372Female Rehabilitation Unit
3131303028Children Rehabilitation Unit
1414141414T.B. Unit
131129113139236Others
406454442430437
Women's Hospital3-
171169170178193Beds (Anti-natal, & Gynecology)
2222242424Obstetric Room
8886787580Pediatrics ICU
4545454545Surgical Unit
2521232335Private Rooms Unit
351343340345377
Psychiatry Hospital4-
5675767676
AL Amal Hospital5-
5151604646
126117122122122
15851651164016231667
383383394394426
19682034203420172093
IN-PATIENT BEDS IN HOSPITALS BY SPECIALIZATION
2006-2010
G .Total
Total
6- Al Khor Hospital
Total
Total of beds in Government Hospital
Total
Total
Total
Total
Privet Hospital
2007200820092010 2006
Total
Year
Particulars

Qatar Infrastructure Statistics-An overview
49
Table 5.38
2010
867979125215551784General Practioners
2643388165Cardiology
4456156153188Family Medicine
687114Infectious Diseases/T.B
137148176291233Pediatrics
2425294948Dermatology
2222265344Neurology & Psychiatry
8393105201131Anesthesiology
77788812890General Surgery
3235397365Orthopedics
2628374442Ophthalmology
2728405252Otorhinolaryngology (E.N.T.)
2334 - - Pathology
53565913473Radiology
444188Chest-Pulmonary Diseases
201615424Cardiovascular surgery
204201290368296Dentistry
555967128104Gynecology & Obstetrics
140132149238206Medicine
10891610Endocrinology
856712Gastroenterology
118101713Rehabilitation & Geriatrics
522112Preventive Health
19421Occupational Health
910123113Nephrology
7771713Rheumatology
2114152316Plastic Surgery
988139Neurosurgery
2220232633Urology
81319 - 25Oncology / Hematology
404596303235Others
20212163279240373849
(1) include physicians working in the public sector and the semi public sector
Total
Year
Field of Practice
2006200720082009
PHYSICIANS WORKING IN GOVERNMENT SECTOR BY FIELD OF PRACTICE(1)
2006-2010

Qatar Infrastructure Statistics-An overview
50
…………………..A Tail piece
HOME
Qatar Infrastructure Projects 2012 is specifically designed for MEED clients in the Middle
East and Europe who wish to learn about and capitalize on the opportunities emerging in
Qatar; the world’s fastest growing economy.
FIFA’s decision in December 2010 to appoint Qatar as host of the 2022 World Cup finals
has created additional reasons why every company interested in and serious about doing
business in the Middle East should know more about the country.
Qatar Infrastructure Projects 2012 will provide detailed information about all areas of
Qatar’s non-energy economy as the country continues on its remarkable and
comprehensive investment programme. Qatar Infrastructure Projects 2012 is Europe’s
only event for the major decision makers of Qatar to meet and network with significant
stakeholders in Europe...
MEED has specifically designed Qatar Infrastructure Projects 2012 to provide a detailed
overview of the vast commercial opportunities associated with the country’s on-going and
comprehensive infrastructure investment programme in the non-energy sector including:
transport infrastructure (roads, highways, roads, bridges, tunnels),
water and electricity
water reuse
waste management
social infrastructure
real estate developments; and
stadia build leading up to the 2022 World Cup
Why should you attend?
Discover the opportunities for your company in delivering the $160bn worth of
projects that will be delivered between now and 2022
Gain invaluable market insight and hear directly from key Qatari project stakeholders
including government officials, developers, clients and investors
Network directly with developers, designers, construction companies, equipment
and material suppliers and professional business service providers all committed to

Qatar Infrastructure Statistics-An overview
51
expanding their business in Qatar
What’s new for MEED's Qatar Infrastructure Projects 2012?
The 2012 programme will feature:
30+ speaker representatives from Qatar and Europe– discussing Qatar’s key
projects and the associated opportunities of how to get involved
2011 speakers and participants include: the Rt. Hon. Lord David Howell, Minister of
State, Foreign and Commonwealth Office, Ministry of Municipality & Urban Planning,
Ministry of Business & Trade, Public Works Authority (Ashghal), Qatar Financial
Centre Authority (QFCA), Olympic Delivery Authority (LONDON 2012), Qatar
Railways, Qatar National Bank and Qatar Electricity & Water Company
Project developers sharing their project updates – hear directly from clients from
the Utilities, Transport, Real Estate and Social Infrastructure sectors about their
upcoming development plans in Qatar, their estimated timelines and their preferred
financing structures
Interactive programme agenda formats – on stage interviews, debates, pre-
conference workshops, Q&A sessions, social drink receptions and unique site visits
– share your views, debate the key issues and get your own questions answered to
solidify your position as a leader in the Qatar market
The agenda is currently being developed and will be available for download shortly. If you
have any content or speaker suggestions, please contact Jennie Bishop on
www.ftse.com/Indices/FTSE_IDFC...Infrastructure Index.../index.jsp Cached - Similar
FTSE Group has partnered with the Infrastructure Development Finance Company (IDFC) to
create the FTSE IDFC India Infrastructure Index Series.
Recommended