Q3 2021 Presentation
Knut Nesse, CEO Ronny Meinkøhn, CFO
Klepp, 5 November 2021

Technology for sustainable biology

Agenda|Q3 2021
Highlights and Outlook
Financial Performance
Q&A Session
Knut Nesse, CEO Ronny Meinkøhn, CFO

Technology for sustainable biology
Highlights|Q3 2021
• Awarded contract for the full grow-out RAS facility from AquaConAS (approx. MUSD 150) subject to financing
• Low activity level and profit from the Sea Based business segment
• Limited impact from the COVID-19 restrictions
• Private placement of MNOK 321.7 completed in October
• Completed agreement to combine AKVA Marine Services AS with Abyss Group AS as a contribution in kind. AKVA group will own 25,5% in the combined company
Operation Innovation and Digital
• Continued high focus on developing capabilities within Land Based technology and advisory services
• Further development of deep-sea open farming concepts is crucial for strengthening the Sea Based business segment
• Strategic review of Digital business segment completed with clear ambitions and expectations of strong organic growth
4

Technology for sustainable biology
Key figures|Q3 2021
4144
66
58
32
Q3 18Q3 17 Q3 19 Q3 20 Q3 21
484
637
771 806738
Q3 17 Q3 18 Q3 19 Q3 20 Q3 21
6171
115105
79
Q3 18Q3 17 Q3 20Q3 19 Q3 21
738 MNOK 79 MNOK 32 MNOK
Revenue EBITDA EBIT
Note: IFRS 16 was implemented January 2019. Comparable figures for the period 2017-2018 have not been prepared5
Technology for sustainable biology
Comments to the financial performance Q3
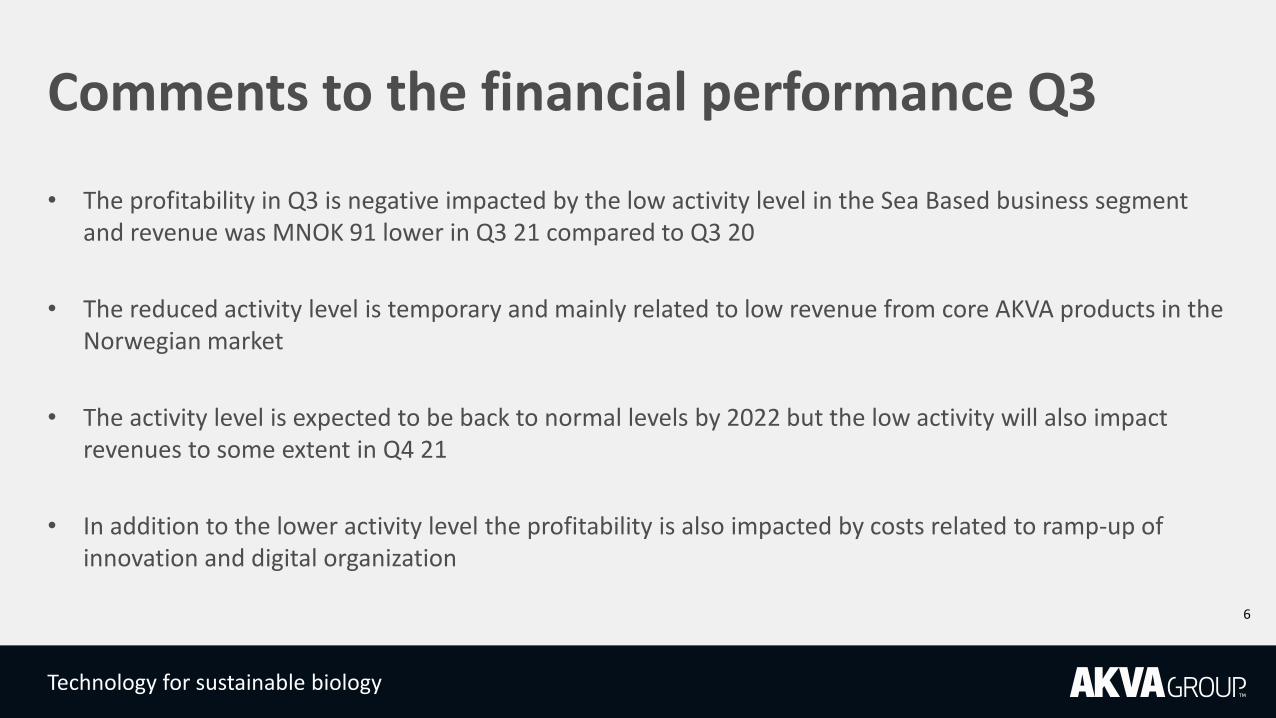
• The profitability in Q3 is negative impacted by the low activity level in the Sea Based business segment and revenue was MNOK 91 lower in Q3 21 compared to Q3 20
• The reduced activity level is temporary and mainly related to low revenue from core AKVA products in the Norwegian market
• The activity level is expected to be back to normal levels by 2022 but the low activity will also impact revenues to some extent in Q4 21
• In addition to the lower activity level the profitability is also impacted by costs related to ramp-up of innovation and digital organization
6

Technology for sustainable biology
Key figures|YTD Q3 2021
118108
168
138
101
Q3 19Q3 18Q3 17 Q3 20 Q3 21
1 531
1 854
2 422 2 4202 289
Q3 17 Q3 21Q3 18 Q3 19 Q3 20
180 182
312284
241
Q3 17 Q3 21Q3 18 Q3 20Q3 19
2 289 MNOK 241 MNOK 101 MNOK
Revenue EBITDA excluding cyber-attack costs* EBIT excluding cyber-attack costs*
Notes: - IFRS 16 was implemented January 2019. Comparable figures for the period 2017-2018 have not been prepared- Costs of 49,7 MNOK related to cyber-attack in Q1 21 are excluded 7
Technology for sustainable biology
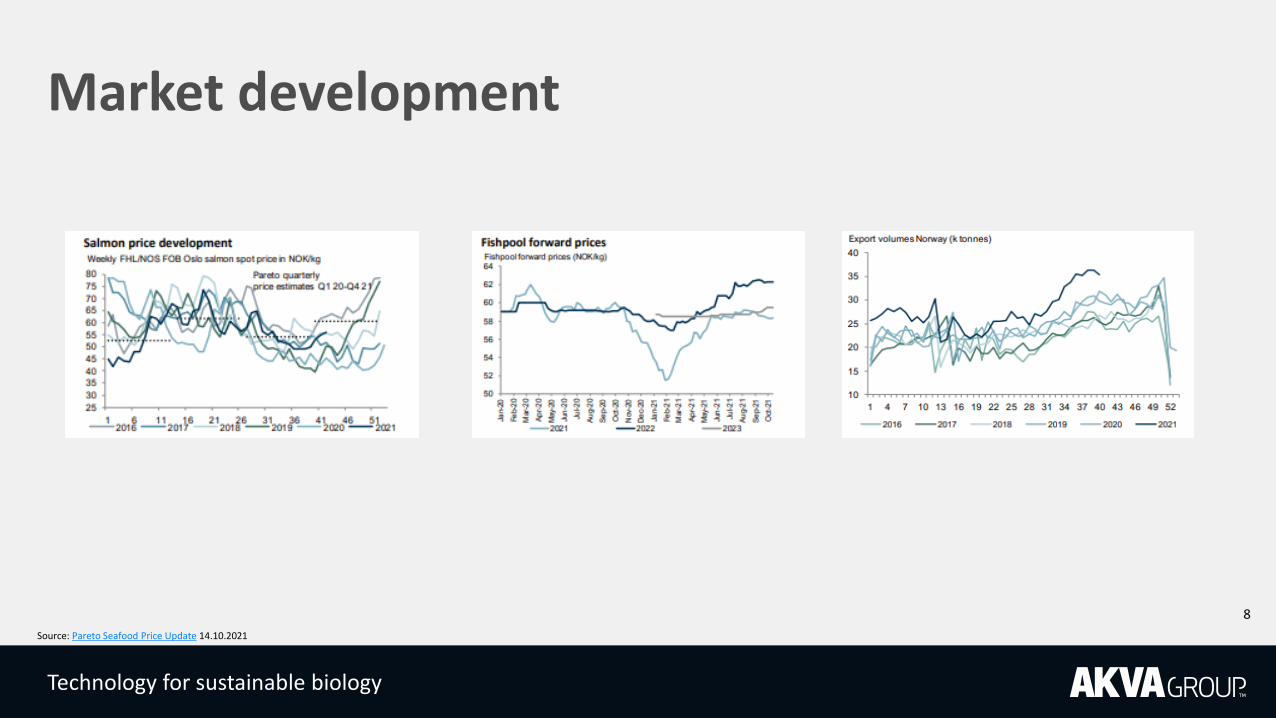
Market development
Source: Pareto Seafood Price Update 14.10.2021
8

Technology for sustainable biology
559 599 569735
563
385
1 317
29
34
16
Q1 21
72 69
Q3 20
26
14
Q4 20
116
Q2 21
19
Q3 21
647
1 009
651
880
1 933
AquaCon
Digital
Land Based
Sea Based
Order intake (MNOK) Order backlog (MNOK)
828 850 829 848 808
747975 929 948
1 317
867
Q4 20
5649
Q3 20
55
Q2 21Q1 21
67
66
Q3 21
1 6251 881 1 813 1 862
3 057
Digital
Sea Based
Land Based
AquaCon
Development order intake and order backlog
9*Notes: - 1 317 MNOK in order backlog related to AquaCon is subject to financing- Order backlog is reduced by MNOK 79 in Q3 related to the divestment of AKVA Marine Services AS

Technology for sustainable biology
COVID-19|Limited impact on operations
• Negative implications in H1 2021 were mainly related to travel restrictions and use of foreign workforce in ongoing operations
• Overall negative EBIT effect of approx. MNOK 15 in H1 21 related to COVID-19 restrictions
• The impact from the restrictions were limited in Q3 and we expect close to normal operations going forward
10

Strategic Status

Technology for sustainable biology
Key highlights new strategic investor
Private placement corresponding to 10% of outstanding shares (3,333,430) in AKVA at a subscription price of NOK 96,50 per share Total capital increase of MNOK 321.7 The transaction will accelerate AKVA’s strategic agenda in all business segments
Share sale existing shareholders of 3,266,762 shares at a purchase price of NOK 96,50 per share Total amount of MNOK 315.2
Establishment of investment platform for investments in land-based projects worldwide
Awarded RAS contract from AquaCon subject to financing
Strategic partnership with Israel Corp.
New shareholdings: Egersund Group AS ~ 51% Israel Corp. ~ 18% Other ~ 31%
12

Technology for sustainable biology
Underlying demand growth implies 1–2 million ton volume increase by 2030
4.0
2009 20272010 2015
3.0
20262011 2012 2013 20162014 2017 2018 2019 2020
1.5
20211.0
2022 2023 2024 2025 2028 2029 2030
2.0
2.5
3.5
4.5
5.0
2.6
4.6
3.7
High demand growth (~5%)1
Base case price-neutral volume growth (~3%)Historic development (~6%)
Salmon demand has increased by 1.1 mill tons from 2009-2019. “Base case” assumes similar demand growth till 2030 Consumption of salmon WFE in mill. tons
Supply potential
2019-2030:+1.1-2.0 mill tons
Key demand drivers
Distribution to new markets fueling demand, ~45% of total volume growth2015-2019
Product developments (e.g. smoked, marinated, sushi) resulting in salmon gaining market share
Modified Atmosphere Packaging (MAP) has prolonged shelf life and enabled grocery retailer distribution
Focus on environment and health increasing demand for more environmentally friendly and healthy sources of protein
Salmon among favored species for consumption in developed and emerging seafood markets
13

Technology for sustainable biology
The paradigm shift of land-based farming will require major capex investments until 2030 and beyond
1. Estimated 200 NOK/kg capex investment for land-based and 20 NOK/kg for conventional production
AKVA Group implications: Strong Cage Farming
segment Exponential growth in
Land Based revenue Likely high margins within
Land Based technology given potential shortage of RAS supplier capacity
Demand
Mill. tonsWFE • Restricted fresh supply requires market effort to
convert demand from fresh to frozen• Asian markets critical for growth – required to increase
and broaden marketing efforts
Conventional production
Mill. tonsWFE
• Innovation critical to achieve growth• New freezing technologies required to secure
increased quality for frozen intercontinental exports• Growth capex >20 bln NOK and additional
maintenance capex• Expectations 2030+ may limit investments/production
Land-based/other unconventional
Mill. tonsWFE
• ~160 bln NOK1 in CAPEX investments needed to reach land-based capacity of 800 th. tons by 2030
• RAS suppliers critical to achieve growth
1.01.30.6
0.72030
1.6
2019
1.92.6
4.5
Europe
NAM
Other
+5.1%
2019 2030
2.6
3.7+3.2%
2019
0.80
0.01
2030
14
14

Technology for sustainable biology
Three main segments within land based
Smolt: Post-smolt: Grow-out:
100 - 250 g 250 - 1000 g 5000 g
15
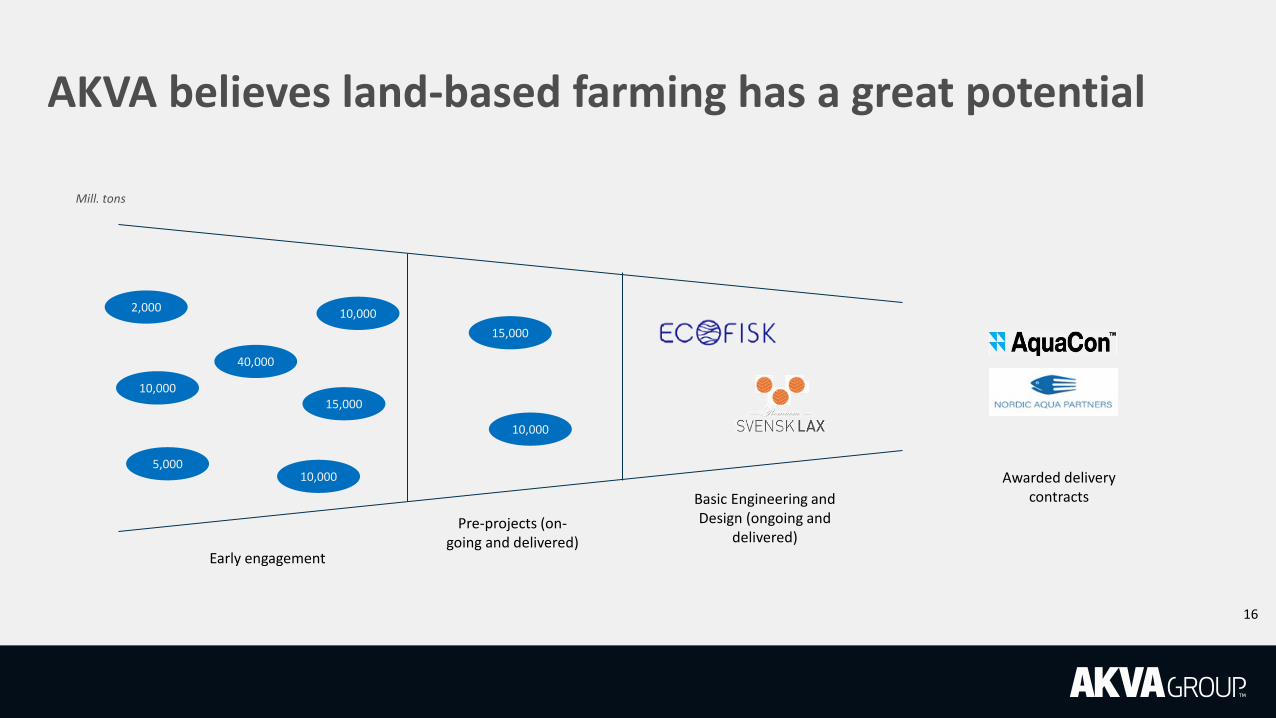
AKVA believes land-based farming has a great potential
Basic Engineering and Design (ongoing and
delivered)Pre-projects (on-
going and delivered)Early engagement
2,000
Mill. tons
15,00010,000
40,000
10,000
10,000
15,000
5,000
10,000
Awarded delivery contracts
16

Technology for sustainable biology
Strategy for Land Based Salmon Farming
Market leading Zero Water Concept RAS enabling sustainable and cost-
effective production
Data driven insight and intelligent farming systems enabling consistent
and optimized production - “Precision Farming”
Delivering complete scope of fish farming technology (e.g. feeding, fish tanks, fish handling, camera, lights,
sensors, control system)
Production Advisory Services – RAS production competence group helping
customers maximizing output and reducing cost
1
3
2
4
AKVA group Innovation agenda – Centre of Excellence
Standard 5,000 tonnes modules
Build up LB organization in Norway17

Establishment of investment platform to accelerate growth ambitions
• AKVA and Israel Corp. has agreed to establish an investment platform
• Investments in land-based projects worldwide using AKVA technology and solutions bearing in mind ESG considerations
• Both parties will contribute with MUSD 10 each and this can be in a pre-established project
• The goal is to raise further commitments from co-investors and partners up to MUSD 100
• The investment platform will target projects which are “closer to the consumer” (i.e. North America, Middle East and Asia)
18

Technology for sustainable biology
Market for smolt / post smolt land-based facilities expected to be strong towards 2030
Base (300g)
9
7
Base (300g)Low (200g) High (400g) Low (200g) High (400g)
14
5
12
212026-20302020-2025
Base case: smolt reaches 300g avg by 2030 High case: smolt reaches 400g avg by 2030Low case: smolt reaches 200g avg by 2030
1. Investments including facilities currently under construction
Market is driven by biomass volume and building costs
Total smolt production is expected to grow with 55-160,000 tonnes in the next 10 years
Smolt number is expected to continue to grow at 4% per year
Smolt sizes in 2030 considered are:— Low case = 200 gram— Base case = 300 gram— High case = 400 gram
Capex per 1000 tonnes— New facility: NOK ~220Mn— Expansion: NOK ~140Mn
Source: McKinsey analysis
19
Expected investments in Norwegian land-based farming facilities towards 2030 is BNOK 12-33
Technology for sustainable biology
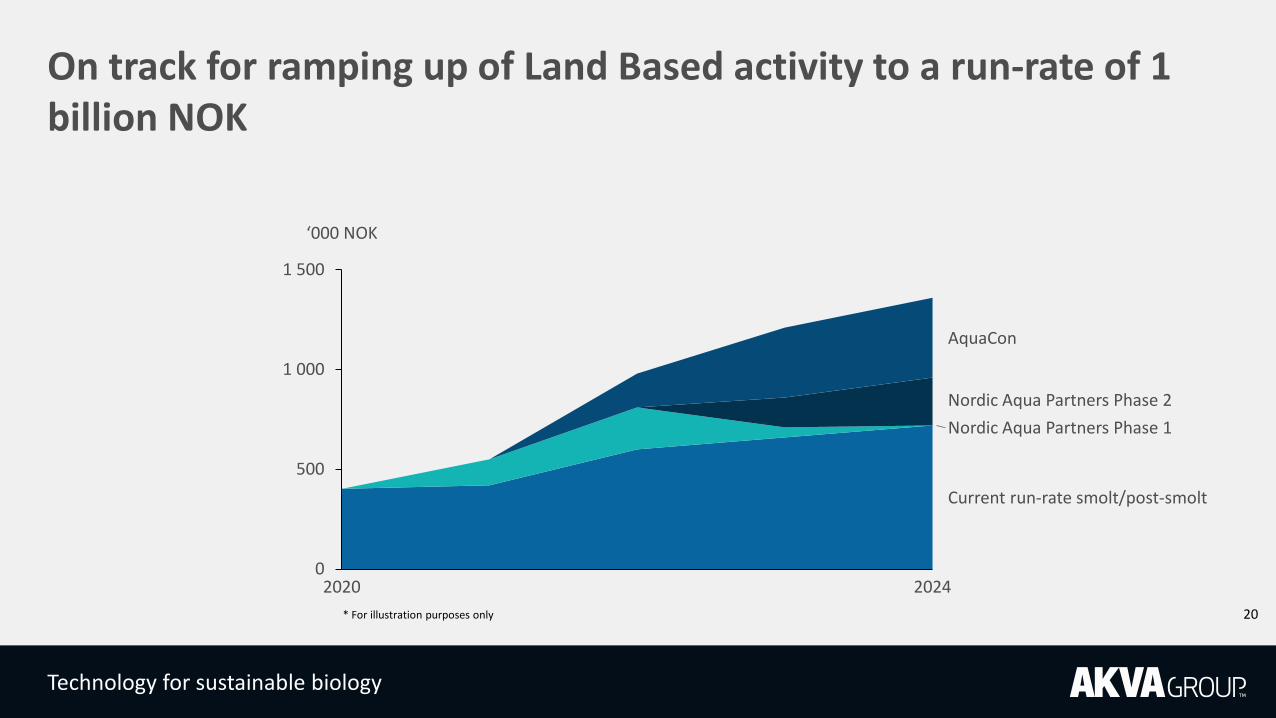
On track for ramping up of Land Based activity to a run-rate of 1 billion NOK
0
500
1 000
1 500
‘000 NOK
20222020 2021
Nordic Aqua Partners Phase 1
2023
Current run-rate smolt/post-smolt
2024
Nordic Aqua Partners Phase 2
AquaCon
* For illustration purposes only 20

Technology for sustainable biology
Precision Farming Sea based Solutions
Marine Infrastructurefor secure containment and efficient operations
• Plastic and Steel pens• Nets• Moorings• Boats• Net Cleaning services
and FNC8s
Precision Feeding for optimizing feed conversion and growth
• Barges• Feed systems• Camera systems• AKVAconnect• AKVA Observe• Fishtalk
Digitalto support precision farming with leading, open and modular digital solutions
• AKVAconnect• AKVA Observe• Fishtalk
Lice Solution to minimize number of lice treatments(Farmer's "license to operate")
• Tubenet• Plastic Cages• Feed system
- Sub surface feeding• Camera systems• Lights• Digital

Technology for sustainable biology
High focus to further develop deep-sea farming concepts
• Avoid or reduce unwanted surface influences like lice, algae, currents, high temperatures.
• Better fish health and reduced mortality
• Improved fish welfare and reduced frequency and cost of reactive lice treatments
• Facilitate salmon farming at more exposed sites
• Knowledge-based development in cooperation with Institute of Marine Research, SINTEF Ocean etc.
• Reduced lice infestations is needed to sustain production growth (Norwegian Traffic Light system)
• Help farmers sustain fish health, reduce risk and increase profits.
Benefits from deep-sea farming AKVA’s current commercial solutions
™
22

Technology for sustainable biology
Future of digitization in aquaculture
Remote operations Precision Fish Farming
Ecosystems
AKVAs current
response
23

Technology for sustainable biology
Strategic guidance
Organic topline growth
• Deliver min. 25% EBIT-increase Y-o-Y
• Step by step improve ROACE to min. 15% by 2023.
Min. 50% increase in Innovation spending to support new Product development and Organic growth
3 Digital platforms: AKVAconnect, AKVA Observe and Fishtalk
Operational excellence
24

Agenda|Q3 2021
Introduction and Highlights
Financial Performance
Q&A Session
Knut Nesse, CEO Ronny Meinkøhn, CFO

Technology for sustainable biology
• Revenue reduced by MNOK 68 compared to Q3 20
• EBITDA and EBIT was MNOK 26 lower in Q3 21 compared to Q3 20 and is related to lower activity level and product mix
• Higher financial costs Q3 21 compared to Q3 20 partly related to lower share price on the investment in Nordic Aqua Partners (MNOK 2,5) and partly due to currency effects
Q3 2021 – Income statement
26
2021 2020 2021 2020 2020Q3 Q3 YTD YTD Total
Revenue 738 806 2 289 2 420 3 177 EBITDA 79 105 192 284 338 EBITDA margin 10,7 % 13,1 % 8,4 % 11,8 % 10,6 %
EBITDA ex. cyber-attack costs1 79 105 241 284 338 EBITDA margin ex. cyber-attack costs1 10,7 % 13,1 % 10,5 % 11,8 % 10,6 %
Depreciation, amortization and impairment 47 48 141 147 191 EBIT 32 58 51 138 147 EBIT margin 4,4 % 7,2 % 2,2 % 5,7 % 4,6 %
EBIT ex. cyber-attack costs1 32 58 101 138 147 EBIT margin ex. cyber-attack costs1 4,4 % 7,2 % 4,4 % 5,7 % 4,6 %
Net Financial Items -13 -7 -48 -26 -26 Income (loss) before tax 19 51 3 112 121 Income (loss) before tax ex. cyber-attack costs1 19 51 52 112 121 Income tax 5 15 -3 28 31 Net income (loss) 14 36 6 84 91 Net income (loss) ex. cyber-attack costs1 14 36 44 84 91
Earnings per share (NOK) 0,43 1,07 0,17 2,51 2,74
Earnings per share (NOK) ex. special items 1 0,43 1,07 1,35 2,51 2,74
1 Cyber-attack costs of 49,7 MNOK in Q1
NOK million

Technology for sustainable biology
• Last twelve months order intake and revenue of MNOK 4,478 and MNOK 3,046, respectively
• Revenue reduced by 8% compared to Q3 20
• Increased activity in Land Based and Digital business segments but reduced revenue in Sea Based segment compared to Q3 20
Revenue development
Revenue (MNOK)
806757
719
832
738
Q3 21Q4 20Q3 20 Q1 21 Q2 2127

Technology for sustainable biology
Digital
Land Based
Sea Based
694580 590
716603
96
157 115
97
115
Q1 21
832
20
Q4 20Q3 20
757 73816
14
18
Q2 21
806
719
Q3 21
20
• Significant reduction of 22% in revenue in Nordic market
• Positive trend continues in Europe & Middle East
• Somewhat increased activity in Americas
Revenue by Segment (MNOK)Revenue by Market* (MNOK)
Nordic
AustralAsia
Europe & Middle East
Americas
508 469 512 548427
193153 84
130
144
98
122112
133
149
11
7
Q3 20
14
Q1 21Q4 20
21
Q2 21
806757
71919
832
Q3 21
738
* Note: Market definition is location of customer
Revenue by Market and Segment
• Sea Based represents 82% of total revenue in Q3 21
28

Technology for sustainable biology
• EBITDA of MNOK 79 / 10,7% in Q3 21
• Reduced profit compared to Q3 20 is mainly related to lower activity level and product mix in Sea Based segment
EBITDA and EBIT developmentEBITEBITDA
58
9
36 32 32
0,0
0,5
1,0
1,5
2,0
2,5
3,0
3,5
4,0
4,5
5,0
5,5
6,0
6,5
7,0
7,5
0,0
10,0
20,0
30,0
40,0
50,0
60,0
70,0
80,0
90,0
100,0
110,0
120,0
Q3 20
7,2%
Q1 21*
1,2%
Q2 21Q4 20
5,0%
3,9%
4,4%
Q3 21
EBIT (MNOK)
EBIT-margin
105
53
83 79 79
0,0
1,0
2,0
3,0
4,0
5,0
6,0
7,0
8,0
9,0
10,0
11,0
12,0
13,0
14,0
0,0
10,0
20,0
30,0
40,0
50,0
60,0
70,0
80,0
90,0
100,0
110,0
120,0
9,5%
13,1%
6,8%
Q3 20 Q1 21*
10,7%
Q4 20
11,5%
Q2 21 Q3 21
EBITDA (MNOK)
EBITDA-margin
*Note: Costs of MNOK 49,7 related to cyber-attack in Q1 21 are excluded29

Technology for sustainable biology
Including a MNOK 300 available credit facility in Danske Bank
Cash flow and financial position
616 546 586733 744
405 535 544519 460
2,93,2
3,4
3,94,1
0,000,350,701,051,401,752,102,452,803,153,503,854,20
0
200
400
600
800
1 000
1 200
1 400
1 600
1 800
1 021
Q3 20 Q4 20 Q1 21
1 130
Q2 21 Q3 21
1 081
1 252 1 204
NIBD
NIBD/EBITDA (12 mth rolling)
Lease Liability (IFRS 16)
316
261 259
375 368
012345678910111213
0
100
200
300
400
500
600
Q1 21
10,3%
Q3 20
8,2%
Q4 20 Q2 21
12,1%
8,2%
12,1%
Q3 21
562525
469
322 311
0
100
200
300
400
500
600
Q3 20 Q4 20 Q1 21 Q2 21 Q3 21
Available cash Net Working capital Net debt / EBITDA*
*Note: NIBD/EBITDA ratio for the period Q1 20 to Q3 20 is adjusted for non-recurring items of MNOK 108 and in the period Q1 21 to Q3 21 for non-recurring cyber-attack costs of MNOK 49,7
NIBD/EBITDA covenant threshold of 4,25
30
Technology for sustainable biology
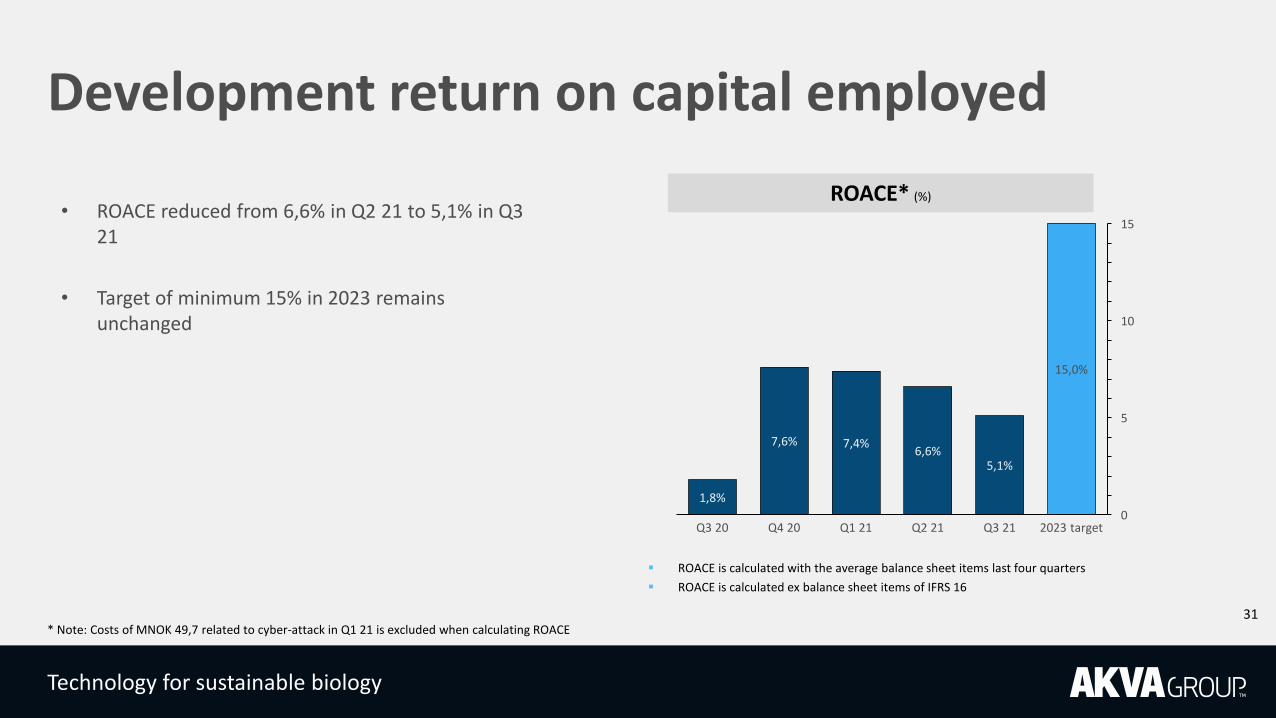
Development return on capital employed
ROACE is calculated with the average balance sheet items last four quarters ROACE is calculated ex balance sheet items of IFRS 16
ROACE* (%)
15
10
5
0
7,4%
Q4 20
1,8%
Q3 20
7,6%
Q1 21
6,6%
Q2 21
15,0%
2023 targetQ3 21
5,1%
• ROACE reduced from 6,6% in Q2 21 to 5,1% in Q3 21
• Target of minimum 15% in 2023 remains unchanged
* Note: Costs of MNOK 49,7 related to cyber-attack in Q1 21 is excluded when calculating ROACE31

Technology for sustainable biology
Dividend
0,75
1,251,50
1,75
1,00 1,00
2016 Q2 20212017 20192018 2020
• A dividend of NOK 1,00 per share was paid on 14 April 2021
• Due to the challenging first half year of 2021 the companyhas decided not to pay any dividend in the second half
Cash dividend (NOK per share)
32

Business segments

Technology for sustainable biology
• Revenue reduced by 13% in Q3 compared to Q3 20 while order intake was at the same level as last year
Nordic• Revenue reduced by 25% in Q3 compared to Q3 20 • Total order intake of MNOK 339 and 22% reduction compared to
Q3 20
Americas• 24% reduction in revenue in Q3 compared to Q3 20• Increase in order intake of 140% in Q3 compared to Q3 20
Europe & Middle East• Significant increase in revenue of 47% but a reduction in order
intake of 25% compared to Q3 20
453338
178
140
63
125
0
1
2
3
4
5
6
7
8
9
10
11
12
13
14
15
0
100
200
300
400
500
600
700
800
900
1 000
2021 Q3
14,4%
2020 Q3
11,6%694
603
Revenue (MNOK) and EBITDA-margin (%)
EBITDA %
Europe & Middle East
Americas / AustralAsia
Nordic
Sea Based Technology
34

Technology for sustainable biology
Development OPEX based revenue
• As expected, the share of recurring revenue increased in Q3 as the travel restrictions were lifted in June
• Overall, the activity level at service stations in Norway were high during Q3
240223
194225 238
0
5
10
15
20
25
30
35
40
0
50
100
150
200
250
300
Q1 21
32,9%
34,6%
37,6%
Q3 20 Q4 20 Q2 21
31,4%
39,5%
Q3 21% of total Sea Based revenue
OPEX Based revenue
Revenue (MNOK)
35

Technology for sustainable biology
Land Based Technology
• Order intake of MNOK 1,349 in the quarter compared to MNOK 68 in Q3 2020
• Revenue increased by 20% in Q3 21 compared to Q3 20 and further increase in activity level is expected in Q4
• EBITDA of MNOK 6,6 (5,7%) in the quarter
92
113
4
0
2
4
6
8
10
12
14
16
18
20
22
24
26
20
30
40
50
60
70
80
90
100
110
120
0,2%
2021 Q3
960
0
2020 Q3
5,7%
1152
EBITDA %
Europe&Middle East
Americas
Nordic
Revenue (MNOK) and EBITDA-margin (%)
36

Technology for sustainable biology
Digital
• Revenue increased by 24% in Q3 21 compared to last year
• Reduced EBITDA margin related to ramp-up of organization
1113
5
6
0
5
10
15
20
25
30
35
0
5
10
15
20
25
30
35
40
1
2021 Q3
31,6%
2020 Q3
13,0%
161
20
Americas
EBITDA %
Europe&Middle East
Nordic
Revenue (MNOK) and EBITDA-margin (%)
37

Outlook

• Order backlog is solid and forms a good foundation to execute our organic growth strategy
• Long term fundamentals remains unchanged as presented in our Capital Markets Day in November 2020
• Private placement of MNOK 321,7 will accelerate our strategic agenda within all three business segments
• Establishment of investment platform to facilitate our organic growth ambition within the Land Based business segment
• Digital solutions is an important part of AKVA groups total product offering and the company will continue to invest and improve our solutions, both within Sea Based and Land Based Technology
Outlook
39

Agenda|Q3 2021
Introduction and Highlights
Financial Performance
Q&A Session
Knut Nesse, CEO Ronny Meinkøhn, CFO

Technology for sustainable biology
Disclaimer• All opinions and statements in this notice are, regardless of source, given in good faith, and may only be valid as of the stated date of this
notice and may be subject to change without notice. AKVA group has taken all reasonable steps to ensure that the information contained in this notice is true and not misleading. Notwithstanding such efforts, we make no guarantee as to its accuracy or completeness.
• This notice includes forward-looking statements. Forward-looking statements are based on current plans, estimates and projections, and therefore investors should not place undue reliance on them. Words such as “expect”, “anticipate”, “believe”, “intend”, “estimate, “should” and other similar expressions are intended to identify forward-looking statements but are not the exclusive means of identifying such statements. Forward-looking statements speaks only as of the date they are made, and we undertake no obligation to update any forward-looking statement in light of new information or future events.
• Forward-looking statements involve inherent risks and uncertainties, most of which are difficult to predict and generally beyond AKVA group’s control. Although it is believed that the plans, objectives, expectations, estimates and intentions expressed in such forward-looking statements are reasonable, investors should bear in mind that a number of important factors could cause actual results to differ materially from the plans, objectives, expectations, estimates and intentions expressed in such forward-looking statements, including assumptions relating to general economic conditions in Norway and worldwide. Numerous factors exist and may occur that could cause AKVA group’s actual operations, result or performance to differ from the forward-looking statements.
• Any use of information contained in this notice is at your own individual risk. AKVA group assumes no liability for any losses caused by relaying on the information contained in this notice, including investment decision taken on the basis of this notice.
• This notice is not intended for, and must not be distributed to, individuals or entities in jurisdictions where such distribution is unlawful.
41

Appendix

AKVA group in brief
Leading technology and service partner
Listed on Oslo stock exchange since 2006
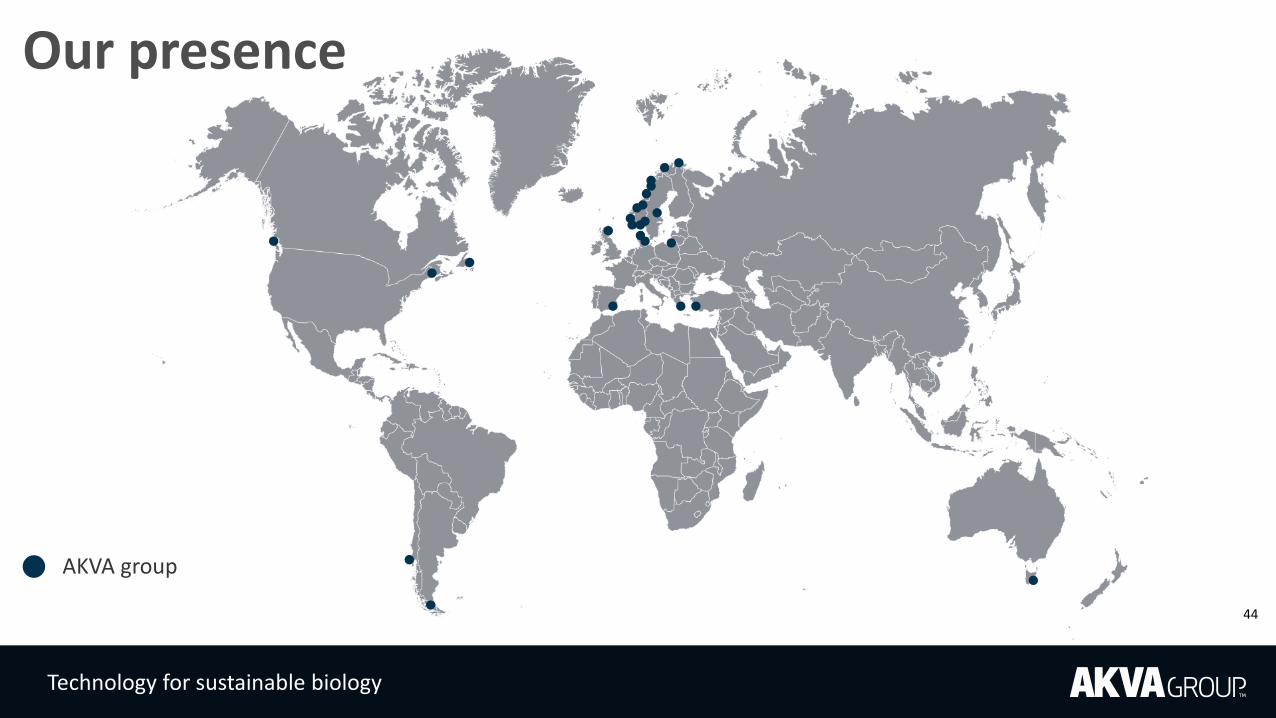
Deliveries in 65 countries over 40 years
Companies in 10 countries. 1 437 employees
Technology for sustainable biology
AKVA group
Our presence
44

Technology for sustainable biology
SolutionsSea Based Technology Land Based Technology Digital
45

Technology for sustainable biology
Revenue by species
Revenue by Species (MNOK)
741690 664
725625
4143
65
64
41
49
Q3 21Q4 20
23
Q3 20 Q1 21
24
3620
Q2 21
806757
719
832
738
Non seafood
Salmon
Other species
46

Technology for sustainable biology
Balance sheet
3347
CONDENSED CONSOLIDATED STATEMENT OF FINANCIAL POSITION 2021 2020 2020(NOK 1 000) 30.9. 30.9. 31.12.
Intangible f ixed assets 936 882 1 055 369 1 043 350 Deferred tax assets 2 319 12 932 10 872 Fixed assets 625 070 725 511 749 124 Long-term financial assets 331 924 105 148 148 437 FIXED ASSETS 1 896 196 1 898 958 1 951 784
Stock 550 860 491 970 474 930 Trade receivables 580 082 552 491 483 993 Other receivables 82 817 92 122 91 103 Cash and cash equivalents 87 925 262 097 224 884 CURRENT ASSETS 1 301 684 1 398 680 1 274 910
TOTAL ASSETS 3 197 880 3 297 639 3 226 694
Paid in capital 880 174 880 374 880 174 Retained equity 96 152 192 563 161 364 Equity attributable to equity holders of AKVA group ASA 976 327 1 072 937 1 041 538 Non-controlling interests 119 3 867 158 TOTAL EQUITY 976 447 1 076 803 1 041 696
Deferred tax 44 387 86 315 58 272 Other long term debt 38 771 31 225 32 361 Lease Liability - Long-term 395 484 352 765 444 920 Long-term interest bearing debt 754 187 845 867 766 239 LONG-TERM DEBT 1 232 827 1 316 173 1 301 792
Short-term interest bearing debt 77 889 32 166 844 Lease Liability - Short-term 64 083 51 923 93 821 Other current liabilities 846 633 820 574 788 542 SHORT-TERM DEBT 988 605 904 663 883 207
TOTAL EQUITY AND DEBT 3 197 880 3 297 639 3 226 694

Technology for sustainable biology
Cash flow statement
48
CONDENSED CONSOLIDATED STATEMENT OF CASH FLOW 2021 2020 2021 2020 2020(NOK 1 000) Q3 Q3 YTD YTD Total
Cash flow from operating activitiesProfit before taxes 19 263 50 584 2 577 111 811 121 475Taxes paid -13 278 -8 619 -25 936 -13 578 -27 509 Net interest cost 10 862 8 966 31 415 31 567 41 622Gain/loss on disposal of f ixed assets -295 5 704 -1 005 5 693 5 705
Depreciation and amortization 46 950 47 538 140 827 146 478 190 928
Changes in stock, accounts receivable and trade payables -113 126 -61 067 -168 052 -192 299 13 480
Changes in other receivables and payables 120 218 19 553 69 518 169 282 8 264Net foreign exchange difference -15 132 -4 776 -30 004 -3 980 -7 373 Cash generated from operating activities 55 463 57 884 19 341 254 973 346 591
Interest paid -11 090 -9 745 -32 694 -35 261 -46 089 Interest received 228 779 1 279 3 694 4 467Net cash flow from operating activities 44 601 48 918 -12 074 223 406 304 969
Cash flow from investment activitiesInvestments in f ixed assets -23 347 -20 753 -69 687 -86 293 -103 199 Proceeds from sale of f ixed assets 287 37 197 1 979 37 644 43 925Net payment of long-term receivables 0 -8 251 0 -30 363 0Payment of shares and participations 0 0 -30 803 0 -38 585 Acquisition of shares and subsidiaries net of cash acquired 0 0 0 -90 525 -90 542 Net cash flow from investment activities -23 060 8 193 -98 511 -169 536 -188 401
Cash flow from financing activitiesRepayment of borrow ings -72 871 -12 973 -67 948 -125 946 -203 076
Proceed from borrow ings 0 835 77 879 200 835 200 000
Dividend payment 0 0 -32 956 -33 157 -33 157
Dividents payment to NCI 0 0 0 -1 798 -1 798
Sale/(purchase) ow n shares 0 0 0 0 -14 662 Net cash flow from financing activities -72 871 -12 138 -23 025 39 934 -52 692
Net change in cash and cash equivalents -51 330 44 973 -133 610 93 804 63 876Net foreign exchange differences -3 319 1 333 -2 004 7 295 10Cash and cash equivalents at beginning of period 143 920 215 792 224 884 160 999 160 999Cash and cash equivalents divested entities -1 347 0 -1 347 0 0Cash and cash equivalents at end of period 87 925 262 097 87 925 262 097 224 884

Technology for sustainable biology
Largest shareholders20 largest shareholders
Origin of shareholders, 5 largest countries
Share development
Subscribe to Oslo Stock Exchange Releases from AKVA by email on:http://ir.akvagroup.com/investor-relations/subscribe 49

Technology for sustainable biology
• The company is aiming to give the shareholders a competitive return on investment by a combination of cash dividend and share price increase
• The company’s dividend policy shall be stable and predictable
• When deciding the dividend, the Board will take into consideration expected cash flow, capital expenditure plans, financing requirements/compliance, appropriate financial flexibility, and the level of net interest-bearing debt
• The company needs to be in compliance with all legal requirements to pay dividend
• The company will target to pay dividend twice a year
Dividend policy
50


Recommended