Wapic Insurance Plc.
Q3 2016 Financial Results Presentation to Investors & Analysts
November 1, 2016

PresentersBode OjeniyiExecutive Director, Sales & Distribution
Yinka AdekoyaManaging Director, Wapic Insurance Plc.
Olufemi ObalekeExecutive Director, Sales & Distribution
Dayo ArowojoluManaging Director, Wapic Ghana Ltd.
Zina Y. Giwa-AmuStrategy & Investor Relations
Seyi TaiwoChief Financial Officer
Rantimi OgunleyeManaging Director, Wapic Assurance Ltd.

Proprietary & Confidential Strategy & PMO
MOOV
Protect your vehicle the smart way.

SpeakerTopics
About Wapic
Operating Environment
Regulatory Environment
Financial Overview
Outlook
Proprietary & Confidential Strategy & PMO
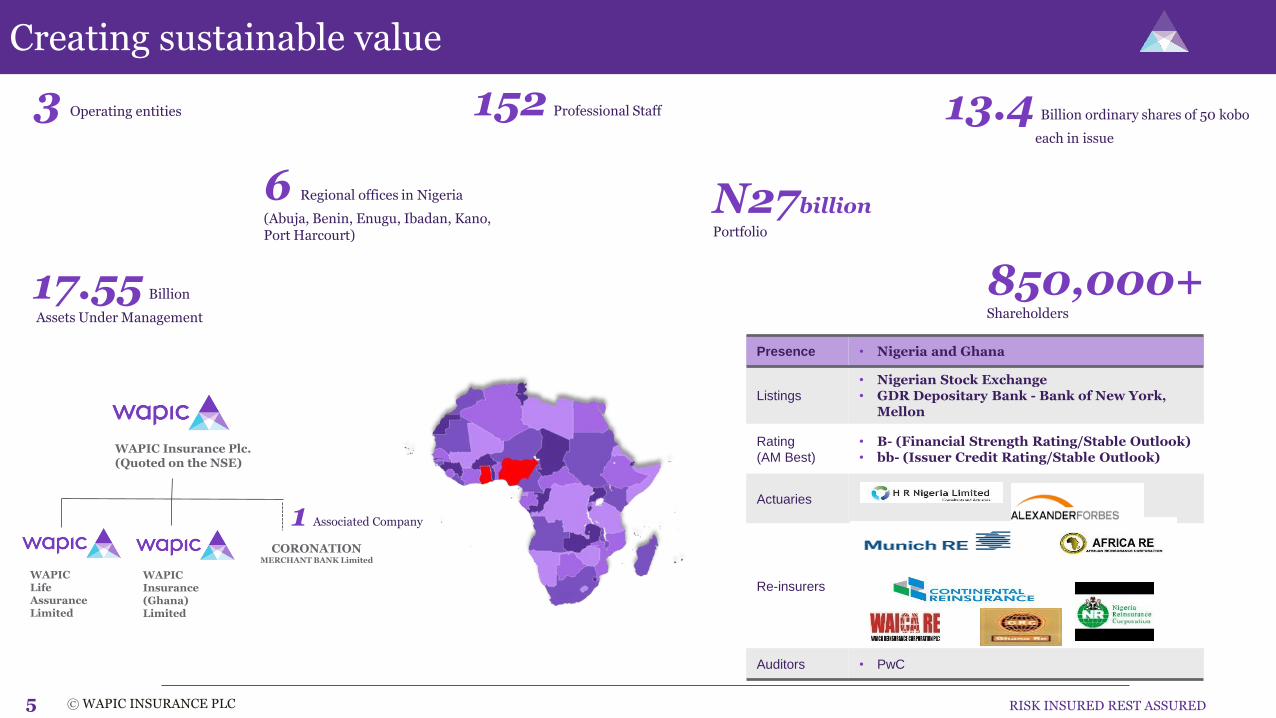
Creating sustainable value
5 © WAPIC INSURANCE PLC RISK INSURED REST ASSURED
152 Professional Staff3 Operating entities
Presence • Nigeria and Ghana
Listings
• Nigerian Stock Exchange• GDR Depositary Bank - Bank of New York,
Mellon
Rating
(AM Best)
• B- (Financial Strength Rating/Stable Outlook)• bb- (Issuer Credit Rating/Stable Outlook)
Actuaries
Re-insurers
Auditors • PwC
1 Associated Company
CORONATION MERCHANT BANK Limited
WAPIC Insurance Plc. (Quoted on the NSE)
WAPIC Life Assurance Limited
WAPIC Insurance (Ghana) Limited
6 Regional offices in Nigeria
(Abuja, Benin, Enugu, Ibadan, Kano, Port Harcourt)
13.4 Billion ordinary shares of 50 kobo
each in issue
N27billionPortfolio
850,000+Shareholders
17.55 Billion
Assets Under Management

Proprietary & Confidential Strategy & PMO
Operating environment
6
GD
P G
row
th
© WAPIC INSURANCE PLC RISK INSURED REST ASSURED
9.17 9.39 9.55
12.77
16.4817.85
Infla
tionHeadline inflation has trended upwards consistently since 2015
reaching 17.61% in August 2016; an 11-year high largely due torising energy and food prices as well as the pass-through effect onprices of imported items. MoM, headline inflation grew at it slowestpace in 7 months in August 2016. Although inflation rose to 17.85%at the end of Q3 2016, the underlying patterns show a slowing ofinflationary pressures.
Jun’15 Sep’15 Dec’15 Mar’16 Jun’16 Sept’16
63.85
47.69
36.61 38.21
48.05 48.24
Cru
de O
il $/b
arrel
Oil prices maintained a relatively flat growth during Q3 2016peaking at $50 per barrel. The continued vandalisation of thecountry’s oil installations by militant groups has resulted insignificant output shortages with Nigeria losing the status ofAfrica’s top oil producer to Angola.
Jun’15 Sep’15 Dec’15 Mar’16 Jun’16 Sept’16
197 197 197 197
280311.62
229.0 223.5 240.0
320.0348.0 475.0
Official Rate Parallel Mkt
FX
Ra
te N
/$
The Naira has depreciated significantly since the adoption of thefloating FX policy in June 2016. the Naira maintained a relativelysteady rate of N315/$ towards the end of Q3 2016 at the interbankmarket. However at the parallel market the Naira weakened to arecord low of N490/$ during the period.
Jun’15 Sep’15 Dec’15 Mar’16 Jun’16 Sept’16
2.352.84
2.11
-0.36
-2.06
-3.38
The economy has recorded two consecutive quarters of negativegrowth: -0.36% and -2.06% in Q1 and Q2 2016 respectively. Withthe exception of agriculture and telecommunications, all majorsectors of the economy are in recession.S&P lowered Nigeria’s long-term foreign and local currencysovereign credit ratings to 'B' from 'B+‘ on weak growth but stableoutlook signals.
GD
P G
row
th (
%)
Jun’15 Sep’15 Dec’15 Mar’16 Jun’16 Sept’16
e

Proprietary & Confidential Strategy & PMORISK INSURED REST ASSURED
Regulatory & industry environment
7 © WAPIC INSURANCE PLC
NAICOM has established the modalities for the establishment of a nationwide municipalInsurance pool. Municipal risk pools is a form of risk management practiced by insurancecompanies which pool resources together to help ease financial pressures in the event ofcatastrophic risks.
NAICOM has concluded plans to sign a memorandum of understanding (MoU) with Stategovernments across the country for enforcement of compulsory insurance. The MoU when signedwill increase the internally generated revenues (IGR) of participating states while ensuring theenforcement of compulsory insurance nationwide.
In order to ensure sustainability and enhance the quality of Islamic Bonds, (Sukuk), the CBN hasset commercial banks’ investment in the bonds issued by state governments to 10% of the totalamount on offer and a maximum tenor of 10 years for the bonds. This will further deepen themarket and promote investment and secondary market activities.
NAICOM has suspended bancassurance partnership deals between insurance companies and banksindefinitely. This follows the CBN’s refusal to allow NAICOM issue insurance licenses to banks for theprovision of bancassurance services to bank customers. As a result, all relationships NAICOM previouslyaccommodated, where insurance companies pay commission/fees to banks for insurance transactions,referral or introduction, are no more valid.
The National Pension Commission (PENCOM) is set to roll out plans to partner with other WestAfrican pension organizations to establish a strong and reliable pension scheme in the sub-region.
Increased pressure on capital owing to shift to Solvency II and ORSA as well as NAICOM’s drivetowards risk based supervision and capitalization rules.

Speaker Topics
Financial Highlights
Income Statement Review
SOFP Review
Assets under Management
Proprietary & Confidential Strategy & PMO
%∆
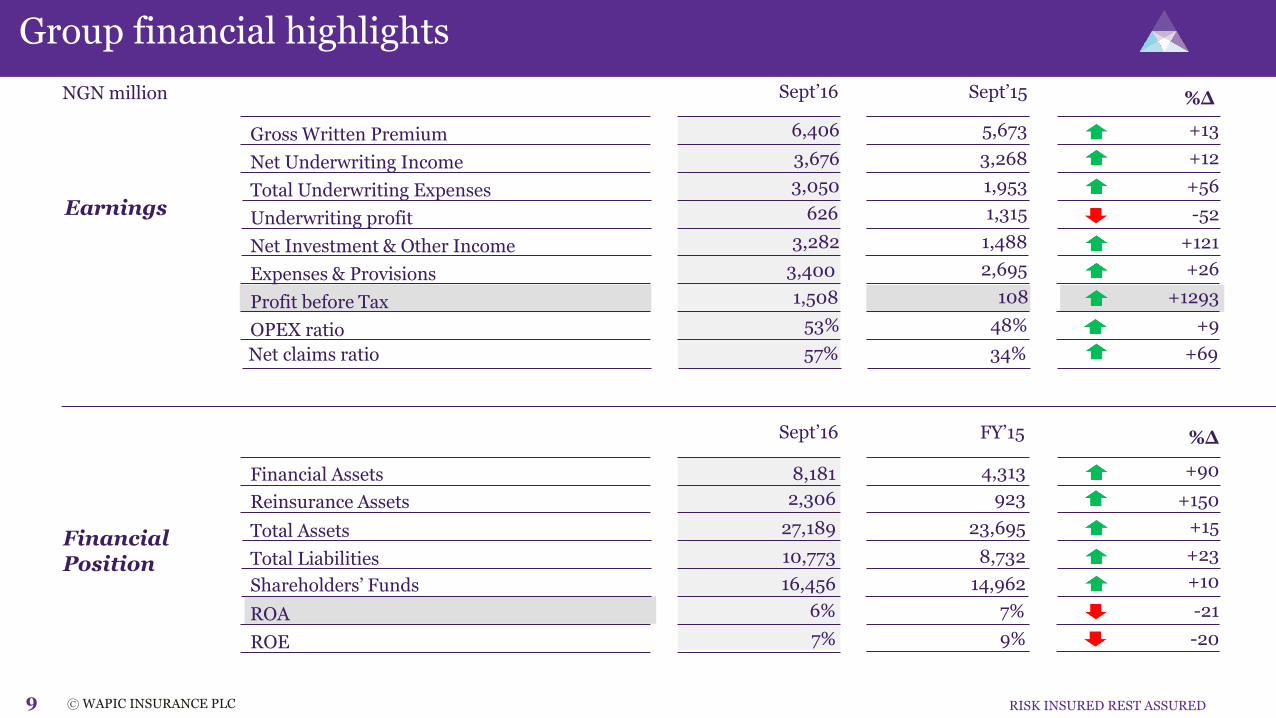
Financial Assets
Total Assets
Total Liabilities
Shareholders’ Funds
ROE
Reinsurance Assets
Sept’16 FY’15
923
4,313
23,695
8,732
14,962
7%
9%
2,306
8,181
27,189
10,773
16,456
6%
7%
+150
+90
+15
+23
+10
-21
-20
Group financial highlights
9
NGN million
© WAPIC INSURANCE PLC RISK INSURED REST ASSURED
ROA
%∆
Net Underwriting Income
Total Underwriting Expenses
Underwriting profit
Net Investment & Other Income
Expenses & Provisions
Profit before Tax
OPEX ratio
Gross Written Premium
Sept’16 Sept’15
6,406
3,676
3,050
626
3,282
1,508
53%
5,673
3,268
1,953
1,315
1,488
2,695
108
48%
+13
+12
+56
-52
+121
+26
+1293
+9
3,400
Earnings
Net claims ratio 57% 34% +69
FinancialPosition

Agenda
Financial Highlights
Income Statement Review
SOFP Review
Assets under Management

Proprietary & Confidential Strategy & PMO11 © WAPIC INSURANCE PLC RISK INSURED REST ASSURED
Income statement review
Reinsurance expenses
Net claims expenses
Underwriting expenses
Underwriting profit
Investment income
Other operating income
Operating expenses
Profit before tax
Gross Written Premium
Sept’16 Sept’15
6,406
2,281
1,848
1,202
626
1,591
1,692
3,400
1,508
5,673
1,429
994
959
1,315
1,288
183
2,695
108
+13
+60
+86
+25
-52
+24
+823
+26
1293
%∆ GWP increased by 13% YoY to N6.4bn at the end of Q3
2016 up from N5.7bn in the prior period last year.
Reinsurance expenses grew by 60% largely as a result of the growth in GWP and an increase in facultative reinsurance to balance exposure on specific risks particularly in the oil and energy portfolio.
The 86% growth in Net Claims Expenses came as a result of an increase in settled claims and growth in IBNR during the period.
Investment income grew by 24% due to an improvement in money market returns in Q3 2016.
Underwriting profit was impacted primarily by the high claims payout experience for the period from one-off incidents in Nigeria and legacy claims in Ghana.
The Group returned a PBT of N1.5bn, up from N108m in Q3’15. This represents a 1293% increase from the prior period, largely driven by returns on strategic investment and positive underwriting profit.
Highlights
NGN million

Proprietary & Confidential Strategy & PMO
1,127
1,570
1,101
1,568
446
288 105 201 (2)127
(111)
534
(50)
131
(35)
31
OIL& ENERGY
GENERALACCIDENT
LIFE MOTOR FIRE MARINE ENGINEERING AVIATION
-0.2%
8%
-10%
34%
-11%
46%
-33%
16%
Motor, 85%
Fire, -8%
General Accident,
20%
Marine, 21%
Aviation, 5%
Engineering, -6%
Oil & Energy-0.4%
Life, -18%
By products
Product performance
12 © WAPIC INSURANCE PLC RISK INSURED REST ASSURED
18%
25%
17%
24%
7%
4% 2% 3%
OIL &ENERGY
GENERALACCIDENT
LIFE MOTOR FIRE MARINE ENGINEERING AVIATION
GWP contribution By product
Underwriting profit margin
Underwriting profitby product
N’m
GWP Underwriting profit Underwriting profit ratio
Highlights
General Accident and Motor had the highest contribution to GWP with 25% and 24% respectively. This is closely followed by Oil & energy and Life.
Motor is the Group’s most profitable product with an 85% contribution to underwriting profit. Marine and General Accident also contributed 21% and 20% respectively to the underwriting profit in Q3.
The increased growth and profitability of the motor portfolio is an evidence of the company’s commitment to, and sales drive with, the MOOV product.

Proprietary & Confidential Strategy & PMO
Group expenses
Net claims exp.Net prem. income
Net claims ratio
UW exp. ratio
Underwriting exp.
Net prem. income
Net claims expenses
Net Claims Expenses grew to N1.8bn in Q3 2016; an increase of 86% YoYfrom Q3 2015. This is as a result of a one-off payment of legacy claims and an increase in IBNR resulting from the growth in GWP.
As a result of the foregoing, Net Claims Ratio increased to 57% in Q3 2016 compared with 34% in the corresponding period of 2015.
NGN million
Underwriting expenses rose by 25% from the prior period’s position to N1.2bn in Q3 2016. This is due to the growth in GWP and increased share of corporate business portfolio
Underwriting expense ratio grew to 37% in Q3 2016, a marginal increase compared with 32% in Q3 2015.
13 © WAPIC INSURANCE PLC RISK INSURED REST ASSURED
464
994
1,848 2142
2,952 3,244
SEPT'14 SEPT'15 SEPT'16
22%
34%
57%
842 959 1202
2,142
2,952 3,244
SEPT'14 SEPT'15 SEPT'16
39%32% 37%
Underwriting expenses
Proprietary & Confidential Strategy & PMO
Group expenses
Reinsurance expenses
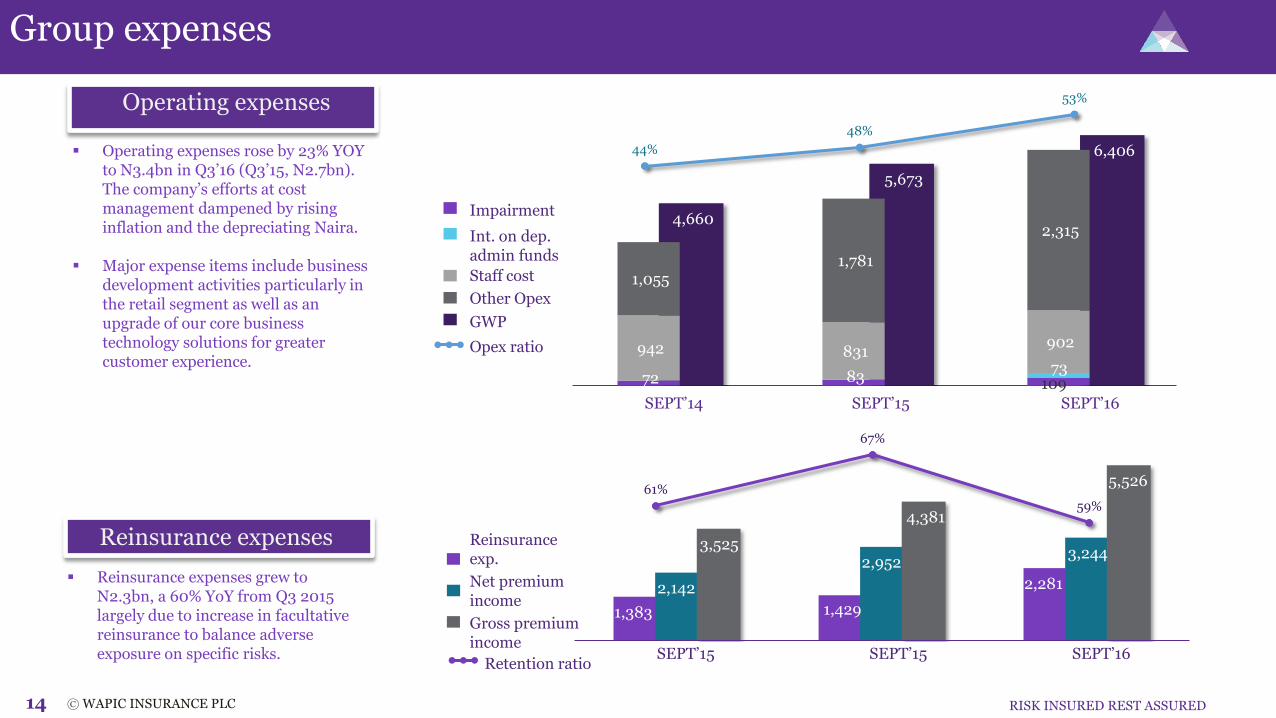
Reinsurance expenses grew to N2.3bn, a 60% YoY from Q3 2015 largely due to increase in facultative reinsurance to balance adverse exposure on specific risks.
NGN million
Operating expenses rose by 23% YOY to N3.4bn in Q3’16 (Q3’15, N2.7bn). The company’s efforts at cost management dampened by rising inflation and the depreciating Naira.
Major expense items include business development activities particularly in the retail segment as well as an upgrade of our core business technology solutions for greater customer experience.
Operating expenses
14 © WAPIC INSURANCE PLC RISK INSURED REST ASSURED
Reinsurance exp.
Net premium income
Retention ratio
Gross premium income
Opex ratio
44%
48%
53%
1,383 1,429
2,281 2,142
2,952 3,244
3,525
4,381
5,526
SEPT'14 SEPT'15 SEPT'16
61%
67%
59%
SEPT’15 SEPT’16
4,660
5,673
6,406
72 83 109 73
942 831 902
1,055 1,781
2,315
SEPT’16SEPT’15SEPT’14
SEPT’15
Impairment
Staff cost
Other Opex
GWP
Int. on dep. admin funds

Proprietary & Confidential Strategy & PMO
N’m
Revenue
The Group’s Total income grew by 35% to N10bn in Q3’16 (Q3’15, N7.5bn) Wapic Ghana grew 48% YoY in real terms and contributed 17% to the Group’s GWP. This is evidence of Wapic’s effective sales drive and increasing
share of the Ghanaian insurance market. Wapic’s Large Corporates group was the largest contributor to the Group’s GWP in Q3’16 at 41%, followed by Financial Institutions group at 30%. Wapic has repositioned its teams for improved relationship and service delivery, a restructuring that is paying off.
15 © WAPIC INSURANCE PLC RISK INSURED, REST ASSURED
6,062
7,477
10,120
SEPT' 14 SEPT'15 SEPT'16
67%
30%
1%
41%
3%
7%
17%
LargeCorporates
FinancialInstitutions
HNI
Public Sector
Retail S&D
Ghana
GWP contributionby Business Groups
Group Total Income
6,040

Proprietary & Confidential Strategy & PMO
170 108
1,508
SEPT'14 SEPT'15 SEPT'16
0.9%0.2%
7%
0.7%0.5%
6%
Group profit position
Profit before tax
N’m
16
The Group’s underwriting profit declined by 53% to N626m in Q3’16 (Q3’15, N1,315m) resulting in an underwriting profit margin of 10%, a 57% dip from the corresponding quarter of 2015. This was largely due to the increase in settled claims and IBNR during the period.
The Group recorded a PBT of N1.5bn in Q3’16 a 1293% YoY growth partly due to strong returns from strategic investments. ROA and ROE remain positive at 6% and 7% respectively for the period.
© WAPIC INSURANCE PLC RISK INSURED REST ASSURED
1,082
1,315
626
SEPT'14 SEPT'15 SEPT'16
Underwriting profit
N’m
Profit before tax ROA ROEUnderwriting Profit UWP margin
23% 23%
10%

Agenda
Financial Highlights
Income Statement Review
SOFP Review
Assets under Management

Proprietary & Confidential Strategy & PMO18 © WAPIC INSURANCE PLC RISK INSURED REST ASSURED
Statement of financial position
Financial assets
Reinsurance assets
Investment property
Investment in associate
Fixed assets and intangibles
Other receivables & Prepayment
Cash and cash equivalents
FY’15
7,054
4,313
923
675
5,244
2,410
1,224
%∆
23,695
211
2,497
152
4,677
1,196
-62
+90
+150
-62
+31
+32
+58
Other assets 1,300 +20
+10
Trade payables
Provisions & other payables
Current income tax liabilities
Insurance contract liabilities
Investment contract liabilities
Total liabilities
Equity
Total equity & liabilities
Total assets
+7
-3
+121
+44
-12
8,732
14,962
23,695
+26
+8
+15
NGN million
Cash and cash equivalents dropped by 62% compared to FY’15 largely due to a realignment of our portfolio to take advantage of higher-yielding assets.
Financial Assets recorded a 90% growth as a result of the utilisation of the prior year cash and cash equivalents as well as cash from current year operations.
The 150% growth in Reinsurance Assets is due to the growth in reinsurance expenses arising from a growth in the GWP
Other receivables and prepayments increased by 58% largely due to prepaid expenses and outstanding proceeds on investments.
Investment Property declined by 62% due a divestment from property in order to invest in higher-yielding assets.
Insurance contract liabilities increased by 44% from FY’15, following a growth in GWP during the period.
Highlights
Other Assets= Deferred acquisition cost+ Deferred Tax asset +Statutory DepositsFixed Assets & intangibles= Property, plant & equipment + Intangible Assets
Note
SEPT’16
2,676
8,181
2,306
259
6,873
3,187
1,933
27,189
227
2,410
336
6,712
1,048
1,563
10,733
16,456
27,189
Trade receivables 552 -62211

Proprietary & Confidential Strategy & PMO
NGN million
Highlights of financial position
19 © WAPIC INSURANCE PLC RISK INSURED, REST ASSURED
23,916 23,695 24,621 26,148 27,189
14,940 14,962 15,067 15,561 16,456
Sept' 15 Dec'15 Mar'16 Jun'16 Sept'16
Total Assets Shareholders funds
Total Assets &Earnings Assets
Insurance &Investment
Contract liabilities to Total Liabilities
Total Assets &Shareholders Funds
Highlights
Earnings assets to Total assets ratio dropped by 9% from the FY’15 position to 71% in Q3’16 due to increased investment in fixed assets, while the Group’s Total assets increased by 15% to N27bn for Q3’16 (FY’15, N24bn)
Insurance and Investment contract liabilities stood at N7.8bn representing a 32% growth from the FY’15 position of N5.9bn, largely due to an increased IBNR reserve for the period.
Total liabilities grew by 23% to N10.7bn in the period compared with FY’15, due to the growth in Insurance contract liabilities recorded for the period.
The Group’s Shareholders funds increased by 10% to N16.2bn in Q3’16 (FY’15, N14.9bn).
23,916 23,695 24,621 26,148 27,189
18,091 18,595 17,511 18,132 19,328
Sept' 15 Dec'15 Mar'16 Jun'16 Sept'16
Total Assets Earnings Assets
8,976 8,733 9,554
10,587 10,733
5,932 5,873 7,073
8,105 7,760
Sept' 15 Dec'15 Mar'16 Jun'16 Sept'16
Total Liabilities Ins. & Inv.Contract Liabilities

Agenda
Financial Highlights
Income Statement Review
SOFP Review
Assets Under Management

Proprietary & Confidential Strategy & PMO
10%
29%
13%4%
1%
1%
39%
3%
Term deposit
Treasury Bills
Bonds
Quoted Investments
Unquoted Investments
Investment property
Investment in associates
Statutory Deposit
35%
11%10%
4%
0.5%
4%
31%
3%
21
Outer circle: SEPT’16Inner circle: FY’15
Assets under management
Term Deposits
Treasury Bills
Bonds
Quoted Investments
Unquoted Investments
Investment Property
Investment in Associate
Statutory Deposit
5,912
1,880
1,689
668
76
675
5,244
522
SEPT’16 FY’15
1,708
5,097
2,221
778
95
259
6,873
522
NGN million
The investment portfolio composition maintains a high allocation to the fundamentally strong associate and subsidiaries as well as fixed income securities with high yield. The property portfolio reduced in line with the strategy to fully exit the underperforming legacy properties.
Treasury bills and money market deposits were rebalanced to take advantage of uptick in yields; while additional acquisition was made to position Wapic for other prospects in the associate.
A portion of the exchange gains on Available For Sale(AFS) Foreign exchange securities was realized in the period. The unrealized foreign currency assets still have significant positive exchange gains based on current valuation.
© WAPIC INSURANCE PLC RISK INSURED REST ASSURED

Proprietary & Confidential Strategy & PMO22
How we build for the future
FINANCIAL
OPERATIONAL
SALES
PEOPLE
Wapic Ghana continues to deepen its retail distribution, with significant gains in bancassurance and sales ofour innovative MOOV product, already impacting the topline.
Following the restructuring of the Sales & Distribution function, Wapic continues to drive the focus onrelationship management and excellent service delivery.
We have structured the Retail sales function to leverage relationships with the Wapic value chain, in line withrecent Regulatory guidelines on bancassurance.
We have optimized our reinsurance processes to reduce underwriting expenses. As we optimize underwritingto suit claims experience, our reinsurance expenses are expected to decline.
We are concluding the implementation of a core application to enhance service delivery and overall customerexperience. We reiterate out aim to be a leading full service insurance provider by 2019.
We shall seek to educate shareholders about the benefits of the Global Depositary Program for greatersecurity of investment funds.
Wapic continues a disciplined execution of our innovative digital strategy, driving engagement andawareness.
As a foundation to value-driven learning and development, we have restructured the organization as aholistic system; investment of resources in talent development is expected to manifest in productivity gains.
We are harnessing the culture of a leading customer experience with a series of innovative initiatives gearedto inculcate the desired behaviors.
We remain focused on a performance driven organization, with significant improvements in employeeengagement initiatives anchored by staff, for staff.
We continue to proactively drive for a solid solvency margin, ahead of an expected Regulatory change incapital adequacy rules.
We expect topline growth of 30% YoY in line with our strategic growth expectations. We shall maintain a continuous focus on cost optimization in order to meet the target cost-to-income ratio.
© WAPIC INSURANCE PLC RISK INSURED REST ASSURED

Proprietary & Confidential Strategy & PMO
The information presented herein is based on sources which Wapic Insurance Plc (The “Company”) regards dependable.
This presentation may contain forward looking statements. These statements concern or may affect future matters, such as the Company’s economic results, business plansand strategies, and are based upon the current expectations of the directors. They are subject to a number of risks and uncertainties that might cause actual results andevents to differ materially from the expectations expressed in or implied by such forward looking statements. Factors that could cause or contribute to differences incurrent expectations include, but are not limited to, regulatory developments, competitive conditions, technological developments and general economic conditions. TheCompany assumes no responsibility to update any of the forward looking statements contained in this presentation.
The information should not be interpreted as an advice to customers on the purchase or sale of specific financial instruments. Wapic Insurance Plc bears no responsibilityin any instance for loss which may result from reliance on the information.
Wapic Insurance Plc. holds copyright to the information, unless expressly indicated otherwise or this is self-evident from its nature. Written permission from WapicInsurance Plc is required to republish the information on Wapic Insurance or to distribute or copy such information. This shall apply regardless of the purpose for which itis to be republished, copied or distributed. Wapic Insurance Plc’s customers may, however, retain the information for their private use.
Transactions with financial instruments by their very nature involve high risk. Historical price changes are not necessarily an indication of future price trends. Investors areencouraged to acquire general information from Wapic Insurance Plc or other expert advisors concerning securities trading, investment issues, taxation etc in connectionwith securities transactions.
The Information contained in this presentation is subject to, and must be read in conjunction with, all other publicly available information, including, where relevant, anyfuller disclosure document published by the Company. Any person at any time acquiring the securities must do so only on the basis of such person’s own judgment as to themerits of the suitability of the securities for its purposes and only on such information as is contained in public information having taken all such professional or otheradvice as it considers necessary or appropriate in the circumstances and not in reliance on the information contained herein. The information is not tailored for anyparticular investor and does not constitute individual investment advice.
Disclaimer
© WAPIC INSURANCE PLC RISK INSURED REST ASSURED

RISK INSURED REST ASSURED
Thank you

RISK INSURED REST ASSURED
For further inquiries:
Wapic Insurance Plc.119 Awolowo Road , Ikoyi. Lagos , NigeriaM: 0700DialWapicT: 012774500 /4566 /4555http://www.wapic.com
Zina Giwa-Amu
Strategy & Investor Relations
E: [email protected]: +234 808 543 3233T: +234 1 277 4500Ext: 4900
Email: strategy&[email protected]: www.wapic.comPhone: 012774500 /4566 /4555
RISK INSURED REST ASSURED
Appendix

Proprietary & Confidential Strategy & PMO
Disclaimer
Total Assets 27,189 23,695 +15%
Total Investments 16,953 12,563 +35%
Insurance & Invt Contract Liabilities 7,760 5,873 +32%
Total equity 16,456 14,962 -10%
Solvency Margin 221% 250% %
Gross Written Premium 6,406 5,673 +13%
Gross earnings 10,120 7,460 +36%
PBT 1,508 108 +1293%
PAT 1,147 34 +3311%
Underwriting Profit Margin 10% 23%Loss Ratio 57% 34%Underwriting expense Ratio 37% 32%Combined ratio 197% 157%Cost to income ratio 68% 96%Pre - Tax Return on Average Assets 5.5% 0.5%Post- Tax Return on Average Equity 7.0% 0.2%
Share Outstanding (Mn Units) 13,383 13,383 Price (₦) 50k 50kMarket Capitalisation (N‘000) 6,691,369 6,691,369
BALANCE SHEET
EARNINGS
KEYPERFORMANCE
RATIOS
SHAREHOLDINGRATIO
SEPT’16 YE’15 9MoY
SEPT’16 SEPT’15 YoY
SEPT’16 SEPT’15
HY’16 Sept’15
Appendix: Other Financial Highlights
NGN million
RISK INSURED REST ASSURED A1 © WAPIC INSURANCE PLC

Proprietary & Confidential Strategy & PMO
Disclaimer
Gross Earnings Evolution (N’m)
Operating Expenses (N’bn)
Underwriting Performance
1,001 1,263 1,075 1,159
500 485 1,533 306
275 294 160 249
606 675 720 436
25% 19% 17% 11%
73% 32% 41% 42%
-3% 23% 21% 12%
Q2’15 Q3’15 Q4’15 Q1’16
Q2’15 Q3’15 Q4’15 Q1’16
FY’13 FY’14 FY’15 Q1’16
Underwriting Income
Non-underwriting Income
Employee Benefit Exp.
Other Operating Exp.
Underwriting Exp.
Net Claims Exp.
Underwriting Margin
Appendix: Group Operating Income Trend Analysis
© WAPIC INSURANCE PLC A2
Q2’16
Q2’16
Q2’16
1,205
1,031
277
921
28%
-6%
84%
RISK INSURED REST ASSURED
Q3’16
Q3’16
Q3’16
1,311
1,945
376
1,102
24%
46%
19%

Proprietary & Confidential Strategy & PMO
Evolution Since 1958
20111958 1997
20131978 20092000
20142007
March 14, 1958 -Incorporated as a
private limited liability Company under the name of
West Africa Provincial Insurance
Company Limited
The Company was acquired by
Intercontinental Bank Plc.
Separated the Life business and
transferred the related assets and
liabilities to Wapic Life Assurance
Limited
Became a subsidiary of Access Bank
through Access Bank’s acquisition
of Intercontinental
Bank Plc.
Launched new corporate identity
Secured AM Best Rating. Rated B-for financial stability and bb-for issuer credit
Became a Public Limited Liability Company & was
listed on the Nigerian Stock
Exchange
Secured a Life business license from NAICOM &
became a Composite Insurance business
Established Wapic Insurance Ghana
Limited to transact general
business
Access Bank divested through a share distribution scheme to comply with CBN directive
on banking reforms
© WAPIC INSURANCE PLC RISK INSURED REST ASSURED A3
2016
Moved to its iconic and
environmentally-friendly global headquarters,
symbolically built on the same site as the previous head
office
Recommended