VTT RESEA
RCH N
OTES 2273Pure torsion tests on single hollow
core slabs
ISBN 951–38–6052–3 (URL: http://www.vtt.fi/inf/pdf/)ISSN 1455–0865 (URL: http://www.vtt.fi/inf/pdf/)
ESPOO 2004 VTT RESEARCH NOTES 2273
Four tests on prestressed hollow core slab units were carried out. In thetests the slab units were subjected to pure torsion. In all tests the observedfailure mode was the same as the predicted one, i.e. cracking of top flangein angle of 45º with the longitudinal axis of the slab unit. Although thefailure mode was abrupt, the slab units showed considerable ductility afterthe failure. None of them collapsed before the test had to be interrupteddue to excessive rotation.
For 400 mm slabs the torsional stiffness observed in the tests wasclose to that predicted by elementary calculation method, but for 200mm slabs the predicted stiffness was 30 % lower than that observed. Thepredicted torsional resistance was 60% and 70% of the observedresistance for 200 mm and 400 mm slabs, respectively, when the lowercharacteristic value for the tensile strength of the concrete was used forprediction.
Matti Pajari
Pure torsion tests on single hollowcore slabs
VTT TIETOPALVELU VTT INFORMATIONSTJÄNST VTT INFORMATION SERVICEPL 2000 PB 2000 P.O.Box 2000
02044 VTT 02044 VTT FIN–02044 VTT, FinlandPuh. 020 722 4404 Tel. 020 722 4404 Phone internat. + 358 20 722 4404Faksi 020 722 4374 Fax 020 722 4374 Fax + 358 20 722 4374
P
e+∆eP
eActive end
Passive end


VTT TIEDOTTEITA � RESEARCH NOTES 2273
Pure torsion tests on single hollow core slabs
Matti Pajari VTT Building and Transport
2
ISBN 951�38�6517�7 (URL: http://www.vtt.fi/inf/pdf/) ISSN 1455�0865 (URL: http://www.vtt.fi/inf/pdf/) Copyright © VTT 2004
JULKAISIJA � UTGIVARE � PUBLISHER
VTT, Vuorimiehentie 5, PL 2000, 02044 VTT puh. vaihde (09) 4561, faksi (09) 456 4374
VTT, Bergsmansvägen 5, PB 2000, 02044 VTT tel. växel (09) 4561, fax (09) 456 4374
VTT Technical Research Centre of Finland, Vuorimiehentie 5, P.O.Box 2000, FIN�02044 VTT, Finland phone internat. + 358 9 4561, fax + 358 9 456 4374
VTT Rakennus- ja yhdyskuntatekniikka, Kemistintie 3, PL 1805, 02044 VTT puh. vaihde 020 722 111, faksi 020 722 7007
VTT Bygg och transport, Kemistvägen 3, PB 1805, 02044 VTT tel. växel 020 722 111, fax 020 722 7007
VTT Building and Transport, Kemistintie 3, P.O.Box 1805, FIN�02044 VTT, Finland phone internat. +358 20 722 111, fax +358 20 722 7007
Technical editing Leena Ukskoski

3
Pajari, Matti. Pure torsion tests on single hollow core slabs. Espoo 2004. VTT Tiedotteita � Research Notes 2273. 29 p. + app. 28 p.
Keywords shear tests, torsion tests, hollow core slabs, testing, test specimens, load testing, failure loads, concrete, precast, prestressed, structure
Abstract Four tests on prestressed hollow core slab units were carried out. The slab units, two of them 200 mm and two 400 mm in thickness, were subjected to pure torsion. In all tests the observed failure mode was the same as the predicted one, i.e. cracking of top flange in angle of 45º with the longitudinal axis of the slab unit. Although the failure mode was abrupt, the slab units showed considerable ductility after the failure. None of them collapsed before the test had to be interrupted due to excessive rotation.
For 400 mm slabs the torsional stiffness observed in the tests was close to that predicted by elementary calculation method, but for 200 mm slabs the predicted stiffness was 30% lower than that observed. The predicted torsional resistance was 60% and 70% of the observed resistance for 200 mm and 400 mm slabs, respectively, when the lower characteristic value for the tensile strength of the concrete was used for prediction.

4
Preface In 2002�2004, a European research project named HOLCOTORS was carried out. It aimed at providing numerical methods for analysis and simplified methods for design of prestressed hollow core floors subjected to shear and torsion. The calculation models were developed by Chalmers University of Technology, Sweden. The tests used for verification of the models were carried out and documented by VTT, Finland. The researchers in the involved research institutes were
Helen Broo Chalmers Björn Engström Chalmers Karin Lundgren Chalmers Matti Pajari VTT Mario Plos Chalmers.
In addition to the researchers, the following representatives of the industrial partners participated in the work as members of the steering group and by participating in the workshops organised on the day before the steering group meetings:
Olli Korander Consolis Technology, Finland, Chairman Arnold van Acker Belgium Willem Bekker Echo, Belgium David Fernandez-Ordonez Castelo, Spain Ronald Klein-Holte BVSH (VBI) The Netherlands Gösta Lindström Strängbetong, Sweden Aad van Paassen BVSH (VBI), The Netherlands Nordy Robbens Echo, Belgium Bart Thijs Echo, Belgium Jan de Wit IPHA (Dycore), The Netherlands Javier Zubia Castelo, Spain.
Gösta Lindström also worked in close co-operation with the researchers, participated in extra workshops between the steering group meetings and made proposals for the future design practice.
The experimental part of the research project, a part of which is documented in this report, was financed by the Fifth Framework Programme of European Commission (Competitive and Sustainable Growth, Contract Nº G6RD-CT-2001-00641); Inter-national Prestressed Hollow Core Association, Bundesverband Spannbeton-Hohlplatten, Castelo, Consolis, Echo, Strängbetong, and VTT. The test specimens were provided by Parma Betonila, Finland.

5
Contents
Abstract..............................................................................................................................3
Preface ...............................................................................................................................4
1. Introduction..................................................................................................................6
2. Test arrangements ........................................................................................................7
3. Loading strategy.........................................................................................................13
4. Test results .................................................................................................................14 4.1 Failure mode and torque vs. rotation relationship ............................................14 4.2 Data about concrete ..........................................................................................20
5. Analysis of results......................................................................................................23
6. Discussion..................................................................................................................28
References .......................................................................................................................29
Appendices A Photographs
B Measured geometry of slabs
C Effect of transverse motion at active end on torque
D Rate of elongation of actuator at active end

6
1. Introduction
The tests documented in this report were planned to represent pure torsion without bending moment, shear force or contribution from neighbouring slab units. The results will mainly be used for calibration of numerical calculation methods. They also give a lower limit for the maximum angle of twist and torque when an isolated slab unit is twisted. This limit is, however, very conservative due to the test arrangements: the cantilevered slab ends and lack of imposed load on the slab increase the tensile stresses in the critical top flange of the slab element, which results in a failure in the top flange. This is not typical of ordinary load cases in which the imposed load on the slab unit reduces the tensile stresses in the top flange and the failure may take place in the webs at a greater torque.
In all figures of this report, the measures are given in millimetres unless otherwise specified.

7
2. Test arrangements
Four tests on single slab units were carried out in June 2002. Some characteristics of the test specimens are given in Table 1.
Table 1. Characteristics of test specimens.
Test Thickness mm
Strands Initial prestress MPa
Length m
Cast
Loaded
PT200A 200 7 d 12.5 900 5.0 23.5. 12.6. PT200B 200 7 d 12.5 900 5.0 23.5. 17.6. PT400A 400 7 d 12.5 1000 7.0 24.5. 17.6. PT400B 400 7 d 12.5 1000 7.0 24.5. 18.6.
The nominal cross-section of the slabs is given in Figs 1 and 2 and the measured geometry in Appendix B. For the shape of the hollow cores see also Fig. 21.
102 131 187.6 187.6 187.6 187.6 187.6 1311416
1871
3843
102.5
97.5
1200
9
c=3052 172.8 187.6 187.6 187.6 187.6 172.8 52
Chamfer 10x10
155
25
20
Fig. 1. Nominal cross-section and location of strands in test specimens PT200A and PT200B. c refers to concrete cover below the strand.

8
109 114 228
175.5 283 283 283 175.56
18
405
605
3
619
Chamfer 12x12
1200
36
44
55400
245.5 50
c=30
46.5 258 258 50 245.5 46.5
Fig. 2. Nominal cross-section and location of strands in test specimens PT400A and PT400B. c refers to concrete cover below the strand.
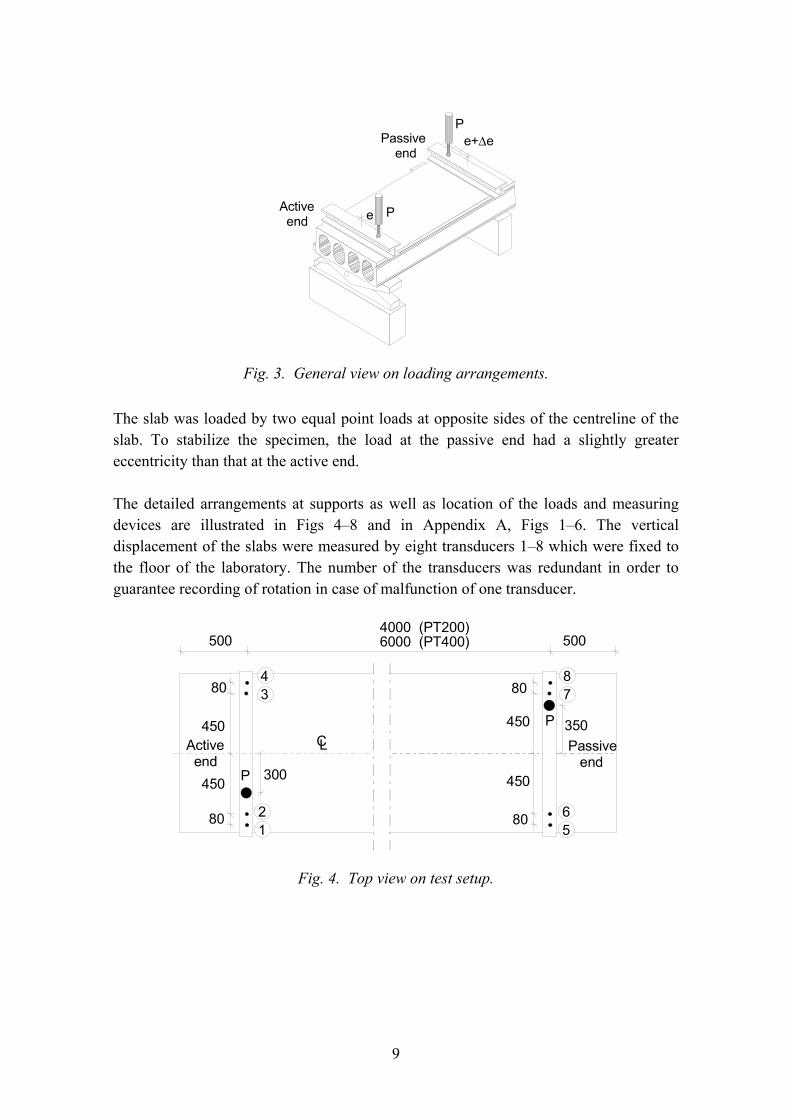
The support conditions and loading arrangements are roughly presented in Fig. 3 and in more detail in Figs 4�9. The active end of the slab was free to rotate around an axis parallel to the longitudinal axis of the slab when the slab was in its initial position. Since this rotation axis was located lower than the centroid of the slab cross-section, the rotation was accompanied by longitudinal and lateral displacements of the same order as the vertical displacement. In other words, in addition to the deformation, the slab was subjected to a rigid body motion. Special attention was paid to allow such a motion without additional restraining forces.
At the passive end the support was able to move longitudinally. Thanks to the separate rollers, see Figs 3 and 4 in Appendix A, the passive support was also free to rotate around a vertical axis until an angle of 50 mm / 1200 mm. At the active end the restraints against rotation around a vertical axis (more exactly, axis perpendicular to the steel support) were eliminated by teflon sheets between the steel support and the neoprene strip supporting the slab end, see Figs 8�10 and Appendix A, Fig. 2. Two steel studs welded to the steel support prevented the centroid of the teflon and neoprene strip, and hence also the centroid of the slab end, from sliding relative to the centroid of the support.
9
P
e+∆eP
eActive end
Passive end
Fig. 3. General view on loading arrangements.
The slab was loaded by two equal point loads at opposite sides of the centreline of the slab. To stabilize the specimen, the load at the passive end had a slightly greater eccentricity than that at the active end.
The detailed arrangements at supports as well as location of the loads and measuring devices are illustrated in Figs 4�8 and in Appendix A, Figs 1�6. The vertical displacement of the slabs were measured by eight transducers 1�8 which were fixed to the floor of the laboratory. The number of the transducers was redundant in order to guarantee recording of rotation in case of malfunction of one transducer.
300P
34
80
450
450
80
CL350450
80
80
450
P
78
56
12
500500
Active end
Passive end
6000 (PT400) 4000 (PT200)
Fig. 4. Top view on test setup.

10
Axis
50 50
Gypsum
Spreader beam
Separaterollers
50 50
Neoprene 10x100
Gypsum
Axis
A A
a)
Det B
Axis
b)
5004000 (PT200A and PT200B)
500
Spreader beam
B C
CB
6000 (PT400A and PT400B)
Fig. 5. Side view on test setup. For det B see Fig. 10.
20
10
20
160
200
Fig. 6. Cross-section of spreader beam made of steel.

11
1234 P300 A
A
8045045080
Axis 190
B B
Fig. 7. Active end.
5
67
8 350 A
A
8045045080
Separate rollers
P
C C
Fig. 8. Passive end.

12
60 60100
490Neoprene 10 mm
TeflonSteelplate
Steel dowelsin holes
Steel dowels, welded to steel plate,in holes 40x60 cut into neoprene and teflon
Fig. 9. Support at active end.
Slab
Steel support
Neoprene 10x100x1200Teflon sheetSteel plateSteel dowel 8x40x60
welded to steel plate
Hole in neoprene andteflon, 40x60
Det B
Fig. 10. Detail of support at active end.

13
3. Loading strategy
The tests were carried out under displacement control. The aimed stages were as follows.
1. Unlock the wedges at the active end, see wedges locked and unlocked in Figs 2 and 6 in App. A, respectively. Zero balance the transducers.
2. Increase the loads until half of the estimated maximum load.
3. Reduce the loads close to zero.
4. After 3 load cycles of the type described in steps 2 and 3 increase the deformation until failure and beyond it as far as possible.
The elongation of the actuator at the active end was used to control the displacements. Attempts were made to keep the rate of elongation piecewise as constant as possible. The actual loading history is illustrated in App. D.
14
4. Test results 4.1 Failure mode and torque vs. rotation relationship
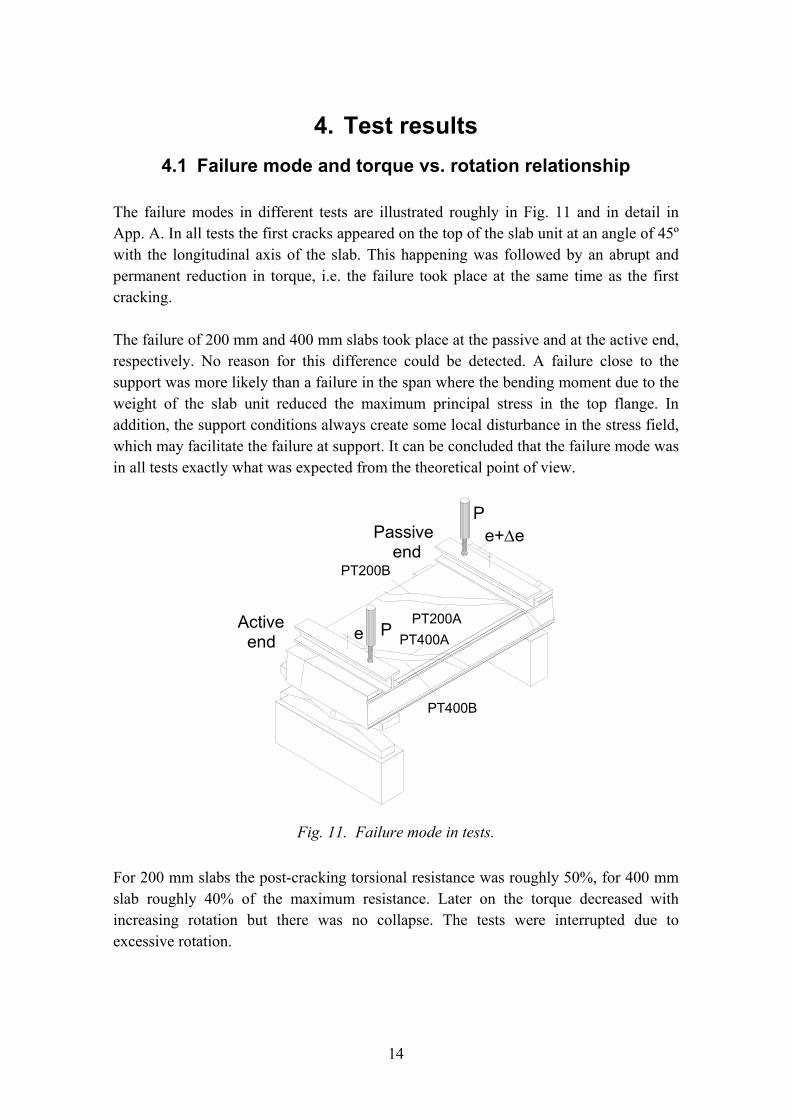
The failure modes in different tests are illustrated roughly in Fig. 11 and in detail in App. A. In all tests the first cracks appeared on the top of the slab unit at an angle of 45º with the longitudinal axis of the slab. This happening was followed by an abrupt and permanent reduction in torque, i.e. the failure took place at the same time as the first cracking.
The failure of 200 mm and 400 mm slabs took place at the passive and at the active end, respectively. No reason for this difference could be detected. A failure close to the support was more likely than a failure in the span where the bending moment due to the weight of the slab unit reduced the maximum principal stress in the top flange. In addition, the support conditions always create some local disturbance in the stress field, which may facilitate the failure at support. It can be concluded that the failure mode was in all tests exactly what was expected from the theoretical point of view.
P
Active end
Passive end
PT200B
PT200APT400A
PT400B
Pe
e+∆e
Fig. 11. Failure mode in tests.
For 200 mm slabs the post-cracking torsional resistance was roughly 50%, for 400 mm slab roughly 40% of the maximum resistance. Later on the torque decreased with increasing rotation but there was no collapse. The tests were interrupted due to excessive rotation.

15
The ductility observed in the tests can be attributed to the prestressed bottom layer of the slab units. In a floor comprising several slab units this means that after the first cracking a slab unit can still participate in the the load-carrying mechanism.
Figs 11�19 illustrate the torque vs. rotation relationship observed in the tests. The torque means the real torque calculated taking into account the displacement of the loaded point at the active end and effect of this displacement on the eccentricity of the couple at the active end as explained in App. C. The rotation means the net rotation (angle of twist) between the line supports, i.e. the rotation measured at the active end minus the rotation measured at the passsive end. It is calculated from expression
mm 1060
8541 wwww +−−=φ (1)
where wi is the vertical displacement measured by transducer i, see Fig. 4.
The measured net rotation defined as above represents the angle of twist. After cracking, it reflects the differential rotation of the two separate pieces of slab unit, i.e. it represents rather relative rigid body motion rather than deformation in the slab unit.
Figs 12�14 represent the cyclic loading phase. During the first test PT200A, at the beginning of stage 2, the load increased uncontrolled until 100 kN. To have a better control, an additional valve was installed in the hydraulic circuit and the active end was unlocked only after a small increase of load. Thanks to these arrangements, no problems in the later tests occurred in the automatic control. However, there were problems of other type during test PT200B. The hydraulic pump could not maintain the aimed pressure after the cyclic stage. Due to this, there was an unintended unloading and reloading stage after the intended cyclic stage but before cracking. This can clearly be seen in Fig. 13.

16
PT200A
0
5
10
15
20
25
30
35
40
0.0 0.2 0.4 0.6 0.8 1.0 1.2 1.4
Mt [kNm]
Rotation/ (1m) [mrad]
Fig. 12. PT200A. Interdependence of torque and relative angle of twist until cracking.
PT200B
0
5
10
15
20
25
30
35
40
0.0 0.2 0.4 0.6 0.8 1.0 1.2 1.4
Mt [kNm]
Rotation/ (1m) [mrad]
Fig. 13. PT200B. Interdependence of torque and relative angle of twist until cracking.

17
0
5
10
15
20
25
30
35
0.00 0.05 0.10 0.15 0.20 0.25
PT400APT400B
Mt [kNm]
Rotation/ (1m) [mrad]
Fig. 14. PT400A and PT400B. Interdependence of torque and relative angle of twist until cracking.
In Figs 15 and 17 the whole torque vs. rotation relationship is illustrated and in Figs 16 and 18 the initial part of these curves. The curves in Figs 15�18 indicate the difficulty involved even in a displacement controlled load test when the concrete cracks. The event is too rapid to be recorded properly.

18
0
5
10
15
20
25
30
35
40
45
0 10 20 30 40 50 60 70 80
PT200APT200B
Mt [kNm]
Rotation [mrad]
Fig. 15. Interdependence of torque and angle of twist for 200 mm slabs.
0
5
10
15
20
25
30
35
40
45
0 1 2 3 4 5 6 7 8 9 10 11 12
Rotation [mrad]
Mt [
kNm
]
PT200APT200B
Fig. 16. Initial part of curves shown in previous figure.

19
0102030405060708090
100
0 5 10 15 20 25 30 35 40 45 50 55
Rotation [mrad]
Mt [
kNm
]
PT400APT400B
Fig. 17. Interdependence of torque and angle of twist for 400 mm slabs.
0102030405060708090
100
0 2 4 6 8 10 12 14 16 18 20 22 24 26
PT400APT400B
Mt [kNm]
Rotation [mrad]
Fig. 18. Initial part of curves shown in previous figure.
In Fig. 19 the relative angle of twist is illustrated for all test specimens in the uncracked state. The slope of the curves gives the torsional stiffness of the slab unit.

20
0102030405060708090
100
0.0 0.2 0.4 0.6 0.8 1.0 1.2 1.4
PT400APT400BPT200APT200B
Mt [kNm]
Rotation/ (1m) [mrad]
PT400
PT200
Fig. 19. Comparison of torsional stiffness of 200 and 400 mm slab units.
4.2 Data about concrete
The strength of the concrete was measured from drilled cores which were still wet due to the drilling and sawing when tested. For all slab units the measured strength was typical of normal production.
Table 2. Strength and density of 50 mm cores drilled from slab unit PT200A and tested on 13th of June 2002.
Specimen Strength MPa
Density kg/m3
PT21 66.5 2450 PT22 66.0 2490 PT23 67.0 2460 PT24 69.0 2450 PT25 59.5 2460 PT26 64.5 2440
Mean x 65.4 2458 Standard deviation s 3.2 17
Characteristic strength fck,C50 = x�1.65s
60.1

21
Table 3. Strength and density of 50 mm cores drilled from slab unit PT200B and tested on 19th of June 2002.
Specimen Strength MPa
Density kg/m3
P27 62.0 2510 P28 73.0 2510 P29 66.0 2520 P30 69.0 2480 P31 62.5 2490 P32 74.5 2510
Mean x 67.8 2500 Standard deviation s 5.3 15
Characteristic strength fck,C50 = x�1.65s
59.2
Table 4. Strength and density of 50 mm cores drilled from slab unit PT400A and tested on 19th of June 2002.
Specimen Strength MPa
Density kg/m3
P41 70.5 2490 P42 61.5 2490 P43 70.0 2510 P44 67.0 2500 P45 67.5 2510 P46 68.5 2500
Mean x 67.5 2492 Standard deviation s 3.2 26
Characteristic strength fck,C50 = x�1.65s
62.2
In Table 5, data of the concrete mix, given by the manufacturer of the slabs, are given.

22
Table 5. Data about concrete mix.
Slab P20 P40 Concrete K60 K60 Cement CEM I 52,5R CEM I 52,5R Number of aggregates 3 4 Maximum aggregate size # 12 mm # 16 mm Water content 130 l/m3 145 l/m3
23
5. Analysis of results
It is assumed that the strength measured from 50 mm drilled cores gives directly the cubic strength measured from 150 mm cubes and that the cylinder strength is equal to 85% of the cubic strength. In this way, the lower characteristic cylinder strength fck,C150 (150 x 300 cylinders) given in Table 6 is obtained. From this, the mean tensile strength
3/2150,30.0 Cckctm ff = (2)
and the lower characteristic tensile strength
ctmctk ff 70.0= (3)
are obtained according to Eurocode 2 [2] or CEB�FIP Model Code 1990 [1]. The elasticity modulus of concrete is calculated according to Model Code [1] from
( )3/1
1085.2185.0 ⎟
⎠⎞
⎜⎝⎛ +⋅⋅=
MPaMPafGPaE ck
c (4)
where the factor 0.85 takes into account the difference between initial and effective elasticity modulus. For the strands, elasticity modulus Ep = 195 GPa is used.
Table 6. Strength measured from 50 mm cores fc,C50, corresponding cylinder strength fc,C150, mean tensile strength fctm, characteristic tensile strength fctk and elasticity modulus Ec.
fc,C50
MPa
fc,C150
MPa
fctm
MPa
fctk
MPa Ec
GPa
PT200A 60.1 51.1 4.15 2.91 33.0 PT200B 59.2 50.3 4.11 2.88 32.9 PT400A 62.2 52.9 4.25 2.97 33.4 PT400B 62.2 52.9 4.25 2.97 33.4
The interdependence of the torque Mt and relative angle of twist Θ is given by
ΘGIM tt = (5)
where G = 0.5E/(1+ν) and It denote the shear modulus and torsion modulus, respectively, and ν = 0.15 denotes Poisson's ratio. Θ is defined by

24
dxdΘ φ
= (6)
where φ denotes the angle of twist and x is the coordinate measured along the axis of the twisted member. In the present tests
LΘ φ= (7)
can be written where L is the span of the slab unit and φ the rotation of the active end with respect to the passive end. For a hollow core cross-section, replacing the cross-section with a tubular one as shown in Fig. 20, It can be calculated from
( ) ( )
22
2121
21
22212
tthtbttbthttI t −−+
−−= (8)
b
ht t
1 2t 2t1
a b
b
Fig. 20. Transforming a hollow core cross-section (a) into a tubular cross-section (b).
The maximum shear stress τt,max due to Mt can be evaluated using
t
tt W
M=max,τ (9)
where the section modulus in torsion for the web can be calculated from
( )( )1211 2 tbthtWt −−= (10)
and that for the top flange from
( )( )1222 2 tbthtWt −−= (11)
Table 7 gives both the geometry of the tubular slab cross-section without inner webs and the resulting geometric moduli. The width and depth of the cross-section are

25
nominal values. The thickness of flanges and outer webs are means of measured values. To simplify the calculations, the thickness of the top flange is also used for the bottom flange. The error due to this is small because the measured thicknesses were close to each other.
Table 7. Geometry and torsional characteristics of tubular cross-section. Width b and depth h of whole section, thickness of web t1, bottom flange t2,bot and top flange t2,top, torsion modulus It as well as section moduli in torsion Wt1 (web) and Wt2 (top flange).
b
mm
h
mm
t1
mm
t2,bot
mm
t2,top
mm
It
mm4
Wt1
mm3
Wt2
mm3
PT200A 1160 200 27.5 23.1 23.8 1.48E+09 1.10E+07 9.50E+06 PT200B 1160 200 28.5 24.0 23.9 1.48E+09 1.14E+07 9.52E+06 PT400A 1160 400 51.3 38.0 39.0 9.03E+09 4.11E+07 3.12E+07 PT400B 1160 400 54.0 39.4 41.0 9.38E+09 4.29E+07 3.26E+07
1160
4444
165
62
400
e
114109
p3664
7615
120120 120120
40 69 52 62
64
36
525262228
762
194
55
ep
155
25
20
1160
200
Figure 21. Geometry used for stress analysis in longitudinal and vertical direction.
Table 8 gives the cross-sectional characteristics of the hollow core slabs specified in Fig. 21. The measured average web width bw and the first moment of area S are also given, even though they are not needed when analysing the normal stresses in the top flange.

26
Using the data from Tables 7 and 8 and assuming the loss of prestress equal to 50 MPa, the predicted results given in Table 9 are obtained. The torsional stiffness is calculated using only the monotonous1 loading stage starting after the last unloading in the cyclic stage and ending at the last step before cracking. Cracking of the top flange above the support is the critical failure mode. The results given in Table 10 are calculated assuming the loss of prestress equal to 100 MPa. Based on Tables 9 and 10 it can be concluded that the results are not sensitive to the exact estimation of the losses of prestress.
Table 8. Distance from centroid of strands to the bottom fibre ep, distance from centroidal axis to bottom fibre e, sum of web widths bw, cross-sectional area A, second moment of area I and first moment of area S.
ep
mm
e
mm
bw
mm
A
mm2
I
mm4
S
mm3
PT200A 38.1 96.1 223 122000 6.13.108 4.02.106 *) PT200B 38.5 96.1 227 122000 6.13.108 4.02.106 *) PT400A 36.6 206.3 276 210800 4.43.109 1.41.107 PT400B 34.6 206.3 285 210800 4.43.109 1.41.107
*) First moment of area above the thinnest part of the web
Table 9. Comparison of predicted and observed torsional stiffness GIt and resistance against torque Mt, when loss of prestress is = 50 MPa. φobs is the last observed angle of twist between supports before cracking.
Mt,obs
kNm
φobs
mrad
Mt,pre
1)
kNm
Mt,pre
2)
kNm
GIt,obs
MNm2obst
pret
GIGI
,
,
obst
pret
MM
,
,1)
obst
pret
MM
,
,2)
PT200A 37.45 4.86 34.9 22.9 32.91 0.64 0.93 0.61 PT200B 39.38 5.35 34.8 22.9 30.02 0.71 0.88 0.58 PT400A 92.96 4.17 103.6 61.74 133.1 0.98 1.11 0.66 PT400B 87.38 3.92 106.9 63.05 134.7 1.01 1.22 0.72
1) Calculated using mean tensile strength fctm
2) Calculated using lower characteristic tensile strength fctk
1 In test PT200B this stage was not monotonous

27
Table 10. Comparison of predicted and observed resistance against torque Mt, when loss of prestress is = 100 MPa. The symbols have the same meaning as in Table 9.
Mt,pre
1)
kNm
Mt,pre
2)
kNm obst
pret
MM
,
,1)
obst
pret
MM
,
,2)
PT200A 34.9 22.9 0,94 0,62 PT200B 34.8 22.9 0,89 0,59 PT400A 103.6 61.74 1,13 0,68 PT400B 106.9 63.05 1,24 0,74
1) Calculated using mean tensile strength fctm 2) Calculated using lower characteristic tensile strength fctk
Comparison with the observed values shows that the torsional stiffness of the 400 mm slabs is accurately predicted by the simple calculation method, but that of the 200 mm slabs is underestimated by 30%. This difference cannot be eliminated by changing the value of elasticity modulus in calculations. Numerical analysis is needed to clarify the reasons for such a big difference.
The resistance, calculated using the mean tensile strength, is higher than the observed one for 400 mm slabs, but lower than the observed resistance for the 200 mm slabs. Using the characteristic tensile strength instead of the mean tensile strength reduces the predicted values so much that the ratio of predicted to observed resistance becomes roughly 70% and 60% for 400 mm and 200 mm slabs, respectively.

28
6. Discussion
When the slab units are cut by sawing, the concrete has not reached its final strength. The mechanical actions of the high speed saw may locally cause longitudinal cracks of the type shown in Fig. 22. Such cracks, due to sawing or other reasons, may sometimes be very long. In the present slab units no visible, longitudinal cracks were observed in the top flange before the test but some local damage may have existed.
Direction of sawingPossible crack
Fig. 22. Crack caused by sawing.
Thanks to the test arrangements, the tensile stresses in the concrete above each hollow core were almost uniformly distributed in the longitudinal direction. An increasing and uniformly distributed tensile stress tends to seek the weakest point of the concrete. For this reason the lower characteristic value of the tensile strength is a good starting point for calculation of torsional resistance and for comparison of calculated and observed resistance in the present tests. When this is done, see the last column in Table 9, the results suggest that the lower characteristic value or an even more conservative value for the resistance can be obtained by applying elementary calculation methods.
One might expect, that a fairly conservative approximation for the torsional stiffness is obtained by omitting the inner parts of the slab cross-section and calculating the torsional stiffness as for a tubular cross-section with thickness equal to the minimum thickness of the top flange or minimum thickness of the outer webs. This is, indeed, the case for 200 mm slabs, for which the calculated stiffness was roughly 70% of the observed stiffnes. For 400 mm slabs the calculated and observed stiffness were equal. This is difficult to explain. Further numerical research is needed.

29
References 1. CEB-FIP Model Code 1990. Comité Euro-International du Béton. Thomas Telford,
London 1993. ISBN: 0 7277 1696 4.
2. EN 1992-1-1. Eurocode 2: Design of concrete structures � Part 1: General rules and rules for buildings. 2004.


A1
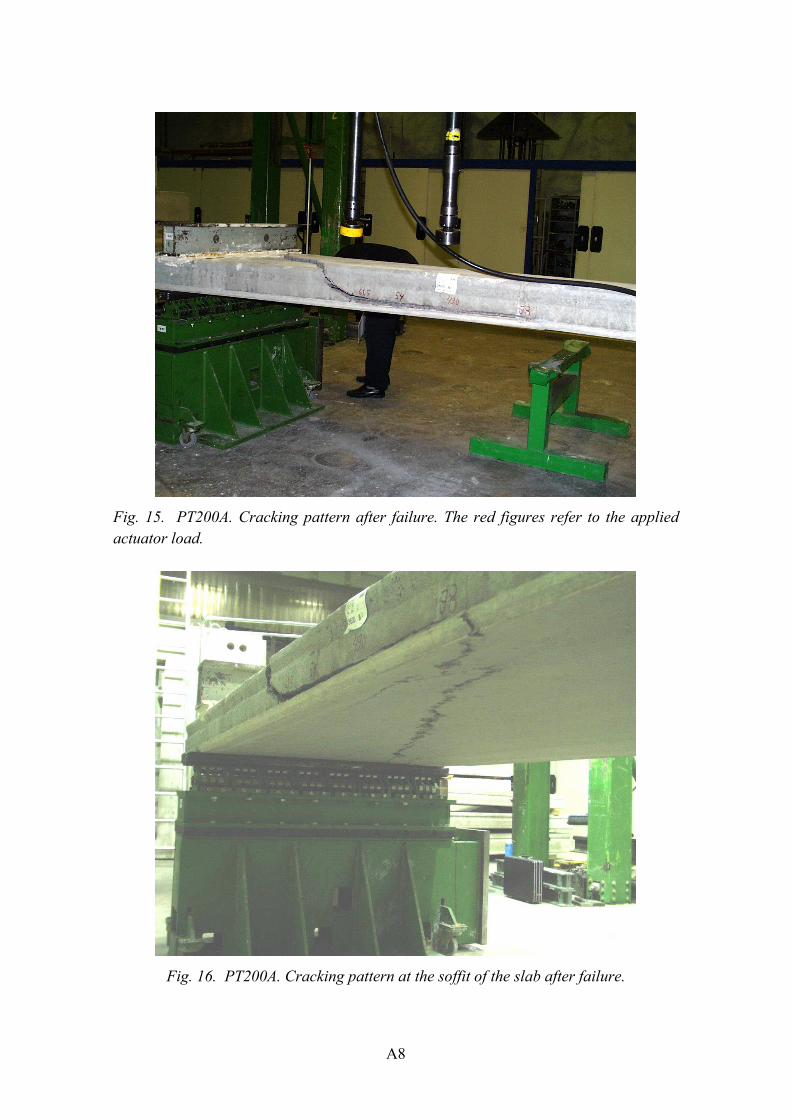
Appendix A: Photographs The red numbers on the surface of the slabs refer to the actuator load. They tell the load at which the crack formed.
Fig. 1. PT200A. Completing test arrangements.
Fig. 2. PT200A. Detail of support at active end before the test. Rotation of active end prevented by an adjustable wedge on the right.

A2
Fig. 3. PT200A. Support at passive end.
Fig. 4. PT200A. Support at passive end. Side view.
A3
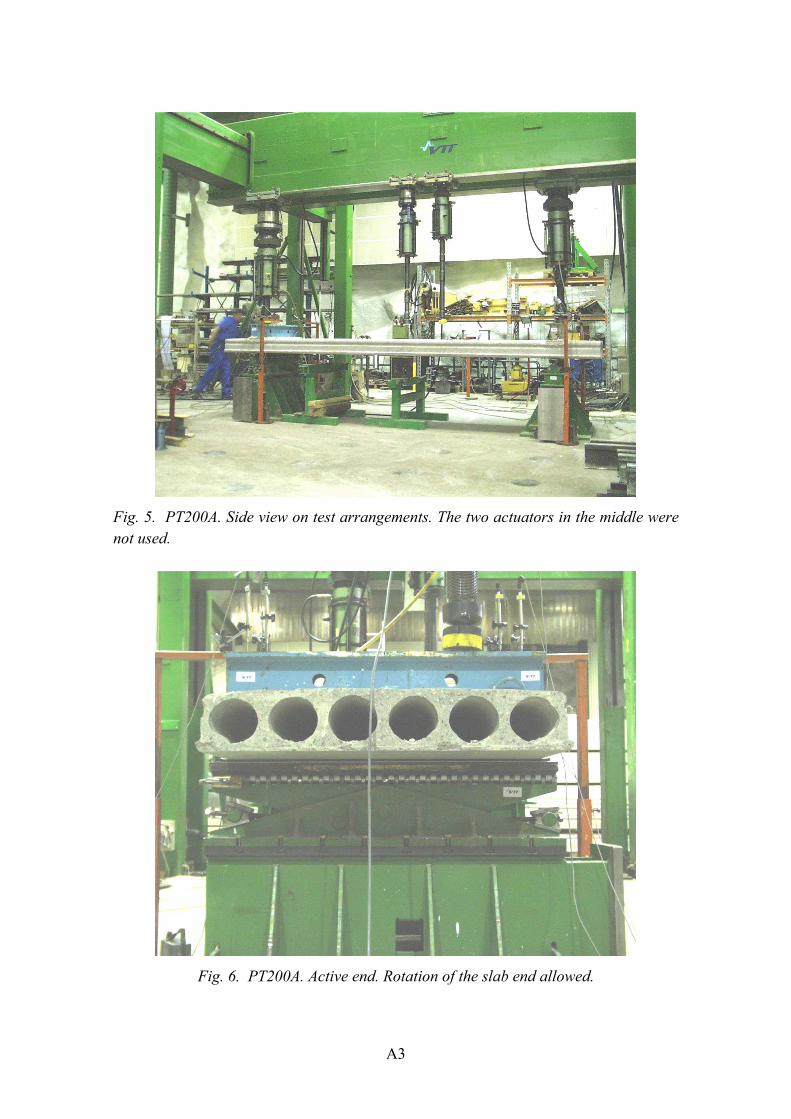
Fig. 5. PT200A. Side view on test arrangements. The two actuators in the middle were not used.
Fig. 6. PT200A. Active end. Rotation of the slab end allowed.

A4
Fig. 7. PT200A. Passive end after first cracks had appeared.
Fig. 8. PT200A. Active end before failure.

A5
Fig. 9. PT200A. Detail of crack after failure.
Fig. 10. PT200A. Side view after failure.

A6
Fig. 11. PT200A. Side view after failure.
Fig. 12. PT200A. Secondary cracking of the edge opposite to the primary cracking. The red figures refer to the applied actuator load.

A7
Fig. 13. PT200A. Cracks on the top of the slab after failure.
Fig. 14. PT200A. Cracking pattern at the cantilevered passive end after failure.
A8
Fig. 15. PT200A. Cracking pattern after failure. The red figures refer to the applied actuator load.
Fig. 16. PT200A. Cracking pattern at the soffit of the slab after failure.

A9
Fig. 17. PT200B. Cracking pattern at passive end.
Fig. 18. PT200B. Cracking of cantilevered passive end.

A10
Fig. 19. PT200B. Cracking below the spreader beam at passive end.
Fig. 20. PT200B. Cracking pattern after failure.

A11
Fig. 21. PT200B. Cracking pattern after failure.
Fig. 22. PT200B. Cracking pattern after removal of loads and loading equipment.

A12
Fig. 23. PT200B. Crackingpattern after removal of loads and loading equipment.
Fig. 24. PT200B. Cracks on the top surface after removal of loads and loading equipment.

A13
Fig. 25. PT400A. General view on the test layout.
Fig. 26. PT400A. Cracking pattern at the active end.
A14
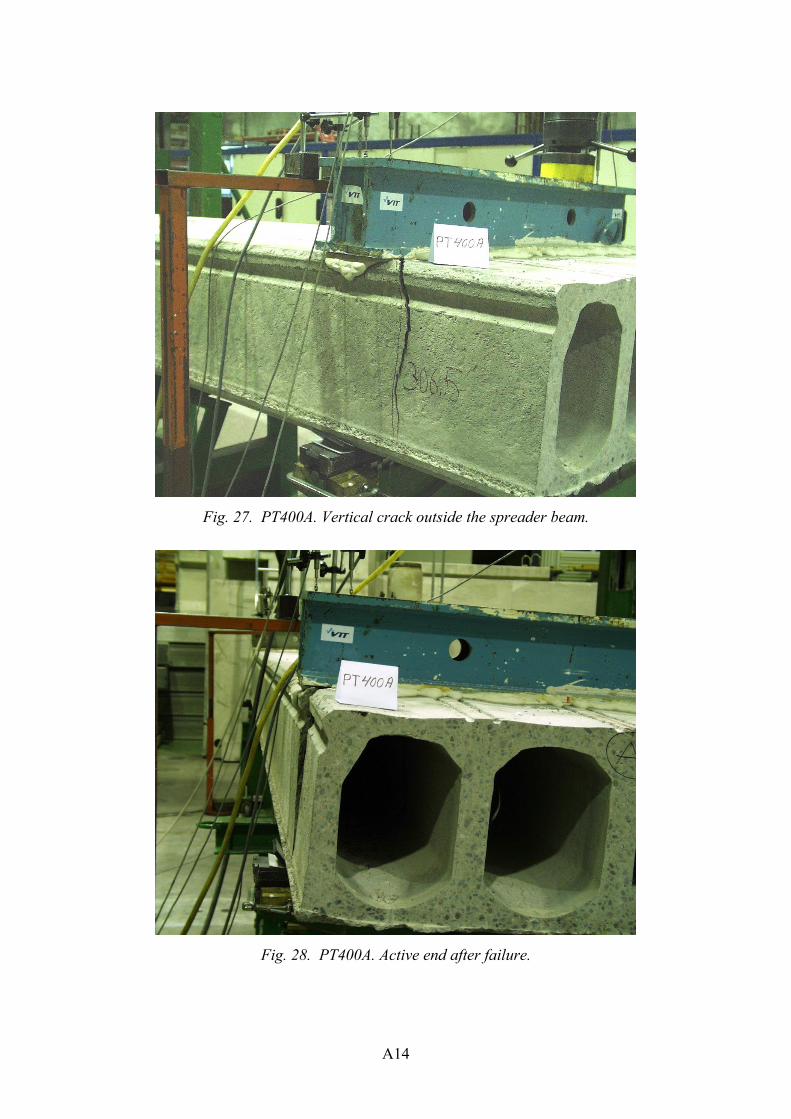
Fig. 27. PT400A. Vertical crack outside the spreader beam.
Fig. 28. PT400A. Active end after failure.

A15
Fig. 29. PT400A. Rotation of active end after failure.
Fig. 30. PT400A. Cracking pattern after failure.

A16
Fig. 31. PT400A. Cracking pattern on the top of the slab.
Fig. 32. PT400A. Cracking pattern at the soffit of the slab.

A17
Fig. 33. PT400B. Cracking pattern at the active end.
Fig. 34. PT400B. Cracking of the cantilevered end.
A18
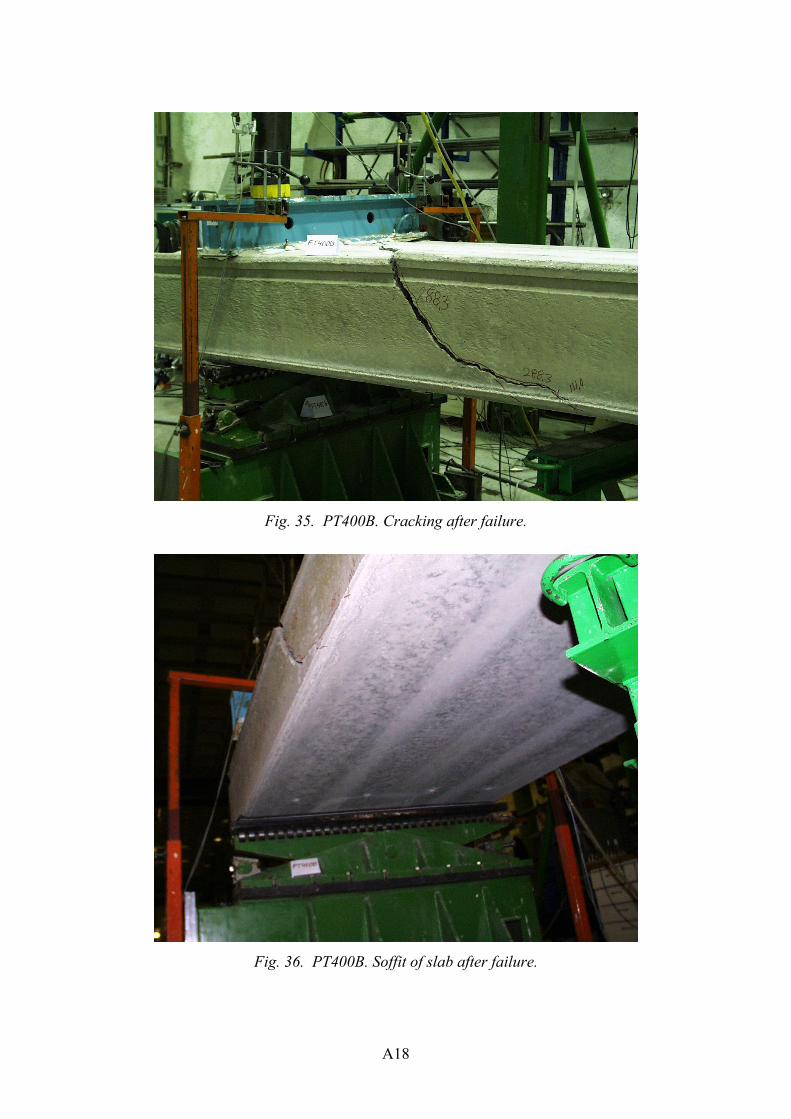
Fig. 35. PT400B. Cracking after failure.
Fig. 36. PT400B. Soffit of slab after failure.

A19
Fig. 37. PT400B. Detail of soffit after failure
Fig. 38. PT400B. Top surface after failure.


B1
Appendix B: Measured geometry of slabs
In the following figures prestress refers to the nominal prestress in the strands after pretensioning (initial prestress). The underlined values refer to initial slippage of the strands. The strands are made of seven non-indented (smooth) wires. The cross-sectional area of a strand is 93 mm2 and nominal strength 1640 MPa / 1860 MPa (0.2% yield strength / ultimate strength). All data concerning the strands except their location and slippage have been provided by Parma Betonila Oy, Nastola factory, the producer of the slabs.
End 1 was in all test the active end.
END 2 / EDGE 1 END 2 / EDGE 2
END 1 / EDGE 1 END 1 / EDGE 2
PT200ALower strands : 7 φ 12.5, prestress = 900 MPa Length : 5010 mm
Mass : 1440 kg
1155
187 15528 148
25 23
194
58 231 602 787
1.0 0.6
38 35
1145
34
0.5
45
0.7
4236
0.7 1.0
38 37
(1161 at mid-depth)
0.7
22
22
24
24
24
25
25
28
24 25
155153 142143149145155156
141156
198
419 974
1196
35 35 34 33 27
1155
192 15527 154
23 20
194
57 231 600 788
1.1 0.3
37 35
1146
32
0.4
42
0.9
4235
0.5 0.5
36 35
(1158 at mid-depth)
0.4
21
21
23
21
24
24
23
23
25 26
156156 148148150152155155
150157
200
419 975
1196
35 35 33 30 28
Fig. 1. PT200A.

B2
END 2 / EDGE 1 END 2 / EDGE 2
END 1 / EDGE 1 END 1 / EDGE 2
PT200BLower strands : 7 φ 12.5, prestress = 900 MPa Length : 5008 mm
Mass : 1460 kg
1156
192 15628 143
23 25
188
51 221 595 777
0.8 0.7
43 36
1138
34
0.5
44
0.8
3937
0.6 0.6
36 36
(1160 at mid-depth)
0.8
26
26
25
26
23
25
24
20
24 22
156156 142148147149154155
142156
197
409 965
1195
34 35 34 35 28
1154
194 15730 145
23 24
192
50 221 594 778
0.7 0.7
41 35
1139
32
0.5
47
0.9
3836
0.7 0.9
36 35
(1161 at mid-depth)
0.8
25
25
25
25
23
24
23
21
24 23
156155 151153151150154155
144157
200
408 965
1197
34 35 34 32 28
Fig. 2. PT200B.

B3
END 2 / EDGE 1 END 2 / EDGE 2
1157 (1163 at middepth)
39 41 40 37
400228 21855 55 59 59 49
38 38 37 39
399
42 293 593
1197
0.6 0.4 0.7
32 34 33
1160
219
321
224
321321 315
402
1.4
31
0.4
33
0.6 0.4
30 32
END 1 / EDGE 1 END 1 / EDGE 2
PT400ALower strands : 7 φ 12.5, prestress = 1000 MPa Length : 7000 mm
Mass : 3610 kg
340 851 896
1156 (1162 at middepth)
40 41 37 37
398226 21753 55 58 61 48
38 37 37 40
401
43 289 590
1196
0.6 0.6 0.4
38 40 39
1158
220
325
225
321317 318
402
2.5
39
0.5
37
1.6 1.3
35 39
339 850 896
Fig. 3. PT400A.

B4
END 2 / EDGE 1 END 2 / EDGE 2
1167 (1171 at middepth)
45 45 41 39
401226 21858 60 60 60 54
40 40 40 40
399
43 293 594
1196
0.8 0.3 0.6
36 38 37
1155
217
310
223
310297 307
402
1.6
36
0.4
36
0.7 0.5
37 37
END 1 / EDGE 1 END 1 / EDGE 2
PT400BLower strands : 7 φ 12.5, prestress = 1000 MPa Length : 7006 mm
Mass : 3640 kg
340 850 896
1158 (1163 at middepth)
38 42 40 38
400227 21855 55 59 59 49
38 37 38 42
400
42 292 592
1197
0.5 0.4 0.6
33 35 32
1158
218
320
224
321321 315
404
1.1
32
0.7
33
0.7 0.8
31 32
339 849 895
Fig. 4. PT400B.

C1
Appendix C: Effect of transverse motion at active end on torque
Consider Figs 1 and 2. When the slab rotates around axis O, point C moves to point C�. If the slab is loaded by an actuator, the upper end of which is fixed to point A, see Fig. 2, both the direction and eccentricity of the load are changed. For greater rotations δ the effect of the rotation has to be taken into account when calculating the torque.
Axis
r
r
dr
δx
z
C
C'w
uδ
O
Fig. 1. Rotation of point C at corner of slab and corresponding displacements u and w.
h
Axis
rR
dr
δi
αk
C
C'wk
uiδ
e
E
d fF
O
A
Fig. 2. Notation. d is the initial distance between upper and lower hinge of actuator, e and E are the eccentricity of the load in the initial and displaced state. f and F represent a vector parallel to the actuator force in the initial and displaced state, respectively.

C2
Using the notation expressed in Fig. 2 the perpendicular distance E from rotation axis O to the line passing through A and C� can be calculated. Using the unit vectors i and k and omitting the axial motion we get
krirrrrr αα cossin −= (1)
( ) ( )krirRrrr
δαδα +−+= cossin (2)
( )[ ] ( )[ ] kwiukrirrRrrrrrr
+=++−+−+=− αδααδα coscossinsin (3)
kwdiukwiufFrrrrrr
)( ++=++= (4)
Eccentricity of the load is equal to
eeRRE r
rrrr ⋅
== βcos (5)
where e is any vector perpendicular to F. E.g.
( ) kuiwderrr
−+= (6)
is such a vector because 0=⋅ Ferr . Hence we get
( )( ) 22
)cos()sin(
uwd
uwdrE++
++++=
δαδαr (7)
where r is the distance from axis of rotation to point C.
From Eq. 8 u and w are calculated. From Eq. 7 eccentricity of the load is then obtained.
d and h are given in Table 1. α is solved from tanα = e/h where e = 300 mm, and r = (e2+h2)1/2. u and w are solved from Eq. 3 and d is measured. In this way the eccentricity of the actuator load can be calculated from Eq. (7) for all load steps.
Table 1. Measures d and h, see Figs 1 and 2.
d mm
h mm
PT200A 1165 590 PT200B 1730 590 PT400A 1740 790 PT400B 1740 790

D1
Appendix D: Rate of elongation of actuator at active end
The relative torque illustrated in the following figures means the torque at the considered time step divided by the maximum torque observed during the test.
The vibration in the rate of elongation reflects not only the nonlinear response of the loading equipment and the loaded structure but also the inability of the control system to follow the response in sudden changes. On the other hand, the regularity in the behaviour of the applied torque shows that the loading history, with few exceptions, was very close to the aimed one.
-0.80
-0.60
-0.40
-0.20
0.00
0.20
0.40
0.60
0.80
1.00
1.20
0 20 40 60 80 100 120 140
Time [min]
[mm
/min
] or [
- ]
Rate of elongationRelative torque
Fig. 1. PT200A.

D2
-0.8
-0.6
-0.4
-0.2
0
0.2
0.4
0.6
0.8
1
1.2
0 20 40 60 80 100
Time [min]
[mm
/min
] or [
- ]
Rate of elongationRelative torque
Fig. 2. PT200B.
-0.8
-0.6
-0.4
-0.2
0
0.2
0.4
0.6
0.8
1
1.2
0 20 40 60 80 100 120
Time [min]
[mm
/min
] or [
- ]
Rate of elongationRelative torque
Fig. 3. PT400A.

D3
-0.80
-0.60
-0.40
-0.20
0.00
0.20
0.40
0.60
0.80
1.00
1.20
40 60 80 100 120 140 160
Time [min]
[mm
/min
] or [
- ]
Rate of elongationRelative torque
Fig. 4. PT400B.


Published by
Series title, number and report code of publication
VTT Research Notes 2273VTT�TIED�2273
Author(s) Pajari, Matti Title Pure torsion tests on single hollow core slabs
Abstract Four tests on prestressed hollow core slab units were carried out. The slab units, two of them 200 mm and two 400 mm in thickness, were subjected to pure torsion. In all tests the observed failure mode was the same as the predicted one, i.e. cracking of top flange in angle of 45º with the longitudinal axis of the slab unit. Although the failure mode was abrupt, the slab units showed considerable ductility after the failure. None of them collapsed before the test had to be interrupted due to excessive rotation.
For 400 mm slabs the torsional stiffness observed in the tests was close to that predicted by elementary calculation method, but for 200 mm slabs the predicted stiffness was 30% lower than that observed. The predicted torsional resistance was 60% and 70% of the observed resistance for 200 mm and 400 mm slabs, respectively, when the lower characteristic value for the tensile strength of the concrete was used for prediction.
Keywords shear tests, torsion tests, hollow core slabs, testing, test specimens, load testing, failure loads, concrete, precast, prestressed, structure
Activity unit VTT Building and Transport, Kemistintie 3, P.O.Box 1805, FIN�02044 VTT, Finland
ISBN Project number 951�38�6517�7 (URL: http://www.vtt.fi/inf/pdf/) R2SU00137
Date Language Pages Price December 2004 English 29 p. + app. 28 p. -
Name of project Commissioned by Holcotors EU, Concrete industry, VTT
Series title and ISSN Published by VTT Tiedotteita � Research Notes 1455�0865 (URL: http://www.vtt.fi/inf/pdf/)
VTT Information Service P.O.Box 2000, FIN�02044 VTT, Finland Phone internat. +358 9 456 4404 Fax +358 9 456 4374

VTT RESEA
RCH N
OTES 2273Pure torsion tests on single hollow
core slabs
ISBN 951–38–6052–3 (URL: http://www.vtt.fi/inf/pdf/)ISSN 1455–0865 (URL: http://www.vtt.fi/inf/pdf/)
ESPOO 2004 VTT RESEARCH NOTES 2273
Four tests on prestressed hollow core slab units were carried out. In thetests the slab units were subjected to pure torsion. In all tests the observedfailure mode was the same as the predicted one, i.e. cracking of top flangein angle of 45º with the longitudinal axis of the slab unit. Although thefailure mode was abrupt, the slab units showed considerable ductility afterthe failure. None of them collapsed before the test had to be interrupteddue to excessive rotation.
For 400 mm slabs the torsional stiffness observed in the tests wasclose to that predicted by elementary calculation method, but for 200mm slabs the predicted stiffness was 30% lower than that observed. Thepredicted torsional resistance was 60% and 70% of the observedresistance for 200 mm and 400 mm slabs, respectively, when the lowercharacteristic value for the tensile strength of the concrete was used forprediction.
Matti Pajari
Pure torsion tests on single hollowcore slabs
VTT TIETOPALVELU VTT INFORMATIONSTJÄNST VTT INFORMATION SERVICEPL 2000 PB 2000 P.O.Box 2000
02044 VTT 02044 VTT FIN–02044 VTT, FinlandPuh. 020 722 4404 Tel. 020 722 4404 Phone internat. + 358 20 722 4404Faksi 020 722 4374 Fax 020 722 4374 Fax + 358 20 722 4374
P
e+∆eP
eActive end
Passive end
Recommended