PURCHASING AND SUPPLY CHAIN MANAGEMENT COSTING:
AN AIR TRANSPORT PERSPECTIVE DERIVED THROUGH
COMMERCIAL AIR CARGO FIRMS
THESIS
Kurt Ettrich, Captain, USAF
AFIT/GAQ/ENV/04M-04
DEPARTMENT OF THE AIR FORCE AIR UNIVERSITY
AIR FORCE INSTITUTE OF TECHNOLOGY Wright-Patterson Air Force Base, Ohio
APPROVED FOR PUBLIC RELEASE; DISTRIBUTION UNLIMITED

The views expressed in this thesis are those of the author and do not reflect the official policy or position of the United States Air Force, Department of Defense, or the United States Government.

AFIT/GAQ/ENV/04M-04
PURCHASING AND SUPPLY CHAIN MANAGEMENT COSTING:
AN AIR TRANSPORT PERSPECTIVE DERIVED THROUGH
COMMERCIAL AIR CARGO FIRMS
THESIS
Presented to the Faculty
Department of Systems and Engineering Management
Graduate School of Engineering and Management
Air Force Institute of Technology
Air University
Air Education and Training Command
In Partial Fulfillment of the Requirements for the
Degree of Master of Science in Acquisition Management
Kurt Ettrich, BS
Captain, USAF
March 2004
APPROVED FOR PUBLIC RELEASE; DISTRIBUTION UNLIMITED.

AFIT/GAQ/ENV/04M-04
PURCHASING AND SUPPLY CHAIN MANAGEMENT COSTING:
AN AIR TRANSPORT PERSPECTIVE DERIVED THROUGH
COMMERCIAL AIR CARGO FIRMS
Kurt Ettrich, BS Captain, USAF
Approved: //Signed// 15 Mar 04 _____________________________________ ______________ Michael A. Greiner, Major, USAF (Chairman) date Assistant Professor of Cost Analysis Department of Systems and Engineering Management
//Signed// 15 Mar 04 _____________________________________ ______________ Stephen F. Swartz, Lieutenant Colonel, USAF (Member) date Assistant Professor of Logistics Management Department of Operational Sciences
//Signed// 15 Mar 04 _____________________________________ ______________ Bryan J. Hudgens, Major, USAF (Member) date Director, Graduate Strategic Purchasing Program Department of Systems and Engineering Management

iv
AFIT/GAQ/ENV/04M-04
Abstract
The Air Force has struggled to completely understand the costs
associated with its operations. The issue of understanding cost is complex,
involving many perspectives, methods and techniques. When examined from
a broad standpoint, total supply chain costs can include a firm’s costs plus
upstream and downstream costs. This perspective takes vendors, suppliers
and end customers into consideration. From this broad standpoint, the Air
Force does not know its total supply chain cost. Since the Air Force’s supply
chain is too broad to be a focus of this study, a smaller segment was chosen
for a closer look. Specifically, air cargo carriers were selected as a type of
commercial organization that could be sufficiently similar to the Air Force in
some respects and possibly offer information to address the investigative
questions. The purpose of this research is to determine what costing issues
exist in the air cargo arena and what costing methods or techniques are
utilized to address those issues. Air cargo carriers were contacted and a
telephone interview was administered to strategic key informants. The
interviews were exploratory, comprised of open-ended questions about how
they calculated their cost information, what problems or issues arose from
their chosen method and how they addressed those issues. The results of
this study may assist the Air Force in determining methods or techniques to
address some it’s costing issues.

v
Acknowledgements
This thesis would not have been possible if not for the guidance,
patience, understanding and free exchange of ideas with Lieutenant Colonel
Stephen Swartz, otherwise known as “the process guy.” His experience in
thesis advising proved to be invaluable and contributed directly to any
success I may have realized in this endeavor. He always found a spare
moment to address an issue and continually had thoughts and ideas at the
ready. His enthusiasm and positive motivation were greatly needed and
appreciated.
A sincere thank you to Major Michael Greiner for keeping me honest
and being able to make the tough calls. I have the utmost respect for him
and his rock solid integrity has taught me a great deal about leadership and
what it really means to be an officer.
My thanks also go out to Major Bryan Hudgens. His ability to reach
back into his bookcase and withdraw the appropriate reference, seemingly
without looking, and open it to exactly what was needed is uncanny.
Thank you to friends and family for their encouragement, kind words,
prayers and inspiration. They were far too neglected during this process and
I greatly appreciate their understanding. Thank you to Renate, AFIT librarian
extraordinaire, whose selfless efforts helped make Chapter Two possible.
Finally, I’m grateful to my fellow students. During our time at AFIT,
we always found a way to encourage each other and it helped us to realize
that we don’t go through this alone.
Kurt Ettrich

vi
Table of Contents
Page
Abstract............................................................................................. iv
Acknowledgements...............................................................................v
List of Figures..................................................................................... ix
List of Tables .......................................................................................x
I. Introduction ....................................................................................1
Overview.........................................................................................1 The Problem ....................................................................................3 Research Questions ..........................................................................4 Investigative Questions .....................................................................4 Methodology ....................................................................................5 Thesis Overview ...............................................................................6
II. Background.....................................................................................7
Air Force Interest .............................................................................7 Air Force Costing ............................................................................10 Costing Issues................................................................................15
Traditional Cost Accounting ........................................................15 Activity Based Costing................................................................15 Direct Product Profitability ..........................................................19 Efficient Consumer Response ......................................................19 Kaizen Costing..........................................................................20 Supply Chain Costing.................................................................20

vii
Page
Target Costing ..........................................................................22 Throughput Accounting ..............................................................22 Total Cost of Ownership .............................................................23 ACMI .......................................................................................26
Summary ......................................................................................27 Chapter Overview...........................................................................30
III. Methodology ...............................................................................31
Problem Statement .........................................................................31 Research Paradigm .........................................................................32 Methodology / Experimental Design ..................................................37 Data Sources / Format ....................................................................40 Data Analysis .................................................................................41 Overview.......................................................................................43
IV. Analysis .......................................................................................44
Findings ........................................................................................44 Results..........................................................................................46 Summary ......................................................................................60 Data Analysis .................................................................................60 Chapter Overview...........................................................................69
V. Discussion, Conclusions and Recommendations .................................70
Research Questions ........................................................................70 Investigative Questions ...................................................................70 Conclusions and Recommendations ...................................................72

viii
Page Overview.......................................................................................79
Appendix A: Definition of Terms ...........................................................80
Appendix B: Data Collection Instruments...............................................82
Bibliography ......................................................................................84

ix
List of Figures
Figure Page
1. PSCM Pillars of Change .................................................................... 9
2. Assignment of Resource Costs to Activities and Supply Chain Outputs ...21
3. Top Five Most Important Costs Comparison .......................................61
4. Desired Cost Movement ..................................................................74
5. Air Force T-43 ...............................................................................78

x
List of Tables Table Page
1. Excerpt Logistics Cost Factors Budget Year 2004................................12
2. Excerpt Aircraft Reimbursement Rates (per flying hour) FY2004 ...........13
3. General Ledger vs. ABC (Harrington, 1995). ................................................... 17
4. Where are costs generated? (Harrington, 1995).................................18
5. Costing Issues and Sources.............................................................28
6. Costing Issues and Methods ............................................................29
7. Criteria for Establishing Trust and Confidence in Research Results ........41
8. Issues and Methods From the Literature............................................44
9. Air Force Cost Per Flying Hour Factors ..............................................45
10.Firm A Ranking..............................................................................47
11.Firm A Weighting ...........................................................................53
12.Firm B Ranking..............................................................................53
13.Firm B Weighting ...........................................................................59
14.Respondent's Cost Issues & Methods ................................................60
15.Cost Element Ranking and Weighting................................................63
16.Summary of Overall Comparison......................................................66
17.Cost Definitions (Blocher, Chen & Lin, 2002)......................................75

1
PURCHASING AND SUPPLY CHAIN MANAGEMENT COSTING:
AN AIR TRANSPORT PERSPECTIVE DERIVED THROUGH
COMMERCIAL AIR CARGO FIRMS
I. Introduction Overview
The Air Force has struggled to completely understand the costs
associated with its operations. The Air Force’s bottom line is mission
accomplishment as opposed to profit, but the Air Force needs to comprehend
its costs for a number of reasons. First, the Air Force must manage
efficiently and effectively a finite amount of appropriated fund dollars each
fiscal year. Second, certain limitations govern the use of appropriated funds
such as the restriction on the percentage of dollars outsourced for depot level
maintenance (10 USC 2466). Finally, if the Air Force can control it’s
spending through an understanding of costing, it may improve cash spin
(Bowersox, Closs & Cooper, 2002), thus achieving more “bang” for the
taxpayer “buck.”
The issue of understanding cost is complex, involving many
perspectives, methods and techniques. For example, managerial accounting
supports decision making while cost accounting supports reporting
requirements.
2
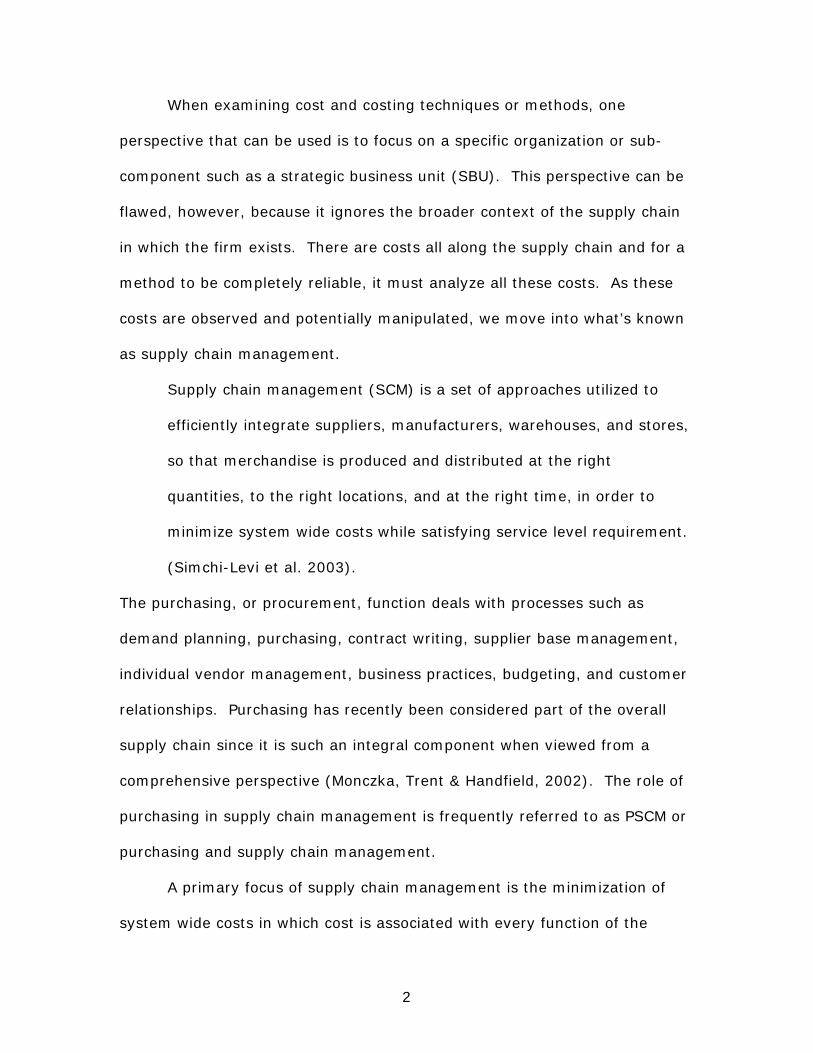
When examining cost and costing techniques or methods, one
perspective that can be used is to focus on a specific organization or sub-
component such as a strategic business unit (SBU). This perspective can be
flawed, however, because it ignores the broader context of the supply chain
in which the firm exists. There are costs all along the supply chain and for a
method to be completely reliable, it must analyze all these costs. As these
costs are observed and potentially manipulated, we move into what’s known
as supply chain management.
Supply chain management (SCM) is a set of approaches utilized to
efficiently integrate suppliers, manufacturers, warehouses, and stores,
so that merchandise is produced and distributed at the right
quantities, to the right locations, and at the right time, in order to
minimize system wide costs while satisfying service level requirement.
(Simchi-Levi et al. 2003).
The purchasing, or procurement, function deals with processes such as
demand planning, purchasing, contract writing, supplier base management,
individual vendor management, business practices, budgeting, and customer
relationships. Purchasing has recently been considered part of the overall
supply chain since it is such an integral component when viewed from a
comprehensive perspective (Monczka, Trent & Handfield, 2002). The role of
purchasing in supply chain management is frequently referred to as PSCM or
purchasing and supply chain management.
A primary focus of supply chain management is the minimization of
system wide costs in which cost is associated with every function of the

3
supply chain from forecasting future demand to final disposition of the
product, or in other words, from “end-to-end” (Simchi-Levi et al. 2003).
Clearly, it is crucial to understand these costs as well as the methods
available to calculate them if efficiencies such as cost savings are to be
achieved.
The Problem
When examined from a broad standpoint, total supply chain costs can
include a firm’s costs plus upstream and downstream costs. This perspective
takes vendors, suppliers and end customers into consideration. From this
broad standpoint, the Air Force is unable to accurately characterize its total
supply chain cost, whether at the Air Force level, the command level (e.g.,
Air Force Materiel Command (AFMC), which performs a large portion of the
Air Force’s purchasing, acquisition and maintenance), or even the Air
Logistics Centers (ALC) or depot level. This is important because the Air
Force can’t quantify potential future cost savings without knowing how much
is currently being spent, or more specifically, where and how it’s being
allocated. Part of the reason the Air Force doesn’t calculate this figure is it
hasn’t yet identified an appropriate and valid total supply chain cost model or
definition.
Since the Air Force is engaged in a comparatively rare set of functions
(i.e. warfighting), and since multiple functions are required to support
multiple aircraft and various pieces of equipment at numerous locations, it
becomes difficult to simply take a generally accepted cost model and use it

4
for the Air Force’s purposes. The Air Force needs to adapt a method or
model that will help the ALC’s, AFMC, and ultimately the Air Force, to
understand the costs associated with the supply chain from a comprehensive
viewpoint, thus enabling operations to be more efficient (i.e., in terms of
cost) while maintaining necessary levels of effectiveness.
Since the Air Force’s supply chain is too broad to be a focus of this
study, a smaller segment was chosen for a closer look. The segment
considered was aircraft operations. The Air Force routinely utilizes aircraft to
move cargo from one location to another. There are commercial firms that
also utilize aircraft in their operations. Specifically, air cargo carriers were
selected as a type of commercial organization that could be sufficiently
similar to the Air Force in some respects and possibly offer information to
address the investigative questions.
Research Questions
The previous discussion suggested that understanding costs and
costing techniques is important when it comes to managing the supply chain.
That leads to the following research questions: What costing techniques are
currently being utilized by air cargo carriers and why? What are the possible
implications for the Air Force?
Investigative Questions
The overarching research questions lead to the following investigative
questions:

5
- What costing techniques are currently available?
- What are the key issues in transportation service costing?
- What are the transportation service costing issues faced by air cargo
carriers?
- How do these firms address those issues?
- Why are these issues addressed that way?
- What is the relevance to the Air Force of these issues and how they’re
addressed?
Methodology
The methodology started out with a thorough literature review
regarding the techniques or methods to calculate costs as well as the issues
surrounding costing. Air cargo carriers were then contacted and a telephone
interview was administered to strategic key informants. The interviews were
exploratory, comprised of open-ended questions about how they calculated
their cost information, what problems or issues arose from their chosen
method and how they addressed those issues.

6
Thesis Overview
This chapter provided a brief introduction and an overview of the
study. The rest of the thesis is structured as follows: Chapter Two contains
background information and a review of relevant literature; Chapter Three
contains the methodology of what data was collected and how it was
collected; Chapter Four follows with an analysis of the data; and Chapter Five
presents an overall discussion of the findings, draws conclusions based on
the discussion, reviews limitations of the study and makes appropriate
recommendations for research and practice.
7
II. Background
This chapter reviews the literature relevant to the study. It is
organized topically and looks first at some background information regarding
the Air Force’s concern with costing. It then explores costing methods and
costing issues.
Air Force Interest
Title 10 of the United States Code includes the so-called 50-50 rule
that governs outsourcing. This rule requires that a defense agency or
military department can outsource no more than 50-percent of the
appropriated funds earmarked for depot-level maintenance (10 USC 2466).
Although the Department of Defense (DoD) is required to submit reports to
the Congress regarding depot maintenance costs, the General Accounting
Office (GAO) also has the responsibility of reporting to the Congress on
whether DoD complied with the 50-50 rule. According to the GAO’s 2002
report, the Army and Navy were below the 50-percent funding limitation for
outsourcing, thus meeting the goal. The Air Force, however, was above the
50-percent limitation (GAO-03-16, Oct 2002). The Air Force’s inability to
comply with Congressional direction has caused concern within Congress
about how the Air Force tracks costing.
The Air Force maintains three Air Logistics Centers (ALC’s), otherwise
known as depots, that exist to perform periodic maintenance, system
upgrades and overhaul capabilities for major weapon systems. All three fall
8
under the Air Force Materiel Command (AFMC), a major command (MAJCOM)
headquartered at Wright-Patterson Air Force Base (AFB) near Dayton, Ohio.
In order to comply with the 50-50 rule, the Air Force has had to take a close
look at its maintenance operations and its supply chain, specifically at the
ALC’s. For the Air Force to become the preferred supplier to the warfighter
and reduce its current level of outsourcing, the Air Force supply chain needs
to become more efficient, more effective, and realize a cost savings.
The commercial sector has attempted to demonstrate that adopting
purchasing and supply chain management (PSCM) “best practices” may help
produce radical improvements such as decreased costs, increased efficiency
and increased effectiveness. No single method has emerged as the panacea
for every situation. Nonetheless, there is a widespread perception that some
efficiency, effectiveness, and cost savings may flow from some form of PSCM
implementation.
The Air Force anticipates certain PSCM practices may contribute to
success in areas such as demand planning; purchasing; inventory
management; supplier base management; business practices; and customer
relationships. The Air Force is specifically interested in possible cost savings
believed to be associated with PSCM. The Air Force wants to assess PSCM
best practices and determine how to apply them to sustainment and
operational activities.
The Spares Campaign, an initiative sponsored by the Air Force’s
Supply Chain Integration & Logistics Transformation Office (AF/IL-I) and
endorsed by the commander of AFMC, strives to ensure the improved

9
availability of spare parts to the warfighter when and where they are needed.
As a key component of the Spares Campaign, PSCM best practices could play
a role in streamlining this process and making it more efficient and effective.
Needless delays caused by back ordered parts can result in cannibalizing the
needed parts from another operational weapon system. While this may be a
temporary fix, cannibalization is a symptom of the larger problem which is
lack of timely re-supply of spares. The Spares Campaign attempts to focus
on a longer term view to resolve the issue.
HQ AFMC/PK, the contracting staff for Materiel Command, is trying to
ascertain how to improve the Air Force Supply Chain and has an initiative in
progress to examine PSCM. An Executive Steering Group has been
established to examine multiple facets of PSCM with respect to the Air Force.
(See Figure 1)
PSCM Pillars of Change
Figure 1. Taken from a PSCM Executive Steering Committee Presentation entitled PSCM Pillars of Change
Proc
ess P
artn
er
Inte
grat
ion
End-to-End Supply Chain Management Data as a Strategic Resource
Prog
ram
R
equi
rem
ents
&
Ops
Pla
nnin
g
Supp
lier
Perf
orm
ance
Im
prov
emen
t
Balanced Scorecard
Com
mod
ity-
Cen
tric
So
urci
ng
Cus
tom
er
Gat
eway
Stre
amlin
ed
Con
trac
ting
Exe
cutio
n
PSCM

10
The notion of an “end-to-end” supply chain serves as the foundation for the
Air Force PSCM construct. This foundational element must be clearly
understood if the Air Force is to be capable of manipulating its supply chain
to efficiencies and cost savings. In order for the Air Force to truly realize a
cost savings, it must determine three things:
1. Where are we now (how much are we spending, where? on what?)? 2. Where do we want to be (how much can we cut)? 3. How do we chart a course to get there (how do we do it)? Step 1 would require the Air Force to identify its current “total supply chain
cost.” Since there are multiple definitions and models of “total supply chain
cost,” (Bowersox, Closs & Cooper, 2002; Frazelle, 2002; Monczka, Trent &
Handfield, 2002; Stock & Lambert, 2001) and total supply chain costs would
be too broad in scope, this study seeks to identify the methods or techniques
to calculate cost and the issues or problems associated with those
techniques. Specifically, the air cargo sector was chosen as a focus for this
analysis.
Air Force Costing
The primary number that serves as a baseline in the Air Force is Cost
Per Flying Hour (CPFH). Since the Air Force flies multiple airframes, CPFH is
calculated by aircraft type, and is further customized by MAJCOM but that
level of refinement isn’t required for this thesis. CPFH is calculated using
four factors:

11
1. System Support Division (SSD) – disposable aircraft parts,
antennas, lights, wiring, windshields, etc.
2. General Support Division (GSD) – other expendable items which
include common bench stock items, administrative supplies, tools, etc.
3. Depot Level Reparables (DLRs) – aircraft parts removed by wing
maintenance personnel and sent to depots for repair.
4. Aviation Fuel (AVFuel) –Fuel used during flight, which typically
includes JP-4, JP-8, off-station fuel and in-flight refueling. The AVFuel
factor is expressed in gallons per hour, which is converted into a dollar
per hour factor based on DoD established prices for each fuel type.
(Rose, 1997)
Numbers one and two fall under a broader category called Consumable
Supplies, so at times, CPFH may be referred to as having three categories
instead of four.
The Air Force utilizes these four factors to calculate a baseline rate
using the most recent numbers for obligations and flying hours. Next,
approved adjustments and economic adjustments are made. MAJCOMS
recommend approved adjustments annually along with rationalization for the
changes. The Air Force Cost Analysis Improvement Group (AFCAIG) applies
the economic adjustments which take inflation (or deflation) into
consideration. These rates are then used in budget estimation for coming
years (Rose, 1997).
Flying Hour (FH) and Primary Aircraft Authorization (PAA) factors are
presented in attachments to Air Force Instruction (AFI) 65-503 entitled Cost

12
and Planning Factors. FH factors are assumed to vary with flying hours
whereas the PAA factors are assumed to vary with the number of assigned
aircraft (Air Force, 1994). Below is Table 1 which contains an excerpt of AFI
65-503, Attachment A2-1, Logistics Cost Factors Budget Year 2004 (FY 2004
Constant $).
Table 1. Excerpt Logistics Cost Factors Budget Year 2004
(FY 2004 Constant$) (Air Force, 1994).
AFI 65-503 Attachment 2-1
December 2003
Table A2-1 BUDGET YEAR 04 (FY04 Const $s) Per Flying Hour Costs Per PAA Costs
MDS
Consum Supp GSD
Depot Level Repar MSD
Aviat Fuel IMPAC
Depot Maint
Total FH
Costs Depot Maint
Suprt Equip
Total PAA Costs
C-141B $655 $2,003 $1,924 $17 $736 $5,335 $718,322 $15,228 $733,550 C-141C $655 $2,003 $1,924 $17 $736 $5,335 $718,322 $6,103 $724,425 C-17A $171 $64 $2,555 $14 $0 $2,804 $4,575 $16,056 $20,631 C-5A $1,493 $4,122 $3,235 $41 $1,799 $10,690 $1,275,734 $7,118 $1,282,852 C-5B $1,493 $4,122 $3,235 $41 $1,799 $10,690 $1,275,734 $12,089 $1,287,823 C-5C $1,493 $4,122 $3,235 $41 $1,799 $10,690 $1,275,734 $5,737 $1,281,471 KC-10A $6 $0 $2,545 $10 $0 $2,561 $216 $21,842 $22,058
This excerpt shows figures for the Air Force’s primary cargo airlift aircraft,
the C-141 Starlifter, C-17 Globemaster, C-5 Galaxy and the KC-10A Extender
which is an in-air refueling platform but can also carry cargo.
When Air Force aircraft are used outside the Air Force, for instance, to
transport cargo for the Department of the Army, a different hourly rate is
utilized. These are called Aircraft Reimbursement Rates and in addition to
the four factors listed earlier, it also includes Contractor Logistics Support
and personnel costs for aircrew (Air Force, 1994). Table 2 includes an

13
excerpt from AFI 65-503, Attachment A15-1, Aircraft Reimbursement Rates
(per flying hour). The same aircraft types are illustrated.
Table 2 . Excerpt Aircraft Reimbursement Rates (per flying hour) FY2004
(Air Force, 1994).
REIMB RATES
FY04 MDS (DOD) (OTH/FMS) (PUBLIC)
C-141B $6,809 $7,128 $7,413 C-141C $7,143 $7,462 $7,760 C-17A $4,963 $5,121 $5,326 C-5A $13,603 $13,892 $14,448 C-5B $10,690 $10,946 $11,384 C-5C $10,690 $10,946 $11,384
KC-10A $7,779 $7,969 $8,288
MDS – Mission, Design, Series FMS – Foreign Military Sales
In addition to the aircraft reimbursement rates are the charges for the
actual cargo. The United States Transportation Command (USTRANSCOM)
issued the Transportation Working Capital Fund (TWCF) Rate Procedures –
Fiscal Year 2003. Specifically addressing cargo are the following criteria:
1. AMC (Air Mobility Command) bills on either a per pound or per
pound mile basis. The Office of Under Secretary of Defense
Comptroller, OUSD(C), directs AMC cargo rates be commercially
comparable. To achieve this, AMC applies a variety of business
procedures in establishing appropriate commercial benchmarks. These
are as follows:

14
a. All rates are priced $0.01 per pound lower than existing commercial
competition (e.g., tenders, commercial air lines of communication
(COMALOC)) whenever possible.
b. Forecasted Channels: If no commercial competition, rates set at
62% overall cost recovery with $1.00 per lb minimum.
c. Non-Forecasted Sequence Listing Channels: If no commercial
competition, non-contingency channels set at 85% overall cost
recovery and contingency channels set at 91% overall cost recovery.
d. All other channels used during fiscal year will be set at 85% overall
cost recovery if there is no commercial competition.
e. Rates vary by weight break (1-439; 440-1099; 1100-2199; 2200-
3599; 3600+).
f. Starting in FY02, there is a $1 per pound minimum rate for all routes
to help recover fixed costs. There is also a minimum shipment weight
billed of 10 pounds per cubic foot and a minimum charge of $25 per
shipment to recover fixed costs.
USTRANSCOM TWCF Rate Procedures – FY2003 Since the Air Force is the premier airpower in DoD, other services
often request that the Air Force provide airlift capability. Since the Air Force
is allocated a limited amount of appropriated fund dollars for it’s own
operations, the aircraft reimbursement rate and the cargo rate procedure
criteria above are used to offset expenditures.

15
Costing Issues
A search of current literature yielded some current costing issues and
methods. To gain a better understanding of the available costing methods,
this chapter will briefly explain each one. The first one addressed is
traditional cost accounting.
Traditional Cost Accounting
The inherent problems with traditional cost accounting are becoming
more glaring. Dugdale (1990) points out that traditional cost accounting is
not in step with changes in manufacturing and, in fact, can give the wrong
impression about a cost issue. This can directly lead to a manager making
the wrong decision about the issue at hand. Since overhead and indirect
costs are not traced to specific products or outputs, the true cost of
production is never really known. As a result, the selling price may not
recover the full cost of the manufacturing process. So while a firm believes it
is generating revenue on a product line, it could be losing money.
Activity Based Costing
Authorities have recommended many approaches to measuring cost in
an organization. One approach is Activity Based Costing (ABC.) ABC is a
technique which involves tracing overhead and direct costs back to specific
products and services (Simchi-Levi et al. 2003). MacArthur (1992)

16
advocates the use of ABC as a more effective approach for tying costs to
particular activities within the organization. Firms that field numerous
products or services may find ABC especially helpful since complex product
offerings can generate complex overhead support activities that require
proper allocation (MacArthur, 1992). ABC could enable a more specific and
focused look at exactly where some of the costs originate which is one of the
more important aspects behind ABC. Where traditional cost accounting deals
with an overhead as a single category of expense, ABC attempts to split the
overhead up and attach it in some way to an output. The output could be a
widget, a service performed such as an oil change or the cost to fly an Air
Force C-17 Globemaster for one hour. Once the cost of the output is known,
it becomes clearer where management should focus attention in an effort to
reduce costs or maximize output.
While ABC offers potential benefits, there are also potential drawbacks.
Managers sometimes would like to disaggregate costs that, in reality, exist
only in the aggregate. For example, if it costs $3,000 per flying hour to
operate a C-17, a savings of $3,000 is not actually realized by not flying.
This stems from certain costs such as the salary of the pilot, co-pilot and
loadmaster who will be paid whether they fly a mission or sit in an office. So
only once the C-17 is airborne can the fixed overhead of salary be traced to
that flying hour, which is the output in this case. This example illustrates the
importance of selecting appropriate cost drivers that result in an output, so
management can fully understand how costs and processes can affect each

17
other as well as the total cost. See Table 3 below and Table 4 on the next
page for an example of the differences between traditional costing and ABC.
Table 3. General Ledger vs. ABC (Harrington, 1995).
General Ledger View Activity-based View of Warehousing Costs of Warehousing Costs Storage and Handling $ 40.10 Dry storage $ 25.00 General and Administration $ 30.90 Refrigerated storage $ 8.10 Trucking and delivery $ 4.50 Receiving $ 20.00 Freight Consolidation $ 2.40 Shipping $ 18.80 Value-added services $ 3.30 Billing $ 3.20 Delivery $ 6.00 Packaging/stenciling $ 1.80 Freight consolidation $ 3.00 Material handling equip. $ 5.30 Total $ 91.20 Total $ 91.20 Activity based costing unbundles the traditional cost view by responsibility center and restates costs by how resources are consumed and managed.
Clearly, the breakdown of costs on the activity-based side is much
easier to trace back to a specific task or output. Beyond being able to trace
specific costs is being able to identify significant increases and knowing
exactly where the source is located. If a pooled total cost increased
dramatically, it may take additional time and effort to break that figure down
into its applicable components in order to identify the primary source of the
increase. For instance, if refrigerated storage has increased by 15%, the
activity-based view would allow us to see that immediately rather than have
to break down the broader ‘storage and handling’ category in the general

18
ledger view. The sooner a problem can be identified, the sooner corrective
action can be implemented.
Table 4. Where are costs generated? (Harrington, 1995).
Costing a Department With Activity-Based Management Chart of accounts view: Activity accounting view: Receiving department Receiving department
Salaries $120,000 Receive Material $ 86,600
Supplies $ 30,000 Depreciation $ 20,000 Move Material $ 84,600 Overtime $ 15,000 Space $ 30,000 Expedite Material $ 58,800 All Other $ 15,000
Total $230,000 Total $ 230,000
Figure 3 shows something a little different. There is a $15,000
expenditure for overtime and while that may be a significant increase, it
doesn’t tell us why there was overtime. Management can’t take action
against ‘overtime’ per se. If workers were required to perform a task, and
the task was completed, that could justify the overtime. However,
management will want to understand the cost driver, in other words, what
generated the overtime. Perhaps a manager would be able to look at the
right hand column and ascertain a normal expediting expense is between
$43,000 and $44,000. Evidently, expediting is the cause of the overtime.
The manager can now dig deeper to determine if there were inefficiencies, a
problem with a supplier or a production glitch.

19
Direct Product Profitability
Direct Product Profitability or DPP emerged as a costing technique
focused on direct costs within the grocery sector during the 1960’s and
1970’s (LaLonde & Pohlen, 1996). Instead of relying on gross margins to
determine profit, DPP took a closer look at specific physical characteristics
such as handling, storage, freight and labor required to stock shelves. This
was done in an attempt to understand how they impacted profit,
merchandising and product-handling decisions (LaLonde & Pohlen, 1996).
While this method developed a more accurate picture as to whether a specific
product was making or losing money, its downfall is related to the exclusion
of overhead or indirect costs (LaLonde & Pohlen, 1996). Any method that
fails to address overhead or indirect costs is clearly too narrow and couldn’t
be utilized on a larger scale to develop a comprehensive awareness of total
costs.
Efficient Consumer Response
Efficient Consumer Response (ECR) is not a cost model, but a broad
costing technique that focuses on automation and is split into two phases;
Phase I is Best Practices Efficient Replenishment and Phase II which is
Efficient Replenishment (LaLonde & Pohlen, 1996). Phase I attempts to
automate the supply chain within the firm and Phase II builds on Phase I by
assimilating the vendors and distributors into the supply chain to create a
larger, cohesive, automated cycle (LaLonde & Pohlen, 1996).

20
While this method is primarily centered on efficiency, as its name
implies, its downfall comes when attempting to optimize in one area. The
costs saved may be inadvertently shifted to another part of the supply chain
within the firm or to a vendor.
Kaizen Costing
The term “kaizen costing” is actually somewhat misleading. Kaizen is
more of a refinement tool to ensure efficiency in production. Once a product
has been in production a certain amount of time, increases in capability and
decreases in price are normally expected by the consumer. This can be
illustrated with digital watches, hand held calculators and personal
computers. First generation prototypes were very expensive and were not
very functional. For example, watches simply offered time and date, yet
today watches offer multiple time zones, multiple alarms, stop watches,
compass heading, altimeter, barometer, ambient air temperature, heart rate,
etc., for a significantly lower price. The process of increasing performance
and decreasing price is known as kaizen costing (Williamson, 1997).
Supply Chain Costing
Essentially, supply chain costing is activity based costing on a broader
level across the entire supply chain. LaLonde and Pohlen (1996) identify the
six steps utilized when employing supply chain costing:

21
1. Analyzing Supply Chain Processes 2. Breaking Processes Down Into Activities 3. Identifying the Resources Required to Perform an Activity 4. Costing the Activities 5. Tracing Activity Costs to Supply Chain Outputs 6. Analysis and Simulation
SupervisionSupervision OfficeOfficeSupportSupport UtilitiesUtilities SuppliesSupplies Equipment Equipment
ReceivingReceiving Put-AwayPut-Away Set-UpsSet-Ups
Resources
Activities
SupplyChainOutputs
Packing &Packing &ShippingShipping
Customer ACustomer A Customer BCustomer B Customer CCustomer C Customer DCustomer D
Figure 2. Assignment of Resource Costs to Activities and Supply Chain Outputs (LaLonde & Pohlen, 1996).
Supply chain costing attempts to allocate each cost back to a process or
output just like activity based costing. This allows a manager to truly
understand what drives cost and, more importantly, how that specific cost
can be manipulated. This also opens a managers eyes to the entire supply
chain perspective. For instance, if a manager wants to save shipping costs,

22
he or she can begin shipping Freight On Board (FOB) Origin versus FOB
Destination. In a limited sense, the customer has now become responsible
for the shipping costs. In reality however, the costs have simply been shifted
to another supply chain partner. When viewed from a comprehensive
perspective, the overall cost of the supply chain has remained the same.
Firms who have strategic partners or are developing alliances in an
attempt to effect a more efficient supply chain can certainly benefit from
supply chain costing.
Target Costing
Ellram (1999) defines Target Costing with a simple formula:
Target Cost = Estimated Selling Price – Desired Profit
She points out that estimated selling price and target price are the same
thing. This is really a method to ascertain what the market will bear. In
essence, the idea is to reverse engineer an appropriate selling price, factor in
the desired profit and determine if the resultant target cost is achievable in
the current market environment.
The benefit to target costing is the ability to know if a product will
generate the desired profit before production begins and resources are
committed.
Throughput Accounting
Mena, Whicker, Templar and Bernon (2002), describe throughput

23
accounting as a derivation of the Theory of Constraints (TOC). TOC
fundamentally espouses the notion that any system has at least one
constraint that keeps it from maximizing its efficiency or achieving its
primary goal (Mena et al, 2002). When the supply chain is viewed through
this mechanism, the idea is to focus on the constraints that prevent the end
goal, whether that is to penetrate new markets, increase revenue, decrease
cost or produce more product.
Throughput accounting intends to assign only direct materials to the
product being produced and while this may be appropriate for a short term
decision where fixed costs don’t play a major role, the failure of this method
is its limited focus on the primary constraint being controlled (Mena et al,
2002). As a result, it fails to address overhead and indirect costs and is not
an efficient method from a broader perspective.
Total Cost of Ownership
Total Cost of Ownership (TCO) is another approach to measuring
costs. Cokins (2001) advocates TCO and points out that the price on the
bottom of a vendor’s invoice does not represent the entire cost of purchasing
an item. There are also costs associated with placing the order, receiving,
inspecting, warehousing, late delivery, warranty work and customer returns
(Ellram, 1994). All these costs comprise the total cost of ownership. Ellram
further distilled TCO down to two models: standard and specific. The
standard TCO model is usually supported by a computer or has been

24
established in writing. It’s designed to be used for many types of purchases
and can be used on a recurring basis. The specific TCO model is created for
a distinct transaction or item (Ellram, 1994). From a DoD perspective, a
standard TCO model might be used when purchasing office furniture or office
supplies. This type of purchase is relatively straightforward, the items are
usually similar and the cost drivers that affect the purchase don’t change a
great deal from purchase to purchase. Therefore, the standard TCO model
can be used again and again. DoD might use a unique TCO model when
purchasing a major weapon system such as the Joint Strike Fighter (JSF).
Ellram (1994) also addresses the implications and barriers of TCO.
While she believes that TCO is a way to improve a firm’s understanding of
costs, barriers such as the corporate culture, types of resources
utilized/purchased, training, and senior leadership buy-in can make the TCO
process difficult to execute. The most significant implication was the
realization there isn’t a standard tactic or implementation for TCO to be
effective and successful (Ellram, 1994).
Scholars (Ellram, 1994; Ferrin & Plank 2002) studied TCO models
utilized by leading edge companies and also suggest there is not one correct
method or generic template that could be utilized across the board for TCO
implementation. While a core set of drivers is needed, each firm can add
auxiliary drivers as they deem appropriate (Ferrin & Plank 2002). In other
words, there might be a need for an amalgam that combines TCO with ABC
to obtain a model that fits the specific needs of the using organization.
Essentially, each organization or company would utilize the aspects and

25
drivers applicable to their industry or its particular operations. A company
like United Airlines would choose drivers that differ from retail giant Wal-Mart
who would choose drivers that are different from a significantly smaller retail
operation. So basically, every company will have a different model.
Logically, we can infer that the Air Force should have an individual model
exclusive of what other firms might utilize. However, the Air Force is very
diverse and even an Air Force specific model that might work at the Warner-
Robins ALC in Georgia may not work for the Ogden ALC in Utah, based on
factors unique to each center’s mission. The difficulty lies in the cost
driver(s). Ferrin & Plank (2002) suggested thirteen categories of drivers for
cost of ownership:
Operations Cost Quality Logistics Technological Advantage Supplier Reliability & Capability Maintenance Inventory Cost Transaction Cost Life Cycle Initial Price Customer-Related Opportunity Cost Miscellaneous
Each recommended category can be decomposed into separate
subsidiary entries. The miscellaneous category, for example, has 32
separate entries, including:
Taxes Warranty Disposal Costs Currency Exchange Rates Lease Rate Factors Obsolescence Cost Supplier Cost Drivers (From Requisition to Receipt) Technical Support Environmental Issues

26
This method appears to be quite in depth and time consuming. It’s
apparent that a great deal of time and effort would have to be expended in
order to identify an appropriate cost model. For instance, the Air Force
would need to determine the cost drivers for the various segments, locations
and weapons systems the Air Force utilizes.
ACMI
ACMI stands for aircraft, crew, maintenance and insurance. This is a
costing method invented by Atlas Air, Inc. (Air Cargo News, 2004). Atlas’s
core business is to operate dedicated cargo flights for other airlines under
ACMI agreements. Under these types of agreements, the lessee, not Atlas,
holds out air service to the shipping public and assumes the marketing risk
(Comments of Atlas Air, Inc., 2003). In turn, the lessor charges a reduced
rate that includes only aircraft, crew, maintenance and insurance. It
becomes incumbent upon the lessee to take care of ground handling, landing
fees, overfly fees, and in some cases, fuel. If the lessee believes they can
find a better price for fuel, they will opt for the dry lease versus the wet lease
alternative. The benefits are cheaper costs but more of an administrative
burden to coordinate additional functions which will generate multiple
invoices.
Part of the appeal of ACMI is a firms ability to enter and compete in
markets without a significant outlay of capital resources to purchase aircraft,
incur maintenance, training and crew expenses. Or perhaps a firm wants to
expand into a possible market segment but wants to determine if it will be

27
profitable first. In this case, aircraft get be obtained through ACMI
agreements for a pre-determined period of time that could serve as a trial
phase (Comments of Atlas Air, Inc., 2003).
It all comes down to the customer deciding if they can get a better
deal on the supporting costs and whether the additional administrative
workload is worth the effort.
Summary
The costing issues and methods found in the literature are introduced
in Tables 5 and 6. The primary costing issues discovered in the literature
review are listed down the left side of Table 5, while the source articles are
listed across the top.

28
Table 5. Costing Issues and Sources
Costing Issues (Down) Sources (Right)
Roo
ting
Out
Sup
ply
Cha
in
Cos
ts (A
yers
, 200
3)
Dia
gnos
ing
Cos
ting
Prob
lem
s (A
tkin
son,
198
9)
Thre
e Pr
oble
ms
That
Lin
ger
(La
Lond
e, 2
003)
Cos
ting
The
Supp
ly C
hain
(M
ena
et a
l, 20
02)
A G
loba
l Sup
ply
Cha
in M
odel
w
ith T
rans
fer P
ricin
g an
d Tr
ansp
orta
tion
Cos
t Allo
catio
n (V
idal
& G
oets
chal
ckx,
200
1)
Issu
es In
Sup
ply
Cha
in C
ostin
g (L
aLon
de &
Poh
len,
199
6)
Indi
rect
Cos
ts o
f Con
trac
ts
(She
lton
& B
rugh
, 200
2).
Mea
surin
g Su
pply
Cha
in
Perf
orm
ance
(Bea
mon
, 199
9)
Mea
surin
g th
e C
ost o
f Ow
ners
hip
(Car
r & It
tner
, 199
2)
Lack of Clarity X
Lack of Credibility of the Costing System X
Lack of Accurate Costing Data for Decision Making X
Variability X
Information Sharing X
Absorption Costing X
Supply Chain Costing X
Transfer Costing X
Competition X
Cost/Price Reduction X
Overhead/Indirect Cost Allocation X
Overhead Creep X
Selecting Suppliers Based Solely on Price X
Target Costing X
The primary costing methods discovered in the literature review are
listed across the top of Table 6, while the costing issues they address are
listed down the left side.

29
Table 6. Costing Issues and Methods
Costing Issues (Down) Costing Methods (Right)
Activity Based Costing
Direct Product Profitability
Efficient Consumer Reporting
Kaizen Costing
Supply Chain Costing
Target Costing
Throughput Accounting
Total Cost of Ownership
Traditional Cost Accounting
Lack of Clarity X Lack of Credibility
of the Costing System X
Lack of Accurate Costing Data for Decision Making X
Variability X Information
Sharing X X Absorption
Costing X Supply Chain
Costing X n/a
Transfer Costing X
Competition X Cost/Price Reduction X
Overhead/Indirect Cost Allocation X
Overhead Creep X Selecting
Suppliers Based Solely on Price X
Target Costing n/a
These two tables provide a starting point to characterize some of
what’s known in the realm of costing, as well as how certain costing issues
are currently being handled. They have also brought to light some gaps in
the assumptions or understanding of the researcher. Perhaps the most basic
assumption was that the available costing methods are viable solutions to
deal with the costing issues or problems, yet what’s shown here isn’t quite
that simplistic. For instance, while these methods were all identified in the
literature review, there are several that fail to address any of the fourteen
costing issues identified. There are three possible explanations for this

30
phenomenon; 1.) The literature improperly identified the problems; 2.) The
literature improperly identified the solutions; or 3.) The researcher
improperly identified the problems or solutions.
Chapter Overview
This chapter discussed the various costing methods and techniques
revealed during the literature review. Some of the issues and problems
related to these methods are discussed. Clearly, some of the methods
emerge as better than others but that determination is dependant upon the
end goal. Certain methods focus on a narrow perspective while others are
more broad based in nature. A method used to calculate the entire supply
chain cost may not be beneficial when attempting to understand how to
optimize performance and reduce the price of a single product.
Ultimately, the manager needs to recognize the various methods and
techniques available before deciding which one to select for his or her
purposes.

31
III. Methodology
Chapter Two reviewed the relevant literature and developed the
hypotheses to guide the study. This chapter describes the methodology that
was used to test these hypotheses. First, this chapter will clearly define the
problem. Second, it will discuss how data was collected. Lastly, it will look
at data analysis.
Problem Statement
The purpose of this study is to discover what costing techniques are
currently being utilized by air cargo carriers and why. Possible implications
for the Air Force will also be considered. The study seeks to understand
differences among competing cost models used in industry. Additionally, it
seeks to understand the rationale behind each firm’s choice of the cost model
currently being utilized.
To address this problem, the following investigative questions,
originally developed in Chapter One, will be answered:
- What costing techniques are currently available? - What are the key issues in transportation service costing? - What are the transportation service costing issues faced by air cargo carriers? - How do these firms address those issues? - Why are these issues addressed that way? - What is the relevance to the Air Force of these issues and how they’re addressed?

32
Research Paradigm
The literature review discovered gaps in the characterization of the
assumptions related to costing methods and the costing issues they are
meant to solve. The most basic assumption was that the available costing
methods are viable solutions to deal with the costing issues or problems that
emerged from the literature review. Certainly, some models addressed more
issues than others; however, since several issues were not addressed by the
available costing methods, there is an incongruity in the “fit model.”
No commercial organization is comparable to the Air Force, however,
some commercial organizations could be sufficiently similar to the Air Force
that they could offer information addressing the investigative questions. A
thorough search was conducted to identify multiple commercial organizations
that have business processes similar to certain segments of the Air Force.
Case Study
A case study research approach was originally considered. Case study
research refers to the collection of extensively detailed information about a
specific participant, program, process or event. Case studies often include
reports on the participants themselves as well the environment that
surrounds what’s being studied. This in depth analysis is normally done over
an extended period of time (Yin, 2003). Since the investigator has little
control over the events and the questions being put are of the “how” and
“why” variety, case study research is generally the preferred method (Yin,

33
2003). Case study research is seen as an all encompassing method rather
than simply a data collection method and may discover more variables than
actual data points (Yin 2003). While this may not be desirable from a
statistical perspective, it opens up the issue being studied and provides a
deeper understanding as well as possible follow on research paths. On the
other hand, case study research is also subject to weaknesses such as
investigator bias, whether intentional or unintentional (Leedy & Ormrod,
2001).
One of the strengths afforded by utilizing a case study method is
flexibility. If the researcher is unsure where the study may lead because
little is known about the topic, a case study approach allows the researcher
to begin with a broader perspective and ultimately narrow to a razor sharp
focus as the study progresses (CSU, 2004). As Leedy & Ormrod indicated,
case study analysis can also open the issue being studied to provide a better
understanding and this can lead to a more informed decision about exactly
what aspect(s) should be studied further.
A significant weakness of the case study method is the perception that
researchers sometimes deviate from the systematic procedures (Yin, 2004).
This could affect the credibility of the study, and as a result, call into
question the findings and inferences made. Personal bias is another
consideration since the researcher will be spending an extended period of
time dealing with the participant(s). Bias can affect the research, how it’s
conducted, preparation of data collection instruments and how the data is
analyzed (CSU, 2004).

34
Although the flexibility offered through the case study method would
have been helpful to produce a clearer and more thorough understanding of
this exploratory effort, the case study method was rejected primarily because
this thesis would not be examining the participants over an extended period
of time. As a result, two other methods were considered; a
phenomenological study and a grounded theory study.
Phenomenological Study
The purpose of a phenomenological study is to use the respondent’s
viewpoint to understand an experience or phenomena (Leedy & Ormrod,
2001). It attempts to focus on the “lived experience” and comprehend how a
participant perceives, describes, judges and makes sense of a phenomenon
that they have experienced first hand (Patton, 2002). This method involves
lengthy interviews with participants in order to gain a deeper understanding
of the phenomena being studied and these interviews normally have the
participant doing most of the talking while the researcher does the listening
(Leedy & Ormrod, 2001).
Clearly, a major strength of this method is being able to collect first
hand knowledge. Each individual can be seen as a filter for information. As
a result, each person has the potential to process information differently so
when information is heard second hand, third hand or greater, there is an
ever increasing possibility that the information loses accuracy. In the end, a
researcher can’t be certain whether the original experience has been
captured or the perception of the second person that passed it on to the third

35
person. Another strength of this method would be the ability to ask
immediate follow-up questions. The individual who has second or third hand
information most likely can not answer simple questions because they
weren’t there to experience the phenomena, consequently, their information
is limited to what they’ve been told, not what they saw, heard or felt.
A weakness of this method would be researcher bias, specifically if the
researcher has experienced the phenomena first hand. To mitigate bias, a
researcher is supposed to suspend any preconceived notions regarding their
experiences, a process known as bracketing, and this is a critical step if the
researcher wants to totally understand the participant’s perspective (Leedy &
Ormrod, 2001).
Since this study contacted respondents who were directly involved
with the costing issues surrounding air cargo carriers, this method seemed
appropriate, but the grounded theory methodology still deserved a look.
Grounded Theory
The grounded theory study methodology seeks to utilize collected data
in order to formulate a theory (Leedy & Ormrod, 2001). In other words,
there are no pre-conceived notions or ideas that are trying to be proven or
disproved. Instead of relying on the literature review to yield any possible
theories or prejudging where the research might go, grounded theory relies
on the data collected from the field to establish the premise (Leedy &
Ormrod, 2001). Grounded theory is meant to build theory rather than test
theory (Patton, 2002). This method also seeks multiple rounds of data

36
collection and the two fundamental characteristics are “constant comparison
of data with emerging categories and theoretical sampling of different groups
to maximize similarities and differences of information” (Creswell, 2003).
A strength of grounded theory is undoubtedly the absence of bias
going into the study. After all, if a researcher doesn’t have a predetermined
theory in his or her mind, there’s a significantly smaller possibility of leaning
one way or the other. In this respect, grounded theory allows the researcher
to see a wide open playing field and the data is allowed to direct the theory
building.
A possible weakness may be the inability of the researcher to draw the
appropriate conclusion or build the proper theory based on the data
collected.
The fact that this approach required multiple rounds of data collection
initially, made this method look less attractive, but since this study seeks to
understand, clarify, refine and propose, this method seemed to be somewhat
appropriate.
Hybrid Method
The chosen method is a hybrid between a phenomenological study and
a grounded theory study. This research required the presentation of first
hand experience of the participants. This first hand perspective is extremely
beneficial in understanding this topic. In addition, the ability to ask
immediate follow-up questions from the person who has the knowledge is
vital if the proper conclusions are to be drawn. While the literature
37
established a possible theoretical context, it did not provide any instances
applicable to the particular research and investigative questions. As a result,
the grounded theory aspect of being able to derive theory from data collected
is considered an enormous strength for this particular thesis topic. This
method also provides a great deal of flexibility to “see what the data says”
before committing a great deal of time and effort on the wrong aspect of the
research. Because of the questions being asked in this study, the
combination of these two methods seemed to be the ideal solution.
Methodology / Experimental Design
Firms in the air cargo arena were selected since they could be
construed as sufficiently similar to the Air Force is some respects that might
enable the study to gather information to address the investigative
questions. There are no civilian firms that fly fighter aircraft so it’s logical to
focus attention around aircraft such as the C-17 Globemaster, C-141
Starlifter and C-5 Galaxy. These are all jet powered, heavy aircraft designed
to move cargo over longer distances. Air cargo firms have operations similar
to the Air Force’s airlift operations with respect to the heavy aircraft, in that
the primary mission of both is to transport cargo versus passengers.
Commercial air cargo firms won’t fly the C-17, C-141 or the C-5, but rather
747’s, 727’s, MD-11’s, DC-9’s etc. The KC-10 Extender aircraft is an in-air
refueling platform for the military but it can also carry cargo. The
commercial firms would fly a near duplicate in the DC-10 aircraft, which is
the civilian version.

38
A search was made of air cargo firms that currently exist and a list was
drafted. The list contained firms discovered during the literature review
through a variety of public published sources as well as an internet search.
The population of interest was comprised of 20 air cargo firms with
operations sufficiently similar to the Air Force’s airlift operations. The list
was then trimmed down to 16 as four firms were removed from the
population; two firms for being in chapter 11 bankruptcy proceedings and
two firms for having been acquired by other air cargo firms. The researcher
attempted to contact all 16 firms that remained on the list. For those firms
that responded, a telephone interview was administered to strategic key
participants. The strategic key participants were chosen because of their
position and how it directly related to the costing function. The interviews
were conducted through exploratory, open-ended questions. The identities
of the firms and individuals contacted will remain anonymous per Protocol
04-14-E as approved by the Human Subject Review Board. As such, data
that would identify the subject, his/her company or product offerings would
not add value to the study, and its exclusion will not impede the analysis.

39
The results of contacting firms on the list breakout as follows:
1 firm said to “call back” at a specific date and time and then didn’t answer (later discovered to be in Bankruptcy proceedings)
1 firm was in Chapter 11 Bankruptcy proceedings
2 firms merged and were “too busy” with merger related issues to respond
4 firms claimed to have no allocations due to using “ACMI” (to be discussed later)
1 firm turned out to be a subsidiary of the firm in Chapter 11
2 firms had been acquired by other air cargo firms
2 firms were left messages but never returned the call
2 firms never answered
3 firms refused to participate
2 firms responded for a 10% response rate
20 – Total Firms
Participants were initially asked to:
(See Appendix B for Data Collection Instrument)
1. Identify the five most important costs for their respective firms. They
were then asked to rank order these five costs. Each cost was then
examined more closely.
2. The fundamental follow up question was; “What are the criteria for
making this (cost) important?” The objective was to understand the “why”
40
behind the specific cost being identified as important. Was it the highest
dollar value, a hard to get item, an item critical to operations, etc.
3. The next question asked was; “How is this cost assigned or allocated?”
The aim was to comprehend how the specific cost is tracked, whether the
cost is traced back to a specific activity or function, included in overhead,
seen as a variable cost, etc.
4. As a logical follow-on, the next question was; “How are the cost elements
assigned to individual services and transactions? Clearly, there is a cost to
fly a package from Denver to Atlanta, but that total cost isn’t charged to the
customer because it would be cost prohibitive. Somehow, the cost is shared
among all customers who have packages or cargo on board the aircraft. The
purpose of this question was to ascertain how that happens.
5. Subsequently, the participants were asked; “What is the result of
following this method or utilizing this technique?” The desired outcome was
to determine what is achieved or what is the yield to the firm, in other words,
to find out “why” they were using this method or technique.
6. Finally, the participants were asked to provide a weighting of the five cost
elements so the disparity between rankings could be discerned.
Data Sources / Format
The data sources are the literature review and interview responses.
Follow up interview and emails were utilized to yield additional information
but were primarily for clarification purposes.

41
Data Analysis
All data will be carefully reviewed. Initially, common threads were
sought. There was an expectation that a similar method or technique would
emerge as predominant as well as being successful, but that was not the
case. Similarities and differences were further explored in an attempt to gain
additional understanding. Then a determination was made as to whether a
model worked and why. Lastly, possible implications for the Air Force were
explored.
Data analysis is not complete until trust and confidence are addressed.
Table 7 was adapted from Lincoln & Guba by Isaac and Michael (1997) and
takes a look at the trust and confidence issues.
Table 7. Criteria for Establishing Trust and Confidence in Research Results
Lincoln & Guba as adapted by Isaac & Michael (1997)
Criteria for Establishing Trust and Confidence in Research Results
Conventional Research Naturalistic Research Internal Validity – Did variations in the Credibility – Will the methodology and its independent variable produce a change conduct produce findings that are believable in the dependent variable? and convincing? External Validity – Can the results of Transferability – To what other contextually this investigation be generalized to similar settings can these findings be applied? other settings? Reliability – Are the results consistent, Dependability – Within reasonable limits, repeatable, and predictable from one are the findings consistent with other study to another? similar studies? Objectivity – Are the events under study Confirmability – Are both the process and public and observable so as to allow the product of the data collection and agreement among investigators? analysis auditable by an outside party?

42
Each element will be addressed individually to ensure nothing is inadvertently
overlooked.
Internal Validity – The researcher remained cognizant of potential biases
and be aware of other explanations for the findings.
External Validity – That was not the intent of this study since it was meant
to be descriptive rather than prescriptive, but it is logical to conclude that
other air cargo firms would respond in a similar manner and it’s hopeful that
there might be some Air Force generalizability.
Reliability – Again, it is logical to conclude that other air cargo firms would
respond in a similar manner.
Objectivity – The identities of the respondents and their firms are
anonymous and therefore, not public. However, fellow investigators on this
study could easily reach the same conclusion. Interviews were audio taped
and data collections forms were utilized.
Credibility – The methodology asked open ended questions during a semi-
structured interview to enable a free flow of information and ideas. As a
result, if another researcher asked the same questions in the same manner,
he or she should obtain similar results.

43
Transferability – The intent of this study was to be descriptive rather than
prescriptive, however, there may some implications for the Air Force.
Dependability – The literature review yielded no similar studies,
nevertheless, it is reasonable to suppose a similar study, or a follow-on
study, conducted in the future may produce comparable results.
Confirmability – The process is certainly auditable by an outside party, but
since the identities of the respondents and their firms are anonymous, the
product of the data collection (otherwise known as the data) is not.
However, the audio tapes and the data collection forms are still on file with
the researcher.
Overview
This chapter clearly defined the problem, described the methodology
that was used to test these hypotheses, discussed how the data was
collected and finally, looked at data analysis to include trust and confidence.
Chapter Four will present the data and summarize the raw results. It will
then discuss an analysis and interpretation of the data.

44
IV. Analysis
Chapter Three described the methodology that was used to test the
hypotheses set forth in Chapter Two. This chapter will present the data and
summarize the raw results. It will then discuss an analysis and interpretation
of the data.
Findings
The literature review revealed the following costing issues (see Table 8
below) along with the method mostly likely to solve or address the issue.
The methods were also discussed during the literature review phase in
Chapter Two.
Table 8. Issues and Methods From the Literature
Issues Method
Lack of Clarity Activity Based Costing (ABC)
Lack of Credibility of the Costing System ABC
Lack of Accurate Costing Data for Decision Making ABC
Variability ABC
Information Sharing Kaizen Costing & Target
Costing
Absorption Costing Traditional Cost Accounting
Supply Chain Costing ABC Transfer Costing ABC Competition Target Costing Cost/Price Reduction ABC Overhead/Indirect Cost Allocation ABC Overhead Creep ABC
Selecting Suppliers Based Solely on Price Target Costing
Target Costing

45
Air Force
The Air Force has identified certain costs as important by virtue of
including them in their CPFH calculation. The factors are listed in Table 9
below.
Table 9. Air Force Cost Per Flying Hour Factors
Issues Air Force Method
Cost Per Flying Hour: comprised of AVFuel, SSD, GSD & DLRs
Major Issue--used to develop
realistic estimate CPFH Model
Aviation Fuel (AVFuel) Used to develop realistic estimate
CPFH Factor
Consumable Supplies: comprised of SSD & GSD
System Support Division (SSD) Used to develop realistic estimate
CPFH Factor
General Support Division (GSD) Used to develop realistic estimate
CPFH Factor
Depot Level Reparables (DLRs) Used to develop realistic estimate
CPFH Factor
Maintenance Significant
expenditure
Included as logistical cost factor to calculate total flying hour cost
Crew Costs / Payroll
Fixed Cost - Utilized for
reimbursement outside USAF
Dependent upon crew members rank and
time in service
The primary number that serves as a baseline in the Air Force is Cost
Per Flying Hour (CPFH). Since the Air Force flies multiple airframes, CPFH is
calculated by aircraft type, and the Air Force utilizes four factors to calculate
a baseline rate using the most recent numbers for obligations and flying
hours. The four factors are listed below:

46
1. System Support Division (SSD) – disposable aircraft parts, antennas,
lights, wiring, windshields, etc.
2. General Support Division (GSD) – other expendable items which
include common bench stock items, administrative supplies, tools, etc.
3. Depot Level Reparables (DLRs) – aircraft parts removed by wing
maintenance personnel and sent to depots for repair.
4. Aviation Fuel (AVFuel) –Fuel used during flight, which typically includes
JP-4, JP-8, off-station fuel and in-flight refueling. The AVFuel factor is
expressed in gallons per hour, which is converted into a dollar per hour
factor based on DoD established prices for each fuel type.
(Rose, 1997)
Numbers one and two fall under a broader category called Consumable
Supplies, so at times, CPFH may be referred to as having three categories
instead of four. Contractor Logistics Support and Crew costs are added to
calculate a reimbursable CPFH.
Results
Interviews were conducted via the telephone and questions were
asked in the same order for all respondents. The interview method using the
phenomenological approach was invaluable as first hand experience was
collected and immediate follow-up clarification questions could be asked.

47
Firm A
The first interview question asked of respondent A was, “What are
the five most important costs for this firm?” This was immediately
followed up with, “How would you rank order these five items?” The
costs and respective rankings are listed in Table 10. The responses for Air
Cargo Firm A are below.
Table 10. Firm A Ranking
Each item was then taken individually and given additional attention.
There were five additional questions asked regarding each item. The
questions and responses are below. Responses are summarized.
1. Fuel
What are the criteria for making this important?
Fuel is the most expensive and volatile operating cost.
How is this cost assigned or allocated?
The cost is allocated by pegging* the fuel price in contracts. The goal is to
limit as much exposure as possible.
*Fuel prices are expected to rise and fall, but a starting point must be established when the contract is written. As a result, fuel is pegged at a particular price that is agreed to by both parties.
Importance Cost Category 1 Fuel 2 Maintenance - Heavy 3 Flight Ops - Crew Costs 4 Insurance 5 Depreciation

48
How are the cost elements assigned to individual services and
transactions?
The cost is then reconciled at the end of a certain period and price is
adjusted accordingly.
What is the result of following this method or utilizing this
technique?
Pegging allows the firm to limit their exposure on the volatility of fuel prices.
How would you characterize the success of utilizing this technique?
This method is very successful as far as limiting exposure, but the firm
essentially pays a fixed price. The firm is limited on the upside exposure, but
they don’t benefit when fuel prices are down. When fuel prices are down,
they are paying above market rate for fuel. (Although this firm doesn’t,
many large airlines hedge their fuel exposure by trading barrels of oil on the
futures market.)
2. Maintenance – Heavy
What are the criteria for making this important?
Maintenance is the second most expensive operating cost. How is this cost assigned or allocated?
Maintenance is a variable cost in the firm’s costing model. How are the cost elements assigned to individual services and
transactions?

49
The cost are broken down into a per flight hour rate by adding up all the
maintenance expenses and dividing that figure by the total number of flight
hours. This generates a per flight hour rate based on aircraft type. This is
then charged back to the customer based on the utilization of a specific
contract.
What is the result of following this method or utilizing this
technique?
The intent is to recover all maintenance costs. This difficulty is that since it
is a variable cost, recovery of costs is dependent upon utilization. For
instance, a “C” check is a type of heavy maintenance check and is good for
5,000 hours or 24 months, which ever comes first. If the aircraft only has
2,000 hours of usage during 24 months, the full cost of the “C” check would
not be recovered.
How would you characterize the success of utilizing this technique?
This method could be more effective, because the pricing of maintenance is
based on historical costs. It is very difficult to predict the future cost of
maintenance. The largest cost within maintenance is engine overhauls. To
limit the firm’s exposure on engine costs, they have implemented fixed prices
on overhauls with many of their vendors. The heavy checks are the big
drivers in maintenance costs and they vary significantly from check to check.
Allocating against aircraft types also makes it easier to identify trends.

50
3. Flight Operations (Crew Costs)
What are the criteria for making this important?
Highest labor function of all cost and includes pilots, first officers and flight engineers. How is this cost assigned or allocated?
Costs are allocated as fixed costs in the costing model. How are the cost elements assigned to individual services and
transactions?
The costs are assigned based on the number of crews required with the given
utilization. The costing number is based on the average salary of the crews.
What is the result of following this method or utilizing this
technique?
In the aggregate, the cost of the crews is recovered. On individual
segments, depending on the seniority of the crews, there is a possibility of
coming out ahead or behind. A contingency is built in by multiplying the
number of required crews by a factor. If may not always be needed, but in
the aggregate, it balances out.
How would you characterize the success of utilizing this technique?
This method is very successful most of the time. However, if there are
delays for any given reason, the crew costs are the first to suffer. Since crew
costs are in the fixed portion of the costing model, crews costs are a function
of utilization. There is a direct benefit with higher utilization of crews.

51
4. Insurance
What are the criteria for making this important?
Insurance costs are important because it is a cost that can be compared
directly with competitors.
How is this cost assigned or allocated?
Insurance costs are allocated by taking the total amount of insurance
premiums and applying a given percentage to a specific aircraft type.
How are the cost elements assigned to individual services and
transactions?
Insurance is in the fixed portion of the costing model. Premiums are paid
based on aircraft values, not flight activity. Therefore there is a greater
benefit with higher utilization.
What is the result of following this method or utilizing this
technique?
Insurance costs are covered if a given utilization is reached.
How would you characterize the success of utilizing this technique?
This method is successful if utilization assumptions are reached. Since it is
based on utilization, there is exposure on both sides, positive and negative.

52
5. Depreciation
What are the criteria for making this important?
This is a significant cost, because it is based on the book values of aircraft.
This is, however, not a cash cost.
How is this cost assigned or allocated?
Like insurance, depreciation is allocated by taking the total amount of
depreciation, then applying a given percentage to a specific aircraft type.
How are the cost elements assigned to individual services and
transactions?
Depreciation is also a fixed cost in the costing model, so there is a benefit
from high utilization.
What is the result of following this method or utilizing this
technique?
Depreciation costs are recovered if a given utilization is reached.
How would you characterize the success of utilizing this technique?
Like insurance, the method is successful if utilization assumptions are
reached.
Respondents were then asked to weight their five most important
costs with respect to how much time and/or attention was routinely
dedicated to the cost. The weighting was on a scale from one to ten with ten
being the most time and/or attention and one being the least. The results
are listed in Table 11.

53
Table 11. Firm A Weighting
Importance Cost Category Weighting
1 Fuel 10 out of 10
2 Maintenance - Heavy 8 out of 10
3 Flight Ops - Crew Costs 7 out of 10
4 Insurance 3 out of 10
5 Depreciation 5 out of 10
Firm B
The first interview question asked of respondent B was, “What are
the five most important costs for this firm?” This was immediately
followed up with, “How would you rank order these five items?” The
costs and respective rankings are listed in Table 12. The responses for Air
Cargo Firm B are below.
Table 12. Firm B Ranking
Importance Cost Category 1 Maintenance - Heavy 2 Payroll 3 Maintenance - Routine 4 Servicing Costs
5 Fuel
Each item was then taken individually and given additional attention.
There were five additional questions asked regarding each item. The
questions and responses are below.

54
1. Maintenance - Heavy
What are the criteria for making this important?
Heavy maintenance was chosen due to its high dollar value. Heavy
maintenance is a significant expenditure.
How is this cost assigned or allocated?
The cost is assigned by aircraft tail number or by specific engine number.
How are the cost elements assigned to individual services and
transactions?
The cost is allocated to individual services and transactions according to the
contract that aircraft are flying for, or by the number of flight hours utilized.
What is the result of following this method or utilizing this
technique?
This method helps to understand the profitability issue more clearly.
How would you characterize the success of utilizing this technique?
This method is very successful with respect to tracking usage against
scheduled heavy maintenance checks because the costs are directly
attributable to an indicated aircraft tail number.
2. Payroll
What are the criteria for making this important?

55
Payroll is also a high dollar value cost and it’s extremely important from a
productivity standpoint. Pilots get paid whether they sit in the office or the
cockpit so it’s imperative that a level of efficiency is achieved that, in turn,
ensures productivity.
How is this cost assigned or allocated?
Payroll allocation is handled in a two-fold manner. First, aircrew salaries are
allocated by the number of crews required per contract. Maintenance and
technical services personnel are also allocated against specific contracts.
Secondly, support personnel (finance, human resources, information
technology and executive committee members) are assigned or allocated
across the aircraft flown.
How are the cost elements assigned to individual services and
transactions?
The aircrew, maintenance and technical services personnel are charged
based on the utilization of a specific contract. The support personnel payroll
is split by stations based on a percentage. Finance speaks to the station
managers at least once a quarter to determine the applicable percentages.
This percentage is either the number of flights processed or the percentage
of aircraft assigned to that station that support a specific contract, whichever
turns out to be a more accurate split.
What is the result of following this method or utilizing this
technique?

56
The technique aids in the understanding of profitability, whether that is the
profitability of a specific contract or an aircraft type. For instance, it might
shed light on a different way to schedule crews or routes that is more
effective or productive.
How would you characterize the success of utilizing this technique?
This method could be more effective, because average salary numbers are
utilized for calculations, yet crews have a wide range of possible salaries. If
a junior aircrew flies, the profit is higher and if a more expensive senior crew
flies, the profit drops.
3. Maintenance - Routine
What are the criteria for making this important?
This cost’s variability, expense and risk caused it’s placement as number
three. Routine maintenance on a forty year old aircraft could yield
unexpected and expensive repairs.
How is this cost assigned or allocated?
Costs are allocated by aircraft tail number. How are the cost elements assigned to individual services and
transactions?
The costs are assigned based on the specific contract that the tail number
flew against.
57
What is the result of following this method or utilizing this
technique?
Once again, the result focuses on profitability. It illustrates the overall
maintenance expense associated with an aircraft by plainly showing the
number of events and the exact dollars associated with a particular aircraft.
This further helps make decisions about whether to keep an aircraft or turn it
back in if it’s leased.
How would you characterize the success of utilizing this technique?
This method is successful and allows a better understanding of an aircrafts
history so decisions about its future can be made more quickly.
4. Servicing Costs
What are the criteria for making this important?
Variability is one of the bigger reasons why this cost is important. Surprises
often crop up in this area and they are hard to predict and track. Late
invoices are also an important issue in this area.
How is this cost assigned or allocated?
These costs are allocated by specific contract.
How are the cost elements assigned to individual services and
transactions?
Again, these costs are assigned by to the customer through specific
contracts.
58
What is the result of following this method or utilizing this
technique?
This method helped get a handle on total costs.
How would you characterize the success of utilizing this technique?
This method is mostly successful but there are still going to be surprises
which can’t be predicted and will continue to be difficult to track. Late
invoices still arrive from an overseas servicing point, sometimes four or five
months after the fact, which puts the expense in a different reporting period.
Assigning this cost back to a specific contract makes it easier to get
reimbursed, even if the invoice is late.
5. Fuel
What are the criteria for making this important?
This is a significant cost because it is the largest single expense. Despite
being the largest expense, it was listed as number five because it is the
easiest to track precisely.
How is this cost assigned or allocated?
This cost is allocated at the route level. There is tracking software that can
determine how much fuel should be used by flight, how much was uplifted
and does this in a very timely manner. This is then charged back to the
customer or a specific contract.
How are the cost elements assigned to individual services and
transactions?

59
Charged back to the customer or a specific contract.
What is the result of following this method or utilizing this
technique?
It provides a true cost per customer or per a contract, by route and by
aircraft. Furthermore, this aides with future pricing.
How would you characterize the success of utilizing this technique?
Very successful. There are never any surprises with fuel.
Respondents were then asked to weight their five most important
costs with respect to how much time and/or attention was routinely
dedicated to the cost. The weighting was on a scale from one to ten with ten
being the most time and/or attention and one being the least. The results
are below in Table 13.
Table 13. Firm B Weighting
Importance Cost Category Weighting
1 Maintenance - Heavy 8 out of 10 2 Payroll 5 out of 10 3 Maintenance - Routine 7 out of 10
4 Servicing Costs 6 out of 10
5 Fuel 3 out of 10

60
Summary
At first glance, there appear to be some similarities and some
differences in the responses. The data analysis section will explore these
further as well as address unanticipated findings and confounds to inference.
A summary of issues is listed in Table 14.
Table 14. Respondent's Cost Issues & Methods
Issues Respondents Method
Cost Per Flying Hour: comprised of AVFuel, SSD, GSD & DLRs
Used as benchmark for comparison
Split by fuel and maintenance
Aviation Fuel (AVFuel) One of the top five issues identified
Tracking software & pegging price to limit
exposure
Depot Level Reparables (DLRs)
Included with broader
maintenance category
Dependent on minimum aircraft utilization rate
Maintenance Major Issue Dependent on minimum aircraft utilization rate
Insurance Important as comparison to competitors
Dependent on minimum aircraft utilization rate
Depreciation Based on book
values of aircraft Dependent on minimum aircraft utilization rate
Crew Costs / Payroll Major Issue
Fixed cost dependent on utilization rate & allocating against
contracts
Servicing Costs Major Issue due to
variability Allocated against specific
contract
Data Analysis
Both firms shared three cost categories in their top five most
important costs. While it may be safe to assume the majority of firms in the
air cargo arena share many of the same cost types, it’s interesting to note

61
how their viewed by the respective firm. Figure 3 shows the divergent
viewpoints, with fuel having the greatest deviation.
Figure 3. Top Five Most Important Costs Comparison
Air Cargo Firm A 1 Fuel 2 Maintenance - Heavy 3 Flight Ops - Crew Costs 4 Insurance 5 Depreciation
Fuel is listed by both firms as one of their five most important costs.
Firm A listed it as number one while firm B listed it as number five. A closer
look reveals that firm A listed it as it’s most expensive and volatile operating
cost while firm B merely listed is as it’s most expensive cost. Firm B seems
to have removed the volatility from this cost and they boldly stated that this
cost is considered to be low risk and does not include many surprises. This
was attributed to the tracking software they utilized that accurately
calculated fuel required and then compared that to actual fuel uplifted in a
timely manner. In addition, if fuel prices rise above the pegged price stated
in the contract, the difference is charged to the customer. If fuel prices drop
below the pegged price, the customer is reimbursed.
Maintenance is the next issue listed by both firms, however firm B split
maintenance into heavy and routine with heavy listed as their number one
important cost. Heavy maintenance includes engine overhauls which are
Air Cargo Firm B 1 Maintenance - Heavy 2 Payroll 3 Maintenance - Routine 4 Servicing Costs 5 Fuel

62
very costly. Firm A wisely outsourced this function and negotiated fixed
prices with their vendors. During the interview, firm A also indicated that
post September 11th, as demand dropped dramatically, many aircraft across
the industry were parked. This resulted in excess engine availability on the
market. Firm A took advantage of this opportunity and leased many of these
engines at an hourly rate. The outcome was a significant savings because it
was more cost effective to run the new engines at the lower economical rate
than performing heavy maintenance checks on certain airframes. Overall,
this demonstrates a flexibility of firm A to quickly respond to changes in the
market or industry.
The last issue shared by both dealt with compensation. Firm A listed
crew costs as number three while firm B listed the broader category of
payroll as number two. Both firms, however, focused on crew costs or the
cost of pilots, first officers and flight engineers and the largest expenditures
within this category. Both seem to have addressed the issue satisfactorily
but feel there is room for improvement. The main problem is the inability to
get exact calculations when estimating costs due to the wide range of
seniority and associated pay scales of crew members. This means average
crew costs have to be used and the actual numbers will almost always be
higher or lower, but rarely on target.
Figure 15 adds the weightings these firms gave to the three shared
cost categories. The ranks and the weightings are within one or two of each
other with the glaring exception of fuel which is highlighted.

63
Table 15. Cost Element Ranking and Weighting
Firm A Cost
Firm B
Weight Rank Element Rank Weight
10 1 Fuel 5 3
8 2 Maintenance 1 & 3 8 & 7
7 3 Payroll/Crew Costs 2 5
The analysis would conclude that although this specific cost is common
to both firms, how it’s handled, allocated or tracked plays a significant role is
how it is viewed by the firm. In other words, the better a cost can be
controlled, the less of a problem it presents. If some or all of the variability
is taken out of the equation, it becomes easier to predict the behavior of that
cost and, ultimately, estimate it far more accurately.
The analysis may also indicate that since firm A didn’t list servicing
costs in their top five, they may have discovered and implemented a method
for controlling this cost. Again, if it’s controlled effectively, it may not require
as much attention and, as a result, moves down the priority list so
management has the opportunity to focus on the remaining costs that don’t
enjoy a firm level of control.
Insurance and depreciation are the remaining costs identified in this
study. To a great extent, these costs can be seen as predetermined and
non-variable. Over time insurance may vary but the point is that the firm
can’t actually do anything to significantly change these two costs.
Depreciation is dictated by accounting standards and tax code and can’t be

64
altered to make the numbers come out a different way. The implication here
is that if all other costs are optimized efficiently, a firm can’t look to
insurance and depreciation as a way to increase efficiency or generate a
greater return. Consequently, firm A strives to ensure these costs are
covered up front. They’ve determined that maintaining a certain utilization
rate will ensure the costs are covered. As long as an aircraft is flying, it
generates revenue. However, unlike fuel, whether an aircraft is flying or
parked, insurance and depreciation are still an issue.
An unanticipated finding was the use of ACMI by four of the firms
contacted. ACMI stands for Aircraft, Crew, Maintenance and Insurance.
ACMI was never found in the literature review, nor did it emerge during the
interviews conducted with firms A and B. It was explained by a firm that
chose not to respond that when a customer wants to charter an aircraft or
simply move cargo, they are charged ACMI. As a result, the firms claim
there are no indirect costs to allocate or trace. This appears to be an
industry-specific, practitioner-developed method that assigns intermediate
cost categories to the four listed as components of ACMI. Even if broad
assumptions are made, such as every single expense related to an aircraft
(fuel, depreciation, servicing costs) are included under Aircraft and all
expenses related to maintenance (parts, labor, facilities at the maintenance
station) are included under Maintenance, that still doesn’t account for the
salary of the CEO or the information technology worker or the customer
service representative that answers the phone. It is the researcher’s belief
that ACMI, while utilized to some extent to control costing, was exploited as

65
a reason not to participate in the study. This allowed a potential respondent
to opt out without refusing to cooperate, but rather, as an excuse that they
had no control over.
Overall Comparison
An overall comparison was made between the Air Force, the Literature
review and the commercial air cargo firms. The results were compiled into
Table 16 located on the following page. The shaded areas illustrate known
gaps in and amongst the three domains identified which are the; Air Force,
Literature (theory) and data collected from the Respondents. The table also
identifies some differences and similarities among the three domains. These
will be addressed below the Table.

66
Table 16. Summary of Overall Comparison
Issues Air Force Method Literature Method Respondents Method
Cost Per Flying Hour: comprised of AVFuel,
SSD, GSD & DLRs
Major Issue--used to develop realistic
estimateCPFH Model
Used as benchmark for comparison
Split by fuel and maintenance
Aviation Fuel (AVFuel)Used to develop realistic estimate
CPFH FactorOne of the top five issues identified
Tracking software & pegging price to
limit exposure
Consumable Supplies: comprised of SSD & GSD
Used to develop realistic estimate
CPFH Factor
System Support Division (SSD)
Used to develop realistic estimate
CPFH Factor
General Support Division (GSD)
Used to develop realistic estimate
CPFH Factor
Depot Level Reparables (DLRs)
Used to develop realistic estimate
CPFH FactorIncluded with broader maintenance category
Dependent on minimum aircraft
utilization rate
Maintenance Significant expenditure
Included as logistical cost factor
to calculate total flying hour cost
Major IssueDependent on
minimum aircraft utilization rate
Lack of Clarity IdentifiedActivity Based Costing (ABC)
Lack of Credibility of the Costing System
Identified ABC
Lack of Accurate Costing Data for Decision Making
Identified ABC
Variability Identified ABC
Information Sharing IdentifiedKaizen Costing & Target Costing
Absorption Costing IdentifiedTraditional Cost
AccountingSupply Chain Costing Identified ABCTransfer Costing Identified ABCCompetition Identified Target CostingCost/Price Reduction Identified ABCOverhead/Indirect Cost Allocation
Identified ABC
Overhead Creep Identified ABCSelecting Suppliers Based Solely on Price
Identified Target Costing
Target Costing Identified
InsuranceGovernment is a self
insurerNot a factor
Important as comparison to competitors
Dependent on minimum aircraft
utilization rate
Depreciation
Government doesn't pay taxes so
depreciation is irrelevant
Not a factorBased on book values
of aircraft
Dependent on minimum aircraft
utilization rate
Crew Costs / Payroll Fixed CostDependent upon
crew members rank and time in service
Major Issue
Fixed cost dependent on
utilization rate & allocating against
contracts
Servicing CostsMajor Issue due to
variabilityAllocated against specific contract

67
For the sake of simplicity, the three domains will be Air Force (USAF),
Literature (Theory) and data collected from respondents (Civilian).
Similarities
Theory – USAF
Unfortunately, the Literature review didn’t really do much with regards
to identifying cost issues and methods for the Air Force. Not one of the
issues or methods were found in or used by the Air Force. In essence, there
was no overlap between the two domains.
Theory – Civilian
Although the Literature review dealt primarily with civilian business
entities, there was no overlap here either. While being interviewed, the
respondents never mentioned any of the cost issues or methods identified by
the Literature as being pertinent.
USAF – Civilian
Overlap was discovered in a number of areas. First was CPFH where
both utilized it as a benchmark for comparison. The respondents per hour
figures, however, weren’t quite the same. For instance, the Air Force
included the four factors listed previously; AVFuel, SSD, GSD and DLRs.
When calculating reimbursement rates, the Air Force also adds in Contractor
Logistics Support and crew costs. The respondents, on the other hand, used
a per flying hour factor for fuel and another for maintenance.

68
Crew costs were also an area where overlap was found. Both realize
it’s a fixed cost but there’s a much greater impact to the respondents who
must ensure crew costs as well as the broader category of payroll, is covered
by revenue generated from operations. The Air Force doesn’t worry about
this since a different pot of money provides pay and allowances for its
members.
Lastly, maintenance was a shared issue. Maintenance is a significant
cost for the Air Force and for the respondents. Both are attempting to
control their respective costs and streamline efficiencies. Both are also
facing rising maintenance costs associated with aging aircraft in the fleet.
Differences
Theory – USAF
The differences demonstrated here were glaring. Not one item
matched up or overlapped. It’s clear that the Air Force is not representative
of firms or organizations found in the Literature review.
Theory – Civilian
While the researcher anticipated there would be more similarities
between the Literature and the respondents, he was surprised to see none.
There is a large gap between the issues and methods identified in the
Literature and what the respondents firms were experiencing.

69
USAF – Civilian
The two differences that stand out are Insurance and Depreciation.
While these were important issues for the respondents, they are irrelevant
for the Air Force. The federal government (to include the Air Force) is a self-
insurer so this is not a cost issue for the Air Force. Depreciation is a function
of the accounting standards and the tax code. Since the Air Force doesn’t
pay taxes, depreciation is a moot point.
From the chart, it may appear there are other differences such as
servicing costs, SSD and GSD but while the Air Force has servicing costs it
most likely rolls them up in the broader category of Consumable Supplies.
Chapter Overview
Chapter Four presented the data collected from the field and analyzed
that data. This chapter provided insight into the ways air cargo firms view
their important costs and how they account for or allocate them. Plainly,
there are differing opinions on how certain costs should be viewed or
handled. Chapter Five will draw conclusions, seek implications for the Air
Force and make recommendations for future research.

70
V. Discussion, Conclusions and Recommendations
Chapter Four presented the data collected from the field and analyzed
that data. It also provided insight into the ways air cargo firms view their
important costs and how they account for or allocate them. This chapter will
draw conclusions, seek implications for the Air Force and make
recommendations for future research as well as answer the research and
investigative questions.
Research Questions
1. What costing techniques are currently being utilized by air cargo carriers
and why?
It turned out that none of the costing techniques found in the
Literature were identified by the respondents. They prefer a ‘per flying hour’
technique to get a better understanding of how costs and revenue offset each
other. For instance, they utilize a per flying hour to understand fuel and
maintenance expenditures.
2. What are the possible implications for the Air Force?
The Air Force currently utilizes a much more comprehensive CPFH cost
model to calculate it’s cost per flying hour rate, and in turn, utilizes this rate
for future budgeting and estimation purposes.
Investigative Questions
1. What costing techniques are currently available?

71
While the Literature identified ABC, Kaizen Costing, Target Costing,
Traditional Cost Accounting, Direct Product Profitability, Efficient Consumer
Reporting, Supply Chain Costing, Throughput Account and Total Cost of
Ownership, none of these were identified as current techniques utilized by
the respondents. The respondents preferred a per flying hour method of
allocating costs and the Air Force prefers a comprehensive CPFH model.
2. What are the key issues in transportation service costing?
Clearly it’s fuel and maintenance. These two costs were shared by the
Air Force and the respondents. Crew costs, servicing costs, insurance and
depreciation are issues for the respondents. Crew costs are also important
to the Air Force when calculating a reimbursement rate.
3. What are the transportation service costing issues faced by air cargo
carriers?
Reaching a minimum utilization rate to ensure enough revenue is
generated to cover costs. Again, fuel is a significant issue mainly because of
the magnitude of the expenditure as well as the volatility of the price.
4. How do these firms address those issues?
Through the use of a per flying hour breakdown to better understand
their costs either by contract or by airframe.
5. Why are these issues addressed that way?
Firm B sees each contract as a profit center so they want to ensure
that profit is being made on every contract. Firm A see every aircraft or
airframe type (e.g., 747-400’s) as a profit center and when all 747-400 total
maintenance costs are divided across total flight hours, they have a fairly

72
accurate idea if it’s time to turn that airframe back in, if it’s leased, and
obtain something newer or more efficient.
6. What is the relevance to the Air Force of these issues and how they’re
addressed?
The primary relevance would be the flexibility and speed with which a
civilian firm can respond to market changes or opportunities. The Air Force
has the added constraint of being restricted by the appropriated fund
budgeting process where requests have to be submitted far in advance and
this precludes the Air Force from being able to swiftly seize opportunities.
For example, post September 11th, demand for charter aircraft (cargo and
passenger) dropped dramatically. Aircraft across the industry were parked
and this resulted in excess engine availability. Since engines are extremely
expensive, Firm A was able to avail itself of the excess in a buyers market
and they are still reaping those benefits today. It would be very difficult for
the Air Force to come up with a few extra hundred million dollars if an
opportunity presented itself.
Conclusions and Recommendations
Managerial Implications
After reviewing Chapter Four, the main conclusion comes from seeing
how the firms perceived their respective costs and how those perspectives
differed. For instance, fuel received a great deal of attention since both firms

73
viewed it so differently. While this specific cost is common to all firms that
utilize aircraft in the accomplishment of their mission, how the cost is
allocated or tracked plays a significant role is how it is viewed by the firm.
Firm B ranked it lower and gave it a lower weighting as well. The reasonable
conclusion is that Firm B is able to better control this cost, most likely
through the use of their tracking software. They indicated that a great deal
of time and attention is not required to manage fuel costs and there are
rarely surprises in this area. Clearly, the better a cost can be controlled, the
less of a variability it presents. Once variability is removed or mitigated, it
becomes easier to predict the behavior of that cost more accurately. If the
cost can be estimated more accurately, it moves down the priority list and
less time/attention is devoted to it.
The fact that Firm A didn’t list servicing costs in their top five indicates
they may have instituted a method for manipulating and effectively
controlling this cost, similar to what Firm B has been able to accomplish with
fuel costs. Management will constantly be forced to focus on costs that
aren’t controlled effectively because they will otherwise add unwanted
variability. Stability is always favored over variability when it comes to cost
because it allows cost to be estimated more easily and accurately. As a
result, firms will evidently prefer a cost that is more direct or at least unit
variable. For instance, the longer the flight, the more fuel is burned so
although fuel is variable, it is directly related to something that is
controllable, in this case, time or distance. The goal then would be to take

74
all variable and indirect costs and make them more direct or unit variable
through allocation methods.
Figure 4 below demonstrates the desired shift to increased
controllability. Table 17 on the following page contains cost type definitions
to further explain the elements mentioned in Figure 4.
DESIRED COST MOVEMENT
Non-Unit Variable Unit Variable
Indirect
Direct
Figure 4. Desired Cost Movement
Least Desired: Most difficult to track
and allocate CEO Salary
More Desired: Easier to allocate against unit
being measured Landing Fees
More Desired: Easier to allocate against cost driver being measured
Direct labor: aircraft engine
mechanic hourly rate
Most Desired: Easiest to track and allocate
Fuel cost to fly from point A to B
Desired Movement

75
Table 17. Cost Definitions (Blocher, Chen & Lin, 2002)
Non-unit variable cost Unit variable cost
Not directly traceable to the specific labor or materials associated with a single unit of goods sold. Unit variable cost can include general overhead.
Directly traceable to the specific labor or materials associated with a single unit of goods sold. Unit variable cost does not include general overhead.
Indirect cost Direct Costs
Incurred for a common or joint purpose and therefore cannot be identified readily and specifically with a particular sponsored project or instructional activity, or any other institutional activity.
Can be identified specifically with a particular sponsored project, an instructional activity, or any other institutional activity, or that can be directly assigned to such activities relatively easily with a high degree of accuracy.
COST DEFINITIONS
As soon as costs are more effectively controlled, management can
return its focus to the strategic vision rather than the tactical problems that
drain resources and attention away from the bigger picture. It becomes
difficult to “grow” the firm when time is spent either reacting to problems or
seeking to get control of variables and costs.
Insurance and depreciation were listed by Firm A but not Firm B. This
is yet another instance where Firm B may have established a more effective
way of controlling these costs despite the fact that to a great extent, these
costs can be seen as predetermined and non-variable. Or perhaps Firm B
realizes that they can’t actually do anything to significantly change these two

76
costs, so they incorporate them into a cost model and turn their focus
elsewhere.
This brings up the remaining two costs; maintenance and
compensation (comprised of crew costs for Firm A and the broader category
of payroll for Firm B). Since both firms viewed these costs fairly evenly, the
resounding conclusion is these two costs still have room for vast
improvement. In other words, neither firm has ascertained the ideal method
to control the variability inherent to these two costs. Both are large
expenditures and directly impact the bottom line. For commercial firms, they
can impact profit. For organizations such as the Air Force, it can directly
impact mission accomplishment. Although compensation, or pay, is allocated
differently in the military, maintenance cost is an area wide open for
improvement. A limited amount of appropriated fund dollars are allocated
each fiscal year and if those dollars aren’t managed efficiently, it could leave
the Air Force short of spare parts or mission ready aircraft. In much the
same way both air cargo firms were concerned with heavy checks related to
maintenance, the Air Force is concerned with it’s version called depot
maintenance. While aircraft are undergoing this type of in depth
maintenance they are unavailable to generate revenue or accomplish the
mission. This is unmistakably an area that requires further study.
From a broader standpoint, managers in the Air Force don’t need to
contemplate how to deal with cost elements like depreciation or insurance.
The salaries for pilots, co-pilots, flight engineers, navigators and loadmasters
come from a different pot of money and are based on rank and time-in-

77
service, which the Air Force can’t necessarily control. That leaves fuel and
maintenance as costs that can be further controlled to realize efficiencies.
Limitations It’s important to note that the air cargo firms that responded shared
two characteristics. They shared a common market segment and both
enjoyed a flow of senior executives drawn from a certain customer base.
This cross flow of executives provided an expertise that afforded a deeper
understanding of the market segment.
Future Research
Determine if the Air Force could benefit from some type of tracking
software, similar to Firm B, to manage its fuel costs.
Study ACMI in greater detail to ascertain if there are any costing
efficiencies available for the Air Force when they contract for
commercial airlift efforts.
If a similar topic is studied in the future, a different perspective on the
Literature needs to be conceptualized since this Literature review
appeared to illustrate more gaps than linkages.
Focus a study specifically on maintenance costs to gain a more
thorough understanding of how to better control those costs.
Or
Locate the commercial firm that has maximized its maintenance cost
controls to see if those techniques might benefit the Air Force.
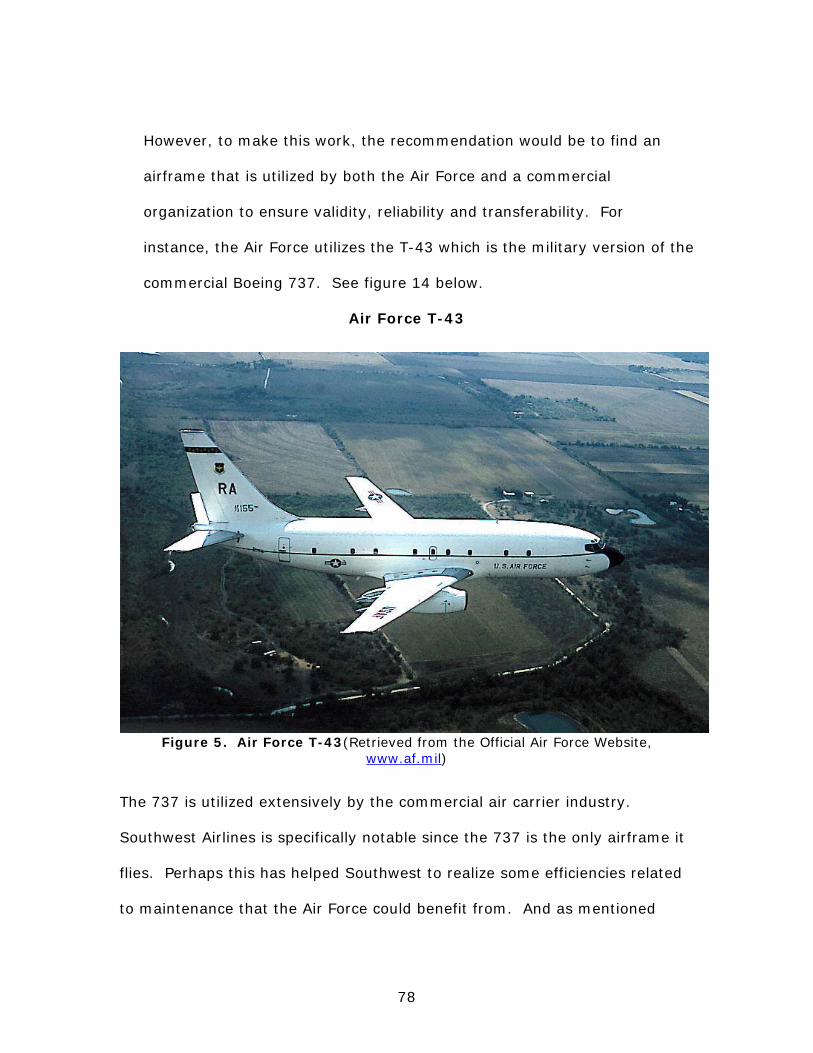
78
However, to make this work, the recommendation would be to find an
airframe that is utilized by both the Air Force and a commercial
organization to ensure validity, reliability and transferability. For
instance, the Air Force utilizes the T-43 which is the military version of the
commercial Boeing 737. See figure 14 below.
Air Force T-43
Figure 5. Air Force T-43(Retrieved from the Official Air Force Website, www.af.mil)
The 737 is utilized extensively by the commercial air carrier industry.
Southwest Airlines is specifically notable since the 737 is the only airframe it
flies. Perhaps this has helped Southwest to realize some efficiencies related
to maintenance that the Air Force could benefit from. And as mentioned

79
previously in Chapter Three, the Air Force’s KC-10 Extender is very similar to
the civilian version known as the DC-10.
Overview
The purpose of this chapter was to draw conclusions, seek implications
for the Air Force and make recommendations for future research. From the
broader standpoint, when costs can be controlled and their variability
successfully mitigated, future estimating becomes easier and more accurate.
Maintenance costs emerged as a common arena that the Air Force shares
with the commercial carriers. The air cargo firms interviewed indicated that
maintenance ranks high on their list of important costs and requires a great
deal of their time and attention. Maintenance costs need to be studied at a
more in depth level to discover possible methods or techniques to control this
cost more efficiently and effectively.

80
Appendix A: Definition of Terms ABC – Activity Based Costing; a technique which involves tracing overhead
and direct costs back to specific products and services.
AF/IL-I - The Air Force’s Supply Chain Integration & Logistics
Transformation Office
AFCAIG – The Air Force Cost Analysis Improvement Group
AFMC – Air Force Material Command headquartered at Wright-Patterson Air
Force Base near Dayton, Ohio. The command conducts research,
development, test and evaluation, and provides acquisition management
services and logistics support necessary to keep Air Force weapons systems
at a pre-determined state of readiness.
ALC – Air Logistics Center: provides worldwide engineering, logistics
management, depot repair, modifications and maintenance overhauls for Air
Force weapons systems (sometimes referred to as the depot).
AVFuel – Aviation Fuel
CC – Two letter designator to indicate an Air Force Commander Function.
CPFH – Cost Per Flying Hour
DLRs – Depot Level Reparables
DoD – Department of Defense
FMS – Foreign Military Sales
GAO – General Accounting Office
GSD – General Support Division
MAJCOM – Major Command
MDS – Mission, Design, Series
81
PK – Two letter designator to indicate an Air Force Contracting Function
PSCM – Purchasing and Supply Chain Management a strategic, streamlined
approach that integrates processes such as demand planning; purchasing;
inventory management; supply chain, supplier base management; business
practices; and customer relationships.
SSD – System Support Division
TCO – Total Cost of Operations
TWCF – Transportation Working Capital Fund
USTRANSCOM – United States Transportation Command

82
Appendix B: Data Collection Instruments
Data Collection Instrument & Analysis Methodology
FIRM:_____________________ POC:__________________________
Interview Questions
What are the 5 most important costs for this firm? (e.g., fuel, pilot salaries, landing fees)
___ ______________________________________________________
___ ______________________________________________________
___ ______________________________________________________
___ ______________________________________________________
___ ______________________________________________________ How would you rank order these 5 items?

83
Interview and Data Collection Instrument
FIRM:_____________________ POC:______________________________ Issue ID:___________________ Rank:_______ Importance:__________ ISSUE - What are the criteria for making this important? (highest dollar value? problem item? hard to get? critical item? ELEMENT - How is this cost assigned or allocated? DECISION RULE - How are the cost elements assigned to individual services & transactions? OUTCOME - What is the result of following this method or utilizing this technique? (What is achieved?)

84
Bibliography Air Cargo News. (2004). Patience And Fortitude Fly On A Wing & Prayer At
Atlas Retrieved on 11 Mar 2004 from; http://www.air-cargo-news.com/MAD.html
Ayers, J. (2003). Rooting Out Supply-Chain Costs. Optimize, 24 (October).
Retrieved on 19 Jan 2004 from; http://www.optimizemag.com/issue/024/supplychain_2.htm
Atkinson, A. (1989). Diagnosing Costing Problems. CMA Magazine, 63(3),
20. Beamon, B. (1999). Measuring Supply Chain Performance. International
Journal of Operations & Production Management, 19 (3), 275-292. Blocher, E., Chen, K. & Lin, T. (2002). Cost Management: A Strategic
Emphasis. New York: McGraw-Hill. Bowersox, D., Closs, D., & Cooper, M. (2002). Supply Chain Logistics
Management. New York: McGraw-Hill. Bull, L. (2003). DoD wants to extend its authority over depot Work. Journal
of Aerospace and Defense Industry News, 31 January. Carr, L. & Ittner, C. (1992). Measuring the cost of ownership. Journal of
Cost Management, 6(3), 42-51. Cokins, G. (2001). Measuring costs across the supply chain. Cost
Engineering; Morgantown, 43(10), 25-31. Colorado State University (CSU). (2004) Writing@CSU Online Writing Guide
Retrieved on 14 Mar 2004 from: http://writing.colostate.edu/index.cfm Comments of Atlas Air, Inc. (2003). Consultation Paper With a View To
Revision of Regulation Nos. 2407/92, 2408/92 and 2409/92. Retrieved on 12 Mar 2004 from: http://europa.eu.int/comm/transport/air/rules/doc/consultation_3_package/contributions/atlasairinc.pdf
Creswell, J. (2003). Research Design: Qualitative, Quantitative, and Mixed
Methods Approaches. Thousand Oaks: Sage Publications, Inc.

85
Department of the Air Force. Financial Management: US Air Force Cost and Planning Factors. AFI 65-503. Washington: HQ USAF, 4 February 1994.
Ellram, L. (1999). The Role of Supply Management in Target Costing.
Center for Advanced Purchasing Studies, Arizona State University. Ellram, L. (1994). A taxonomy of total cost of ownership models. Journal
of Business Logistics, 15(1), 171-191. Ferrin, B. & Plank, R. (2002). Total cost of ownership models: An
Exploratory Study. Journal of Supply Chain Management, 38(3), 18-29.
Frazelle, E. (2002). Supply Chain Strategy: The Logistics of Supply Chain
Management. New York: McGraw-Hill. Harrington, L. (1995). It's Time to Rethink Your Logistics Costing.
Logisticstoday, 36(7), 27-30.
Isaac, S. & Michael, W. (1997). Handbook in Research and Evaluation: A Collection of Principles, Methods and Strategies Useful in the Planning, Design and Evaluation of Studies in Education and the Behavioral Sciences (3rd ed.). San Diego: Educational & Industrial Testing Services.
LaLonde, B. (2003). Three Problems that Linger. Supply Chain
Management Review, 7(2), 7-8. LaLonde, B. & Pohlen, T. (1996). Issues in Supply Chain Costing.
International Journal of Logistics Management, 7(1), 1-12. Leedy, P. & Ormrod, J. (2001). Practical Research: Planning and Design (7th
ed.). Saddle River, NJ: Prentice-Hall, Inc. Kauffman, R. (2002). Supply Management: What’s in a name? Or, do we
know who we are? Journal of Supply Chain Management, 38(4), 46-50.
MacArthur, J. (1992). Activity-based costing: How many cost
drivers do you want? Journal of Cost Management, 6(3), 37-41. Mena, C., Whicker, L., Templar, S. & Bernon, M. (2002). Costing the Supply
Chain. Manufacturing Engineer, 81(5), 225-228. Monczka, R., Trent, R. & Handfield, R. (2002). Purchasing and Supply Chain
Management (2nd ed.). Cincinnati: South-Western.

86
Patton, M. (2002). Qualitative Research & Evaluation Methods (3rd ed.). Thousand Oaks: Sage Publications, Inc.
PSCM Pillars of Change, Executive Steering Group Meeting PowerPoint
Presentation, 29 April 2003. Rose, P., (1997). Cost per flying hour factors: A background and
perspective of how they are developed and what they do. Air Force Comptroller, 31(3), 4-6.
Simchi-Levi, D., Kaminsky, P. & Simchi-Levi, E. (2003). Designing &
Managing the Supply Chain (2nd ed.). New York: McGraw-Hill. Shelton, F. & Brugh, M. (2002). Indirect Costs of Contracts. Journal of
Construction Accounting and Taxation, 12(4), 3-9. Stock, J. & Lambert, D. (2001). Strategic Logistics Management (4th ed.).
New York: McGraw-Hill. United States Code. Title 10, Subtitle A, Part IV, Chapter 146, Sec.
2466. United States General Accounting Office. (2002). Depot Maintenance:
Change in Reporting Practices and Requirements Could Enhance Congressional Oversight (GAO Publication No. GAO-03-16). Washington, DC: U.S. General Accounting Office.
United States Transportation Command Transportation Working Capital Fund
(TWCF) Rate Procedures - Fiscal Year 2003. Retrieved on 13 Mar 2004 from: https://www.amcfm.scott.af.mil/fmb.htm
Vidal, C. & Goetschalskx, M. (2001). A Global Supply Chain Model with
Transfer Pricing and Transportations Cost Allocation. European Journal of Operational Research 129 (2001), 134-158.
Yin, R. (2003). Case Study Research: Design and Methods (3rd ed.).
Thousand Oaks: Sage Publications.

87
REPORT DOCUMENTATION PAGE Form Approved OMB No. 074-0188
The public reporting burden for this collection of information is estimated to average 1 hour per response, including the time for reviewing instructions, searching existing data sources, gathering and maintaining the data needed, and completing and reviewing the collection of information. Send comments regarding this burden estimate or any other aspect of the collection of information, including suggestions for reducing this burden to Department of Defense, Washington Headquarters Services, Directorate for Information Operations and Reports (0704-0188), 1215 Jefferson Davis Highway, Suite 1204, Arlington, VA 22202-4302. Respondents should be aware that notwithstanding any other provision of law, no person shall be subject to an penalty for failing to comply with a collection of information if it does not display a currently valid OMB control number. PLEASE DO NOT RETURN YOUR FORM TO THE ABOVE ADDRESS. 1. REPORT DATE (DD-MM-YYYY) 23-03-2004
2. REPORT TYPE Master’s Thesis
3. DATES COVERED (From – To) Aug 2002 – Mar 2004
5a. CONTRACT NUMBER
5b. GRANT NUMBER
4. TITLE AND SUBTITLE PURCHASING AND SUPPLY CHAIN MANAGEMENT COSTING: AN AIR TRANSPORT PERSPECTIVE DERIVED THROUGH COMMERCIAL AIR CARGO FIRMS
5c. PROGRAM ELEMENT NUMBER
5d. PROJECT NUMBER 5e. TASK NUMBER
6. AUTHOR(S) Ettrich, Kurt G., Captain, USAF
5f. WORK UNIT NUMBER
7. PERFORMING ORGANIZATION NAMES(S) AND ADDRESS(S) Air Force Institute of Technology Graduate School of Engineering and Management (AFIT/EN) 2950 Hobson Way, Building 641 WPAFB OH 45433-7765
8. PERFORMING ORGANIZATION REPORT NUMBER AFIT/GAQ/ENV/04M-04
10. SPONSOR/MONITOR’S ACRONYM(S)
9. SPONSORING/MONITORING AGENCY NAME(S) AND ADDRESS(ES) N/A
11. SPONSOR/MONITOR’S REPORT NUMBER(S)
12. DISTRIBUTION/AVAILABILITY STATEMENT APPROVED FOR PUBLIC RELEASE; DISTRIBUTION UNLIMITED. 13. SUPPLEMENTARY NOTES 14. ABSTRACT The Air Force has struggled to completely understand the costs associated with its operations. The issue of understanding cost is complex, involving many perspectives, methods and techniques. When examined from a broad standpoint, total supply chain costs can include a firm’s costs plus upstream and downstream costs. This perspective takes vendors, suppliers and end customers into consideration. From this broad standpoint, the Air Force does not know its total supply chain cost. Since the Air Force’s supply chain is too broad to be a focus of this study, a smaller segment was chosen for a closer look. Specifically, air cargo carriers were selected as a type of commercial organization that could be sufficiently similar to the Air Force in some respects and possibly offer information to address the investigative questions. The purpose of this research is to determine what costing issues exist in the air cargo arena and what costing methods or techniques are utilized to address those issues. Air cargo carriers were contacted and a telephone interview was administered to strategic key informants. The interviews were exploratory, comprised of open-ended questions about how they calculated their cost information, what problems or issues arose from their chosen method and how they addressed those issues. The results of this study may assist the Air Force in determining methods or techniques to address some it’s costing issues. 15. SUBJECT TERMS air cargo firm costing, air transportation costing, air transportation cost allocation
16. SECURITY CLASSIFICATION OF:
19a. NAME OF RESPONSIBLE PERSON Michael A. Greiner, Major, USAF (ENV)
REPORT U
ABSTRACT U
c. THIS PAGE U
17. LIMITATION OF ABSTRACT UU
18. NUMBER OF PAGES 98 19b. TELEPHONE NUMBER (Include area code)
(937) 255-3636, ext 4588 e-mail: [email protected]
Standard Form 298 (Rev: 8-98) Prescribed by ANSI Std. Z39-18
Recommended