Psychosocial Predictors of Occupational Injury, Illness and Assault in a National
Random‐Digit Dial Survey
Lezah P. Brown, MSPHSchool of Public Health
Kathleen M. Rospenda, PhDCollege of Medicine
Sparking Tradition With InventionAIHce 2007
Philadelphia, PA, June 2‐7, 2007
Objectives
• Describe why psychosocial stressors are important to occupational health and safety professionals.
• Examine the association between 3 psychosocial stressors and Occupational Injury, Illness and Assault (OIIA).
• Explore the implications of psychosocial stressors.
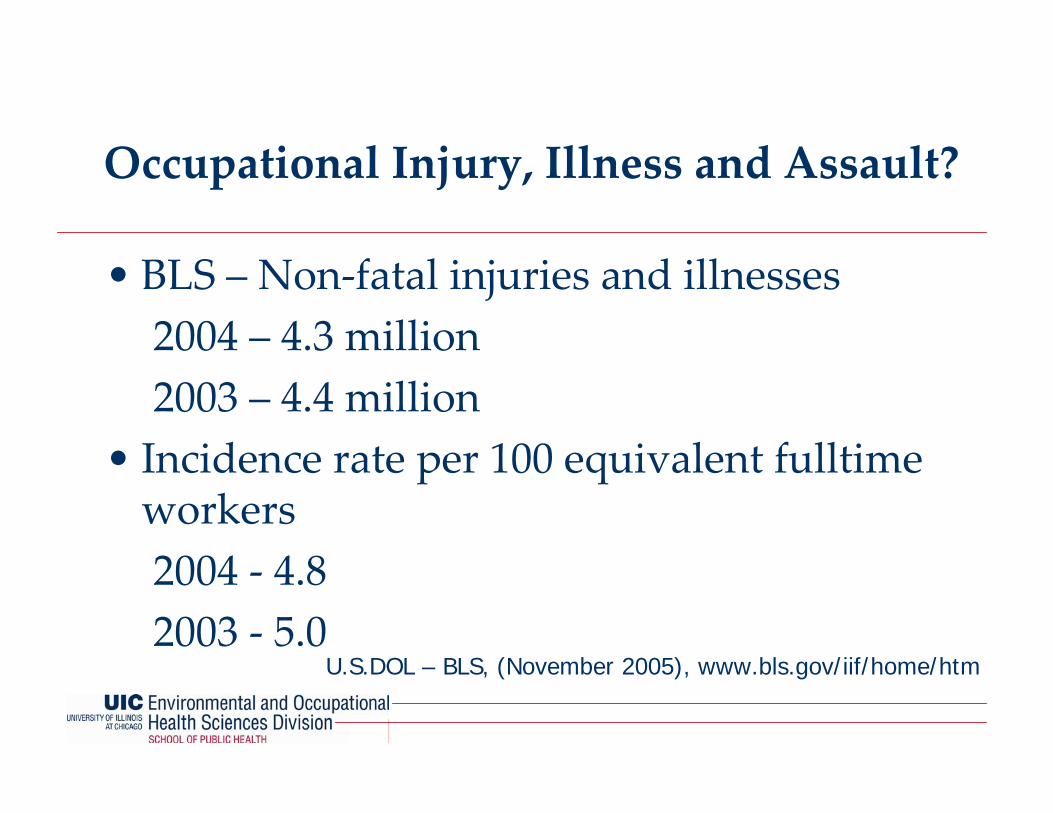
Occupational Injury, Illness and Assault?
• BLS – Non‐fatal injuries and illnesses2004 – 4.3 million2003 – 4.4 million
• Incidence rate per 100 equivalent fulltime workers 2004 ‐ 4.8 2003 ‐ 5.0
U.S.DOL – BLS, (November 2005), www.bls.gov/iif/home/htm
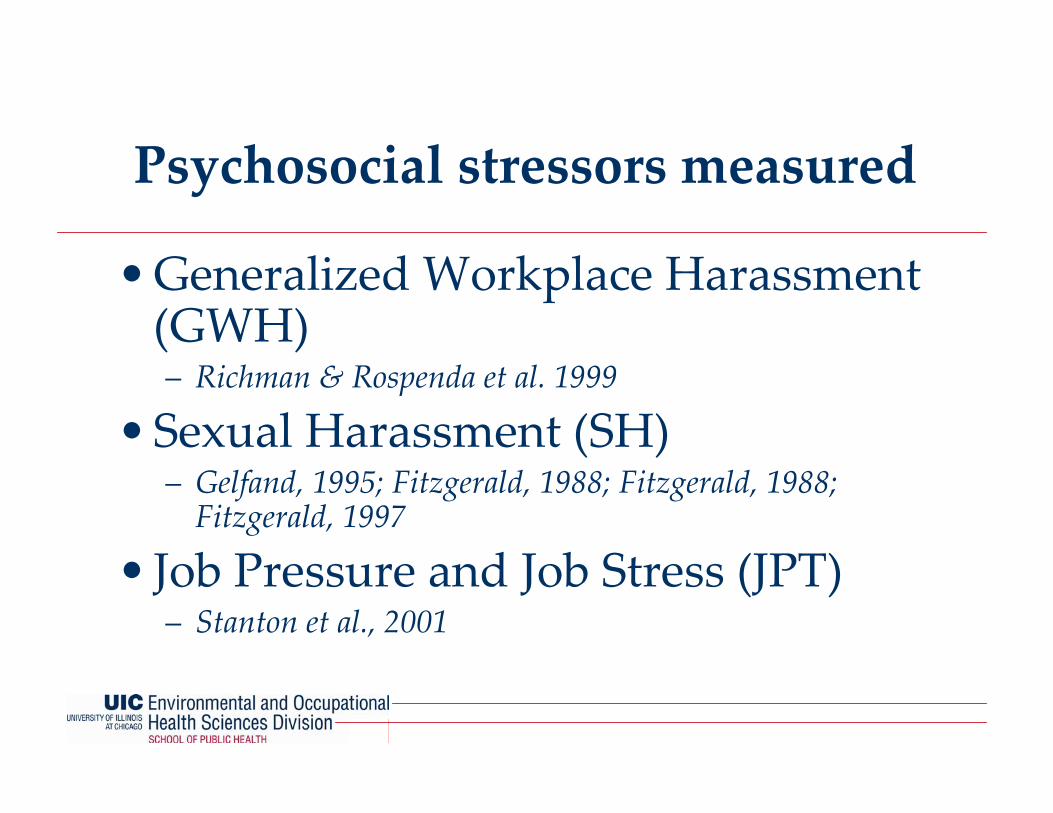
Psychosocial stressors measured
•Generalized Workplace Harassment (GWH)– Richman & Rospenda et al. 1999
•Sexual Harassment (SH)– Gelfand, 1995; Fitzgerald, 1988; Fitzgerald, 1988; Fitzgerald, 1997
• Job Pressure and Job Stress (JPT)– Stanton et al., 2001
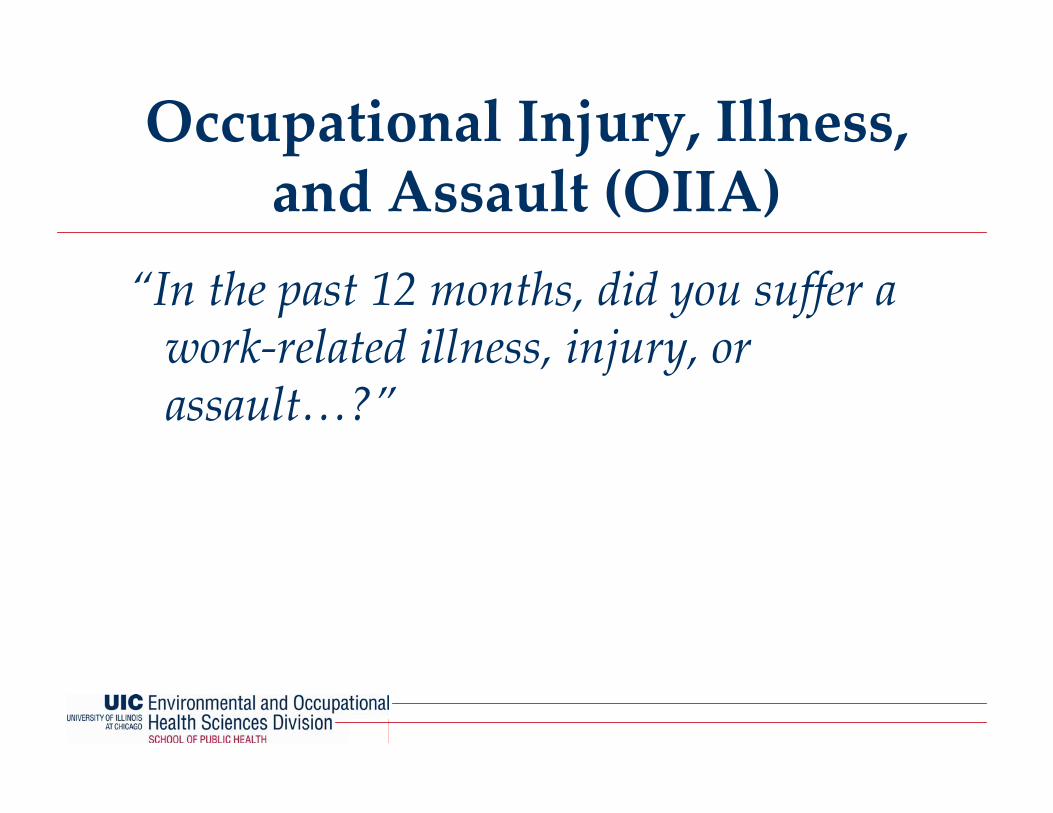
Occupational Injury, Illness, and Assault (OIIA)
“In the past 12 months, did you suffer a work‐related illness, injury, or assault…?”
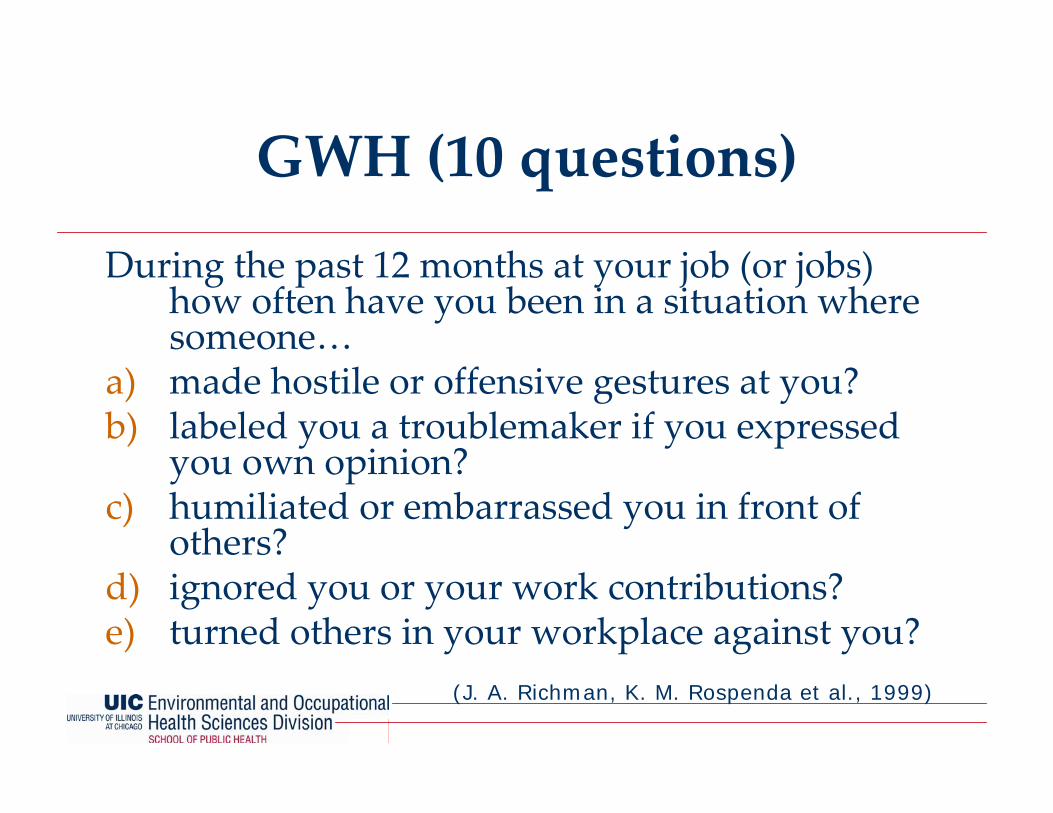
GWH (10 questions)
During the past 12 months at your job (or jobs) how often have you been in a situation where someone…
a) made hostile or offensive gestures at you?b) labeled you a troublemaker if you expressed
you own opinion?c) humiliated or embarrassed you in front of
others?d) ignored you or your work contributions?e) turned others in your workplace against you?
(J. A. Richman, K. M. Rospenda et al., 1999)
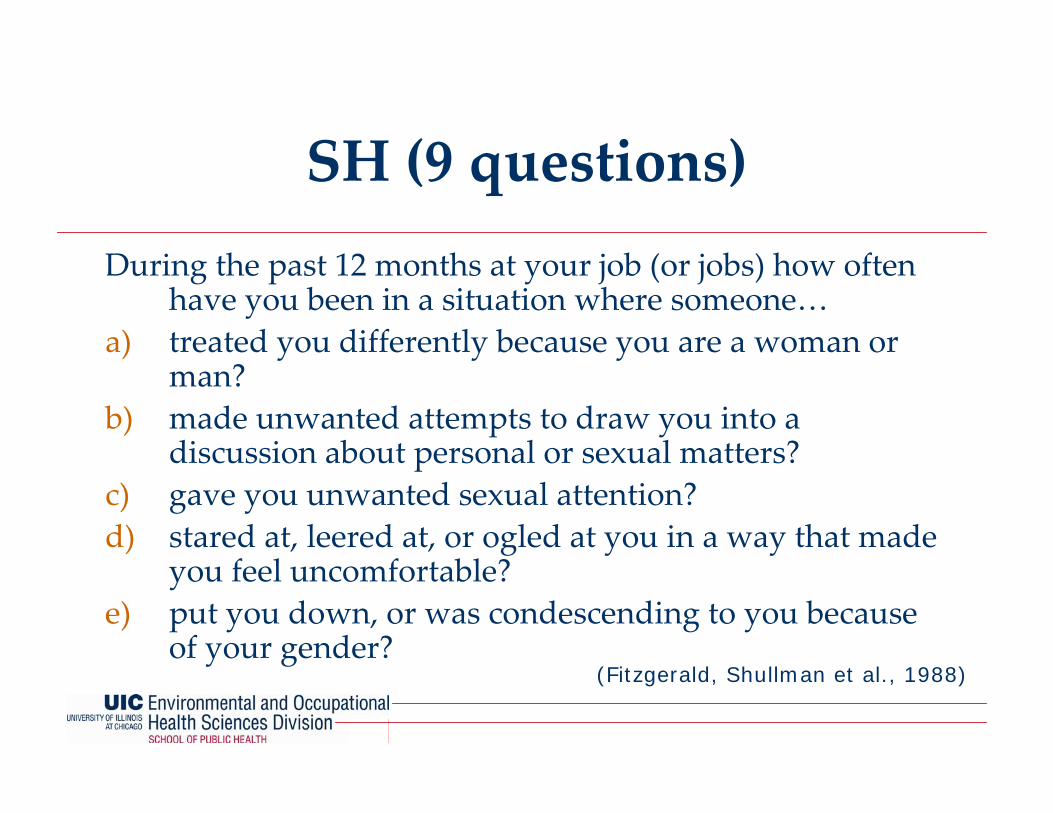
SH (9 questions)During the past 12 months at your job (or jobs) how often
have you been in a situation where someone…a) treated you differently because you are a woman or
man?b) made unwanted attempts to draw you into a
discussion about personal or sexual matters?c) gave you unwanted sexual attention?d) stared at, leered at, or ogled at you in a way that made
you feel uncomfortable?e) put you down, or was condescending to you because
of your gender?(Fitzgerald, Shullman et al., 1988)

JPT (7 questions)Pressure ‐Would you say your job is…a) pressured?b) hectic?c) relaxed?
Threat ‐Would you say your job is…a) under‐control?b) nerve‐wracking?c) hassled?d) smooth‐running?
(Stanton, Balzer et. Al, 2001)
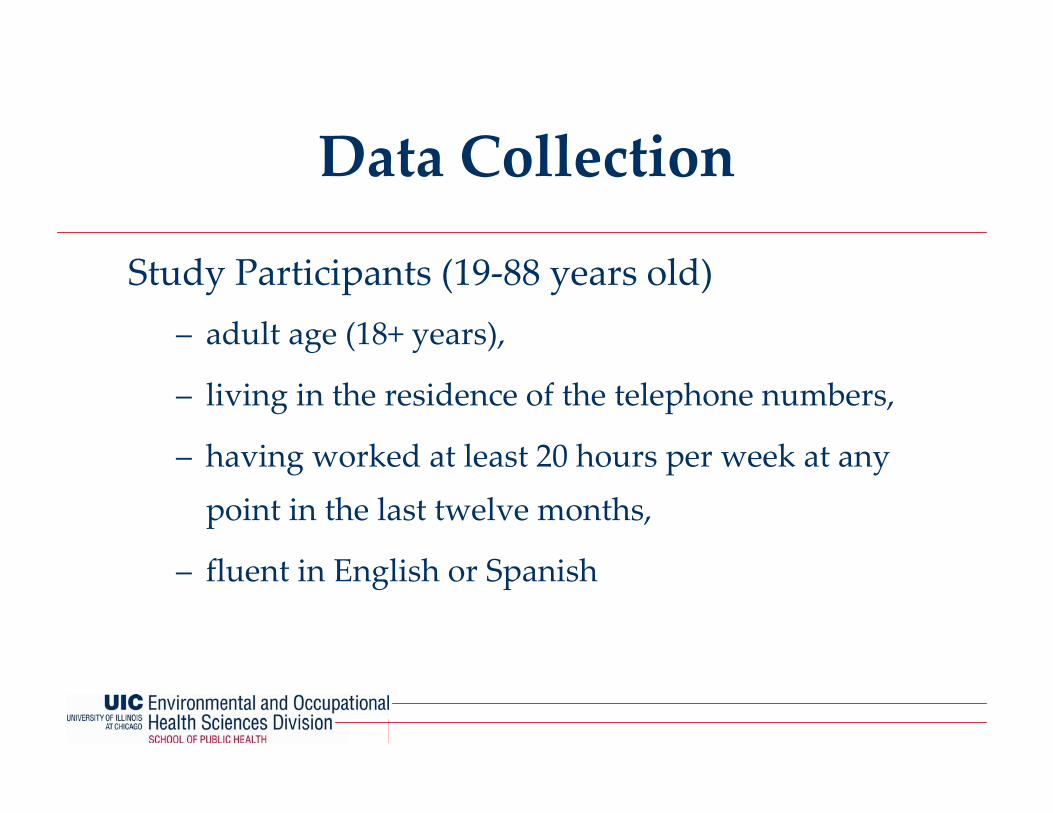
Data Collection
Study Participants (19‐88 years old)– adult age (18+ years),
– living in the residence of the telephone numbers,
– having worked at least 20 hours per week at any
point in the last twelve months,
– fluent in English or Spanish

2‐Wave Nation‐Wide Random‐Digit Dial Telephone SurveyWave–1 August 14, 2003 – February 2, 2004
Wave–2 August 21, 2004 – December 12, 2004
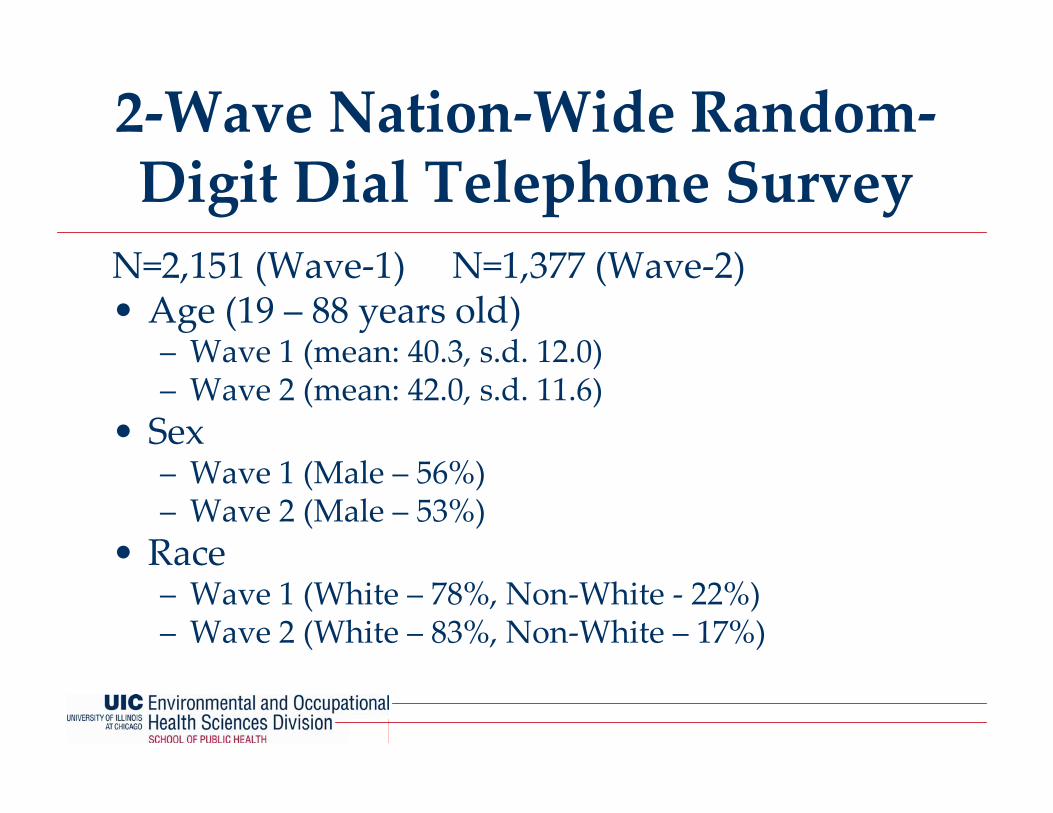
2‐Wave Nation‐Wide Random‐Digit Dial Telephone Survey
N=2,151 (Wave‐1) N=1,377 (Wave‐2)• Age (19 – 88 years old)
– Wave 1 (mean: 40.3, s.d. 12.0)– Wave 2 (mean: 42.0, s.d. 11.6)
• Sex– Wave 1 (Male – 56%)– Wave 2 (Male – 53%)
• Race– Wave 1 (White – 78%, Non‐White ‐ 22%)– Wave 2 (White – 83%, Non‐White – 17%)
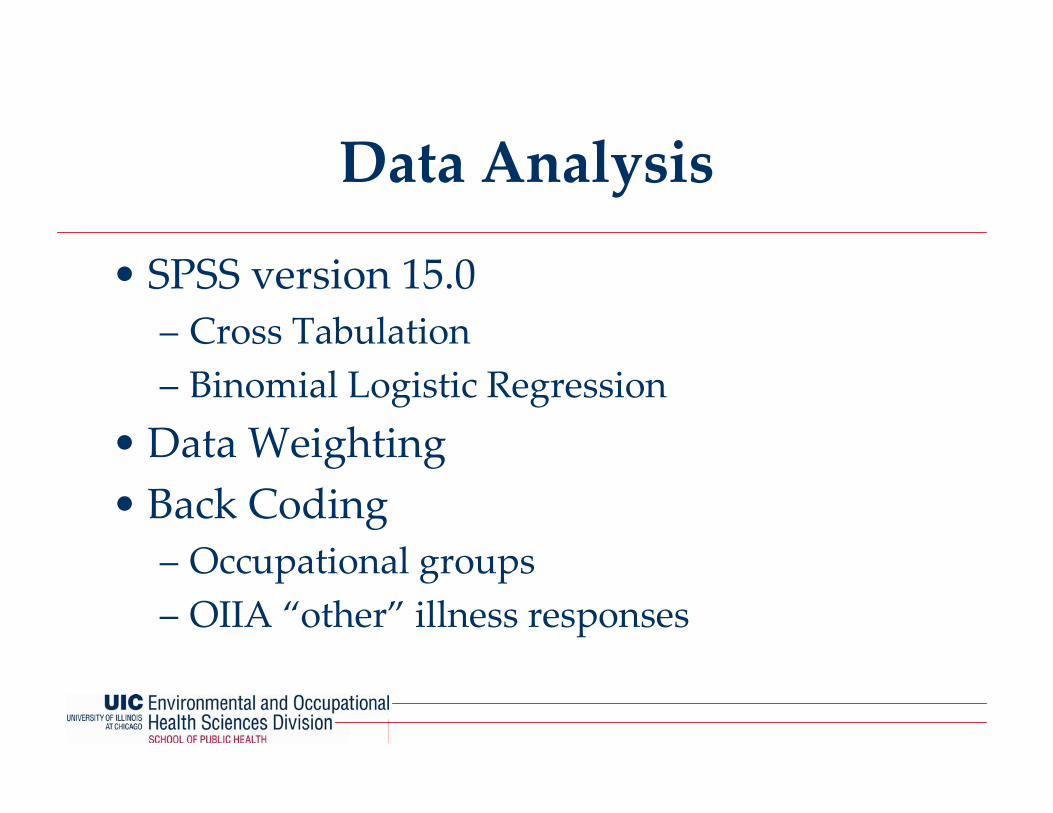
Data Analysis
• SPSS version 15.0– Cross Tabulation– Binomial Logistic Regression
• Data Weighting • Back Coding
– Occupational groups– OIIA “other” illness responses
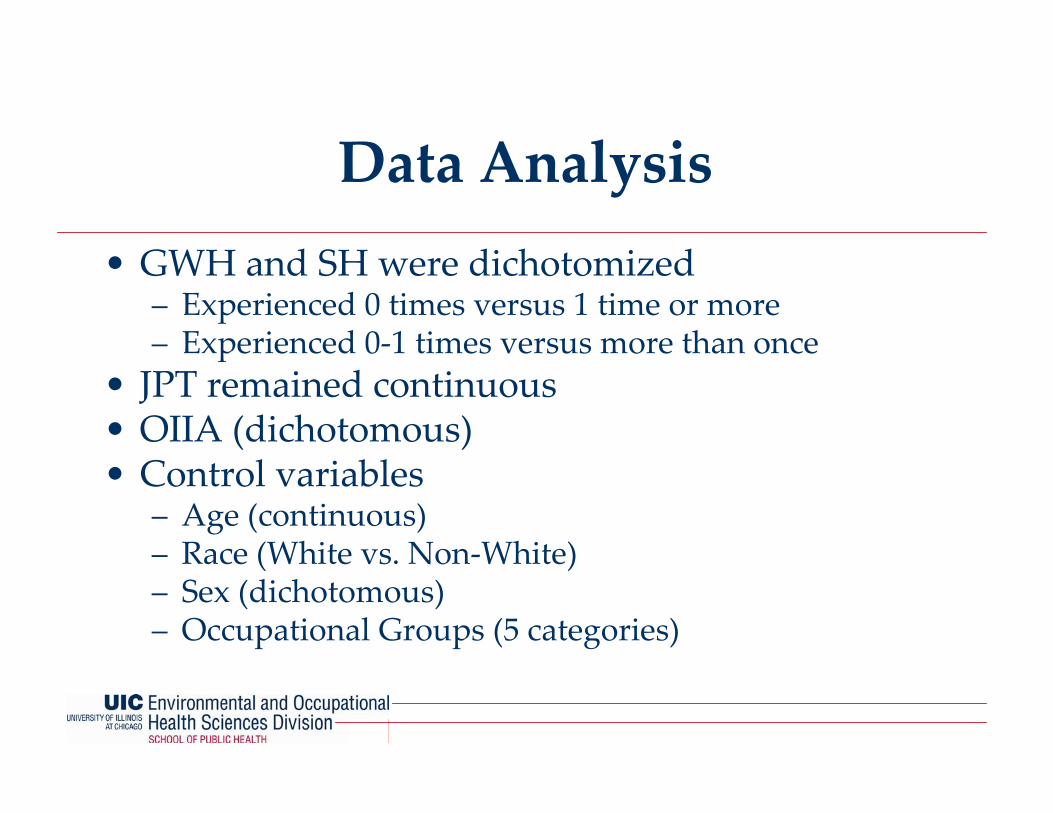
Data Analysis• GWH and SH were dichotomized
– Experienced 0 times versus 1 time or more– Experienced 0‐1 times versus more than once
• JPT remained continuous• OIIA (dichotomous)• Control variables
– Age (continuous)– Race (White vs. Non‐White)– Sex (dichotomous)– Occupational Groups (5 categories)
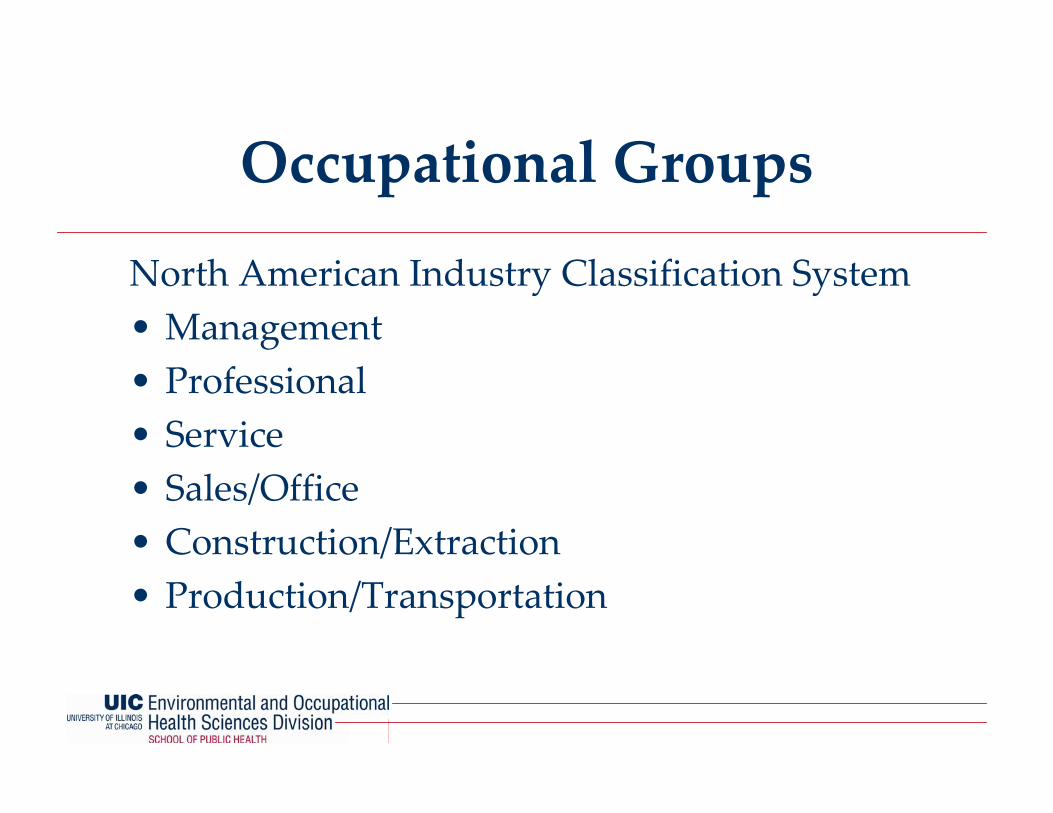
Occupational Groups
North American Industry Classification System• Management• Professional• Service• Sales/Office• Construction/Extraction• Production/Transportation

Odds Ratios for Psychosocial Variables and OIIA in Cross‐sectional and Longitudinal
Results
3.07
2.64
2.05
3.05
3.62
1.06
1.53
1.031.02
0
1
2
3
4
Wave 1 Wave 2 Wave 1 pred.Wave 2
Odds Ratios
GWH SH JPT
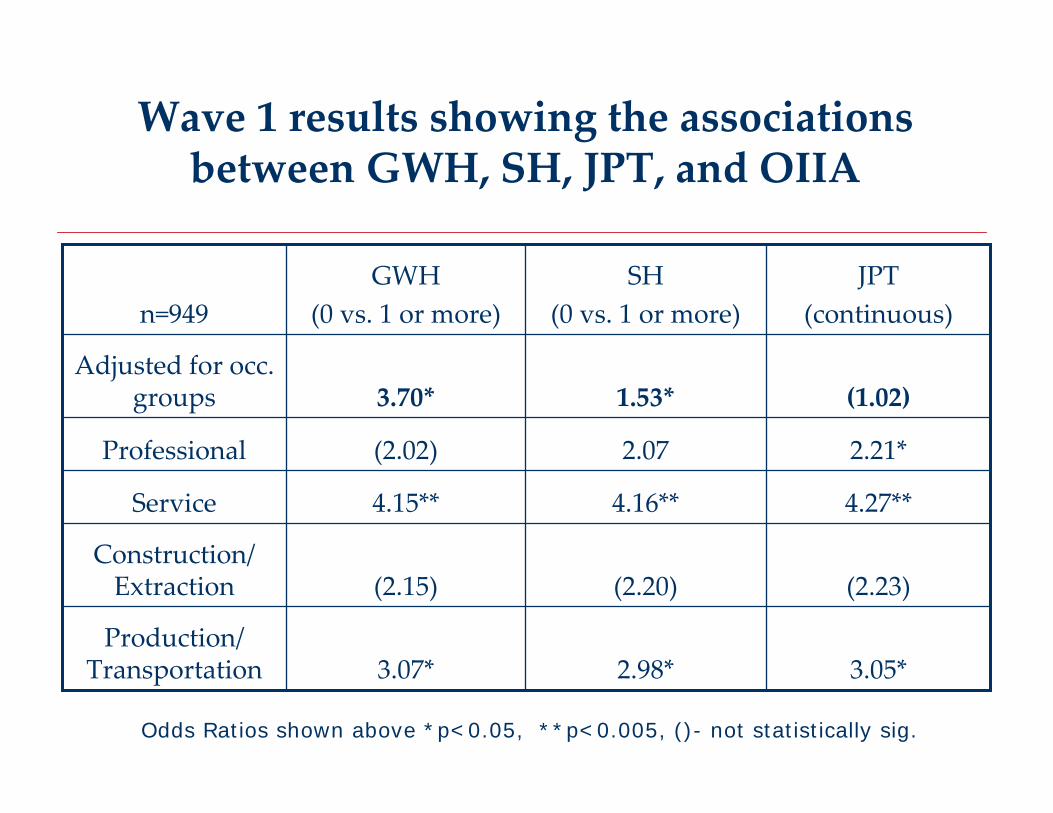
Wave 1 results showing the associations between GWH, SH, JPT, and OIIA
3.05*2.98*3.07*Production/
Transportation
(2.23)(2.20)(2.15)Construction/ Extraction
4.27**4.16**4.15**Service
2.21*2.07(2.02)Professional
(1.02)1.53*3.70*Adjusted for occ.
groups
JPT(continuous)
SH(0 vs. 1 or more)
GWH(0 vs. 1 or more)n=949
Odds Ratios shown above *p<0.05, **p<0.005, ()- not statistically sig.
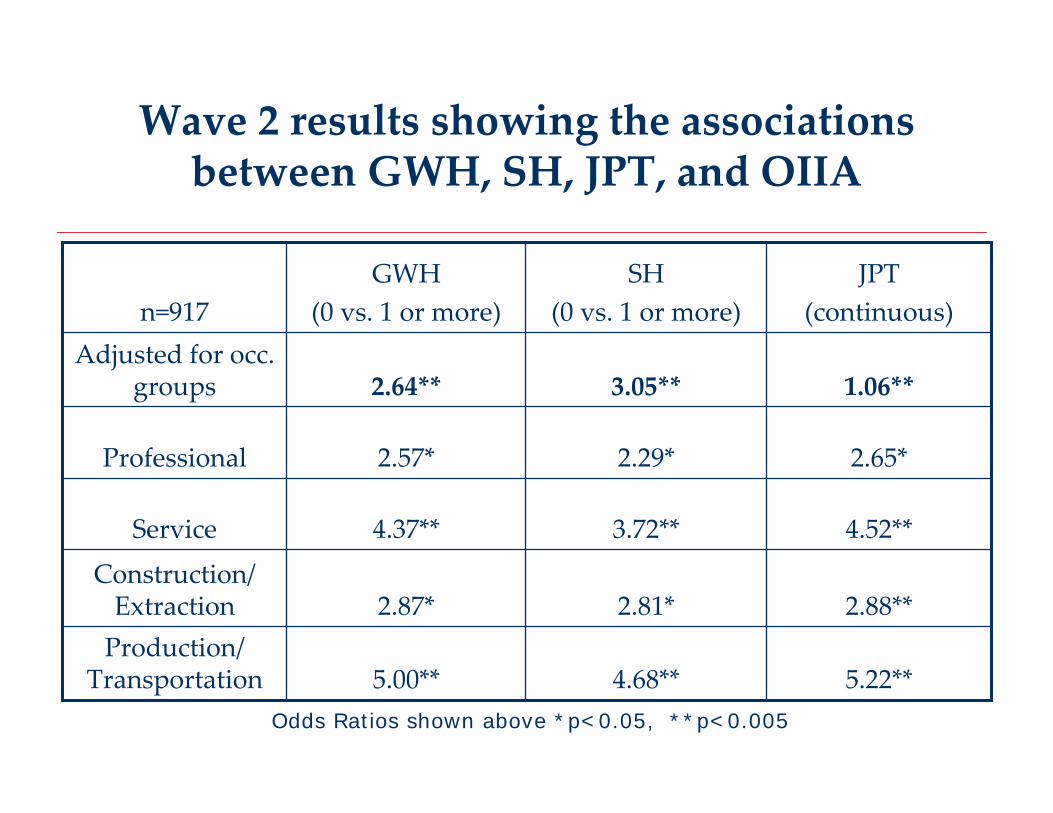
Wave 2 results showing the associations between GWH, SH, JPT, and OIIA
5.22**4.68**5.00**Production/
Transportation
2.88**2.81*2.87*Construction/ Extraction
4.52**3.72**4.37**Service
2.65*2.29*2.57*Professional
1.06**3.05**2.64**Adjusted for occ.
groups
JPT(continuous)
SH(0 vs. 1 or more)
GWH(0 vs. 1 or more)n=917
Odds Ratios shown above *p<0.05, **p<0.005
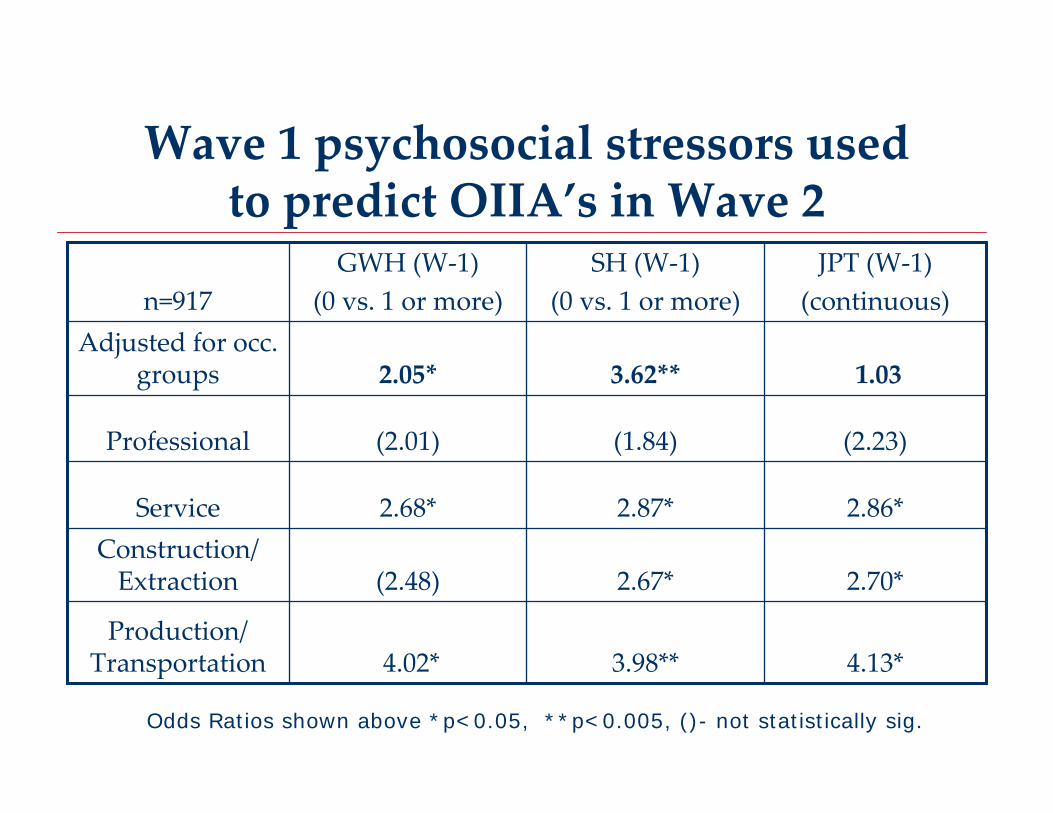
Wave 1 psychosocial stressors used to predict OIIA’s in Wave 2
4.13* 3.98** 4.02*Production/
Transportation
2.70* 2.67* (2.48)Construction/ Extraction
2.86* 2.87* 2.68*Service
(2.23)(1.84)(2.01)Professional
1.033.62** 2.05* Adjusted for occ.
groups
JPT (W‐1)(continuous)
SH (W‐1)(0 vs. 1 or more)
GWH (W‐1)(0 vs. 1 or more)n=917
Odds Ratios shown above *p<0.05, **p<0.005, ()- not statistically sig.
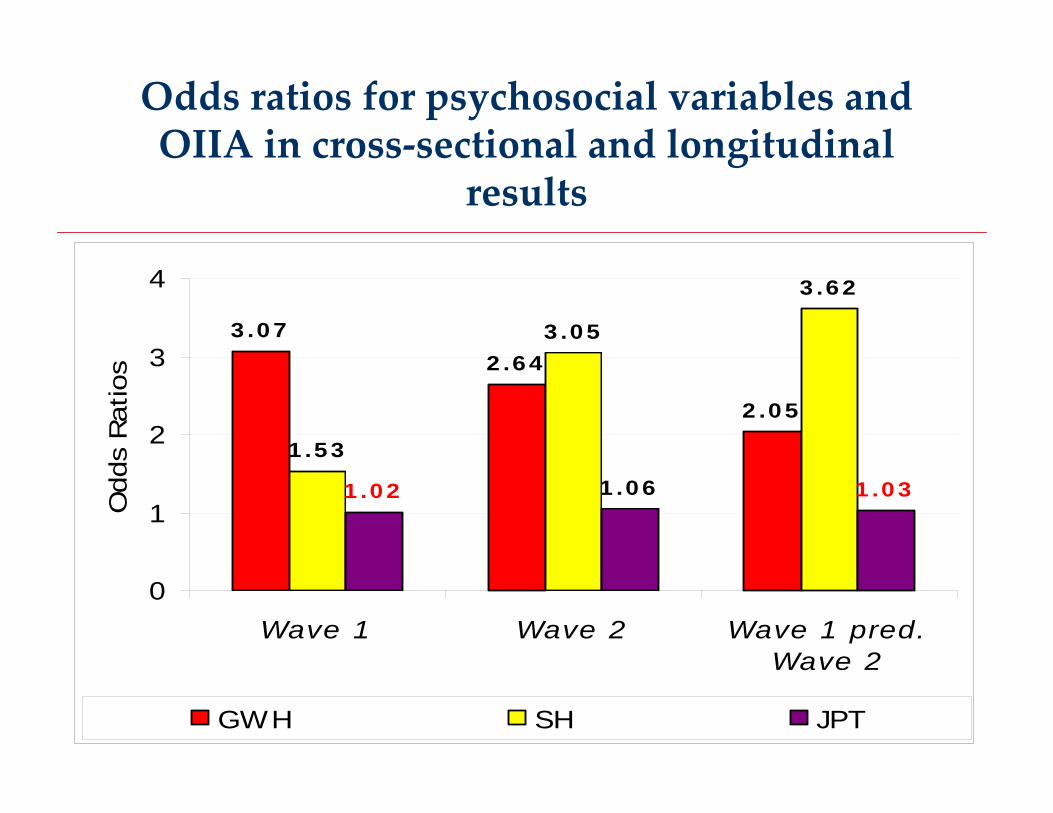
Odds ratios for psychosocial variables and OIIA in cross‐sectional and longitudinal
results
3.07
2.64
2.05
3.05
3.62
1.06
1.53
1.031.02
0
1
2
3
4
Wave 1 Wave 2 Wave 1 pred.Wave 2
Odds
Ratios
GWH SH JPT
Discussion
• All three psychosocial stressors appear to be important
• Occupational Groups experience/report psychosocial stressors differently as well as OIIA
•What are the factors which influence the change in levels of association between stress and OIIA?
Implications
• Mental Health Support and Programs• Employee Assistance Programs• Conflict Resolution• Occupational Health• Overall Employee Health• Supporting the Complete Occupational Environment
Future Research
• Examine coping mechanisms utilized by the two populations (Wave 1 and 2).
• Compare data to other nationally representative databases.
• Examine the occupational groups by gender and income gradients.
AcknowledgementsKathleen M. Rospenda, PhDRosemary K. Sokas, MD, MOH
The research and researchers were supported in part by:
• The National Institute on Alcohol Abuse and Alcoholism Grant # AA013332.
Its contents are solely the responsibility of the authors and do not necessarily represent the official views of the National Institute on Alcohol Abuse and Alcoholism or the National Institutes of Health. The data were collected by the Survey Research Laboratory at the University of Illinois at Chicago.
• Illinois Public Health Research Fellowship Program funded by the Centers for Disease Control and Prevention Grant # 1T01 CD000189‐01.
• NIOSH Training Program Grant # T42/CCT522954‐02
Recommended