NERC | Protection System Response to Power Swings | March 6, 2013 1 of 61
Protection System Response to Power Swings
System Protection and Control Subcommittee
August 2013
3353 Peachtree Road NE Suite 600, North Tower
Atlanta, GA 30326 404-446-2560 | www.nerc.com
NERC | Protection System Response to Power Swings | August 2013 2 of 61
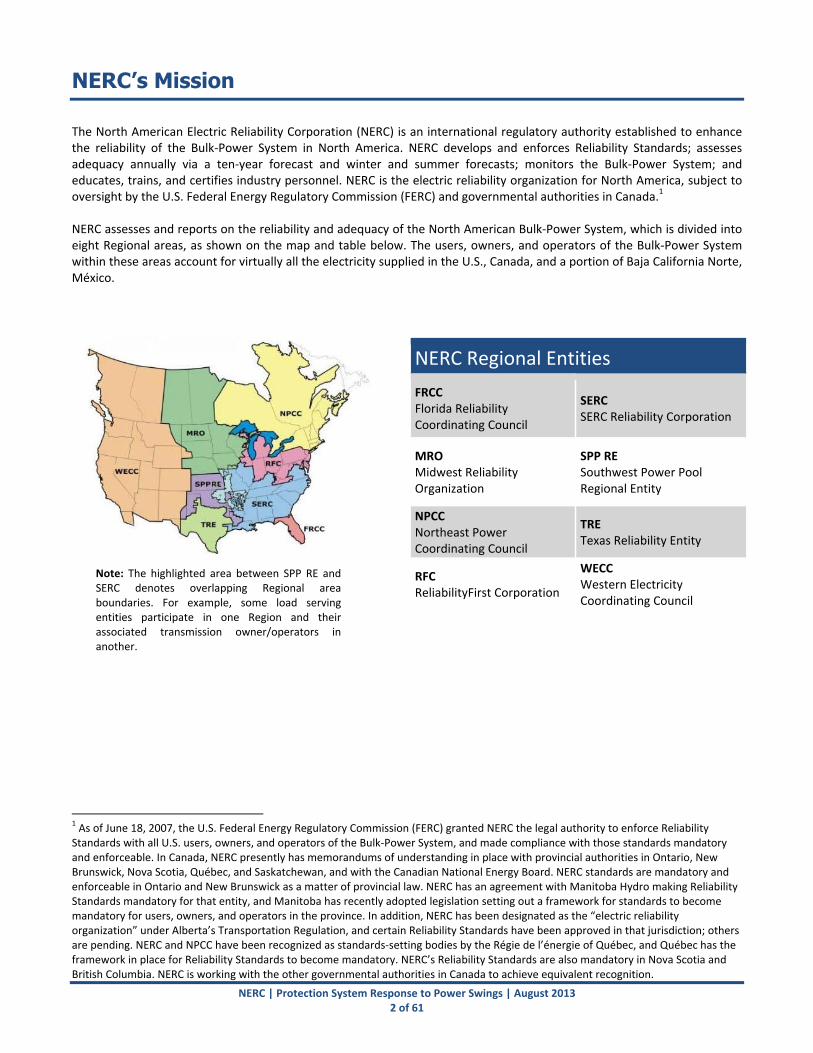
NERC’s Mission The North American Electric Reliability Corporation (NERC) is an international regulatory authority established to enhance the reliability of the Bulk‐Power System in North America. NERC develops and enforces Reliability Standards; assesses adequacy annually via a ten‐year forecast and winter and summer forecasts; monitors the Bulk‐Power System; and educates, trains, and certifies industry personnel. NERC is the electric reliability organization for North America, subject to oversight by the U.S. Federal Energy Regulatory Commission (FERC) and governmental authorities in Canada.1 NERC assesses and reports on the reliability and adequacy of the North American Bulk‐Power System, which is divided into eight Regional areas, as shown on the map and table below. The users, owners, and operators of the Bulk‐Power System within these areas account for virtually all the electricity supplied in the U.S., Canada, and a portion of Baja California Norte, México.
1 As of June 18, 2007, the U.S. Federal Energy Regulatory Commission (FERC) granted NERC the legal authority to enforce Reliability Standards with all U.S. users, owners, and operators of the Bulk‐Power System, and made compliance with those standards mandatory and enforceable. In Canada, NERC presently has memorandums of understanding in place with provincial authorities in Ontario, New Brunswick, Nova Scotia, Québec, and Saskatchewan, and with the Canadian National Energy Board. NERC standards are mandatory and enforceable in Ontario and New Brunswick as a matter of provincial law. NERC has an agreement with Manitoba Hydro making Reliability Standards mandatory for that entity, and Manitoba has recently adopted legislation setting out a framework for standards to become mandatory for users, owners, and operators in the province. In addition, NERC has been designated as the “electric reliability organization” under Alberta’s Transportation Regulation, and certain Reliability Standards have been approved in that jurisdiction; others are pending. NERC and NPCC have been recognized as standards‐setting bodies by the Régie de l’énergie of Québec, and Québec has the framework in place for Reliability Standards to become mandatory. NERC’s Reliability Standards are also mandatory in Nova Scotia and British Columbia. NERC is working with the other governmental authorities in Canada to achieve equivalent recognition.
NERC Regional Entities
FRCC Florida Reliability Coordinating Council
SERC SERC Reliability Corporation
MRO Midwest Reliability Organization
SPP RE Southwest Power Pool Regional Entity
NPCC Northeast Power Coordinating Council
TRE Texas Reliability Entity
RFC ReliabilityFirst Corporation
WECC Western Electricity Coordinating Council
Note: The highlighted area between SPP RE andSERC denotes overlapping Regional areaboundaries. For example, some load servingentities participate in one Region and theirassociated transmission owner/operators inanother.
NERC | Protection System Response to Power Swings | August 2013 3 of 61
Table of Contents NERC’s Mission ............................................................................................................................................................................ 2 Table of Contents ......................................................................................................................................................................... 3 Executive Summary ..................................................................................................................................................................... 5 Introduction ................................................................................................................................................................................. 6 Issue Statement ....................................................................................................................................................................... 6
Chapter 1 – Historical Perspective ............................................................................................................................................... 7 November 9, 1965 ................................................................................................................................................................... 7
1965 Northeast Blackout Conclusions ................................................................................................................................. 8
July 13, 1977 New York Blackout ............................................................................................................................................. 8
1977 New York Blackout Conclusions .................................................................................................................................. 8
July 2‐3, 1996: West Coast Blackout ........................................................................................................................................ 8
July 2‐3, 1996: West Coast Blackout Conclusions ................................................................................................................ 9
August 10, 1996 ..................................................................................................................................................................... 10
August 10, 1996 Conclusions ............................................................................................................................................. 10
August 14, 2003 ..................................................................................................................................................................... 10
Perry‐Ashtabula‐Erie West 345 kV Transmission Line Trip ................................................................................................ 11
Homer City – Watercure and Homer – City Stolle Rd 345 kV Transmission Line Trips ...................................................... 13
Southeast Michigan Loss of Synchronism .......................................................................................................................... 15
2003 Northeast Blackout Conclusion ................................................................................................................................. 16
September 8, 2011 Arizona‐California Outages .................................................................................................................... 17
Other Efforts from the 2003 Blackout Affecting Relay Response to Stable Power Swings ................................................... 17
Overall Observations from Review of Historical Events ........................................................................................................ 17
Chapter 2 – Reliability Issues ..................................................................................................................................................... 18 Dependability and Security .................................................................................................................................................... 18
Trade‐offs Between Security and Dependability ................................................................................................................... 18
Chapter 3 – Reliability Standard Considerations ....................................................................................................................... 20 Need for a Standard ............................................................................................................................................................... 20
Applicability ........................................................................................................................................................................... 20
Identification of Circuits with Protection Systems Subject to Effects of Power Swings .................................................... 20
Benefits of Defining Applicability for Specific Circuit Characteristics ................................................................................ 21
Requirements ........................................................................................................................................................................ 21
Conclusions ................................................................................................................................................................................ 23 Recommendations ..................................................................................................................................................................... 24 Appendix A – Overview of Power Swings .................................................................................................................................. 25 General Characteristics .......................................................................................................................................................... 25
Impedance Trajectory ........................................................................................................................................................ 25
Appendix B – Protection Systems Attributes Related to Power Swings .................................................................................... 29 Desired Response .................................................................................................................................................................. 29
Response of Distance Protection Schemes ............................................................................................................................ 29
Power Swing Without Faults .............................................................................................................................................. 29
Appendix C – Overview of Out‐of‐Step Protection Functions ................................................................................................... 34
NERC | Protection System Response to Power Swings | August 2013 4 of 61
Power Swing and Out‐of‐Step Phenomenon ......................................................................................................................... 34
Basic Phenomenon Using the Two‐Source Model ............................................................................................................. 34
Representation of Power Swings in the Impedance Plane ................................................................................................ 34
Rate of Change of the Positive‐Sequence Impedance ....................................................................................................... 35
Out‐of‐Step Protection Functions .......................................................................................................................................... 36
Power Swing Detection Methods ...................................................................................................................................... 37
Out‐of‐Step Tripping Function ........................................................................................................................................... 42
Issues Associated With the Concentric or Dual‐Blinder Methods ..................................................................................... 45
OOS Relaying Philosophy ................................................................................................................................................... 46
References ............................................................................................................................................................................. 47
Appendix D – Potential Methods to Demonstrate Security of Protective Relays ...................................................................... 48 IEEE PSRC WG D6 Method ..................................................................................................................................................... 48
Calculation Methods based on the Graphical Analysis Method ............................................................................................ 48
Method 1 ........................................................................................................................................................................... 49
Method 2 ........................................................................................................................................................................... 50
Voltage Dip Screening Method .............................................................................................................................................. 53
Discussion of the Results ................................................................................................................................................... 56
Practical Power System Example ....................................................................................................................................... 56
Appendix E – System Protection and Control Subcommittee ................................................................................................... 59 Appendix F – System Analysis and Modeling Subcommittee .................................................................................................... 60 Appendix G – Additional Contributors ....................................................................................................................................... 61
This technical document was approved by the NERC Planning Committee on August 19, 2013.
NERC | Protection System Response to Power Swings | August 2013 5 of 61
Executive Summary After the August 14, 2003 Northeast Blackout, the Federal Energy Regulatory Commission (FERC) raised concerns regarding performance of transmission line protection systems during power swings. These concerns resulted in issuance of a directive in FERC Order No. 733 for NERC to develop a Reliability Standard that requires the use of protective relay systems that can differentiate between faults and stable power swings and, when necessary, phases out protective relay systems that cannot meet this requirement. In the order, FERC stated that operation of zone 3 and zone 2 relays during the August 2003 blackout contributed to the cascade, and that these relays operated because they were unable to distinguish between a dynamic, but stable power swing and an actual fault. FERC further cited the U.S.‐Canada Power System Outage Task Force as identifying dynamic power swings and the resulting system instability as the reason why the cascade spread. While FERC did direct development of a Reliability Standard, FERC also noted that it is not realistic to expect the ERO to develop Reliability Standards that anticipate every conceivable critical operating condition applicable to unknown future configurations for regions with various configurations and operating characteristics. Further, FERC acknowledged that relays cannot be set reliably under extreme multi‐contingency conditions covered by the Category D contingencies of the TPL Reliability Standards. In response to the FERC directive, NERC initiated Project 2010‐13.3 – Phase 3 of Relay Loadability: Stable Power Swings to address the issue of protection system performance during power swings. To support this effort, and in response to a request for research from the NERC Standards Committee, the NERC System Protection and Control Subcommittee (SPCS), with support from the System Analysis and Modeling Subcommittee (SAMS), has developed this report to promote understanding of the overall concepts related to the nature of power swings; the effects of power swings on protection system operation; techniques for detecting power swings and the limitations of those techniques; and methods for assessing the impact of power swings on protection system operation. As part of this assessment the SPCS reviewed six of the most significant system disturbances that have occurred since 1965 and concluded that operation of transmission line protection systems during stable power swings was not causal or contributory to any of these disturbances. Although it might be reasonable, based on statements in the U.S.‐Canada Power System Outage Task Force final report, to conclude this was a causal factor on August 14, 2003, subsequent analysis clarifies the line trips that occurred prior to the system becoming dynamically unstable were a result of steady‐state relay loadability. The causal factors in these disturbances included weather, equipment failure, relay failure, steady‐state relay loadability, vegetation management, situational awareness, and operator training. While tripping on stable swings was not a causal factor, unstable swings caused system separation during several of these disturbances. It is possible that the scope of some events may have been greater without dependable tripping on unstable swings to physically separate portions of the system that lost synchronism. Based on its review of historical events, consideration of the trade‐offs between dependability and security, and recognizing the indirect benefits of implementing the transmission relay loadability standard (PRC‐023), the SPCS concludes that a NERC Reliability Standard to address relay performance during stable power swings is not needed, and could result in unintended adverse impacts to Bulk‐Power System reliability. The SPCS came to this conclusion in the course of responding to the Standards Committee request for research. During this process the SPCS evaluated several alternatives for addressing the concerns stated in Order No. 733. While the SPCS recommends that a Reliability Standard is not needed, the SPCS recognizes the directive in FERC Order No. 733 and the Standards Committee request for research to support Project 2010‐13.3. Therefore, the SPCS provides recommendations for applicability and requirements that can be used if NERC chooses to develop a standard. The SPCS recommends that if a standard is developed, the most effective and efficient use of industry resources would be to limit applicability to protection systems on circuits where the potential for observing power swings has been demonstrated through system operating studies, transmission planning assessments, event analyses, and other studies, such as UFLS assessments, that have identified locations at which a system separation may occur. The SPCS also proposes, as a starting point for a standard drafting team, criteria to determine the circuits to which the standard should be applicable, as well as methods that entities could use to demonstrate that protection systems on applicable circuits are set appropriately to mitigate the potential for operation during stable power swings.
NERC | Protection System Response to Power Swings | August 2013 6 of 61
Introduction Issue Statement After the August 14, 2003 Northeast Blackout, the Federal Energy Regulatory Commission (FERC) raised concerns regarding performance of transmission line protection systems during power swings. These concerns resulted in issuance of a directive in FERC Order No. 733 for NERC to develop a Reliability Standard that requires the use of protective relay systems that can differentiate between faults and stable power swings and, when necessary, phases out protective relay systems that cannot meet this requirement. In the order, FERC stated that operation of zone 3 and zone 2 relays during the August 2003 blackout contributed to the cascade, and that these relays operated because they were unable to distinguish between a dynamic, but stable power swing and an actual fault. FERC further cited the U.S.‐Canada Power System Outage Task Force as identifying dynamic power swings and the resulting system instability as the reason why the cascade spread. While FERC did direct development of a Reliability Standard,2 FERC also noted that it is not realistic to expect the ERO to develop Reliability Standards that anticipate every conceivable critical operating condition applicable to unknown future configurations for regions with various configurations and operating characteristics. Further, FERC acknowledged that relays cannot be set reliably under extreme multi‐contingency conditions covered by the Category D contingencies of the TPL Reliability Standards. In response to the FERC directive, NERC initiated Project 2010‐13.3 – Phase 3 of Relay Loadability: Stable Power Swings to address the issue of protection system performance during power swings. To support this effort, and in response to a request for research from the NERC Standards Committee, the NERC System Protection and Control Subcommittee (SPCS), with support from the System Analysis and Modeling Subcommittee (SAMS), has developed this report to promote understanding of the overall concepts related to the nature of power swings; the effects of power swings on protection system operation; techniques for detecting power swings and the limitations of those techniques; and methods for assessing the impact of power swings on protection system operation. The SPCS also proposes, as a starting point for a standard drafting team, criteria to determine the circuits to which the standard should be applicable, as well as methods that entities could use to demonstrate that protection systems on applicable circuits are appropriately set to mitigate the potential for operation during stable power swings. The SPCS recognizes there are many documents available in the form of textbooks, reports, and transaction papers that provide detailed background on this subject. Therefore, in this report, the SPCS has intentionally limited information on subjects covered elsewhere to an overview of the issues and has provided references that can be consulted for additional detail. The subject matter unique to this report discusses the issues that must be carefully considered, to avoid unintended consequences that may have a negative impact on system reliability, when addressing the concerns stated in Order No. 733.
2 Transmission Relay Loadability Reliability Standard, 130 FERC 61,221, Order No. 733 (2010) (“Order No. 733”) at P.152.

NERC | Protection System Response to Power Swings | August 2013 7 of 61
Chapter 1 – Historical Perspective Transient conditions occur following any system perturbation that upsets the balance of power on the interconnected transmission system, such as changes in load, switching operations, and faults. The resulting transfer of power among generating units is oscillatory and often is referred to as a power swing. The presence of a power swing does not necessarily indicate system instability, and in the vast majority of cases, the resulting power swing is a low‐magnitude, well‐damped oscillation, and the system moves from one steady‐state operating condition to another. In such cases the power swings are of short duration and do not result in the apparent impedance swinging near the operating characteristic of protective relays. Examples of this behavior occurred on August 14, 2003, when there were ten occurrences of transmission lines tripping due to heavy line loading. Each line trip resulted in a low‐magnitude, well‐damped transient and the transmission system reaching a new stable operating point; however, due to the heavy line loading the apparent impedance associated with the new operating point was within a transmission line relay characteristic.3 Secure operation of protective relays for these conditions is addressed by NERC Reliability Standards PRC‐023 – Transmission Relay Loadability and PRC‐025 – Generator Relay Loadability.4 Power swings of sufficient magnitude to challenge protection systems can occur during stressed system conditions when large amounts of power are transferred across the system, or during major system disturbances when the system is operating beyond design and operating criteria due to the occurrence of multiple contingencies in a short period of time. During these conditions the angular separation between coherent groups of generators can be significant, increasing the likelihood that a system disturbance will result in higher magnitude power swings that exhibit lower levels of damping. It is advantageous for system reliability that protective relays do not operate to remove equipment from service during stable power swings associated with a disturbance from which the system is capable of recovering. Secure operation of protective relays for these conditions is the subject of a directive in Order No. 733, and is the subject of Project 2010‐13.3 – Phase 3 of Relay Loadability: Stable Power Swings. Under extreme operating conditions a system disturbance may result in an unstable power swing of increasing magnitude or a loss of synchronism between portions of the system. It is advantageous to separate the system under such conditions, and operation of protection systems associated with system instability is beyond the scope of the standard directed in Order No. 733. However, it is important that actions to address operation during stable power swings do not have the unintended consequence of reducing the dependability of protection systems to operate during unstable power swings. Six major system disturbances are described below, including a discussion of the relationship between power swings and protection system operation and whether operation of protective relays during stable swings was causal or contributory to the disturbance.
November 9, 1965 The November 1965 blackout, which occurred in the Northeastern United States and Ontario, provides an example of steady‐state relay loadability being causal to a major blackout. The event began when 230 kV transmission lines from a hydro generating facility were heavily loaded due to high demand of power from a major load center just north of the hydro generating facility. Heavy power transfers prior to the disturbance resulted from the load center area being hit by cold weather, coupled with an outage of a nearby steam plant. The transmission line protection included zone 3 backup relays, which were set to operate at a power level well below the capacity of the lines. The reason for the setting below the line capacity was to detect faults beyond the next switching point from the generating plant. From the time the relays were initially set, the settings remained unchanged while the loads on the lines steadily increased. Under this circumstance a plant operator, who was apparently unaware of the installed relay setting limitation, attempted to increase power transfer on one of the 230 kV lines. As a result, the load impedance entered the operating characteristics
3 Informational Filing of the North American Electric Reliability Corporations in Response to Order 733‐A on Rehearing, Clarification, and Request for an Extension of Time, Docket No. RM08‐13‐000 (July 21, 2011) (“NERC Informational Filing”), at p. 4. 4 PRC‐025‐1 is presently in development under Project 2010‐13.2 Phase 2 of Relay Loadability: Generation.
Chapter 1 – Historical Perspective
NERC | Protection System Response to Power Swings | August 2013 8 of 61
of the zone 3 line backup relay. The relay operated and tripped the line breaker. Subsequently, the rest of the lines became overloaded. As it happened, each line breaker was tripped by the zone 3 line backup relay one‐by‐one over a period of approximately 2.7 seconds. When all five lines tripped, the hydro generators accelerated rapidly due to the initial reduction of connected electrical load. The resulting drop in generation at this hydro plant and the rapid build‐up of generation in the interconnected system resulted in large power swings that resulted in a loss of synchronism between two portions of the system. This incident initiated a sequence of events across the power system of the northeastern seaboard. The resulting massive outage lasted from a few minutes in some locations to more than a few days in others and encompassed 80,000 square miles, directly affecting an estimated 30 million people in the United States and Canada. This was the largest recorded blackout in history at the time.
1965 Northeast Blackout Conclusions Relays tripping due to stable power swings were not contributory or causal factors in this blackout. Relays applied to 230 kV transmission lines tripping due to load and a lack of operator knowledge of relay loadability limitations caused and contributed to this outage. The Bulk‐Power System is protected against a recurrence of this type of event by the requirements in NERC Reliability Standard PRC‐023‐2.
July 13, 1977 New York Blackout This disturbance resulted in the loss of 6,000 MW of load and affected 9 million people in New York City. Outages lasted for up to 26 hours. A series of events triggering the separation of the Consolidated Edison system from neighboring systems and its subsequent collapse began when two 345 kV lines on a common tower in northern Westchester County were struck by lightning and tripped out. Over the next hour, despite Consolidated Edison (Con Edison) dispatcher actions, the system electrically separated from surrounding systems and collapsed. With the loss of imports, generation in New York City was not sufficient to serve the load in the city. Major causal factors were:
Two 345 kV lines experienced a phase B‐to‐ground fault caused by a lightning strike.
A nuclear generating unit was isolated due to the line trips and tripped due to load rejection. Loss of the ring bus also resulted in the loss of another 345 kV line.
About 18.5 minutes later, two more 345 kV lines tripped due to lightning. One automatically reclosed and one failed to reclose isolating the last Con Edison interconnection to the northwest.
The resulting surge of power caused another line to trip due to a relay with a bent contact.
About 23 minutes later, a 345 kV line sagged into a tree and tripped out. Within a minute a 345/138 kV transformer overloaded and tripped.
The tap‐changing mechanism on a phase‐shifting transformer carrying 1150 MW failed, causing the loss of the phase‐shifting transformer.
The two remaining 138 kV ties to Con Edison tripped on overload isolating the system. Insufficient generation in the isolated system caused the Con Edison island to collapse.
1977 New York Blackout Conclusions Relays tripping due to stable power swings were not contributory or causal factors in this blackout. A series of line and transformer trips due to weather, equipment failure, relay failure, and overloads caused and contributed to this outage.
July 2-3, 1996: West Coast Blackout On July 2, 1996 portions of the Western Interconnection were unknowingly operated in an insecure state. The July 2 disturbance was initiated at 14:24 MST by a line‐to‐ground fault on the Jim Bridger – Kinport 345 kV line due to a flashover to a tree. A protective relay on the Jim Bridger – Goshen 345 kV line misoperated due to a malfunctioning local delay timer, de‐energizing the line and initiating a remedial action scheme which tripped two units at the Jim Bridger generating station. The initial line fault, subsequent relay misoperation, inadequate voltage support, and unanticipated system conditions led
Chapter 1 – Historical Perspective
NERC | Protection System Response to Power Swings | August 2013 9 of 61
to cascading outages causing interruption of service to several million customers and the formation of five system islands. Customer outages affected 11,850 MW of load in the western United States and Canada, and Baja California Norte in Mexico. Outages lasted from a few minutes to several hours. Major causal factors were:
A 345 kV line sagged due to high temperatures and loading causing a flashover to a tree within the right‐of‐way and the line was de‐energized properly. A second line simultaneously tripped incorrectly due to a protective relay malfunction.
Output of a major generating plant was reduced by design due to the two line trips. Two of four generating units at that plant were correctly tripped via a Remedial Action Scheme. The trips of these units caused frequency in the Western Interconnection to decline.
About 2 seconds later, the Round Up – LaGrand 230 kV line tripped via a failed zone 3 relay.
About 13 seconds later a couple of small units tripped via field excitation overcurrent.
About 23 seconds later, the Anaconda – Amps (Mill Point) 230 kV line tripped via a zone 3 relay due to high line loads.
Over the next 12 seconds, numerous lines tripped due to high loads, low voltage at line terminals, or via planned operation of out‐of‐step relaying. Low frequency conditions existed in some areas during many of these trips.
The Western Interconnection separated into five planned islands designed to minimize customer outages and restoration times. The separation occurred mostly by line relay operation with three exceptions: Utah was separated from Idaho by the Treasureton Separation Scheme, Southern Utah separated by out‐of‐step relaying, and Nevada separated from SCE by out‐of‐step relaying.
On July 3, 1996, at 2:03 p.m. MST a similar chain to the July 2, 1996 events began. A line‐to‐ground fault occurred on the Jim Bridger – Kinport 345 kV line due to a flashover to a tree. A protective relay on the Jim Bridger – Goshen 345 kV line misoperated due to a malfunctioning local delay timer, de‐energizing the line and initiating a remedial action scheme (RAS) which tripped two units at the Jim Bridger generating station. Scheduled power limits were reduced on the California – Oregon Intertie (COI) north‐to‐south pending the results of technical studies being conducted to analyze the disturbance of the previous day. The voltage in the Boise area declined to about 205 kV over a three minute period. The area system dispatcher manually shed 600 MW of load over the next two minutes to arrest further voltage decline in the Boise area, containing the disturbance and returning the system voltage to normal 230 kV levels. All customer load was restored within 60 minutes. The Western Systems Coordinating Council Disturbance Report For the Power System Outages that Occurred on the Western Interconnection on July 2, 1996 and July 3, 1996 approved by the WSCC Operations Committee on September 19, 1996 includes numerous recommendations one of which is the following:
The WSCC Operations Committee shall oversee a review of out‐of‐step tripping and out‐of‐step blocking within the WSCC region to evaluate adequacy. This includes:
1. Out‐of‐step relays that operated;
2. Out‐of‐step relays that did not operate but should have; and
3. Out‐of step conditions that caused operation of impedance relays.
Work by C.W. Taylor5 following the disturbance report recommended the review of the use of zone 3 relays which was a contributing factor to the severity of this disturbance.
July 2-3, 1996: West Coast Blackout Conclusions Relays tripping due to stable power swings was not causal or contributory to the July 2‐3 West Coast Blackout. Out‐of‐step relaying did play a role as a safety net designed to limit the extent and duration of customer outages and restoration times.
5 Taylor, C.W., Erickson, Dennis C., IEEE Computer Applications in Power, Vol. 10, Issue 1, 1997.
Chapter 1 – Historical Perspective
NERC | Protection System Response to Power Swings | August 2013 10 of 61
Unstudied system conditions including unexpectedly high transfer conditions coupled with a series of line trips due to vegetation intrusion, relay malfunctions, and relay loadability issues caused and contributed to this outage.
August 10, 1996 At 15:48 PST on August 10, 1996, a major system disturbance separated the Western Interconnection into four islands, interrupting service to 7.5 million customers, with total load loss of 30,390 MW. The interruption period ranged from several minutes to nearly nine hours. The pre‐event system conditions in the Western Interconnection were characterized by high north‐to‐south flows from Canada to California. At 15:42:37, the Allston – Keeler 500 kV line sagged close to a tree and flashed over, additionally forcing the Pearl – Keeler 500 kV line out of service due to 500/230 kV transformer outage and breaker replacement work at Keeler. The line was tripped following unsuccessful single‐pole reclosure. The 500 kV line outage caused overloading and eventual tripping of several underlying 115 kV and 230 kV lines, also in part due to reduced clearances. System voltages sagged partly because several plants were operated in var regulation mode. At 15:47:37, sequential tripping of all units at McNary began due to excitation protection malfunctions at high field voltage as units responded to reduced system voltages. Bonneville Power Administration (BPA) automatic generation control (AGC) further aggravated the situation by increasing generation in the upper Columbia area (Grand Coulee and Chief Joseph) to restore the generation‐load imbalance following McNary tripping. As a result of the above outages and shift of generation northward, sustained power oscillations developed across the interconnection. The magnitude of power and voltage oscillations further increased, as Pacific HVdc Intertie controls started participating in the oscillation. These oscillations were a major factor leading to the separation of the California – Oregon Intertie and subsequent islanding of the Western Interconnection system. Ultimately, the magnitude of voltage and current oscillations caused opening of two COI 500 kV lines (Malin – Round Mountain #1 and #2 500 kV lines) by switch‐onto‐fault relay logic. The third COI 500 kV line tripped 170 ms later. Some of the power that was flowing into northern California surged east and then south through Idaho, Utah, Colorado, Arizona, New Mexico, Nevada, and southern California. Numerous transmission lines in this path subsequently tripped due to out‐of‐step conditions and low system voltage. Because at that time the Northeast – Southeast separation scheme was kept out of service when all COI lines were in operation, the Western Interconnection experienced uncontrolled islanding. Fifteen large thermal and nuclear plants in California and the desert southwest failed to ride through the disturbance and tripped after the system islanding, thereby delaying the system restoration.
August 10, 1996 Conclusions Relays tripping due to stable power swings were not causal or contributory to the August 10th West Coast Blackout. System operation was unknowingly in an insecure state prior to the outage of the Keeler‐Allston 500 kV line due to reduced clearances resulting from a season of rapid tree growth and stagnant atmospheric conditions. Outage of the Keeler‐Allston 500 kV line precipitated the overloading and tripping of underlying parallel 230 kV and 115 kV lines, causing undesirable tripping of key hydro units, voltage drops, and subsequent increasing of power oscillations, all of which led to tripping of the COI and other major transmission lines separating the Western Interconnection into four islands. The result was widespread uncontrolled outage of generation and the interruption of service to approximately 7.5 million customers.
August 14, 2003 Similar to a number of the disturbances discussed above, the disturbance on August 14, 2003 concluded with line trips during power swings that were preceded by many outages due to other causes. The progression of cascading outages on August 14, 2003 was initially caused by lines contacting underlying vegetation (the basis for Blackout Recommendation 46 and FAC‐003), followed by a series of lines tripping due to steady‐state relay loadability issues (the basis for Blackout Recommendation 8a7 and PRC‐023). After the system was severely weakened by these outages, line trips occurred in response to power swings.
6 Approved by the NERC Approved by the Board of Trustees, February 10, 2004. 7 Ibid.
Chapter 1 – Historical Perspective
NERC | Protection System Response to Power Swings | August 2013 11 of 61
In the days and hours preceding the early afternoon of August 14 the power system experienced a number of generation and transmission outages that resulted in increased transfers of power between portions of the system. During the early afternoon a number of lines tripped, first due to contact with underlying vegetation and then due to load encroaching into the operating characteristics of phase distance relays. The events occurred over a period of hours, with sufficient time between events for the system to find a new steady‐state condition after each event. In Order No. 733 and Order No. 733‐A FERC discussed tripping of fourteen transmission lines to support the directive pertaining to conditions in which relays misoperate due to stable power swings. FERC cited the Blackout Report8, stating the system did not become dynamically unstable until at least the Thetford – Jewell 345 kV line tripped at 16:10:38 EDT. FERC noted that up until this point, with each dynamic, but stable, power swing, the transmission system recovered and appeared to stabilize. However, as the power swings and oscillations increased in magnitude, zone 3, zone 2, and other relays on fourteen key transmission lines reacted as though there was a fault in their protective zone even though there was no fault. These relays were not able to differentiate the levels of currents and voltages that the relays measured, because of their settings, and consequently operated unnecessarily.9 The Commission’s directive pertains to conditions in which relays misoperate due to stable power swings that were identified as propagating the cascade during the August 2003 Blackout.10 NERC subsequently clarified that the fourteen lines did not trip due to stable power swings; ten of these lines tripped in response to the steady‐state loadability issue addressed by Reliability Standard PRC‐023, while the last four lines tripped in response to dynamic instability of the power system. Although the Blackout Report states that the system did not become dynamically unstable until at least after the Thetford – Jewell 345 kV transmission line trip11, subsequent analysis indicates that the system became dynamically unstable following tripping of the Argenta – Battle Creek and Argenta – Tompkins 345 kV transmission lines, about two seconds earlier than stated in the Blackout Report. The operations not associated with faults, up to and including the initial trips of Argenta – Battle Creek and Argenta – Tompkins lines, are associated with the steady‐state loadability issue addressed by Reliability Standard PRC‐023.12 As the cascade accelerated, 140 discrete events occurred from 16:05:50 to 16:36. The last transmission lines to trip as result of relay loadability concerns were the Argenta –Battle Creek and Argenta – Tompkins 345 kV transmission lines in southern Michigan at 16:10:36. Upon tripping of these lines the disturbance entered into a dynamic phase characterized by significant power swings resulting in electrical separation of portions of the power system. Within the time delay associated with high‐speed reclosing (500 ms) the angles between the terminals of these lines reached 80 degrees and 120 degrees respectively prior to unsuccessful high‐speed reclosing of these lines. The next line trips in the sequence of events occurred as a result of power swings. These trips occurred on the Thetford – Jewell and Hampton – Pontiac 345 kV transmission lines north of Detroit at 16:10:38. These lines tripped as the result of apparent impedance trajectories passing through the directional comparison trip relay characteristics at both terminals of each line. All subsequent line trips occurred as the result of power swings. All but two of these trips occurred during unstable power swings. A few of the events relevant to this subject are discussed below.
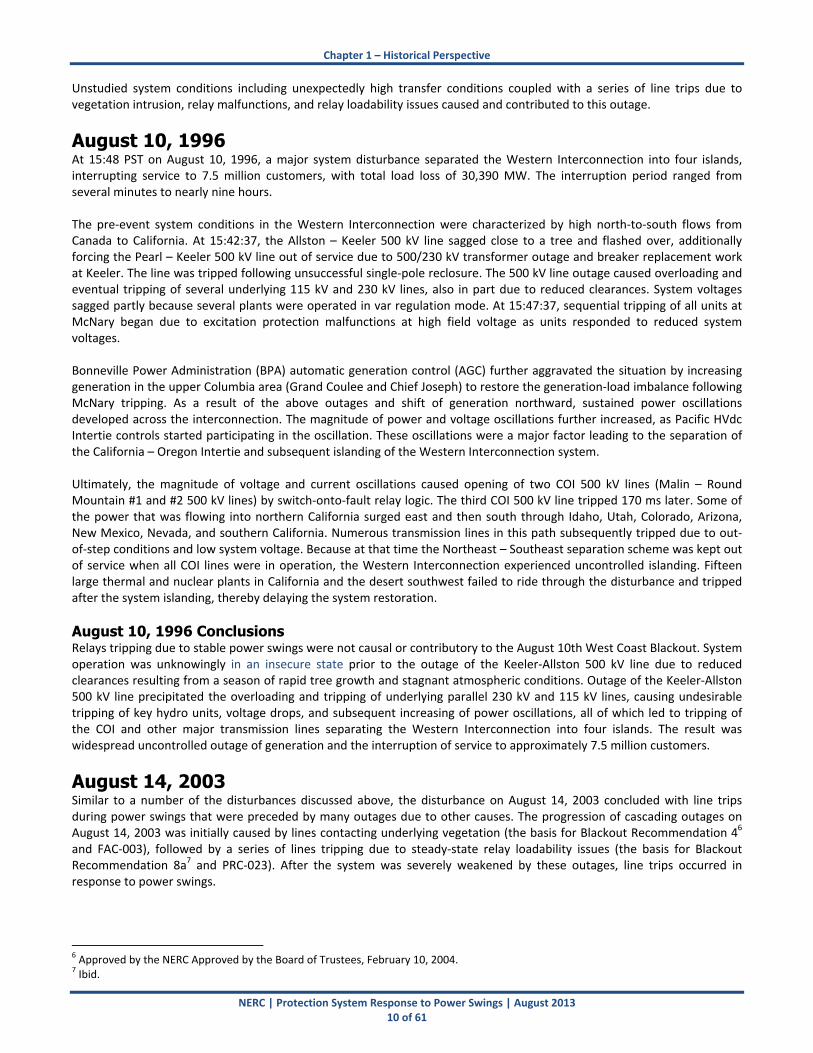
Perry-Ashtabula-Erie West 345 kV Transmission Line Trip The Perry – Ashtabula – Erie West 345 kV line is a three‐terminal line between Perry substation in northeast Ohio and Erie West substation in northwest Pennsylvania, with a 345‐138 kV autotransformer tapped at the Ashtabula substation in northeast Ohio. This transmission line trip is interesting because the line tripped at the Perry terminal by its zone 3 relay. Typically zone 3 line trips are associated with relay loadability issues, as the zone 3 time delay typically is set longer than the time it would take for a power swing to traverse the relay trip characteristic. The fact that the protection system trip was initiated by the zone 3 relay raises questions as to whether the power swing was stable or unstable. The rate‐of‐change of an apparent impedance trajectory typically is used as a discriminant to identify unstable swings, based on the assumption that higher rates‐of‐change are associated with unstable swings. In this case the speed of the apparent impedance
8 U.S.‐Canada Power System Outage Task Force, Final Report on the August 14, 2003 Blackout in the United States and Canada: Causes and Recommendations (Apr. 2004) (“Blackout Report”). 9 Transmission Relay Loadability Reliability Standard, 134 FERC 61,127, Order No. 733‐A (2011) (“Order No. 733‐A”). Order No. 733‐A at P.110. 10 Id, P.111. 11 Blackout Report at p. 82. 12 NERC Informational Filing, at p. 6.
Chapter 1 – Historical Perspective
NERC | Protection System Response to Power Swings | August 2013 12 of 61
trajectory was relatively slow, as it would need to be to remain within the zone 3 characteristic long enough to initiate a trip. Dynamic simulation of the event confirmed that while this swing was slow to develop, had the line not been tripped by its zone 3 relay the swing eventually would have entered the zone 1 relay characteristic at the Erie West terminal followed by a loss of synchronism condition. Figure 1 presents the simulated apparent impedance trajectory observed from the Perry line terminal. This figure shows that the apparent impedance swing was moving away from the relay characteristic up to the time of the Argenta – Battle Creek and Argenta – Tompkins 345 kV line trips, at which time the trajectory reversed direction and entered the zone 3 relay characteristic from the second quadrant. The apparent impedance remained in the relay characteristic long enough to initiate a zone 3 trip.
Figure 1: Apparent Impedance Trajectory for Perry – Ashtabula 345 kV Line on August 14, 2003
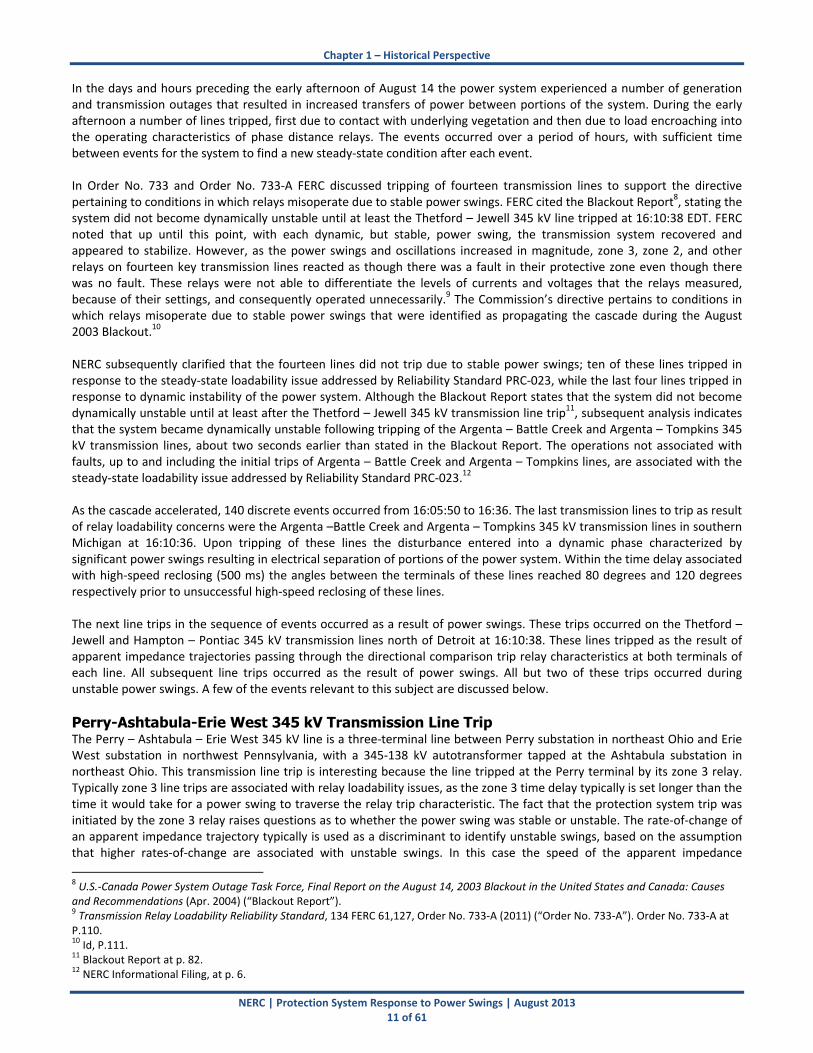
Figure 2 presents the simulated apparent impedance observed from the Erie West terminal. The first (green) apparent impedance trajectory is the simulated trajectory with the zone 3 trip at Perry simulated. With the 345 kV path from Erie West to Perry interrupted, the decreased flow on the line from Erie West into the 345‐138 kV transformer at Ashtabula resulted in the apparent impedance moving to a new trajectory further from the Erie West terminal. The apparent impedance trajectory was resimulated with tripping of the Perry terminal blocked. The second (blue) trajectory demonstrates that the next swing would have been unstable, passing through the zone 1 relay characteristic and eventually crossing the system impedance indicative of a loss of synchronism condition with the system angle increasing beyond 180 degrees.
‐75 ‐45 ‐15 ‐15 45 75
Apparent Resistance (Primary Ohms)
120
90
60
30
0
‐30
Apparen
t Reactance (Primary Ohms)
Argenta‐Battle Creek and Argenta‐Tompkings trips
Chapter 1 – Historical Perspective
NERC | Protection System Response to Power Swings | August 2013 13 of 61
Figure 2: Apparent Impedance Trajectory for Erie West – Ashtabula 345 kV Line on August 14, 2003
In addition to the Perry – Ashtabula – Erie West trip demonstrating that the apparent impedance trajectory of a power swing can result in a time delayed trip, it also demonstrates that for severely stressed system conditions with a rapid succession of events exciting multiple dynamic modes, the resulting apparent impedance trajectories may vary significantly from the traditional textbook trajectories that are based on two‐machine system models. This points to the difficulty of establishing standardized applications to address out‐of‐step conditions that are both secure and dependable for all possible system conditions.
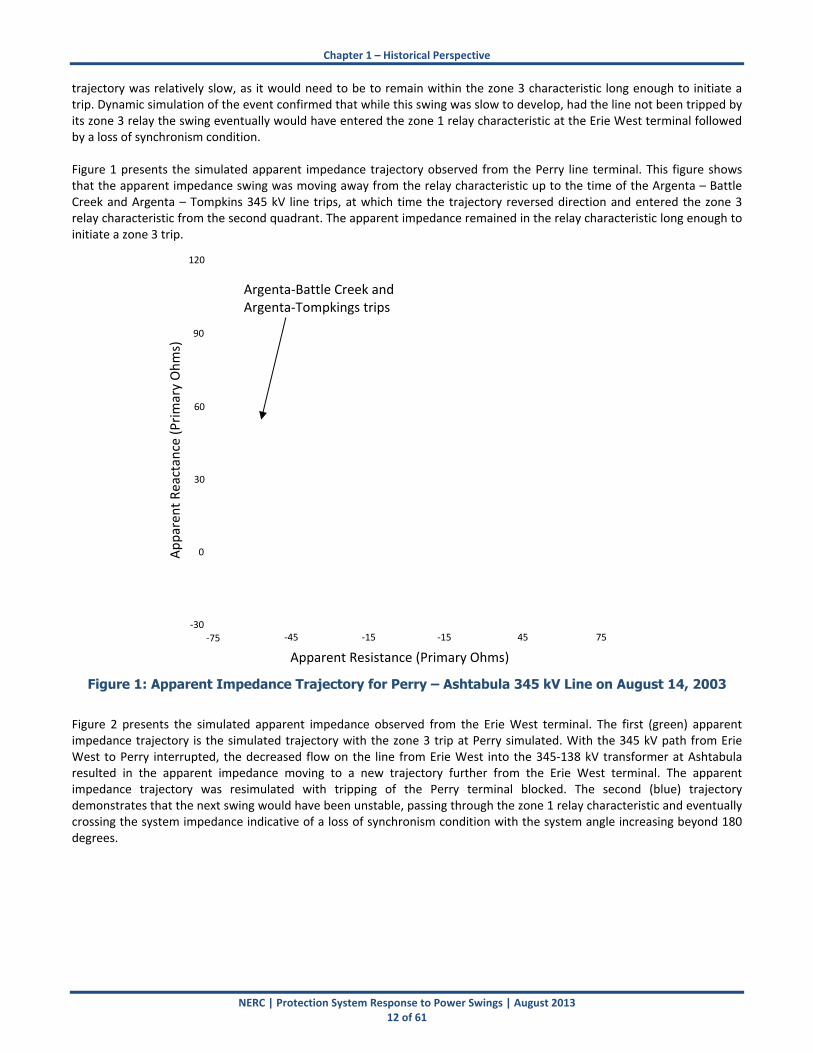
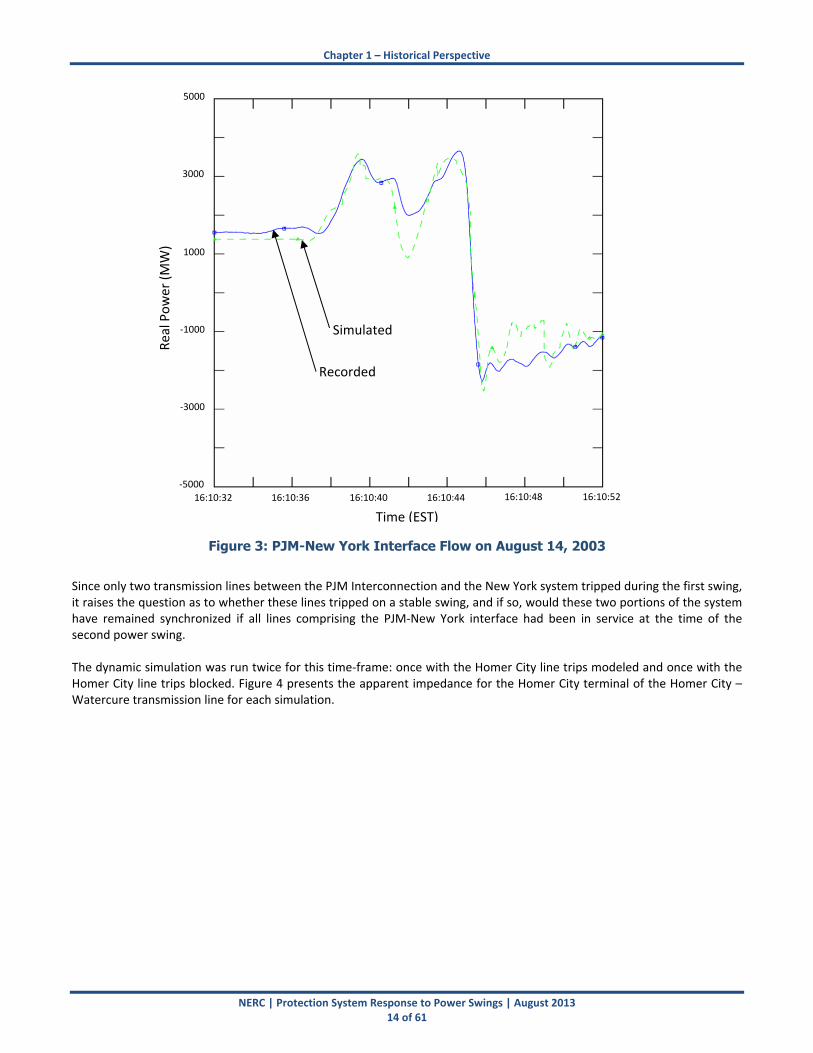
Homer City – Watercure and Homer – City Stolle Rd 345 kV Transmission Line Trips These two transmission lines connect the Homer City generating plant in central Pennsylvania to the Watercure and Stolle Rd substations in western New York. As the power swing traveled across the system, this was the next place the swing was observable: along the interface between New York and the PJM Interconnection. These two transmission lines were tripped by their respective zone 1 relays at Homer City. The recorded and simulated powerflow across this interface are presented in Figure 3 below. Following the separation in southern Michigan, two swings occurred between the New York and PJM systems. The first swing occurred at approximately 16:10:39.5 corresponding to tripping of the Homer City – Watercure and Homer City – Stolle Road 345 kV transmission lines. The second swing occurred approximately 4 seconds later corresponding with the New York‐PJM separation completed by the Branchburg – Ramapo 500 kV line trip.
‐75 ‐45 ‐15 ‐15 45 75
Apparent Resistance (Primary Ohms)
120
90
60
30
0
‐30
Apparen
t Reactance (Primary Ohms)
Perry terminal trip
Simulation with Perry terminal trip
Simulation without Perry terminal trip
Chapter 1 – Historical Perspective
NERC | Protection System Response to Power Swings | August 2013 14 of 61
Figure 3: PJM-New York Interface Flow on August 14, 2003
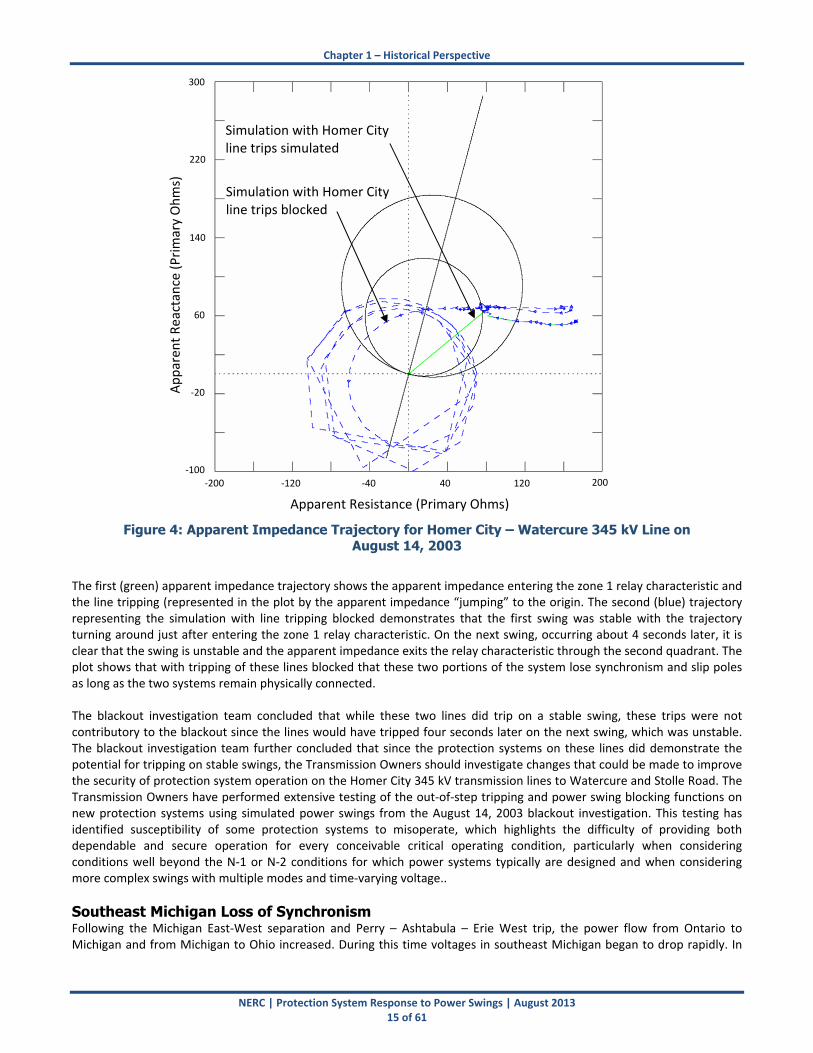
Since only two transmission lines between the PJM Interconnection and the New York system tripped during the first swing, it raises the question as to whether these lines tripped on a stable swing, and if so, would these two portions of the system have remained synchronized if all lines comprising the PJM‐New York interface had been in service at the time of the second power swing. The dynamic simulation was run twice for this time‐frame: once with the Homer City line trips modeled and once with the Homer City line trips blocked. Figure 4 presents the apparent impedance for the Homer City terminal of the Homer City – Watercure transmission line for each simulation.
16:10:32 16:10:36 16:10:40 16:10:44 16:10:48 16:10:52
Time (EST)
5000
3000
1000
‐1000
‐3000
‐5000
Real Power (MW)
Simulated
Recorded
Chapter 1 – Historical Perspective
NERC | Protection System Response to Power Swings | August 2013 15 of 61
Figure 4: Apparent Impedance Trajectory for Homer City – Watercure 345 kV Line on August 14, 2003
The first (green) apparent impedance trajectory shows the apparent impedance entering the zone 1 relay characteristic and the line tripping (represented in the plot by the apparent impedance “jumping” to the origin. The second (blue) trajectory representing the simulation with line tripping blocked demonstrates that the first swing was stable with the trajectory turning around just after entering the zone 1 relay characteristic. On the next swing, occurring about 4 seconds later, it is clear that the swing is unstable and the apparent impedance exits the relay characteristic through the second quadrant. The plot shows that with tripping of these lines blocked that these two portions of the system lose synchronism and slip poles as long as the two systems remain physically connected. The blackout investigation team concluded that while these two lines did trip on a stable swing, these trips were not contributory to the blackout since the lines would have tripped four seconds later on the next swing, which was unstable. The blackout investigation team further concluded that since the protection systems on these lines did demonstrate the potential for tripping on stable swings, the Transmission Owners should investigate changes that could be made to improve the security of protection system operation on the Homer City 345 kV transmission lines to Watercure and Stolle Road. The Transmission Owners have performed extensive testing of the out‐of‐step tripping and power swing blocking functions on new protection systems using simulated power swings from the August 14, 2003 blackout investigation. This testing has identified susceptibility of some protection systems to misoperate, which highlights the difficulty of providing both dependable and secure operation for every conceivable critical operating condition, particularly when considering conditions well beyond the N‐1 or N‐2 conditions for which power systems typically are designed and when considering more complex swings with multiple modes and time‐varying voltage..
Southeast Michigan Loss of Synchronism Following the Michigan East‐West separation and Perry – Ashtabula – Erie West trip, the power flow from Ontario to Michigan and from Michigan to Ohio increased. During this time voltages in southeast Michigan began to drop rapidly. In
‐200 ‐120 ‐40 40 120 200
Apparent Resistance (Primary Ohms)
300
220
140
60
‐20
‐100
Apparen
t Reactance (Primary Ohms)
Simulation with Homer City line trips blocked
Simulation with Homer City line trips simulated
Chapter 1 – Historical Perspective
NERC | Protection System Response to Power Swings | August 2013 16 of 61
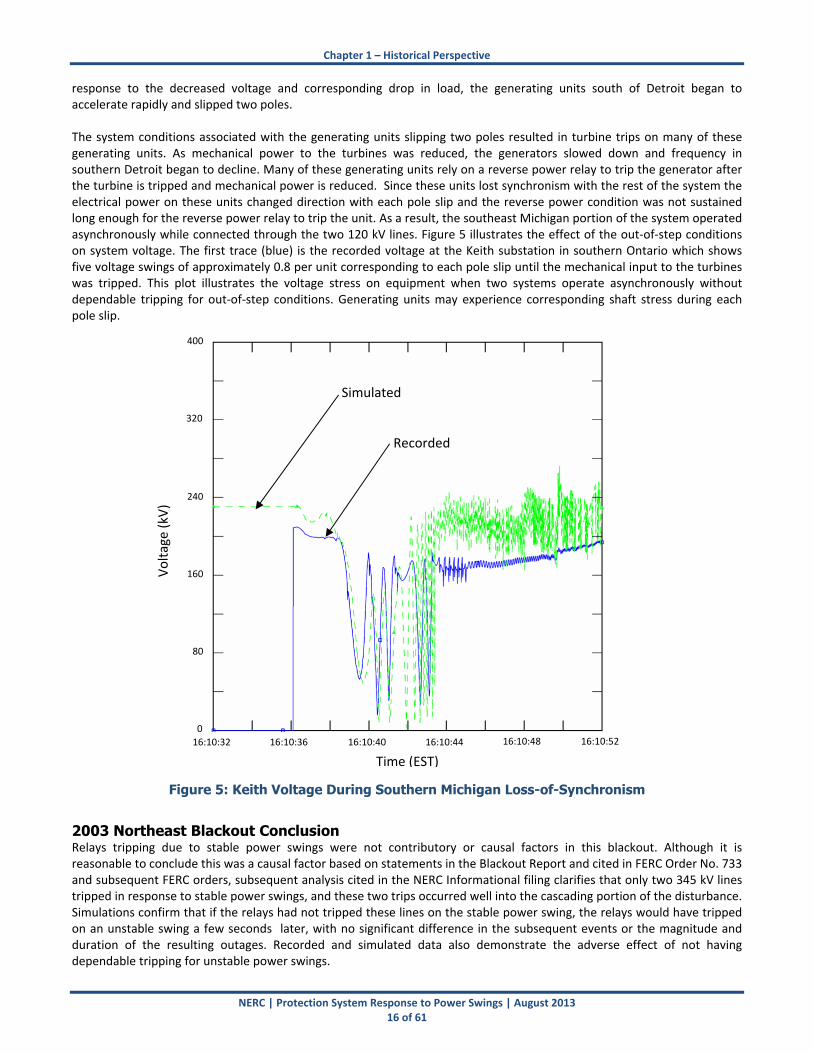
response to the decreased voltage and corresponding drop in load, the generating units south of Detroit began to accelerate rapidly and slipped two poles. The system conditions associated with the generating units slipping two poles resulted in turbine trips on many of these generating units. As mechanical power to the turbines was reduced, the generators slowed down and frequency in southern Detroit began to decline. Many of these generating units rely on a reverse power relay to trip the generator after the turbine is tripped and mechanical power is reduced. Since these units lost synchronism with the rest of the system the electrical power on these units changed direction with each pole slip and the reverse power condition was not sustained long enough for the reverse power relay to trip the unit. As a result, the southeast Michigan portion of the system operated asynchronously while connected through the two 120 kV lines. Figure 5 illustrates the effect of the out‐of‐step conditions on system voltage. The first trace (blue) is the recorded voltage at the Keith substation in southern Ontario which shows five voltage swings of approximately 0.8 per unit corresponding to each pole slip until the mechanical input to the turbines was tripped. This plot illustrates the voltage stress on equipment when two systems operate asynchronously without dependable tripping for out‐of‐step conditions. Generating units may experience corresponding shaft stress during each pole slip.
Figure 5: Keith Voltage During Southern Michigan Loss-of-Synchronism
2003 Northeast Blackout Conclusion Relays tripping due to stable power swings were not contributory or causal factors in this blackout. Although it is reasonable to conclude this was a causal factor based on statements in the Blackout Report and cited in FERC Order No. 733 and subsequent FERC orders, subsequent analysis cited in the NERC Informational filing clarifies that only two 345 kV lines tripped in response to stable power swings, and these two trips occurred well into the cascading portion of the disturbance. Simulations confirm that if the relays had not tripped these lines on the stable power swing, the relays would have tripped on an unstable swing a few seconds later, with no significant difference in the subsequent events or the magnitude and duration of the resulting outages. Recorded and simulated data also demonstrate the adverse effect of not having dependable tripping for unstable power swings.
16:10:32 16:10:36 16:10:40 16:10:44 16:10:48 16:10:52
Time (EST)
400
320
240
160
80
0
Voltage (kV)
Simulated
Recorded

Chapter 1 – Historical Perspective
NERC | Protection System Response to Power Swings | August 2013 17 of 61
September 8, 2011 Arizona-California Outages This disturbance is well documented in the April 2012 FERC/NERC Staff Report on the September 8, 2011 Blackout, available on the NERC website. Twenty seven findings and recommendations were made in this report. Relays tripping due to stable power swings were not cited in any of the recommendations from the NERC/FERC report. Relays tripping due to stable power swings were not contributory or causal factors in this blackout.
Other Efforts from the 2003 Blackout Affecting Relay Response to Stable Power Swings The August 14, 2003 northeast blackout spawned the effort that raised the bar on relay loadability. Efforts included the “Zone 3” and “Beyond Zone 3” relays reviews that preceded development of the PRC‐023 Transmission Relay Loadability standard. The SPCTF report, Protection System Review Program – Beyond Zone 3, dated December 7, 2006 identified that 22 percent of the 11,499 EHV relays reviewed required changes to meet the NERC Recommendation 8a criterion or a Technical Exception (equivalent to the criteria under Requirement R1 of PRC‐023‐2). Methods used to attain the greater loadability typically included limiting relay reaches or changing relay characteristic shapes or both. These relay changes affected relays with the largest distance zones susceptible to tripping on stable power swings such as the Perry – Ashtabula – Erie West zone 3 trip discussed above. In many cases these relay changes also affected distance zones that trip high‐speed such as zone 2 functions that are part of communication‐assisted protection systems, and in some cases even zone 1 relays that trip without intentional time delay. While it is not possible to quantify the extent to which these modifications improved security against tripping for stable power swings, reducing the resistive reach of phase distance protection functions does increase the power system angular separation necessary to enter the relay characteristic. Thus, these changes increased security throughout North America for relays susceptible to tripping on stable power swings.
Overall Observations from Review of Historical Events Relays tripping on stable power swings were not causal or contributory in any of the historical events reviewed. Causal factors in the events included lines sagging into trees, lines tripping via relay action due to high loads, lines tripping due to relay malfunctions, and other causes. These causes have been addressed in several NERC Reliability Standards. Relays tripping on unstable swings occurred in several of the historical events reviewed. The tripping was not causal or contributory as tripping on unstable swings occurs after the system has reached the point of instability, cascading, or uncontrolled separation. However, it is possible that the scope of some events may have been greater without dependable tripping on unstable swings to physically separate portions of the system that lost synchronism.
NERC | Protection System Response to Power Swings | August 2013 18 of 61
Chapter 2 – Reliability Issues Dependability and Security When considering power swings, both facets of protection system reliability are important to consider. To support power system reliability it is desirable that protection systems are secure to prevent undesired operation during stable power swings. It also is desirable to provide dependable means to separate the system in the event of an unstable power swing. Protection system security during stable swings is important to maintaining reliable power system operation. Unnecessary tripping of transmission lines during stable power swings may lead to cascade tripping due to increased loading on parallel circuits or may lead directly to power system instability by increasing the apparent impedance between two portions of the system. Ensuring that dependable means are available to separate portions of the system that have lost synchronism is essential to maintaining reliable power system operation. Failing to physically separate portions of the system that have lost synchronism will result in adverse impacts due to the system slipping poles, resulting in significant voltage and power flow deviations occurring at the system slip frequency. Near the electrical center of the power swing the voltage deviations will have amplitude of nearly 1 per unit, stressing equipment insulation. Rapid changes in power flow also stress equipment, in particular rotating machines that are participating in the swings.
Trade-offs Between Security and Dependability Secure and dependable operation of protection systems are both important to power system reliability. While methods for discriminating between stable and unstable power swings have improved over time, ensuring both secure and dependable operation for all possible system events remains a challenge. Testing out‐of‐step functions using simulated power system swings from the August 14, 2003 blackout investigation has identified susceptibility of some protection systems to misoperate, which highlights the difficulty of providing both dependable and secure operation for every conceivable critical operating condition, particularly when considering conditions well beyond the N‐1 or N‐2 conditions for which power systems typically are designed and when considering more complex swings with multiple modes and time‐varying voltage. While the directive in Order No. 733 is focused on protective relays operating unnecessarily due to stable power swings, it is important that focusing on this aspect of security does not occur to the detriment of system reliability by producing the unintended consequence of decreasing ability to dependably identify unstable swings and separate portions of the system that have lost synchronism. It certainly is possible to provide transmission line protection that can discriminate between fault and power swing conditions. Current‐based protection systems such as current differential or phase comparison can be utilized to provide a high degree of security against operation for stable power swings. However, application of such protection systems in locations where the system may be prone to unstable power swings does not provide a dependable means of separating portions of the system that lose synchronism. In such cases it would be necessary to install out‐of‐step protection to initiate system separation, which reintroduces the need to discriminate between stable and unstable power swings. Installing current‐based protection systems does not remove the need to install impedance‐based back up protection, which reintroduces the need to discriminate between stable and unstable power swings. Recognizing that no one protection system design can provide security and dependability for all possible power swings under all possible system conditions, two questions must be considered: (1) for what conditions must protection systems operate reliably, and (2) under conditions for which reliable operation cannot be assured, should protection system design err on the side of security or dependability. The trade‐offs between secure and dependable operation in response to system faults are discussed much more frequently than the trade‐offs in response to power swings; however, there are similarities when comparing fault and power swing conditions. In both cases, a lack of dependability is more likely to result in an undesirable outcome. For a fault condition, a failure to trip will result in increased equipment damage and acceleration of rotating machines that may result in system instability. For an unstable power swing, a failure to trip will result in portions of the system slipping poles against each other and resultant increased equipment stress and an increased probability of system collapse.
Chapter 2 – Reliability Issues
NERC | Protection System Response to Power Swings | August 2013 19 of 61
By comparison, tripping an additional circuit in response to a fault may lead to unacceptable system performance; however, the potential for equipment damage or instability is less than for a failure to trip, particularly in highly networked systems. In theory tripping a circuit for a stable power swing may lead to cascade tripping of power system circuits; however, analysis of historical events supports that the probability of undesirable system performance is less than for a failure to trip for an unstable swing. Given the relative risks associated with a lack of dependable operation for unstable power swings and the lack of secure operation for stable swings, over‐emphasizing secure operation for stable powers swings could be detrimental to Bulk‐Power System reliability. It therefore is preferable to emphasize dependability over security when it is not possible to ensure both for all possible system conditions.

NERC | Protection System Response to Power Swings | August 2013 20 of 61
Chapter 3 – Reliability Standard Considerations Need for a Standard Based on its review of historical events, consideration of the trade‐offs between dependability and security, and recognizing the indirect benefits of implementing the transmission relay loadability standard (PRC‐023), the SPCS concludes that a NERC Reliability Standard to address relay performance during stable swings is not needed, and could result in unintended adverse impacts to Bulk‐Power System reliability. In the course of coming to this conclusion, however, the SPCS has developed recommendations for implementing a standard. Given the directive in FERC Order No. 733 and the Standards Committee request for research to support Project 2010‐13.3, the SPCS recommends that if a standard is developed it should include the following applicability and requirements.
Applicability Two options exist for developing requirements for secure operation of protection systems during power swings: (i) develop requirements applicable to protection systems on all circuits, or (ii) identify the circuits on which a power swing may affect protection system operation and develop requirements applicable to protection systems on those specific circuits. The effort to assess every protection system to assure it will not operate during stable power swings would be significant. An equally effective and more efficient approach would be to identify the types of circuits on which protection systems would be challenged by power swings, and limit the applicability of a new standard to these circuits. During development of this report the SPCS explored the possibility of recommending a standard applicable to all circuits and requiring that entities verify for each circuit that either a power swing will not pass through the circuit or that the protection system on the circuit would not operate for a stable power swing. The SPCS investigated several different approaches including the analytical assessment and system study approaches described in Appendix D. Analysis of the various approaches indicated that applying one or more of these approaches to each circuit would be a significant effort with varying results that are dependent on the system topology and the assumptions specified for the analysis. Extreme system topologies are often present during actual relay trips during power swings. These topologies would be very difficult to anticipate in a study. The historical evidence supports taking a more efficient approach to limit burden on responsible entities given the limited role that undesired tripping in response to stable power swings has played in major disturbances. Such an approach is consistent with taking a risk‐based approach to Reliability Standards by focusing the applicability to circuits on which protection systems are most likely to be affected during power swings. This section recommends an approach for identifying those power system circuits on which protection systems are susceptible to operation for stable power swings. Although past system disturbances do not provide specific input on which circuits are most at risk, past disturbances demonstrate it is not necessary for a Reliability Standard to apply to all lines. In the absence of direct input from past disturbances, the SPCS believes it is reasonable to recommend an approach that uses information from existing planning and operating studies and experience, and physical attributes of power systems. This approach provides the opportunity to effectively identify circuits of concern without requiring extensive, and in many cases duplicative, studies. The recommended approach is an effective and efficient manner that can be used to limit the number of circuits for which entities are required to evaluate and provide a basis for protection system response during power swings.
Identification of Circuits with Protection Systems Subject to Effects of Power Swings Power system swings, stable or unstable, are caused by the relative motion of generators with respect to each other. These power swings manifest themselves as swings in the apparent impedance “seen” by protective relays due to the variations in voltages and currents which occur during these swings. Power swings are classified as local mode or inter‐area mode. Local mode oscillations are characterized by units at a generating station swinging with respect to the rest of the system. This is in contrast to inter‐area mode oscillations, where a coherent group13 of generating stations in one part of the system is swinging against another coherent group of generators in a different part of the system.
13 In this context, the generators in a coherent group exhibit similar waveforms for their rotor‐angle response to a system disturbance.

Chapter 3 – Reliability Standard Considerations
NERC | Protection System Response to Power Swings | August 2013 21 of 61
The electrical center of a local mode swing tends to remain relatively close to the generating station that is causing the swing. The electrical center of an inter‐area mode oscillation will occur between the two coherent groups of generators. Therefore, it can be concluded that stable power swings are most likely to challenge protective relays on lines terminating at generating stations or on lines between coherent groups of generators. This is a useful filter in identifying transmission lines on which protective relays should be subject to the Reliability Standard. The electrical center of a power swing is determined by physical characteristics of the system. The electrical center may vary depending on the dispatch of generators and status of transmission equipment making it difficult to assure that all possible power swings are identified. This is particularly true when considering power swings that may occur during major system disturbances after a number of circuits have tripped. However, it is possible to identify the most likely locations of electrical centers of power swings and focus attention on protections systems applied on the circuits where the electrical centers exist. In the case of local mode oscillations the electrical center is most likely to occur in the generator step‐up (GSU) transformer or on a transmission line connected to the bus on the high‐side of the GSU transformer. In the case of an inter‐area oscillation the electrical center is more difficult to predict; however, the electrical center already will have been identified if any planning or operating studies have identified the need to apply a System Operating Limit (SOL) based on stability constraints, or if other studies or event analyses have identified the potential for tripping during a system disturbance that includes power swings. The standard drafting team should consider the following criteria in establishing the applicability of the Reliability Standard to limit applicability to only those transmission lines on which protective relays are most likely to be challenged during stable power swings.
Lines terminating at a generating plant, where a generating plant stability constraint is addressed by an operating limit or Special Protection System (SPS) (including line‐out conditions).
Lines that are associated with a System Operating Limit (SOL) that has been established based on stability constraints identified in system planning or operating studies (including line‐out conditions).
Lines that have tripped due to power swings during system disturbances.
Lines that form a boundary of the Bulk Electric System that may form an island.14
Lines identified through other studies, including but not limited to, event analyses and transmission planning or operational planning assessments.
Benefits of Defining Applicability for Specific Circuit Characteristics Limiting the applicability of a Reliability Standard provides a number of benefits.
Efforts may be more focused, creating the possibility to include dynamic simulations assessing a greater number of fault types and system configurations.
It may be possible, subject to relay model availability, to model specific relay settings in the dynamic simulation software, to more precisely identify the likelihood of a stable swing entering the relay characteristic. Including relay models in transient stability simulations could be used to monitor security of settings and identify potential concerns. Present software and computing developments are reducing limitations that historically have prevented such modeling, as well as practical limits to managing the volume of data. However, models are not presently available for all tripping relay characteristics, such as when load encroachment features are used to limit the trip characteristic to meet relay loadability requirements.
Requirements The following requirements should be applicable to the circuits identified in the preceding section to mitigate the risk of protection systems operating during stable power swings.
A requirement for each Reliability Coordinator and Planning Coordinator to identify lines that meet the criteria in the applicability section and notify the owners of applicable circuits.
14 See NERC Reliability Standard PRC‐006‐1 – Automatic Underfrequency Load Shedding, Requirement R1.
Chapter 3 – Reliability Standard Considerations
NERC | Protection System Response to Power Swings | August 2013 22 of 61
A Functional Model entity with a wide‐area view should have responsibility for identifying the circuits to which the standard is applicable. This approach promotes consistent application of the criteria and assures that facility owners are aware of their responsibilities, given that a facility owner may not be aware of all relevant system studies. It is most appropriate to assign this responsibility to the Reliability Coordinator and the Planning Coordinator given their wide‐area view and awareness of reliability issues. Both entities should be involved since stability issues may be identified in both operating and planning studies. The standard should require periodic review to assure the list of applicable circuits is up‐to‐date.
A requirement for each facility owner to document its basis for applying protection to each of its applicable circuits (as identified above), and provide this information to its Reliability Coordinator, Planning Coordinator, and Transmission Planner.15
There are multiple ways for a facility owner to mitigate the potential of protection systems tripping for stable power swings. In some cases conventional impedance‐based protection may be acceptable (e.g., on a short line a mho characteristic may not be susceptible to tripping for stable swings), in other cases a modified protection characteristic may be suitable, in some cases it may be appropriate to supervise the protection to enable or to block tripping during power swings, and in some cases the consequences of failing to trip for an unstable swing may be so significant that a risk of tripping for some stable swings is deemed in the best interest of Bulk‐Power System reliability. Decisions whether to apply out‐of‐step protection should be made between the facility owner who has knowledge of the protection system design and the Reliability Coordinator, Planning Coordinator, and Transmission Planner who have knowledge of the characteristics of the power system performance. The documented basis should include rationale for whether out‐of‐step protection is needed, and if so, whether out‐of‐step tripping or power swing blocking is applied. Although this requirement is focused on documentation, this information is necessary for Reliable Operation of the Bulk‐Power System. Entities responsible for operating and planning the Bulk‐Power System need this information to understand how protection systems may respond during extreme system conditions. Entities may find the information presented in the appendices of this report useful in developing a basis for applying protection to each applicable line.
The SPCS discussed additional requirements related to modeling the tripping functions of phase protection systems responsive to power swings. Modeling these protective functions in transient stability simulations could be an effective method of verifying that protection systems will not operate on stable power swings. Default phase distance relay models exist in simulation software that can be used to monitor apparent impedance and identify lines and conditions where relay operation is possible, as well as explicit models for many typical trip function characteristics. However, existing models do not address some of the unique features, such as load encroachment, that many entities have utilized to meet the transmission relay loadability requirements. The SPCS supports use of existing relay models in operating studies and transmission planning assessments; however, the SPCS believes is not possible to implement a measurable requirement until explicit models are available. NERC, through its technical committees, could monitor the availability of relay models and provide further recommendations at an appropriate time. Modeling the tripping functions of phase protection systems responsive to power swings would enable the Reliability Coordinator, Planning Coordinator, and Transmission Planner to identify cases for which the protection systems applied are susceptible to tripping on stable power swings. Simulation results could provide important feedback since it is not practical to consider every potential power swing at the time settings are applied to a protection system. Given the difficulty of identifying all potential power swings, it is important that any information obtained through actual events and system studies is evaluated by the facility owner. In some cases this new information may identify the need to modify a protection system design or its settings. Decisions to modify a protection system, or not, should be made between the facility owner who has knowledge of the protection system design and the Reliability Coordinator, Planning Coordinator, and Transmission Planner who have knowledge of the characteristics of both the power system performance and protection system design. Decisions whether to modify a protection system should consider the need for dependable tripping during unstable power swings in addition to the objective of secure operation for stable power swings.
15 This and subsequent requirements should include all entities responsible for assessing dynamic performance of the Bulk‐Power System. The Reliability Coordinator has responsibility for operating studies and the Planning Coordinator and Transmission Planner have responsibility for transmission planning assessments.
NERC | Protection System Response to Power Swings | August 2013 23 of 61
Conclusions Operation of transmission line protection systems was not causal or contributory to six of the most significant system disturbances that have occurred since 1965. System separation during several of these disturbances did occur due to unstable power swings, and it is likely that the scope of some events and potential for equipment damage would have been greater without dependable tripping on unstable swings to physically separate portions of the system that lost synchronism. Given the relative risks associated with a lack of dependable operation for unstable power swings and the lack of secure operation for stable swings, it is generally preferable to emphasize dependability over security when it is not possible to ensure both for all possible system conditions. Prohibiting use of certain types of relays may have unintended negative outcomes for Bulk‐Power System reliability. Efforts to improve transmission relay loadability subsequent to the August 14, 2003 northeast blackout had a secondary effect of reducing the susceptibility of some protection systems to tripping on stable power swings. While it is not possible to quantify the extent to which these modifications improved security against tripping for stable power swings, reducing the resistive reach of phase distance protection functions does increase the power system angular separation necessary to enter the relay characteristic. Although current‐only‐based protection is immune to operating during power swings, exclusive use of current‐only‐based protection is not practical and would reduce dependability of tripping for system faults and unstable power swings. A power system with no remote backup protection is susceptible to uncleared faults and the inability to separate during unstable power swings during extreme system events. Although current‐only‐based protection is secure for stable power swings and can be used on lines which require tripping on out‐of‐step conditions, additional separate out‐of‐step protection is required. Application of impedance‐based backup protection and, where necessary, out‐of‐step protection, reintroduces the need to discriminate between stable and unstable power swings. Although many new algorithms exist to discriminate between stable and unstable swings, testing out‐of‐step functions using actual power system swings has identified susceptibility of some protection systems to misoperate, which highlights the difficulty of providing both dependable and secure operation.

NERC | Protection System Response to Power Swings | August 2013 24 of 61
Recommendations Based on its review of historical events, consideration of the trade‐offs between dependability and security, and recognizing the indirect benefits of implementing the transmission relay loadability standard (PRC‐023), the SPCS concludes that a NERC Reliability Standard to address relay performance during stable swings is not needed, and could result in unintended adverse impacts to Bulk‐Power System reliability. While the SPCS recommends that a Reliability Standard is not needed, the SPCS recognizes the directive in FERC Order No. 733 and the Standards Committee request for research to support Project 2010‐13.3. Therefore, the SPCS provides recommendations for applicability and requirements that can be used if NERC chooses to develop a standard.

NERC | Protection System Response to Power Swings | August 2013 25 of 61
Appendix A – Overview of Power Swings General Characteristics An electric power grid, consisting of generators connected to loads via transmission lines, is constantly in a dynamic state as generators automatically adjust their output to satisfy real and reactive power demand. During steady‐state operating conditions, a balance exists between the power generated and the power consumed, with the absolute differences in the voltages between buses typically maintained within 5 percent and frequency within 0.02 Hz of nominal. In the balanced system state, each generator in the system maintains its voltage and internal machine rotor angle at an appropriate relationship with the other generators as dictated by required power flow conditions in the system. Sudden changes in electrical power caused by power system faults, line switching, generator disconnection, or the loss or connection of large blocks of load, disturb the balance between the mechanical power into and the required electrical power out of generators, causing acceleration or deceleration of the generating units because the mechanical power input responds more slowly than the generator electrical power. Such system disturbances cause the machine rotor angles of the generators to swing or oscillate with respect to one another in the search for a new equilibrium state. During this period, transmission lines will experience power swings, which can be stable or unstable, depending of the severity of the disturbance. In a stable swing, the power system will return to a new equilibrium state where the generator machine rotor angle differences are within stable operating range to generate power that is balanced with the load. In an unstable swing, the generation and load do not find a balance and the machine rotor angles between coherent groups of generators continue to increase, eventually leading to loss of synchronism between the coherent groups of generators. The location at which loss of synchronism occurs is based on the physical attributes of the system and is unlikely to correspond to boundaries between neighboring utilities. When synchronism is lost among areas of a power system, the areas should be separated quickly to avoid equipment damage and to avoid possible collapse of the entire power system. Ideally, the system is separated at predetermined locations into self‐contained areas, each of which can maintain a generation/load balance, where the attainment of the balance may require appropriate generation or load shedding.
Impedance Trajectory The dynamic state of the power system can be represented by the impedance “seen” at a bus in the power system. The two machine equivalent shown in Figure 6 can be used to illustrate the concept, where the source voltages at the two ends of the system, EG and EH, are constant magnitudes behind their transient impedances, ZG and ZH.
Figure 6: Two-Machine Equivalent of a Power System
Figure 7, the geometrical interpretation of the power equation for this simple two source system, shows the R‐X diagram with a mho characteristic of the relay at Bus A, set to a typical zone 1 setting for protection of the line (line impedance is ZL). The total impedance across the system is represented by Points G to H, where ZG extends from the origin to point G in the third quadrant and ZH extends from the tip of ZL to Point H in the first quadrant.

Appendix A – Overview of Power Swings
NERC | Protection System Response to Power Swings | August 2013 26 of 61
Figure 7: Illustration of Electrical Center of the Equivalent Power System
With EG and EH of equal magnitude and with a phase angle difference of (EG leading) the apparent impedance during a swing will fall on a straight line perpendicular to and bisecting the total system impedance between G and H. As source EG
moves ahead of source EH in angle during a swing (with magnitudes of EG and EH equal), the angle increases. On the R‐X diagram, the angle formed by the intersection of lines PG and PH at P is the angle of separation between the source
voltages EG and EH. Point P on the R‐X diagram of Figure 7 is the apparent impedance seen at Bus A. When = 90º, the impedance lies on the circle whose diameter is the total impedance (GH) across the system. This is the point of maximum
load transfer between G and H. When reaches 120º, and beyond, the systems are not likely to recover.16 When the locus
intersects the total system impedance line GH, is 180º and the systems are completely out of phase. This point is called the electrical center (at the mid‐point of the total system impedance when EG and EH are of equal magnitude). The voltage is zero at this point and, therefore, it is equivalent to a three‐phase fault at the electrical center. As the impedance locus
moves to the left of impedance line GH, increases beyond 180º and eventually the systems will be in phase again. If the systems are not separated, source EG continues to move ahead of source EH, and the cycle repeats itself. When the impedance locus reaches the starting point of the swing, one slip cycle has been completed.
16 Application of Out‐of‐Step Blocking and Tripping Relays, John Berdy.
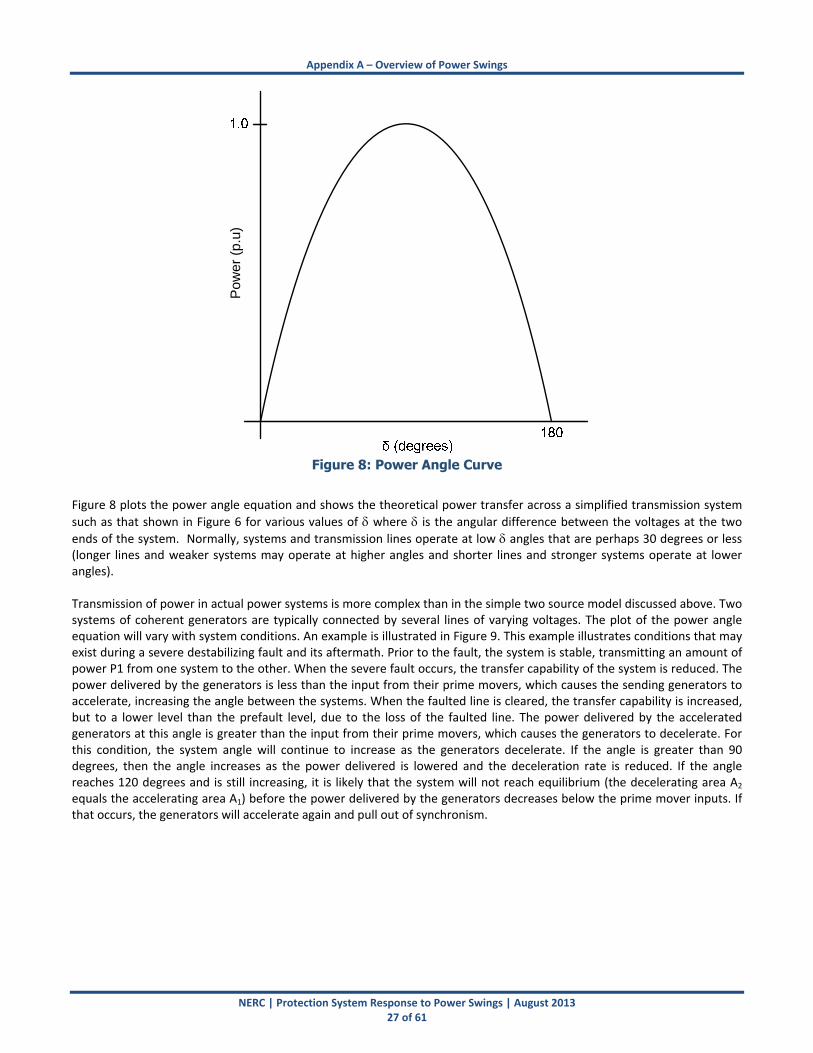
Appendix A – Overview of Power Swings
NERC | Protection System Response to Power Swings | August 2013 27 of 61
Figure 8: Power Angle Curve
Figure 8 plots the power angle equation and shows the theoretical power transfer across a simplified transmission system
such as that shown in Figure 6 for various values of where is the angular difference between the voltages at the two ends of the system. Normally, systems and transmission lines operate at low angles that are perhaps 30 degrees or less (longer lines and weaker systems may operate at higher angles and shorter lines and stronger systems operate at lower angles). Transmission of power in actual power systems is more complex than in the simple two source model discussed above. Two systems of coherent generators are typically connected by several lines of varying voltages. The plot of the power angle equation will vary with system conditions. An example is illustrated in Figure 9. This example illustrates conditions that may exist during a severe destabilizing fault and its aftermath. Prior to the fault, the system is stable, transmitting an amount of power P1 from one system to the other. When the severe fault occurs, the transfer capability of the system is reduced. The power delivered by the generators is less than the input from their prime movers, which causes the sending generators to accelerate, increasing the angle between the systems. When the faulted line is cleared, the transfer capability is increased, but to a lower level than the prefault level, due to the loss of the faulted line. The power delivered by the accelerated generators at this angle is greater than the input from their prime movers, which causes the generators to decelerate. For this condition, the system angle will continue to increase as the generators decelerate. If the angle is greater than 90 degrees, then the angle increases as the power delivered is lowered and the deceleration rate is reduced. If the angle reaches 120 degrees and is still increasing, it is likely that the system will not reach equilibrium (the decelerating area A2 equals the accelerating area A1) before the power delivered by the generators decreases below the prime mover inputs. If that occurs, the generators will accelerate again and pull out of synchronism.
Pow
er (
p.u)
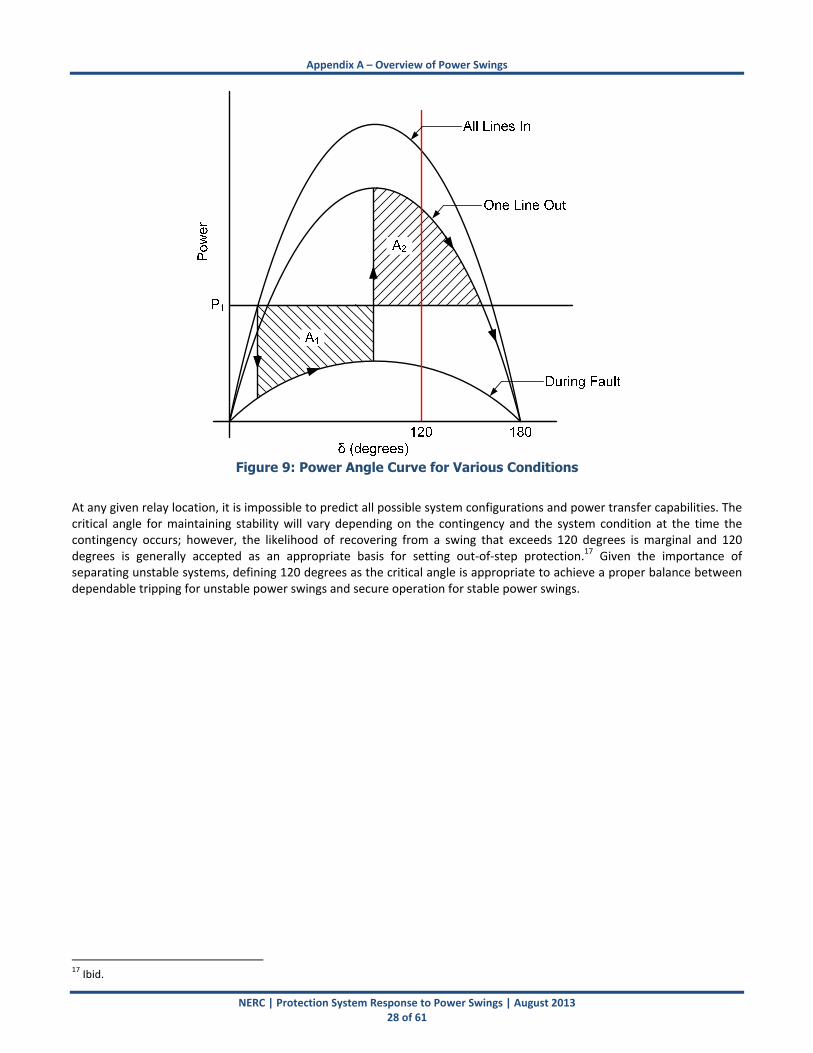
Appendix A – Overview of Power Swings
NERC | Protection System Response to Power Swings | August 2013 28 of 61
Figure 9: Power Angle Curve for Various Conditions
At any given relay location, it is impossible to predict all possible system configurations and power transfer capabilities. The critical angle for maintaining stability will vary depending on the contingency and the system condition at the time the contingency occurs; however, the likelihood of recovering from a swing that exceeds 120 degrees is marginal and 120 degrees is generally accepted as an appropriate basis for setting out‐of‐step protection.17 Given the importance of separating unstable systems, defining 120 degrees as the critical angle is appropriate to achieve a proper balance between dependable tripping for unstable power swings and secure operation for stable power swings.
17 Ibid.
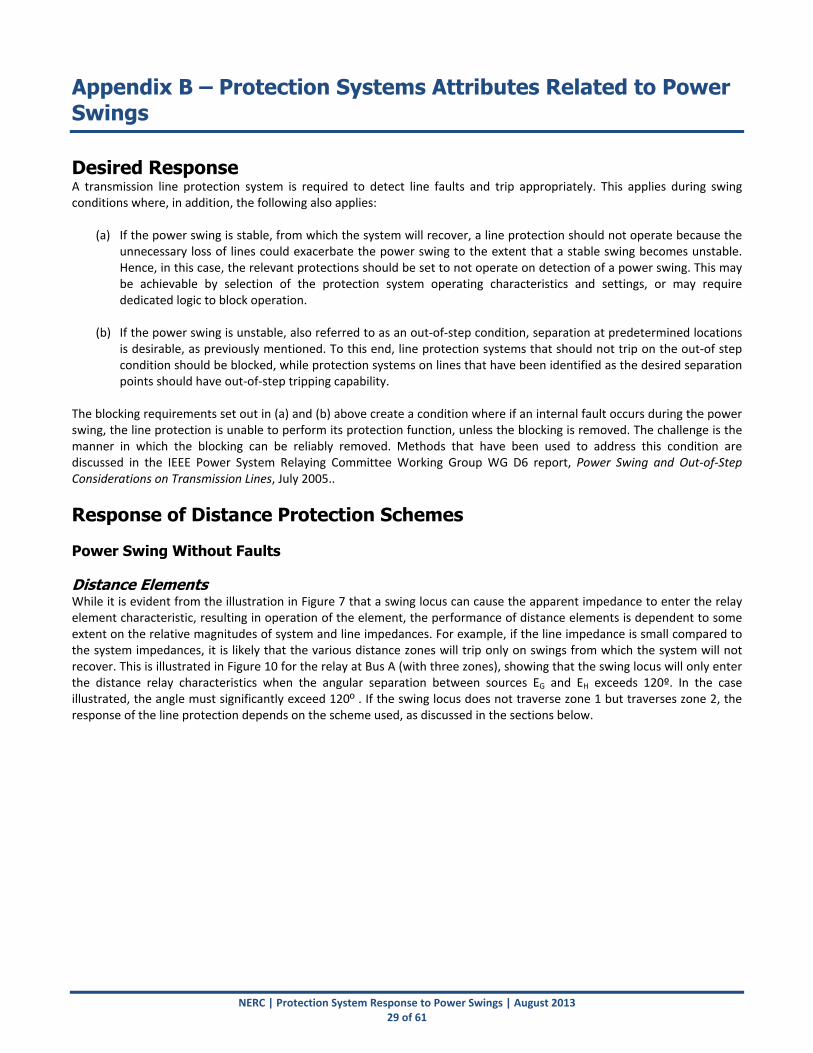
NERC | Protection System Response to Power Swings | August 2013 29 of 61
Appendix B – Protection Systems Attributes Related to Power Swings Desired Response A transmission line protection system is required to detect line faults and trip appropriately. This applies during swing conditions where, in addition, the following also applies:
(a) If the power swing is stable, from which the system will recover, a line protection should not operate because the unnecessary loss of lines could exacerbate the power swing to the extent that a stable swing becomes unstable. Hence, in this case, the relevant protections should be set to not operate on detection of a power swing. This may be achievable by selection of the protection system operating characteristics and settings, or may require dedicated logic to block operation.
(b) If the power swing is unstable, also referred to as an out‐of‐step condition, separation at predetermined locations is desirable, as previously mentioned. To this end, line protection systems that should not trip on the out‐of step condition should be blocked, while protection systems on lines that have been identified as the desired separation points should have out‐of‐step tripping capability.
The blocking requirements set out in (a) and (b) above create a condition where if an internal fault occurs during the power swing, the line protection is unable to perform its protection function, unless the blocking is removed. The challenge is the manner in which the blocking can be reliably removed. Methods that have been used to address this condition are discussed in the IEEE Power System Relaying Committee Working Group WG D6 report, Power Swing and Out‐of‐Step Considerations on Transmission Lines, July 2005..
Response of Distance Protection Schemes
Power Swing Without Faults
Distance Elements While it is evident from the illustration in Figure 7 that a swing locus can cause the apparent impedance to enter the relay element characteristic, resulting in operation of the element, the performance of distance elements is dependent to some extent on the relative magnitudes of system and line impedances. For example, if the line impedance is small compared to the system impedances, it is likely that the various distance zones will trip only on swings from which the system will not recover. This is illustrated in Figure 10 for the relay at Bus A (with three zones), showing that the swing locus will only enter the distance relay characteristics when the angular separation between sources EG and EH exceeds 120º. In the case illustrated, the angle must significantly exceed 120º . If the swing locus does not traverse zone 1 but traverses zone 2, the response of the line protection depends on the scheme used, as discussed in the sections below.
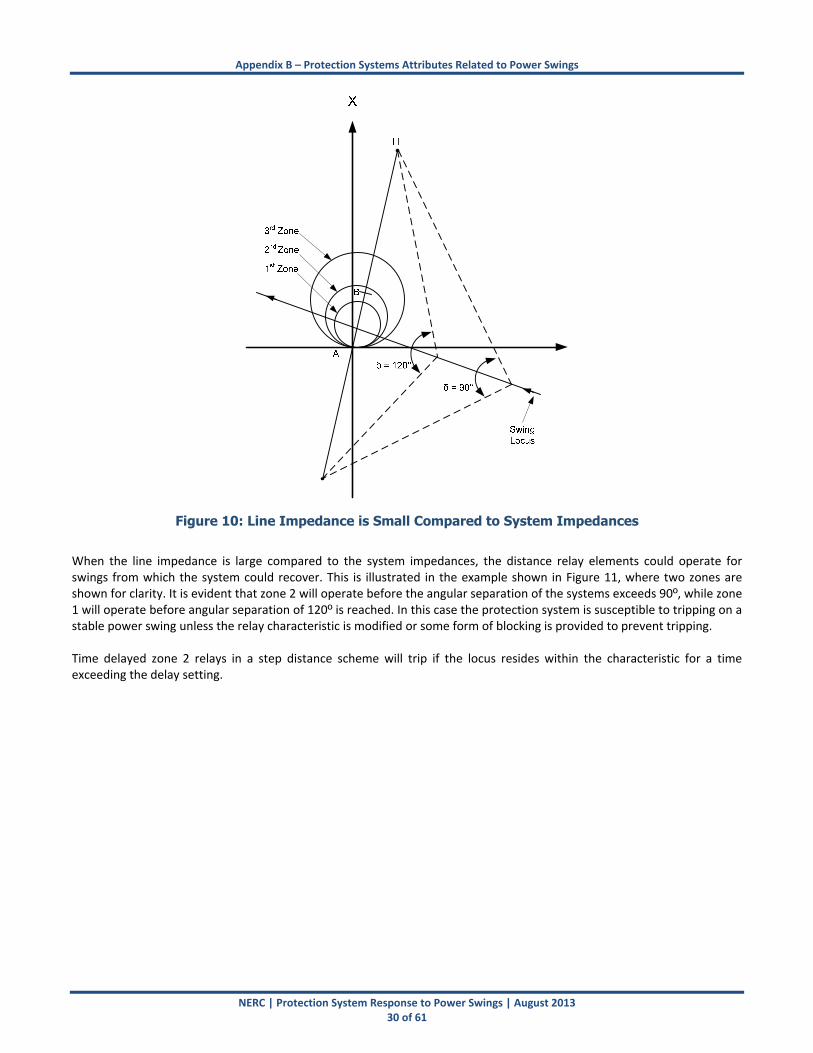
Appendix B – Protection Systems Attributes Related to Power Swings
NERC | Protection System Response to Power Swings | August 2013 30 of 61
Figure 10: Line Impedance is Small Compared to System Impedances
When the line impedance is large compared to the system impedances, the distance relay elements could operate for swings from which the system could recover. This is illustrated in the example shown in Figure 11, where two zones are shown for clarity. It is evident that zone 2 will operate before the angular separation of the systems exceeds 90º, while zone 1 will operate before angular separation of 120º is reached. In this case the protection system is susceptible to tripping on a stable power swing unless the relay characteristic is modified or some form of blocking is provided to prevent tripping. Time delayed zone 2 relays in a step distance scheme will trip if the locus resides within the characteristic for a time exceeding the delay setting.
Appendix B – Protection Systems Attributes Related to Power Swings
NERC | Protection System Response to Power Swings | August 2013 31 of 61
Figure 11: Line Impedance is Large Compared to System Impedances
Distance Relay Based Pilot Scheme Response to Power Swings Figure 12 Shows impedance elements as they are typically applied in directional comparison pilot schemes. The green characteristics represent zone 2 tripping elements. The tripping elements are used in both Directional Comparison Blocking (DCB) schemes, and Permissive Over Reaching (POR) schemes. The red characteristics represent blocking elements. They are used in all DCB schemes and many variations of POR schemes. Depending on the path of the impedance locus, power swings will affect the performance of DCB and POR schemes differently. To cause a POR scheme to open a line, the impedance locus must be within both zone 2 tripping characteristics simultaneously. For POR schemes employing transient blocking functions, the locus must enter both tripping characteristics within a short time of each other, usually within about a power cycle. A DCB scheme will open at least one line terminal any time the locus enters either tripping characteristic, without also entering a blocking characteristic. If the locus enters a blocking element, DCB schemes will transmit blocking signals, and POR terminals with blocking elements will not respond to received permissive signals. If a fault occurs on the protected line subsequent to the power swing locus entering the blocking element, a DCB scheme will trip. The performance of the POR terminal will depend on the system strength behind the terminal and on details of the permissive scheme logic associated with the blocking function.

Appendix B – Protection Systems Attributes Related to Power Swings
NERC | Protection System Response to Power Swings | August 2013 32 of 61
Figure 12: Directional Comparison Trip and Block
Response of Line Current Differential Protections With recent advancements in digital communication systems, the current differential principle has been effectively applied to line protection, providing good sensitivity for detection of line faults, including high resistance ground faults, while maintaining high degree of selectivity between internal and external faults. Many of these characteristics apply during power swing and out‐of‐step conditions. With the current differential principle measuring the current at one terminal of the line and computing the differential current with the current levels transmitted from the other terminal(s), the protection remains secure during a swing condition because the computed differential current remains below the threshold that would signify a fault. With increasing angular separation between the swinging systems, the current levels at each of the terminals increase beyond normal load levels, making the condition look like a through fault. Phase comparison protection systems exhibit performance similar to current differential protection systems. One shortcoming in the characteristics of these current‐only‐based protections is that during some portion of the power swing, the protection could become insensitive to line faults. For example, if a line fault occurs at the electrical center of a
two‐terminal system when the angular separation between the swinging systems is 180, the current levels at the two terminals are equal in magnitude and opposite in phase. This results in zero difference current, rendering the protection blind to this fault condition. However, as the power swing moves away from the electrical center (i.e., as the angular
separation becomes different from 180), the difference current becomes non‐zero, re‐establishing the protection’s sensitivity to detection of faults on the line being protected. Hence, the existence of the blind spot could delay the detection of some faults, as the angular separation needs to move from a less favorable to a more favorable value. The impact of this delay is system dependent, i.e., if the system slip is relatively fast, the delay could be minimal. For example, at
slip frequency of 5 Hz, angular separation of 180 takes place in 100 ms. so the blind spot could last for less than 10 ms. The blind spot lasts for correspondingly longer periods of time when the slip frequency is reduced.
Appendix B – Protection Systems Attributes Related to Power Swings
NERC | Protection System Response to Power Swings | August 2013 33 of 61
The shortcoming discussed above may be inconsequential in many applications; however, current‐only‐based protection systems have another shortcoming because backup protection is needed to address failures of the communication channel. In practice, a second independent current‐based protection scheme could be applied to provide backup protection. However, a power system with no remote backup protection is susceptible to uncleared faults unless back‐up protection is applied. Although a current‐only‐based protection system is secure for stable power swings and can be used on lines which require tripping on out‐of‐step conditions, an out‐of‐step tripping protection function is still required. Using an impedance‐based back‐up protection or out‐of‐step tripping function reintroduces the need to discriminate between stable and unstable power swings. The shortcomings of impedance‐based out‐of‐step tripping functions can be mitigated by applying an integrated out‐of‐step tripping function that is supervised by non impedance‐based algorithms; however, testing out‐of‐step tripping functions using simulated power system swings from the August 14, 2003 blackout investigation has identified susceptibility of some such protection systems to misoperate.
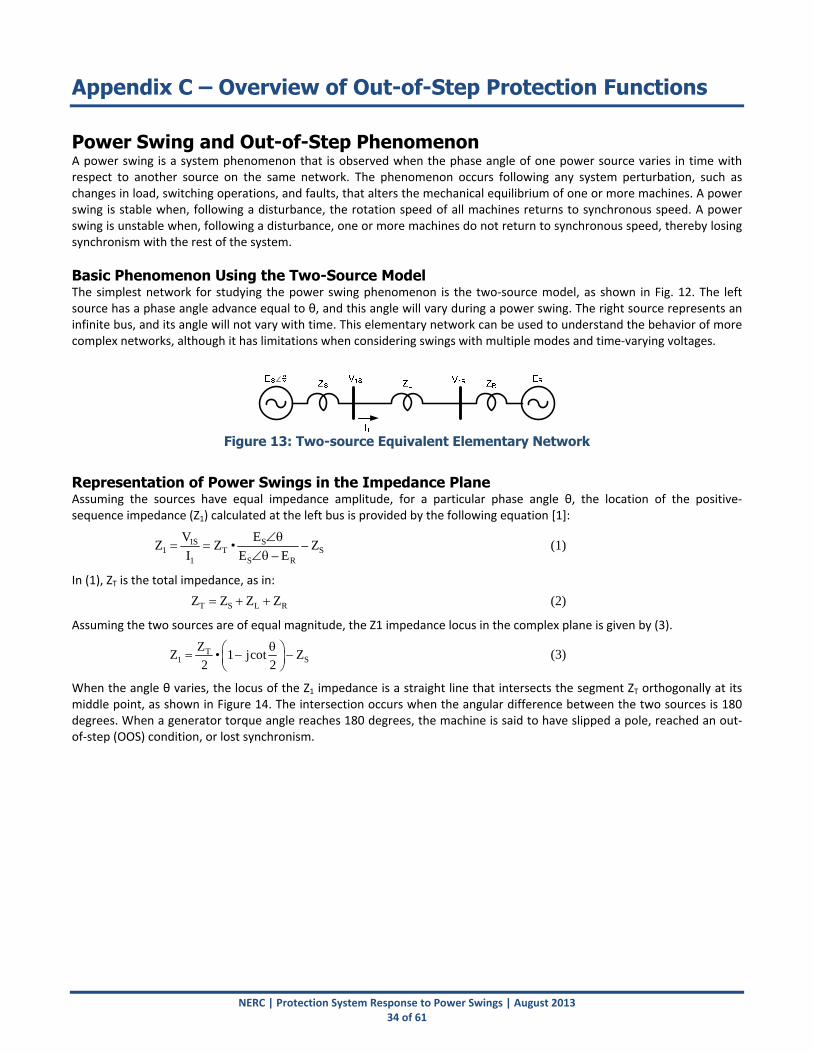
NERC | Protection System Response to Power Swings | August 2013 34 of 61
Appendix C – Overview of Out-of-Step Protection Functions Power Swing and Out-of-Step Phenomenon A power swing is a system phenomenon that is observed when the phase angle of one power source varies in time with respect to another source on the same network. The phenomenon occurs following any system perturbation, such as changes in load, switching operations, and faults, that alters the mechanical equilibrium of one or more machines. A power swing is stable when, following a disturbance, the rotation speed of all machines returns to synchronous speed. A power swing is unstable when, following a disturbance, one or more machines do not return to synchronous speed, thereby losing synchronism with the rest of the system.
Basic Phenomenon Using the Two-Source Model The simplest network for studying the power swing phenomenon is the two‐source model, as shown in Fig. 12. The left source has a phase angle advance equal to θ, and this angle will vary during a power swing. The right source represents an infinite bus, and its angle will not vary with time. This elementary network can be used to understand the behavior of more complex networks, although it has limitations when considering swings with multiple modes and time‐varying voltages.
Figure 13: Two-source Equivalent Elementary Network
Representation of Power Swings in the Impedance Plane Assuming the sources have equal impedance amplitude, for a particular phase angle θ, the location of the positive‐sequence impedance (Z1) calculated at the left bus is provided by the following equation [1]:
1S S1 T S
1 S R
V EZ Z • – Z
I E – E
(1)
In (1), ZT is the total impedance, as in:
T S L RZ Z Z Z (2)
Assuming the two sources are of equal magnitude, the Z1 impedance locus in the complex plane is given by (3).
T1 S
ZZ • 1 jcot Z
2 2
(3)
When the angle θ varies, the locus of the Z1 impedance is a straight line that intersects the segment ZT orthogonally at its middle point, as shown in Figure 14. The intersection occurs when the angular difference between the two sources is 180 degrees. When a generator torque angle reaches 180 degrees, the machine is said to have slipped a pole, reached an out‐of‐step (OOS) condition, or lost synchronism.
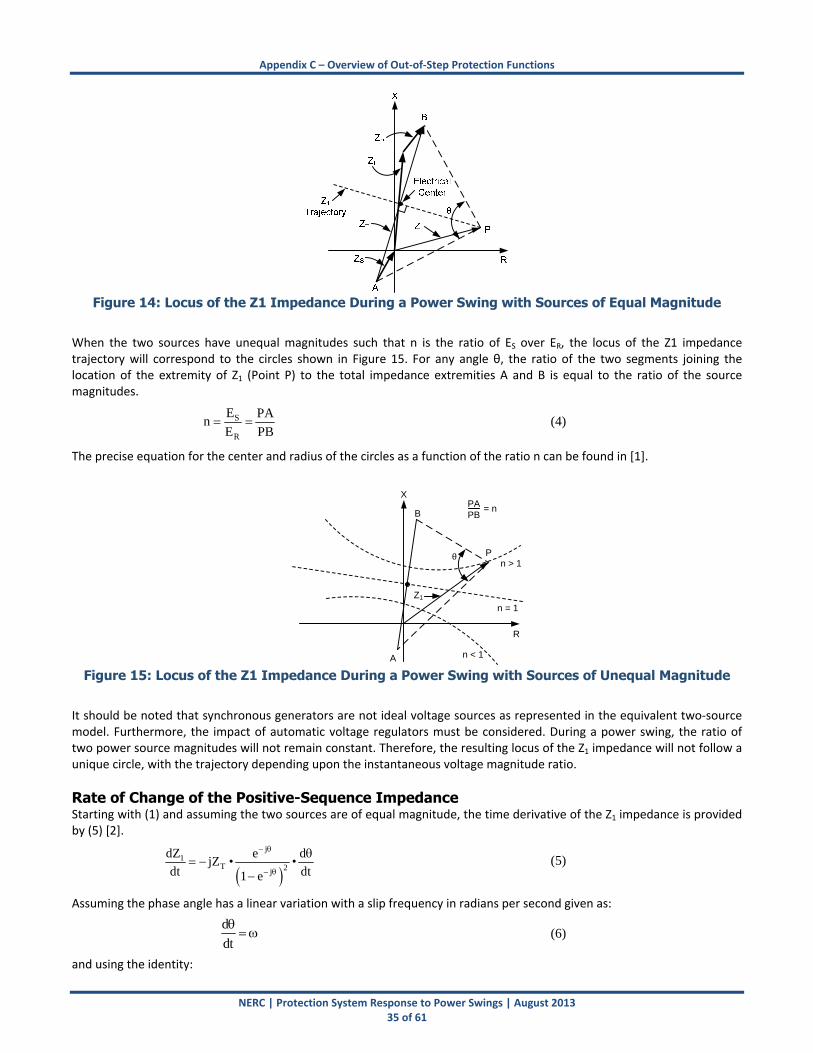
Appendix C – Overview of Out‐of‐Step Protection Functions
NERC | Protection System Response to Power Swings | August 2013 35 of 61
Figure 14: Locus of the Z1 Impedance During a Power Swing with Sources of Equal Magnitude
When the two sources have unequal magnitudes such that n is the ratio of ES over ER, the locus of the Z1 impedance trajectory will correspond to the circles shown in Figure 15. For any angle θ, the ratio of the two segments joining the location of the extremity of Z1 (Point P) to the total impedance extremities A and B is equal to the ratio of the source magnitudes.
S
R
E PAn
E PB (4)
The precise equation for the center and radius of the circles as a function of the ratio n can be found in [1].
θ P
R
X
A
B
n > 1
n = 1
n < 1
Z1
PAPB
= n
Figure 15: Locus of the Z1 Impedance During a Power Swing with Sources of Unequal Magnitude
It should be noted that synchronous generators are not ideal voltage sources as represented in the equivalent two‐source model. Furthermore, the impact of automatic voltage regulators must be considered. During a power swing, the ratio of two power source magnitudes will not remain constant. Therefore, the resulting locus of the Z1 impedance will not follow a unique circle, with the trajectory depending upon the instantaneous voltage magnitude ratio.
Rate of Change of the Positive-Sequence Impedance Starting with (1) and assuming the two sources are of equal magnitude, the time derivative of the Z1 impedance is provided by (5) [2].
j1
T 2j
dZ e djZ • •
dt dt1 e
(5)
Assuming the phase angle has a linear variation with a slip frequency in radians per second given as:
d
dt
(6)
and using the identity:
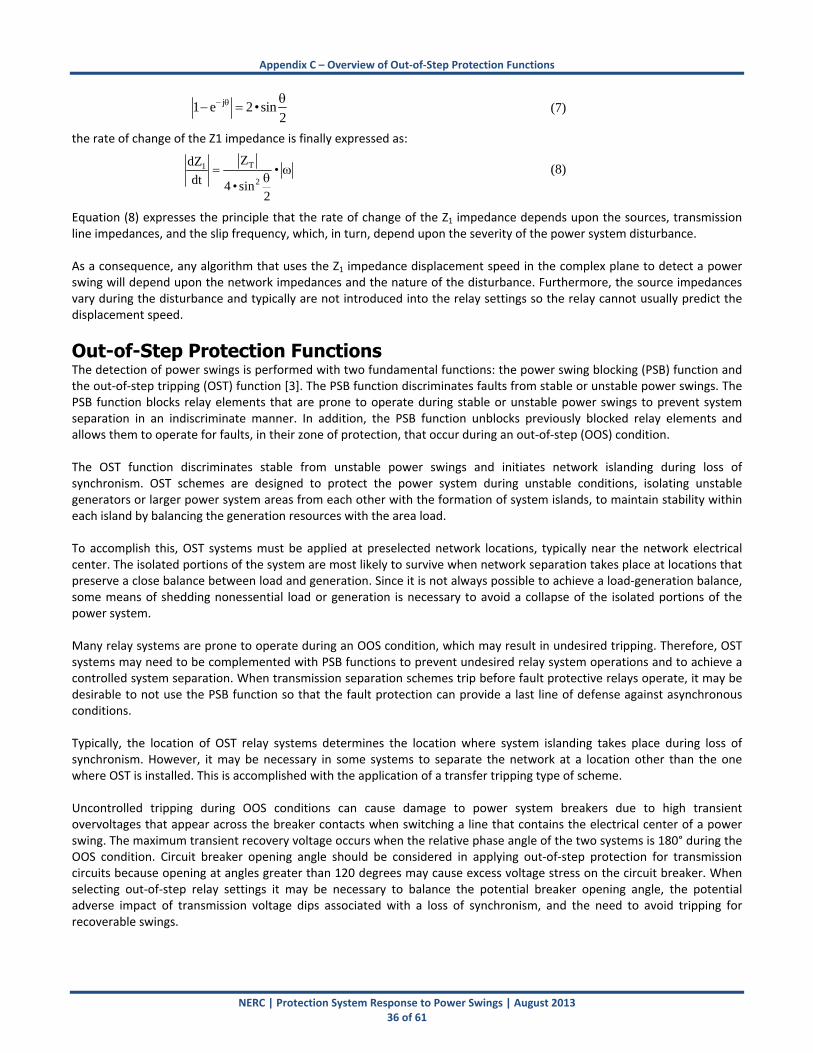
Appendix C – Overview of Out‐of‐Step Protection Functions
NERC | Protection System Response to Power Swings | August 2013 36 of 61
j1 e 2•sin2
(7)
the rate of change of the Z1 impedance is finally expressed as:
T1
2
ZdZ•
dt 4 • sin2
(8)
Equation (8) expresses the principle that the rate of change of the Z1 impedance depends upon the sources, transmission line impedances, and the slip frequency, which, in turn, depend upon the severity of the power system disturbance. As a consequence, any algorithm that uses the Z1 impedance displacement speed in the complex plane to detect a power swing will depend upon the network impedances and the nature of the disturbance. Furthermore, the source impedances vary during the disturbance and typically are not introduced into the relay settings so the relay cannot usually predict the displacement speed.
Out-of-Step Protection Functions The detection of power swings is performed with two fundamental functions: the power swing blocking (PSB) function and the out‐of‐step tripping (OST) function [3]. The PSB function discriminates faults from stable or unstable power swings. The PSB function blocks relay elements that are prone to operate during stable or unstable power swings to prevent system separation in an indiscriminate manner. In addition, the PSB function unblocks previously blocked relay elements and allows them to operate for faults, in their zone of protection, that occur during an out‐of‐step (OOS) condition. The OST function discriminates stable from unstable power swings and initiates network islanding during loss of synchronism. OST schemes are designed to protect the power system during unstable conditions, isolating unstable generators or larger power system areas from each other with the formation of system islands, to maintain stability within each island by balancing the generation resources with the area load. To accomplish this, OST systems must be applied at preselected network locations, typically near the network electrical center. The isolated portions of the system are most likely to survive when network separation takes place at locations that preserve a close balance between load and generation. Since it is not always possible to achieve a load‐generation balance, some means of shedding nonessential load or generation is necessary to avoid a collapse of the isolated portions of the power system. Many relay systems are prone to operate during an OOS condition, which may result in undesired tripping. Therefore, OST systems may need to be complemented with PSB functions to prevent undesired relay system operations and to achieve a controlled system separation. When transmission separation schemes trip before fault protective relays operate, it may be desirable to not use the PSB function so that the fault protection can provide a last line of defense against asynchronous conditions. Typically, the location of OST relay systems determines the location where system islanding takes place during loss of synchronism. However, it may be necessary in some systems to separate the network at a location other than the one where OST is installed. This is accomplished with the application of a transfer tripping type of scheme. Uncontrolled tripping during OOS conditions can cause damage to power system breakers due to high transient overvoltages that appear across the breaker contacts when switching a line that contains the electrical center of a power swing. The maximum transient recovery voltage occurs when the relative phase angle of the two systems is 180° during the OOS condition. Circuit breaker opening angle should be considered in applying out‐of‐step protection for transmission circuits because opening at angles greater than 120 degrees may cause excess voltage stress on the circuit breaker. When selecting out‐of‐step relay settings it may be necessary to balance the potential breaker opening angle, the potential adverse impact of transmission voltage dips associated with a loss of synchronism, and the need to avoid tripping for recoverable swings.
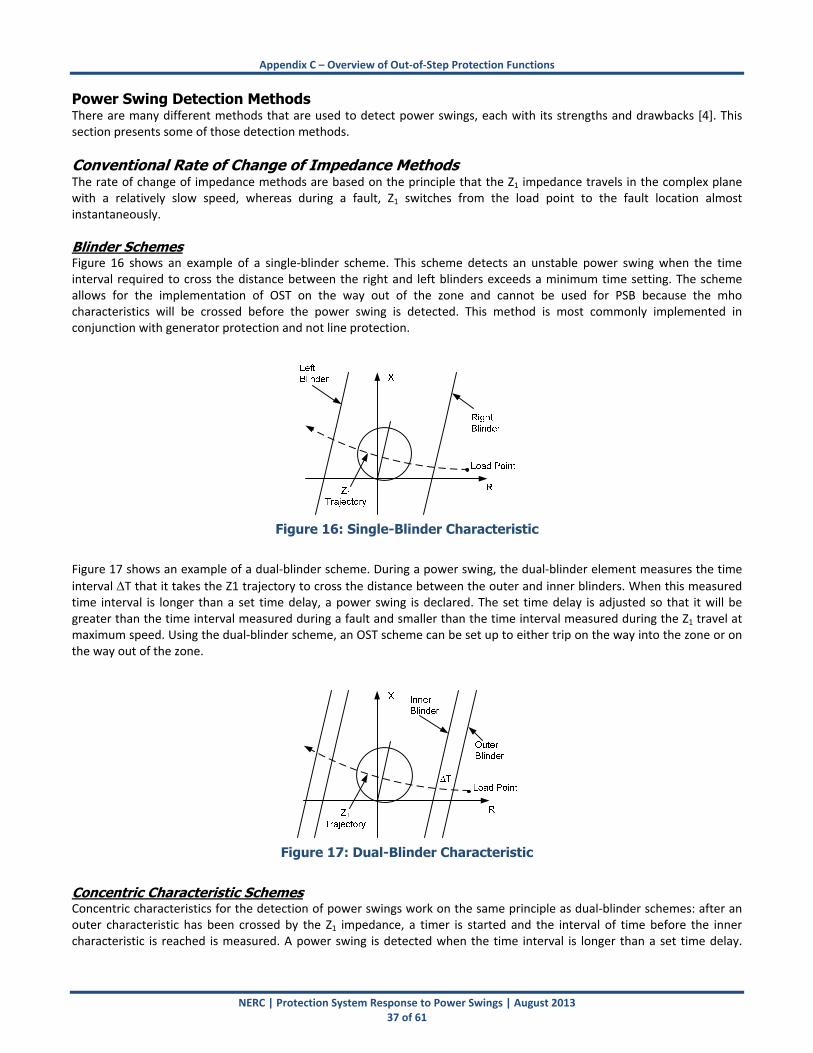
Appendix C – Overview of Out‐of‐Step Protection Functions
NERC | Protection System Response to Power Swings | August 2013 37 of 61
Power Swing Detection Methods There are many different methods that are used to detect power swings, each with its strengths and drawbacks [4]. This section presents some of those detection methods.
Conventional Rate of Change of Impedance Methods The rate of change of impedance methods are based on the principle that the Z1 impedance travels in the complex plane with a relatively slow speed, whereas during a fault, Z1 switches from the load point to the fault location almost instantaneously.
Blinder Schemes Figure 16 shows an example of a single‐blinder scheme. This scheme detects an unstable power swing when the time interval required to cross the distance between the right and left blinders exceeds a minimum time setting. The scheme allows for the implementation of OST on the way out of the zone and cannot be used for PSB because the mho characteristics will be crossed before the power swing is detected. This method is most commonly implemented in conjunction with generator protection and not line protection.
Figure 16: Single-Blinder Characteristic
Figure 17 shows an example of a dual‐blinder scheme. During a power swing, the dual‐blinder element measures the time
interval T that it takes the Z1 trajectory to cross the distance between the outer and inner blinders. When this measured time interval is longer than a set time delay, a power swing is declared. The set time delay is adjusted so that it will be greater than the time interval measured during a fault and smaller than the time interval measured during the Z1 travel at maximum speed. Using the dual‐blinder scheme, an OST scheme can be set up to either trip on the way into the zone or on the way out of the zone.
Figure 17: Dual-Blinder Characteristic
Concentric Characteristic Schemes Concentric characteristics for the detection of power swings work on the same principle as dual‐blinder schemes: after an outer characteristic has been crossed by the Z1 impedance, a timer is started and the interval of time before the inner characteristic is reached is measured. A power swing is detected when the time interval is longer than a set time delay.
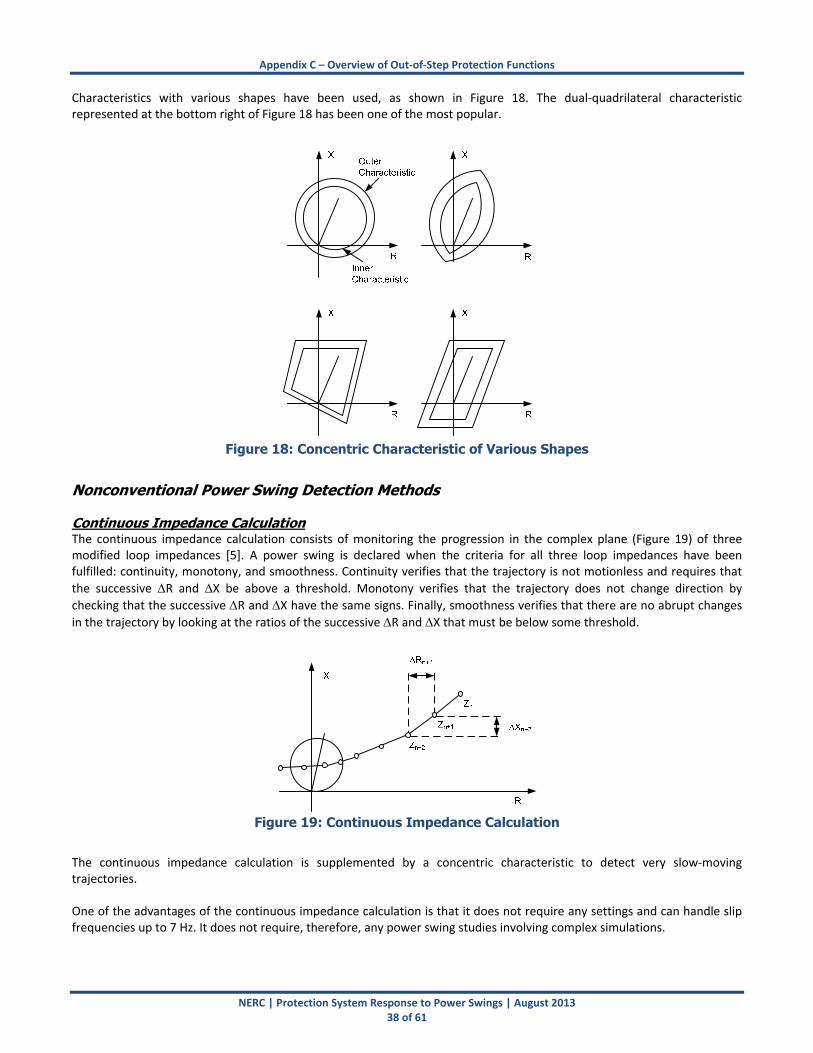
Appendix C – Overview of Out‐of‐Step Protection Functions
NERC | Protection System Response to Power Swings | August 2013 38 of 61
Characteristics with various shapes have been used, as shown in Figure 18. The dual‐quadrilateral characteristic represented at the bottom right of Figure 18 has been one of the most popular.
Figure 18: Concentric Characteristic of Various Shapes
Nonconventional Power Swing Detection Methods Continuous Impedance Calculation The continuous impedance calculation consists of monitoring the progression in the complex plane (Figure 19) of three modified loop impedances [5]. A power swing is declared when the criteria for all three loop impedances have been fulfilled: continuity, monotony, and smoothness. Continuity verifies that the trajectory is not motionless and requires that
the successive R and X be above a threshold. Monotony verifies that the trajectory does not change direction by
checking that the successive R and X have the same signs. Finally, smoothness verifies that there are no abrupt changes
in the trajectory by looking at the ratios of the successive R and X that must be below some threshold.
Figure 19: Continuous Impedance Calculation
The continuous impedance calculation is supplemented by a concentric characteristic to detect very slow‐moving trajectories. One of the advantages of the continuous impedance calculation is that it does not require any settings and can handle slip frequencies up to 7 Hz. It does not require, therefore, any power swing studies involving complex simulations.
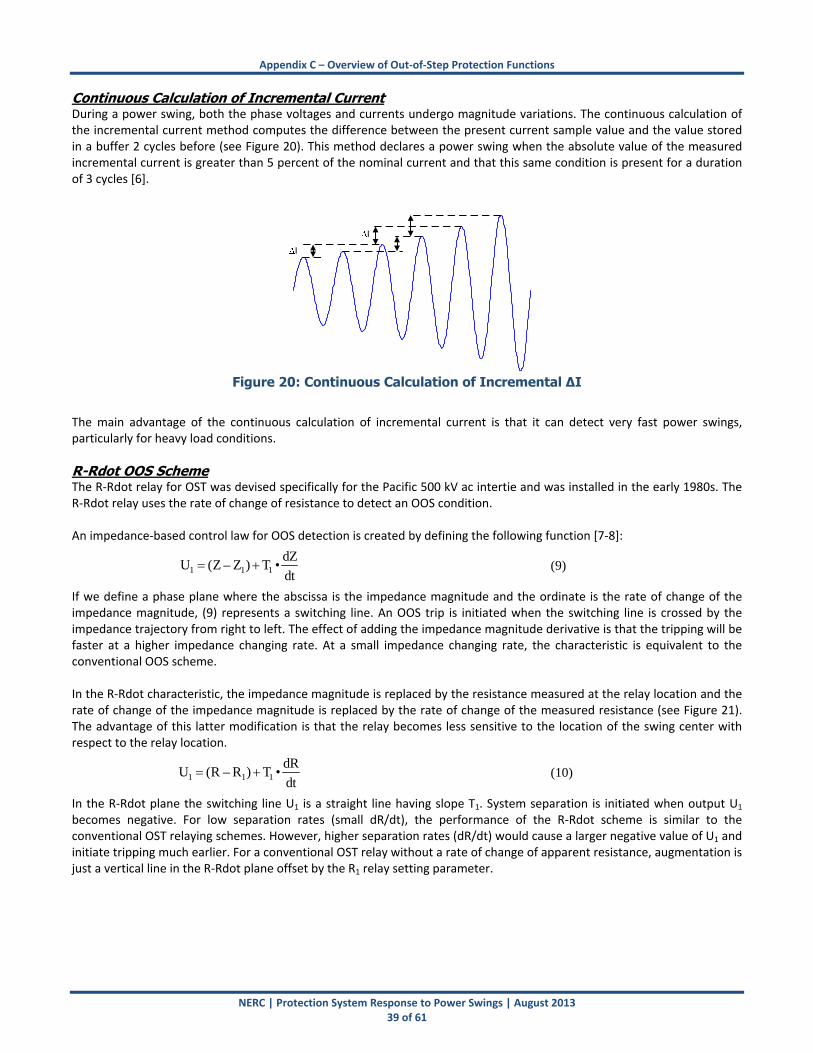
Appendix C – Overview of Out‐of‐Step Protection Functions
NERC | Protection System Response to Power Swings | August 2013 39 of 61
Continuous Calculation of Incremental Current During a power swing, both the phase voltages and currents undergo magnitude variations. The continuous calculation of the incremental current method computes the difference between the present current sample value and the value stored in a buffer 2 cycles before (see Figure 20). This method declares a power swing when the absolute value of the measured incremental current is greater than 5 percent of the nominal current and that this same condition is present for a duration of 3 cycles [6].
I
I
Figure 20: Continuous Calculation of Incremental ΔI
The main advantage of the continuous calculation of incremental current is that it can detect very fast power swings, particularly for heavy load conditions.
R-Rdot OOS Scheme The R‐Rdot relay for OST was devised specifically for the Pacific 500 kV ac intertie and was installed in the early 1980s. The R‐Rdot relay uses the rate of change of resistance to detect an OOS condition. An impedance‐based control law for OOS detection is created by defining the following function [7‐8]:
1 1 1dZ
U (Z – Z ) T •dt
(9)
If we define a phase plane where the abscissa is the impedance magnitude and the ordinate is the rate of change of the impedance magnitude, (9) represents a switching line. An OOS trip is initiated when the switching line is crossed by the impedance trajectory from right to left. The effect of adding the impedance magnitude derivative is that the tripping will be faster at a higher impedance changing rate. At a small impedance changing rate, the characteristic is equivalent to the conventional OOS scheme. In the R‐Rdot characteristic, the impedance magnitude is replaced by the resistance measured at the relay location and the rate of change of the impedance magnitude is replaced by the rate of change of the measured resistance (see Figure 21). The advantage of this latter modification is that the relay becomes less sensitive to the location of the swing center with respect to the relay location.
1 1 1dR
U (R – R ) T •dt
(10)
In the R‐Rdot plane the switching line U1 is a straight line having slope T1. System separation is initiated when output U1 becomes negative. For low separation rates (small dR/dt), the performance of the R‐Rdot scheme is similar to the conventional OST relaying schemes. However, higher separation rates (dR/dt) would cause a larger negative value of U1 and initiate tripping much earlier. For a conventional OST relay without a rate of change of apparent resistance, augmentation is just a vertical line in the R‐Rdot plane offset by the R1 relay setting parameter.
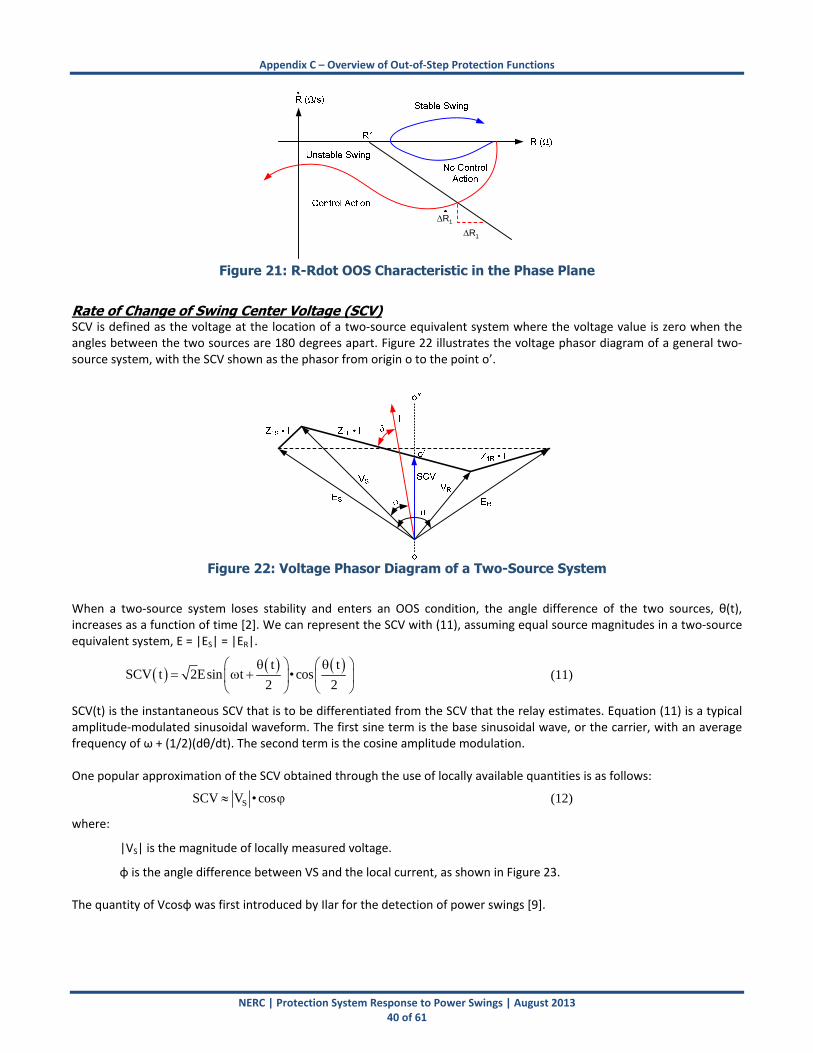
Appendix C – Overview of Out‐of‐Step Protection Functions
NERC | Protection System Response to Power Swings | August 2013 40 of 61
1R
1R
Figure 21: R-Rdot OOS Characteristic in the Phase Plane
Rate of Change of Swing Center Voltage (SCV) SCV is defined as the voltage at the location of a two‐source equivalent system where the voltage value is zero when the angles between the two sources are 180 degrees apart. Figure 22 illustrates the voltage phasor diagram of a general two‐source system, with the SCV shown as the phasor from origin o to the point o’.
Figure 22: Voltage Phasor Diagram of a Two-Source System
When a two‐source system loses stability and enters an OOS condition, the angle difference of the two sources, θ(t), increases as a function of time [2]. We can represent the SCV with (11), assuming equal source magnitudes in a two‐source equivalent system, E = |ES| = |ER|.
t tSCV t 2Esin t • cos
2 2
(11)
SCV(t) is the instantaneous SCV that is to be differentiated from the SCV that the relay estimates. Equation (11) is a typical amplitude‐modulated sinusoidal waveform. The first sine term is the base sinusoidal wave, or the carrier, with an average frequency of ω + (1/2)(dθ/dt). The second term is the cosine amplitude modulation. One popular approximation of the SCV obtained through the use of locally available quantities is as follows:
SSCV V • cos (12)
where:
|VS| is the magnitude of locally measured voltage.
φ is the angle difference between VS and the local current, as shown in Figure 23. The quantity of Vcosφ was first introduced by Ilar for the detection of power swings [9].
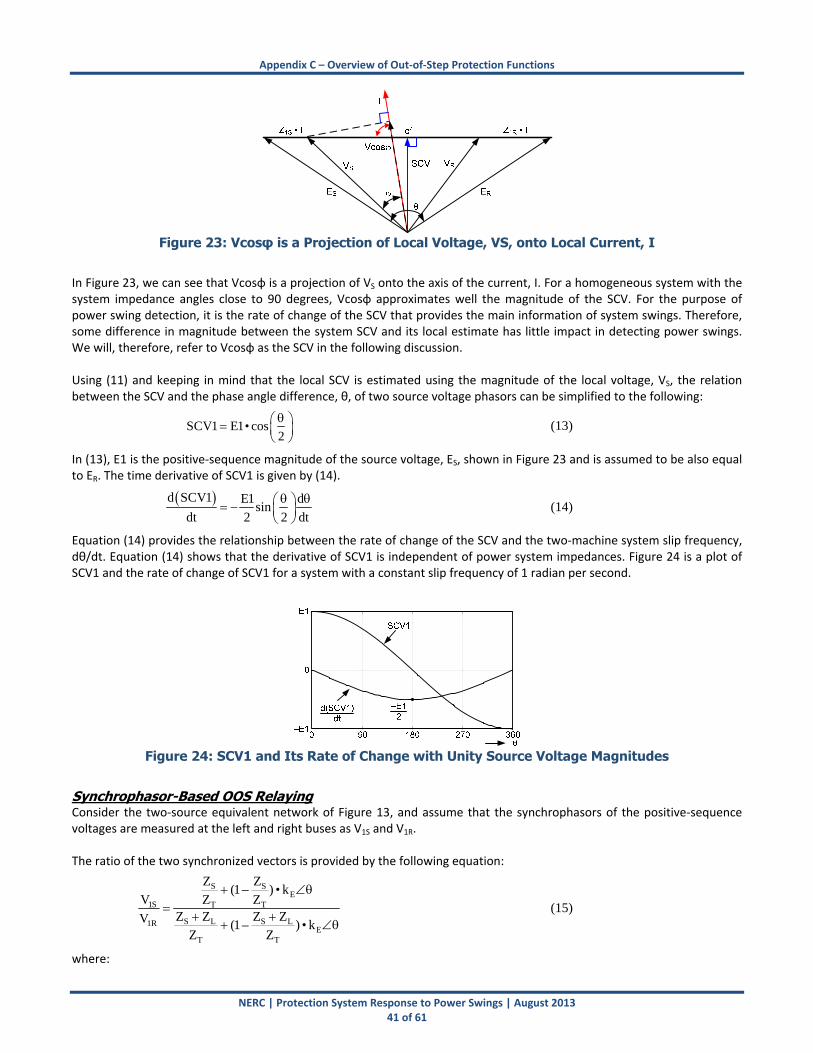
Appendix C – Overview of Out‐of‐Step Protection Functions
NERC | Protection System Response to Power Swings | August 2013 41 of 61
Figure 23: Vcosφ is a Projection of Local Voltage, VS, onto Local Current, I
In Figure 23, we can see that Vcosφ is a projection of VS onto the axis of the current, I. For a homogeneous system with the system impedance angles close to 90 degrees, Vcosφ approximates well the magnitude of the SCV. For the purpose of power swing detection, it is the rate of change of the SCV that provides the main information of system swings. Therefore, some difference in magnitude between the system SCV and its local estimate has little impact in detecting power swings. We will, therefore, refer to Vcosφ as the SCV in the following discussion. Using (11) and keeping in mind that the local SCV is estimated using the magnitude of the local voltage, VS, the relation between the SCV and the phase angle difference, θ, of two source voltage phasors can be simplified to the following:
SCV1 E1• cos2
(13)
In (13), E1 is the positive‐sequence magnitude of the source voltage, ES, shown in Figure 23 and is assumed to be also equal to ER. The time derivative of SCV1 is given by (14).
d SCV1 E1 d
sindt 2 2 dt
(14)
Equation (14) provides the relationship between the rate of change of the SCV and the two‐machine system slip frequency, dθ/dt. Equation (14) shows that the derivative of SCV1 is independent of power system impedances. Figure 24 is a plot of SCV1 and the rate of change of SCV1 for a system with a constant slip frequency of 1 radian per second.
Figure 24: SCV1 and Its Rate of Change with Unity Source Voltage Magnitudes
Synchrophasor-Based OOS Relaying Consider the two‐source equivalent network of Figure 13, and assume that the synchrophasors of the positive‐sequence voltages are measured at the left and right buses as V1S and V1R. The ratio of the two synchronized vectors is provided by the following equation:
S SE
1S T T
S L S L1RE
T T
Z Z(1– ) • k
V Z ZZ Z Z ZV (1– ) • k
Z Z
(15)
where:
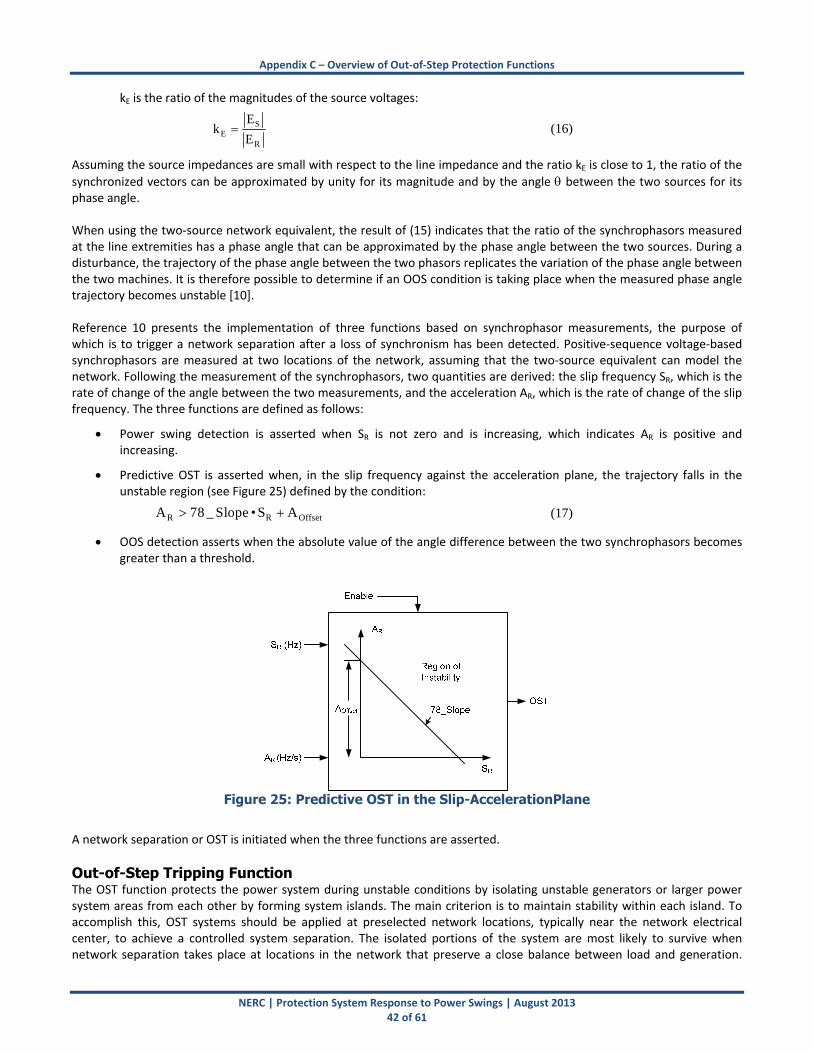
Appendix C – Overview of Out‐of‐Step Protection Functions
NERC | Protection System Response to Power Swings | August 2013 42 of 61
kE is the ratio of the magnitudes of the source voltages:
SE
R
Ek
E (16)
Assuming the source impedances are small with respect to the line impedance and the ratio kE is close to 1, the ratio of the
synchronized vectors can be approximated by unity for its magnitude and by the angle between the two sources for its phase angle. When using the two‐source network equivalent, the result of (15) indicates that the ratio of the synchrophasors measured at the line extremities has a phase angle that can be approximated by the phase angle between the two sources. During a disturbance, the trajectory of the phase angle between the two phasors replicates the variation of the phase angle between the two machines. It is therefore possible to determine if an OOS condition is taking place when the measured phase angle trajectory becomes unstable [10]. Reference 10 presents the implementation of three functions based on synchrophasor measurements, the purpose of which is to trigger a network separation after a loss of synchronism has been detected. Positive‐sequence voltage‐based synchrophasors are measured at two locations of the network, assuming that the two‐source equivalent can model the network. Following the measurement of the synchrophasors, two quantities are derived: the slip frequency SR, which is the rate of change of the angle between the two measurements, and the acceleration AR, which is the rate of change of the slip frequency. The three functions are defined as follows:
Power swing detection is asserted when SR is not zero and is increasing, which indicates AR is positive and increasing.
Predictive OST is asserted when, in the slip frequency against the acceleration plane, the trajectory falls in the unstable region (see Figure 25) defined by the condition:
R R OffsetA 78 _ Slope • S A (17)
OOS detection asserts when the absolute value of the angle difference between the two synchrophasors becomes greater than a threshold.
Figure 25: Predictive OST in the Slip-AccelerationPlane
A network separation or OST is initiated when the three functions are asserted.
Out-of-Step Tripping Function The OST function protects the power system during unstable conditions by isolating unstable generators or larger power system areas from each other by forming system islands. The main criterion is to maintain stability within each island. To accomplish this, OST systems should be applied at preselected network locations, typically near the network electrical center, to achieve a controlled system separation. The isolated portions of the system are most likely to survive when network separation takes place at locations in the network that preserve a close balance between load and generation.
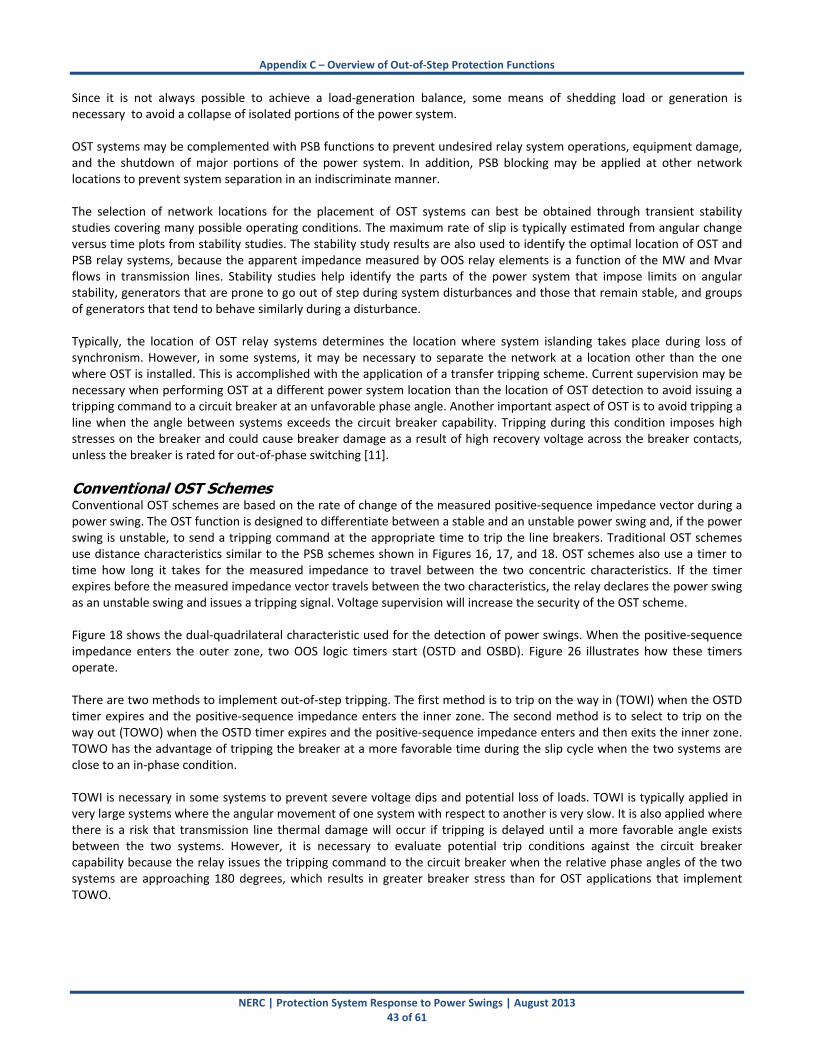
Appendix C – Overview of Out‐of‐Step Protection Functions
NERC | Protection System Response to Power Swings | August 2013 43 of 61
Since it is not always possible to achieve a load‐generation balance, some means of shedding load or generation is necessary to avoid a collapse of isolated portions of the power system. OST systems may be complemented with PSB functions to prevent undesired relay system operations, equipment damage, and the shutdown of major portions of the power system. In addition, PSB blocking may be applied at other network locations to prevent system separation in an indiscriminate manner. The selection of network locations for the placement of OST systems can best be obtained through transient stability studies covering many possible operating conditions. The maximum rate of slip is typically estimated from angular change versus time plots from stability studies. The stability study results are also used to identify the optimal location of OST and PSB relay systems, because the apparent impedance measured by OOS relay elements is a function of the MW and Mvar flows in transmission lines. Stability studies help identify the parts of the power system that impose limits on angular stability, generators that are prone to go out of step during system disturbances and those that remain stable, and groups of generators that tend to behave similarly during a disturbance. Typically, the location of OST relay systems determines the location where system islanding takes place during loss of synchronism. However, in some systems, it may be necessary to separate the network at a location other than the one where OST is installed. This is accomplished with the application of a transfer tripping scheme. Current supervision may be necessary when performing OST at a different power system location than the location of OST detection to avoid issuing a tripping command to a circuit breaker at an unfavorable phase angle. Another important aspect of OST is to avoid tripping a line when the angle between systems exceeds the circuit breaker capability. Tripping during this condition imposes high stresses on the breaker and could cause breaker damage as a result of high recovery voltage across the breaker contacts, unless the breaker is rated for out‐of‐phase switching [11].
Conventional OST Schemes Conventional OST schemes are based on the rate of change of the measured positive‐sequence impedance vector during a power swing. The OST function is designed to differentiate between a stable and an unstable power swing and, if the power swing is unstable, to send a tripping command at the appropriate time to trip the line breakers. Traditional OST schemes use distance characteristics similar to the PSB schemes shown in Figures 16, 17, and 18. OST schemes also use a timer to time how long it takes for the measured impedance to travel between the two concentric characteristics. If the timer expires before the measured impedance vector travels between the two characteristics, the relay declares the power swing as an unstable swing and issues a tripping signal. Voltage supervision will increase the security of the OST scheme. Figure 18 shows the dual‐quadrilateral characteristic used for the detection of power swings. When the positive‐sequence impedance enters the outer zone, two OOS logic timers start (OSTD and OSBD). Figure 26 illustrates how these timers operate. There are two methods to implement out‐of‐step tripping. The first method is to trip on the way in (TOWI) when the OSTD timer expires and the positive‐sequence impedance enters the inner zone. The second method is to select to trip on the way out (TOWO) when the OSTD timer expires and the positive‐sequence impedance enters and then exits the inner zone. TOWO has the advantage of tripping the breaker at a more favorable time during the slip cycle when the two systems are close to an in‐phase condition. TOWI is necessary in some systems to prevent severe voltage dips and potential loss of loads. TOWI is typically applied in very large systems where the angular movement of one system with respect to another is very slow. It is also applied where there is a risk that transmission line thermal damage will occur if tripping is delayed until a more favorable angle exists between the two systems. However, it is necessary to evaluate potential trip conditions against the circuit breaker capability because the relay issues the tripping command to the circuit breaker when the relative phase angles of the two systems are approaching 180 degrees, which results in greater breaker stress than for OST applications that implement TOWO.
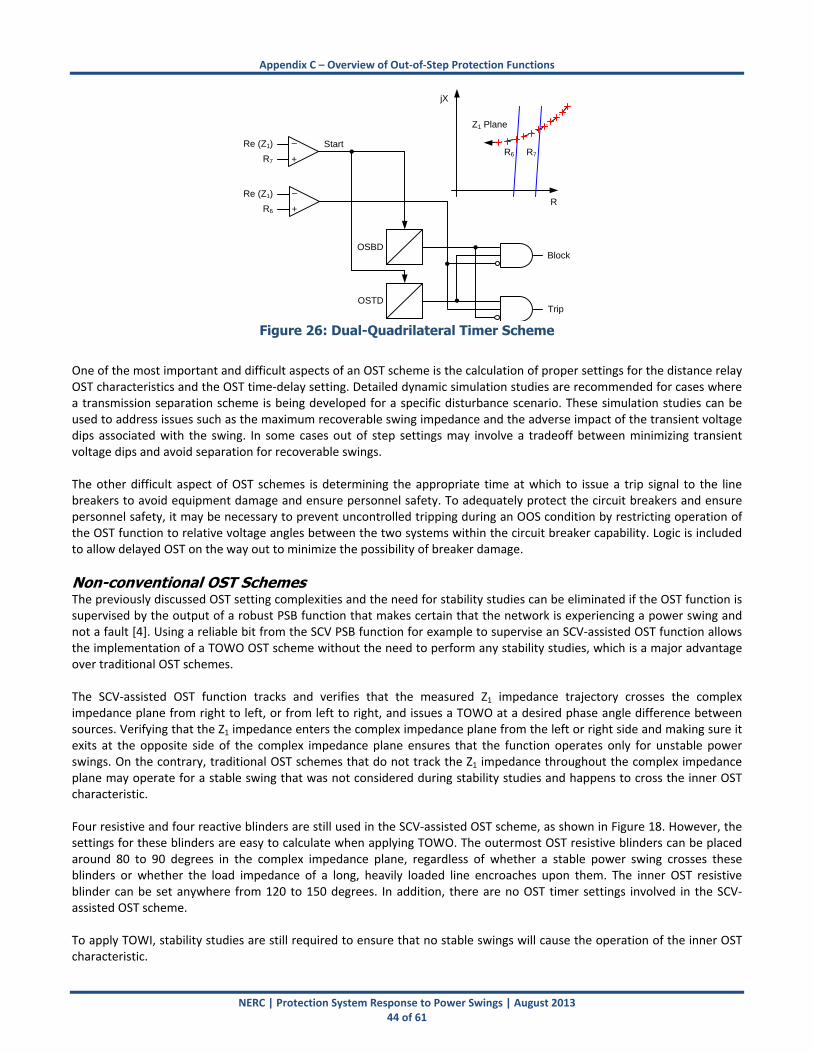
Appendix C – Overview of Out‐of‐Step Protection Functions
NERC | Protection System Response to Power Swings | August 2013 44 of 61
–
+
–
+
OSBD
OSTD
Block
Trip
Re (Z1)
Re (Z1)
Z1 Plane
jX
R
R6 R7R7
R6
Start
Figure 26: Dual-Quadrilateral Timer Scheme
One of the most important and difficult aspects of an OST scheme is the calculation of proper settings for the distance relay OST characteristics and the OST time‐delay setting. Detailed dynamic simulation studies are recommended for cases where a transmission separation scheme is being developed for a specific disturbance scenario. These simulation studies can be used to address issues such as the maximum recoverable swing impedance and the adverse impact of the transient voltage dips associated with the swing. In some cases out of step settings may involve a tradeoff between minimizing transient voltage dips and avoid separation for recoverable swings. The other difficult aspect of OST schemes is determining the appropriate time at which to issue a trip signal to the line breakers to avoid equipment damage and ensure personnel safety. To adequately protect the circuit breakers and ensure personnel safety, it may be necessary to prevent uncontrolled tripping during an OOS condition by restricting operation of the OST function to relative voltage angles between the two systems within the circuit breaker capability. Logic is included to allow delayed OST on the way out to minimize the possibility of breaker damage.
Non-conventional OST Schemes The previously discussed OST setting complexities and the need for stability studies can be eliminated if the OST function is supervised by the output of a robust PSB function that makes certain that the network is experiencing a power swing and not a fault [4]. Using a reliable bit from the SCV PSB function for example to supervise an SCV‐assisted OST function allows the implementation of a TOWO OST scheme without the need to perform any stability studies, which is a major advantage over traditional OST schemes. The SCV‐assisted OST function tracks and verifies that the measured Z1 impedance trajectory crosses the complex impedance plane from right to left, or from left to right, and issues a TOWO at a desired phase angle difference between sources. Verifying that the Z1 impedance enters the complex impedance plane from the left or right side and making sure it exits at the opposite side of the complex impedance plane ensures that the function operates only for unstable power swings. On the contrary, traditional OST schemes that do not track the Z1 impedance throughout the complex impedance plane may operate for a stable swing that was not considered during stability studies and happens to cross the inner OST characteristic. Four resistive and four reactive blinders are still used in the SCV‐assisted OST scheme, as shown in Figure 18. However, the settings for these blinders are easy to calculate when applying TOWO. The outermost OST resistive blinders can be placed around 80 to 90 degrees in the complex impedance plane, regardless of whether a stable power swing crosses these blinders or whether the load impedance of a long, heavily loaded line encroaches upon them. The inner OST resistive blinder can be set anywhere from 120 to 150 degrees. In addition, there are no OST timer settings involved in the SCV‐assisted OST scheme. To apply TOWI, stability studies are still required to ensure that no stable swings will cause the operation of the inner OST characteristic.
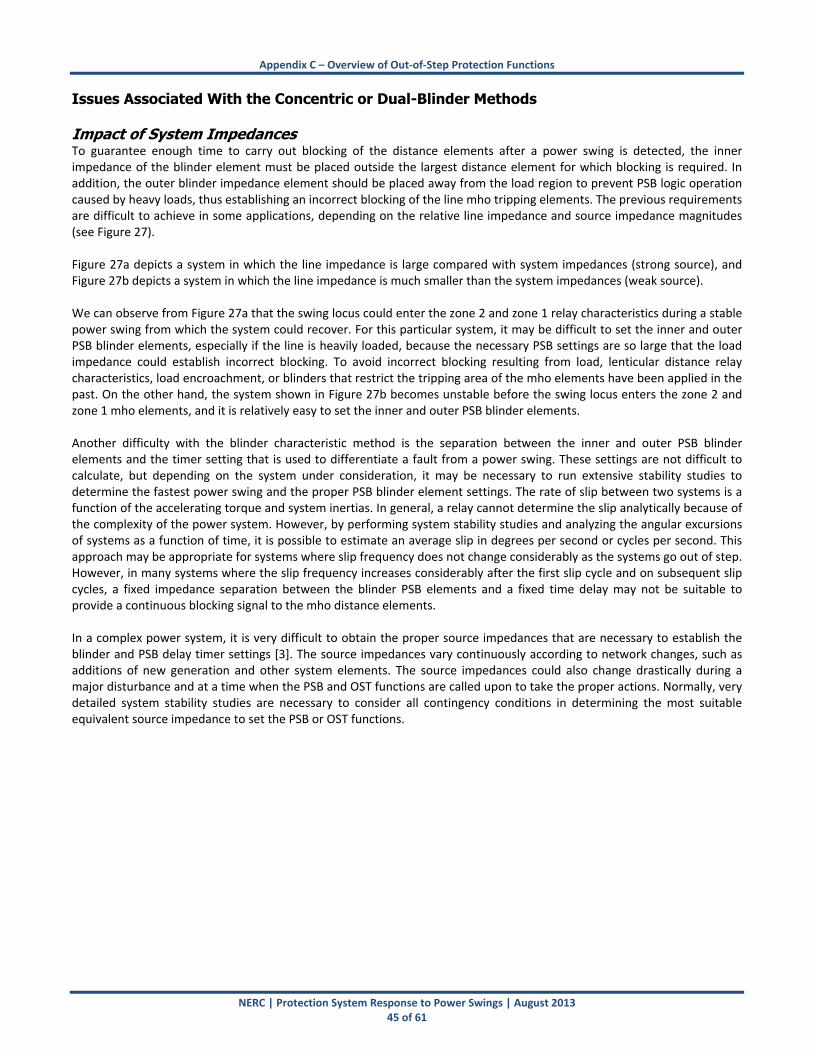
Appendix C – Overview of Out‐of‐Step Protection Functions
NERC | Protection System Response to Power Swings | August 2013 45 of 61
Issues Associated With the Concentric or Dual-Blinder Methods Impact of System Impedances To guarantee enough time to carry out blocking of the distance elements after a power swing is detected, the inner impedance of the blinder element must be placed outside the largest distance element for which blocking is required. In addition, the outer blinder impedance element should be placed away from the load region to prevent PSB logic operation caused by heavy loads, thus establishing an incorrect blocking of the line mho tripping elements. The previous requirements are difficult to achieve in some applications, depending on the relative line impedance and source impedance magnitudes (see Figure 27). Figure 27a depicts a system in which the line impedance is large compared with system impedances (strong source), and Figure 27b depicts a system in which the line impedance is much smaller than the system impedances (weak source). We can observe from Figure 27a that the swing locus could enter the zone 2 and zone 1 relay characteristics during a stable power swing from which the system could recover. For this particular system, it may be difficult to set the inner and outer PSB blinder elements, especially if the line is heavily loaded, because the necessary PSB settings are so large that the load impedance could establish incorrect blocking. To avoid incorrect blocking resulting from load, lenticular distance relay characteristics, load encroachment, or blinders that restrict the tripping area of the mho elements have been applied in the past. On the other hand, the system shown in Figure 27b becomes unstable before the swing locus enters the zone 2 and zone 1 mho elements, and it is relatively easy to set the inner and outer PSB blinder elements. Another difficulty with the blinder characteristic method is the separation between the inner and outer PSB blinder elements and the timer setting that is used to differentiate a fault from a power swing. These settings are not difficult to calculate, but depending on the system under consideration, it may be necessary to run extensive stability studies to determine the fastest power swing and the proper PSB blinder element settings. The rate of slip between two systems is a function of the accelerating torque and system inertias. In general, a relay cannot determine the slip analytically because of the complexity of the power system. However, by performing system stability studies and analyzing the angular excursions of systems as a function of time, it is possible to estimate an average slip in degrees per second or cycles per second. This approach may be appropriate for systems where slip frequency does not change considerably as the systems go out of step. However, in many systems where the slip frequency increases considerably after the first slip cycle and on subsequent slip cycles, a fixed impedance separation between the blinder PSB elements and a fixed time delay may not be suitable to provide a continuous blocking signal to the mho distance elements. In a complex power system, it is very difficult to obtain the proper source impedances that are necessary to establish the blinder and PSB delay timer settings [3]. The source impedances vary continuously according to network changes, such as additions of new generation and other system elements. The source impedances could also change drastically during a major disturbance and at a time when the PSB and OST functions are called upon to take the proper actions. Normally, very detailed system stability studies are necessary to consider all contingency conditions in determining the most suitable equivalent source impedance to set the PSB or OST functions.
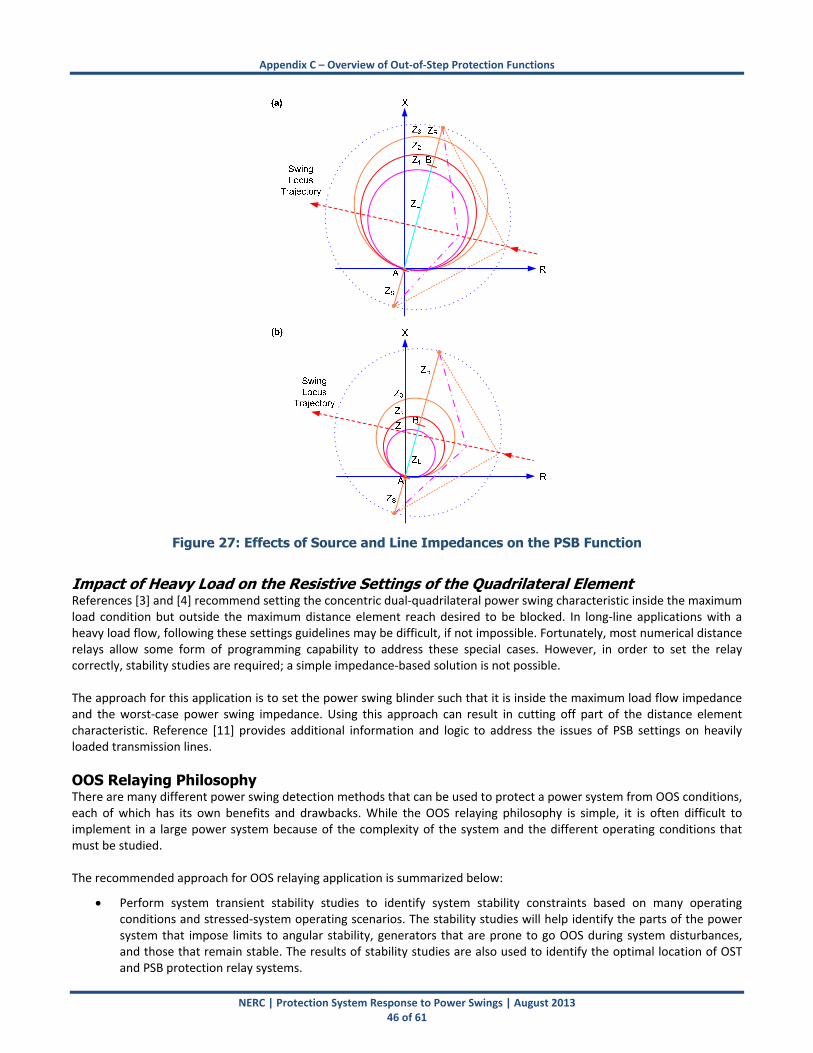
Appendix C – Overview of Out‐of‐Step Protection Functions
NERC | Protection System Response to Power Swings | August 2013 46 of 61
Figure 27: Effects of Source and Line Impedances on the PSB Function
Impact of Heavy Load on the Resistive Settings of the Quadrilateral Element References [3] and [4] recommend setting the concentric dual‐quadrilateral power swing characteristic inside the maximum load condition but outside the maximum distance element reach desired to be blocked. In long‐line applications with a heavy load flow, following these settings guidelines may be difficult, if not impossible. Fortunately, most numerical distance relays allow some form of programming capability to address these special cases. However, in order to set the relay correctly, stability studies are required; a simple impedance‐based solution is not possible. The approach for this application is to set the power swing blinder such that it is inside the maximum load flow impedance and the worst‐case power swing impedance. Using this approach can result in cutting off part of the distance element characteristic. Reference [11] provides additional information and logic to address the issues of PSB settings on heavily loaded transmission lines.
OOS Relaying Philosophy There are many different power swing detection methods that can be used to protect a power system from OOS conditions, each of which has its own benefits and drawbacks. While the OOS relaying philosophy is simple, it is often difficult to implement in a large power system because of the complexity of the system and the different operating conditions that must be studied. The recommended approach for OOS relaying application is summarized below:
Perform system transient stability studies to identify system stability constraints based on many operating conditions and stressed‐system operating scenarios. The stability studies will help identify the parts of the power system that impose limits to angular stability, generators that are prone to go OOS during system disturbances, and those that remain stable. The results of stability studies are also used to identify the optimal location of OST and PSB protection relay systems.

Appendix C – Overview of Out‐of‐Step Protection Functions
NERC | Protection System Response to Power Swings | August 2013 47 of 61
Determine the locations of the swing loci during various system conditions and identify the optimal locations to implement the OST protection function. The optimal location for the detection of the OOS condition is near the electrical center of the power system. However, it is necessary to determine that the behavior of the impedance locus near the electrical center would facilitate the successful detection of OOS.
Determine the optimal location for system separation during an OOS condition. This will typically depend on the impedance between islands, the potential to attain a good load/generation balance, and the ability to establish stable operating areas after separation. High impedance paths between system areas typically represent appropriate locations for network separation.
Establish the maximum rate of slip between systems for OOS timer setting requirements, as well as the minimum forward and reverse reach settings required for successful detection of OOS conditions. The swing frequency of a particular power system area or group of generators relative to another power system area or group of generators does not remain constant. The dynamic response of generator control systems, such as automatic voltage regulators, and the dynamic behavior of loads or other power system devices, such as SVCs and FACTS, can influence the rate of change of the impedance measured by OOS protection devices.
References [1] C. R. Mason, The Art and Science of Protective Relaying. John Wiley & Sons, Inc., New York, 1956.
[2] G. Benmouyal, D. Hou, and D. Tziouvaras, "Zero‐setting Power‐Swing Blocking Protection ", proceedings of the 31st Annual Western Protective Relay Conference, Spokane, WA, October 2004.
[3] D. Tziouvaras, and D. Hou, “Out‐of‐Step Protection Fundamentals and Advancements,” proceedings of the 30th Annual Western Protective Relay Conference, Spokane, WA, October 2003.
[4] N. Fischer, G. Benmouyal, Da. Hou, D. Tziouvaras, J. Byrne‐Finley, and B. Smyth, “Tutorial on Power Swing Blocking and Out‐of‐Step Tripping,” proceedings of the 39th Annual Western Protective Relay Conference, Spokane, WA, October 2012.
[5] J. Holbach, “New Blocking Algorithm for Detecting Fast Power Swing Frequencies,” proceedings of the 30th Annual Western Protective Relay Conference, Spokane, WA, October 2003.
[6] Q. Verzosa, “Realistic Testing of Power Swing Blocking and Out‐of‐Step Tripping Functions,” proceedings of the 38th Annual Western Protective Relay Conference, Spokane, WA, October 2011.
[7] C. W. Taylor, J. M. Haner, L. A. Hill, W. A. Mittelstadt, and R. L. Cresap, “A New Out‐of‐Step Relay With Rate of Change of Apparent Resistance Augmentation,” IEEE Transactions on Power Apparatus and Systems, Vol. PAS‐102, No. 3, March 1983.
[8] J. M. Haner, T. D. Laughlin, and C. W. Taylor, “Experience with the R Rdot Out‐of‐Step Relay,” IEEE Transactions on Power Delivery, Vol. 1, No. 2, April 1986.
[9] F. Ilar, “Innovations in the Detection of Power Swings in Electrical Networks,” Brown Boveri Publication CH‐ES 35‐30.10E, 1997.
[10] A. Guzmán, V. Mynam, and G. Zweigle, “Backup Transmission Line Protection for Ground Faults and Power Swing Detection Using Synchrophasors,” proceedings of the 34th Annual Western Protective Relay Conference, Spokane, WA, October 2007.
[11] J. Mooney and N. Fischer, “Application Guidelines for Power Swing Detection on Transmission Systems,” proceedings of the 32nd Annual Western Protective Relay Conference, Spokane, WA, October 2005.
[12] W. A. Elmore, "The Fundamentals of Out‐of‐Step Relaying," proceedings of the 34th Annual Conference for Protective Relay Engineers, Texas A&M University, College Station, TX, April 1981.
[13] IEEE Power System Relaying Committee, Working Group D‐6 Report, Power Swing and Out‐of‐Step Considerations on Transmission Lines. Available: http://www.pes‐psrc.org/.

NERC | Protection System Response to Power Swings | August 2013 48 of 61
Appendix D – Potential Methods to Demonstrate Security of Protective Relays IEEE PSRC WG D6 Method Appendix A of the IEEE PSRC WG D6 paper on power swing considerations presents the process of reducing a complex power system to a two source equivalent system connected by a single transmission line in parallel with a second line which is the equivalent of the remaining transmission system connecting the two sources. The two source equivalent system will be accurate for faults anywhere on the retained transmission line. It can also be used to determine whether the swing center of the two systems lies within the retained transmission. The usefulness of the method of determining whether the swing center is contained within the line depends on the probability of the actual power system to consist of two coherent systems of generators connected by the modeled system. This method was applied to a system in the northwest portion of the eastern interconnection. The system consists of a double circuit ring of 345 kV lines around an underlying 115 kV system. Large generation stations are located at several points around the ring. The 345 kV lines connect with other systems from the east, southeast, and southwest parts of the ring. When applied to these connections, the method of Appendix A predicts that the swing center will pass through these lines. In fact this system has been observed to have at least one of these swing centers, and the system of generators around the ring will behave as a coherent set relative to the connected system across the ties. The method also predicts that virtually every 115kV line within the 345kV ring will also contain the swing center when the system is reduced to a two source equivalent. It is extremely unlikely to separate into two independent sets of coherent generators within this ring. In his paper “The Fundamentals of Out‐Of‐Step Relaying”, Walt Elmore presents this method and states, “When more than a line or two are to be analyzed, it is virtually impossible to use the method.” When applied to the 345kV lines making up the double circuit ring, the method shows that for a majority of them the swing center will not pass through them, but will fall just outside the line. For the most part, these lines are fairly short with many interconnections. An assessment was not performed examining the effect of taking two or three lines out, but this likely would result in bringing the center into one end of the line. With several of these lines out the possibility of two sets of generators swinging relative to each other increases. For the most part, the Appendix A method looks useful for identifying swing centers between relatively independent systems connected by a small number of ties.
Calculation Methods based on the Graphical Analysis Method A classical method to determine if a particular relay is subject to tripping during a power swing is discussed in Appendix A. In this method, the system consists of the line where the relay is applied with a system equivalent generator and impedance at each end of a particular line (see Figure 6). For this system, assuming equal voltage magnitudes for the equivalent generator, a power swing traverses along the perpendicular bisector of the total system impedance. Figure 6 shows a graphical interpretation of this. In Figure 7, the dashed line is the path the impedance traverses during the power swing and the angle delta is the angle between the two equivalent generator sources. The impedance seen at relay terminal A is to the right of the relay’s impedance characteristic prior to the onset of the power swing. As a stable power swing occurs, the angle between the two equivalent generators increases causing the impedance to move to the left along the dashed line. When the system stabilizes, the power swing will switch directions (this can take a significant amount of time) and move to the right along the dashed line, oscillate, and then end at a new stable operating point. Depending on the size of the overall system impedance, the length of the line, and the reach of the impedance relay, the stable power swing may or may not fall within the relay characteristic. For cases where the relay’s impedance characteristic intersects the electrical center of the system, the power swing will enter the relay’s characteristic at some value of the angle delta. When the power swing enters the relay’s characteristic, the relay will trip quickly if it is a zone 1 type relay. Because stable power swings may be slower to reverse direction than it takes a typical time delayed relay to trip, time delayed zones must also be evaluated. As stated in this report and many others it is generally accepted based on many power swing studies that if a power swing traverses beyond an angle delta greater than or equal to 120 degrees, the power swing will not be stable. This 120 degree angle is often called the “critical angle.” The logic behind the general acceptance of 120 degrees as the critical angle for
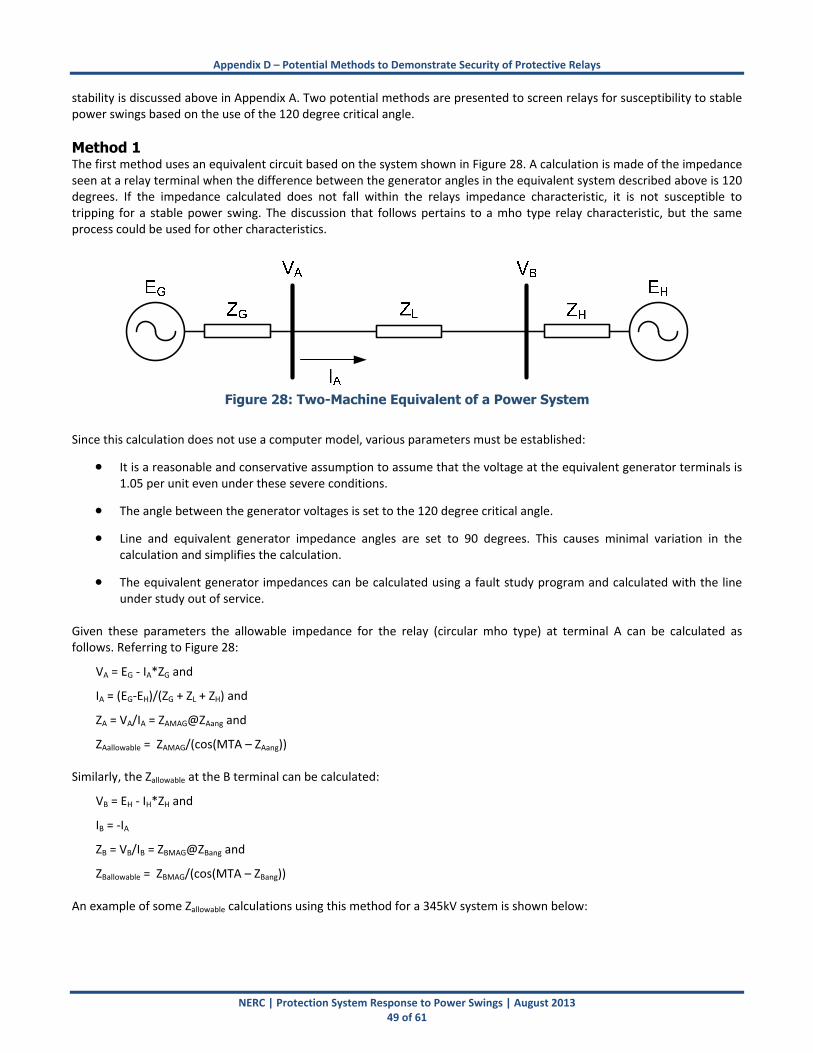
Appendix D – Potential Methods to Demonstrate Security of Protective Relays
NERC | Protection System Response to Power Swings | August 2013 49 of 61
stability is discussed above in Appendix A. Two potential methods are presented to screen relays for susceptibility to stable power swings based on the use of the 120 degree critical angle.
Method 1 The first method uses an equivalent circuit based on the system shown in Figure 28. A calculation is made of the impedance seen at a relay terminal when the difference between the generator angles in the equivalent system described above is 120 degrees. If the impedance calculated does not fall within the relays impedance characteristic, it is not susceptible to tripping for a stable power swing. The discussion that follows pertains to a mho type relay characteristic, but the same process could be used for other characteristics.
Figure 28: Two-Machine Equivalent of a Power System
Since this calculation does not use a computer model, various parameters must be established:
It is a reasonable and conservative assumption to assume that the voltage at the equivalent generator terminals is 1.05 per unit even under these severe conditions.
The angle between the generator voltages is set to the 120 degree critical angle.
Line and equivalent generator impedance angles are set to 90 degrees. This causes minimal variation in the calculation and simplifies the calculation.
The equivalent generator impedances can be calculated using a fault study program and calculated with the line under study out of service.
Given these parameters the allowable impedance for the relay (circular mho type) at terminal A can be calculated as follows. Referring to Figure 28:
VA = EG ‐ IA*ZG and
IA = (EG‐EH)/(ZG + ZL + ZH) and
ZA = VA/IA = ZAMAG@ZAang and
ZAallowable = ZAMAG/(cos(MTA – ZAang)) Similarly, the Zallowable at the B terminal can be calculated:
VB = EH ‐ IH*ZH and
IB = ‐IA
ZB = VB/IB = ZBMAG@ZBang and
ZBallowable = ZBMAG/(cos(MTA – ZBang)) An example of some Zallowable calculations using this method for a 345kV system is shown below:

Appendix D – Potential Methods to Demonstrate Security of Protective Relays
NERC | Protection System Response to Power Swings | August 2013 50 of 61
Table 1: Examples of Zallowable for a Sample 345 kV System Using Method 1
System Angle
(degrees)
System and Line Impedance (Ohms) ZA allowable ZB allowable
EG EH ZG ZL ZH 90º MTA
85º MTA
80º MTA
75º MTA
90º MTA
85º MTA
80º MTA
75º MTA
0 120 5 5 10 11.7 13.0 14.9 17.5 11.7 10.6 9.8 9.2
0 120 13 5 10 66.3 227.4 ‐158.4 ‐58.9 16.3 15.1 14.3 13.6
0 120 20 20 10 46.7 62.7 96.5 213.3 46.7 37.4 31.4 27.2
0 120 5 5 60 43.6 46.5 50.3 55.1 43.6 41.3 39.6 38.2
Note 1) A negative number means that no stable power swings will fall within the zone.
Note 2) If EG = 120 and EH = 0, then the ZA allowable impedances shown become the ZB allowable impedances and vice versa.
This method is conservative for a number of reasons:
This simplified calculation assumes a large stable power swing with the system in a normal configuration. Tripping for a stable power swing is more likely with the system weakened. Weakening the system increases the allowable impedance for a given line.
This simplified calculation estimates the equivalent system impedances from the fault model which uses sub‐transient reactances for generators. Power Swings are longer time phenomena and use transient reactances which are larger (X’’d ~ 0.7X’d).
It does not include the effects of parallel paths to the line under test (i.e., it ignores the transfer impedance – see Method 2). Including parallel paths allows for a higher distance zone setting. This method essentially assumes that the line under test is the only line connecting two systems.
Some conclusions that are generally known can also be drawn from this method:
Shorter lines with shorter relay settings are less susceptible to tripping on power swings than longer lines with larger settings.
Zone 1 relays on short lines (i.e. lines < ~ 40 miles at 345kV and probably greater) are basically immune to tripping on stable power swings. Overreaching distance zones (zone 2, zone 3, etc.) with reaches equivalent to this short line zone 1 reach are also basically immune to tripping on stable power swings. Note that distances vary proportionally with voltage level (lower at lower voltages and higher at higher voltage levels).
As source impedances change due to system configuration changes, the susceptibility of a mho relay to trip for a stable power swing can vary a great deal.
Depending on the direction of power flow during the stable swing (into or out of the relay terminal), the susceptibility of a mho relay to trip for a stable power swing can vary a great deal.
This method will screen out backup zones in some cases, but does not screen out backup zones well, even on highly connected systems where stable power swings are less likely or highly unlikely.
Method 2 The second method uses an equivalent circuit based on the system shown in Figure 29. A calculation of the impedance seen at a relay terminal when the difference between the generator angles in the equivalent system described above is 120
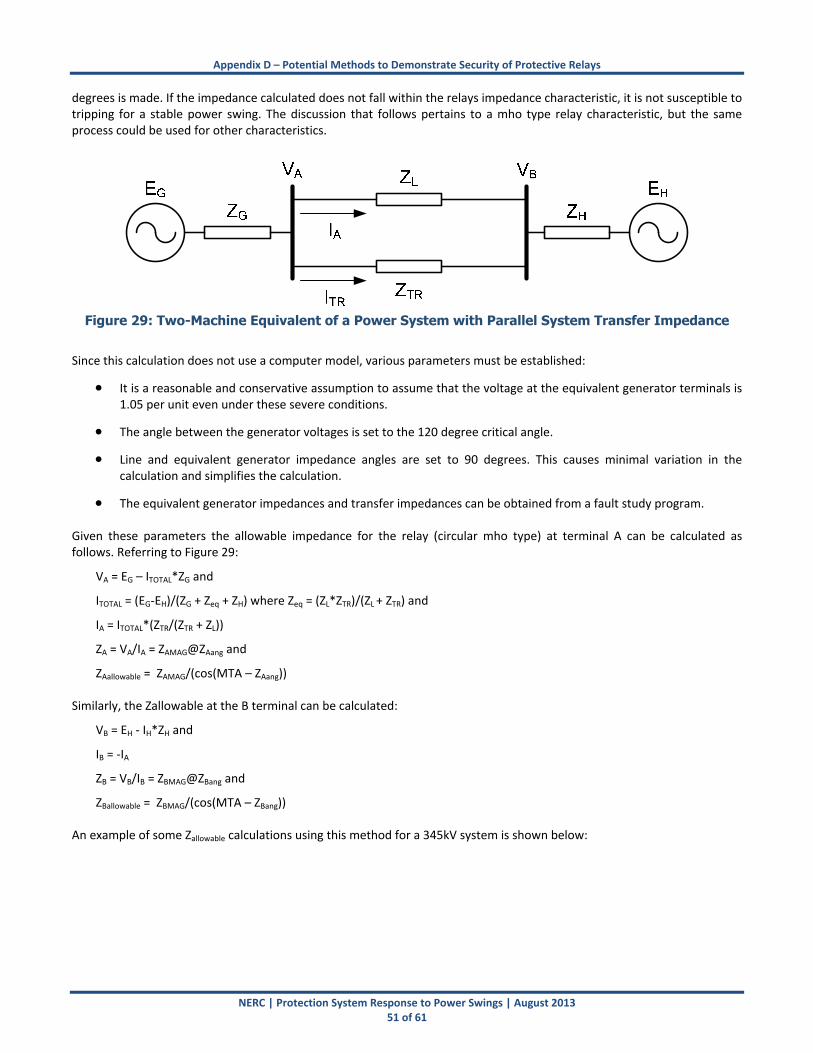
Appendix D – Potential Methods to Demonstrate Security of Protective Relays
NERC | Protection System Response to Power Swings | August 2013 51 of 61
degrees is made. If the impedance calculated does not fall within the relays impedance characteristic, it is not susceptible to tripping for a stable power swing. The discussion that follows pertains to a mho type relay characteristic, but the same process could be used for other characteristics.
Figure 29: Two-Machine Equivalent of a Power System with Parallel System Transfer Impedance
Since this calculation does not use a computer model, various parameters must be established:
It is a reasonable and conservative assumption to assume that the voltage at the equivalent generator terminals is 1.05 per unit even under these severe conditions.
The angle between the generator voltages is set to the 120 degree critical angle.
Line and equivalent generator impedance angles are set to 90 degrees. This causes minimal variation in the calculation and simplifies the calculation.
The equivalent generator impedances and transfer impedances can be obtained from a fault study program. Given these parameters the allowable impedance for the relay (circular mho type) at terminal A can be calculated as follows. Referring to Figure 29:
VA = EG – ITOTAL*ZG and
ITOTAL = (EG‐EH)/(ZG + Zeq + ZH) where Zeq = (ZL*ZTR)/(ZL + ZTR) and
IA = ITOTAL*(ZTR/(ZTR + ZL))
ZA = VA/IA = ZAMAG@ZAang and
ZAallowable = ZAMAG/(cos(MTA – ZAang)) Similarly, the Zallowable at the B terminal can be calculated:
VB = EH ‐ IH*ZH and
IB = ‐IA
ZB = VB/IB = ZBMAG@ZBang and
ZBallowable = ZBMAG/(cos(MTA – ZBang)) An example of some Zallowable calculations using this method for a 345kV system is shown below:

Appendix D – Potential Methods to Demonstrate Security of Protective Relays
NERC | Protection System Response to Power Swings | August 2013 52 of 61
Table 2: Examples of Zallowable for a Sample 345 kV System Using Method 2
System Angles System, Line, and Transfer
Impedances ZA allowable ZB allowable
EG EH ZG ZH ZTR ZL 90º MTA
85º MTA
80º MTA
75º MTA
90º MTA
85º MTA
80º MTA
75º MTA
0 120 5 5 10 10 20.0 23.7 29.2 38.6 17.5 16.3 15.4 14.7
0 120 5 5 50 10 13.1 14.8 17.1 20.5 12.7 11.7 10.9 10.3
0 120 5 5 100 10 12.4 13.9 16.0 18.9 12.2 11.2 10.4 9.7
0 120 5 5 500 10 11.8 13.2 15.1 17.8 11.8 10.7 9.9 9.3
0 120 13 5 10 10 -61.8 -44.7 -35.2 -29.3 27.8 26.2 25.0 24.0
0 120 13 5 50 10 416.3 -139.7 -60.0 -38.4 18.5 17.3 16.4 15.6
0 120 13 5 100 10 123.9 -489.1 -82.4 -45.2 17.4 16.2 15.3 14.6
0 120 20 20 10 10 140.0 257.7 1696.9 -369.5 52.0 47.8 44.6 42.1
0 120 20 20 50 10 61.1 86.7 151.4 615.4 40.1 34.7 30.7 27.7
0 120 20 20 100 10 53.6 74.0 120.9 337.1 41.7 35.0 30.4 27.0
0 120 5 5 10 60 76.9 86.7 100.2 119.8 83.5 79.4 76.3 74.0
0 120 5 5 50 60 48.7 52.5 57.4 63.9 51.6 48.9 46.9 45.4
0 120 5 5 100 60 46.0 49.4 53.7 59.3 47.6 45.1 43.2 41.8
Note 1) A negative number means that no stable power swings will fall within the zone.
Note 2) If EG = 120 and EH = 0, then the ZA allowable impedances shown become the ZB allowable impedances and vice versa.
This method is conservative for a number of reasons:
This simplified calculation assumes a large stable power swing with the system in a normal configuration. Tripping for a stable power swing is more likely with the system weakened. Weakening the system increases the allowable impedance for a given line.
This simplified calculation estimates the equivalent system impedances from the fault model which uses sub‐transient reactances for generators. Power Swings are longer time phenomena and use transient reactances which are larger (X’’d ~ 0.7X’d).
Some conclusions that are generally known can also be drawn from this method:
If the transfer impedance is high, this method is essentially the same as method 1. If the transfer impedance is infinite, this method is equivalent to method 1.

Appendix D – Potential Methods to Demonstrate Security of Protective Relays
NERC | Protection System Response to Power Swings | August 2013 53 of 61
If the transfer impedance is low as in a more interconnected system, this method shows that a greater relay reach can be set before a relay will trip during a stable power swing versus method 1. This method is a more accurate representation of the power system and hence is more accurate than method 1. However, as transfer impedances change due to system configuration changes, the susceptibility of a mho relay to trip for a stable power swing also changes.
Shorter lines with shorter relay settings are less susceptible to tripping on power swings than longer lines with larger settings.
Zone 1 relays on short lines (i.e. lines < ~ 40 miles at 345kV and probably greater) are basically immune to tripping on stable power swings. Overreaching distance zones (zone 2, zone 3, etc.) with reaches equivalent to this short line zone 1 reach are also basically immune to tripping on stable power swings. Note that distances vary with voltage level (lower at lower voltages and higher at higher voltage levels).
As source impedances change due to system configuration changes, the susceptibility of a mho relay to trip for a stable power swing can vary a great deal.
Depending on the direction of power flow during the stable swing (into or out of the relay terminal), the susceptibility of a mho relay to trip for a stable power swing can vary a great deal.
This method will screen out backup zones better than method 1. Like the methods for loadability in PRC‐023, both method 1 and method 2 address a single impedance relay or a single relay element. This method does not provide a calculation for a composite scheme like a Permissive Overreach with Transfer Trip scheme where two relays may be required to pick up to cause a trip.
Voltage Dip Screening Method Although there are number of successful power swing detection methods, the goal of the voltage dip method is to establish a reliable screening tool easily applicable in transient stability planning studies. Transient stability planning studies evaluate many contingencies and monitor performance of many variables of the Bulk‐Power System in order to demonstrate compliance with applicable standards and criteria. Due to the comprehensive nature of the analysis, a practical screening method that flags potential power swing problems is essential. It is well known that the most accurate method of identifying stable/unstable power swing requires a model of the protection system (susceptible to stable and unstable power swings) in place and detailed simulation of the event that produces the power swing. A plot of apparent impedance trajectory during the system disturbance against an appropriate relay characteristic determines the power swing status. In large scale transient stability planning studies where many contingencies are considered, that approach requires an effort of modeling and maintaining many relay characteristics and recording many apparent impedance channels. The proposed screening method seeks a reliable way of identifying potential power swings with minimal burden on additional modeling as part of the analysis. While the power swing is the result of angular separation between units or coherent groups of units that oscillate against each other, finding the coherent groups requires multiple simulation runs. In power swing identification primary question is whether the swing is stable or not and the subsequent question is to identify which units drive the power swing. As a result of coherent units swings, the transmission voltage magnitude gets low near the center of the swing. Therefore, since transmission voltages are monitored in transient stability planning studies and voltage performance is subject to planning criteria in many areas (WECC Transmission planning standard and ISO‐NE voltage sag guidelines), post‐disturbance voltage dips can be used as a potential screening tool for power swing identification. In order to establish a theory behind the proposed method, a two‐source equivalent is examined first. Since the system has only one path between two sources, the idea is to study a range of system conditions subject to the power swing and then test the voltage dip criteria on the transmission line terminals. The two‐source system in Figure 30 is analyzed. The system is assumed to be symmetrical (i.e., the source terminal voltages are equal in magnitude, |EG|=|EH|), during the power swing, the electrical center occurs in the middle of the impedance between two sources.

Appendix D – Potential Methods to Demonstrate Security of Protective Relays
NERC | Protection System Response to Power Swings | August 2013 54 of 61
Figure 30:Two-source equivalent system
The following assumptions have been made regarding the system in Figure 30:
1) Source and line resistances are neglected
2) Distance relay characteristic is a circle with diameter equal to 100 percent of line reactance
3) Relay maximum torque angle is equal to line angle
4) For simplicity it will be assumed that XG+XL+XH=1 pu
5) Source voltage magnitudes are equal EG=EH=1.0 pu
6) EH0, represents an infinite bus
7) EG , with (0,180) swings against EH
8) Angle M represents angle of separation between sources G and H at which swing trajectory enters line relay characteristic.
The equations used in numerical simulations of the system represented in Figure 30 are as follows. The current between two sources is determined by:
)(
0
HLG
HG
XXXj
EEI
The voltage at the electrical center of the swing is:
The complex voltages at the line ends A and B are:
IjXEV GGA
IjXEV HHB
The goal of the following analysis is that depending on different system conditions in terms of strength of systems and length of the line, investigate values of different quantities of the two source system at the moment when power swing
locus enters the line relay characteristic (designated with angle M in Figure 30) and test whether power swing could be identified based on voltage dip at the line terminals.
IXXX
jEV HLGGC 2
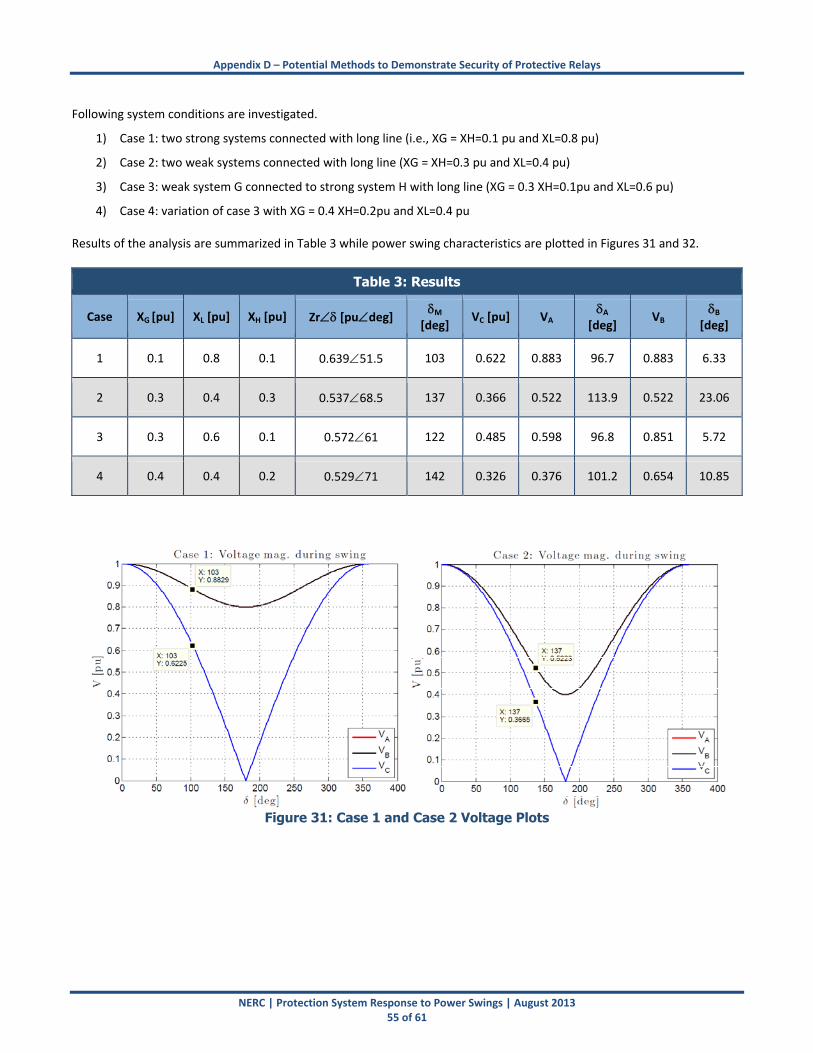
Appendix D – Potential Methods to Demonstrate Security of Protective Relays
NERC | Protection System Response to Power Swings | August 2013 55 of 61
Following system conditions are investigated.
1) Case 1: two strong systems connected with long line (i.e., XG = XH=0.1 pu and XL=0.8 pu)
2) Case 2: two weak systems connected with long line (XG = XH=0.3 pu and XL=0.4 pu)
3) Case 3: weak system G connected to strong system H with long line (XG = 0.3 XH=0.1pu and XL=0.6 pu)
4) Case 4: variation of case 3 with XG = 0.4 XH=0.2pu and XL=0.4 pu Results of the analysis are summarized in Table 3 while power swing characteristics are plotted in Figures 31 and 32.
Table 3: Results
Case XG [pu] XL [pu] XH [pu] Zr [pudeg] M
[deg] VC [pu] VA
A [deg]
VB B
[deg]
1 0.1 0.8 0.1 0.63951.5 103 0.622 0.883 96.7 0.883 6.33
2 0.3 0.4 0.3 0.53768.5 137 0.366 0.522 113.9 0.522 23.06
3 0.3 0.6 0.1 0.57261 122 0.485 0.598 96.8 0.851 5.72
4 0.4 0.4 0.2 0.52971 142 0.326 0.376 101.2 0.654 10.85
Figure 31: Case 1 and Case 2 Voltage Plots
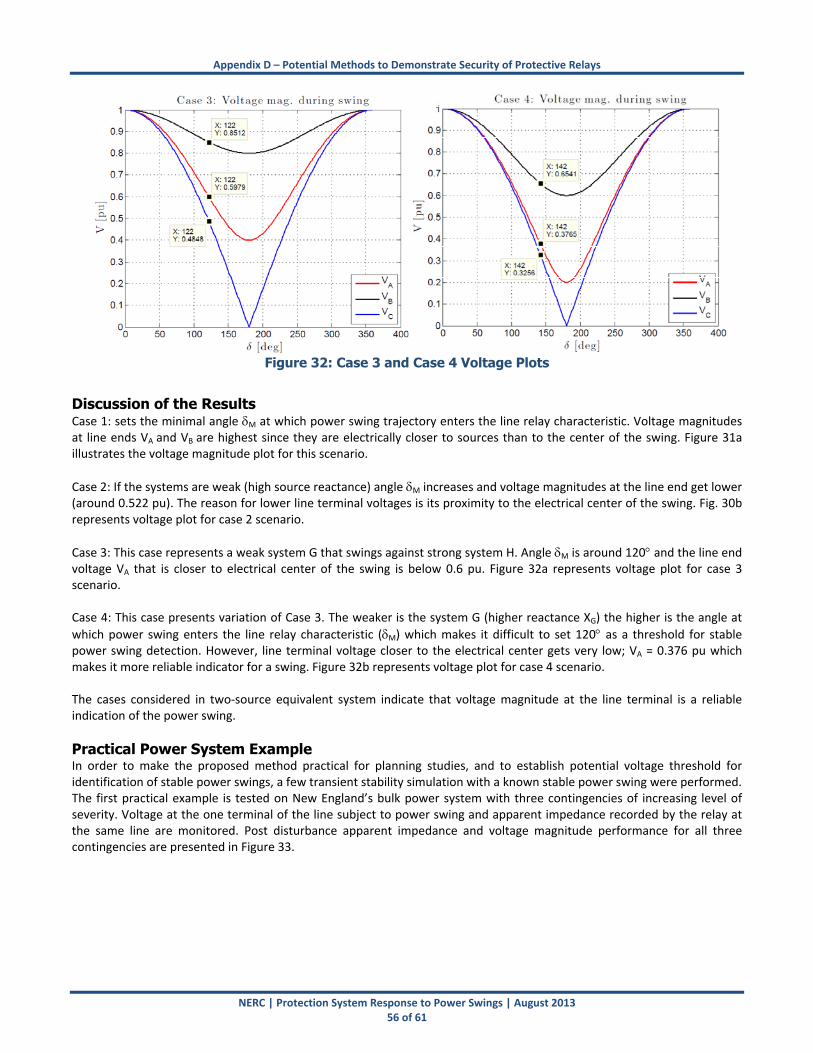
Appendix D – Potential Methods to Demonstrate Security of Protective Relays
NERC | Protection System Response to Power Swings | August 2013 56 of 61
Figure 32: Case 3 and Case 4 Voltage Plots
Discussion of the Results Case 1: sets the minimal angle M at which power swing trajectory enters the line relay characteristic. Voltage magnitudes at line ends VA and VB are highest since they are electrically closer to sources than to the center of the swing. Figure 31a illustrates the voltage magnitude plot for this scenario.
Case 2: If the systems are weak (high source reactance) angle M increases and voltage magnitudes at the line end get lower (around 0.522 pu). The reason for lower line terminal voltages is its proximity to the electrical center of the swing. Fig. 30b represents voltage plot for case 2 scenario.
Case 3: This case represents a weak system G that swings against strong system H. Angle M is around 120 and the line end voltage VA that is closer to electrical center of the swing is below 0.6 pu. Figure 32a represents voltage plot for case 3 scenario. Case 4: This case presents variation of Case 3. The weaker is the system G (higher reactance XG) the higher is the angle at
which power swing enters the line relay characteristic (M) which makes it difficult to set 120 as a threshold for stable power swing detection. However, line terminal voltage closer to the electrical center gets very low; VA = 0.376 pu which makes it more reliable indicator for a swing. Figure 32b represents voltage plot for case 4 scenario. The cases considered in two‐source equivalent system indicate that voltage magnitude at the line terminal is a reliable indication of the power swing.
Practical Power System Example In order to make the proposed method practical for planning studies, and to establish potential voltage threshold for identification of stable power swings, a few transient stability simulation with a known stable power swing were performed. The first practical example is tested on New England’s bulk power system with three contingencies of increasing level of severity. Voltage at the one terminal of the line subject to power swing and apparent impedance recorded by the relay at the same line are monitored. Post disturbance apparent impedance and voltage magnitude performance for all three contingencies are presented in Figure 33.
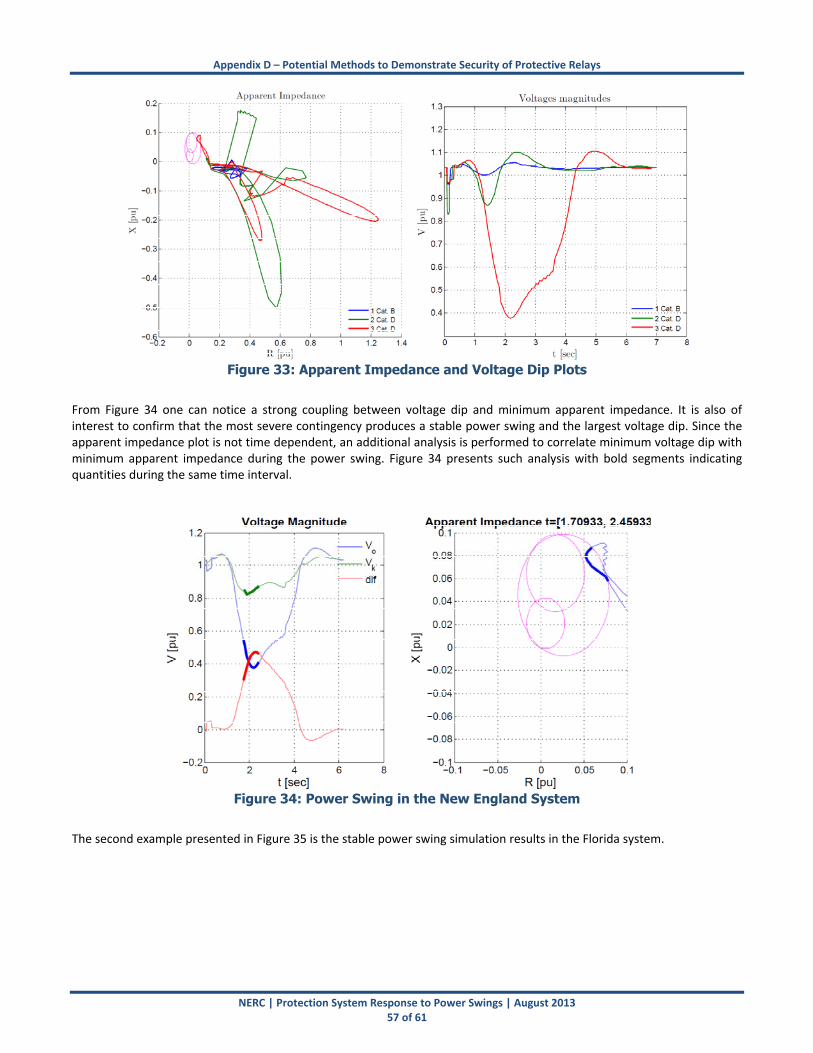
Appendix D – Potential Methods to Demonstrate Security of Protective Relays
NERC | Protection System Response to Power Swings | August 2013 57 of 61
Figure 33: Apparent Impedance and Voltage Dip Plots
From Figure 34 one can notice a strong coupling between voltage dip and minimum apparent impedance. It is also of interest to confirm that the most severe contingency produces a stable power swing and the largest voltage dip. Since the apparent impedance plot is not time dependent, an additional analysis is performed to correlate minimum voltage dip with minimum apparent impedance during the power swing. Figure 34 presents such analysis with bold segments indicating quantities during the same time interval.
Figure 34: Power Swing in the New England System
The second example presented in Figure 35 is the stable power swing simulation results in the Florida system.
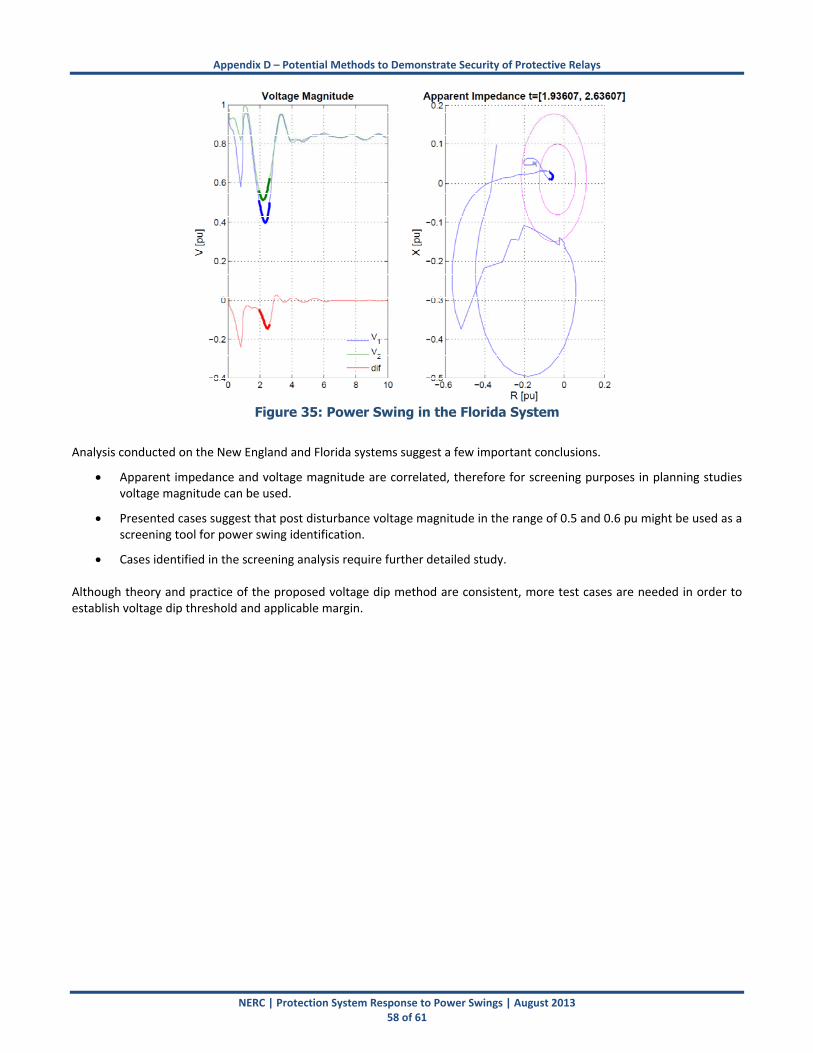
Appendix D – Potential Methods to Demonstrate Security of Protective Relays
NERC | Protection System Response to Power Swings | August 2013 58 of 61
Figure 35: Power Swing in the Florida System
Analysis conducted on the New England and Florida systems suggest a few important conclusions.
Apparent impedance and voltage magnitude are correlated, therefore for screening purposes in planning studies voltage magnitude can be used.
Presented cases suggest that post disturbance voltage magnitude in the range of 0.5 and 0.6 pu might be used as a screening tool for power swing identification.
Cases identified in the screening analysis require further detailed study. Although theory and practice of the proposed voltage dip method are consistent, more test cases are needed in order to establish voltage dip threshold and applicable margin.

NERC | Protection System Response to Power Swings | August 2013 59 of 61
Appendix E – System Protection and Control Subcommittee William J. Miller Chair Principal Engineer Exelon Corporation
Philip B. Winston Vice Chair Chief Engineer, Protection and Control Southern Company
Michael Putt RE – FRCC Manager, Protection and Control Engineering Applications Florida Power & Light Co.
Mark Gutzmann RE – MRO Manager, System Protection Engineering Xcel Energy, Inc.
Richard Quest RE – MRO – Alternate Principal Systems Protection Engineer Midwest Reliability Organization
George Wegh RE – NPCC Manager – Transmission Protection and Controls Engineering Northeast Utilities
Quoc Le RE – NPCC ‐‐ Alternate Manager, System Planning and Protection NPCC
Jeff Iler RE – RFC Principal Engineer, Protection and Control Engineering American Electric Power
Therron Wingard RE – SERC Principal Engineer Southern Company
David Greene RE – SERC ‐‐ Alternate Reliability Engineer SERC Reliability Corporation
Lynn Schroeder RE – SPP Manager, Substation Protection and Control Westar Energy
Samuel Francis RE – TRE System Protection Specialist Oncor Electric Delivery
David Penney, P.E. RE – TRE – Alternate Senior Reliability Engineer Texas Reliability Entity
Baj Agrawal RE – WECC Principal Engineer Arizona Public Service Company
Forrest Brock Cooperative Station Services Superintendent Western Farmers Electric Cooperative
Miroslav Kostic Federal/Provincial Utility P&C Planning Manager, Transmission Hydro One Networks, Inc.
Sungsoo Kim Federal/Provincial Utility Section Manager – Protections and Technical Compliance Ontario Power Generation Inc.
Joe T. Uchiyama Federal/Provincial Utility Senior Electrical Engineer U.S. Bureau of Reclamation
Daniel McNeely Federal/Provincial Utility ‐ Alternate Engineer ‐ System Protection and Analysis Tennessee Valley Authority
Michael J. McDonald Investor‐Owned Utility Principal Engineer, System Protection Ameren Services Company
Jonathan Sykes Investor‐Owned Utility Manager of System Protection Pacific Gas and Electric Company
Charles W. Rogers Transmission Dependent Utility Principal Engineer Consumers Energy Co.
Philip J. Tatro NERC Staff Coordinator Senior Performance and Analysis Engineer NERC
NERC | Protection System Response to Power Swings | August 2013 60 of 61
Appendix F – System Analysis and Modeling Subcommittee John Simonelli Chair Director ‐ Operations Support Services ISO New England
K. R Chakravarthi Vice Chair Manager, Interconnection and Special Studies Southern Company Services, Inc.
G Brantley Tillis, P.E. RE – FRCC Manager, Transmission Planning Florida Progress Energy Florida
Kiko Barredo RE – FRCC – Alternate Manager, Bulk Transmission Planning Florida Power & Light Co.
Thomas C. Mielnik RE – MRO Manager Electric System Planning MidAmerican Energy Co.
Salva R. Andiappan RE – MRO – Alternate Manager ‐ Modeling and Reliability Assessments Midwest Reliability Organization
Donal Kidney RE – NPCC Manager, System Compliance Program Implementation Northeast Power Coordinating Council
Quoc Le RE – NPCC ‐‐ Alternate Manager, System Planning and Protection NPCC
Eric Mortenson, P.E. Investor‐Owned Utility Principal Rates & Regulatory Specialist Exelon Business Services Company
Mark Byrd RE – SERC Manager ‐ Transmission Planning Progress Energy Carolinas
Gary T Brownfield RE – SERC – Alternate Supervising Engineer, Transmission Planning Ameren Services
Jonathan E Hayes RE – SPP Reliability Standards Development Engineer Southwest Power Pool, Inc.
Kenneth A. Donohoo, P.E. RE – TRE Director System Planning Oncor Electric Delivery
Hari Singh, Ph.D. RE – WECC Transmission Asset Management Xcel Energy, Inc.
Kent Bolton RE – WECC – Alternate Staff Engineer Western Electricity Coordinating Council
Patricia E Metro Cooperative Manager, Transmission and Reliability Standards National Rural Electric Cooperative Association
Paul McCurley Cooperative – Alternate Manager, Power Supply and Chief Engineer National Rural Electric Cooperative Association
Ajay Garg Federal/Provincial Utility Manager, Policy and Approvals Hydro One Networks, Inc.
Amos Ang, P.E. Investor‐Owned Utility Engineer, Transmission Interconnection Planning Southern California Edison
Bobby Jones Investor‐Owned Utility Project Manager, Stability Studies Southern Company Services, Inc.
Scott M. Helyer IPP Vice President, Transmission Tenaska, Inc.
Digaunto Chatterjee ISO/RTO Manager of Transmission Expansion Planning Midwest ISO, Inc.
Bill Harm ISO/RTO Senior Consultant PJM Interconnection, L.L.C.
Steve Corey ISO/RTO – Alternate Manager, Transmission Planning New York Independent System Operator
Bob Cummings NERC Staff Coordinator Senior Performance and Analysis Engineer NERC
NERC | Protection System Response to Power Swings | August 2013 61 of 61
Appendix G – Additional Contributors John Ciufo, P.Eng. Principal Engineer Ciufo & Cooperberg Consulting, Inc.
Tom Gentile Vice President Transmission Quanta Technology
Bryan Gwyn Senior Director, Protection and Control Asset Management Quanta Technology
Kevin W. Jones Principal Engineer, System Protection Engineering Xcel Energy
Dmitry Kosterev Bonneville Power Administration
Chuck Matthews Bonneville Power Administration
John O’Connor Principal Engineer Progress Energy Carolinas
Slobodan Pajic Senior Engineer, Energy Consulting GE Energy Management
Fabio Rodriguez Principal Engineer Progress Energy Florida
Tracy Rolstad Senior Power System Consultant Avista Corporation
Joseph Seabrook Consulting Engineer Puget Sound Energy, Inc.
Demetrios Tziouvaras Senior Research Engineer Schweitzer Engineering Laboratories, Inc.
Recommended