- 1 -
PROSPECTUS SUPPLEMENT DATED 3 SEPTEMBER 2012
TO THE BASE PROSPECTUS DATED 1 JUNE 2012
Electricité de France
€30,000,000,000 EURO MEDIUM TERM NOTE PROGRAMME
This prospectus supplement (the "Supplement") is supplemental and must be read in conjunction with
the Base Prospectus dated 1 June 2012 (the "Base Prospectus") granted visa No. 12-240 on 1 June
2012 by the Autorité des marchés financiers (the "AMF") prepared by Electricité de France ("EDF" or
the "Issuer") with respect to its €30,000,000,000 Euro Medium Term Note Programme (the
"Programme"). Terms defined in the Base Prospectus have the same meaning when used in this
Supplement.
Application has been made for approval of this Supplement to the AMF in its capacity as competent
authority pursuant to Article 212-2 of its Règlement Général which implements Directive 2003/71/EC
of 4 November 2003 on the prospectus to be published when securities are offered to the public or
admitted to trading as amended by Directive 2010/73/EU to the extent that such amendments havebeen implemented in a Member State of the European Economic Area (the "Prospectus Directive").
This Supplement has been prepared pursuant to Article 16 of the Prospectus Directive and article 212-
25 of the Règlement Général of the AMF for the purposes of incorporating the half-year management
report at 30 June 2012, the condensed consolidated half-year financial statements at 30 June 2012
and recent events in connection with the Issuer’s position, activities and status.
Copies of this Supplement will be available for viewing on the website of the AMF (www.amf-
france.org), on the Issuer's website (www.edf.com) and may be obtained, free of charge, during
normal business hours from Electricité de France, 22-30, avenue de Wagram, 75008 Paris, France
and at the specified offices of each of the Paying Agents.
Saved as disclosed in this Supplement to the Base Prospectus, there has been no other significant
new factor, material mistake or inaccuracy relating to information included in the Base Prospectus
which is capable of affecting the assessment of Notes issued under the Programme since the
publication of the Base Prospectus.
- 2 -
Contents of the Supplement
1 HALF-YEAR MANAGEMENT REPORT AT JUNE 30, 2012 3
2 CONDENSED CONSOLIDATED HALF-YEAR FINANCIAL STATEMENTS AT JUNE
30, 2012 59
3 STATUTORY AUDITORS' REVIEW REPORT ON THE FIRST HALF-YEAR
FINANCIAL INFORMATION FOR 2012 114
4 RECENT EVENTS 118
5 PERSONS RESPONSIBLE FOR THE SUPPLEMENT 134
6 VISA OF THE AUTORITÉ DES MARCHÉS FINANCIERS 135
In this Supplement, unless otherwise stated, the references to "Company" or "EDF" refer to EDF S.A.,
the parent company, and the references to "EDF Group" and "Group" refer to EDF and its subsidiaries
and shareholdings.
- 3 -
HALF-YEAR MANAGEMENT REPORT
30 JUNE 2012
- 4 -
MANAGEMENT REPORT CONTENTS
KEY FIGURES 5
ECONOMIC ENVIRONMENT AND SIGNIFICANT EVENTS OF FIRST-HALF 2012 7
ANALYSIS OF THE BUSINESS AND THE CONSOLIDATED INCOME STATEMENTS FOR
THE FIRST HALF-YEARS OF 2011 AND 2012 24
NET INDEBTEDNESS, CASH FLOWS AND INVESTMENTS 39
MANAGEMENT AND CONTROL OF MARKET RISKS 44
TRANSACTIONS WITH RELATED PARTIES 52
PRINCIPAL RISKS AND UNCERTAINTIES FOR THE SECOND HALF OF 2012 52
SIGNIFICANT EVENTS RELATED TO LITIGATION IN PROCESS 53
FINANCIAL OUTLOOK 57
- 5 -
KEY FIGURES
Pursuant to European regulation 1606/2002 of 19 July 2002 on the adoption of international
accounting standards, the EDF group’s condensed consolidated financial statements at 30 June
2012 are prepared using the presentation, recognition and measurement rules set forth in the
international accounting standards published by the IASB and approved by the European Union
for application at 30 June 2012. These international standards are IAS (International Accounting
Standards), IFRS (International Financial Reporting Standards), and SIC and IFRIC interpretations.
The accounting and valuation methods applied by the Group are presented in note 1 to the
condensed consolidated half-year financial statements at 30 June 2012.
The figures presented in this document are taken from the EDF Group’s condensed consolidated
half-year financial statements at 30 June 2012.
The comparative figures for 2011 have been restated for the impact of the change in accounting
method for actuarial gains and losses on post-employment benefits under the options offered by
IAS 19 (see note 2 to the half-year condensed consolidated financial statements). These figures are
presented in the tables in this half-year financial report as “H1 2011 restated”.
The first half-year of 2012 was marked by the acquisition of control over the Edison group at 24
May 2012 (for details of the operation see section 2.2.1.1). Edison is fully consolidated as of that
date, since the Group now holds 78.96% of the capital and 80.7% of the voting rights in Edison.
Application of IFRS 3 (revised) led to recognition of the following in Other income and expenses:
- a loss on sale of €(1,090) million relating to the previous holding in Edison,
- negative goodwill of €1,023 million.
- 6 -
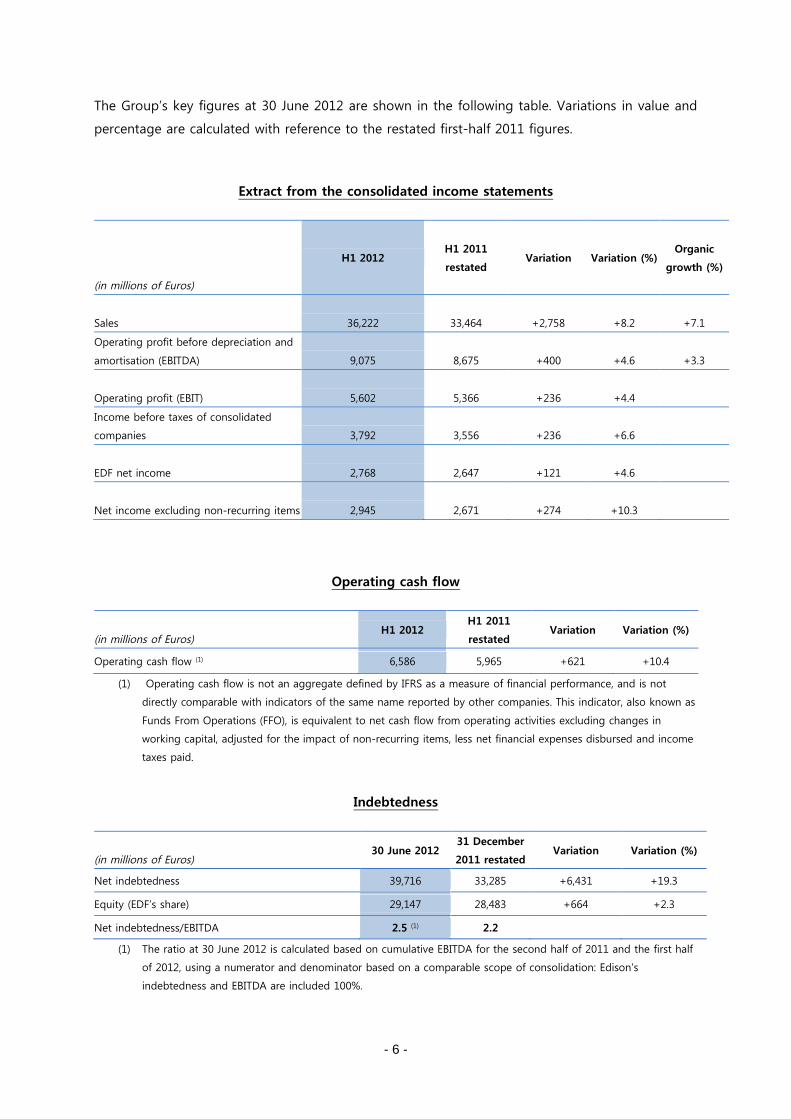
The Group’s key figures at 30 June 2012 are shown in the following table. Variations in value and
percentage are calculated with reference to the restated first-half 2011 figures.
Extract from the consolidated income statements
(in millions of Euros)
H1 2012H1 2011
restatedVariation Variation (%)
Organic
growth (%)
Sales 36,222 33,464 +2,758 +8.2 +7.1
Operating profit before depreciation and
amortisation (EBITDA) 9,075 8,675 +400 +4.6 +3.3
Operating profit (EBIT) 5,602 5,366 +236 +4.4
Income before taxes of consolidated
companies 3,792 3,556 +236 +6.6
EDF net income 2,768 2,647 +121 +4.6
Net income excluding non-recurring items 2,945 2,671 +274 +10.3
Operating cash flow
(in millions of Euros)H1 2012
H1 2011
restatedVariation Variation (%)
Operating cash flow (1) 6,586 5,965 +621 +10.4
(1) Operating cash flow is not an aggregate defined by IFRS as a measure of financial performance, and is not
directly comparable with indicators of the same name reported by other companies. This indicator, also known as
Funds From Operations (FFO), is equivalent to net cash flow from operating activities excluding changes in
working capital, adjusted for the impact of non-recurring items, less net financial expenses disbursed and income
taxes paid.
Indebtedness
(in millions of Euros)30 June 2012
31 December
2011 restatedVariation Variation (%)
Net indebtedness 39,716 33,285 +6,431 +19.3
Equity (EDF’s share) 29,147 28,483 +664 +2.3
Net indebtedness/EBITDA 2.5 (1) 2.2
(1) The ratio at 30 June 2012 is calculated based on cumulative EBITDA for the second half of 2011 and the first half
of 2012, using a numerator and denominator based on a comparable scope of consolidation: Edison’s
indebtedness and EBITDA are included 100%.
- 7 -
2. ECONOMIC ENVIRONMENT AND SIGNIFICANT EVENTS OF FIRST-HALF
2012
2.1. ECONOMIC ENVIRONMENT
2.1.1. TRENDS IN MARKET PRICES FOR ELECTRICITY AND THE PRINCIPAL ENERGY
SOURCES
During the first half of 2012, energy prices in Europe were affected by strongly fluctuating fuel
prices, and a significant wave of cold weather across Europe in February.
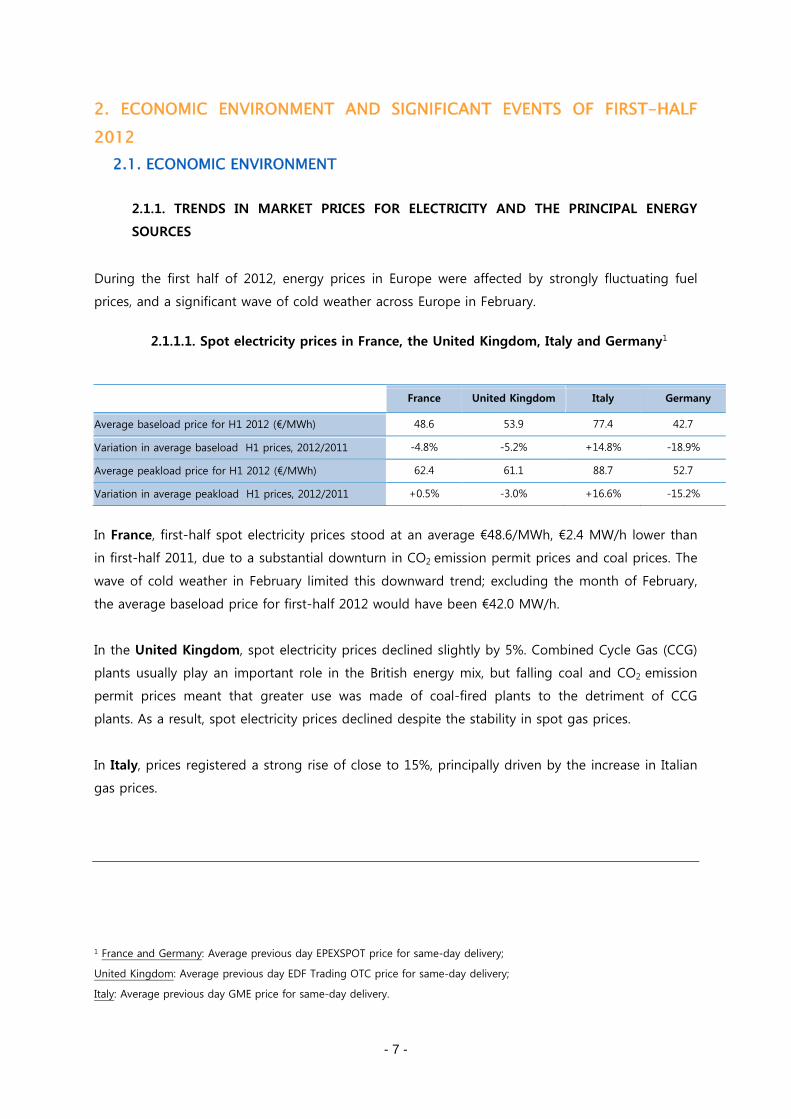
2.1.1.1. Spot electricity prices in France, the United Kingdom, Italy and Germany1
In France, first-half spot electricity prices stood at an average €48.6/MWh, €2.4 MW/h lower than
in first-half 2011, due to a substantial downturn in CO2 emission permit prices and coal prices. The
wave of cold weather in February limited this downward trend; excluding the month of February,
the average baseload price for first-half 2012 would have been €42.0 MW/h.
In the United Kingdom, spot electricity prices declined slightly by 5%. Combined Cycle Gas (CCG)
plants usually play an important role in the British energy mix, but falling coal and CO2 emission
permit prices meant that greater use was made of coal-fired plants to the detriment of CCG
plants. As a result, spot electricity prices declined despite the stability in spot gas prices.
In Italy, prices registered a strong rise of close to 15%, principally driven by the increase in Italian
gas prices.
1 France and Germany: Average previous day EPEXSPOT price for same-day delivery;
United Kingdom: Average previous day EDF Trading OTC price for same-day delivery;
Italy: Average previous day GME price for same-day delivery.
France United Kingdom Italy Germany
Average baseload price for H1 2012 (€/MWh) 48.6 53.9 77.4 42.7
Variation in average baseload H1 prices, 2012/2011 -4.8% -5.2% +14.8% -18.9%
Average peakload price for H1 2012 (€/MWh) 62.4 61.1 88.7 52.7
Variation in average peakload H1 prices, 2012/2011 +0.5% -3.0% +16.6% -15.2%
- 8 -
In Germany, prices were down by 19% compared to first-half 2011 as a result of fuel price
movements and large-scale wind power and photovoltaic power generation. Demand for
electricity is not highly temperature-sensitive in Germany, and the cold spell had less of an impact
than in France.
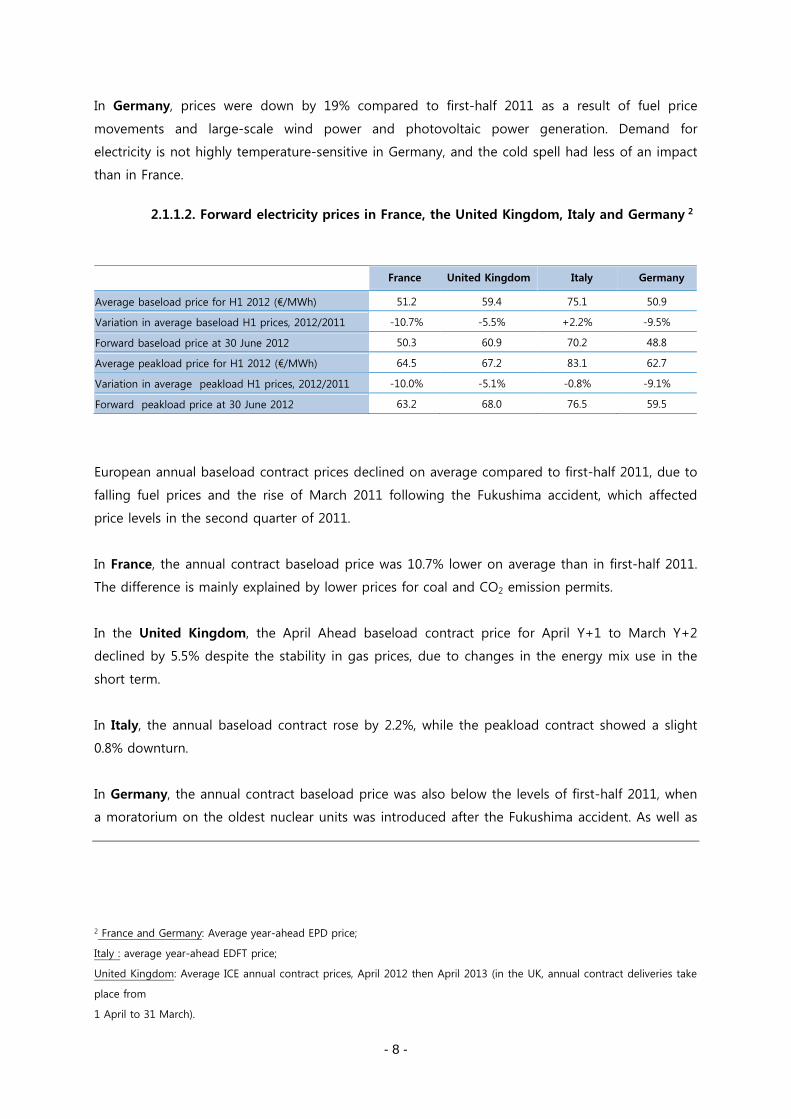
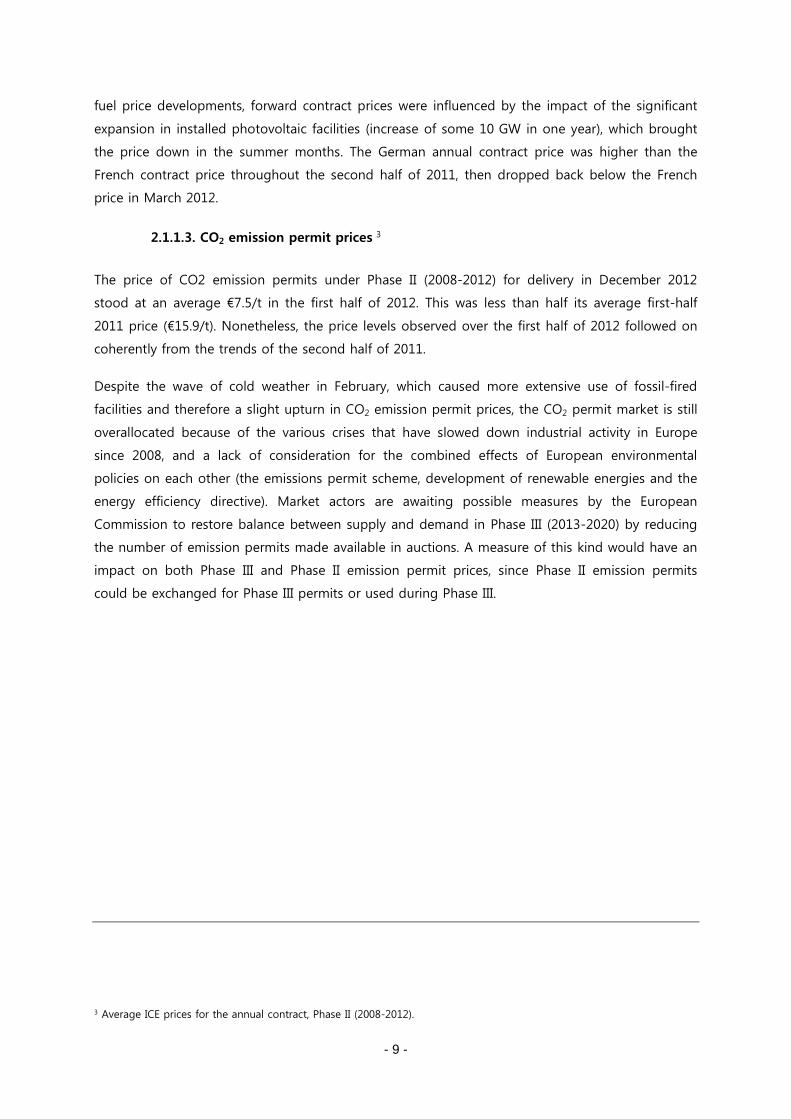
2.1.1.2. Forward electricity prices in France, the United Kingdom, Italy and Germany 2
European annual baseload contract prices declined on average compared to first-half 2011, due to
falling fuel prices and the rise of March 2011 following the Fukushima accident, which affected
price levels in the second quarter of 2011.
In France, the annual contract baseload price was 10.7% lower on average than in first-half 2011.
The difference is mainly explained by lower prices for coal and CO2 emission permits.
In the United Kingdom, the April Ahead baseload contract price for April Y+1 to March Y+2
declined by 5.5% despite the stability in gas prices, due to changes in the energy mix use in the
short term.
In Italy, the annual baseload contract rose by 2.2%, while the peakload contract showed a slight
0.8% downturn.
In Germany, the annual contract baseload price was also below the levels of first-half 2011, when
a moratorium on the oldest nuclear units was introduced after the Fukushima accident. As well as
2 France and Germany: Average year-ahead EPD price;
Italy : average year-ahead EDFT price;
United Kingdom: Average ICE annual contract prices, April 2012 then April 2013 (in the UK, annual contract deliveries take
place from
1 April to 31 March).
France United Kingdom Italy Germany
Average baseload price for H1 2012 (€/MWh) 51.2 59.4 75.1 50.9
Variation in average baseload H1 prices, 2012/2011 -10.7% -5.5% +2.2% -9.5%
Forward baseload price at 30 June 2012 50.3 60.9 70.2 48.8
Average peakload price for H1 2012 (€/MWh) 64.5 67.2 83.1 62.7
Variation in average peakload H1 prices, 2012/2011 -10.0% -5.1% -0.8% -9.1%
Forward peakload price at 30 June 2012 63.2 68.0 76.5 59.5
- 9 -
fuel price developments, forward contract prices were influenced by the impact of the significant
expansion in installed photovoltaic facilities (increase of some 10 GW in one year), which brought
the price down in the summer months. The German annual contract price was higher than the
French contract price throughout the second half of 2011, then dropped back below the French
price in March 2012.
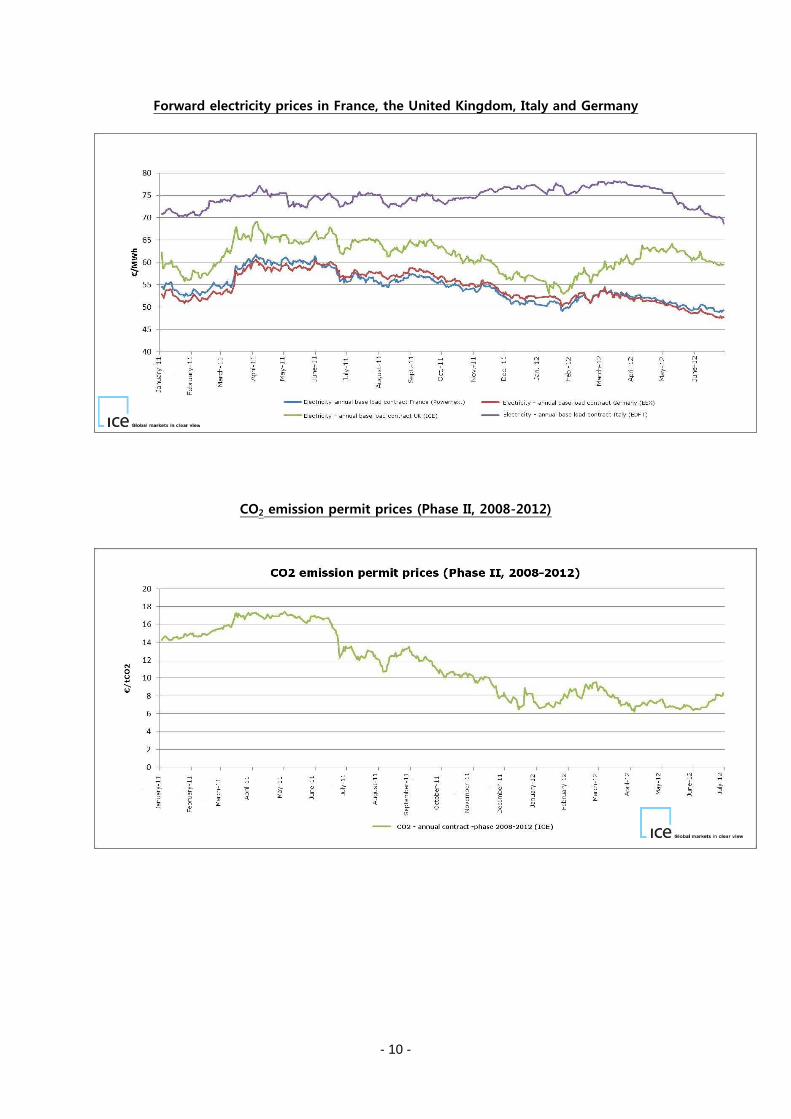
2.1.1.3. CO2 emission permit prices 3
The price of CO2 emission permits under Phase II (2008-2012) for delivery in December 2012
stood at an average €7.5/t in the first half of 2012. This was less than half its average first-half
2011 price (€15.9/t). Nonetheless, the price levels observed over the first half of 2012 followed on
coherently from the trends of the second half of 2011.
Despite the wave of cold weather in February, which caused more extensive use of fossil-fired
facilities and therefore a slight upturn in CO2 emission permit prices, the CO2 permit market is still
overallocated because of the various crises that have slowed down industrial activity in Europe
since 2008, and a lack of consideration for the combined effects of European environmental
policies on each other (the emissions permit scheme, development of renewable energies and the
energy efficiency directive). Market actors are awaiting possible measures by the European
Commission to restore balance between supply and demand in Phase III (2013-2020) by reducing
the number of emission permits made available in auctions. A measure of this kind would have an
impact on both Phase III and Phase II emission permit prices, since Phase II emission permits
could be exchanged for Phase III permits or used during Phase III.
3 Average ICE prices for the annual contract, Phase II (2008-2012).
- 10 -
Forward electricity prices in France, the United Kingdom, Italy and Germany
CO2 emission permit prices (Phase II, 2008-2012)
- 11 -
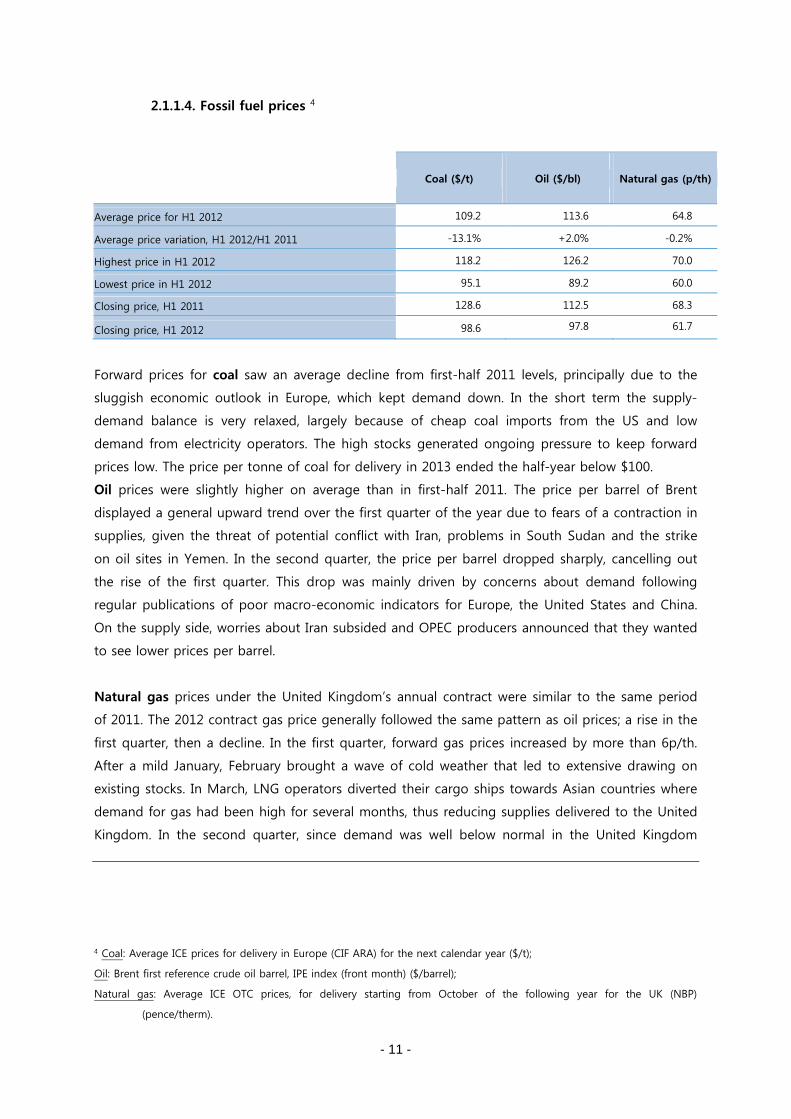
2.1.1.4. Fossil fuel prices 4
Forward prices for coal saw an average decline from first-half 2011 levels, principally due to the
sluggish economic outlook in Europe, which kept demand down. In the short term the supply-
demand balance is very relaxed, largely because of cheap coal imports from the US and low
demand from electricity operators. The high stocks generated ongoing pressure to keep forward
prices low. The price per tonne of coal for delivery in 2013 ended the half-year below $100.
Oil prices were slightly higher on average than in first-half 2011. The price per barrel of Brent
displayed a general upward trend over the first quarter of the year due to fears of a contraction in
supplies, given the threat of potential conflict with Iran, problems in South Sudan and the strike
on oil sites in Yemen. In the second quarter, the price per barrel dropped sharply, cancelling out
the rise of the first quarter. This drop was mainly driven by concerns about demand following
regular publications of poor macro-economic indicators for Europe, the United States and China.
On the supply side, worries about Iran subsided and OPEC producers announced that they wanted
to see lower prices per barrel.
Natural gas prices under the United Kingdom’s annual contract were similar to the same period
of 2011. The 2012 contract gas price generally followed the same pattern as oil prices; a rise in the
first quarter, then a decline. In the first quarter, forward gas prices increased by more than 6p/th.
After a mild January, February brought a wave of cold weather that led to extensive drawing on
existing stocks. In March, LNG operators diverted their cargo ships towards Asian countries where
demand for gas had been high for several months, thus reducing supplies delivered to the United
Kingdom. In the second quarter, since demand was well below normal in the United Kingdom
4 Coal: Average ICE prices for delivery in Europe (CIF ARA) for the next calendar year ($/t);
Oil: Brent first reference crude oil barrel, IPE index (front month) ($/barrel);
Natural gas: Average ICE OTC prices, for delivery starting from October of the following year for the UK (NBP)
(pence/therm).
Coal ($/t) Oil ($/bl) Natural gas (p/th)
Average price for H1 2012 109.2 113.6 64.8
Average price variation, H1 2012/H1 2011 -13.1% +2.0% -0.2%
Highest price in H1 2012 118.2 126.2 70.0
Lowest price in H1 2012 95.1 89.2 60.0
Closing price, H1 2011 128.6 112.5 68.3
Closing price, H1 2012 98.6 97.8 61.7
- 12 -
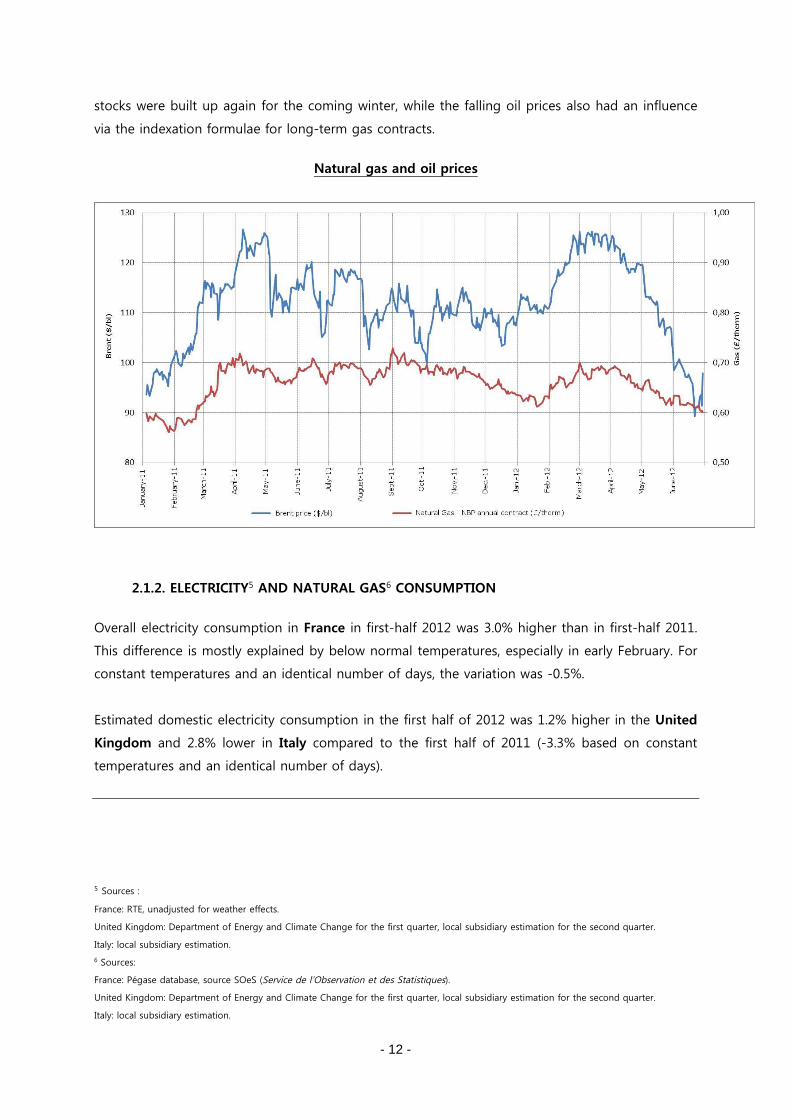
stocks were built up again for the coming winter, while the falling oil prices also had an influence
via the indexation formulae for long-term gas contracts.
Natural gas and oil prices
2.1.2. ELECTRICITY5 AND NATURAL GAS6 CONSUMPTION
Overall electricity consumption in France in first-half 2012 was 3.0% higher than in first-half 2011.
This difference is mostly explained by below normal temperatures, especially in early February. For
constant temperatures and an identical number of days, the variation was -0.5%.
Estimated domestic electricity consumption in the first half of 2012 was 1.2% higher in the United
Kingdom and 2.8% lower in Italy compared to the first half of 2011 (-3.3% based on constant
temperatures and an identical number of days).
5 Sources :
France: RTE, unadjusted for weather effects.
United Kingdom: Department of Energy and Climate Change for the first quarter, local subsidiary estimation for the second quarter.
Italy: local subsidiary estimation.
6 Sources:
France: Pégase database, source SOeS (Service de l’Observation et des Statistiques).
United Kingdom: Department of Energy and Climate Change for the first quarter, local subsidiary estimation for the second quarter.
Italy: local subsidiary estimation.
- 13 -
Natural gas consumption in France rose by 9% in first-half 2012 compared to first-half 2011.
Much of this rise is attributable to weather effects, especially the low temperatures of February
and April.
Estimated domestic natural gas consumption was up by 5.2% in the United Kingdom and down
by 2.3% in Italy.
2.1.3. ELECTRICITY AND NATURAL GAS SALES TARIFFS
In France, the Minister for Ecology, Sustainable Development and Energy issued a decision on 20
July 2012 raising regulated electricity sale tariffs by 2.0% for the “blue” tariff (for residential
customers) and the “yellow” and “green” tariffs (for industrial and large business customers). This
rise took effect on 23 July 2012.
In application of current laws and regulations, these tariffs must at least cover the costs incurred
by historical operators, which the French market regulator CRE considers as accounting costs.
After discussion of the proposal for the above decision on 19 July 2012, the CRE issued the
following opinions:
- It was in favour of the proposed decision regarding the green tariffs, which covered costs
recorded in 2011 and forecast for 2012;
- It was not in favour of the proposal for the yellow tariffs, as although costs recorded in
2011 were covered, forecast costs for 2012 were not;
- It was not in favour of the proposal for the blue tariffs, which covered neither costs
recorded in 2011 nor forecast costs for 2012.
In the United Kingdom, EDF Energy reduced its gas tariffs for residential customers by -5% on 7
February 2012. The previous year, it had raised its electricity and gas tariffs by 7.5% and 6.5%
respectively on 2 March 2011, then by 4.5% and 15.4% respectively on 10 November 2011.

- 14 -
2.1.4. WEATHER CONDITIONS
2.1.4.1. Temperatures
Average temperatures: variance from normal levels, January to June 20127
After a mostly mild, dry month of January, there was a wave of cold weather in the first fortnight
of February with temperatures 4.6°C lower than normal across the whole month. A warm March
followed, then the second quarter was close to normal. Temperatures over the half-year as a
whole were ultimately close to normal in France but markedly higher than normal in Scandinavia
and Northern Europe.
7 Map comparing average temperatures with normal levels between January and June 2012.
Normal temperatures are measured over 30 years (1971-2000 for Western Europe and 1961-1990 for Eastern Europe).
Source: Base de Données Climatologiques, Météo France.
- 15 -
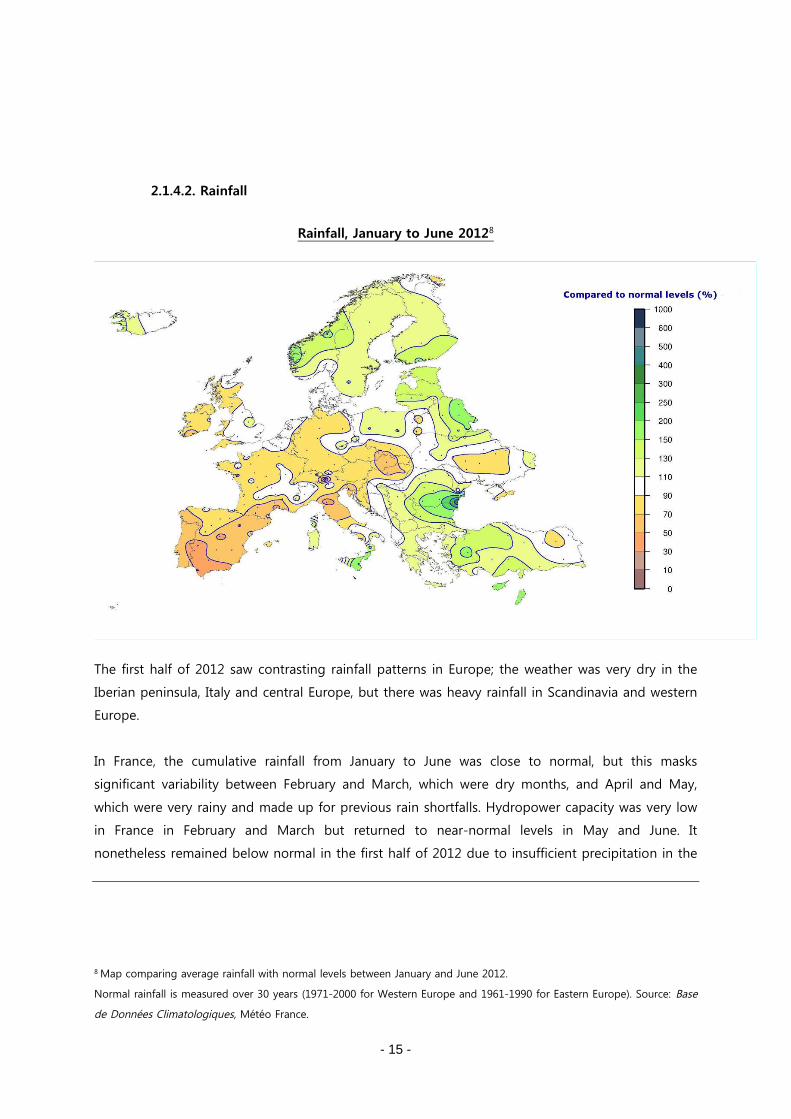
2.1.4.2. Rainfall
Rainfall, January to June 20128
The first half of 2012 saw contrasting rainfall patterns in Europe; the weather was very dry in the
Iberian peninsula, Italy and central Europe, but there was heavy rainfall in Scandinavia and western
Europe.
In France, the cumulative rainfall from January to June was close to normal, but this masks
significant variability between February and March, which were dry months, and April and May,
which were very rainy and made up for previous rain shortfalls. Hydropower capacity was very low
in France in February and March but returned to near-normal levels in May and June. It
nonetheless remained below normal in the first half of 2012 due to insufficient precipitation in the
8 Map comparing average rainfall with normal levels between January and June 2012.
Normal rainfall is measured over 30 years (1971-2000 for Western Europe and 1961-1990 for Eastern Europe). Source: Base
de Données Climatologiques, Météo France.
- 16 -
south of France (particularly the Pyrenees and the southern Alps), where many hydropower
facilities are located.
2.2. SIGNIFICANT EVENTS9/10
2.2.1. NEW INVESTMENTS
2.2.1.1. Finalisation of the takeover of Edison
Following fulfilment of the conditions for the operation, on 24 May 2012 the EDF group and its
Italian partners finalised the takeover of the energy group Edison. The principles of the final
agreement are consistent with the preliminary agreement signed by the parties on 26 December
2011.
The Group thus took control of Edison by purchasing Delmi’s entire investment in Transalpina di
Energia - TdE (50%) for a total of €784 million, corresponding to the negotiated price of €0.89 per
Edison share.
Following this acquisition the Group now holds 78.96% of the capital and 80.7% of the voting
rights in Edison.
At the same time as the takeover of Edison, Delmi, as planned in the initial agreement, acquired
Edison’s 50% stake in Edipower for €684 million and Alpiq’s 20% stake in Edipower for
€200 million. This operation, together with reimbursements of shareholder loans, improved
Edison’s liquidity position and reduced its net indebtedness.
Once the CONSOB gave its authorisation on 27 June 2012, EDF launched a mandatory tender offer
on 2 July 2012 for the ordinary Edison shares not owned by EDF, i.e. 19.36% of ordinary Edison
shares, at the price of €0.89 per share. Unless extended, this offer will close on 3 August 2012.
2.2.1.2. Takeover of Photowatt’s business and PV Alliance
On 27 February 2012, the Vienna Commercial Court in France accepted the EDF group’s offer for
the activities of Photowatt. This operation and the concurrent operation involving the CEA (French
atomic energy commission), will enable the Group, via its subsidiary EDF Energies Nouvelles
Réparties, to take over Photowatt’s assets and 100% of its subsidiary PV Alliance, and to obtain a
world exclusivity licence for the heterojunction technology currently in development.
9 Significant events related to litigation are described in chapter 8.
10 The reference document and a full list of press releases are available from the EDF website: www.edf.com.
- 17 -
As part of this operation the Group has offered a job at EDF SA or ERDF to every employee not
retained in the new entity.
2.2.1.3 Acquisition of Enerest
On 1 April 2012, Electricité de Strasbourg acquired 100% of Enerest, the longstanding gas supplier
to the economic region of Strasbourg. The acquisition price was €139 million. Following
establishment of a provisional initial balance sheet, intangible assets (principally concerning
customer relations and the “Gaz de Strasbourg” brand) were valued at €38 million before tax
effects. The provisional goodwill on this operation recorded in the consolidated financial
statements at 30 June 2012 amounts to €90 million.
2.2.2. INVESTMENT PROJECTS
2.2.2.1. Flamanville 3
The first half of 2012 was marked by detection of faults in the polar crane support brackets for the
reactor building. After analysis, EDF decided to replace these brackets, which fix the reactor
building’s polar crane to the interior of the building structure.
Some of the work has been adapted to incorporate these changes, and the rest is continuing in
line with schedule:
construction of the north diesel building
installation of the brackets for steam generators and primary pumps in the reactor
building
completion of principal civil engineering work for the four safeguard buildings
start of installation of the filter drums for the pumping station to filter cooling water.
By the end of June, civil engineering work was 92% complete and electromechanical assembly was
30% complete.
2.2.2.2. Successful bid for French offshore wind farms
On 6 April 2012, the European consortium headed by the EDF group won the tender for French
offshore projects at Saint-Nazaire, Courseulles-sur-Mer and Fécamp. These projects total around
1,500 MW in new capacities to be installed after 2015. They are accompanied by an ambitious
industrial project that will create some 7,500 direct and indirect jobs, notably for production of
Alstom’s Haliade 150 wind turbine in France.
2.2.2.3. EDF Energies Nouvelles gains positions on the Moroccan and South African
markets
On 16 April 2012, the consortium headed by EDF Energies Nouvelles, in partnership with the
Japanese group Mitsui & Co, was selected as the “preferred bidder” for the 150 MW Taza wind
- 18 -
power project by Morocco’s National Electricity Office. EDF Energies Nouvelles also announced
that it was to form a local subsidiary, EDF EN Maroc, to lead its development in Morocco.
On 30 May 2012, EDF Energies Nouvelles was also named the “preferred bidder” by the South
African energy department for three wind power projects allocated as part of the second round of
renewable energy tenders in South Africa, which was launched in August 2011. Representing total
power of 104 MW, the projects at Chaba (20.6 MW), Waainek (23.3 MW) and Grassridge (59.8
MW) are located in the Eastern Cape province of South Africa. They will be equipped with Vesta
turbines, each with 3 MW unit capacity. Construction is due to start in 2013, with commissioning
by the end of 2014.
2.2.2.4. Launch of Electranova Capital
On 15 May 2012, EDF announced that it had joined forces with Idinvest Partners, a reputed
specialist in small business funding, to create a venture capital fund called Electranova Capital,
endowed with a minimum investment capacity of €60 million, including €30 million contributed by
EDF and €10 million by Allianz. The fund will finance innovative young companies in the energy
sector, in France and throughout Europe, by taking minority shareholdings in order to rise to the
challenge of a low-carbon energy model.
2.2.2.5. Installation of the EPR Unit 1 reactor pressure vessel at Taishan
Construction of the EPR at Taishan in China, coordinated by teams from EDF, CGNPC (China
Guangdong Nuclear Power Company) and Areva, reached a further key milestone in early June
2012 when the pressure vessel was lowered into the Unit 1 reactor, then installed in its final
position in the reactor pit. This operation marked the start of work to install the nuclear steam
supply system, alongside installation of auxiliary equipment and systems.
2.2.2.6. New nuclear power plant at Hinkley Point C
On 19 June 2012 the joint venture Bouygues TP/Laing O’Rourke was designated “preferred bidder”
for the contract to construct a nuclear power plant in the United Kingdom. This contract is worth
around £2 billion and should create 4,000 jobs. This project is subject to EDF Energy’s final
investment decision in late 2012, and will concern the major civil engineering work for the nuclear
island, the conventional island and supporting structures.
- 19 -
2.2.2.7. Extension of AGR11 reactor lifetimes in the United Kingdom
In the United Kingdom, EDF Energy intends to extend the average operating lifetime of all its AGR
reactors by 7 years. These reactors are spread across 7 sites (2 reactors at each site). This decision
has a direct impact on the depreciation period of these reactors.
2.2.2.8. Compliance with ASN recommendations concerning the nuclear fleet
Following the recommendations put forward by the French nuclear safety authority ASN on 28
June 2012 as part of its additional safety assessments, EDF confirms its commitment to carrying
out work to reinforce the safety level at its nuclear facilities. This work on its nuclear fleet is part of
the Group’s overall investment programme for the period to 2015.
EDF has already begun an action plan in accordance with the ASN’s technical recommendations,
including for example:
Introduction by the end of 2012 of the rapid response nuclear task force (“Force d’Action
Rapide du Nucléaire”) capable of intervening in an emergency at any nuclear reactor in
France
Development of local crisis centres to manage extreme events
The tender process for production of emergency diesel generators.
2.2.3 ACCREDITATIONS
2.2.3.1. New accreditation for EDF: the FTSE4Good Index
On 12 March 2012, following an in-depth independent analysis and examination of social,
environmental and nuclear safety criteria, the FTSE4Good Policy Committee approved the EDF
group’s admission to the prestigious FTSE4Good index. EDF is now one of five nuclear operators
worldwide that meet the stringent criteria developed and monitored by the FTSE4Good Policy
Committee. These criteria are designed to identify and measure the performance of companies
that work for sustainable environmental protection, develop positive relations with all stakeholders
and strive to promote human rights and their enforcement.
2.2.3.2. Two distinctions for the Group’s expertise in training
The EDF Corporate University for Management, which caters for the Group’s 12,000 managers, has
won the 13th Corporate University Xchange Prize for Excellence and Innovation, a global
benchmark in terms of corporate learning. This distinction was awarded for a training programme
11 Advanced gas-cooled reactors.
- 20 -
carried out with the Toulouse School of Economics’ Institute of Industrial Economics for the
leaders of ERDF, a subsidiary of the EDF Group. The programme focused on the economics of
local concession mechanisms in the electricity distribution industry.
A few weeks earlier, the Group’s training expertise had already received the international
Corporate Learning Improvement Process accreditation.
2.2.4. REGULATORY ENVIRONMENT
2.2.4.1. France
2.2.4.1.1. The NOME law and the ARENH system
On 12 June 2012, the European Commission announced that subject to conditions, it approved
the State aid contained in the regulated electricity tariffs in France. In 2007, the Commission had
opened an investigation into the regulated tariffs for sales to business customers (the “yellow” and
“green” tariffs and the TaRTAM transition tariff). Since then, France’s NOME law on the new
electricity market organisation modified the French legislative and regulatory context by
discontinuing the TaRTAM transition tariff, programming the end of the yellow and green tariffs
for the end of 2015 and setting up a scheme for regulated access to nuclear power (named
ARENH, for Accès Régulé à l’Electricité Nucléaire Historique) for all suppliers of customers located
in France from 1 July 2011, at the price of €42/MWh for 2012.
Every half-year, suppliers apply for volumes of energy for future periods under the ARENH system.
In the first three rounds, supplier applications amounted to more than 30 TWh each half-year. The
annual ARENH volume cannot exceed 100 TWh a year; this will be increased from August 2013 by
the amounts sold to network operators to compensate for technical losses.
Following an inquiry, the European Commission concluded that the business tariffs constituted
State aid, but are nevertheless compatible with European law provided:
- the ARENH price remains at €42/MWh until the Commission gives approval of the methodology
used to set the ARENH price, and
- there is a gradual move towards cost-based pricing every year from the summer of 2012, until
the yellow and green tariffs cease to exist at the end of 2015.
This decision marks the end of the European Commission’s investigation concerning State aid.
2.2.4.1.2. CSPE
The Contribution to the Public Electricity Service (Contribution aux charges de Service Public de
l’Électricité or CSPE) is intended to compensate for certain public service charges assigned to EDF
- 21 -
in particular12. This tax is collected directly from the final customer and applies to electricity
consumption. The amended Finance Law of July 2011 departed from the schedule for CSPE rises,
splitting the €3/MWh increase for 1 January 2012 so that it applied half from 31 July 2011 and
half from 1 July 2012. A €1.5/MWh rise was thus introduced on 1 July 2012, bringing the CSPE to
€10.5/MWh.
Since 2007, CSPE income has been unable to cover EDF’s public electricity service expenses, which
have been steadily rising, primarily due to the higher volumes of wind power and solar power
purchased under the purchase obligation scheme. As the costs borne by LDCs and Electricité de
Mayotte are fully compensated, the shortfall is borne solely by EDF, leading to recognition of a
€4.5 billion receivable in its financial statements at 30 June 2012. By the end of 2012 this
receivable could be close to €5 billion.
EDF has expressly requested recognition of the cost of bearing this deficit from the outset, as well
as the costs of managing the purchase obligations scheme, which are not covered by the current
CSPE system. EDF has therefore included these items in its 2011 declaration of public service
expenses to the French regulator CRE.
In June 2012, the French Court of Accounts remitted a report on the CSPE to the Senate
investigative committee examining the true cost of electricity. The Court observed the current and
future increase in public service expenses. It noted that the expenses borne by EDF (cost of
bearing the shortfall and managing purchase obligations) are not covered by the system and
acknowledged that the request for formal recognition of these costs “was not economically
unfounded”. It identified areas for reflection to limit the impact of future rises in the CSPE for
electricity consumers: for example, broadening financing of the system to other energies, use of
other sources of electricity-generated income, and revision of the current exemption rules.
The decree of 6 March 2012 introduced automatic attribution of social electricity tariffs.
Approximately 1.3 million French households are eligible for social tariffs but only 600,000
households benefited from those tariffs in 2011.
2.2.4.1.3. Application decree for article 225 of the “Grenelle 2” law
The French government published the application decree for article 225 of the “Grenelle 2” law on
26 April 2012, making reporting of labour, environmental and social reporting in the management
report mandatory for companies with a workforce of over 500 and a balance sheet total or total
12 French Local Distribution Companies (LDCs) and Electricité de Mayotte also make a small contribution.
- 22 -
net sales of more than €100 million. This non-financial reporting must be audited by an
independent organisation.
The EDF group has assessed the impact of this decree for its own organisation but also for the
French subsidiaries concerned (Electricité de Strasbourg and ERDF). This assessment complements
the assessments carried out in 2011 that have been verified by the statutory auditors, who are the
Group’s chosen independent organisation. It enabled the Group to check the compliance of its
existing system, set up several years ago, and make any necessary improvements.
2.2.4.2. Belgium
The Belgian government brought in a new energy market regulation through the law of 29 March
2012, freezing indexed rises in variable parameters contained in gas and electricity contracts for 9
months from 1 April 2012. This regulation affects EDF Luminus in 2012, particularly in the second
half-year.
On 4 July 2012, the government decided to shut down the Doel1 and Doel2 nuclear plants (which
are not operated by EDF) in 2015, and to extend operation of the Tihange 1 plant until 2025,
under the plan for secure electricity supplies presented by the Belgian Secretary of State for
Energy Melchior Wathelet. The Belgian Council of Ministers also plans to make 1,000 MW of
nuclear power available on the market, to increase competition between suppliers and achieve the
lowest possible prices for consumers and business users.
2.2.4.3. Hungary
An amendment to the law on electricity adopted on 16 March 2011 ended all support for
cogeneration in Hungary from July 2011, and stipulated that heat tariffs would now be regulated.
The price must now be set by the Hungarian government after proposal by the regulator, and is
no longer freely negotiated between suppliers and their customers. This amendment particularly
affects BE ZRt.
After a transitional period in the final quarter of 2011, new more favourable heat tariffs were
published from 1 January 2012. These tariffs are sufficient to cover the associated costs.
Discussions are in process between BE ZRt and the regulator on how these costs will be covered
for next winter.
2.2.4.4. United Kingdom
On 22 May 2012, British minister for Energy and Climate Change, Ed Davey, presented a draft bill
for a law on electricity market reform intended to attract around £110 billion (€136 billion) of
investments in nuclear power and renewable energies over ten years. The chief innovation in this
reform is the introduction of “contracts for difference” (CFD), a contractual mechanism that would
guarantee an economic balance between new low-carbon electricity generation methods,
- 23 -
comprising renewable energies (wind power, solar power, biomass, etc) and nuclear power plants.
Under this type of contract, EDF would be compensated for selling electricity generated by the
new reactors below an agreed price, and conversely would pay the surplus if it sold electricity at a
higher price.
This reform is expected to become law in 2012.
2.2.5. GOVERNANCE
2.2.5.1. Board of directors
By a decree of 13 February 2012, François Loos, Chairman of the French Environment and Energy
Management Agency (ADEME – Agence de l’Environnement et de la Maîtrise de l’Energie) was
appointed as a director of EDF representing the French State, replacing Philippe Van de Maele.
By a decree of 7 May 2012, Marie-Christine Lepetit, Head of the General Inspectorate of Finances,
was appointed a member of EDF’s Board of directors, replacing Pierre-Marie Abadie. At the Board
of Directors’ meeting held on 24 May 2012, Mme Lepetit was made a member of the Strategy
Committee, the Nuclear Commitments monitoring committee and the Ethics Committee.
There are now 4 women among the 18 members of the Board of Directors, or 22% for all
categories of director.
Pierre-Marie Abadie, Director of Energy at the General division for Energy and Climate for the
French Minister of Ecology, Sustainable development and energy, was appointed Government
commissioner to EDF by decision of 15 June 2012.
- 24 -
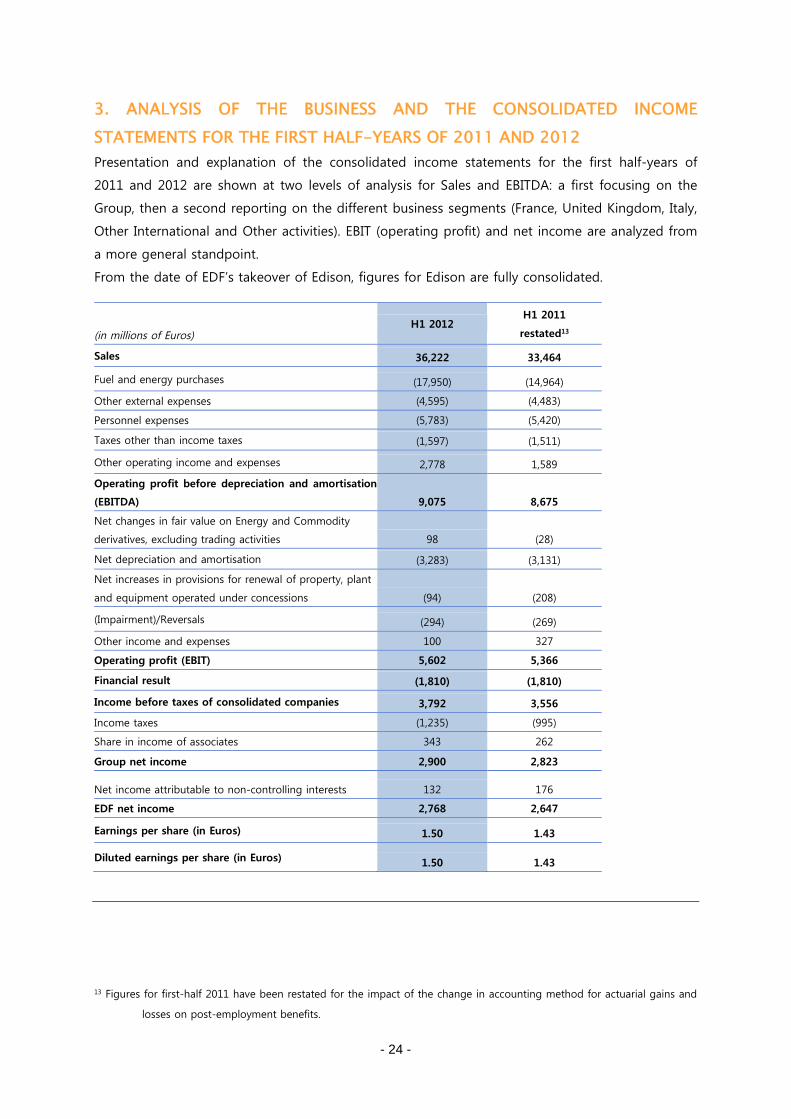
3. ANALYSIS OF THE BUSINESS AND THE CONSOLIDATED INCOME
STATEMENTS FOR THE FIRST HALF-YEARS OF 2011 AND 2012
Presentation and explanation of the consolidated income statements for the first half-years of
2011 and 2012 are shown at two levels of analysis for Sales and EBITDA: a first focusing on the
Group, then a second reporting on the different business segments (France, United Kingdom, Italy,
Other International and Other activities). EBIT (operating profit) and net income are analyzed from
a more general standpoint.
From the date of EDF’s takeover of Edison, figures for Edison are fully consolidated.
(in millions of Euros)H1 2012
H1 2011
restated13
Sales 36,222 33,464
Fuel and energy purchases (17,950) (14,964)
Other external expenses (4,595) (4,483)
Personnel expenses (5,783) (5,420)
Taxes other than income taxes (1,597) (1,511)
Other operating income and expenses 2,778 1,589
Operating profit before depreciation and amortisation
(EBITDA) 9,075 8,675
Net changes in fair value on Energy and Commodity
derivatives, excluding trading activities 98 (28)
Net depreciation and amortisation (3,283) (3,131)
Net increases in provisions for renewal of property, plant
and equipment operated under concessions (94) (208)
(Impairment)/Reversals (294) (269)
Other income and expenses 100 327
Operating profit (EBIT) 5,602 5,366
Financial result (1,810) (1,810)
Income before taxes of consolidated companies 3,792 3,556
Income taxes (1,235) (995)
Share in income of associates 343 262
Group net income 2,900 2,823
Net income attributable to non-controlling interests 132 176
EDF net income 2,768 2,647
Earnings per share (in Euros) 1.50 1.43
Diluted earnings per share (in Euros) 1.50 1.43
13 Figures for first-half 2011 have been restated for the impact of the change in accounting method for actuarial gains and
losses on post-employment benefits.
- 25 -
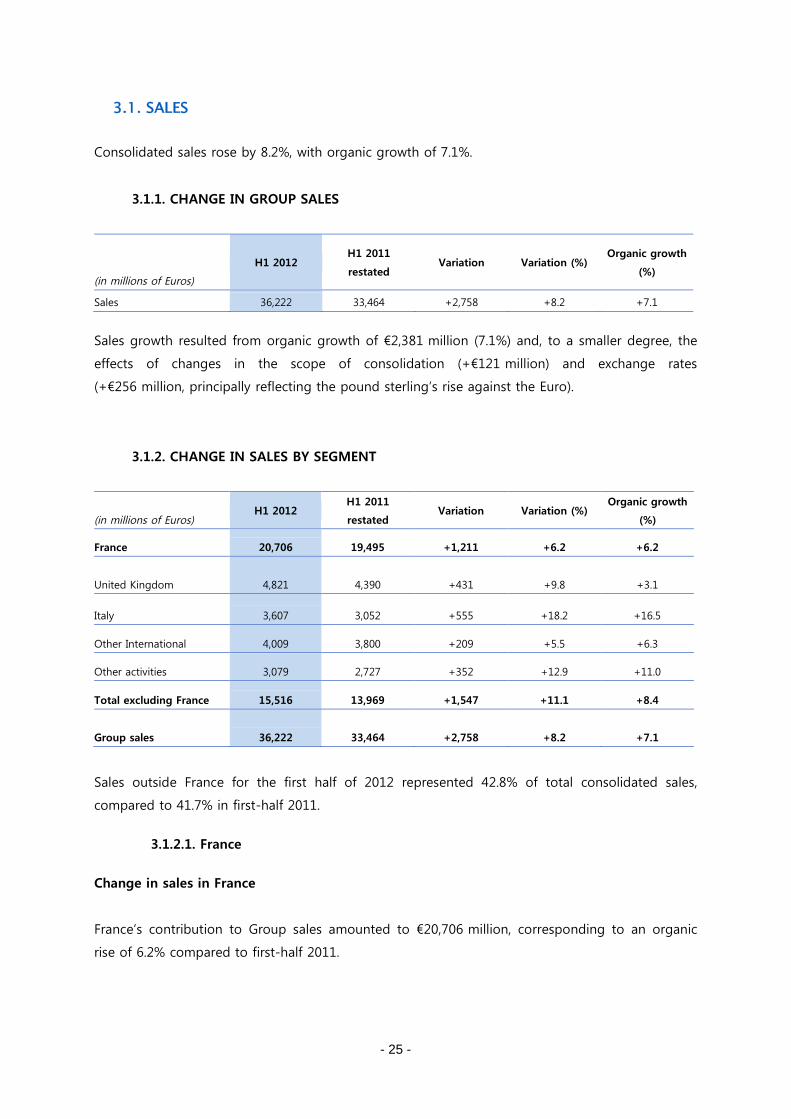
3.1. SALES
Consolidated sales rose by 8.2%, with organic growth of 7.1%.
3.1.1. CHANGE IN GROUP SALES
(in millions of Euros)
H1 2012H1 2011
restatedVariation Variation (%)
Organic growth
(%)
Sales 36,222 33,464 +2,758 +8.2 +7.1
Sales growth resulted from organic growth of €2,381 million (7.1%) and, to a smaller degree, the
effects of changes in the scope of consolidation (+€121 million) and exchange rates
(+€256 million, principally reflecting the pound sterling’s rise against the Euro).
3.1.2. CHANGE IN SALES BY SEGMENT
(in millions of Euros)H1 2012
H1 2011
restatedVariation Variation (%)
Organic growth
(%)
France 20,706 19,495 +1,211 +6.2 +6.2
United Kingdom 4,821 4,390 +431 +9.8 +3.1
Italy 3,607 3,052 +555 +18.2 +16.5
Other International 4,009 3,800 +209 +5.5 +6.3
Other activities 3,079 2,727 +352 +12.9 +11.0
Total excluding France 15,516 13,969 +1,547 +11.1 +8.4
Group sales 36,222 33,464 +2,758 +8.2 +7.1
Sales outside France for the first half of 2012 represented 42.8% of total consolidated sales,
compared to 41.7% in first-half 2011.
3.1.2.1. France
Change in sales in France
France’s contribution to Group sales amounted to €20,706 million, corresponding to an organic
rise of 6.2% compared to first-half 2011.
- 26 -
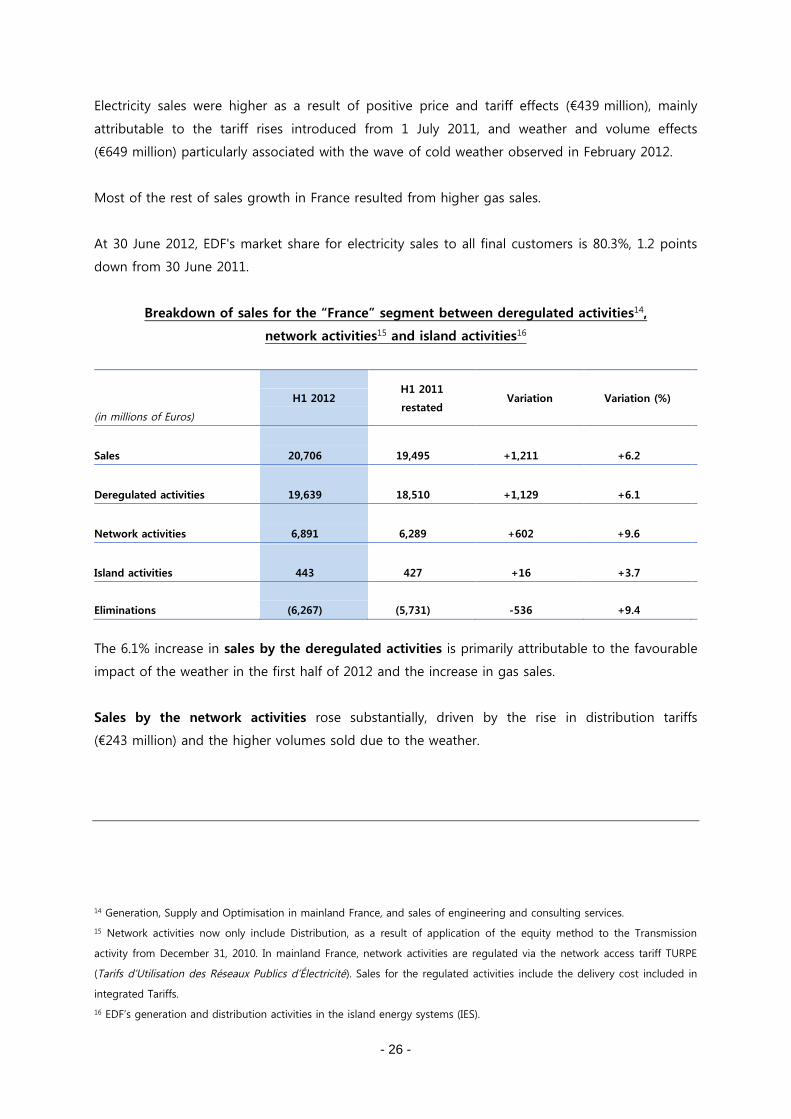
Electricity sales were higher as a result of positive price and tariff effects (€439 million), mainly
attributable to the tariff rises introduced from 1 July 2011, and weather and volume effects
(€649 million) particularly associated with the wave of cold weather observed in February 2012.
Most of the rest of sales growth in France resulted from higher gas sales.
At 30 June 2012, EDF's market share for electricity sales to all final customers is 80.3%, 1.2 points
down from 30 June 2011.
Breakdown of sales for the “France” segment between deregulated activities14,
network activities15 and island activities16
(in millions of Euros)
H1 2012H1 2011
restatedVariation Variation (%)
Sales 20,706 19,495 +1,211 +6.2
Deregulated activities 19,639 18,510 +1,129 +6.1
Network activities 6,891 6,289 +602 +9.6
Island activities 443 427 +16 +3.7
Eliminations (6,267) (5,731) -536 +9.4
The 6.1% increase in sales by the deregulated activities is primarily attributable to the favourable
impact of the weather in the first half of 2012 and the increase in gas sales.
Sales by the network activities rose substantially, driven by the rise in distribution tariffs
(€243 million) and the higher volumes sold due to the weather.
14 Generation, Supply and Optimisation in mainland France, and sales of engineering and consulting services.
15 Network activities now only include Distribution, as a result of application of the equity method to the Transmission
activity from December 31, 2010. In mainland France, network activities are regulated via the network access tariff TURPE
(Tarifs d’Utilisation des Réseaux Publics d’Électricité). Sales for the regulated activities include the delivery cost included in
integrated Tariffs.
16 EDF’s generation and distribution activities in the island energy systems (IES).
- 27 -
Electricity generation
Nuclear generation produced 207.8 TWh in the first half of 2012, compared to 218.4 TWh for the
first half of 2011. This contraction of more than 10 TWh is explained by the much busier shutdown
schedule than in first-half 2011 and a higher number of unscheduled outages, whereas fleet
availability was exceptionally good in the first half of 2011.
Hydropower output stood at 20.0 TWh, an improvement from first-half 2011 (+5.9 TWh) when
water availability levels were particularly low.
Fossil-fired generation produced 7.0 TWh, up by +1.0 TWh from first-half 2011.
Sales volumes to final customers, including Eurodif and local distribution firms, were up by
+6.0 TWh. The temperature differential alone explains +7.9 TWh of the increase. In addition, losses
of customers, mainly at the high end of the portfolio17, and the reduction in Eurodif supplies were
not offset by the growth in demand.
Compared to first-half 2011, the net volumes sold on the wholesale markets declined by
30.1 TWh, principally as a result of sales to the ARENH system in the first half of 2012 (30.2 TWh),
which had no equivalent in first-half 2011. Excluding VPP auctions18, EDF was a net buyer of
17.2 TWh on the markets in the first half of 2012. Deliveries under VPP auctions (16.6 TWh)
showed a downturn compared to first-half 2011 since the system was terminated in 2011.
3.1.2.2. United Kingdom
Sales in the United Kingdom amounted to €4,821 million in first-half 2012, up by 9.8% from first-
half 2011 with organic growth of 3.1%. The favourable exchange effect (+€295 million) relates to
the rise of the pound sterling against the Euro.
The benefit of favourable price effects driven by rising wholesale prices was felt in all segments.
UK sales also incorporate unfavourable volume effects resulting from lower sales to business
customers against aggressive competition. This downturn was partly counterbalanced by a rise in
17 Very large business and industrial customers.
18 Virtual Power Plant capacity auction system – generating deliveries for periods ranging from a few months to 3 years.
- 28 -
volumes sold to residential customers, especially due to growth in the number of customer
accounts thanks to EDF Energy’s competitive offer19.
3.1.2.3. Italy
Italy20 contributed €3,607 million to consolidated sales, up by 18.2% with organic growth of
16.5%.
Sales by Edison rose by €556 million or +19.9% (organic growth of €510 million or +18.2%),
essentially due to changes in commodity prices. Edison sales include a positive €46 million scope
effect reflecting the change to full consolidation from 1 June 2012, the sale of Edipower in 2012
and the sale of the Taranto power plant in October 2011.
In the electricity business, sales benefited from an increase in electricity prices that was partly
counterbalanced by a negative volume effect for sales to end-customers and on the wholesale
markets.
In the hydrocarbon business, sales registered a strong rise as a result of commodity price rises and
higher generation volumes in Exploration-Production due to commissioning of new facilities
during 2011.
3.1.2.4. Other International
The Other International segment principally covers operations in Europe excluding the United
Kingdom and Italy, and operations in the United States, Brazil and Asia (China, Vietnam and Laos).
This segment contributed €4,009 million to Group sales in the first half of 2012, €209 million or
+5.5% more than in first-half 2011.
Foreign exchange effects between the first half-years of 2011 and 2012 amounted to -€40 million.
The effect of changes in the scope of consolidation in this segment essentially reflects changes in
the consolidation method for the Polish subsidiaries Zielona Gora and Kogeneracja21.
19 EDF Energy was the cheapest supplier on the British market for combined electricity and gas contracts (Direct Debit
contracts).
20 Edison group and Fenice.
21 From proportional consolidation to full consolidation on 16 February 2012 as part of the acquisition of EnBW’s
investments in these companies.
- 29 -
Without these scope and exchange effects, sales would show organic growth of 6.3% from first-
half 2011.
Most of this increase concerns Belgium, and to a smaller extent Austria.
In Belgium, sales amounted to €1,935 million, registering organic growth of +9.9%. This growth
chiefly results from the rise in sales related to gas optimisation, and had no significant impact on
the margin. It also reflects a rise in gas volumes sold to residential customers, associated with
weather effects.
In Austria, sales stood at €305 million, registering very substantial organic growth of +56.4%,
essentially explained by development in the optimisation business. This had no significant impact
on the margin.
3.1.2.5. Other activities
Other activities comprise, among other entities, EDF Energies Nouvelles, EDF Trading, Electricité
de Strasbourg and the investment in Dalkia.
The contribution by the Other activities segment to Group sales in first-half 2012 was €3,079
million, up by €352 million or +12.9%, with organic growth of 11.0% compared to first-half 2011.
EDF Energies Nouvelles’ contribution to Group sales showed organic growth of 41.6% from first-
half 2011. This growth resulted primarily from expanding business in the Development-Sales of
Structured Assets activity. It was also driven by higher Generation activity as capacities in
operation increased; the effect was divided equally between Europe and North America.
EDF Trading22 sales saw an organic decline from first-half 2011 (-8.0%), despite a good trading
performance in Europe.
Dalkia’s contribution to sales registered organic growth of €38 million (+3.2%).
22 EDF Trading sales consist of trading margins.
- 30 -
3.2. EBITDA
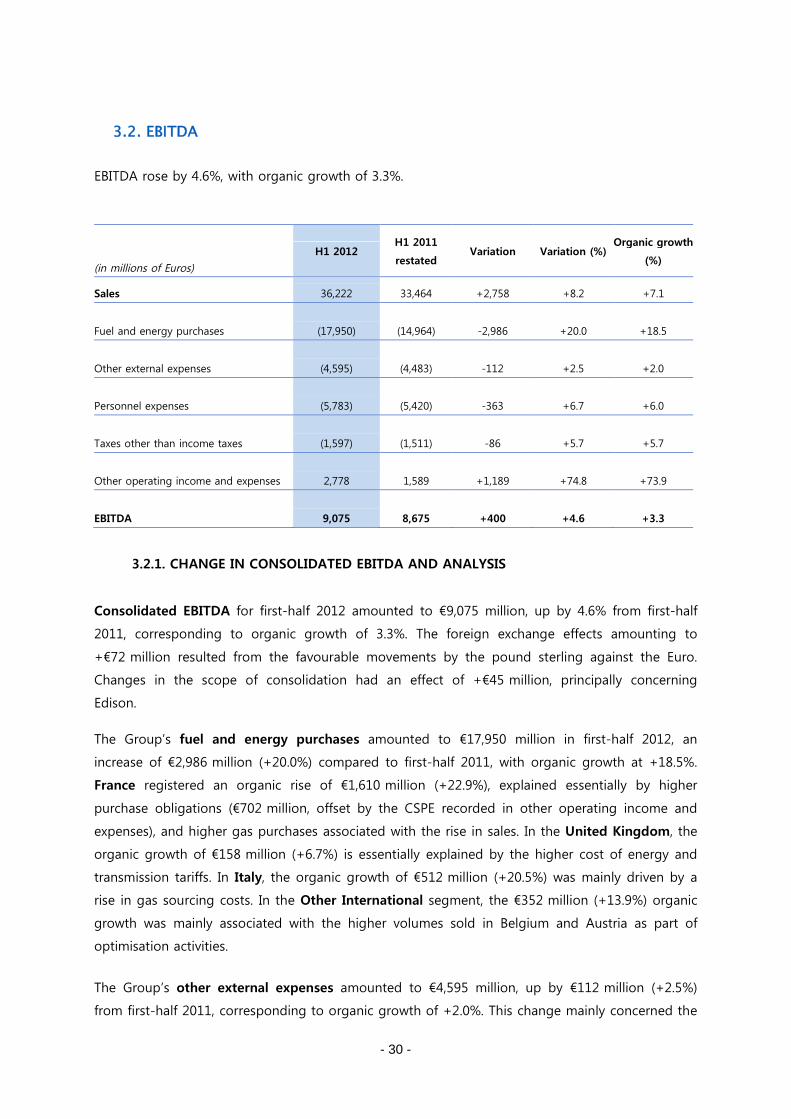
EBITDA rose by 4.6%, with organic growth of 3.3%.
(in millions of Euros)
H1 2012H1 2011
restatedVariation Variation (%)
Organic growth
(%)
Sales 36,222 33,464 +2,758 +8.2 +7.1
Fuel and energy purchases (17,950) (14,964) -2,986 +20.0 +18.5
Other external expenses (4,595) (4,483) -112 +2.5 +2.0
Personnel expenses (5,783) (5,420) -363 +6.7 +6.0
Taxes other than income taxes (1,597) (1,511) -86 +5.7 +5.7
Other operating income and expenses 2,778 1,589 +1,189 +74.8 +73.9
EBITDA 9,075 8,675 +400 +4.6 +3.3
3.2.1. CHANGE IN CONSOLIDATED EBITDA AND ANALYSIS
Consolidated EBITDA for first-half 2012 amounted to €9,075 million, up by 4.6% from first-half
2011, corresponding to organic growth of 3.3%. The foreign exchange effects amounting to
+€72 million resulted from the favourable movements by the pound sterling against the Euro.
Changes in the scope of consolidation had an effect of +€45 million, principally concerning
Edison.
The Group’s fuel and energy purchases amounted to €17,950 million in first-half 2012, an
increase of €2,986 million (+20.0%) compared to first-half 2011, with organic growth at +18.5%.
France registered an organic rise of €1,610 million (+22.9%), explained essentially by higher
purchase obligations (€702 million, offset by the CSPE recorded in other operating income and
expenses), and higher gas purchases associated with the rise in sales. In the United Kingdom, the
organic growth of €158 million (+6.7%) is essentially explained by the higher cost of energy and
transmission tariffs. In Italy, the organic growth of €512 million (+20.5%) was mainly driven by a
rise in gas sourcing costs. In the Other International segment, the €352 million (+13.9%) organic
growth was mainly associated with the higher volumes sold in Belgium and Austria as part of
optimisation activities.
The Group’s other external expenses amounted to €4,595 million, up by €112 million (+2.5%)
from first-half 2011, corresponding to organic growth of +2.0%. This change mainly concerned the
- 31 -
Other activities segment, principally EDF Energies Nouvelles (+€114 million), in keeping with the
higher level of sales by the Development-Sale of Structured Assets activity.
The Group’s personnel expenses totalled €5,783 million, €363 million (+6.7%) higher than in first-
half 2011, with organic growth of +6.0%. This change essentially related to France, where
personnel expenses totalled €4,345 million, corresponding to organic growth of +6.6% compared
to first-half 2011 as a result of the increase in the workforce (mainly in nuclear generation and
distribution), the effect of pay measures, and the rise in employer’s social charges (after the basis
for calculating those charges was broadened).
Taxes other than income taxes stood at €1,597 million for first-half 2012, up by €86 million from
the equivalent period of 2011 (+5.7%, with identical organic growth). This rise includes the effect
of higher taxes for the Generation activity in France.
Other operating income and expenses generated net income of €2,778 million for the first half
of 2012, €1,189 million higher than in first-half 2011, or an organic variation of +73.9%. In France,
the change is attributable to the increase in the CSPE (€658 million) associated with the higher
compensation of purchase obligations, and the positive effect of the end of the TaRTAM transition
tariff system in July 2011. In the United Kingdom, other operating income and expenses showed
an organic decline of €82 million due mainly to the unfavourable effect of the fair value
adjustment of electricity sale contracts at the time of EDF’s acquisition of British Energy.
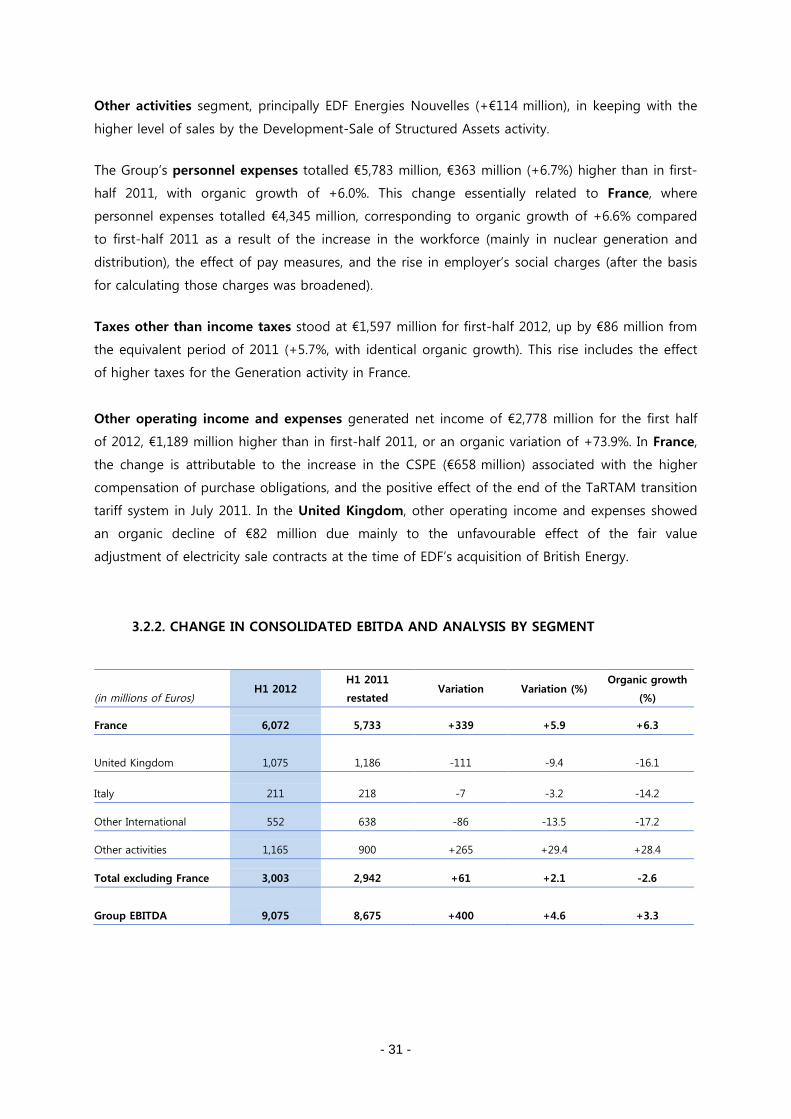
3.2.2. CHANGE IN CONSOLIDATED EBITDA AND ANALYSIS BY SEGMENT
(in millions of Euros)H1 2012
H1 2011
restatedVariation Variation (%)
Organic growth
(%)
France 6,072 5,733 +339 +5.9 +6.3
United Kingdom 1,075 1,186 -111 -9.4 -16.1
Italy 211 218 -7 -3.2 -14.2
Other International 552 638 -86 -13.5 -17.2
Other activities 1,165 900 +265 +29.4 +28.4
Total excluding France 3,003 2,942 +61 +2.1 -2.6
Group EBITDA 9,075 8,675 +400 +4.6 +3.3
- 32 -
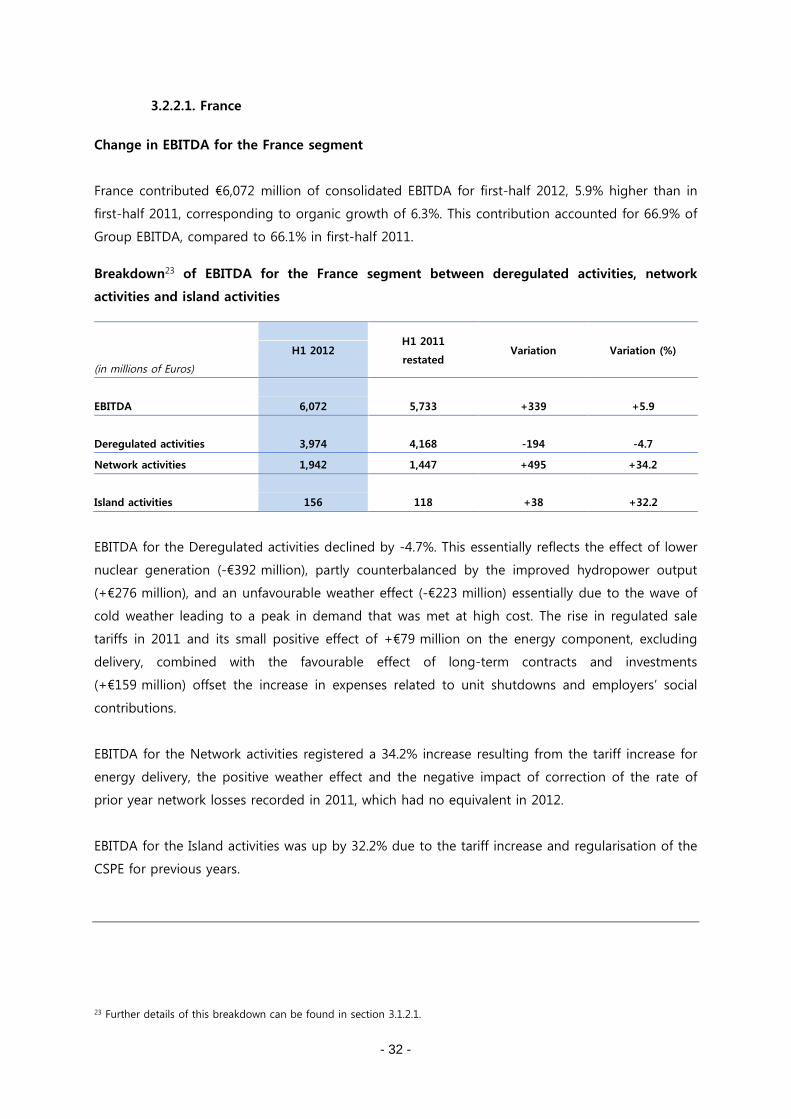
3.2.2.1. France
Change in EBITDA for the France segment
France contributed €6,072 million of consolidated EBITDA for first-half 2012, 5.9% higher than in
first-half 2011, corresponding to organic growth of 6.3%. This contribution accounted for 66.9% of
Group EBITDA, compared to 66.1% in first-half 2011.
Breakdown23 of EBITDA for the France segment between deregulated activities, network
activities and island activities
(in millions of Euros)
H1 2012H1 2011
restatedVariation Variation (%)
EBITDA 6,072 5,733 +339 +5.9
Deregulated activities 3,974 4,168 -194 -4.7
Network activities 1,942 1,447 +495 +34.2
Island activities 156 118 +38 +32.2
EBITDA for the Deregulated activities declined by -4.7%. This essentially reflects the effect of lower
nuclear generation (-€392 million), partly counterbalanced by the improved hydropower output
(+€276 million), and an unfavourable weather effect (-€223 million) essentially due to the wave of
cold weather leading to a peak in demand that was met at high cost. The rise in regulated sale
tariffs in 2011 and its small positive effect of +€79 million on the energy component, excluding
delivery, combined with the favourable effect of long-term contracts and investments
(+€159 million) offset the increase in expenses related to unit shutdowns and employers’ social
contributions.
EBITDA for the Network activities registered a 34.2% increase resulting from the tariff increase for
energy delivery, the positive weather effect and the negative impact of correction of the rate of
prior year network losses recorded in 2011, which had no equivalent in 2012.
EBITDA for the Island activities was up by 32.2% due to the tariff increase and regularisation of the
CSPE for previous years.
23 Further details of this breakdown can be found in section 3.1.2.1.
- 33 -
3.2.2.2. United Kingdom
The United Kingdom’s contribution to Group EBITDA for first-half 2012 was €1,075 million, down
by 9.4% from first-half 2011, with an organic change of -16.1%. The pound sterling’s rise against
the Euro generated a favourable foreign exchange effect amounting to €80 million.
A major factor in the change in EBITDA is the end of the positive effect of fair value adjustment of
British Energy’s initial balance sheet upon acquisition, which had an organic effect of -€100 million
compared to first-half 2011.
Nuclear power output declined by 1.2 TWh between first-half 2011 and first-half 2012 to
29.8 TWh. This lower output had an adverse effect of €57 million on EBITDA, and is mainly
explained by the seasonality of scheduled shutdowns for plant maintenance. More shutdowns
were scheduled in first-half 2012 than first-half 2011.
3.2.2.3. Italy
The Italy segment contributed €211 million to the Group’s consolidated EBITDA, down by 3.2%
(organic decline of -14.2%).
Against persistent pressure from competitors and falling demand in Italy, Edison contributed €161
million to consolidated EBITDA in first-half 2012 against €158 million in first-half 2011,
corresponding to an organic change of -€21 million or -13.3%.
EBITDA for the electricity activities declined, primarily due to shrinking unit margins on the end-
customer market and lower hydropower output than in first-half 2011.
The hydrocarbon activities’ contribution to EBITDA amounted to €46 million, a significant rise from
first-half 2011 thanks to a good performance by Exploration-Production and the favourable effect
of renegotiation of long-term natural gas contracts with Promgas, finalised on 21 July 2011.
Nonetheless, these activities remain strongly affected by the fall in margins on gas sales to end
customers, which resulted from lower demand combined with high availability on spot markets at
European gas hubs, causing decorrelation between spot gas prices and the cost of long-term
contracts. Renegotiations and arbitration procedures have been begun to restore the profitability
of these contracts. Arbitration decisions on supply contracts in Libya with ENI and Qatar with
Rasgas are expected in the second half of 2012.
Fenice’s contribution to consolidated EBITDA registered an organic decline of €11 million between
first-half 2011 and first-half 2012, reflecting a gloomy industrial environment in Italy and Poland.
- 34 -
3.2.2.4. Other International
EBITDA for the Other International segment declined by €86 million or 13.5%, corresponding to
an organic decline of 17.2%.
EBITDA in Poland registered an organic decline of €41 million, principally related to contracting
margins caused by a rise in coal and biomass fuel prices.
Brazil recorded an organic decline of €33 million in EBITDA, largely attributable to two major
scheduled shutdowns at the Norte Fluminense plant in the first half of 2012 and the exceptionally
high level of exports in first-half 2011.
EBITDA in the United States also showed an organic decline (-€17 million), explained by the lower
margin achieved by CENG due to falling market prices for electricity, and the higher number of
days of scheduled shutdowns between first-half 2011 and first-half 2012. This decline is partly
offset by the slower pace of expenditure on UniStar’s Calvert Cliffs 3 project, and control of
structural costs in the holding company EDF Inc.
In Hungary, EBITDA registered an organic decline (-€12 million) especially at Be ZRt where
margins fell following changes in the regulatory context of July 2011, as detailed in section 2.2.4.3.
EBITDA in Belgium registered an organic decline of €3 million, reflecting the unfavourable effect
of new regulation mechanisms that came into force on 1 April, presented in section 2.2.4.2.
3.2.2.5. Other activities
Other activities contributed €1,165 million to Group EBITDA for first-half 2012, €265 million more
than in first-half 2011, with organic growth of +28.4%.
EDF Energies Nouvelles’ contribution to consolidated EBITDA registered an organic increase of
70.5% compared to first-half 2011, in line with development in Development-Sales of Structured
Assets and Generation.
EBITDA at EDF Trading was down by 8.4% compared to first-half 2011, in line with the trading
margin.
Dalkia’s EBITDA saw an organic decline of €40 million (-29.0%), due to the unfavourable business
environment in Italy.
- 35 -
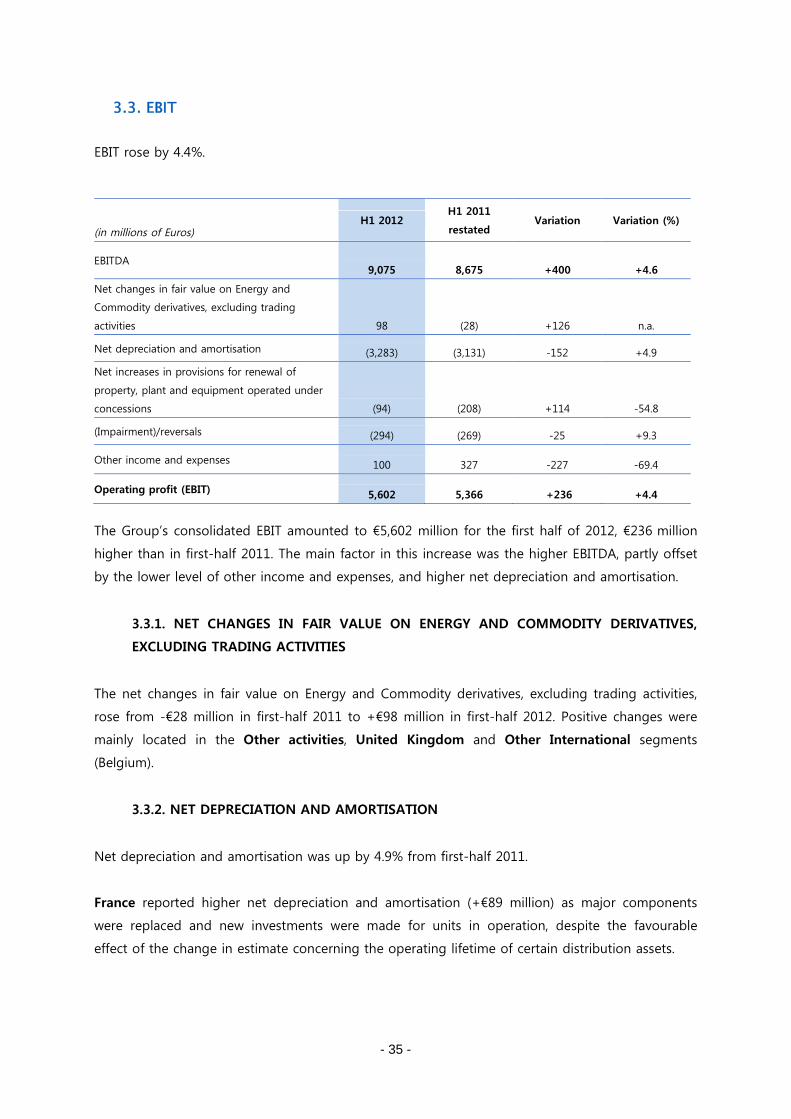
3.3. EBIT
EBIT rose by 4.4%.
(in millions of Euros)H1 2012
H1 2011
restatedVariation Variation (%)
EBITDA9,075 8,675 +400 +4.6
Net changes in fair value on Energy and
Commodity derivatives, excluding trading
activities 98 (28) +126 n.a.
Net depreciation and amortisation (3,283) (3,131) -152 +4.9
Net increases in provisions for renewal of
property, plant and equipment operated under
concessions (94) (208) +114 -54.8
(Impairment)/reversals (294) (269) -25 +9.3
Other income and expenses 100 327 -227 -69.4
Operating profit (EBIT) 5,602 5,366 +236 +4.4
The Group’s consolidated EBIT amounted to €5,602 million for the first half of 2012, €236 million
higher than in first-half 2011. The main factor in this increase was the higher EBITDA, partly offset
by the lower level of other income and expenses, and higher net depreciation and amortisation.
3.3.1. NET CHANGES IN FAIR VALUE ON ENERGY AND COMMODITY DERIVATIVES,
EXCLUDING TRADING ACTIVITIES
The net changes in fair value on Energy and Commodity derivatives, excluding trading activities,
rose from -€28 million in first-half 2011 to +€98 million in first-half 2012. Positive changes were
mainly located in the Other activities, United Kingdom and Other International segments
(Belgium).
3.3.2. NET DEPRECIATION AND AMORTISATION
Net depreciation and amortisation was up by 4.9% from first-half 2011.
France reported higher net depreciation and amortisation (+€89 million) as major components
were replaced and new investments were made for units in operation, despite the favourable
effect of the change in estimate concerning the operating lifetime of certain distribution assets.
- 36 -
In the United Kingdom, net depreciation and amortisation for first-half 2012 benefited from a
favourable €92 million effect of the operating lifetimes of AGR24 nuclear plants, which were
extended by an average 7 years from the closing date expected when EDF took over British
Energy in January 2009.
In Italy, the higher hydrocarbon generation volumes at Edison led to a rise in amortisation and
depreciation expenses. In the Exploration-Production sector, Edison continued exploring and made
two discoveries in Norway covering an estimated 18 billion m3 of gas reserves (in which Edison
holds a 20% share). The related exploration costs were charged to expenses for the half-year.
At EDF Energies Nouvelles, commissioning of new generation facilities caused a €26 million
increase in net depreciation and amortisation.
3.3.3. NET INCREASES IN PROVISIONS FOR RENEWAL OF PROPERTY, PLANT AND
EQUIPMENT OPERATED UNDER CONCESSIONS
The €114 million decrease in net increases in provisions for renewal of property, plant and
equipment operated under concessions between the first half of 2011 and the first half of 2012 is
attributable to ERDF. The amount allocated to these provisions was €71 million lower due to the
probability that facilities would be renewed before the end of contracts, and re-estimation of
operating lifetimes for certain public distribution facilities had a favourable €19 million impact on
the allocations to provisions for renewal.
3.3.4. IMPAIRMENT / REVERSALS
During first-half 2011, impairment losses totalling €174 million were recognised in the Other
activities segment by Dalkia in respect of the Italy zone and to a lesser extent the Spain zone, and
€60 million of impairment was booked in Italy by Edison on generation assets.
In first-half 2012, impairment mainly concerned the Other International segment: CENG
recognised impairment of €233 million in view of the poor outlook for forward electricity prices in
the United States.
3.3.5. OTHER INCOME AND EXPENSES
Other income and expenses for the first half of 2011 included €327 million for the gain on sale of
EnBW.
24 Advanced gas-cooled reactors.
- 37 -
Other income and expenses for the first half of 2012 include income of €177 million at ERDF
resulting mainly from a reversal from a provision for renewal following a change in estimate
concerning the operating lifetimes of high/low voltage transformers (which was extended from 30
years to 40 years), and the effects of the Group’s takeover of Edison (-€51 million).
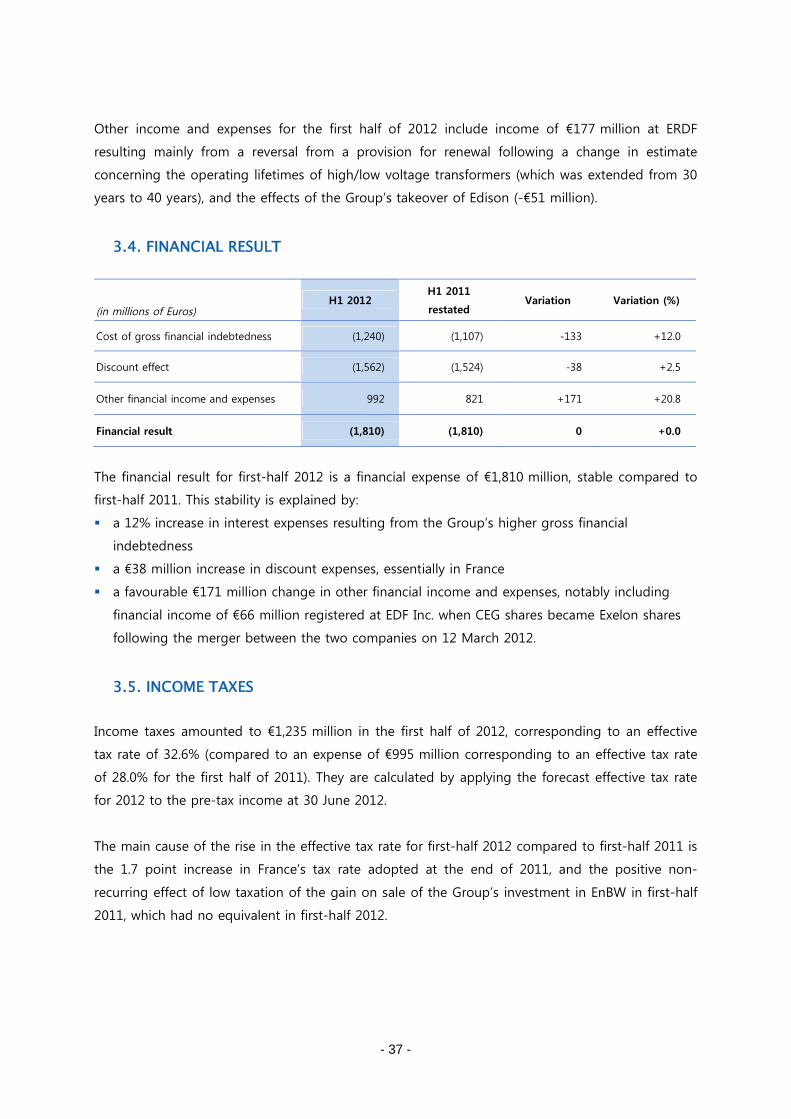
3.4. FINANCIAL RESULT
(in millions of Euros)H1 2012
H1 2011
restatedVariation Variation (%)
Cost of gross financial indebtedness (1,240) (1,107) -133 +12.0
Discount effect (1,562) (1,524) -38 +2.5
Other financial income and expenses 992 821 +171 +20.8
Financial result (1,810) (1,810) 0 +0.0
The financial result for first-half 2012 is a financial expense of €1,810 million, stable compared to
first-half 2011. This stability is explained by:
a 12% increase in interest expenses resulting from the Group’s higher gross financial
indebtedness
a €38 million increase in discount expenses, essentially in France
a favourable €171 million change in other financial income and expenses, notably including
financial income of €66 million registered at EDF Inc. when CEG shares became Exelon shares
following the merger between the two companies on 12 March 2012.
3.5. INCOME TAXES
Income taxes amounted to €1,235 million in the first half of 2012, corresponding to an effective
tax rate of 32.6% (compared to an expense of €995 million corresponding to an effective tax rate
of 28.0% for the first half of 2011). They are calculated by applying the forecast effective tax rate
for 2012 to the pre-tax income at 30 June 2012.
The main cause of the rise in the effective tax rate for first-half 2012 compared to first-half 2011 is
the 1.7 point increase in France’s tax rate adopted at the end of 2011, and the positive non-
recurring effect of low taxation of the gain on sale of the Group’s investment in EnBW in first-half
2011, which had no equivalent in first-half 2012.
- 38 -
3.6. SHARE IN INCOME OF ASSOCIATES
The Group’s share in income of associates was a positive €343 million in first-half 2012, compared
to €262 million for first-half 2011. This rise is mostly explained by the growth in net income at RTE
between first-half 2011 and first-half 2012 (+€102 million).
3.7. NET INCOME ATTRIBUTABLE TO NON-CONTROLLING INTERESTS
Net income attributable to non-controlling interests amounted to €132 million at 30 June 2012,
€44 million lower than at 30 June 2011. The change mainly concerns the Other International
segment (Poland), and to a lesser degree Italy.
3.8. EDF NET INCOME
EDF net income was €2,768 million at 30 June 2012, up by 4.6% compared to first-half 2011.
3.9. NET INCOME EXCLUDING NON-RECURRING ITEMS
The Group’s net income excluding non-recurring items25 stood at €2,945 million for first-half 2012,
up by €274 million or 10.3% compared to 30 June 2011.
25 Group net income excluding non-recurring items and net changes in fair value on Energy and Commodity derivatives,
excluding trading activities, net of tax.
Non-recurring items and net changes in fair value on Energy and Commodity derivatives, excluding trading activities, net of
tax amounted to -€177 million in first-half 2012:
+€113 million for reversals of provisions for renewal following extension of operating lifetimes of certain assets,
-€51 million for the effect of the takeover of TdE/Edison,
-€304 million for miscellaneous risks and impairment (principally at CENG in the United States),
+€65 million of net changes in fair value on Energy and Commodity derivatives, excluding trading activities, net of tax
Non-recurring items and net changes in fair value on Energy and Commodity derivatives, excluding trading activities, net of
tax amounted to
(-€24 million) in first-half 2011:
-€7 million for other risks and impairment (mainly concerning Dalkia and Edison) and TaRTAM transition tariff
provisions, offset by the gain on the sale of EnBW,
-€17 million of net changes in fair value on Energy and Commodity derivatives, excluding trading activities, net of tax.
- 39 -
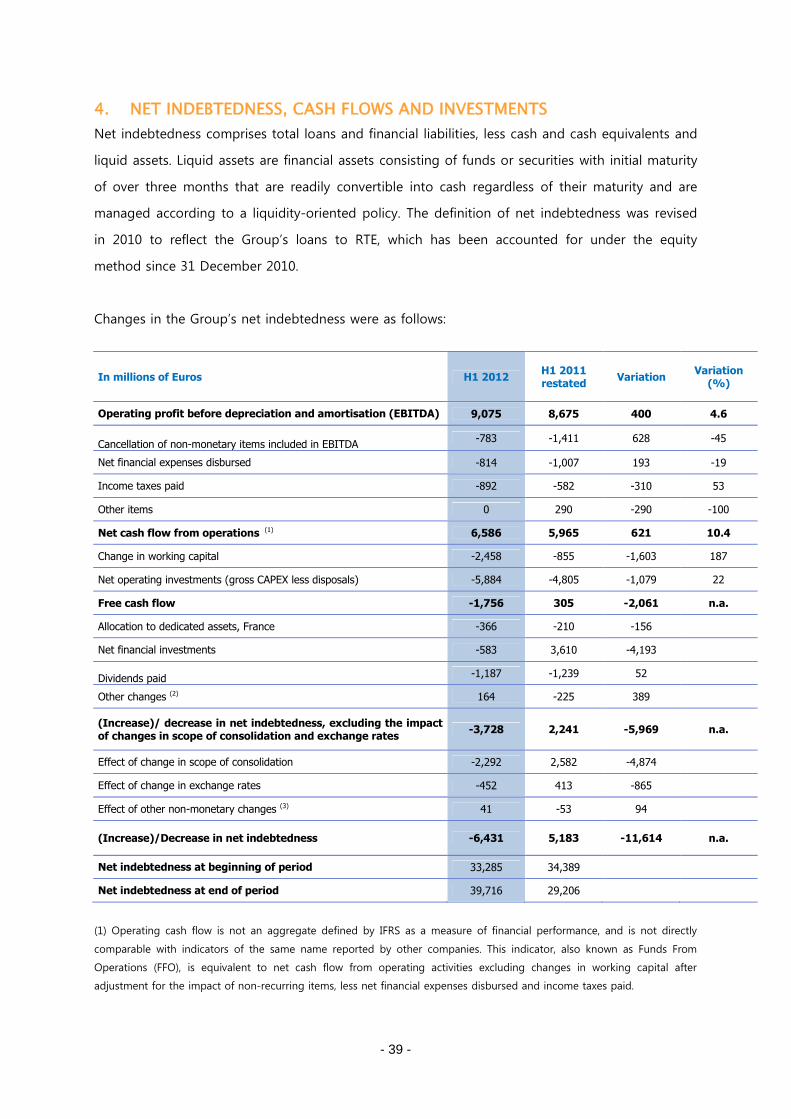
4. NET INDEBTEDNESS, CASH FLOWS AND INVESTMENTS
Net indebtedness comprises total loans and financial liabilities, less cash and cash equivalents and
liquid assets. Liquid assets are financial assets consisting of funds or securities with initial maturity
of over three months that are readily convertible into cash regardless of their maturity and are
managed according to a liquidity-oriented policy. The definition of net indebtedness was revised
in 2010 to reflect the Group’s loans to RTE, which has been accounted for under the equity
method since 31 December 2010.
Changes in the Group’s net indebtedness were as follows:
In millions of Euros H1 2012H1 2011restated
VariationVariation
(%)
Operating profit before depreciation and amortisation (EBITDA) 9,075 8,675 400 4.6
Cancellation of non-monetary items included in EBITDA-783 -1,411 628 -45
Net financial expenses disbursed -814 -1,007 193 -19
Income taxes paid -892 -582 -310 53
Other items 0 290 -290 -100
Net cash flow from operations (1) 6,586 5,965 621 10.4
Change in working capital -2,458 -855 -1,603 187
Net operating investments (gross CAPEX less disposals) -5,884 -4,805 -1,079 22
Free cash flow -1,756 305 -2,061 n.a.
Allocation to dedicated assets, France -366 -210 -156
Net financial investments -583 3,610 -4,193
Dividends paid -1,187 -1,239 52
Other changes (2) 164 -225 389
(Increase)/ decrease in net indebtedness, excluding the impactof changes in scope of consolidation and exchange rates
-3,728 2,241 -5,969 n.a.
Effect of change in scope of consolidation -2,292 2,582 -4,874
Effect of change in exchange rates -452 413 -865
Effect of other non-monetary changes (3) 41 -53 94
(Increase)/Decrease in net indebtedness -6,431 5,183 -11,614 n.a.
Net indebtedness at beginning of period 33,285 34,389
Net indebtedness at end of period 39,716 29,206
(1) Operating cash flow is not an aggregate defined by IFRS as a measure of financial performance, and is not directly
comparable with indicators of the same name reported by other companies. This indicator, also known as Funds From
Operations (FFO), is equivalent to net cash flow from operating activities excluding changes in working capital after
adjustment for the impact of non-recurring items, less net financial expenses disbursed and income taxes paid.
- 40 -
(2) Mainly the change in accrued interest on debt, contributions received on concession assets, investment subsidies and
the payment to AREVA for decommissioning of the plant at La Hague (the final payment of €664 million excluding taxes
was made in June 2011).
(3) Mainly corresponds to changes in fair value and accounting reclassifications affecting net indebtedness.
The change in net indebtedness over the first half of 2012 incorporates all the impacts of the
Edison operation which was finalised on 24 May 2012, i.e.:
Takeover via acquisition of Transalpina di Energia (€784 million)
Acquisition by Delmi of the investment in Edipower (€684 million)
The effect of changes in the scope of consolidation, mainly related to 100% inclusion of the net
indebtedness of Edison and TdE, partially offset by the sale of Edipower (€2,290 million).
The total impact was thus €2,390 million (before any impacts of the mandatory tender offer
launched on 2 July 2012).
4.1. OPERATING CASH FLOW
The operating cash flow amounted to €6,586 million in first-half 2012 compared to €5,965 million
in first-half 2011.
This change principally reflects the rise in EBITDA (€400 million), and the decrease in non-
monetary items included in EBITDA (€628 million), essentially relating to fair value adjustments of
hedging instruments.
These positive effects were partly counterbalanced by the rise in income taxes paid (-€310 million),
mainly as a result of the differences in the taxes paid in France in respect of previous years, and
the payments made in 2012 in connection with tax inspections), and the decline in other items (-
€290 million, including -€268 million for dividends received from associates, which in 2012 will
mostly be received in the second half-year).
4.2. CHANGE IN WORKING CAPITAL
Working capital increased by €2,458 million over the first half of 2012.
Working capital for the Optimisation-Trading activity was stable between December 2011 and
June 2012. The significant variation in working capital over the first half of 2012 is mainly
explained by the lower level of trade payables (-€1,304 million excluding Optimisation-Trading; -
€929 million of this amount concerned France), which was the automatic result of the lower
purchase volumes at 30 June compared to 31 December.
This seasonal effect was not offset in 2012 by the decline in trade receivables that is traditionally
observed in the first half-year. In fact, trade receivables increased (-€157 million excluding
Optimisation-Trading) at 30 June 2012 due to the impact on electricity sales (and therefore on the
- 41 -
level of receivables) of the mild weather of late 2011 and the waves of cold weather experienced
in the first half of 2012.
Another factor in the rise in working capital was the increase in the CSPE receivable, which
includes income for billed energy (-€687 million for EDF SA).
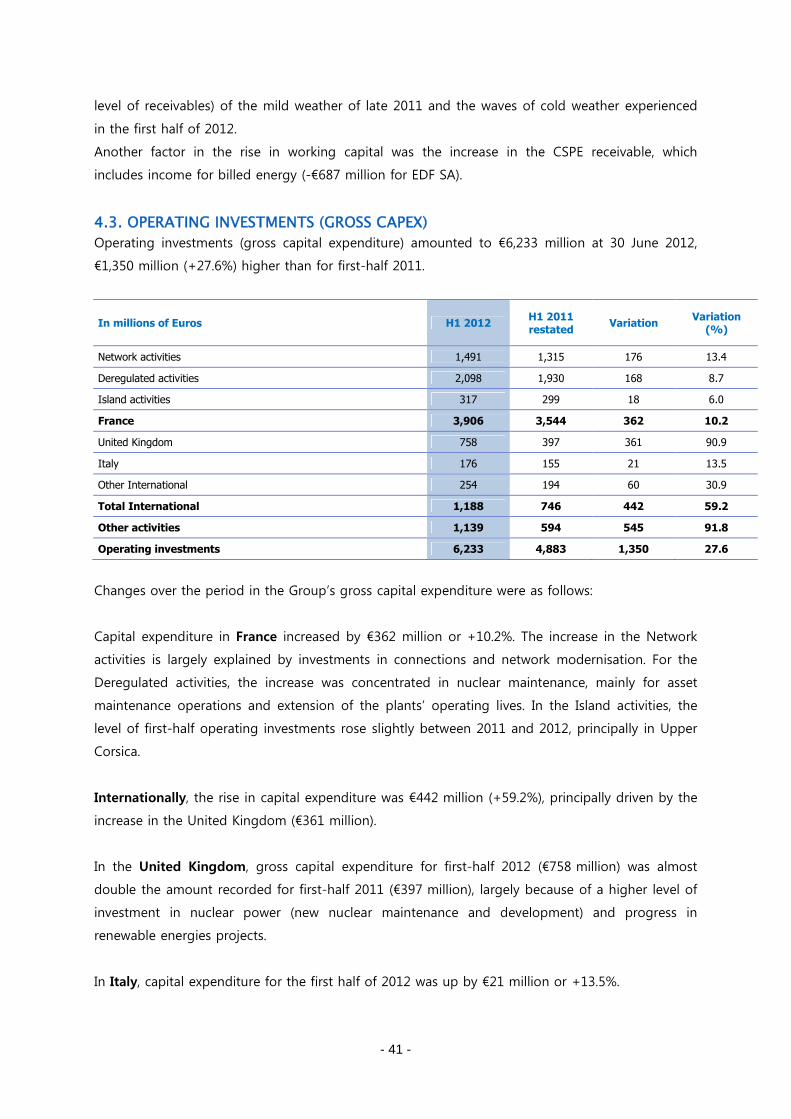
4.3. OPERATING INVESTMENTS (GROSS CAPEX)
Operating investments (gross capital expenditure) amounted to €6,233 million at 30 June 2012,
€1,350 million (+27.6%) higher than for first-half 2011.
In millions of Euros H1 2012H1 2011restated
VariationVariation
(%)
Network activities 1,491 1,315 176 13.4
Deregulated activities 2,098 1,930 168 8.7
Island activities 317 299 18 6.0
France 3,906 3,544 362 10.2
United Kingdom 758 397 361 90.9
Italy 176 155 21 13.5
Other International 254 194 60 30.9
Total International 1,188 746 442 59.2
Other activities 1,139 594 545 91.8
Operating investments 6,233 4,883 1,350 27.6
Changes over the period in the Group’s gross capital expenditure were as follows:
Capital expenditure in France increased by €362 million or +10.2%. The increase in the Network
activities is largely explained by investments in connections and network modernisation. For the
Deregulated activities, the increase was concentrated in nuclear maintenance, mainly for asset
maintenance operations and extension of the plants’ operating lives. In the Island activities, the
level of first-half operating investments rose slightly between 2011 and 2012, principally in Upper
Corsica.
Internationally, the rise in capital expenditure was €442 million (+59.2%), principally driven by the
increase in the United Kingdom (€361 million).
In the United Kingdom, gross capital expenditure for first-half 2012 (€758 million) was almost
double the amount recorded for first-half 2011 (€397 million), largely because of a higher level of
investment in nuclear power (new nuclear maintenance and development) and progress in
renewable energies projects.
In Italy, capital expenditure for the first half of 2012 was up by €21 million or +13.5%.
- 42 -
In the Other International segment, capital expenditure for first-half 2012 rose by €60 million
(+30.9%). The increase was mostly concentrated in Continental Europe and Brazil.
Capital expenditure in the Other activities was up by €545 million. This variation is primarily due
to a significant increase in operating investments by EDF Energies Nouvelles (€465 million),
particularly in the United States and Mexico, and progress on construction of the Dunkirk LNG
terminal (€76 million).
4.4. FREE CASH FLOW
The Group’s free cash flow at 30 June 2012 was negative at -€1,756 million (against €305 million
at 30 June 2011). The main factors were:
operating cash flow of €6,586 million (see section 4.1)
a decrease in working capital over the first half of 2012 (-€2,458 million, see section 4.2)
gross capital expenditure of €6,233 million at 30 June 2012 (see section 4.3).
4.5. ALLOCATION TO DEDICATED ASSETS
In compliance with the French Law of 28 June 2006 on the sustainable management of radioactive
materials and waste, EDF is continuing to build up a portfolio of dedicated assets for secure
financing of long-term nuclear obligations.
Allocations to the dedicated asset portfolio were suspended in October 2011 but resumed in
January 2012, and the cash allocation to the dedicated asset portfolio in France for first-half 2012
amounted to €366 million, €156 million more than in first-half 2011.
4.6. NET FINANCIAL INVESTMENTS (EXCLUDING THE ALLOCATION TO
DEDICATED ASSETS)
In the first half of 2012 net financial investments (excluding allocations to dedicated assets)
amounted to -€583 million, comprising:
gains on disposals (€687 million) explained by receipt in May 2012 of €684 million after
Delmi’s purchase of Edison’s investment in Edipower,
investments for external growth (-€1,341 million), mainly relating to the takeover of Edison
through acquisition of TdE (€784 million) and the purchase of the shares in ERSA and
Kogeneracja held by EnBW for €301 million.
- 43 -
4.7. DIVIDENDS
Dividends paid in cash (€1,187 million) comprise the balance of the 2011 dividends (€1,072
million) and the dividends paid by Group subsidiaries to their minority shareholders (€115 million),
principally Centrica in the UK. In first-half 2011, dividends paid in cash amounted to €1,239 million.
4.8. CHANGES IN SCOPE OF CONSOLIDATION AND FOREIGN EXCHANGE EFFECTS
€2,290 million of the changes in the scope of consolidation reflect full consolidation of the
financial debt of Edison and Transalpina di Energia (TdE) after EDF took control of those
companies. This effect was partly offset by the disposal of Edipower.
Foreign exchange effects (rise of the US dollar and the pound sterling against the Euro26)
accounted for €452 million of the increase in the Group’s net indebtedness over the first half of
2012.
4.9. NET INDEBTEDNESS
The Group’s net indebtedness stood at €39,716 million at 30 June 2012 compared to
€33,285 million at 31 December 2011, an increase of €6,431 million over the first half of 2012.
This mainly reflects the impacts associated with the Edison operation (€2,390 million), the negative
free cash flow (€1,756 million, notably resulting from the decrease in working capital over the first
half of 2012, see section 4.4), payment of cash dividends (€1,187 million, see section 4.7) and the
unfavourable foreign exchange effect (€452 million, see section 4.8).
26 The US dollar rose by 2.8% against the Euro, from €0.7729/$1 at December 31, 2011 to €0.7943/$1 at 30 June 2012.
The pound sterling rose by 3.5% against the Euro, from €1.1972/£1 at December 31, 2011 to €1.2395/£1 at 30 June 2012.
- 44 -
5. MANAGEMENT AND CONTROL OF MARKET RISKS
The policy and principles for management and control of the Group’s market risks are presented
in Section 9.5 of the 2011 Reference Document. There have been no significant changes during
the first half-year of 2012.
This chapter sets forth the main changes over the first half-year of 2012 in financial data
concerning the management and control of market risks.
5.1. MANAGEMENT AND CONTROL OF FINANCIAL RISKS
5.1.1. LIQUIDITY POSITION AND MANAGEMENT OF LIQUIDITY RISKS
5.1.1.1. Liquidity position
At 30 June 2012, the Group’s liquidities totalled €17,982 million compared to €14,767 million at 31
December 2011, and available credit lines amounted to €9,128 million compared to €10,179
million at 31 December 2011.
5.1.1.2. Management of liquidity risks
During first-half 2012, EDF undertook several new EMTN issues:
€2 billion with annual coupon of 3.875% and 10-year maturity (on 18 January 2012)
€1 billion with annual coupon of 4.125% and 15-year maturity (on 27 March 2012)
£500 million with annual coupon of 5.5% and 25-year maturity (on 27 March 2012)
£250 million with annual coupon of 5.5% and 30-year maturity (on 30 January 2012)
The average maturity of Group debt was thus 8.6 years at 30 June 2012, compared to 9.2 years at
31 December 2011. For EDF SA, the average maturity of debt was 9.9 years against 10.4 years at
31 December 2011.
During first-half 2012, Edison undertook a €400 million drawing on the €1.5 billion syndicated
credit facility, maturing in April 2013. The other syndicated credit facility, amounting to
€700 million, was fully drawn at the end of December 2011 and reimbursed in full in May 2012,
such that it was fully available at 30 June 2012.
RTE had two syndicated credit facilities: the first for €1 billion, and the second for €500 million. As
the second of these matured on 22 June 2012, the €1 billion facility was replaced by a new
syndicated credit facility of €1.5 billion on 6 July 2012 (maturing on 6 July 2017).
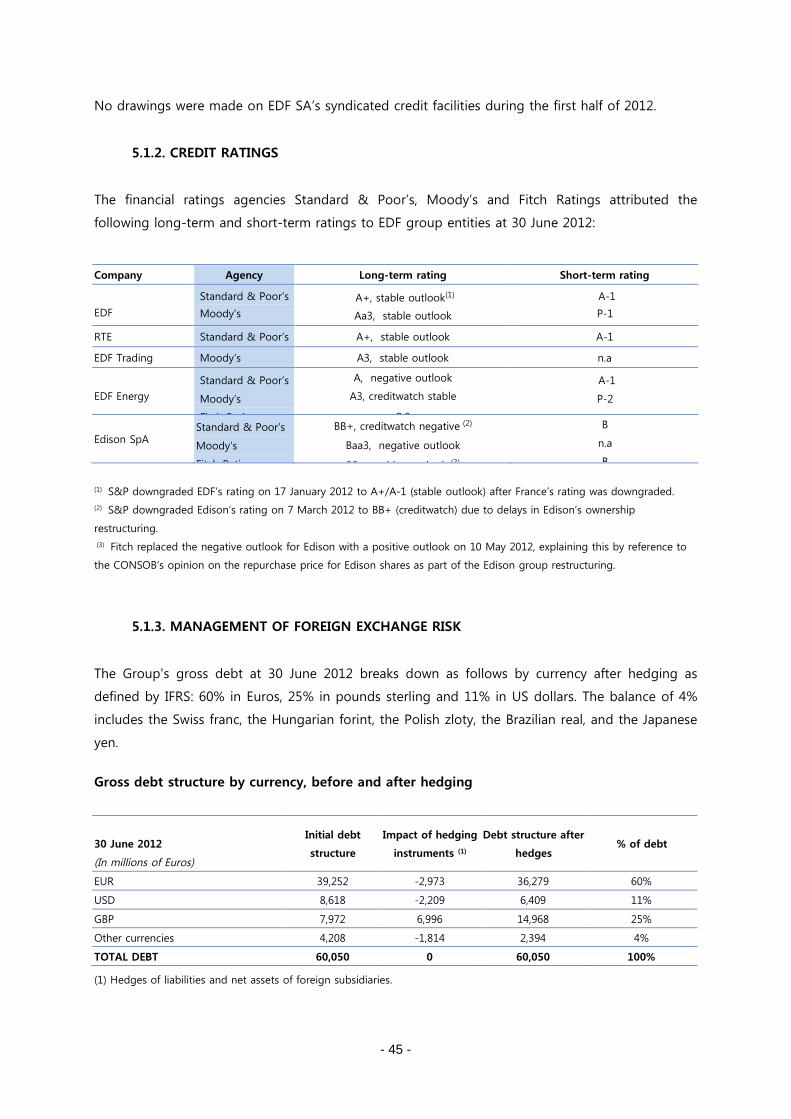
- 45 -
No drawings were made on EDF SA’s syndicated credit facilities during the first half of 2012.
5.1.2. CREDIT RATINGS
The financial ratings agencies Standard & Poor’s, Moody’s and Fitch Ratings attributed the
following long-term and short-term ratings to EDF group entities at 30 June 2012:
(1) S&P downgraded EDF’s rating on 17 January 2012 to A+/A-1 (stable outlook) after France’s rating was downgraded.
(2) S&P downgraded Edison’s rating on 7 March 2012 to BB+ (creditwatch) due to delays in Edison’s ownership
restructuring.
(3) Fitch replaced the negative outlook for Edison with a positive outlook on 10 May 2012, explaining this by reference to
the CONSOB’s opinion on the repurchase price for Edison shares as part of the Edison group restructuring.
5.1.3. MANAGEMENT OF FOREIGN EXCHANGE RISK
The Group's gross debt at 30 June 2012 breaks down as follows by currency after hedging as
defined by IFRS: 60% in Euros, 25% in pounds sterling and 11% in US dollars. The balance of 4%
includes the Swiss franc, the Hungarian forint, the Polish zloty, the Brazilian real, and the Japanese
yen.
Gross debt structure by currency, before and after hedging
(1) Hedges of liabilities and net assets of foreign subsidiaries.
Company Agency Long-term rating Short-term rating
EDF
Standard & Poor’s
Moody’s
Fitch Ratings
A+, stable outlook(1)
Aa3, stable outlook
A+, stable outlook
A-1
P-1
F1RTE Standard & Poor’s A+, stable outlook A-1
EDF Trading Moody’s A3, stable outlook n.a
EDF Energy
Standard & Poor’s
Moody’s
Fitch Ratings
A, negative outlook
A3, creditwatch stable
n.a
A-1
P-2
n.a
Edison SpAStandard & Poor’s
Moody’s
Fitch Ratings
BB+, creditwatch negative (2)
Baa3, negative outlook
BB-, positive outlook (3)
B
n.a
B
30 June 2012
(In millions of Euros)
Initial debt
structure
Impact of hedging
instruments (1)
Debt structure after
hedges% of debt
EUR 39,252 -2,973 36,279 60%
USD 8,618 -2,209 6,409 11%
GBP 7,972 6,996 14,968 25%
Other currencies 4,208 -1,814 2,394 4%
TOTAL DEBT 60,050 0 60,050 100%
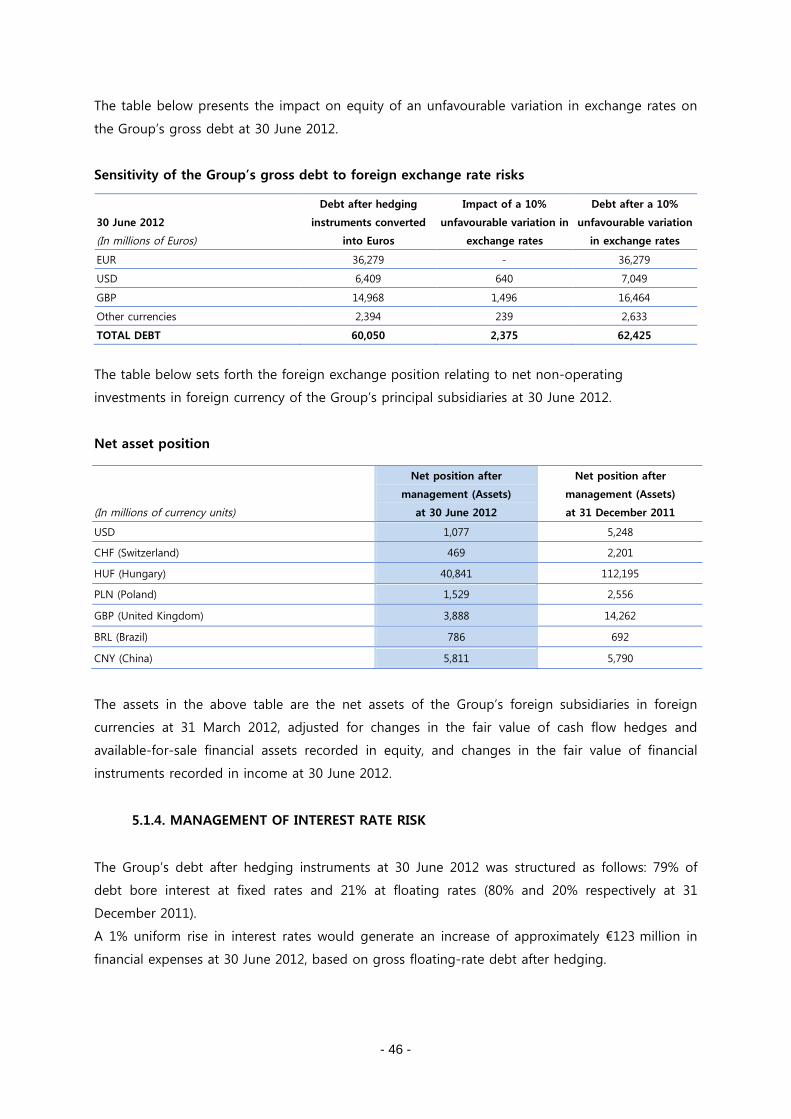
- 46 -
The table below presents the impact on equity of an unfavourable variation in exchange rates on
the Group’s gross debt at 30 June 2012.
Sensitivity of the Group’s gross debt to foreign exchange rate risks
The table below sets forth the foreign exchange position relating to net non-operating
investments in foreign currency of the Group’s principal subsidiaries at 30 June 2012.
Net asset position
The assets in the above table are the net assets of the Group’s foreign subsidiaries in foreign
currencies at 31 March 2012, adjusted for changes in the fair value of cash flow hedges and
available-for-sale financial assets recorded in equity, and changes in the fair value of financial
instruments recorded in income at 30 June 2012.
5.1.4. MANAGEMENT OF INTEREST RATE RISK
The Group’s debt after hedging instruments at 30 June 2012 was structured as follows: 79% of
debt bore interest at fixed rates and 21% at floating rates (80% and 20% respectively at 31
December 2011).
A 1% uniform rise in interest rates would generate an increase of approximately €123 million in
financial expenses at 30 June 2012, based on gross floating-rate debt after hedging.
30 June 2012
(In millions of Euros)
Debt after hedging
instruments converted
into Euros
Impact of a 10%
unfavourable variation in
exchange rates
Debt after a 10%
unfavourable variation
in exchange rates
EUR 36,279 - 36,279
USD 6,409 640 7,049
GBP 14,968 1,496 16,464
Other currencies 2,394 239 2,633
TOTAL DEBT 60,050 2,375 62,425
(In millions of currency units)
Net position after
management (Assets)
at 30 June 2012
Net position after
management (Assets)
at 31 December 2011
USD 1,077 5,248
CHF (Switzerland) 469 2,201
HUF (Hungary) 40,841 112,195
PLN (Poland) 1,529 2,556
GBP (United Kingdom) 3,888 14,262
BRL (Brazil) 786 692
CNY (China) 5,811 5,790
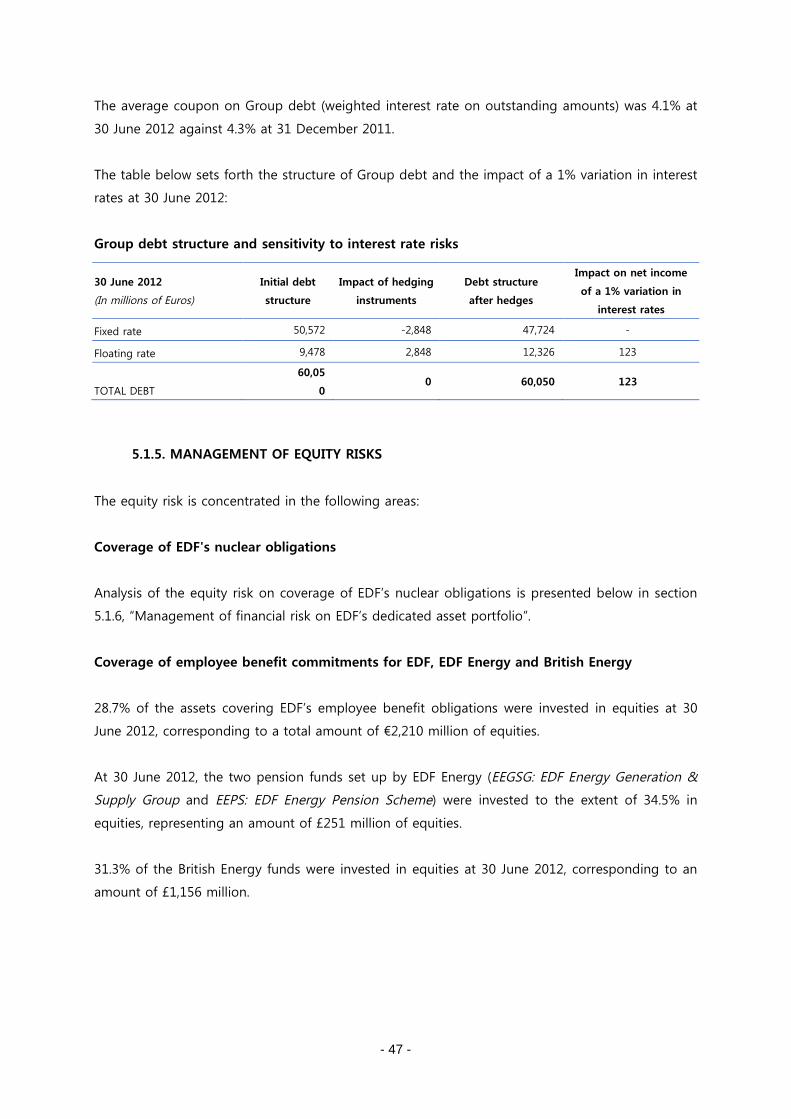
- 47 -
The average coupon on Group debt (weighted interest rate on outstanding amounts) was 4.1% at
30 June 2012 against 4.3% at 31 December 2011.
The table below sets forth the structure of Group debt and the impact of a 1% variation in interest
rates at 30 June 2012:
Group debt structure and sensitivity to interest rate risks
5.1.5. MANAGEMENT OF EQUITY RISKS
The equity risk is concentrated in the following areas:
Coverage of EDF's nuclear obligations
Analysis of the equity risk on coverage of EDF’s nuclear obligations is presented below in section
5.1.6, “Management of financial risk on EDF’s dedicated asset portfolio”.
Coverage of employee benefit commitments for EDF, EDF Energy and British Energy
28.7% of the assets covering EDF’s employee benefit obligations were invested in equities at 30
June 2012, corresponding to a total amount of €2,210 million of equities.
At 30 June 2012, the two pension funds set up by EDF Energy (EEGSG: EDF Energy Generation &
Supply Group and EEPS: EDF Energy Pension Scheme) were invested to the extent of 34.5% in
equities, representing an amount of £251 million of equities.
31.3% of the British Energy funds were invested in equities at 30 June 2012, corresponding to an
amount of £1,156 million.
30 June 2012
(In millions of Euros)
Initial debt
structure
Impact of hedging
instruments
Debt structure
after hedges
Impact on net income
of a 1% variation in
interest rates
Fixed rate 50,572 -2,848 47,724 -
Floating rate 9,478 2,848 12,326 123
TOTAL DEBT
60,05
00 60,050 123
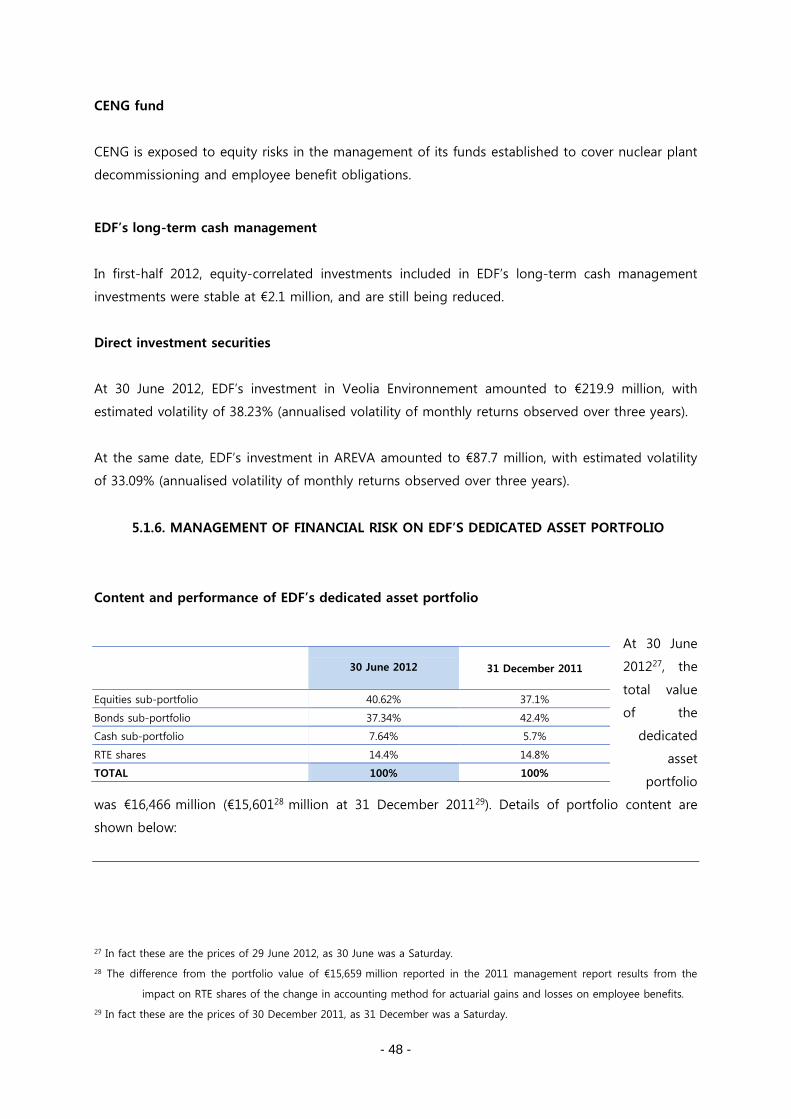
- 48 -
CENG fund
CENG is exposed to equity risks in the management of its funds established to cover nuclear plant
decommissioning and employee benefit obligations.
EDF’s long-term cash management
In first-half 2012, equity-correlated investments included in EDF’s long-term cash management
investments were stable at €2.1 million, and are still being reduced.
Direct investment securities
At 30 June 2012, EDF’s investment in Veolia Environnement amounted to €219.9 million, with
estimated volatility of 38.23% (annualised volatility of monthly returns observed over three years).
At the same date, EDF’s investment in AREVA amounted to €87.7 million, with estimated volatility
of 33.09% (annualised volatility of monthly returns observed over three years).
5.1.6. MANAGEMENT OF FINANCIAL RISK ON EDF’S DEDICATED ASSET PORTFOLIO
Content and performance of EDF’s dedicated asset portfolio
At 30 June
201227, the
total value
of the
dedicated
asset
portfolio
was €16,466 million (€15,60128 million at 31 December 201129). Details of portfolio content are
shown below:
27 In fact these are the prices of 29 June 2012, as 30 June was a Saturday.
28 The difference from the portfolio value of €15,659 million reported in the 2011 management report results from the
impact on RTE shares of the change in accounting method for actuarial gains and losses on employee benefits.
29 In fact these are the prices of 30 December 2011, as 31 December was a Saturday.
30 June 2012 31 December 2011
Equities sub-portfolio 40.62% 37.1%
Bonds sub-portfolio 37.34% 42.4%
Cash sub-portfolio 7.64% 5.7%
RTE shares 14.4% 14.8%
TOTAL 100% 100%
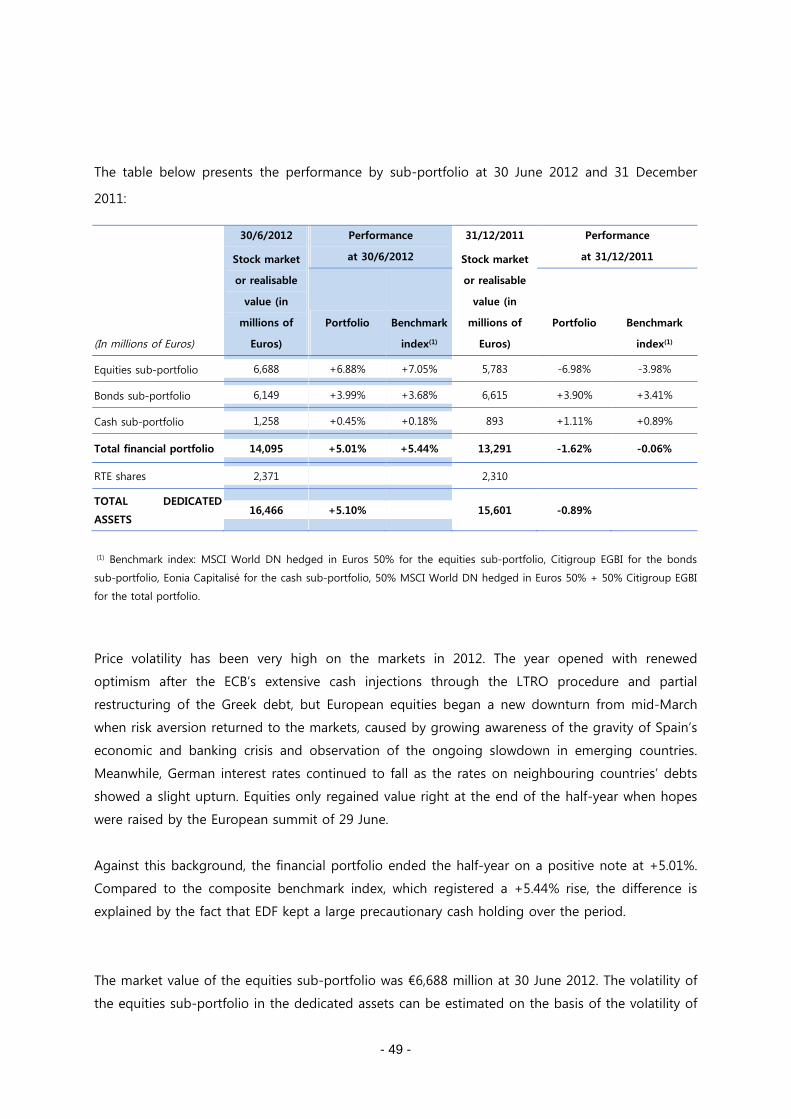
- 49 -
The table below presents the performance by sub-portfolio at 30 June 2012 and 31 December
2011:
(1) Benchmark index: MSCI World DN hedged in Euros 50% for the equities sub-portfolio, Citigroup EGBI for the bonds
sub-portfolio, Eonia Capitalisé for the cash sub-portfolio, 50% MSCI World DN hedged in Euros 50% + 50% Citigroup EGBI
for the total portfolio.
Price volatility has been very high on the markets in 2012. The year opened with renewed
optimism after the ECB’s extensive cash injections through the LTRO procedure and partial
restructuring of the Greek debt, but European equities began a new downturn from mid-March
when risk aversion returned to the markets, caused by growing awareness of the gravity of Spain’s
economic and banking crisis and observation of the ongoing slowdown in emerging countries.
Meanwhile, German interest rates continued to fall as the rates on neighbouring countries’ debts
showed a slight upturn. Equities only regained value right at the end of the half-year when hopes
were raised by the European summit of 29 June.
Against this background, the financial portfolio ended the half-year on a positive note at +5.01%.
Compared to the composite benchmark index, which registered a +5.44% rise, the difference is
explained by the fact that EDF kept a large precautionary cash holding over the period.
The market value of the equities sub-portfolio was €6,688 million at 30 June 2012. The volatility of
the equities sub-portfolio in the dedicated assets can be estimated on the basis of the volatility of
(In millions of Euros)
30/6/2012
Stock market
or realisable
value (in
millions of
Euros)
Performance
at 30/6/2012
31/12/2011
Stock market
or realisable
value (in
millions of
Euros)
Performance
at 31/12/2011
Portfolio Benchmark
index(1)
Portfolio Benchmark
index(1)
Equities sub-portfolio 6,688 +6.88% +7.05% 5,783 -6.98% -3.98%
Bonds sub-portfolio 6,149 +3.99% +3.68% 6,615 +3.90% +3.41%
Cash sub-portfolio 1,258 +0.45% +0.18% 893 +1.11% +0.89%
Total financial portfolio 14,095 +5.01% +5.44% 13,291 -1.62% -0.06%
RTE shares 2,371 2,310
TOTAL DEDICATED
ASSETS16,466 +5.10% 15,601 -0.89%
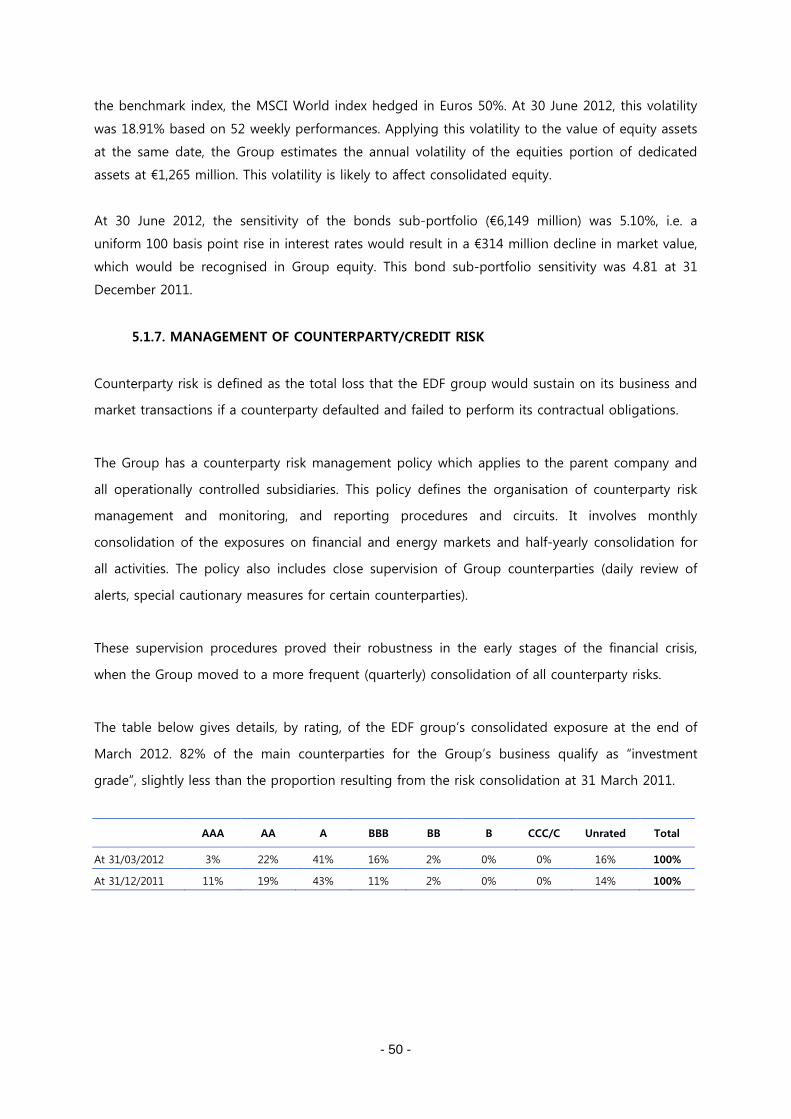
- 50 -
the benchmark index, the MSCI World index hedged in Euros 50%. At 30 June 2012, this volatility
was 18.91% based on 52 weekly performances. Applying this volatility to the value of equity assets
at the same date, the Group estimates the annual volatility of the equities portion of dedicated
assets at €1,265 million. This volatility is likely to affect consolidated equity.
At 30 June 2012, the sensitivity of the bonds sub-portfolio (€6,149 million) was 5.10%, i.e. a
uniform 100 basis point rise in interest rates would result in a €314 million decline in market value,
which would be recognised in Group equity. This bond sub-portfolio sensitivity was 4.81 at 31
December 2011.
5.1.7. MANAGEMENT OF COUNTERPARTY/CREDIT RISK
Counterparty risk is defined as the total loss that the EDF group would sustain on its business and
market transactions if a counterparty defaulted and failed to perform its contractual obligations.
The Group has a counterparty risk management policy which applies to the parent company and
all operationally controlled subsidiaries. This policy defines the organisation of counterparty risk
management and monitoring, and reporting procedures and circuits. It involves monthly
consolidation of the exposures on financial and energy markets and half-yearly consolidation for
all activities. The policy also includes close supervision of Group counterparties (daily review of
alerts, special cautionary measures for certain counterparties).
These supervision procedures proved their robustness in the early stages of the financial crisis,
when the Group moved to a more frequent (quarterly) consolidation of all counterparty risks.
The table below gives details, by rating, of the EDF group’s consolidated exposure at the end of
March 2012. 82% of the main counterparties for the Group’s business qualify as “investment
grade”, slightly less than the proportion resulting from the risk consolidation at 31 March 2011.
AAA AA A BBB BB B CCC/C Unrated Total
At 31/03/2012 3% 22% 41% 16% 2% 0% 0% 16% 100%
At 31/12/2011 11% 19% 43% 11% 2% 0% 0% 14% 100%
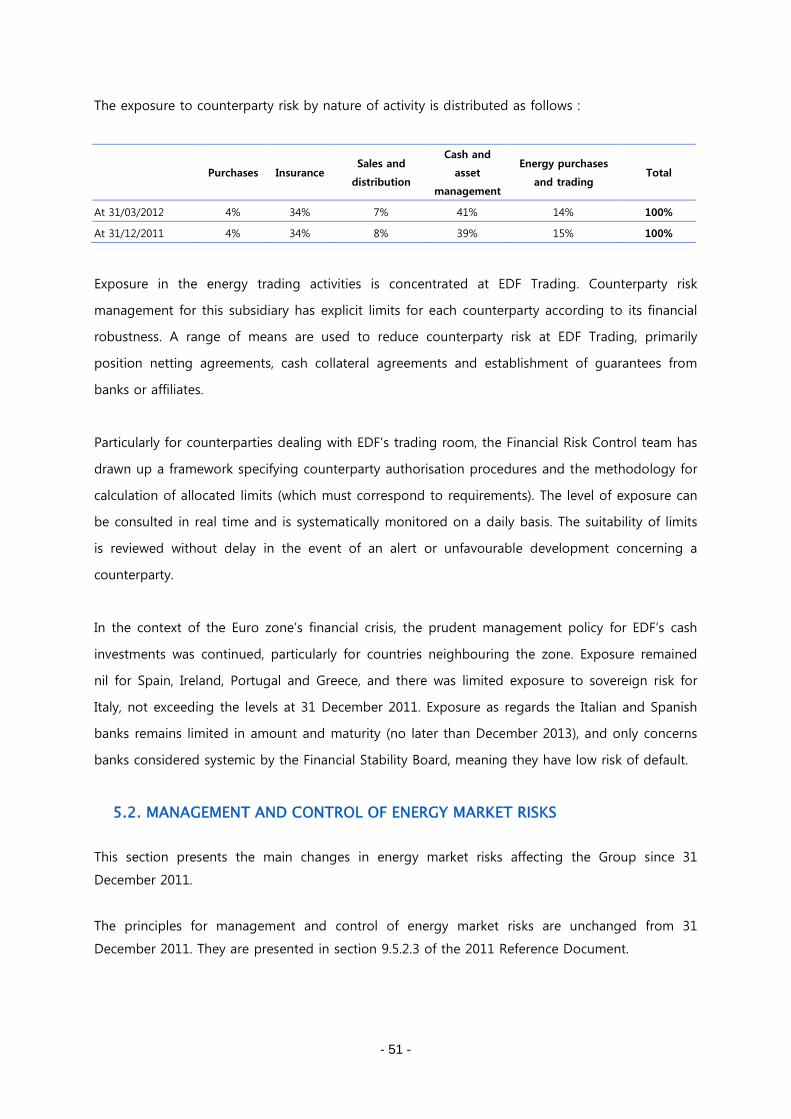
- 51 -
The exposure to counterparty risk by nature of activity is distributed as follows :
Exposure in the energy trading activities is concentrated at EDF Trading. Counterparty risk
management for this subsidiary has explicit limits for each counterparty according to its financial
robustness. A range of means are used to reduce counterparty risk at EDF Trading, primarily
position netting agreements, cash collateral agreements and establishment of guarantees from
banks or affiliates.
Particularly for counterparties dealing with EDF’s trading room, the Financial Risk Control team has
drawn up a framework specifying counterparty authorisation procedures and the methodology for
calculation of allocated limits (which must correspond to requirements). The level of exposure can
be consulted in real time and is systematically monitored on a daily basis. The suitability of limits
is reviewed without delay in the event of an alert or unfavourable development concerning a
counterparty.
In the context of the Euro zone’s financial crisis, the prudent management policy for EDF’s cash
investments was continued, particularly for countries neighbouring the zone. Exposure remained
nil for Spain, Ireland, Portugal and Greece, and there was limited exposure to sovereign risk for
Italy, not exceeding the levels at 31 December 2011. Exposure as regards the Italian and Spanish
banks remains limited in amount and maturity (no later than December 2013), and only concerns
banks considered systemic by the Financial Stability Board, meaning they have low risk of default.
5.2. MANAGEMENT AND CONTROL OF ENERGY MARKET RISKS
This section presents the main changes in energy market risks affecting the Group since 31
December 2011.
The principles for management and control of energy market risks are unchanged from 31
December 2011. They are presented in section 9.5.2.3 of the 2011 Reference Document.
Purchases InsuranceSales and
distribution
Cash and
asset
management
Energy purchases
and tradingTotal
At 31/03/2012 4% 34% 7% 41% 14% 100%
At 31/12/2011 4% 34% 8% 39% 15% 100%
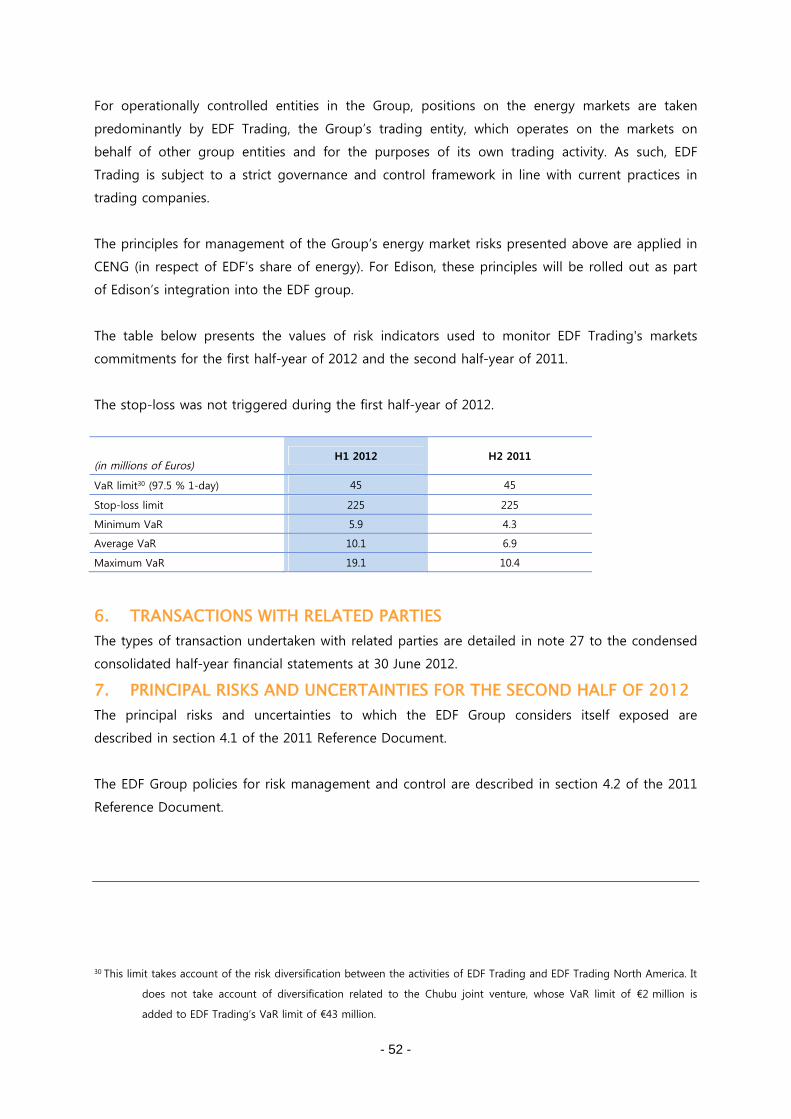
- 52 -
For operationally controlled entities in the Group, positions on the energy markets are taken
predominantly by EDF Trading, the Group’s trading entity, which operates on the markets on
behalf of other group entities and for the purposes of its own trading activity. As such, EDF
Trading is subject to a strict governance and control framework in line with current practices in
trading companies.
The principles for management of the Group’s energy market risks presented above are applied in
CENG (in respect of EDF’s share of energy). For Edison, these principles will be rolled out as part
of Edison’s integration into the EDF group.
The table below presents the values of risk indicators used to monitor EDF Trading's markets
commitments for the first half-year of 2012 and the second half-year of 2011.
The stop-loss was not triggered during the first half-year of 2012.
6. TRANSACTIONS WITH RELATED PARTIES
The types of transaction undertaken with related parties are detailed in note 27 to the condensed
consolidated half-year financial statements at 30 June 2012.
7. PRINCIPAL RISKS AND UNCERTAINTIES FOR THE SECOND HALF OF 2012
The principal risks and uncertainties to which the EDF Group considers itself exposed are
described in section 4.1 of the 2011 Reference Document.
The EDF Group policies for risk management and control are described in section 4.2 of the 2011
Reference Document.
30 This limit takes account of the risk diversification between the activities of EDF Trading and EDF Trading North America. It
does not take account of diversification related to the Chubu joint venture, whose VaR limit of €2 million is
added to EDF Trading’s VaR limit of €43 million.
(in millions of Euros)H1 2012 H2 2011
VaR limit30 (97.5 % 1-day) 45 45
Stop-loss limit 225 225
Minimum VaR 5.9 4.3
Average VaR 10.1 6.9
Maximum VaR 19.1 10.4
- 53 -
This presentation of the major risks remains valid at the date of publication of this report for
assessment of the principal risks and uncertainties for the second half of 2012, and the Group
remains subject to the usual risks specific to its business.
8. SIGNIFICANT EVENTS RELATED TO LITIGATION IN PROCESS
Litigations concerning the EDF group are described in section 20.5 of the 2011 Reference
Document. This chapter reports on litigations which have seen significant developments since the
release of the 2011 reference document.
8.1. PROCEEDINGS CONCERNING EDF
General Network
The European Commission initiated proceedings against France in October 2002, claiming that EDF
had received State aid when its balance sheet was restructured at 1 January 1997. By a decision
dated 16 December 2003, the European Commission set the amount of aid to be repaid at €889
million (principal). On 11 February 2004, the French State issued a collection note for €1,224
million, comprised of the principal amount of the aid to be repaid, plus interest. This amount was
paid by EDF. On 27 April 2004, EDF filed an appeal with the European Court of First Instance, now
the General Court of the European Union, to have the Commission’s decision reversed. The Court
issued a ruling on 15 December 2009 cancelling the Commission’s decision of 16 December 2003.
As this was immediately enforceable, the State repaid the sum of €1,224 million to EDF on 30
December 2009. On 26 February 2010, the European Commission filed an appeal before the Court
of Justice of the European Union against the General Court’s decision. This appeal was rejected by
a decision of 5 June 2012, in which the Court of Justice upheld the 15 December 2009 ruling by
the General Court of the European Union.
Solaire Direct
On 19 May 2008, Solaire Direct filed a complaint and an application for protective measures with
France’s Competition Council (Autorité de la Concurrence), alleging that the EDF group had made
improper use of its dominant position on the various electricity markets to penetrate the
comprehensive services market for shared photovoltaic electricity generation via its subsidiary EDF
Énergies Nouvelles Réparties (“EDF ENR”).
In February 2009, the Competition Council passed protective measures concerning the marketing
methods for comprehensive photovoltaic energy services by EDF ENR, and decided to examine the
substance of Solaire Direct’s complaint.
- 54 -
On 30 May 2012, EDF received a statement of objection from the Competition Council, now
renamed the Competition Authority. This marks the first step in an adversarial procedure for which
the final outcome cannot be predicted. If at the end of the investigation the Authority concludes
that EDF was using anti-competitive practices, it could impose a financial penalty in application of
the provisions of article L.464-2 of the French Commercial Code. The potential maximum sanction
is 10% of the company’s worldwide sales (excluding taxes).
Litigation with photovoltaic energy producers
The announcement by the French authorities in autumn 2009 of a coming reduction in the
photovoltaic electricity purchase prices set by the order of 10 July 2006 caused an upsurge in
applications for purchase contracts that was likely to generate a very significant increase in costs
to be compensated by the CSPE. The French Government therefore issued a series of decisions
modifying both the purchase tariffs for electricity generated from photovoltaic energy and their
terms of application. By a decree of 9 December 2010, it also temporarily suspended the purchase
obligation for photovoltaic electricity. A certain number of producers responded to this situation
by bringing action claiming the benefit of the more favourable tariff conditions set out by the
previous order of 10 July 2006. The most significant of these litigations concerns the Green Yellow
companies, some twenty subsidiaries of the Casino retail group, which litigation has already given
rise to two decisions by the Conflicts Tribunal and two rulings by the Commercial Court on 11 July
2011 and 29 June 2012. This most recent ruling approved the claimants’ position and ordered EDF
to offer contracts at the former tariff.
In Corsica and in French overseas territories where EDF is also the network operator, some twenty
producers have also brought claims for compensation for the shortfall in earnings they consider
they have suffered due to delays in connection procedures that allegedly resulted in them being
subject to the purchase obligation suspension.
Vent de Colère – Appeal against the decision of 17 November 2008 setting wind power
purchase tariffs
Following an appeal by the association “Vent de Colère” against the decision of 17 November
2008 setting the purchase tariffs for wind power, the French Council of State suspended judgment
and submitted a prejudicial question to the Court of Justice of the European Union, on the point
of whether the purchase obligation financing system based on the CSPE should be considered as
intervention by the State or through State resources as defined in the EU Treaty provisions
concerning State aid, for the purposes of application of the treaty.
- 55 -
Packaging and interim storage installation for radioactive waste (ICEDA)
A decree of 23 April 2010 authorised EDF to open a regulated nuclear installation, a conditioning
and interim storage installation for radioactive waste, in the town of Saint-Vulbas, in the Ain
département. Two petitions for cancellation of the decree were filed with the French Council of
State in June 2010, one by Roozen, a horticultural company operating near the site, and the other
by a group of environmental protection associations. As of the date of the filing of this report, the
investigation is still pending with the French Council of State. A third petition was filed in April
2012 before the Council of State by the city of Geneva. EDF has not yet received full details.
Roozen also filed a petition with the Lyon Administrative Court on 21 April 2010 seeking
cancellation of the building permit for the storage installation issued by decision of the Ain
authorities on 22 February 2010. In a judgment of 13 December 2011, the Administrative Court
cancelled the building permit due to violation of the zoning plan for the town concerned. EDF
lodged an appeal with the Lyon Administrative Court of Appeal, also requesting a suspension for
implementation of the judgment. In a ruling of 19 June 2012, the Court confirmed cancellation of
the building permit. The town of Saint Vulbas has also initiated a review of its local zoning plan,
and EDF is preparing a new building permit application.
SOCODEI
The CENTRACO low-level waste processing and conditioning centre operated by SOCODEI, a fully-
owned EDF subsidiary, treats waste with low radioactivity by fusion or incineration. On 12
September 2011, an explosion in a waste fusion furnace caused a fire that killed one person and
injured four others. The accident did not cause any chemical or radioactive discharge. The ASN
classified this accident at level 1 on the international nuclear event scale (INES) and decided on 27
September 2011 to require advance authorisation for the fusion furnaces and incinerators shut
down just after the accident to be brought back into operation. On 29 June 2012 the ASN
authorised SOCODEI to restart the incinerator, provided it first sends the ASN a full report of
compliance verifications carried out for the furnace safety equipment. The fusion unit where the
accident happened is still inactive.
Several inquiries were opened after this accident. On 16 September 2011 the Nimes prosecutor’s
office began a criminal investigation for manslaughter and involuntary injury, which is still in
process. The findings of the inquiries by the labour authorities and the ASN have been sent to the
prosecutor’s office and a court-approved expert has been appointed.
- 56 -
8.2. PROCEEDINGS CONCERNING EDF’S SUBSIDIARIES AND AFFILIATES
8.2.1 ERDF
Litigation with photovoltaic producers
The very fast growth in the photovoltaic sector and changes in the regulatory context described in
section 8.1 generated a large volume of legal proceedings against ERDF in late 2011, mostly
brought by energy producers in connection with the less favourable tariffs that applied to them.
A large number of commercial courts declared themselves incompetent to judge these cases, but
some did consider themselves competent and seven rulings on the substance of the claims have
been issued by two commercial courts. These rulings declared ERDF liable, but the total
compensation awarded is non-significant and well below the amounts claimed by the producers.
ERDF has appealed against these decisions, considering that it cannot be held liable, notably in
view of the high volume of applications for connection it had received.
8.2.2 EnBW
Arbitration request by the Baden-Württemberg region
On 22 February 2012 EDF International received a request for arbitration filed with the
International Chamber of Commerce by the German company Neckarpri GmBH, the vehicle for the
Baden-Württemberg region’s acquisition of EDF’s stake in EnBW, which was agreed on 6
December 2010 and completed on 17 February 2011.
Neckarpri claims that the price paid for EDF International‘s investment in EnBW was excessive and
therefore constitutes illegal State aid. On those grounds, it is claiming reimbursement of the
allegedly excess portion of the price. This was initially estimated at €2 billion in the request for
arbitration, but was re-estimated at €840 million on 11 July 2012 in a new independent report on
the valuation of EnBW commissioned by Baden-Württemberg. Should the reimbursement claim be
rejected, as an alternative, Neckarpri is seeking cancellation of the sale of the EDF group’s
investment in EnBW.
EDF considers this claim unfounded and a misuse of law, and intends to sue for damages for all
the kinds of prejudices caused by this action.
8.2.3 Edison
Carlo Tassara SpA, Edison’s largest minority shareholder, initiated action on 12 July 2012 before
the Lazio (Rome) Regional Administrative Court, seeking an increase in the price of the mandatory
tender offer for Edison shares launched by EDF’s subsidiary Transalpina di Energia (TdE) after the
- 57 -
takeover of Edison on 24 May 2012. While awaiting a ruling on the substance of the case, Carlo
Tassara is also petitioning for suspension of the Italian financial market authority CONSOB’s
decision of 3 May 2012 which allowed TdE to launch the offer at the price of €0.89 per share, and
therefore suspension of the offer currently in process. This action has been brought against the
CONSOB itself, EDF and its Italian subsidiaries (MNTC, WGRM4 and TdE), Edison, Delmi and A2A.
At the court hearing on the question of suspension held on 25 July 2012, the court rejected the
petition for suspension as the CONSOB had not given any decision in response to Carlo Tassara’s
application for an increase in the offer price (see below). A further hearing has therefore been
scheduled for 30 August 2012. Given the specific circumstances of these proceedings, whatever
the court decides regarding suspension, its decision regarding the question of the €0.89 offer
price is not expected to be issued before late 2012 at the soonest.
There is no precedent for a court ruling overturning a decision by the CONSOB once it has
confirmed the launch of a mandatory offer. EDF considers that Carlo Tassara has not provided any
new evidence that calls into question the offer price as confirmed by the CONSOB, and that these
proceedings are unfounded.
In parallel, on 31 May 2012 Carlo Tassara submitted an application to the CONSOB for an increase
in the price of the mandatory tender offer. The deadline for the CONSOB’s reply is 3 August 2012.
The arguments put forward by Carlo Tassara to support his application are practically identical to
those used in the court proceedings described above.
9. FINANCIAL OUTLOOK
The net financial debt/ EBITDA ratio was 2.5x at 30 June 2012, which is the maximum amount set
by the Group. In order to reach its debt target, the Group continues to work to resolve the
question of the CSPE deficit and will review, before the end of 2012, its cost and capex trajectory,
excluding safety.
In this context, the Group can confirm its financial objectives for 2011-2015:
Average annual growth in EBITDA31 of between 4% and 6%,
Average annual growth in net income excluding non-recurring items of between 5% and
10%,
Net indebtedness/EBITDA ratio of less than 2.5x over the period,
A dividend distribution rate of between 55% and 65% over the period.
31 Growth based on constant scope of consolidation and exchange rates.
- 58 -
The 2012 objectives are coherent with these aims. The dividend for 2012 will be at least stable
compared to the dividend paid for 2011.
Page 59
Board of directors’ meeting of 30 July 2012
CONDENSED CONSOLIDATED
HALF-YEAR FINANCIAL STATEMENTS
AT 30 JUNE 2012
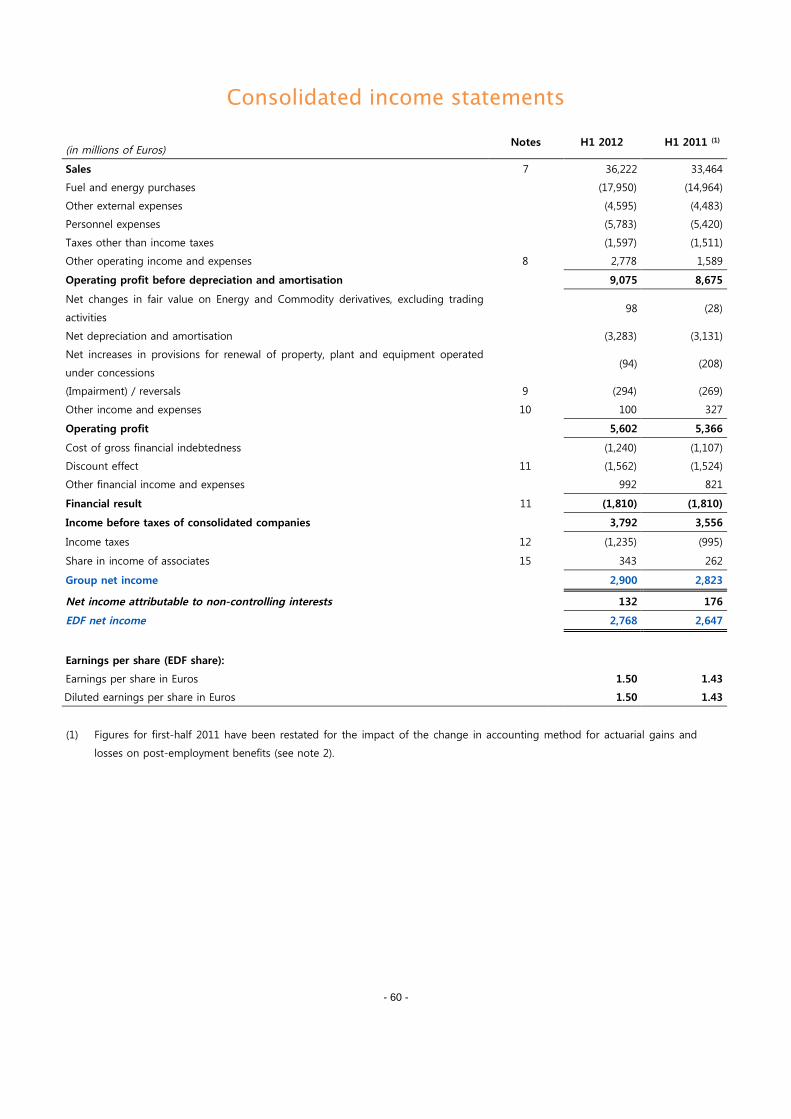
- 60 -
Consolidated income statements
(in millions of Euros)Notes H1 2012 H1 2011 (1)
Sales 7 36,222 33,464
Fuel and energy purchases (17,950) (14,964)
Other external expenses (4,595) (4,483)
Personnel expenses (5,783) (5,420)
Taxes other than income taxes (1,597) (1,511)
Other operating income and expenses 8 2,778 1,589
Operating profit before depreciation and amortisation 9,075 8,675
Net changes in fair value on Energy and Commodity derivatives, excluding trading
activities98 (28)
Net depreciation and amortisation (3,283) (3,131)
Net increases in provisions for renewal of property, plant and equipment operated
under concessions(94) (208)
(Impairment) / reversals 9 (294) (269)
Other income and expenses 10 100 327
Operating profit 5,602 5,366
Cost of gross financial indebtedness (1,240) (1,107)
Discount effect 11 (1,562) (1,524)
Other financial income and expenses 992 821
Financial result 11 (1,810) (1,810)
Income before taxes of consolidated companies 3,792 3,556
Income taxes 12 (1,235) (995)
Share in income of associates 15 343 262
Group net income 2,900 2,823
Net income attributable to non-controlling interests 132 176
EDF net income 2,768 2,647
Earnings per share (EDF share):
Earnings per share in Euros 1.50 1.43
Diluted earnings per share in Euros 1.50 1.43
(1) Figures for first-half 2011 have been restated for the impact of the change in accounting method for actuarial gains and
losses on post-employment benefits (see note 2).
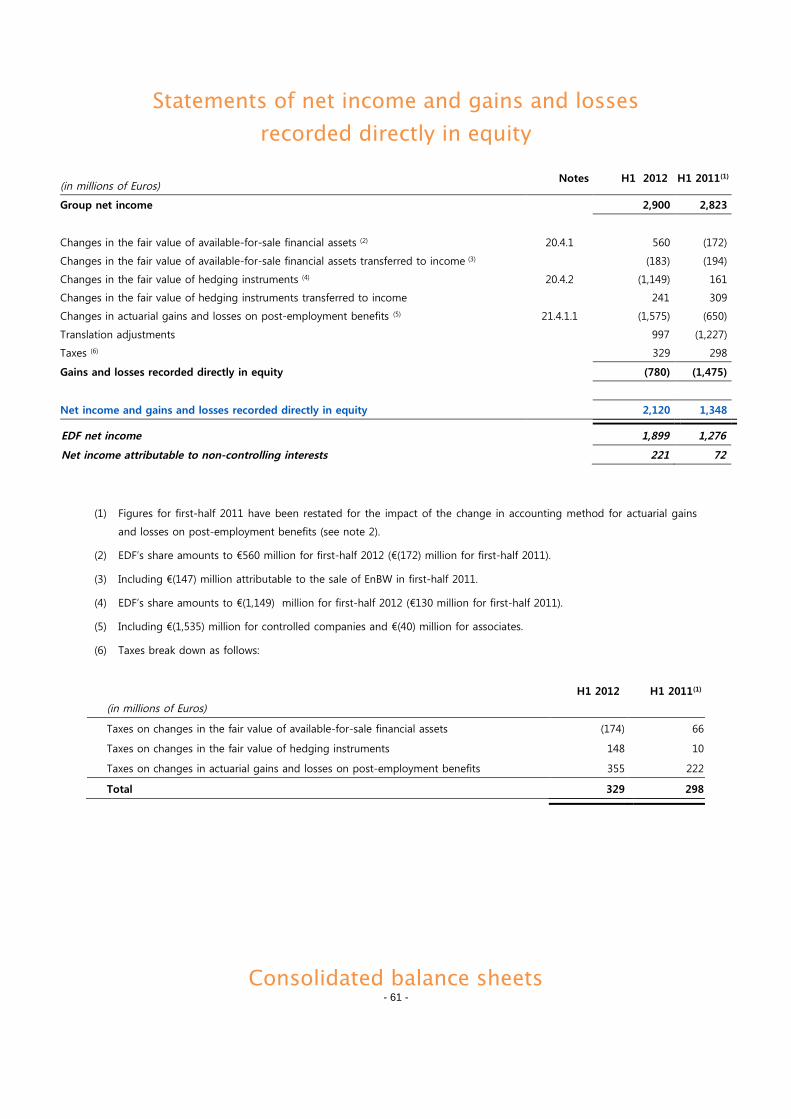
- 61 -
Statements of net income and gains and losses
recorded directly in equity
(in millions of Euros)Notes H1 2012 H1 2011(1)
Group net income 2,900 2,823
Changes in the fair value of available-for-sale financial assets (2) 20.4.1 560 (172)
Changes in the fair value of available-for-sale financial assets transferred to income (3) (183) (194)
Changes in the fair value of hedging instruments (4) 20.4.2 (1,149) 161
Changes in the fair value of hedging instruments transferred to income 241 309
Changes in actuarial gains and losses on post-employment benefits (5) 21.4.1.1 (1,575) (650)
Translation adjustments 997 (1,227)
Taxes (6) 329 298
Gains and losses recorded directly in equity (780) (1,475)
Net income and gains and losses recorded directly in equity 2,120 1,348
EDF net income 1,899 1,276
Net income attributable to non-controlling interests 221 72
(1) Figures for first-half 2011 have been restated for the impact of the change in accounting method for actuarial gains
and losses on post-employment benefits (see note 2).
(2) EDF’s share amounts to €560 million for first-half 2012 (€(172) million for first-half 2011).
(3) Including €(147) million attributable to the sale of EnBW in first-half 2011.
(4) EDF’s share amounts to €(1,149) million for first-half 2012 (€130 million for first-half 2011).
(5) Including €(1,535) million for controlled companies and €(40) million for associates.
(6) Taxes break down as follows:
(in millions of Euros)
H1 2012 H1 2011(1)
Taxes on changes in the fair value of available-for-sale financial assets (174) 66
Taxes on changes in the fair value of hedging instruments 148 10
Taxes on changes in actuarial gains and losses on post-employment benefits 355 222
Total 329 298
Consolidated balance sheets
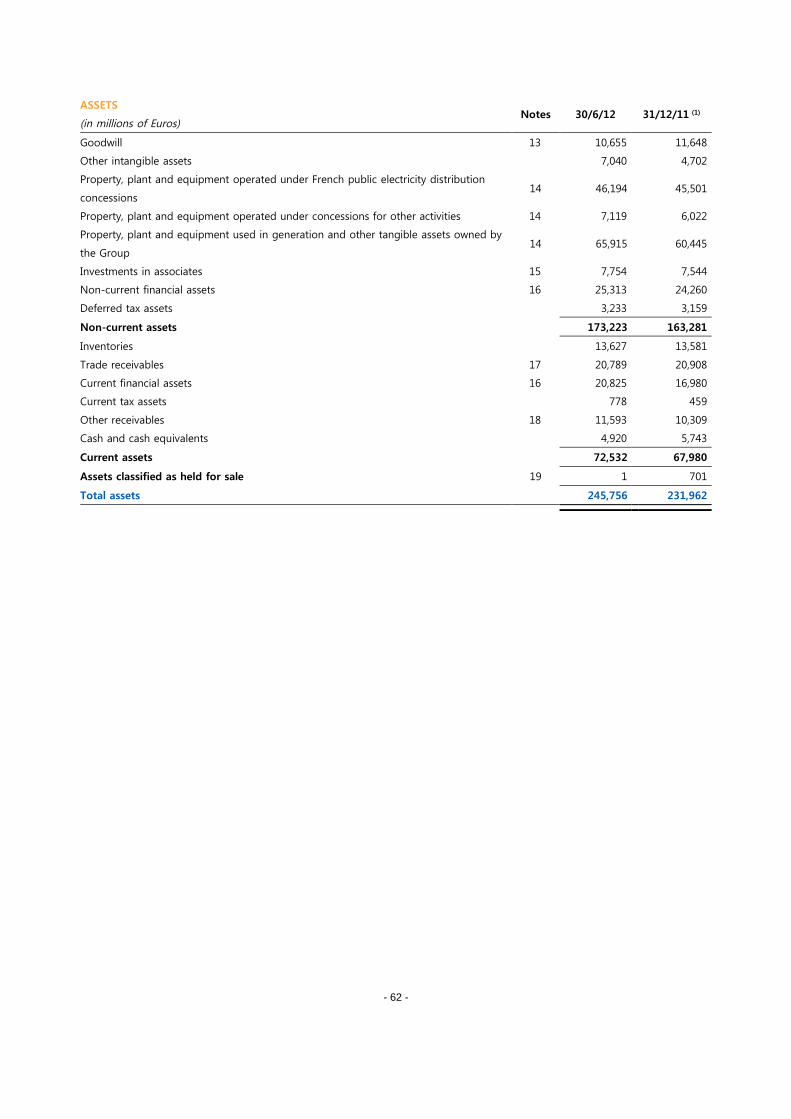
- 62 -
ASSETS
(in millions of Euros)Notes 30/6/12 31/12/11 (1)
Goodwill 13 10,655 11,648
Other intangible assets 7,040 4,702
Property, plant and equipment operated under French public electricity distribution
concessions14 46,194 45,501
Property, plant and equipment operated under concessions for other activities 14 7,119 6,022
Property, plant and equipment used in generation and other tangible assets owned by
the Group14 65,915 60,445
Investments in associates 15 7,754 7,544
Non-current financial assets 16 25,313 24,260
Deferred tax assets 3,233 3,159
Non-current assets 173,223 163,281
Inventories 13,627 13,581
Trade receivables 17 20,789 20,908
Current financial assets 16 20,825 16,980
Current tax assets 778 459
Other receivables 18 11,593 10,309
Cash and cash equivalents 4,920 5,743
Current assets 72,532 67,980
Assets classified as held for sale 19 1 701
Total assets 245,756 231,962
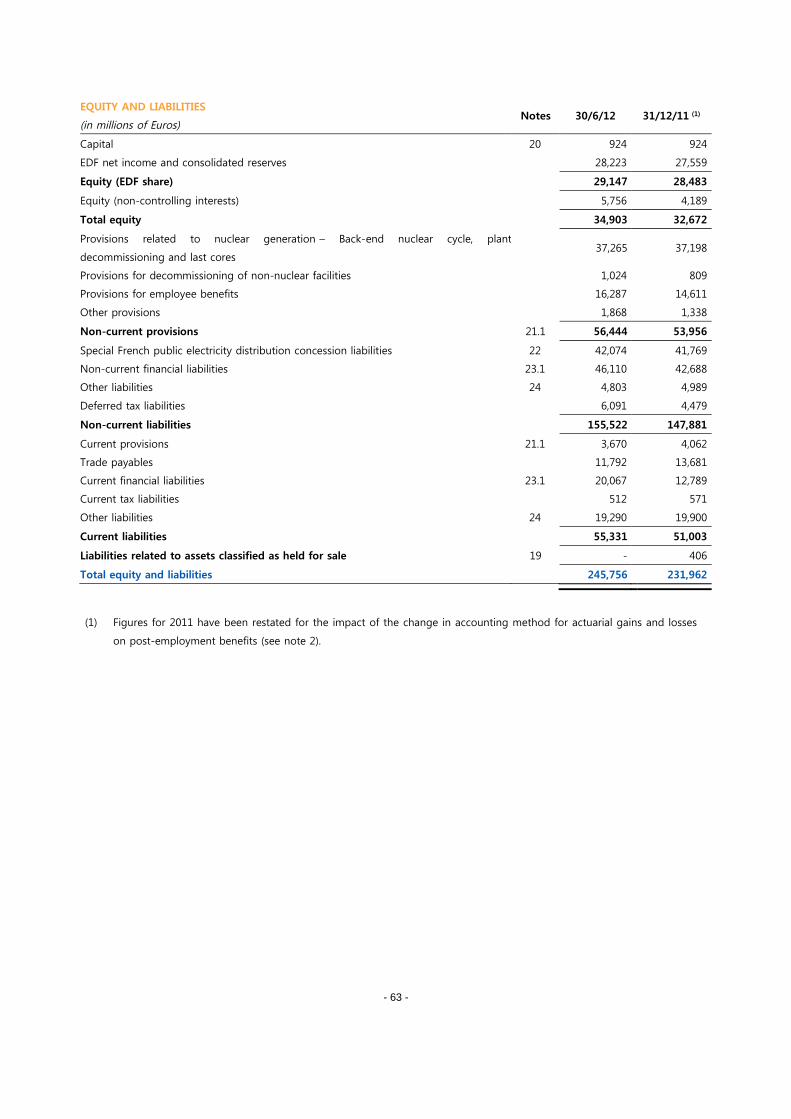
- 63 -
EQUITY AND LIABILITIES
(in millions of Euros)Notes 30/6/12 31/12/11 (1)
Capital 20 924 924
EDF net income and consolidated reserves 28,223 27,559
Equity (EDF share) 29,147 28,483
Equity (non-controlling interests) 5,756 4,189
Total equity 34,903 32,672
Provisions related to nuclear generation – Back-end nuclear cycle, plant
decommissioning and last cores37,265 37,198
Provisions for decommissioning of non-nuclear facilities 1,024 809
Provisions for employee benefits 16,287 14,611
Other provisions 1,868 1,338
Non-current provisions 21.1 56,444 53,956
Special French public electricity distribution concession liabilities 22 42,074 41,769
Non-current financial liabilities 23.1 46,110 42,688
Other liabilities 24 4,803 4,989
Deferred tax liabilities 6,091 4,479
Non-current liabilities 155,522 147,881
Current provisions 21.1 3,670 4,062
Trade payables 11,792 13,681
Current financial liabilities 23.1 20,067 12,789
Current tax liabilities 512 571
Other liabilities 24 19,290 19,900
Current liabilities 55,331 51,003
Liabilities related to assets classified as held for sale 19 - 406
Total equity and liabilities 245,756 231,962
(1) Figures for 2011 have been restated for the impact of the change in accounting method for actuarial gains and losses
on post-employment benefits (see note 2).
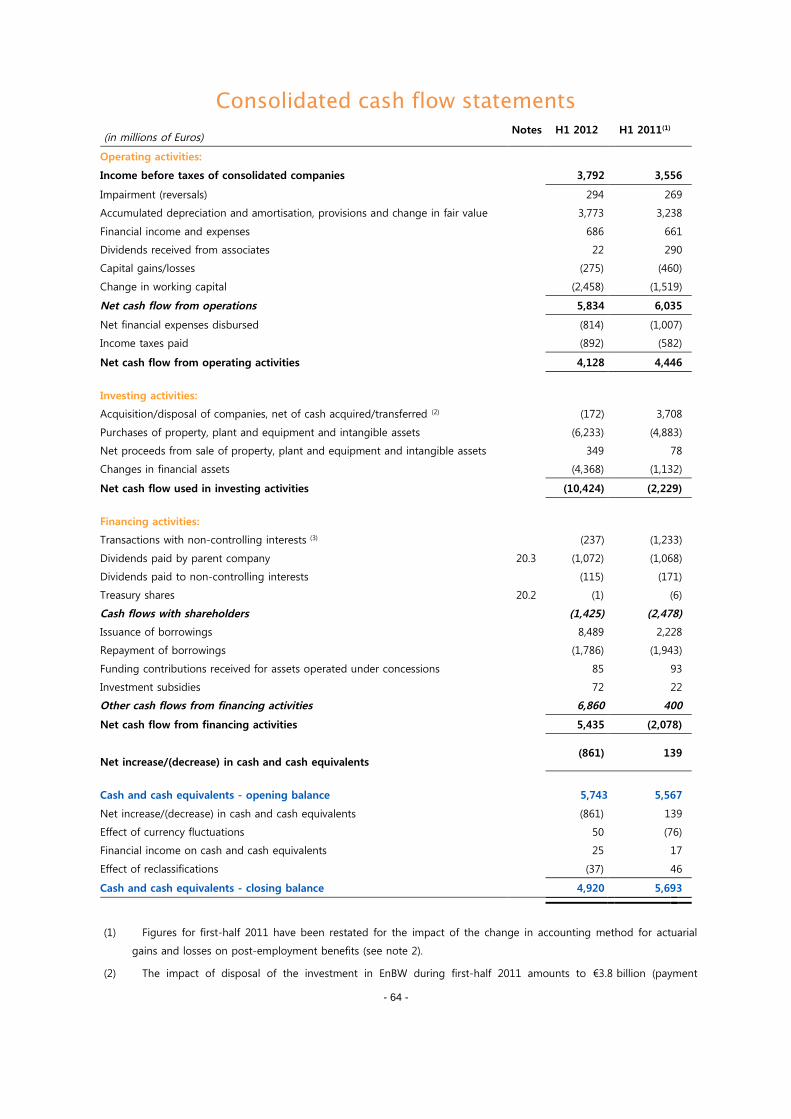
- 64 -
Consolidated cash flow statements
(in millions of Euros)Notes H1 2012 H1 2011(1)
Operating activities:
Income before taxes of consolidated companies 3,792 3,556
Impairment (reversals) 294 269
Accumulated depreciation and amortisation, provisions and change in fair value 3,773 3,238
Financial income and expenses 686 661
Dividends received from associates 22 290
Capital gains/losses (275) (460)
Change in working capital (2,458) (1,519)
Net cash flow from operations 5,834 6,035
Net financial expenses disbursed (814) (1,007)
Income taxes paid (892) (582)
Net cash flow from operating activities 4,128 4,446
Investing activities:
Acquisition/disposal of companies, net of cash acquired/transferred (2) (172) 3,708
Purchases of property, plant and equipment and intangible assets (6,233) (4,883)
Net proceeds from sale of property, plant and equipment and intangible assets 349 78
Changes in financial assets (4,368) (1,132)
Net cash flow used in investing activities (10,424) (2,229)
Financing activities:
Transactions with non-controlling interests (3) (237) (1,233)
Dividends paid by parent company 20.3 (1,072) (1,068)
Dividends paid to non-controlling interests (115) (171)
Treasury shares 20.2 (1) (6)
Cash flows with shareholders (1,425) (2,478)
Issuance of borrowings 8,489 2,228
Repayment of borrowings (1,786) (1,943)
Funding contributions received for assets operated under concessions 85 93
Investment subsidies 72 22
Other cash flows from financing activities 6,860 400
Net cash flow from financing activities 5,435 (2,078)
Net increase/(decrease) in cash and cash equivalents(861) 139
Cash and cash equivalents - opening balance 5,743 5,567
Net increase/(decrease) in cash and cash equivalents (861) 139
Effect of currency fluctuations 50 (76)
Financial income on cash and cash equivalents 25 17
Effect of reclassifications (37) 46
Cash and cash equivalents - closing balance 4,920 5,693
(1) Figures for first-half 2011 have been restated for the impact of the change in accounting method for actuarial
gains and losses on post-employment benefits (see note 2).
(2) The impact of disposal of the investment in EnBW during first-half 2011 amounts to €3.8 billion (payment
- 65 -
received of €4.5 billion net of €0.7 billion cash transferred in the sale).
(3) Contributions via capital increases or reductions and acquisitions of additional interests in controlled companies.
In first-half 2012, acquisition of additional interests in EnBW’s investment in its subsidiary ERSA amount to
€252 million (see note 5.1).
In first-half 2011, the acquisition of additional interests through the simplified alternative public cash or exchange
offer for EDF Energies Nouvelles shares accounts for €1,292 million: €1,045 million in cash and €247 million in
shares through the associated EDF share repurchase program.
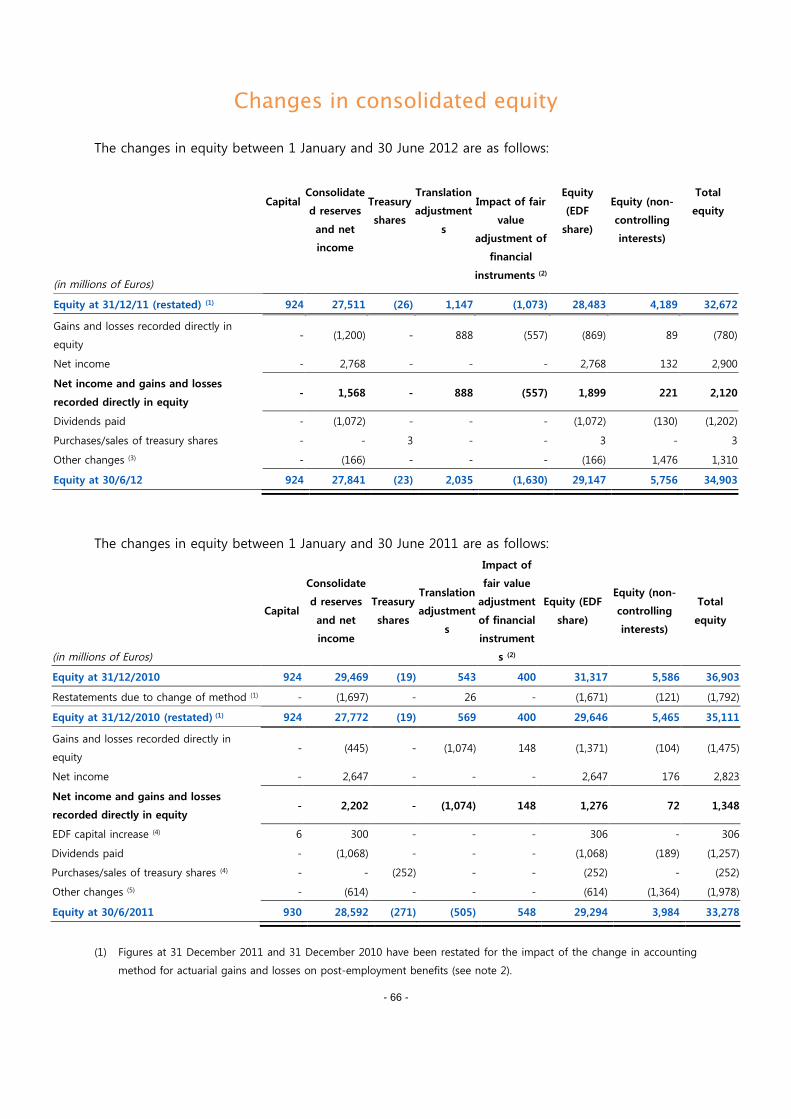
- 66 -
Changes in consolidated equity
The changes in equity between 1 January and 30 June 2012 are as follows:
(in millions of Euros)
CapitalConsolidate
d reserves
and net
income
Treasury
shares
Translation
adjustment
s
Impact of fair
value
adjustment of
financial
instruments (2)
Equity
(EDF
share)
Equity (non-
controlling
interests)
Total
equity
Equity at 31/12/11 (restated) (1) 924 27,511 (26) 1,147 (1,073) 28,483 4,189 32,672
Gains and losses recorded directly in
equity- (1,200) - 888 (557) (869) 89 (780)
Net income - 2,768 - - - 2,768 132 2,900
Net income and gains and losses
recorded directly in equity- 1,568 - 888 (557) 1,899 221 2,120
Dividends paid - (1,072) - - - (1,072) (130) (1,202)
Purchases/sales of treasury shares - - 3 - - 3 - 3
Other changes (3) - (166) - - - (166) 1,476 1,310
Equity at 30/6/12 924 27,841 (23) 2,035 (1,630) 29,147 5,756 34,903
The changes in equity between 1 January and 30 June 2011 are as follows:
(in millions of Euros)
Capital
Consolidate
d reserves
and net
income
Treasury
shares
Translation
adjustment
s
Impact of
fair value
adjustment
of financial
instrument
s (2)
Equity (EDF
share)
Equity (non-
controlling
interests)
Total
equity
Equity at 31/12/2010 924 29,469 (19) 543 400 31,317 5,586 36,903
Restatements due to change of method (1) - (1,697) - 26 - (1,671) (121) (1,792)
Equity at 31/12/2010 (restated) (1) 924 27,772 (19) 569 400 29,646 5,465 35,111
Gains and losses recorded directly in
equity- (445) - (1,074) 148 (1,371) (104) (1,475)
Net income - 2,647 - - - 2,647 176 2,823
Net income and gains and losses
recorded directly in equity- 2,202 - (1,074) 148 1,276 72 1,348
EDF capital increase (4) 6 300 - - - 306 - 306
Dividends paid - (1,068) - - - (1,068) (189) (1,257)
Purchases/sales of treasury shares (4) - - (252) - - (252) - (252)
Other changes (5) - (614) - - - (614) (1,364) (1,978)
Equity at 30/6/2011 930 28,592 (271) (505) 548 29,294 3,984 33,278
(1) Figures at 31 December 2011 and 31 December 2010 have been restated for the impact of the change in accounting
method for actuarial gains and losses on post-employment benefits (see note 2).
- 67 -
(2) These changes correspond to the effects of fair value adjustment of available-for-sale financial assets and amounts
transferred to income following changes in their fair value, and the effects of fair value adjustment of hedging
instruments and amounts transferred to income in respect of terminated contracts. For details see the statement of
net income and gains and losses recorded directly in equity.
(3) In first-half 2012, €1,387 million of other changes attributable to non-controlling interests correspond to the effects of
the takeover of Edison (held 78.96% at 30 June 2012), including €991 million for direct minority shareholdings.
(4) EDF’s capital increase and the higher treasury share purchases during first-half 2011 relate to the simplified alternative
public cash or exchange offer for shares of EDF Energies Nouvelles.
(5) In first-half 2011, other changes (EDF's share and the share attributable to non-controlling interests) include €(688)
million and €(764) million respectively reflecting the effects of acquisition of minority shareholdings in EDF Energies
Nouvelles. Other changes in equity attributable to non-controlling interests also include the effects of deconsolidation
of EnBW, amounting to €(519) million.
- 68 -
NOTES TO THE CONDENSED CONSOLIDATED
FINANCIAL STATEMENTS
Electricité de France (EDF or “the Company”) is a French société anonyme governed by French
Law, and registered in France.
The EDF group is an integrated energy company operating in all types of energy businesses:
generation, transmission, distribution, supply and trading of energies.
The Company’s condensed consolidated half-year financial statements at 30 June 2012 include the
accounts of companies directly or indirectly under the exclusive control of the Company and its
subsidiaries, which are fully consolidated, the accounts of jointly-controlled companies (joint
ventures), which are proportionally consolidated, and the accounts of companies in which the
Company exercises significant influence (associates), which are accounted for under the equity
method. All these economic entities are collectively referred to as the “Group”.
The Group’s condensed consolidated financial statements at 30 June 2012 were prepared under
the responsibility of the Board of Directors and approved by the Directors at the Board meeting
held
on 30 July 2012.
The comparative figures for 2011 reported in the notes to the financial statements have been
restated as a result of the change in accounting method for actuarial gains and losses on post-
employment benefits (see note 2).
1. MAIN GROUP ACCOUNTING PRINCIPLES AND METHODS
1.1 DECLARATION OF CONFORMITY AND GROUP ACCOUNTING POLICIES
Pursuant to European regulation 1606/2002 of 19 July 2002 on the adoption of international
accounting standards, the EDF group’s condensed consolidated financial statements at 30 June
2012 are prepared using the presentation, recognition and measurement rules set forth in the
international accounting standards published by the IASB and approved by the European Union
for application at 30 June 2012. These international standards are IAS (International Accounting
Standards), IFRS (International Financial Reporting Standards), and SIC and IFRIC interpretations.
The condensed consolidated half-year financial statements comply with standard IAS 34 on interim
- 69 -
financial reporting. They do not therefore include all the information required for full annual
financial statements, and are to be read in conjunction with the consolidated financial statements
at 31 December 2011.
Apart from the changes indicated below, the accounting principles and methods are identical to
those applied in the consolidated financial statements at 31 December 2011, as described in
note 1 to those financial statements.
1.2 ACCOUNTING METHODS FOR THE FIRST HALF-YEAR OF 2012
Change of accounting option concerning recognition of actuarial gains and losses on
post-employment benefits
IAS 19 allows the following methods for recognition of actuarial gains and losses on post-
employment defined benefit plans:
- Either the full amount of such gains and losses, or a portion as determined under the
“corridor” method, is recorded through the income statement; the Group applied this
approach until 31 December 2011;
- Or they are recorded in full through other components of net income and gains and
losses recorded directly in equity.
The Group decided to use the option to record actuarial gains and losses for post-employment
benefits in the statement of net income and gains and losses recorded directly in equity from 1
January 2012. The Group considers that this change will make information on post-employment
benefits clearer and more comprehensible.
This change of accounting option is applied retrospectively, as required by IAS 8. Note 2 presents
a description of this change of accounting method and calculations of its principal effects.
New standards and interpretations
Apart from the change presented above and the valuation methods specific to interim financial
statements described in note 1.3, the accounting and valuation methods applied by the Group in
the consolidated interim financial statements at 30 June 2012 are identical to those used in the
consolidated financial statements for the year ended 31 December 2011.
The amendment to IFRS 7, “Financial instruments: disclosures – Transfers of financial assets”
adopted by the European Union in 2011 became mandatory on 1 January 2012. As IFRS 7
concerns disclosures, this amendment has no impact on the accounting methods applied in the
consolidated financial statements.
The Group has not opted for early application of any standards, amendments or interpretation.
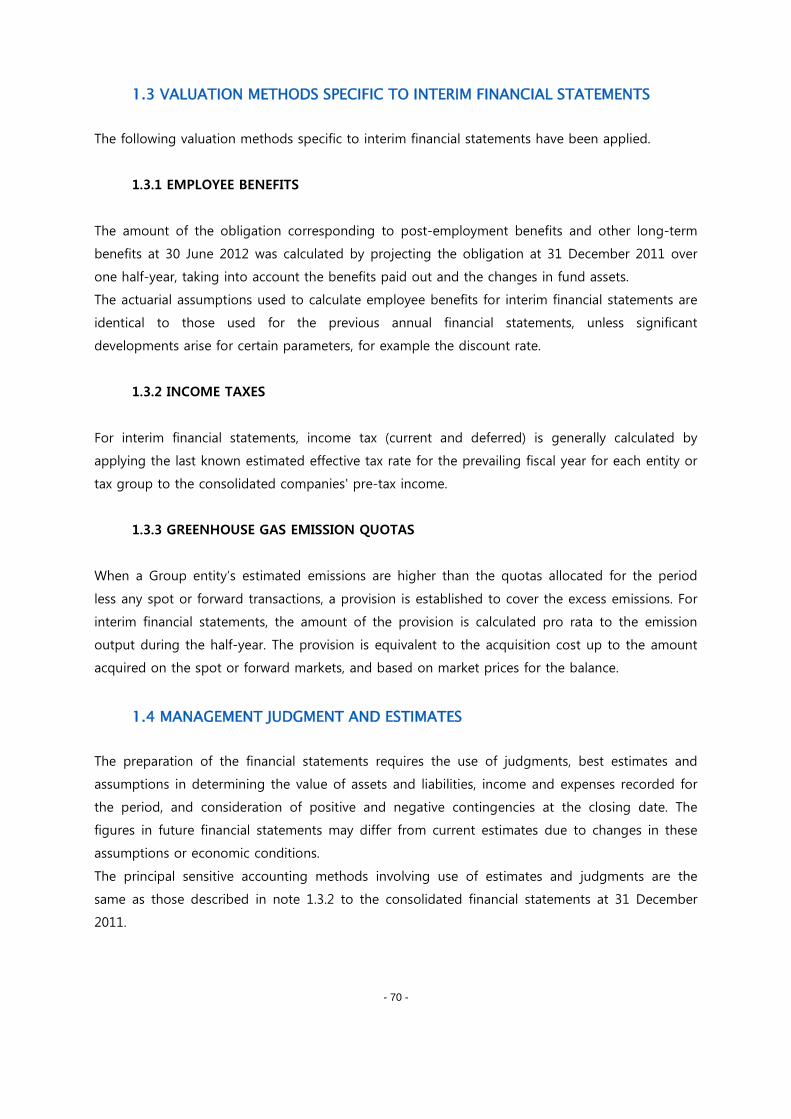
- 70 -
1.3 VALUATION METHODS SPECIFIC TO INTERIM FINANCIAL STATEMENTS
The following valuation methods specific to interim financial statements have been applied.
1.3.1 EMPLOYEE BENEFITS
The amount of the obligation corresponding to post-employment benefits and other long-term
benefits at 30 June 2012 was calculated by projecting the obligation at 31 December 2011 over
one half-year, taking into account the benefits paid out and the changes in fund assets.
The actuarial assumptions used to calculate employee benefits for interim financial statements are
identical to those used for the previous annual financial statements, unless significant
developments arise for certain parameters, for example the discount rate.
1.3.2 INCOME TAXES
For interim financial statements, income tax (current and deferred) is generally calculated by
applying the last known estimated effective tax rate for the prevailing fiscal year for each entity or
tax group to the consolidated companies' pre-tax income.
1.3.3 GREENHOUSE GAS EMISSION QUOTAS
When a Group entity’s estimated emissions are higher than the quotas allocated for the period
less any spot or forward transactions, a provision is established to cover the excess emissions. For
interim financial statements, the amount of the provision is calculated pro rata to the emission
output during the half-year. The provision is equivalent to the acquisition cost up to the amount
acquired on the spot or forward markets, and based on market prices for the balance.
1.4 MANAGEMENT JUDGMENT AND ESTIMATES
The preparation of the financial statements requires the use of judgments, best estimates and
assumptions in determining the value of assets and liabilities, income and expenses recorded for
the period, and consideration of positive and negative contingencies at the closing date. The
figures in future financial statements may differ from current estimates due to changes in these
assumptions or economic conditions.
The principal sensitive accounting methods involving use of estimates and judgments are the
same as those described in note 1.3.2 to the consolidated financial statements at 31 December
2011.
- 71 -
1.5 SEASONAL NATURE OF THE BUSINESS
Interim sales and operating profit before depreciation and amortisation are affected by significant
seasonal factors in the calendar year, principally in France. The variations observed are mainly
associated with the weather conditions and tariff structures specific to each period.
To illustrate this, the table below shows the sales and operating profit before depreciation and
amortisation for the first half and second half of 2011:
(in millions of Euros) H1 2011 H2 2011 2011
Sales 33,464 31,843 65,307
Operating profit before depreciation and amortisation 8,675 6,264 14,939
2. COMPARABILITY
2.1 CHANGE IN RECOGNITION OF ACTUARIAL GAINS AND LOSSES RELATED TO
POST-EMPLOYMENT BENEFITS
Since 1 January 2012, the Group has recorded actuarial gains and losses related to post-
employment defined benefit plans in the statement of net income and gains and losses recorded
directly in equity, under the option allowed by IAS 19.
Under this option, all actuarial gains and losses on post-employment benefits generated by
changes in actuarial assumptions are recognised in the statement of net income and gains and
losses recorded directly in equity. The Group has thus stopped using the “corridor” method and
now recognises all actuarial gains and losses in full.
As this is a change of accounting method, in compliance with IAS 8, comparative prior year figures
resulting from retrospective application of this method are presented.
The impact on equity (EDF share) amounts to € (1,671) million at 1 January 2011 and €
(2,087) million at 31 December 2011.
The impact at 1 January 2011 mainly concerns the France and United Kingdom segments (€
(1,010) million and € (566) million respectively).
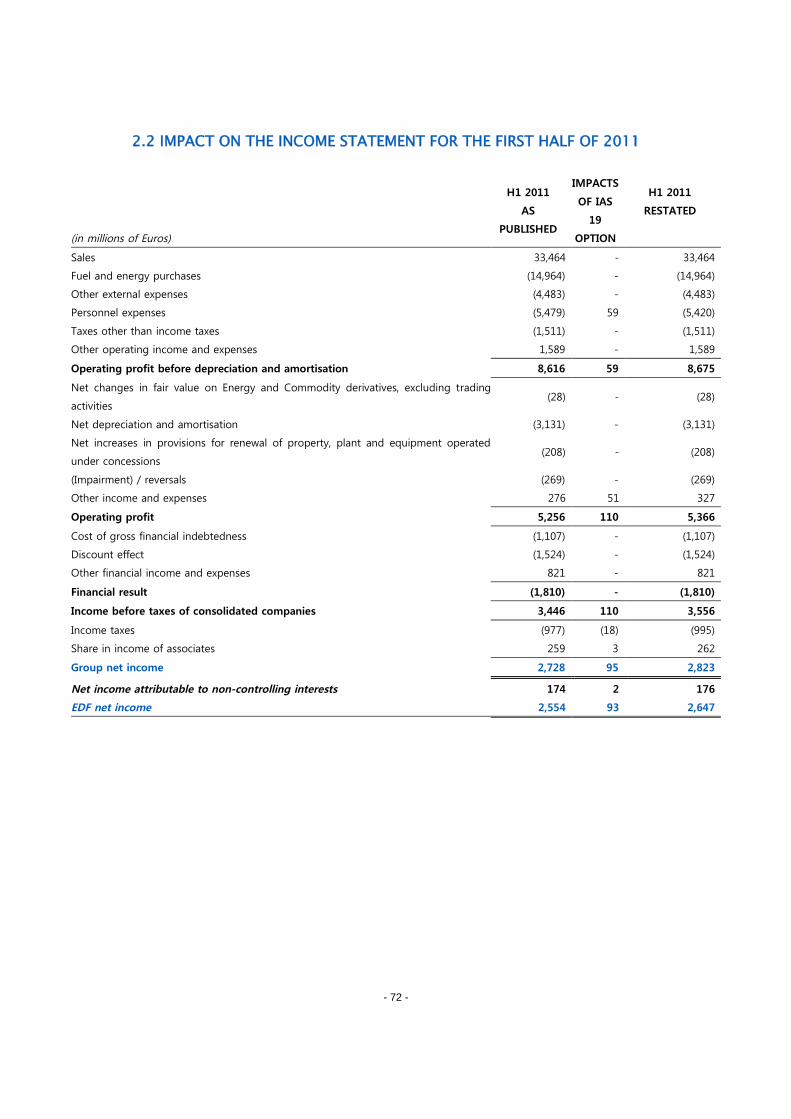
- 72 -
2.2 IMPACT ON THE INCOME STATEMENT FOR THE FIRST HALF OF 2011
(in millions of Euros)
H1 2011
AS
PUBLISHED
IMPACTS
OF IAS
19
OPTION
H1 2011
RESTATED
Sales 33,464 - 33,464
Fuel and energy purchases (14,964) - (14,964)
Other external expenses (4,483) - (4,483)
Personnel expenses (5,479) 59 (5,420)
Taxes other than income taxes (1,511) - (1,511)
Other operating income and expenses 1,589 - 1,589
Operating profit before depreciation and amortisation 8,616 59 8,675
Net changes in fair value on Energy and Commodity derivatives, excluding trading
activities(28) - (28)
Net depreciation and amortisation (3,131) - (3,131)
Net increases in provisions for renewal of property, plant and equipment operated
under concessions(208) - (208)
(Impairment) / reversals (269) - (269)
Other income and expenses 276 51 327
Operating profit 5,256 110 5,366
Cost of gross financial indebtedness (1,107) - (1,107)
Discount effect (1,524) - (1,524)
Other financial income and expenses 821 - 821
Financial result (1,810) - (1,810)
Income before taxes of consolidated companies 3,446 110 3,556
Income taxes (977) (18) (995)
Share in income of associates 259 3 262
Group net income 2,728 95 2,823
Net income attributable to non-controlling interests 174 2 176
EDF net income 2,554 93 2,647
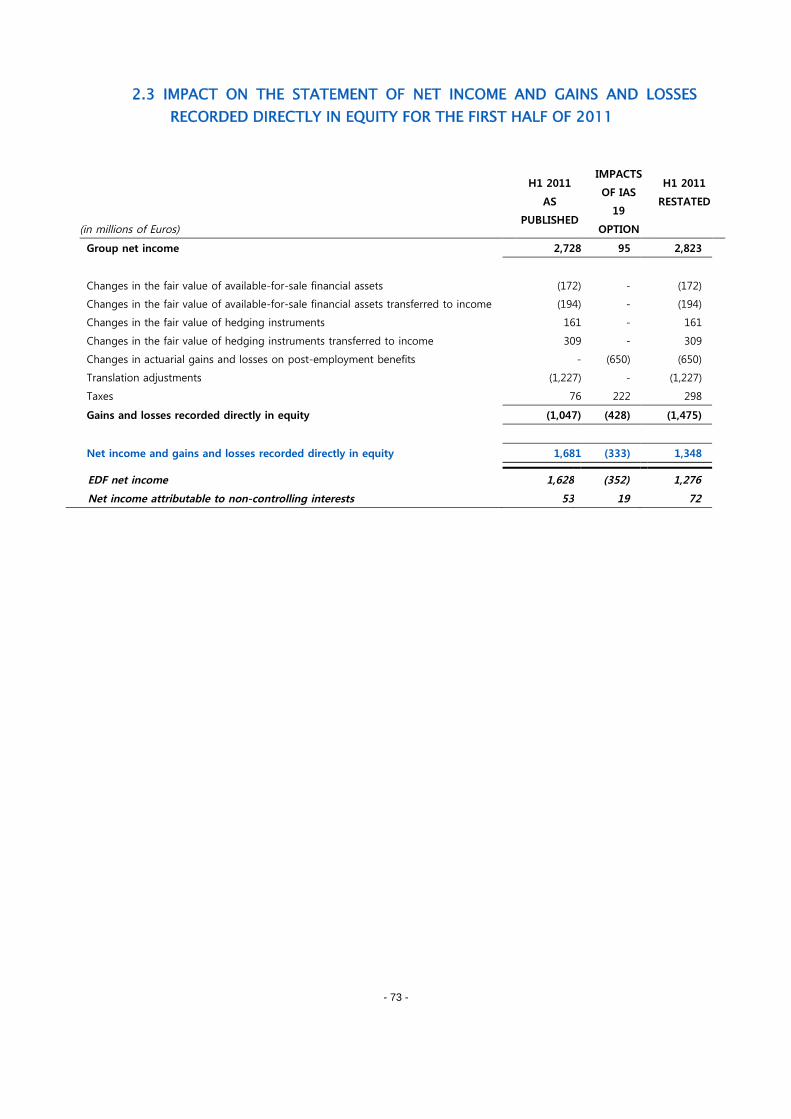
- 73 -
2.3 IMPACT ON THE STATEMENT OF NET INCOME AND GAINS AND LOSSES
RECORDED DIRECTLY IN EQUITY FOR THE FIRST HALF OF 2011
(in millions of Euros)
H1 2011
AS
PUBLISHED
IMPACTS
OF IAS
19
OPTION
H1 2011
RESTATED
Group net income 2,728 95 2,823
Changes in the fair value of available-for-sale financial assets (172) - (172)
Changes in the fair value of available-for-sale financial assets transferred to income (194) - (194)
Changes in the fair value of hedging instruments 161 - 161
Changes in the fair value of hedging instruments transferred to income 309 - 309
Changes in actuarial gains and losses on post-employment benefits - (650) (650)
Translation adjustments (1,227) - (1,227)
Taxes 76 222 298
Gains and losses recorded directly in equity (1,047) (428) (1,475)
Net income and gains and losses recorded directly in equity 1,681 (333) 1,348
EDF net income 1,628 (352) 1,276
Net income attributable to non-controlling interests 53 19 72
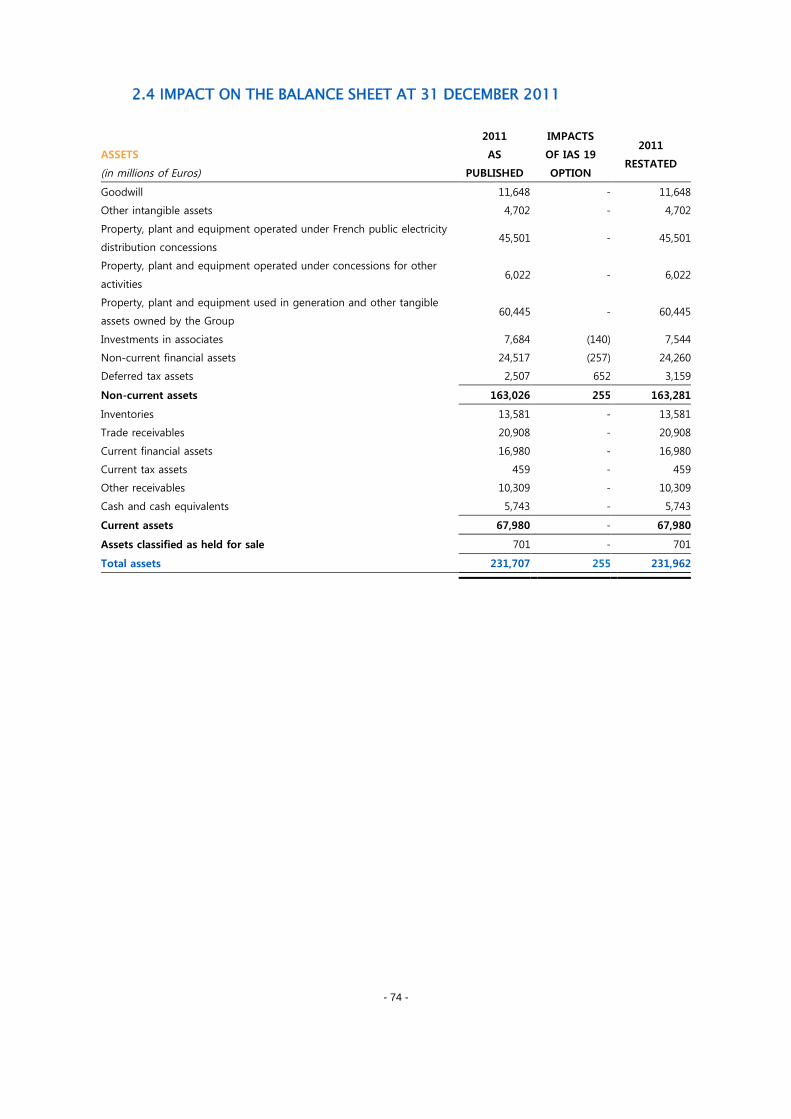
- 74 -
2.4 IMPACT ON THE BALANCE SHEET AT 31 DECEMBER 2011
ASSETS
(in millions of Euros)
2011
AS
PUBLISHED
IMPACTS
OF IAS 19
OPTION
2011
RESTATED
Goodwill 11,648 - 11,648
Other intangible assets 4,702 - 4,702
Property, plant and equipment operated under French public electricity
distribution concessions45,501 - 45,501
Property, plant and equipment operated under concessions for other
activities6,022 - 6,022
Property, plant and equipment used in generation and other tangible
assets owned by the Group60,445 - 60,445
Investments in associates 7,684 (140) 7,544
Non-current financial assets 24,517 (257) 24,260
Deferred tax assets 2,507 652 3,159
Non-current assets 163,026 255 163,281
Inventories 13,581 - 13,581
Trade receivables 20,908 - 20,908
Current financial assets 16,980 - 16,980
Current tax assets 459 - 459
Other receivables 10,309 - 10,309
Cash and cash equivalents 5,743 - 5,743
Current assets 67,980 - 67,980
Assets classified as held for sale 701 - 701
Total assets 231,707 255 231,962
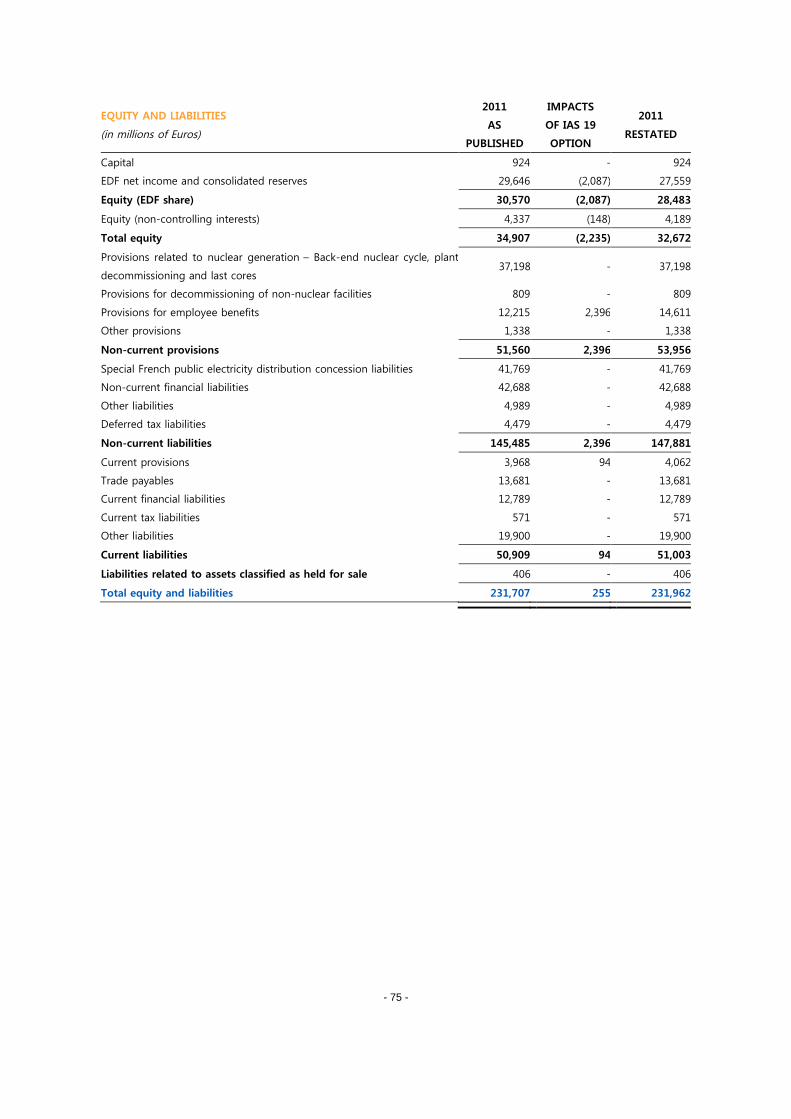
- 75 -
EQUITY AND LIABILITIES
(in millions of Euros)
2011
AS
PUBLISHED
IMPACTS
OF IAS 19
OPTION
2011
RESTATED
Capital 924 - 924
EDF net income and consolidated reserves 29,646 (2,087) 27,559
Equity (EDF share) 30,570 (2,087) 28,483
Equity (non-controlling interests) 4,337 (148) 4,189
Total equity 34,907 (2,235) 32,672
Provisions related to nuclear generation – Back-end nuclear cycle, plant
decommissioning and last cores37,198 - 37,198
Provisions for decommissioning of non-nuclear facilities 809 - 809
Provisions for employee benefits 12,215 2,396 14,611
Other provisions 1,338 - 1,338
Non-current provisions 51,560 2,396 53,956
Special French public electricity distribution concession liabilities 41,769 - 41,769
Non-current financial liabilities 42,688 - 42,688
Other liabilities 4,989 - 4,989
Deferred tax liabilities 4,479 - 4,479
Non-current liabilities 145,485 2,396 147,881
Current provisions 3,968 94 4,062
Trade payables 13,681 - 13,681
Current financial liabilities 12,789 - 12,789
Current tax liabilities 571 - 571
Other liabilities 19,900 - 19,900
Current liabilities 50,909 94 51,003
Liabilities related to assets classified as held for sale 406 - 406
Total equity and liabilities 231,707 255 231,962
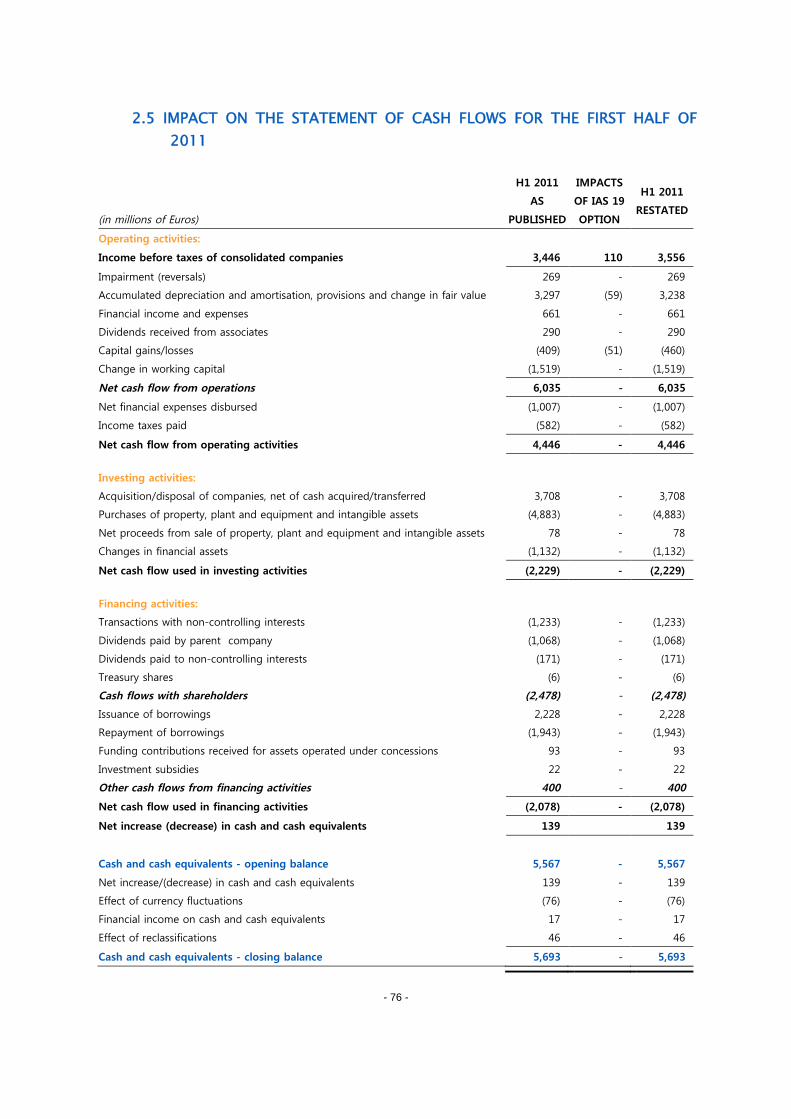
- 76 -
2.5 IMPACT ON THE STATEMENT OF CASH FLOWS FOR THE FIRST HALF OF
2011
(in millions of Euros)
H1 2011
AS
PUBLISHED
IMPACTS
OF IAS 19
OPTION
H1 2011
RESTATED
Operating activities:
Income before taxes of consolidated companies 3,446 110 3,556
Impairment (reversals) 269 - 269
Accumulated depreciation and amortisation, provisions and change in fair value 3,297 (59) 3,238
Financial income and expenses 661 - 661
Dividends received from associates 290 - 290
Capital gains/losses (409) (51) (460)
Change in working capital (1,519) - (1,519)
Net cash flow from operations 6,035 - 6,035
Net financial expenses disbursed (1,007) - (1,007)
Income taxes paid (582) - (582)
Net cash flow from operating activities 4,446 - 4,446
Investing activities:
Acquisition/disposal of companies, net of cash acquired/transferred 3,708 - 3,708
Purchases of property, plant and equipment and intangible assets (4,883) - (4,883)
Net proceeds from sale of property, plant and equipment and intangible assets 78 - 78
Changes in financial assets (1,132) - (1,132)
Net cash flow used in investing activities (2,229) - (2,229)
Financing activities:
Transactions with non-controlling interests (1,233) - (1,233)
Dividends paid by parent company (1,068) - (1,068)
Dividends paid to non-controlling interests (171) - (171)
Treasury shares (6) - (6)
Cash flows with shareholders (2,478) - (2,478)
Issuance of borrowings 2,228 - 2,228
Repayment of borrowings (1,943) - (1,943)
Funding contributions received for assets operated under concessions 93 - 93
Investment subsidies 22 - 22
Other cash flows from financing activities 400 - 400
Net cash flow used in financing activities (2,078) - (2,078)
Net increase (decrease) in cash and cash equivalents 139 139
Cash and cash equivalents - opening balance 5,567 - 5,567
Net increase/(decrease) in cash and cash equivalents 139 - 139
Effect of currency fluctuations (76) - (76)
Financial income on cash and cash equivalents 17 - 17
Effect of reclassifications 46 - 46
Cash and cash equivalents - closing balance 5,693 - 5,693
- 77 -
3. SIGNIFICANT EVENTS AND TRANSACTIONS OF THE FIRST HALF-YEAR OF
2012
3.1 EDISON
3.1.1 Takeover of Edison by the EDF group
Following fulfilment of the conditions for the operation, on 24 May 2012 the EDF group and its
Italian partners finalised the takeover of the energy group Edison. The principles of the final
agreement are consistent with the preliminary agreement signed by the parties on 26 December
2011.
The Group thus took control of Edison by purchasing Delmi’s entire investment in TdE (50%) for a
total of €784 million, corresponding to the negotiated price of €0.89 per Edison share. Following
this acquisition the Group now holds 78.96% of the capital and 80.64% of the voting rights in
Edison.
At the same time as EDF took control of Edison, Delmi took control of Edipower by purchasing the
investments in Edipower held by Edison (50%) and ALPIQ (20%) for the total sum of €884 million.
Edison and Edipower also signed a long-term (6-year) gas supply contract to cover 50% of
Edipower’s gas requirements.
In compliance with Italian stock market regulations, the EDF Group launched a mandatory tender
offer for remaining Edison shares at the price of €0.89 per ordinary share. The additional cost of
raising this offer price from the €0.84 envisaged in the preliminary agreement of 26 December
2011 will be borne equally by the EDF group and Delmi, totalling a maximum of €24 million for
each, depending on the number of shares tendered to the offer. This offer was opened on 2 July
2012 and is due to close on 3 August 2012 unless extended.
3.1.2 Accounting treatment of the operation
The purchase of 50% of TdE from Delmi gave the EDF group control over the Edison group and
TdE as of 24 May 2012. Although the mandatory tender offer for Edison shares launched on 2 July
2012 is an inevitable consequence of acquisition of TdE under Italian stock market regulations, for
accounting purposes it has been considered as a separate operation from the takeover of Edison,
since:
Minority shareholders remain free to accept or refuse the offer;
Control was acquired on 24 May 2012, independently of the number of shares minority
shareholders will tender to the offer, and cannot be called into question.
- 78 -
Consequently, as required by IFRS 3 (revised) (IFRS 3), the identifiable assets and liabilities
acquired from Edison and TdE are recorded at fair value at the date control was acquired. The
Group has opted to state non-controlling interests at fair value in application of the “full goodwill”
method.
In accordance with IFRS 3, the values determined are provisional and the Group has 12 months to
finalise allocation of the acquisition price.
Delmi’s share of the cost of the mandatory tender offer for Edison shares has been considered as
a purchase price adjustment clause for the investment in TdE/Edison.
Application of IFRS 3 to the takeover of Edison and TdE is therefore reflected in the following
items in the Group’s consolidated financial statements:
A loss on sale of €(1,090) million resulting from remeasurement of the previous holding in
Edison to “market participant(32)“ fair value at the date control was acquired,
Negative goodwill of €1,023 million.
Since the price for the sale of Edison’s investment in Edipower to Delmi was higher than defined
in the preliminary agreement of 26 December 2011, a reversal of impairment has been booked in
the first-half 2012 income statement for a total amount of €39 million (EDF’s share).
Finally, acquisition expenses amounting to €(23) million before taxes were recognised in first-half
2012.
Overall, the takeover of Edison and TdE thus generates a €(51) million expense recognised in the
first-half 2012 consolidated income statement under “Other income and expenses”.
3.1.3 Determination of the loss on sale of the previously-held investment
In application of IFRS 3, a loss on sale is recognised, equal to the difference between the net
consolidated value and the “market participant” fair value for the Group’s investment in the Edison
and TdE subgroups at the date of the takeover.
The “market participant” fair value is the Edison share value on the market, i.e. the transaction
price with Delmi and minority shareholders through the mandatory tender offer launched on 2
July 2012 (€0.89 per share).
32 The “market participant” fair value is the amount for which an asset could be exchanged between knowledgeable, willing
parties in an arm’s length transaction.
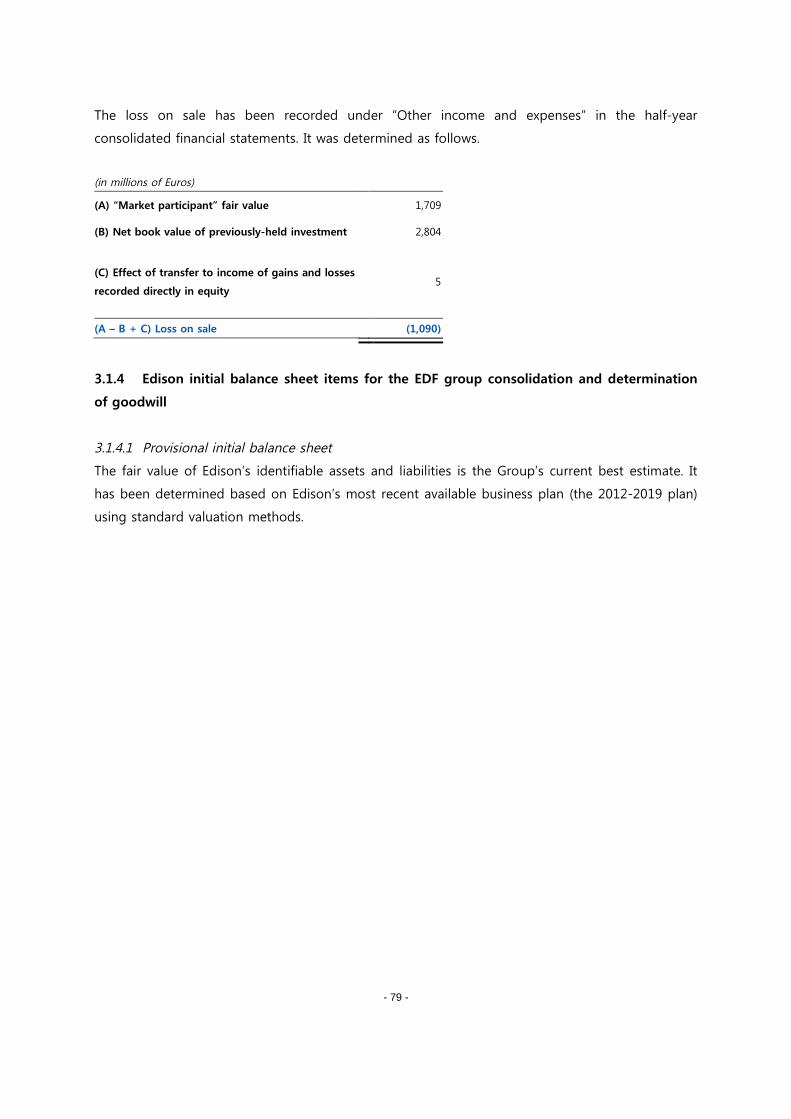
- 79 -
The loss on sale has been recorded under “Other income and expenses” in the half-year
consolidated financial statements. It was determined as follows.
(in millions of Euros)
(A) “Market participant” fair value 1,709
(B) Net book value of previously-held investment 2,804
(C) Effect of transfer to income of gains and losses
recorded directly in equity5
(A – B + C) Loss on sale (1,090)
3.1.4 Edison initial balance sheet items for the EDF group consolidation and determination
of goodwill
3.1.4.1 Provisional initial balance sheet
The fair value of Edison’s identifiable assets and liabilities is the Group’s current best estimate. It
has been determined based on Edison’s most recent available business plan (the 2012-2019 plan)
using standard valuation methods.
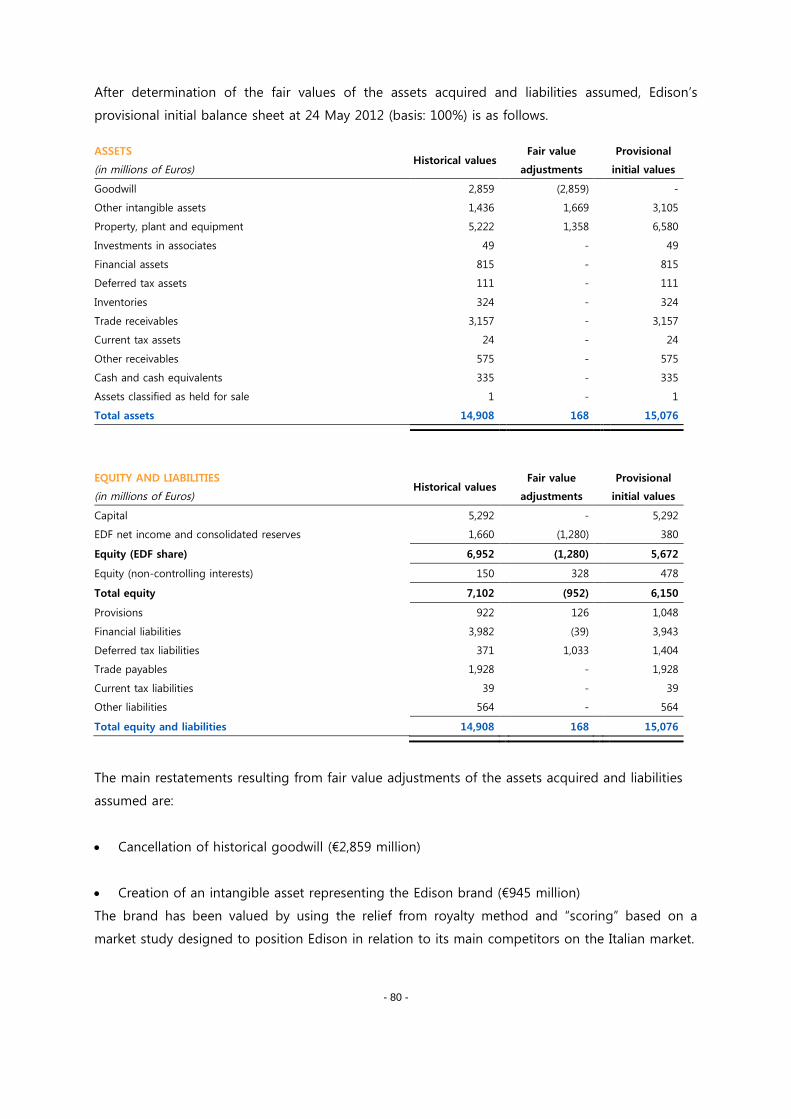
- 80 -
After determination of the fair values of the assets acquired and liabilities assumed, Edison’s
provisional initial balance sheet at 24 May 2012 (basis: 100%) is as follows.
ASSETS
(in millions of Euros)Historical values
Fair value
adjustments
Provisional
initial values
Goodwill 2,859 (2,859) -
Other intangible assets 1,436 1,669 3,105
Property, plant and equipment 5,222 1,358 6,580
Investments in associates 49 - 49
Financial assets 815 - 815
Deferred tax assets 111 - 111
Inventories 324 - 324
Trade receivables 3,157 - 3,157
Current tax assets 24 - 24
Other receivables 575 - 575
Cash and cash equivalents 335 - 335
Assets classified as held for sale 1 - 1
Total assets 14,908 168 15,076
EQUITY AND LIABILITIES
(in millions of Euros)Historical values
Fair value
adjustments
Provisional
initial values
Capital 5,292 - 5,292
EDF net income and consolidated reserves 1,660 (1,280) 380
Equity (EDF share) 6,952 (1,280) 5,672
Equity (non-controlling interests) 150 328 478
Total equity 7,102 (952) 6,150
Provisions 922 126 1,048
Financial liabilities 3,982 (39) 3,943
Deferred tax liabilities 371 1,033 1,404
Trade payables 1,928 - 1,928
Current tax liabilities 39 - 39
Other liabilities 564 - 564
Total equity and liabilities 14,908 168 15,076
The main restatements resulting from fair value adjustments of the assets acquired and liabilities
assumed are:
Cancellation of historical goodwill (€2,859 million)
Creation of an intangible asset representing the Edison brand (€945 million)
The brand has been valued by using the relief from royalty method and “scoring” based on a
market study designed to position Edison in relation to its main competitors on the Italian market.
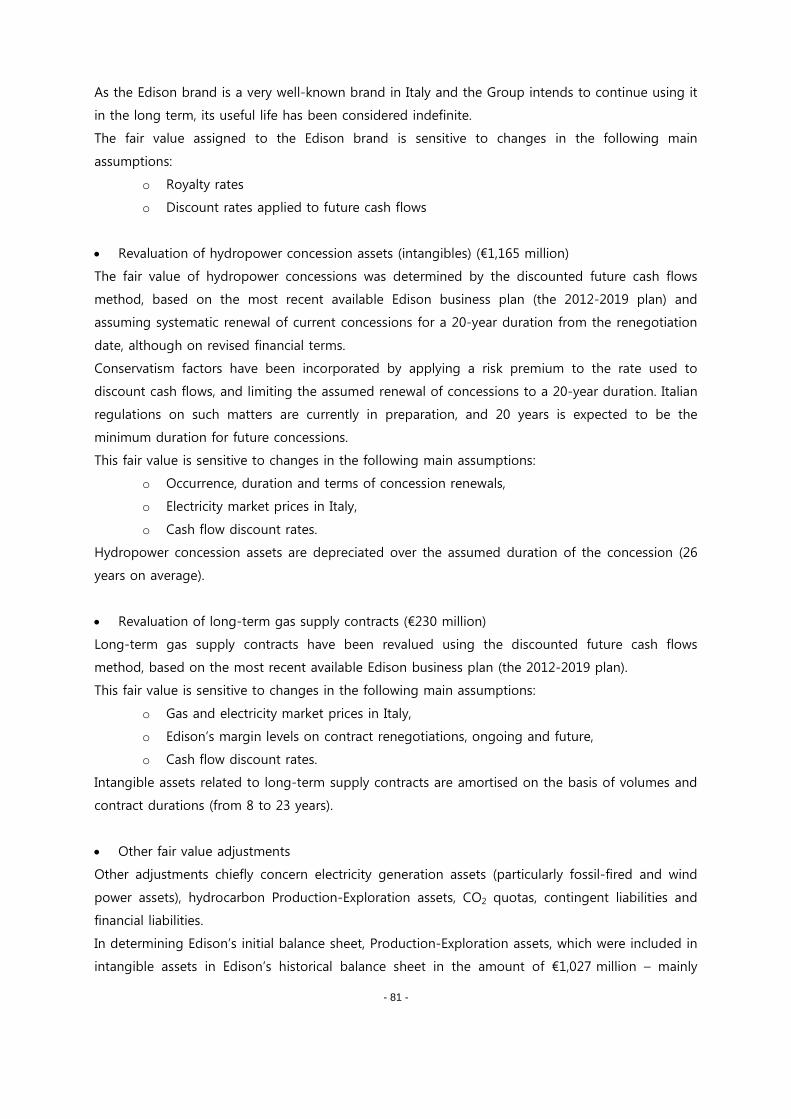
- 81 -
As the Edison brand is a very well-known brand in Italy and the Group intends to continue using it
in the long term, its useful life has been considered indefinite.
The fair value assigned to the Edison brand is sensitive to changes in the following main
assumptions:
o Royalty rates
o Discount rates applied to future cash flows
Revaluation of hydropower concession assets (intangibles) (€1,165 million)
The fair value of hydropower concessions was determined by the discounted future cash flows
method, based on the most recent available Edison business plan (the 2012-2019 plan) and
assuming systematic renewal of current concessions for a 20-year duration from the renegotiation
date, although on revised financial terms.
Conservatism factors have been incorporated by applying a risk premium to the rate used to
discount cash flows, and limiting the assumed renewal of concessions to a 20-year duration. Italian
regulations on such matters are currently in preparation, and 20 years is expected to be the
minimum duration for future concessions.
This fair value is sensitive to changes in the following main assumptions:
o Occurrence, duration and terms of concession renewals,
o Electricity market prices in Italy,
o Cash flow discount rates.
Hydropower concession assets are depreciated over the assumed duration of the concession (26
years on average).
Revaluation of long-term gas supply contracts (€230 million)
Long-term gas supply contracts have been revalued using the discounted future cash flows
method, based on the most recent available Edison business plan (the 2012-2019 plan).
This fair value is sensitive to changes in the following main assumptions:
o Gas and electricity market prices in Italy,
o Edison’s margin levels on contract renegotiations, ongoing and future,
o Cash flow discount rates.
Intangible assets related to long-term supply contracts are amortised on the basis of volumes and
contract durations (from 8 to 23 years).
Other fair value adjustments
Other adjustments chiefly concern electricity generation assets (particularly fossil-fired and wind
power assets), hydrocarbon Production-Exploration assets, CO2 quotas, contingent liabilities and
financial liabilities.
In determining Edison’s initial balance sheet, Production-Exploration assets, which were included in
intangible assets in Edison’s historical balance sheet in the amount of €1,027 million – mainly
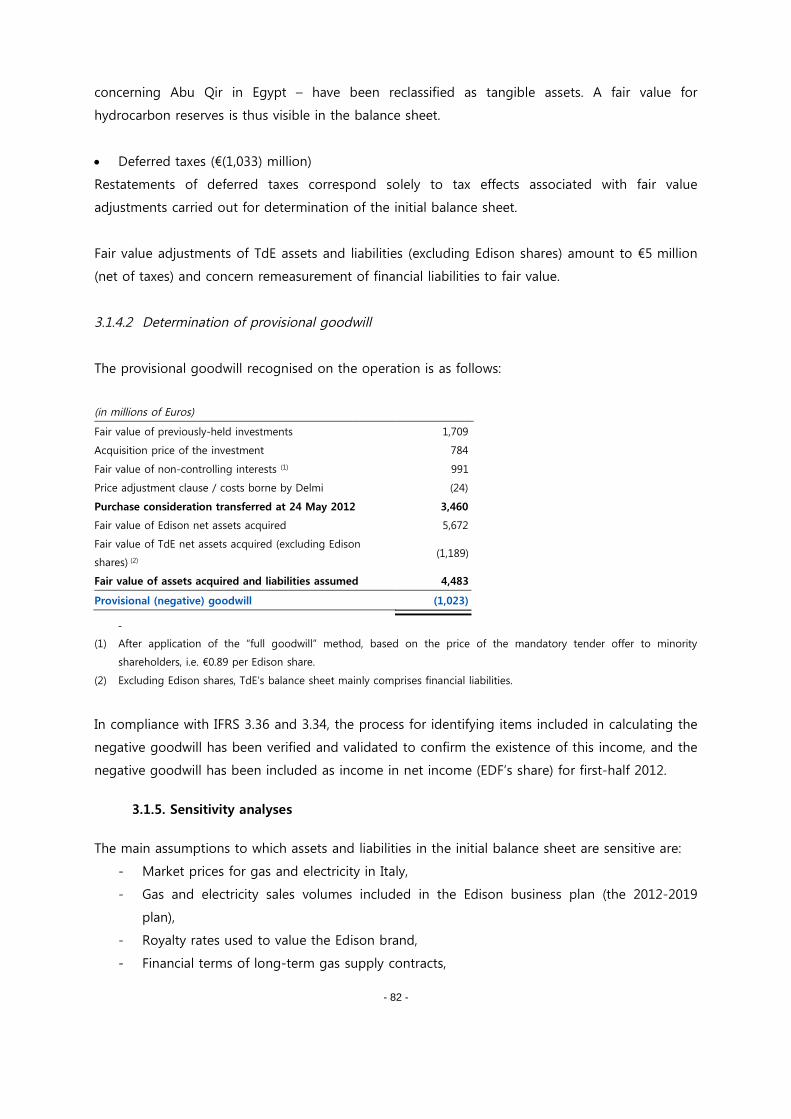
- 82 -
concerning Abu Qir in Egypt – have been reclassified as tangible assets. A fair value for
hydrocarbon reserves is thus visible in the balance sheet.
Deferred taxes (€(1,033) million)
Restatements of deferred taxes correspond solely to tax effects associated with fair value
adjustments carried out for determination of the initial balance sheet.
Fair value adjustments of TdE assets and liabilities (excluding Edison shares) amount to €5 million
(net of taxes) and concern remeasurement of financial liabilities to fair value.
3.1.4.2 Determination of provisional goodwill
The provisional goodwill recognised on the operation is as follows:
(in millions of Euros)
Fair value of previously-held investments 1,709
Acquisition price of the investment 784
Fair value of non-controlling interests (1) 991
Price adjustment clause / costs borne by Delmi (24)
Purchase consideration transferred at 24 May 2012 3,460
Fair value of Edison net assets acquired 5,672
Fair value of TdE net assets acquired (excluding Edison
shares) (2)(1,189)
Fair value of assets acquired and liabilities assumed 4,483
Provisional (negative) goodwill (1,023)
-
(1) After application of the “full goodwill” method, based on the price of the mandatory tender offer to minority
shareholders, i.e. €0.89 per Edison share.
(2) Excluding Edison shares, TdE’s balance sheet mainly comprises financial liabilities.
In compliance with IFRS 3.36 and 3.34, the process for identifying items included in calculating the
negative goodwill has been verified and validated to confirm the existence of this income, and the
negative goodwill has been included as income in net income (EDF’s share) for first-half 2012.
3.1.5. Sensitivity analyses
The main assumptions to which assets and liabilities in the initial balance sheet are sensitive are:
- Market prices for gas and electricity in Italy,
- Gas and electricity sales volumes included in the Edison business plan (the 2012-2019
plan),
- Royalty rates used to value the Edison brand,
- Financial terms of long-term gas supply contracts,
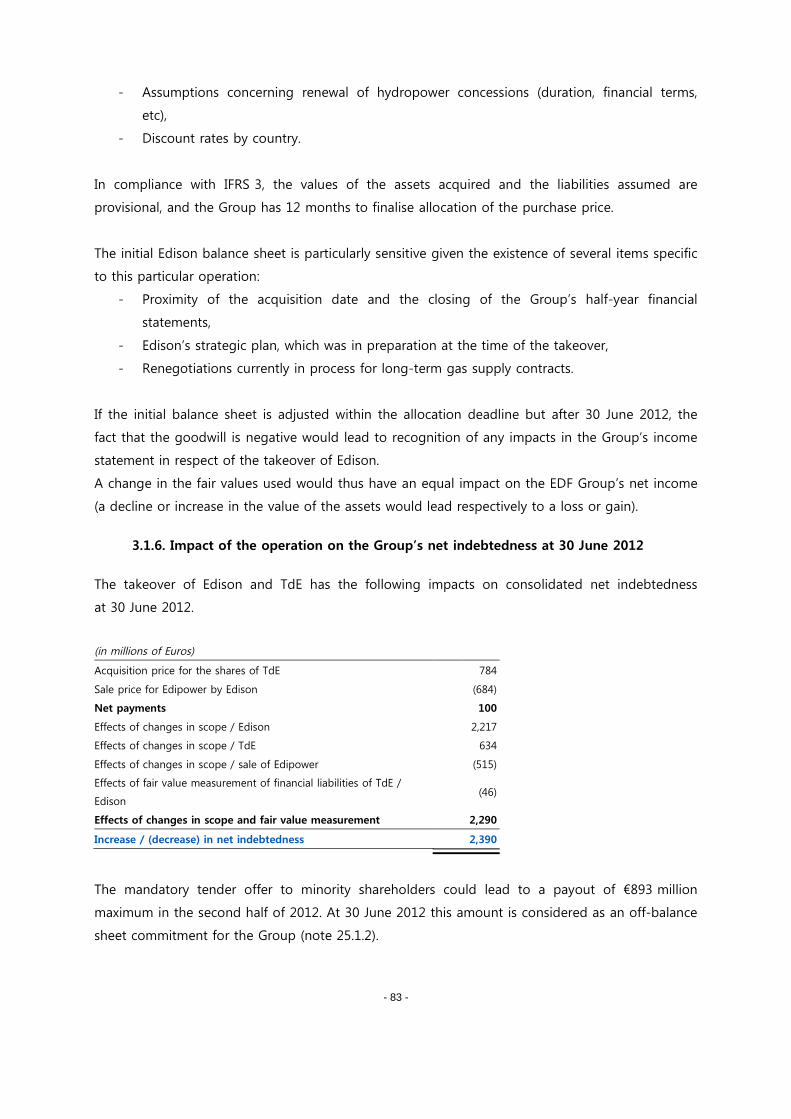
- 83 -
- Assumptions concerning renewal of hydropower concessions (duration, financial terms,
etc),
- Discount rates by country.
In compliance with IFRS 3, the values of the assets acquired and the liabilities assumed are
provisional, and the Group has 12 months to finalise allocation of the purchase price.
The initial Edison balance sheet is particularly sensitive given the existence of several items specific
to this particular operation:
- Proximity of the acquisition date and the closing of the Group’s half-year financial
statements,
- Edison’s strategic plan, which was in preparation at the time of the takeover,
- Renegotiations currently in process for long-term gas supply contracts.
If the initial balance sheet is adjusted within the allocation deadline but after 30 June 2012, the
fact that the goodwill is negative would lead to recognition of any impacts in the Group’s income
statement in respect of the takeover of Edison.
A change in the fair values used would thus have an equal impact on the EDF Group’s net income
(a decline or increase in the value of the assets would lead respectively to a loss or gain).
3.1.6. Impact of the operation on the Group’s net indebtedness at 30 June 2012
The takeover of Edison and TdE has the following impacts on consolidated net indebtedness
at 30 June 2012.
(in millions of Euros)
Acquisition price for the shares of TdE 784
Sale price for Edipower by Edison (684)
Net payments 100
Effects of changes in scope / Edison 2,217
Effects of changes in scope / TdE 634
Effects of changes in scope / sale of Edipower (515)
Effects of fair value measurement of financial liabilities of TdE /
Edison(46)
Effects of changes in scope and fair value measurement 2,290
Increase / (decrease) in net indebtedness 2,390
The mandatory tender offer to minority shareholders could lead to a payout of €893 million
maximum in the second half of 2012. At 30 June 2012 this amount is considered as an off-balance
sheet commitment for the Group (note 25.1.2).
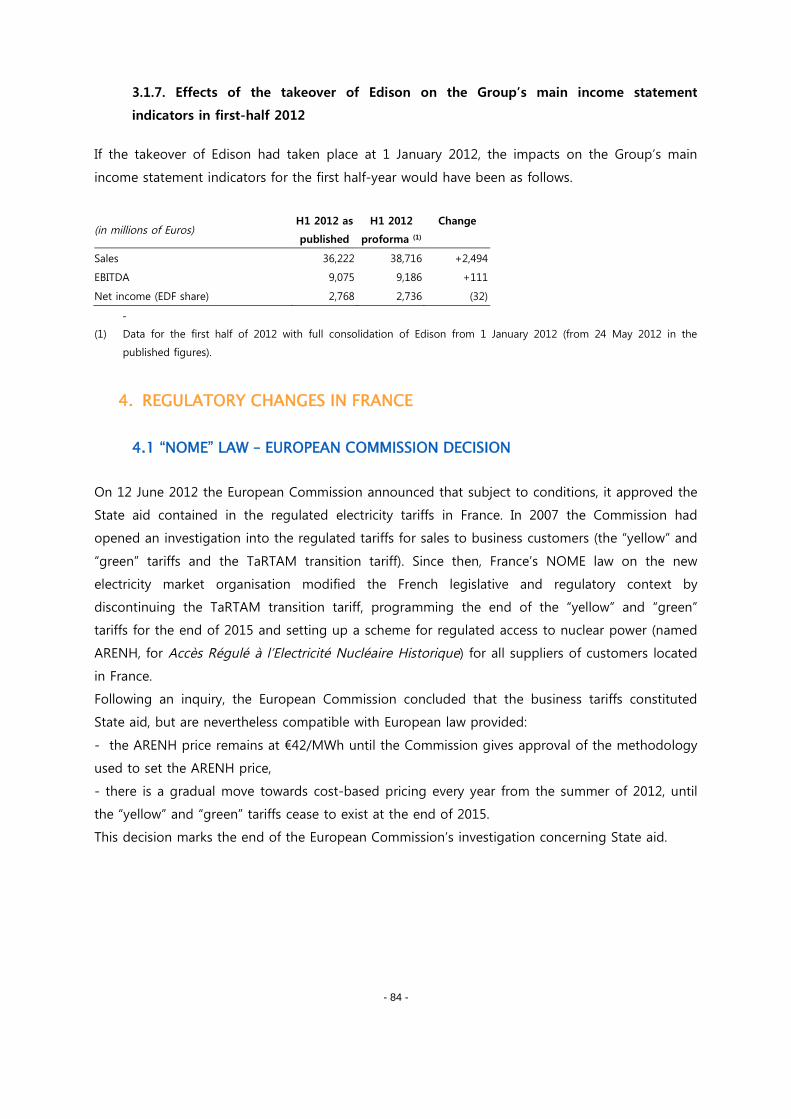
- 84 -
3.1.7. Effects of the takeover of Edison on the Group’s main income statement
indicators in first-half 2012
If the takeover of Edison had taken place at 1 January 2012, the impacts on the Group’s main
income statement indicators for the first half-year would have been as follows.
(in millions of Euros)H1 2012 as
published
H1 2012
proforma (1)
Change
Sales 36,222 38,716 +2,494
EBITDA 9,075 9,186 +111
Net income (EDF share) 2,768 2,736 (32)
-
(1) Data for the first half of 2012 with full consolidation of Edison from 1 January 2012 (from 24 May 2012 in the
published figures).
4. REGULATORY CHANGES IN FRANCE
4.1 “NOME” LAW – EUROPEAN COMMISSION DECISION
On 12 June 2012 the European Commission announced that subject to conditions, it approved the
State aid contained in the regulated electricity tariffs in France. In 2007 the Commission had
opened an investigation into the regulated tariffs for sales to business customers (the “yellow” and
“green” tariffs and the TaRTAM transition tariff). Since then, France’s NOME law on the new
electricity market organisation modified the French legislative and regulatory context by
discontinuing the TaRTAM transition tariff, programming the end of the “yellow” and “green”
tariffs for the end of 2015 and setting up a scheme for regulated access to nuclear power (named
ARENH, for Accès Régulé à l’Electricité Nucléaire Historique) for all suppliers of customers located
in France.
Following an inquiry, the European Commission concluded that the business tariffs constituted
State aid, but are nevertheless compatible with European law provided:
- the ARENH price remains at €42/MWh until the Commission gives approval of the methodology
used to set the ARENH price,
- there is a gradual move towards cost-based pricing every year from the summer of 2012, until
the “yellow” and “green” tariffs cease to exist at the end of 2015.
This decision marks the end of the European Commission’s investigation concerning State aid.
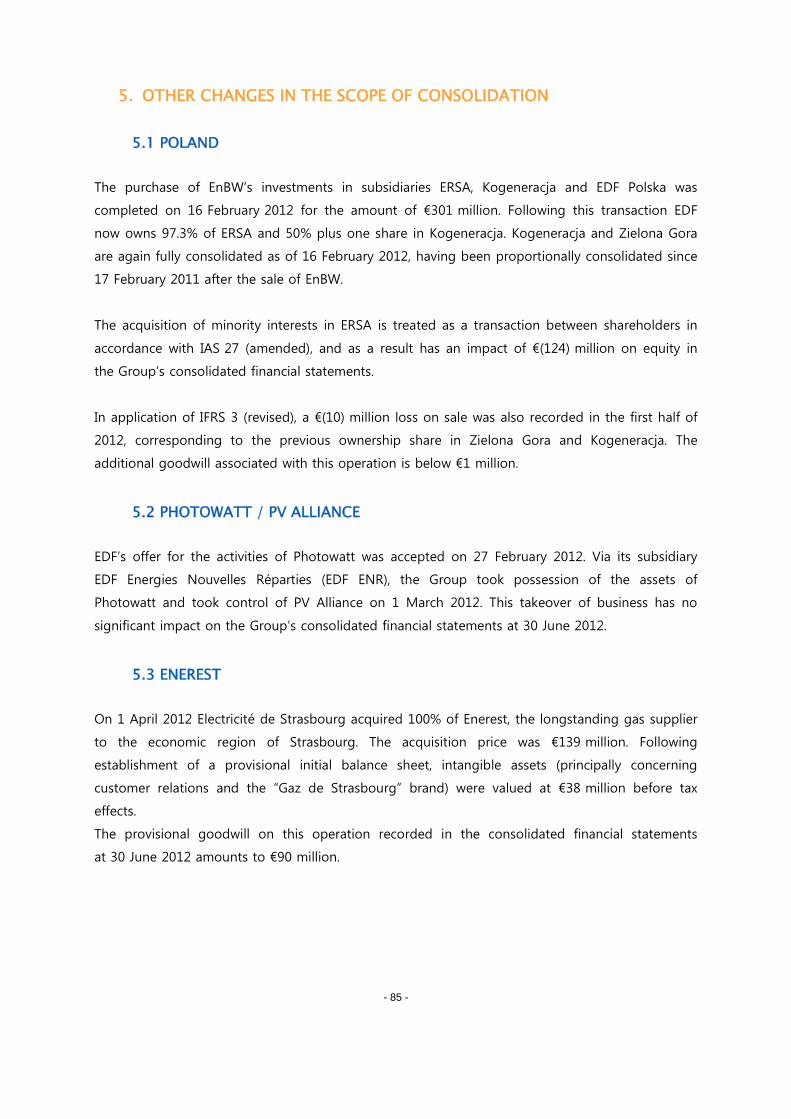
- 85 -
5. OTHER CHANGES IN THE SCOPE OF CONSOLIDATION
5.1 POLAND
The purchase of EnBW’s investments in subsidiaries ERSA, Kogeneracja and EDF Polska was
completed on 16 February 2012 for the amount of €301 million. Following this transaction EDF
now owns 97.3% of ERSA and 50% plus one share in Kogeneracja. Kogeneracja and Zielona Gora
are again fully consolidated as of 16 February 2012, having been proportionally consolidated since
17 February 2011 after the sale of EnBW.
The acquisition of minority interests in ERSA is treated as a transaction between shareholders in
accordance with IAS 27 (amended), and as a result has an impact of €(124) million on equity in
the Group’s consolidated financial statements.
In application of IFRS 3 (revised), a €(10) million loss on sale was also recorded in the first half of
2012, corresponding to the previous ownership share in Zielona Gora and Kogeneracja. The
additional goodwill associated with this operation is below €1 million.
5.2 PHOTOWATT / PV ALLIANCE
EDF’s offer for the activities of Photowatt was accepted on 27 February 2012. Via its subsidiary
EDF Energies Nouvelles Réparties (EDF ENR), the Group took possession of the assets of
Photowatt and took control of PV Alliance on 1 March 2012. This takeover of business has no
significant impact on the Group’s consolidated financial statements at 30 June 2012.
5.3 ENEREST
On 1 April 2012 Electricité de Strasbourg acquired 100% of Enerest, the longstanding gas supplier
to the economic region of Strasbourg. The acquisition price was €139 million. Following
establishment of a provisional initial balance sheet, intangible assets (principally concerning
customer relations and the “Gaz de Strasbourg” brand) were valued at €38 million before tax
effects.
The provisional goodwill on this operation recorded in the consolidated financial statements
at 30 June 2012 amounts to €90 million.
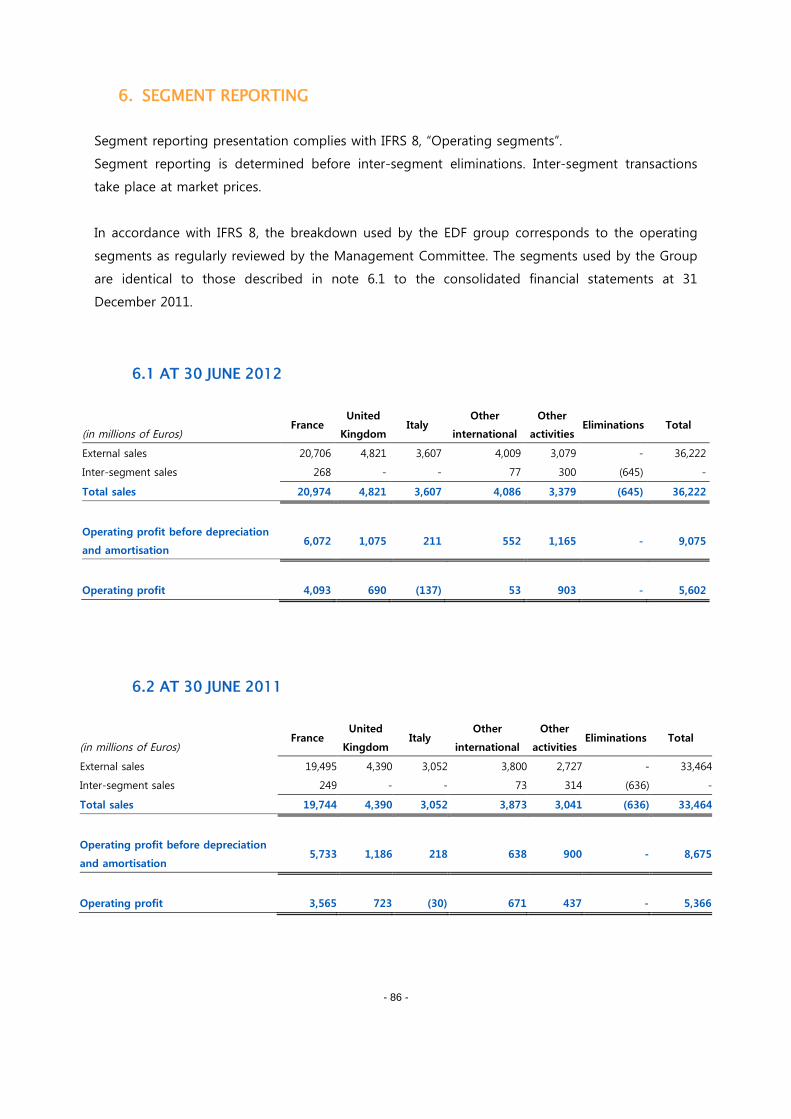
- 86 -
6. SEGMENT REPORTING
Segment reporting presentation complies with IFRS 8, “Operating segments”.
Segment reporting is determined before inter-segment eliminations. Inter-segment transactions
take place at market prices.
In accordance with IFRS 8, the breakdown used by the EDF group corresponds to the operating
segments as regularly reviewed by the Management Committee. The segments used by the Group
are identical to those described in note 6.1 to the consolidated financial statements at 31
December 2011.
6.1 AT 30 JUNE 2012
(in millions of Euros)France
United
KingdomItaly
Other
international
Other
activitiesEliminations Total
External sales 20,706 4,821 3,607 4,009 3,079 - 36,222
Inter-segment sales 268 - - 77 300 (645) -
Total sales 20,974 4,821 3,607 4,086 3,379 (645) 36,222
Operating profit before depreciation
and amortisation6,072 1,075 211 552 1,165 - 9,075
Operating profit 4,093 690 (137) 53 903 - 5,602
6.2 AT 30 JUNE 2011
(in millions of Euros)France
United
KingdomItaly
Other
international
Other
activitiesEliminations Total
External sales 19,495 4,390 3,052 3,800 2,727 - 33,464
Inter-segment sales 249 - - 73 314 (636) -
Total sales 19,744 4,390 3,052 3,873 3,041 (636) 33,464
Operating profit before depreciation
and amortisation5,733 1,186 218 638 900 - 8,675
Operating profit 3,565 723 (30) 671 437 - 5,366
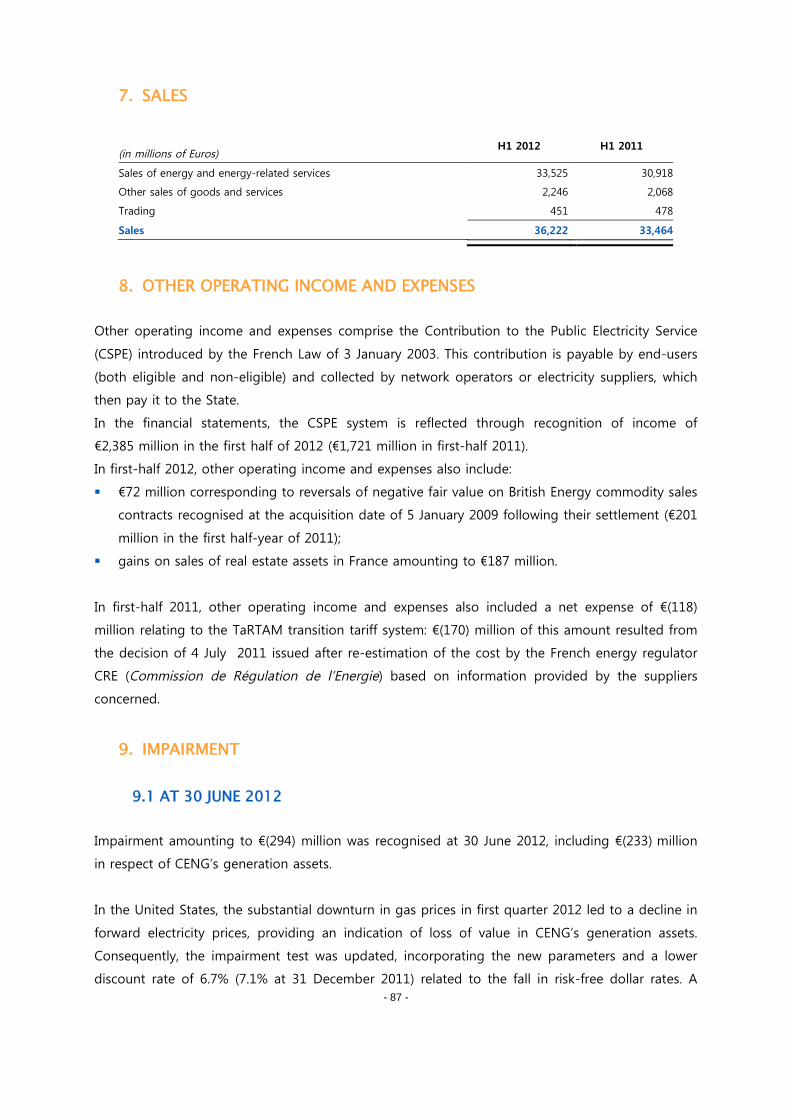
- 87 -
7. SALES
(in millions of Euros)H1 2012 H1 2011
Sales of energy and energy-related services 33,525 30,918
Other sales of goods and services 2,246 2,068
Trading 451 478
Sales 36,222 33,464
8. OTHER OPERATING INCOME AND EXPENSES
Other operating income and expenses comprise the Contribution to the Public Electricity Service
(CSPE) introduced by the French Law of 3 January 2003. This contribution is payable by end-users
(both eligible and non-eligible) and collected by network operators or electricity suppliers, which
then pay it to the State.
In the financial statements, the CSPE system is reflected through recognition of income of
€2,385 million in the first half of 2012 (€1,721 million in first-half 2011).
In first-half 2012, other operating income and expenses also include:
€72 million corresponding to reversals of negative fair value on British Energy commodity sales
contracts recognised at the acquisition date of 5 January 2009 following their settlement (€201
million in the first half-year of 2011);
gains on sales of real estate assets in France amounting to €187 million.
In first-half 2011, other operating income and expenses also included a net expense of €(118)
million relating to the TaRTAM transition tariff system: €(170) million of this amount resulted from
the decision of 4 July 2011 issued after re-estimation of the cost by the French energy regulator
CRE (Commission de Régulation de l’Energie) based on information provided by the suppliers
concerned.
9. IMPAIRMENT
9.1 AT 30 JUNE 2012
Impairment amounting to €(294) million was recognised at 30 June 2012, including €(233) million
in respect of CENG’s generation assets.
In the United States, the substantial downturn in gas prices in first quarter 2012 led to a decline in
forward electricity prices, providing an indication of loss of value in CENG’s generation assets.
Consequently, the impairment test was updated, incorporating the new parameters and a lower
discount rate of 6.7% (7.1% at 31 December 2011) related to the fall in risk-free dollar rates. A
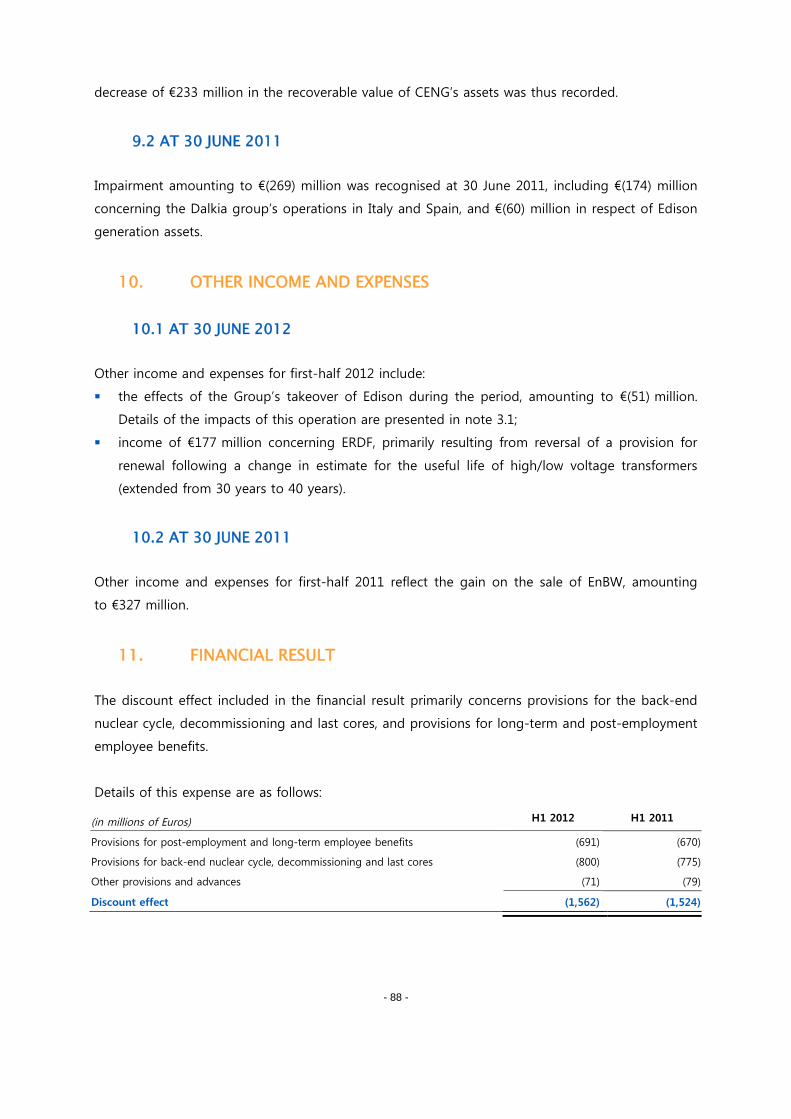
- 88 -
decrease of €233 million in the recoverable value of CENG’s assets was thus recorded.
9.2 AT 30 JUNE 2011
Impairment amounting to €(269) million was recognised at 30 June 2011, including €(174) million
concerning the Dalkia group’s operations in Italy and Spain, and €(60) million in respect of Edison
generation assets.
10. OTHER INCOME AND EXPENSES
10.1 AT 30 JUNE 2012
Other income and expenses for first-half 2012 include:
the effects of the Group’s takeover of Edison during the period, amounting to €(51) million.
Details of the impacts of this operation are presented in note 3.1;
income of €177 million concerning ERDF, primarily resulting from reversal of a provision for
renewal following a change in estimate for the useful life of high/low voltage transformers
(extended from 30 years to 40 years).
10.2 AT 30 JUNE 2011
Other income and expenses for first-half 2011 reflect the gain on the sale of EnBW, amounting
to €327 million.
11. FINANCIAL RESULT
The discount effect included in the financial result primarily concerns provisions for the back-end
nuclear cycle, decommissioning and last cores, and provisions for long-term and post-employment
employee benefits.
Details of this expense are as follows:
(in millions of Euros) H1 2012 H1 2011
Provisions for post-employment and long-term employee benefits (691) (670)
Provisions for back-end nuclear cycle, decommissioning and last cores (800) (775)
Other provisions and advances (71) (79)
Discount effect (1,562) (1,524)
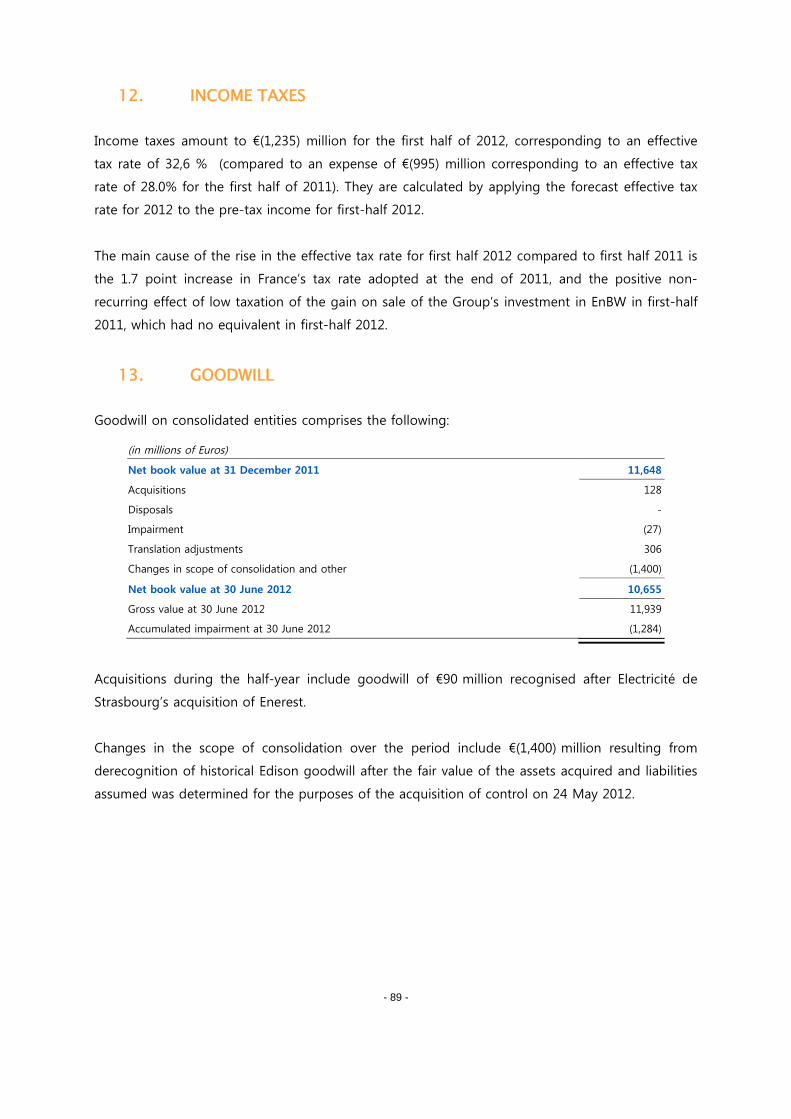
- 89 -
12. INCOME TAXES
Income taxes amount to €(1,235) million for the first half of 2012, corresponding to an effective
tax rate of 32,6 % (compared to an expense of €(995) million corresponding to an effective tax
rate of 28.0% for the first half of 2011). They are calculated by applying the forecast effective tax
rate for 2012 to the pre-tax income for first-half 2012.
The main cause of the rise in the effective tax rate for first half 2012 compared to first half 2011 is
the 1.7 point increase in France’s tax rate adopted at the end of 2011, and the positive non-
recurring effect of low taxation of the gain on sale of the Group’s investment in EnBW in first-half
2011, which had no equivalent in first-half 2012.
13. GOODWILL
Goodwill on consolidated entities comprises the following:
(in millions of Euros)
Net book value at 31 December 2011 11,648
Acquisitions 128
Disposals -
Impairment (27)
Translation adjustments 306
Changes in scope of consolidation and other (1,400)
Net book value at 30 June 2012 10,655
Gross value at 30 June 2012 11,939
Accumulated impairment at 30 June 2012 (1,284)
Acquisitions during the half-year include goodwill of €90 million recognised after Electricité de
Strasbourg’s acquisition of Enerest.
Changes in the scope of consolidation over the period include €(1,400) million resulting from
derecognition of historical Edison goodwill after the fair value of the assets acquired and liabilities
assumed was determined for the purposes of the acquisition of control on 24 May 2012.
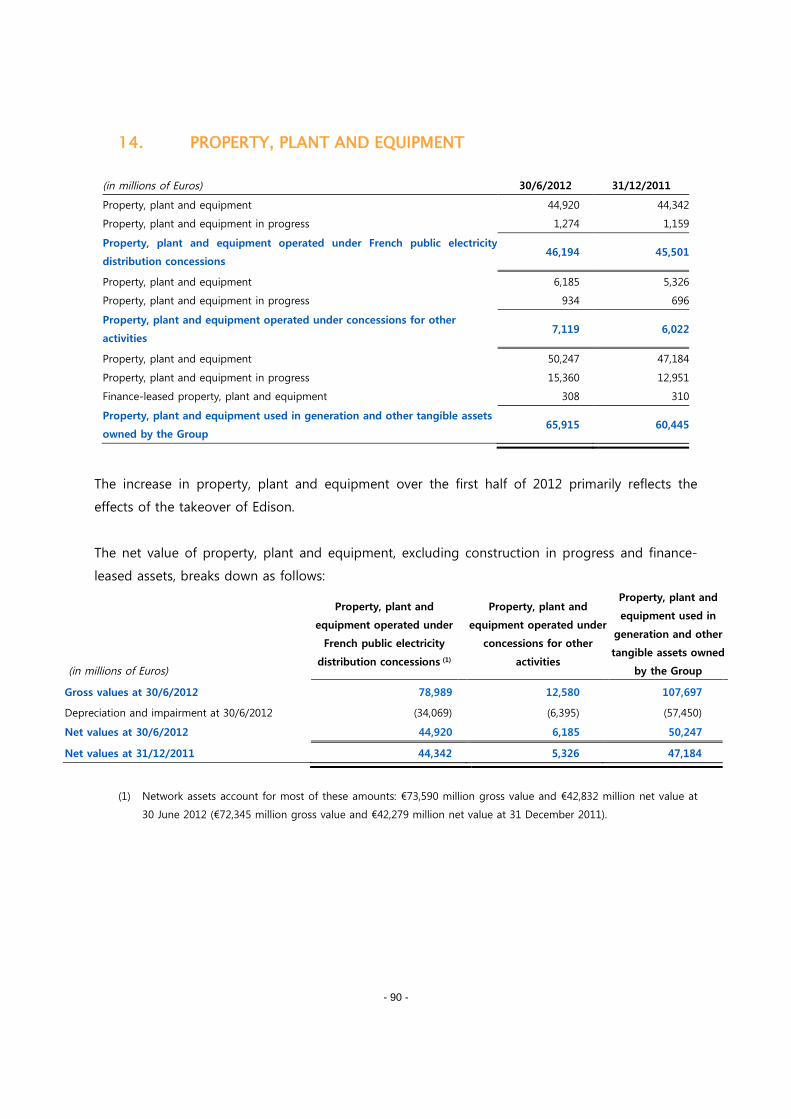
- 90 -
14. PROPERTY, PLANT AND EQUIPMENT
(in millions of Euros) 30/6/2012 31/12/2011
Property, plant and equipment 44,920 44,342
Property, plant and equipment in progress 1,274 1,159
Property, plant and equipment operated under French public electricity
distribution concessions46,194 45,501
Property, plant and equipment 6,185 5,326
Property, plant and equipment in progress 934 696
Property, plant and equipment operated under concessions for other
activities7,119 6,022
Property, plant and equipment 50,247 47,184
Property, plant and equipment in progress 15,360 12,951
Finance-leased property, plant and equipment 308 310
Property, plant and equipment used in generation and other tangible assets
owned by the Group65,915 60,445
The increase in property, plant and equipment over the first half of 2012 primarily reflects the
effects of the takeover of Edison.
The net value of property, plant and equipment, excluding construction in progress and finance-
leased assets, breaks down as follows:
(in millions of Euros)
Property, plant and
equipment operated under
French public electricity
distribution concessions (1)
Property, plant and
equipment operated under
concessions for other
activities
Property, plant and
equipment used in
generation and other
tangible assets owned
by the Group
Gross values at 30/6/2012 78,989 12,580 107,697
Depreciation and impairment at 30/6/2012 (34,069) (6,395) (57,450)
Net values at 30/6/2012 44,920 6,185 50,247
Net values at 31/12/2011 44,342 5,326 47,184
(1) Network assets account for most of these amounts: €73,590 million gross value and €42,832 million net value at
30 June 2012 (€72,345 million gross value and €42,279 million net value at 31 December 2011).
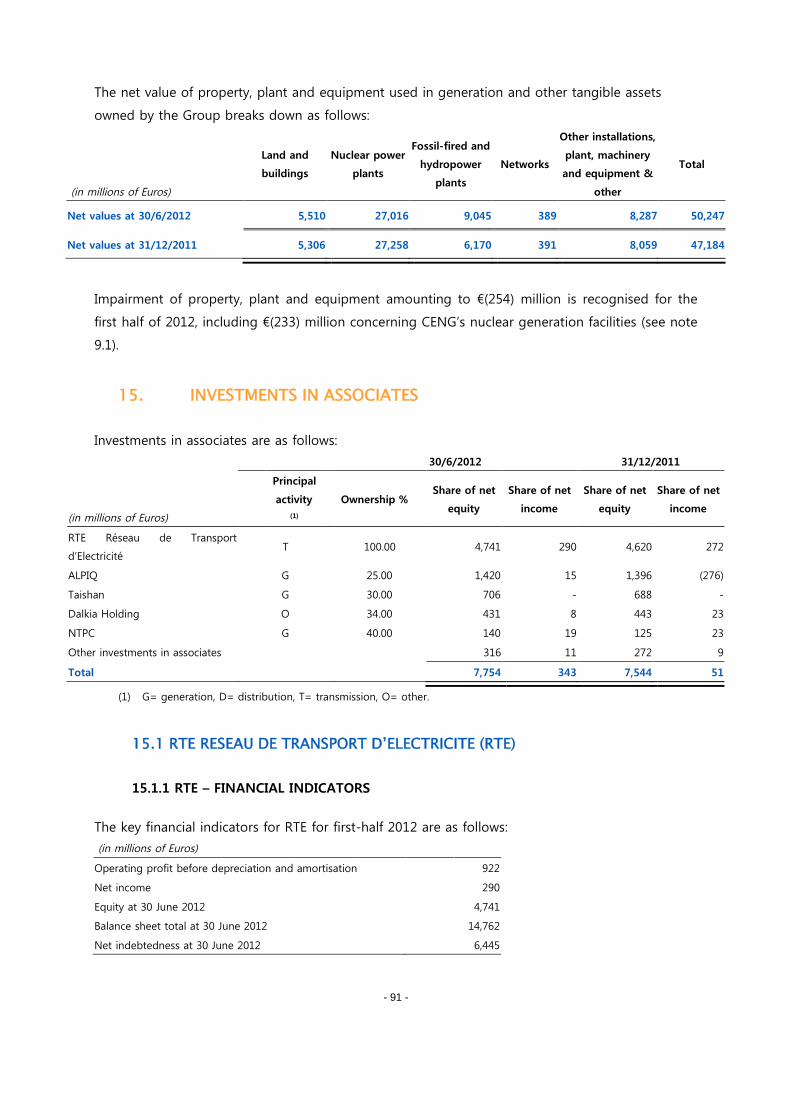
- 91 -
The net value of property, plant and equipment used in generation and other tangible assets
owned by the Group breaks down as follows:
(in millions of Euros)
Land and
buildings
Nuclear power
plants
Fossil-fired and
hydropower
plants
Networks
Other installations,
plant, machinery
and equipment &
other
Total
Net values at 30/6/2012 5,510 27,016 9,045 389 8,287 50,247
Net values at 31/12/2011 5,306 27,258 6,170 391 8,059 47,184
Impairment of property, plant and equipment amounting to €(254) million is recognised for the
first half of 2012, including €(233) million concerning CENG’s nuclear generation facilities (see note
9.1).
15. INVESTMENTS IN ASSOCIATES
Investments in associates are as follows:
30/6/2012 31/12/2011
(in millions of Euros)
Principal
activity
(1)
Ownership %Share of net
equity
Share of net
income
Share of net
equity
Share of net
income
RTE Réseau de Transport
d’ElectricitéT 100.00 4,741 290 4,620 272
ALPIQ G 25.00 1,420 15 1,396 (276)
Taishan G 30.00 706 - 688 -
Dalkia Holding O 34.00 431 8 443 23
NTPC G 40.00 140 19 125 23
Other investments in associates 316 11 272 9
Total 7,754 343 7,544 51
(1) G= generation, D= distribution, T= transmission, O= other.
15.1 RTE RESEAU DE TRANSPORT D’ELECTRICITE (RTE)
15.1.1 RTE – FINANCIAL INDICATORS
The key financial indicators for RTE for first-half 2012 are as follows:
(in millions of Euros)
Operating profit before depreciation and amortisation 922
Net income 290
Equity at 30 June 2012 4,741
Balance sheet total at 30 June 2012 14,762
Net indebtedness at 30 June 2012 6,445
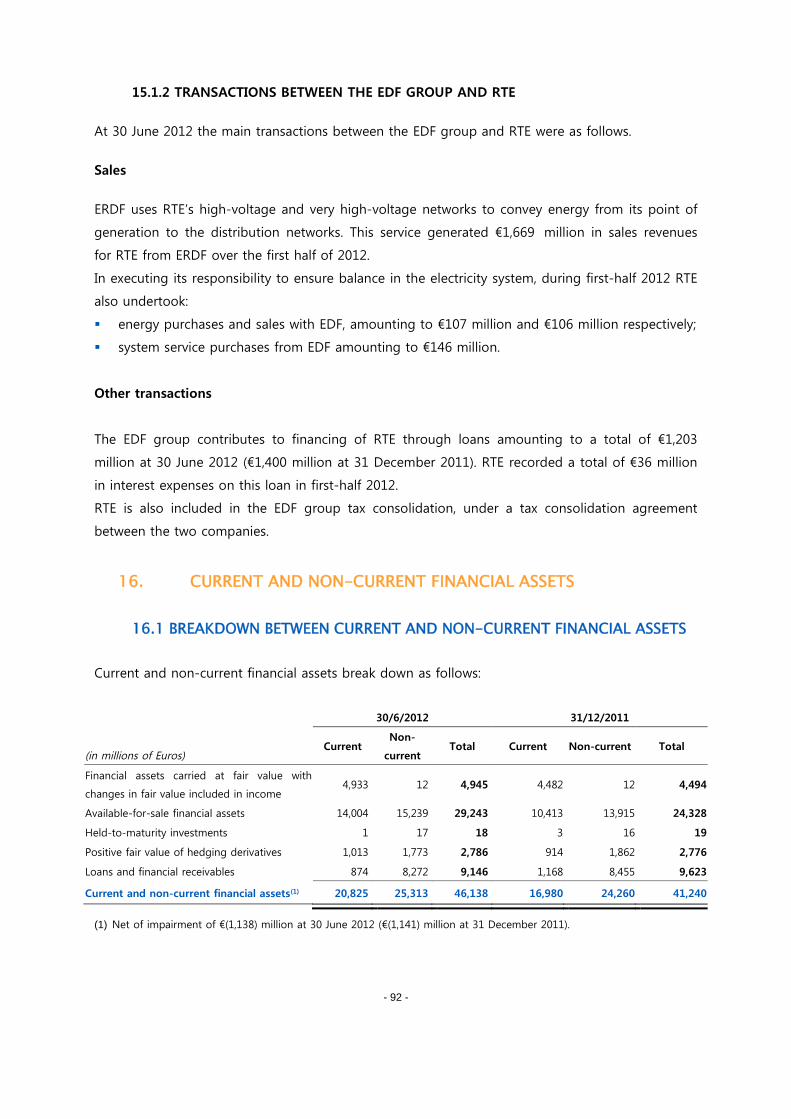
- 92 -
15.1.2 TRANSACTIONS BETWEEN THE EDF GROUP AND RTE
At 30 June 2012 the main transactions between the EDF group and RTE were as follows.
Sales
ERDF uses RTE’s high-voltage and very high-voltage networks to convey energy from its point of
generation to the distribution networks. This service generated €1,669 million in sales revenues
for RTE from ERDF over the first half of 2012.
In executing its responsibility to ensure balance in the electricity system, during first-half 2012 RTE
also undertook:
energy purchases and sales with EDF, amounting to €107 million and €106 million respectively;
system service purchases from EDF amounting to €146 million.
Other transactions
The EDF group contributes to financing of RTE through loans amounting to a total of €1,203
million at 30 June 2012 (€1,400 million at 31 December 2011). RTE recorded a total of €36 million
in interest expenses on this loan in first-half 2012.
RTE is also included in the EDF group tax consolidation, under a tax consolidation agreement
between the two companies.
16. CURRENT AND NON-CURRENT FINANCIAL ASSETS
16.1 BREAKDOWN BETWEEN CURRENT AND NON-CURRENT FINANCIAL ASSETS
Current and non-current financial assets break down as follows:
30/6/2012 31/12/2011
(in millions of Euros)Current
Non-
currentTotal Current Non-current Total
Financial assets carried at fair value with
changes in fair value included in income4,933 12 4,945 4,482 12 4,494
Available-for-sale financial assets 14,004 15,239 29,243 10,413 13,915 24,328
Held-to-maturity investments 1 17 18 3 16 19
Positive fair value of hedging derivatives 1,013 1,773 2,786 914 1,862 2,776
Loans and financial receivables 874 8,272 9,146 1,168 8,455 9,623
Current and non-current financial assets(1) 20,825 25,313 46,138 16,980 24,260 41,240
(1) Net of impairment of €(1,138) million at 30 June 2012 (€(1,141) million at 31 December 2011).
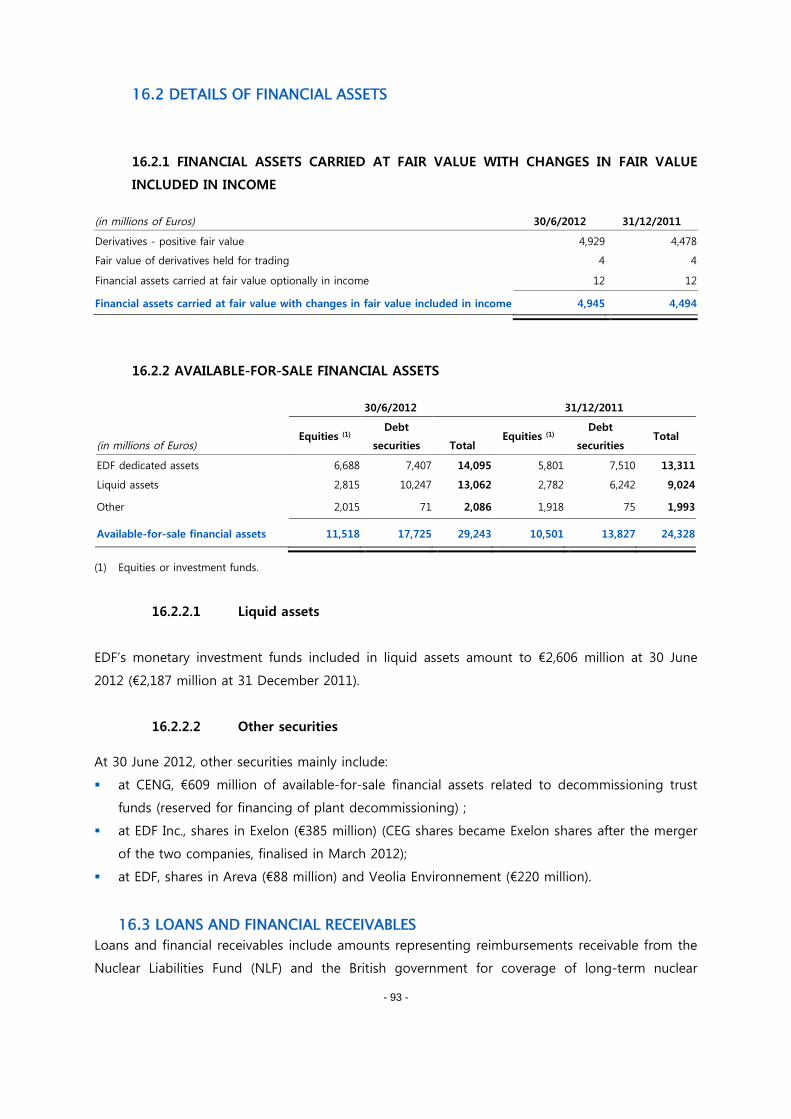
- 93 -
16.2 DETAILS OF FINANCIAL ASSETS
16.2.1 FINANCIAL ASSETS CARRIED AT FAIR VALUE WITH CHANGES IN FAIR VALUE
INCLUDED IN INCOME
(in millions of Euros) 30/6/2012 31/12/2011
Derivatives - positive fair value 4,929 4,478
Fair value of derivatives held for trading 4 4
Financial assets carried at fair value optionally in income 12 12
Financial assets carried at fair value with changes in fair value included in income 4,945 4,494
16.2.2 AVAILABLE-FOR-SALE FINANCIAL ASSETS
30/6/2012 31/12/2011
(in millions of Euros)Equities (1)
Debt
securities TotalEquities (1)
Debt
securitiesTotal
EDF dedicated assets 6,688 7,407 14,095 5,801 7,510 13,311
Liquid assets 2,815 10,247 13,062 2,782 6,242 9,024
Other 2,015 71 2,086 1,918 75 1,993
Available-for-sale financial assets 11,518 17,725 29,243 10,501 13,827 24,328
(1) Equities or investment funds.
16.2.2.1 Liquid assets
EDF’s monetary investment funds included in liquid assets amount to €2,606 million at 30 June
2012 (€2,187 million at 31 December 2011).
16.2.2.2 Other securities
At 30 June 2012, other securities mainly include:
at CENG, €609 million of available-for-sale financial assets related to decommissioning trust
funds (reserved for financing of plant decommissioning) ;
at EDF Inc., shares in Exelon (€385 million) (CEG shares became Exelon shares after the merger
of the two companies, finalised in March 2012);
at EDF, shares in Areva (€88 million) and Veolia Environnement (€220 million).
16.3 LOANS AND FINANCIAL RECEIVABLES
Loans and financial receivables include amounts representing reimbursements receivable from the
Nuclear Liabilities Fund (NLF) and the British government for coverage of long-term nuclear
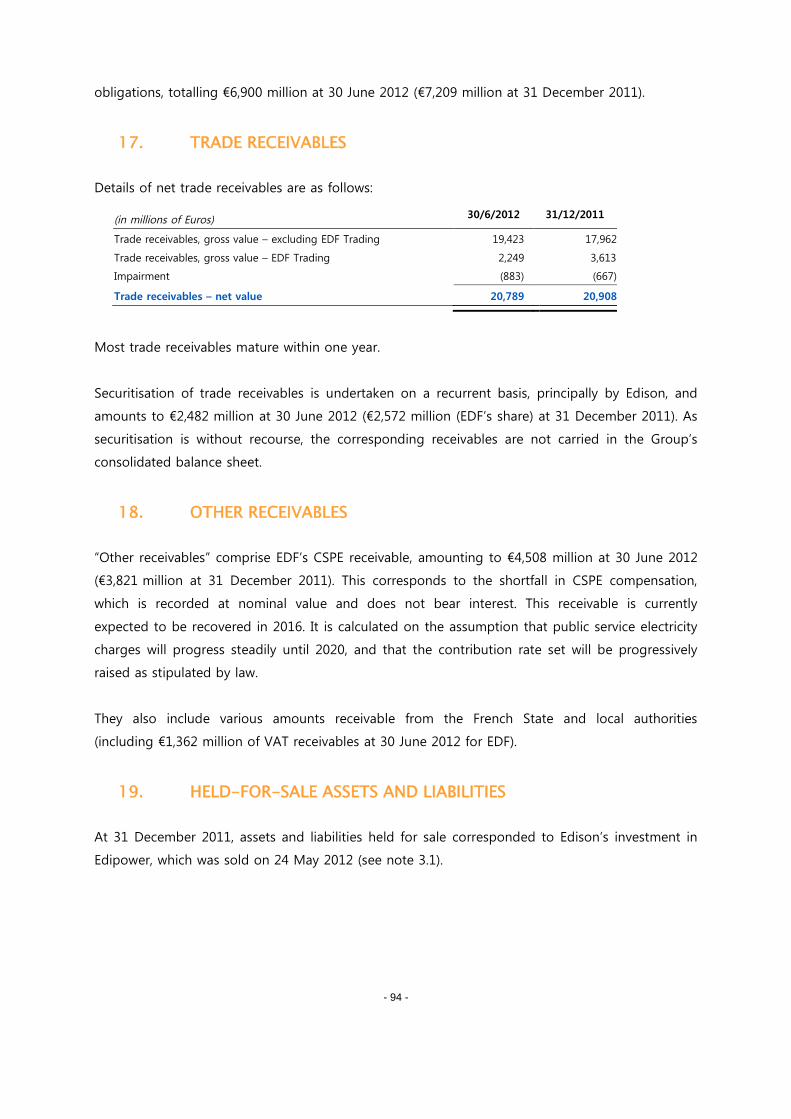
- 94 -
obligations, totalling €6,900 million at 30 June 2012 (€7,209 million at 31 December 2011).
17. TRADE RECEIVABLES
Details of net trade receivables are as follows:
(in millions of Euros) 30/6/2012 31/12/2011
Trade receivables, gross value – excluding EDF Trading 19,423 17,962
Trade receivables, gross value – EDF Trading 2,249 3,6133
Impairment (883) (667)
Trade receivables – net value 20,789 20,908
Most trade receivables mature within one year.
Securitisation of trade receivables is undertaken on a recurrent basis, principally by Edison, and
amounts to €2,482 million at 30 June 2012 (€2,572 million (EDF’s share) at 31 December 2011). As
securitisation is without recourse, the corresponding receivables are not carried in the Group’s
consolidated balance sheet.
18. OTHER RECEIVABLES
“Other receivables” comprise EDF’s CSPE receivable, amounting to €4,508 million at 30 June 2012
(€3,821 million at 31 December 2011). This corresponds to the shortfall in CSPE compensation,
which is recorded at nominal value and does not bear interest. This receivable is currently
expected to be recovered in 2016. It is calculated on the assumption that public service electricity
charges will progress steadily until 2020, and that the contribution rate set will be progressively
raised as stipulated by law.
They also include various amounts receivable from the French State and local authorities
(including €1,362 million of VAT receivables at 30 June 2012 for EDF).
19. HELD-FOR-SALE ASSETS AND LIABILITIES
At 31 December 2011, assets and liabilities held for sale corresponded to Edison’s investment in
Edipower, which was sold on 24 May 2012 (see note 3.1).
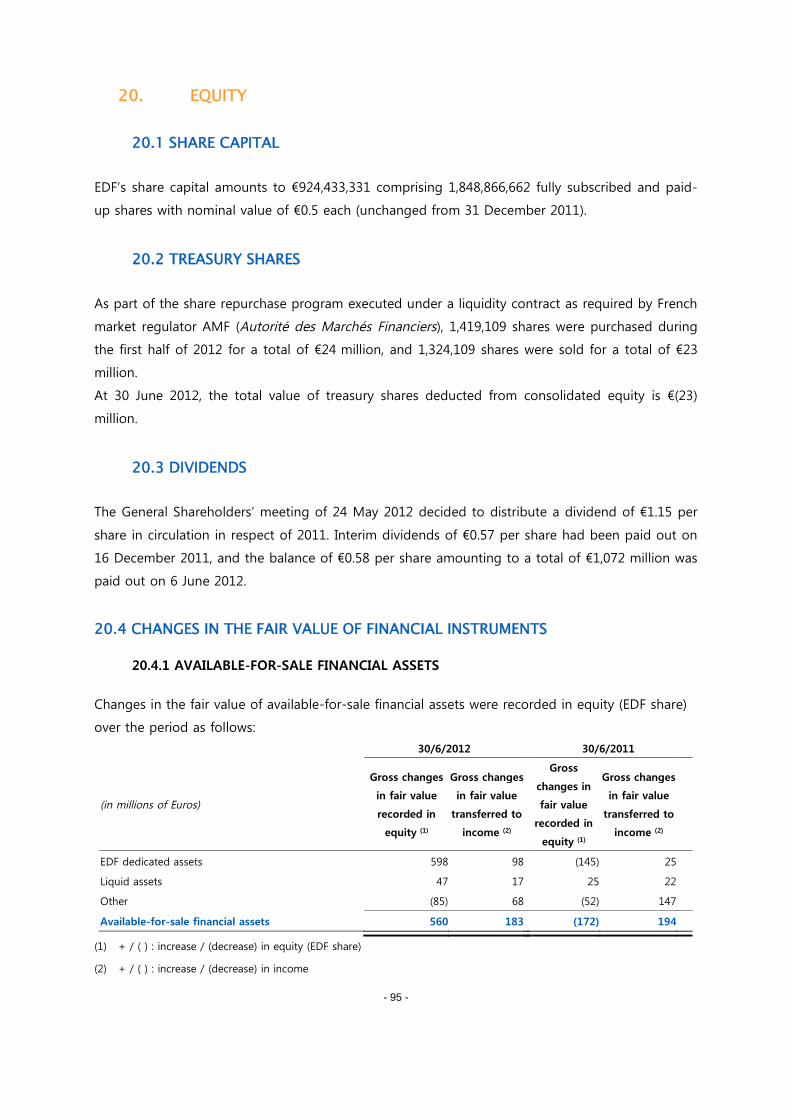
- 95 -
20. EQUITY
20.1 SHARE CAPITAL
EDF’s share capital amounts to €924,433,331 comprising 1,848,866,662 fully subscribed and paid-
up shares with nominal value of €0.5 each (unchanged from 31 December 2011).
20.2 TREASURY SHARES
As part of the share repurchase program executed under a liquidity contract as required by French
market regulator AMF (Autorité des Marchés Financiers), 1,419,109 shares were purchased during
the first half of 2012 for a total of €24 million, and 1,324,109 shares were sold for a total of €23
million.
At 30 June 2012, the total value of treasury shares deducted from consolidated equity is €(23)
million.
20.3 DIVIDENDS
The General Shareholders’ meeting of 24 May 2012 decided to distribute a dividend of €1.15 per
share in circulation in respect of 2011. Interim dividends of €0.57 per share had been paid out on
16 December 2011, and the balance of €0.58 per share amounting to a total of €1,072 million was
paid out on 6 June 2012.
20.4 CHANGES IN THE FAIR VALUE OF FINANCIAL INSTRUMENTS
20.4.1 AVAILABLE-FOR-SALE FINANCIAL ASSETS
Changes in the fair value of available-for-sale financial assets were recorded in equity (EDF share)
over the period as follows:
30/6/2012 30/6/2011
(in millions of Euros)
Gross changes
in fair value
recorded in
equity (1)
Gross changes
in fair value
transferred to
income (2)
Gross
changes in
fair value
recorded in
equity (1)
Gross changes
in fair value
transferred to
income (2)
EDF dedicated assets 598 98 (145) 25
Liquid assets 47 17 25 22
Other (85) 68 (52) 147
Available-for-sale financial assets 560 183 (172) 194
(1) + / ( ) : increase / (decrease) in equity (EDF share)
(2) + / ( ) : increase / (decrease) in income
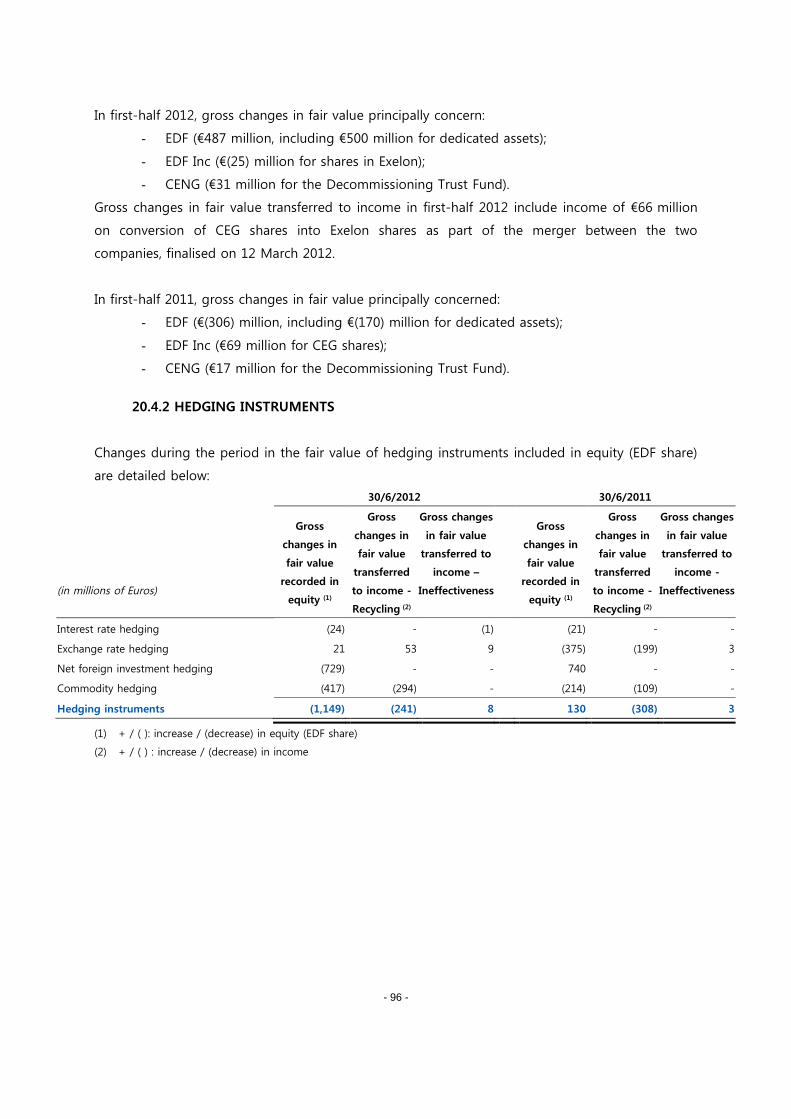
- 96 -
In first-half 2012, gross changes in fair value principally concern:
- EDF (€487 million, including €500 million for dedicated assets);
- EDF Inc (€(25) million for shares in Exelon);
- CENG (€31 million for the Decommissioning Trust Fund).
Gross changes in fair value transferred to income in first-half 2012 include income of €66 million
on conversion of CEG shares into Exelon shares as part of the merger between the two
companies, finalised on 12 March 2012.
In first-half 2011, gross changes in fair value principally concerned:
- EDF (€(306) million, including €(170) million for dedicated assets);
- EDF Inc (€69 million for CEG shares);
- CENG (€17 million for the Decommissioning Trust Fund).
20.4.2 HEDGING INSTRUMENTS
Changes during the period in the fair value of hedging instruments included in equity (EDF share)
are detailed below:
30/6/2012 30/6/2011
(in millions of Euros)
Gross
changes in
fair value
recorded in
equity (1)
Gross
changes in
fair value
transferred
to income -
Recycling (2)
Gross changes
in fair value
transferred to
income –
Ineffectiveness
Gross
changes in
fair value
recorded in
equity (1)
Gross
changes in
fair value
transferred
to income -
Recycling (2)
Gross changes
in fair value
transferred to
income -
Ineffectiveness
Interest rate hedging (24) - (1) (21) - -
Exchange rate hedging 21 53 9 (375) (199) 3
Net foreign investment hedging (729) - - 740 - -
Commodity hedging (417) (294) - (214) (109) -
Hedging instruments (1,149) (241) 8 130 (308) 3
(1) + / ( ): increase / (decrease) in equity (EDF share)
(2) + / ( ) : increase / (decrease) in income
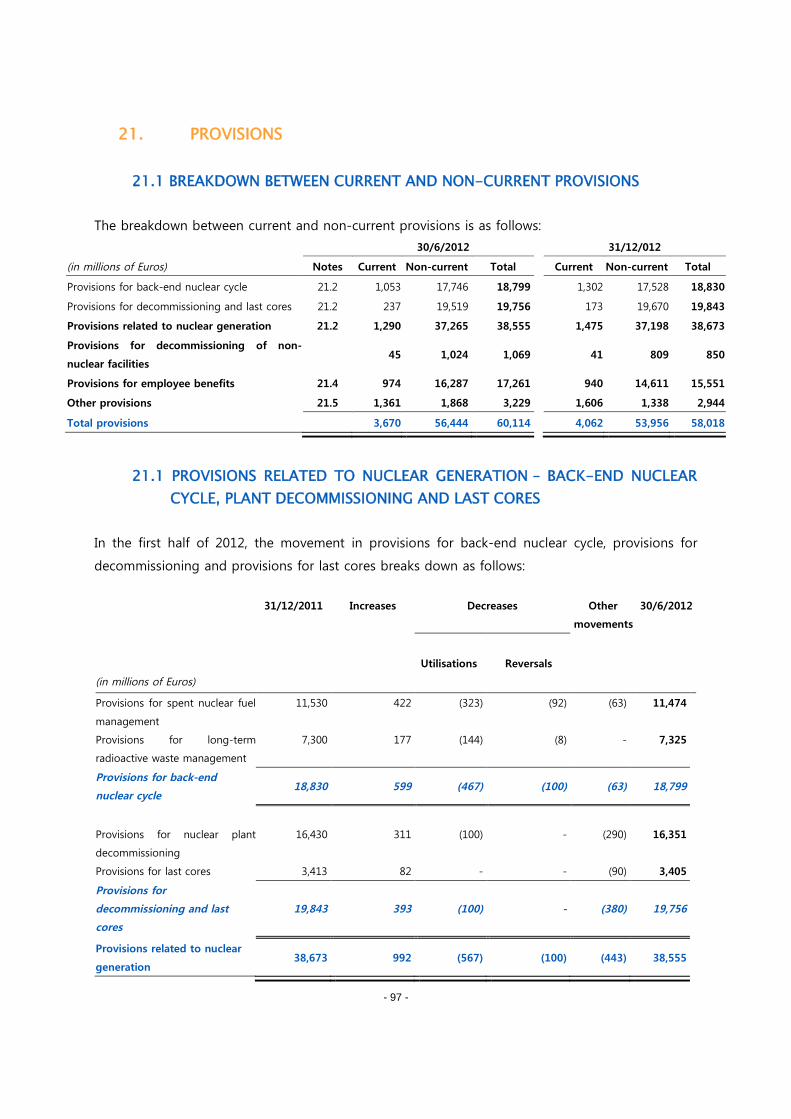
- 97 -
21. PROVISIONS
21.1 BREAKDOWN BETWEEN CURRENT AND NON-CURRENT PROVISIONS
The breakdown between current and non-current provisions is as follows:
30/6/2012 31/12/012
(in millions of Euros) Notes Current Non-current Total Current Non-current Total
Provisions for back-end nuclear cycle 21.2 1,053 17,746 18,799 1,302 17,528 18,830
Provisions for decommissioning and last cores 21.2 237 19,519 19,756 173 19,670 19,843
Provisions related to nuclear generation 21.2 1,290 37,265 38,555 1,475 37,198 38,673
Provisions for decommissioning of non-
nuclear facilities45 1,024 1,069 41 809 850
Provisions for employee benefits 21.4 974 16,287 17,261 940 14,611 15,551
Other provisions 21.5 1,361 1,868 3,229 1,606 1,338 2,944
Total provisions 3,670 56,444 60,114 4,062 53,956 58,018
21.1 PROVISIONS RELATED TO NUCLEAR GENERATION – BACK-END NUCLEAR
CYCLE, PLANT DECOMMISSIONING AND LAST CORES
In the first half of 2012, the movement in provisions for back-end nuclear cycle, provisions for
decommissioning and provisions for last cores breaks down as follows:
(in millions of Euros)
31/12/2011 Increases Decreases Other
movements
30/6/2012
Utilisations Reversals
Provisions for spent nuclear fuel
management
11,530 422 (323) (92) (63) 11,474
Provisions for long-term
radioactive waste management
7,300 177 (144) (8) - 7,325
Provisions for back-end
nuclear cycle18,830 599 (467) (100) (63) 18,799
Provisions for nuclear plant
decommissioning
16,430 311 (100) - (290) 16,351
Provisions for last cores 3,413 82 - - (90) 3,405
Provisions for
decommissioning and last
cores
19,843 393 (100) - (380) 19,756
Provisions related to nuclear
generation38,673 992 (567) (100) (443) 38,555
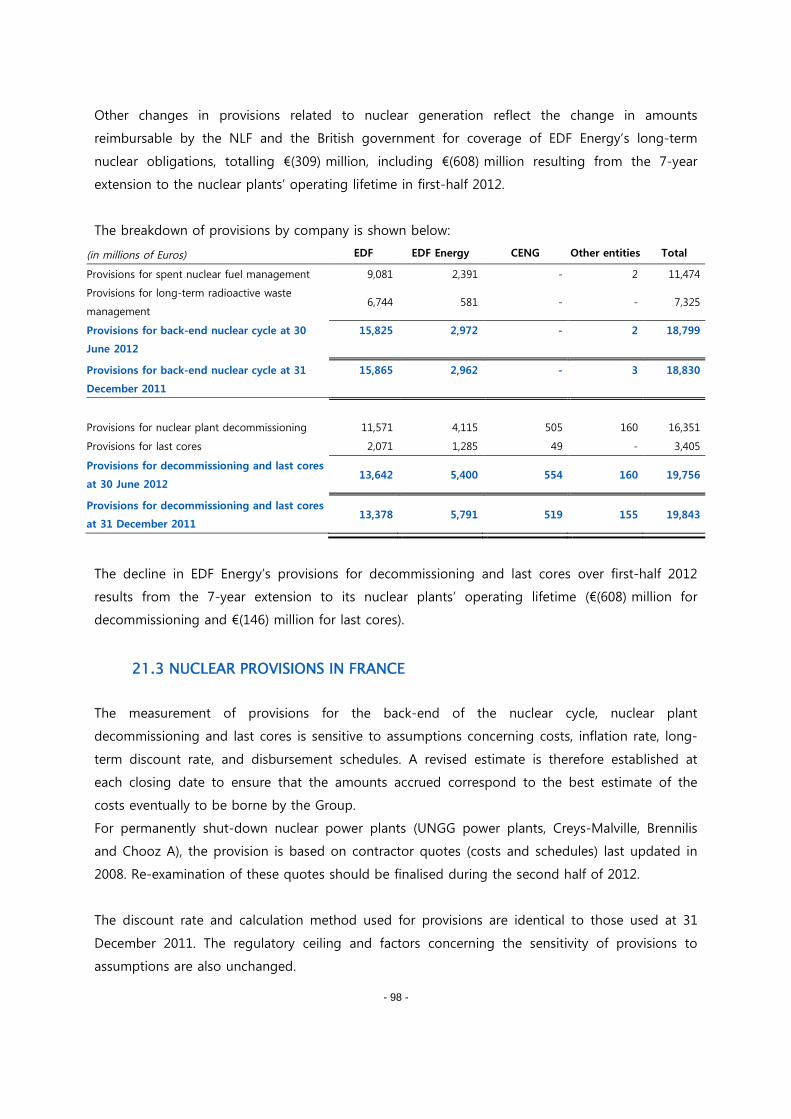
- 98 -
Other changes in provisions related to nuclear generation reflect the change in amounts
reimbursable by the NLF and the British government for coverage of EDF Energy’s long-term
nuclear obligations, totalling €(309) million, including €(608) million resulting from the 7-year
extension to the nuclear plants’ operating lifetime in first-half 2012.
The breakdown of provisions by company is shown below:
(in millions of Euros) EDF EDF Energy CENG Other entities Total
Provisions for spent nuclear fuel management 9,081 2,391 - 2 11,474
Provisions for long-term radioactive waste
management6,744 581 - - 7,325
Provisions for back-end nuclear cycle at 30
June 2012
15,825 2,972 - 2 18,799
Provisions for back-end nuclear cycle at 31
December 2011
15,865 2,962 - 3 18,830
Provisions for nuclear plant decommissioning 11,571 4,115 505 160 16,351
Provisions for last cores 2,071 1,285 49 - 3,405
Provisions for decommissioning and last cores
at 30 June 201213,642 5,400 554 160 19,756
Provisions for decommissioning and last cores
at 31 December 201113,378 5,791 519 155 19,843
The decline in EDF Energy’s provisions for decommissioning and last cores over first-half 2012
results from the 7-year extension to its nuclear plants’ operating lifetime (€(608) million for
decommissioning and €(146) million for last cores).
21.3 NUCLEAR PROVISIONS IN FRANCE
The measurement of provisions for the back-end of the nuclear cycle, nuclear plant
decommissioning and last cores is sensitive to assumptions concerning costs, inflation rate, long-
term discount rate, and disbursement schedules. A revised estimate is therefore established at
each closing date to ensure that the amounts accrued correspond to the best estimate of the
costs eventually to be borne by the Group.
For permanently shut-down nuclear power plants (UNGG power plants, Creys-Malville, Brennilis
and Chooz A), the provision is based on contractor quotes (costs and schedules) last updated in
2008. Re-examination of these quotes should be finalised during the second half of 2012.
The discount rate and calculation method used for provisions are identical to those used at 31
December 2011. The regulatory ceiling and factors concerning the sensitivity of provisions to
assumptions are also unchanged.
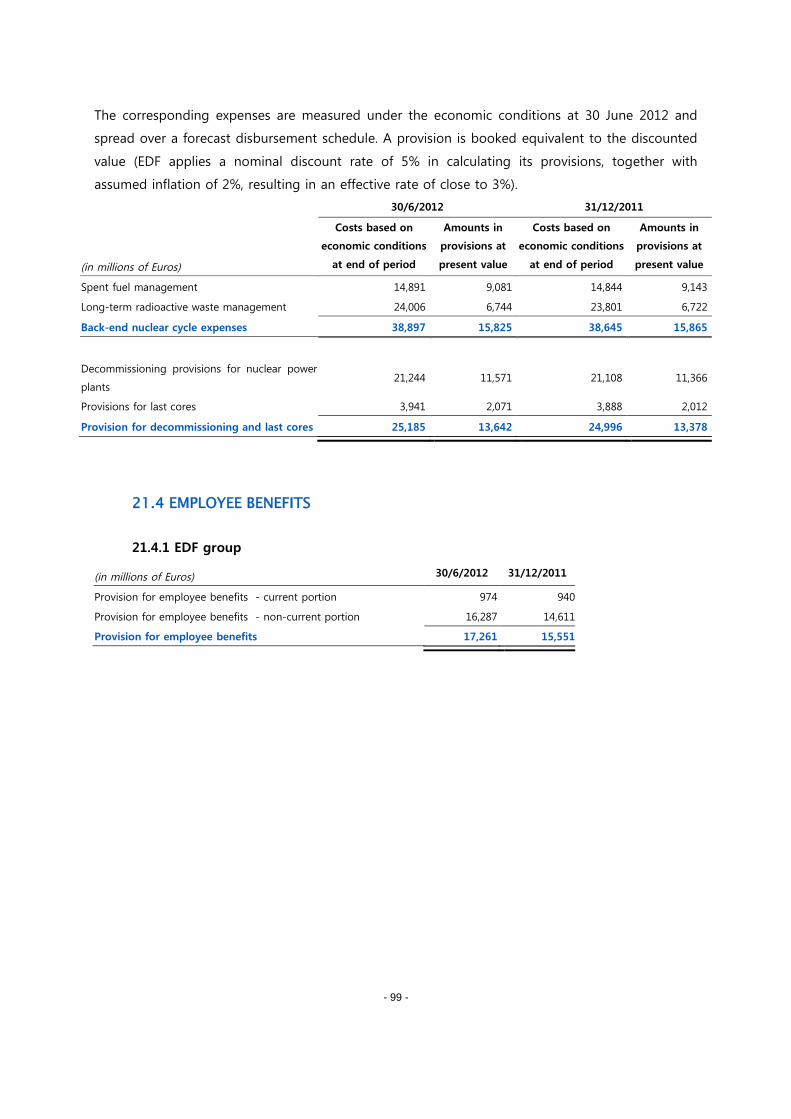
- 99 -
The corresponding expenses are measured under the economic conditions at 30 June 2012 and
spread over a forecast disbursement schedule. A provision is booked equivalent to the discounted
value (EDF applies a nominal discount rate of 5% in calculating its provisions, together with
assumed inflation of 2%, resulting in an effective rate of close to 3%).
30/6/2012 31/12/2011
(in millions of Euros)
Costs based on
economic conditions
at end of period
Amounts in
provisions at
present value
Costs based on
economic conditions
at end of period
Amounts in
provisions at
present value
Spent fuel management 14,891 9,081 14,844 9,143
Long-term radioactive waste management 24,006 6,744 23,801 6,722
Back-end nuclear cycle expenses 38,897 15,825 38,645 15,865
Decommissioning provisions for nuclear power
plants21,244 11,571 21,108 11,366
Provisions for last cores 3,941 2,071 3,888 2,012
Provision for decommissioning and last cores 25,185 13,642 24,996 13,378
21.4 EMPLOYEE BENEFITS
21.4.1 EDF group
(in millions of Euros) 30/6/2012 31/12/2011
Provision for employee benefits - current portion 974 940
Provision for employee benefits - non-current portion 16,287 14,611
Provision for employee benefits 17,261 15,551
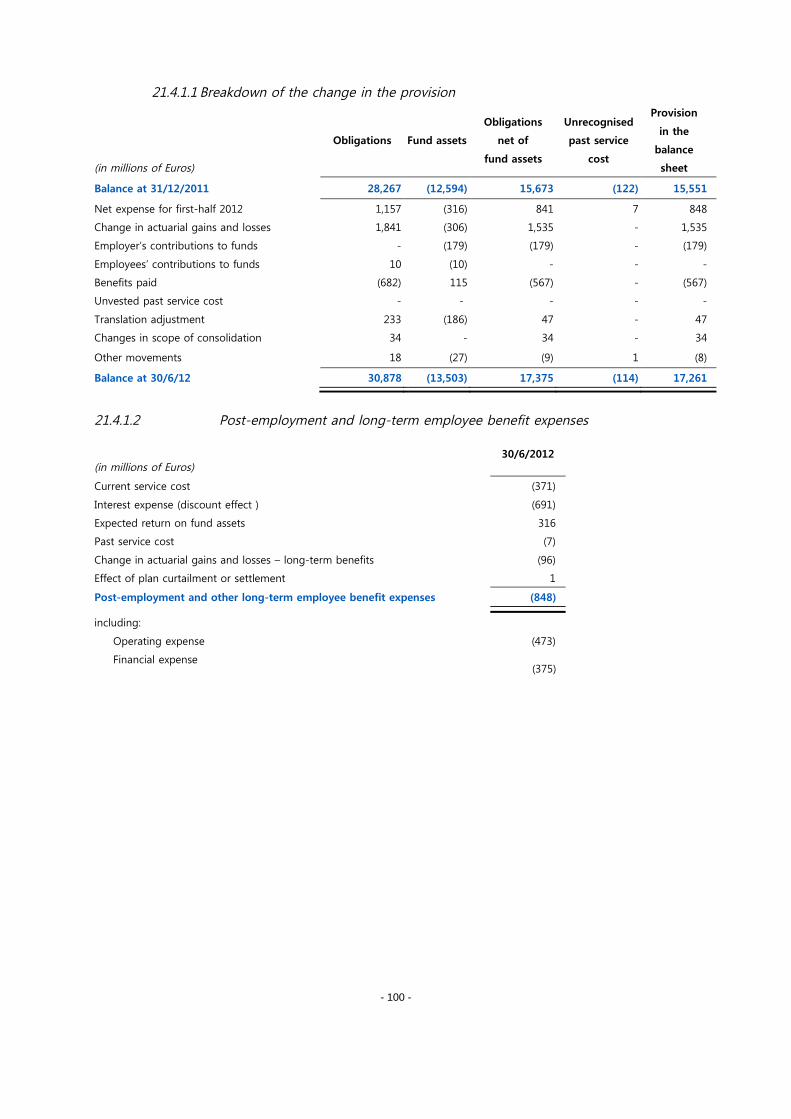
- 100 -
21.4.1.1 Breakdown of the change in the provision
(in millions of Euros)
Obligations Fund assets
Obligations
net of
fund assets
Unrecognised
past service
cost
Provision
in the
balance
sheet
Balance at 31/12/2011 28,267 (12,594) 15,673 (122) 15,551
Net expense for first-half 2012 1,157 (316) 841 7 848
Change in actuarial gains and losses 1,841 (306) 1,535 - 1,535
Employer’s contributions to funds - (179) (179) - (179)
Employees’ contributions to funds 10 (10) - - -
Benefits paid (682) 115 (567) - (567)
Unvested past service cost - - - - -
Translation adjustment 233 (186) 47 - 47
Changes in scope of consolidation 34 - 34 - 34
Other movements 18 (27) (9) 1 (8)
Balance at 30/6/12 30,878 (13,503) 17,375 (114) 17,261
21.4.1.2 Post-employment and long-term employee benefit expenses
(in millions of Euros)30/6/2012
Current service cost (371)
Interest expense (discount effect ) (691)
Expected return on fund assets 316
Past service cost (7)
Change in actuarial gains and losses – long-term benefits (96)
Effect of plan curtailment or settlement 1
Post-employment and other long-term employee benefit expenses (848)
including:
Operating expense (473)
Financial expense(375)
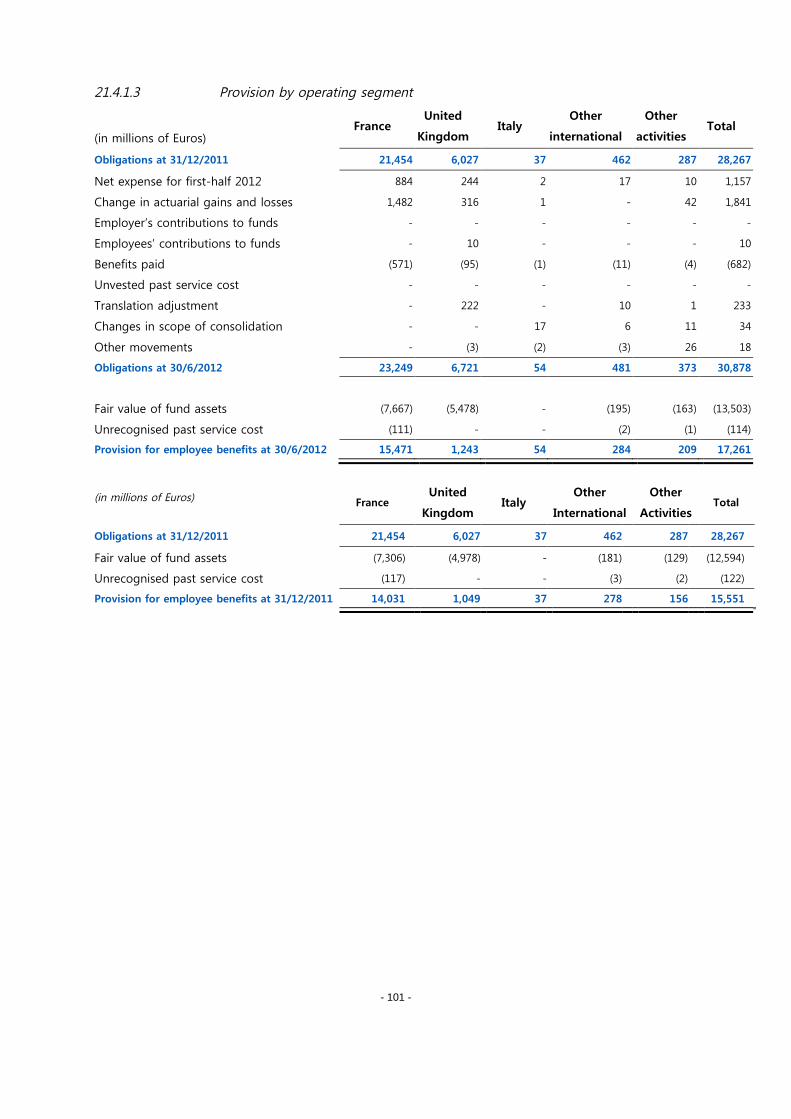
- 101 -
21.4.1.3 Provision by operating segment
(in millions of Euros)France
United
KingdomItaly
Other
international
Other
activitiesTotal
Obligations at 31/12/2011 21,454 6,027 37 462 287 28,267
Net expense for first-half 2012 884 244 2 17 10 1,157
Change in actuarial gains and losses 1,482 316 1 - 42 1,841
Employer’s contributions to funds - - - - - -
Employees’ contributions to funds - 10 - - - 10
Benefits paid (571) (95) (1) (11) (4) (682)
Unvested past service cost - - - - - -
Translation adjustment - 222 - 10 1 233
Changes in scope of consolidation - - 17 6 11 34
Other movements - (3) (2) (3) 26 18
Obligations at 30/6/2012 23,249 6,721 54 481 373 30,878
Fair value of fund assets (7,667) (5,478) - (195) (163) (13,503)
Unrecognised past service cost (111) - - (2) (1) (114)
Provision for employee benefits at 30/6/2012 15,471 1,243 54 284 209 17,261
(in millions of Euros) FranceUnited
KingdomItaly
Other
International
Other
ActivitiesTotal
Obligations at 31/12/2011 21,454 6,027 37 462 287 28,267
Fair value of fund assets (7,306) (4,978) - (181) (129) (12,594)
Unrecognised past service cost (117) - - (3) (2) (122)
Provision for employee benefits at 31/12/2011 14,031 1,049 37 278 156 15,551
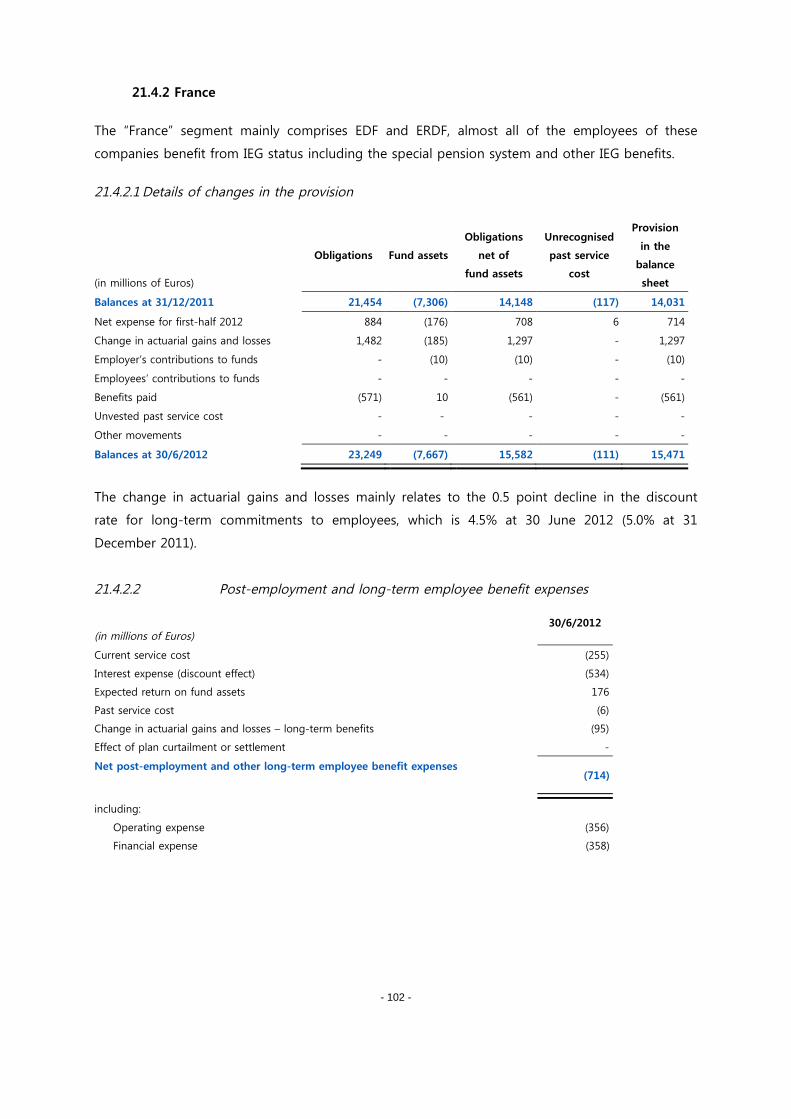
- 102 -
21.4.2 France
The “France” segment mainly comprises EDF and ERDF, almost all of the employees of these
companies benefit from IEG status including the special pension system and other IEG benefits.
21.4.2.1 Details of changes in the provision
(in millions of Euros)
Obligations Fund assets
Obligations
net of
fund assets
Unrecognised
past service
cost
Provision
in the
balance
sheet
Balances at 31/12/2011 21,454 (7,306) 14,148 (117) 14,031
Net expense for first-half 2012 884 (176) 708 6 714
Change in actuarial gains and losses 1,482 (185) 1,297 - 1,297
Employer’s contributions to funds - (10) (10) - (10)
Employees’ contributions to funds - - - - -
Benefits paid (571) 10 (561) - (561)
Unvested past service cost - - - - -
Other movements - - - - -
Balances at 30/6/2012 23,249 (7,667) 15,582 (111) 15,471
The change in actuarial gains and losses mainly relates to the 0.5 point decline in the discount
rate for long-term commitments to employees, which is 4.5% at 30 June 2012 (5.0% at 31
December 2011).
21.4.2.2 Post-employment and long-term employee benefit expenses
(in millions of Euros)30/6/2012
Current service cost (255)
Interest expense (discount effect) (534)
Expected return on fund assets 176
Past service cost (6)
Change in actuarial gains and losses – long-term benefits (95)
Effect of plan curtailment or settlement -
Net post-employment and other long-term employee benefit expenses(714)
including:
Operating expense (356)
Financial expense (358)
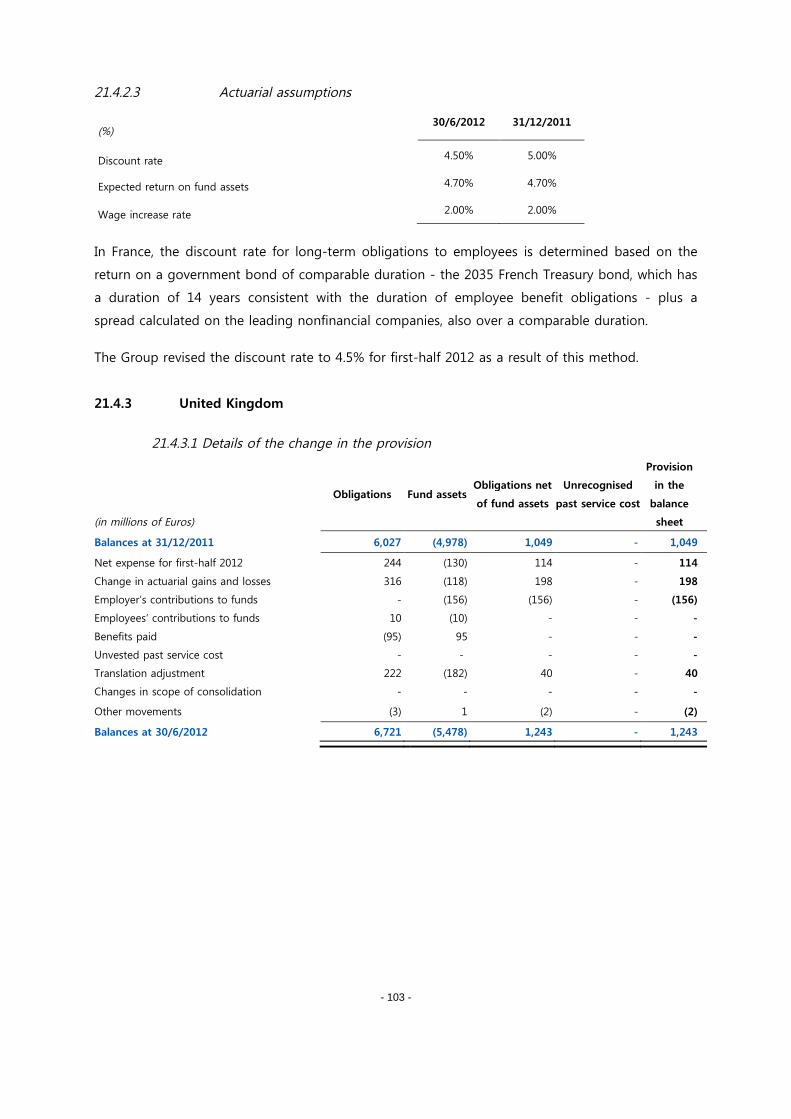
- 103 -
21.4.2.3 Actuarial assumptions
(%)30/6/2012 31/12/2011
Discount rate 4.50% 5.00%
Expected return on fund assets 4.70% 4.70%
Wage increase rate 2.00% 2.00%
In France, the discount rate for long-term obligations to employees is determined based on the
return on a government bond of comparable duration - the 2035 French Treasury bond, which has
a duration of 14 years consistent with the duration of employee benefit obligations - plus a
spread calculated on the leading nonfinancial companies, also over a comparable duration.
The Group revised the discount rate to 4.5% for first-half 2012 as a result of this method.
21.4.3 United Kingdom
21.4.3.1 Details of the change in the provision
(in millions of Euros)
Obligations Fund assetsObligations net
of fund assets
Unrecognised
past service cost
Provision
in the
balance
sheet
Balances at 31/12/2011 6,027 (4,978) 1,049 - 1,049
Net expense for first-half 2012 244 (130) 114 - 114
Change in actuarial gains and losses 316 (118) 198 - 198
Employer’s contributions to funds - (156) (156) - (156)
Employees’ contributions to funds 10 (10) - - -
Benefits paid (95) 95 - - -
Unvested past service cost - - - - -
Translation adjustment 222 (182) 40 - 40
Changes in scope of consolidation - - - - -
Other movements (3) 1 (2) - (2)
Balances at 30/6/2012 6,721 (5,478) 1,243 - 1,243
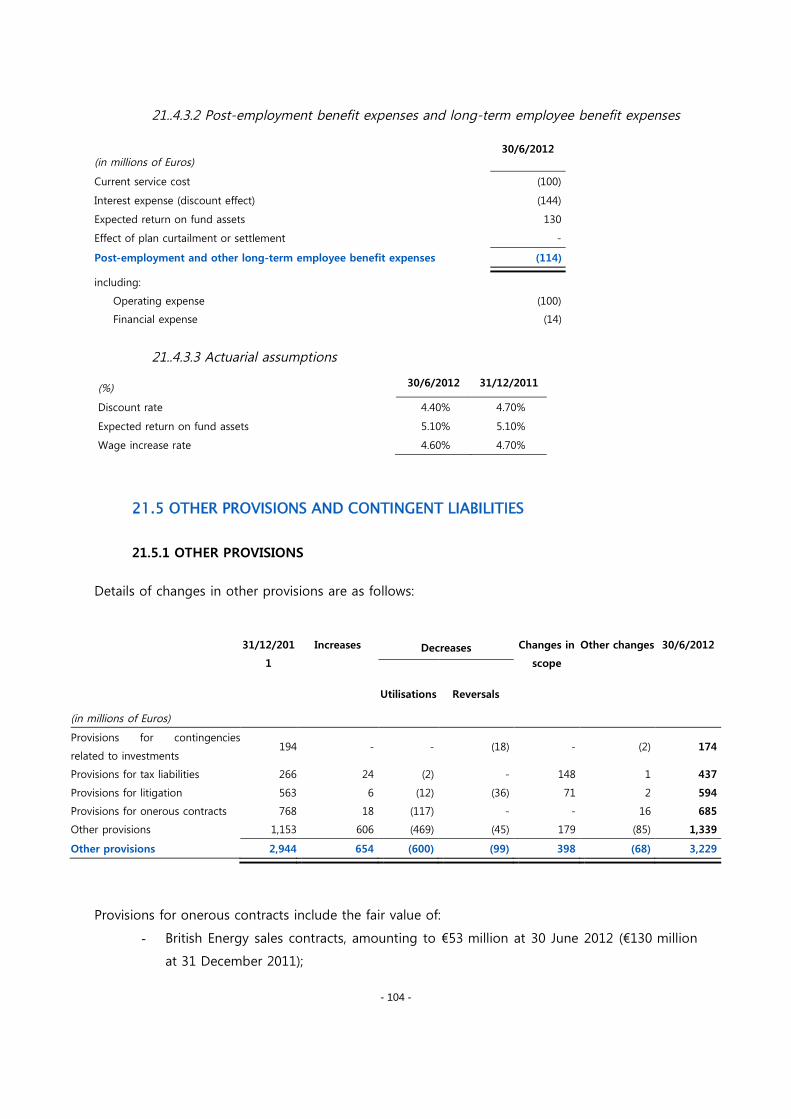
- 104 -
21..4.3.2 Post-employment benefit expenses and long-term employee benefit expenses
(in millions of Euros)30/6/2012
Current service cost (100)
Interest expense (discount effect) (144)
Expected return on fund assets 130
Effect of plan curtailment or settlement -
Post-employment and other long-term employee benefit expenses (114)
including:
Operating expense (100)
Financial expense (14)
21..4.3.3 Actuarial assumptions
(%) 30/6/2012 31/12/2011
Discount rate 4.40% 4.70%
Expected return on fund assets 5.10% 5.10%
Wage increase rate 4.60% 4.70%
21.5 OTHER PROVISIONS AND CONTINGENT LIABILITIES
21.5.1 OTHER PROVISIONS
Details of changes in other provisions are as follows:
Provisions for onerous contracts include the fair value of:
- British Energy sales contracts, amounting to €53 million at 30 June 2012 (€130 million
at 31 December 2011);
(in millions of Euros)
31/12/201
1
Increases Decreases Changes in
scope
Other changes 30/6/2012
Utilisations Reversals
Provisions for contingencies
related to investments194 - - (18) - (2) 174
Provisions for tax liabilities 266 24 (2) - 148 1 437
Provisions for litigation 563 6 (12) (36) 71 2 594
Provisions for onerous contracts 768 18 (117) - - 16 685
Other provisions 1,153 606 (469) (45) 179 (85) 1,339
Other provisions 2,944 654 (600) (99) 398 (68) 3,229
- 105 -
- CENG sales contracts amounting to €494 million at 30 June 2012 (€491 million at 31
December 2011).
At 30 June 2012, other provisions include provisions of €574 million for greenhouse gas emission
quotas and renewable energy certificates (€466 million at 31 December 2011).
21.5.2 CONTINGENT LIABILITIES
The main changes during the first half-year of 2012 compared to the contingent liabilities
reported in note 45 to the consolidated financial statements for 2011 are as follows:
21.5.2.1 Arbitration request by the Baden-Württemberg region / EnBW
On 22 February 2012 EDF International received a request for arbitration filed with the
International Chamber of Commerce by the German company Neckarpri GmbH, the vehicle for the
Baden-Württemberg region’s acquisition of the EDF group’s stake in EnBW, which was agreed on
6 December 2010 and completed on 17 February 2011.
Neckarpri claims that the price paid for the EDF group‘s investment in EnBW was excessive and
therefore constitutes illegal State aid. On those grounds, it is claiming reimbursement of the
allegedly excess portion of the price. This was initially estimated at €2 billion in the request for
arbitration, but was re-estimated at €840 million on 11 July 2012 in a new independent report on
the valuation of EnBW commissioned by Baden-Württemberg. Should the reimbursement claim be
rejected, as an alternative Neckarpri is seeking cancellation of the sale of the EDF group’s stake in
EnBW.
EDF considers this claim unfounded and a misuse of law, and intends to sue for damages for all
the kinds of prejudices caused by this action.
21.5.2.2 General Network – Rejection of the European Commission’s appeal
On 15 December 2009 the European Union Court cancelled the European Commission’s decision
of 16 December 2003 that had classified the tax treatment of provisions created for the renewal of
the General Network at the time of EDF’s capital increase in 1997 as state aid, and ordered
repayment to the French State of the discounted value, i.e. €1,224 million (paid by EDF in February
2004). The State therefore reimbursed this amount to EDF on 30 December 2009, then in February
2010 the European Commission filed an appeal before the Court of Justice of the European Union.
On 5 June 2012, the Court of Justice of the European Union issued a decision rejecting the
European Commission’s appeal and upheld the European Union Court’s decision of 15 December
2009.
- 106 -
21.5.2.3 ERDF – Action against TURPE 3 tariff decisions
On 17 August 2009, a claim was filed with the French Council of State by certain energy market
players, seeking cancellation of the TURPE3 tariff decisions of 5 May and 5 June 2009.
The Council of State gave a decision on 28 March 2012 which confirmed the validity of the
procedure for adopting TURPE 3. However, before delivering a judgment on the substance of the
case, it has requested an independent expert’s opinion, in particular on the method used to
determine the weighted average cost of capital.
21.5.2.4 Edison mandatory tender offer – Appeal of Carlo Tassara
Carlo Tassara S.p.A., Edison’s largest minority shareholder, initiated action on 12 July 2012 before
the Lazio (Rome) Regional Administrative Court, seeking an increase in the price of the mandatory
tender offer for Edison shares launched by TdE. Carlo Tassara is also petitioning for suspension of
the CONSOB’s decision of 3 May 2012 allowing TdE to launch the offer at the price of €0.89 per
share, and therefore suspension of the offer currently in process. At the court hearing on the
question of suspension held on 25 July 2012, the court rejected the petition for suspension as the
CONSOB had not given any decision in response to Carlo Tassara’s application for an increase in
the offer price (see below). A further hearing has therefore been scheduled for 30 August 2012.
Whatever the court decides regarding suspension, its decision regarding the question of the €0.89
offer price is not expected to be issued before late 2012 at the soonest.
In parallel, on 31 May 2012 Carlo Tassara submitted an application to the CONSOB for an increase
in the price of the mandatory tender offer. The deadline for the CONSOB’s reply is 3 August 2012.
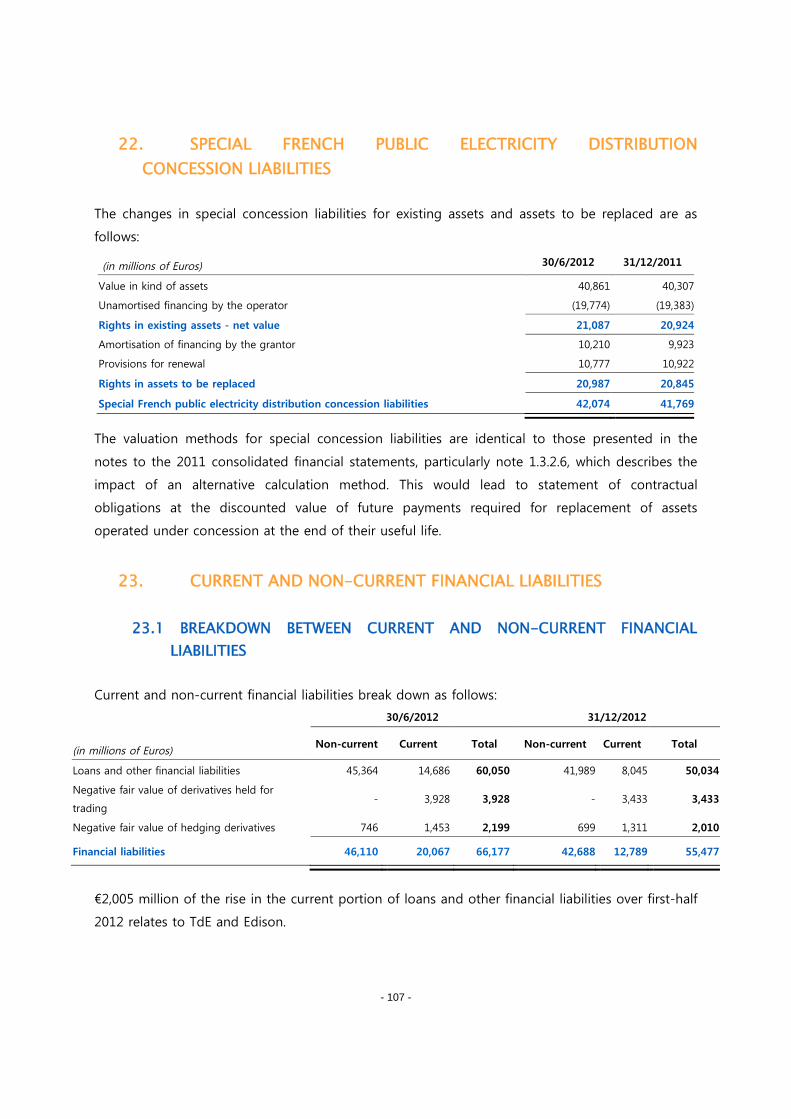
- 107 -
22. SPECIAL FRENCH PUBLIC ELECTRICITY DISTRIBUTION
CONCESSION LIABILITIES
The changes in special concession liabilities for existing assets and assets to be replaced are as
follows:
(in millions of Euros) 30/6/2012 31/12/2011
Value in kind of assets 40,861 40,307
Unamortised financing by the operator (19,774) (19,383)
Rights in existing assets - net value 21,087 20,924
Amortisation of financing by the grantor 10,210 9,923
Provisions for renewal 10,777 10,922
Rights in assets to be replaced 20,987 20,845
Special French public electricity distribution concession liabilities 42,074 41,769
The valuation methods for special concession liabilities are identical to those presented in the
notes to the 2011 consolidated financial statements, particularly note 1.3.2.6, which describes the
impact of an alternative calculation method. This would lead to statement of contractual
obligations at the discounted value of future payments required for replacement of assets
operated under concession at the end of their useful life.
23. CURRENT AND NON-CURRENT FINANCIAL LIABILITIES
23.1 BREAKDOWN BETWEEN CURRENT AND NON-CURRENT FINANCIAL
LIABILITIES
Current and non-current financial liabilities break down as follows:
30/6/2012 31/12/2012
(in millions of Euros)Non-current Current Total Non-current Current Total
Loans and other financial liabilities 45,364 14,686 60,050 41,989 8,045 50,034
Negative fair value of derivatives held for
trading- 3,928 3,928 - 3,433 3,433
Negative fair value of hedging derivatives 746 1,453 2,199 699 1,311 2,010
Financial liabilities 46,110 20,067 66,177 42,688 12,789 55,477
€2,005 million of the rise in the current portion of loans and other financial liabilities over first-half
2012 relates to TdE and Edison.
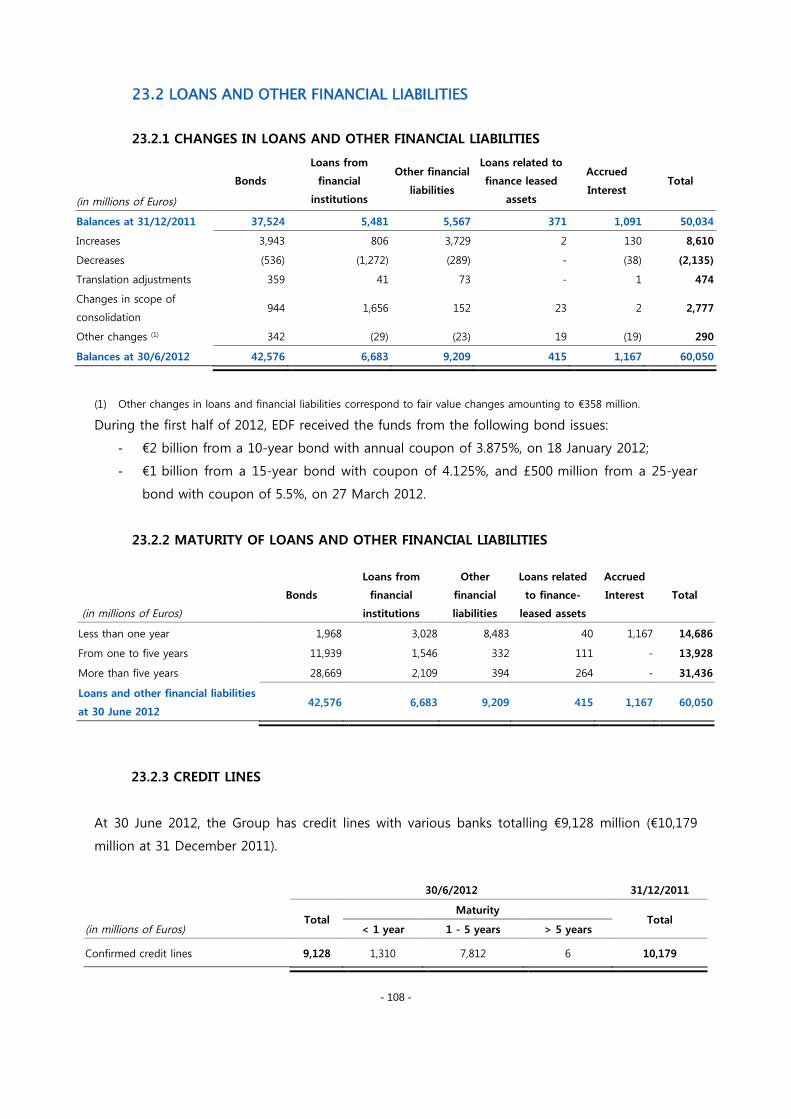
- 108 -
23.2 LOANS AND OTHER FINANCIAL LIABILITIES
23.2.1 CHANGES IN LOANS AND OTHER FINANCIAL LIABILITIES
(in millions of Euros)
Bonds
Loans from
financial
institutions
Other financial
liabilities
Loans related to
finance leased
assets
Accrued
InterestTotal
Balances at 31/12/2011 37,524 5,481 5,567 371 1,091 50,034
Increases 3,943 806 3,729 2 130 8,610
Decreases (536) (1,272) (289) - (38) (2,135)
Translation adjustments 359 41 73 - 1 474
Changes in scope of
consolidation944 1,656 152 23 2 2,777
Other changes (1) 342 (29) (23) 19 (19) 290
Balances at 30/6/2012 42,576 6,683 9,209 415 1,167 60,050
(1) Other changes in loans and financial liabilities correspond to fair value changes amounting to €358 million.
During the first half of 2012, EDF received the funds from the following bond issues:
- €2 billion from a 10-year bond with annual coupon of 3.875%, on 18 January 2012;
- €1 billion from a 15-year bond with coupon of 4.125%, and £500 million from a 25-year
bond with coupon of 5.5%, on 27 March 2012.
23.2.2 MATURITY OF LOANS AND OTHER FINANCIAL LIABILITIES
(in millions of Euros)
Bonds
Loans from
financial
institutions
Other
financial
liabilities
Loans related
to finance-
leased assets
Accrued
Interest Total
Less than one year 1,968 3,028 8,483 40 1,167 14,686
From one to five years 11,939 1,546 332 111 - 13,928
More than five years 28,669 2,109 394 264 - 31,436
Loans and other financial liabilities
at 30 June 201242,576 6,683 9,209 415 1,167 60,050
23.2.3 CREDIT LINES
At 30 June 2012, the Group has credit lines with various banks totalling €9,128 million (€10,179
million at 31 December 2011).
30/6/2012 31/12/2011
TotalMaturity
Total(in millions of Euros) < 1 year 1 - 5 years > 5 years
Confirmed credit lines 9,128 1,310 7,812 6 10,179
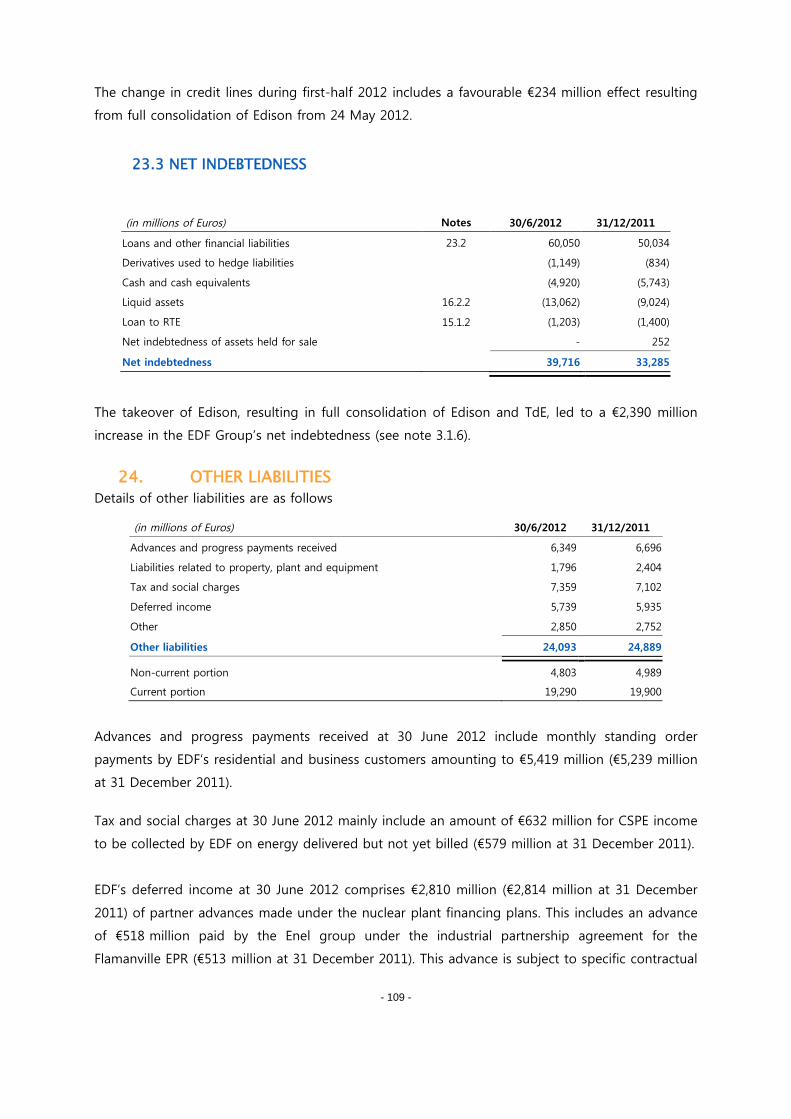
- 109 -
The change in credit lines during first-half 2012 includes a favourable €234 million effect resulting
from full consolidation of Edison from 24 May 2012.
23.3 NET INDEBTEDNESS
(in millions of Euros) Notes 30/6/2012 31/12/2011
Loans and other financial liabilities 23.2 60,050 50,034
Derivatives used to hedge liabilities (1,149) (834)
Cash and cash equivalents (4,920) (5,743)
Liquid assets 16.2.2 (13,062) (9,024)
Loan to RTE 15.1.2 (1,203) (1,400)
Net indebtedness of assets held for sale - 252
Net indebtedness 39,716 33,285
The takeover of Edison, resulting in full consolidation of Edison and TdE, led to a €2,390 million
increase in the EDF Group’s net indebtedness (see note 3.1.6).
24. OTHER LIABILITIES
Details of other liabilities are as follows
(in millions of Euros) 30/6/2012 31/12/2011
Advances and progress payments received 6,349 6,696
Liabilities related to property, plant and equipment 1,796 2,404
Tax and social charges 7,359 7,102
Deferred income 5,739 5,935
Other 2,850 2,752
Other liabilities 24,093 24,889
Non-current portion 4,803 4,989
Current portion 19,290 19,900
Advances and progress payments received at 30 June 2012 include monthly standing order
payments by EDF’s residential and business customers amounting to €5,419 million (€5,239 million
at 31 December 2011).
Tax and social charges at 30 June 2012 mainly include an amount of €632 million for CSPE income
to be collected by EDF on energy delivered but not yet billed (€579 million at 31 December 2011).
EDF’s deferred income at 30 June 2012 comprises €2,810 million (€2,814 million at 31 December
2011) of partner advances made under the nuclear plant financing plans. This includes an advance
of €518 million paid by the Enel group under the industrial partnership agreement for the
Flamanville EPR (€513 million at 31 December 2011). This advance is subject to specific contractual
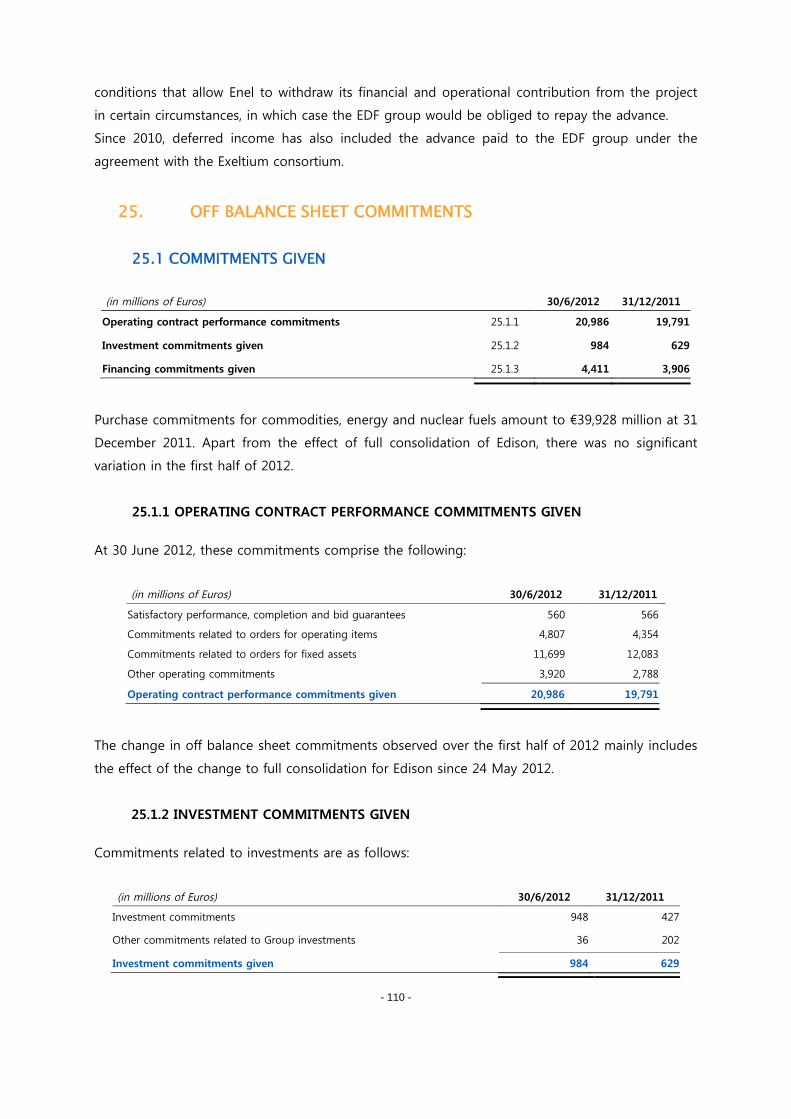
- 110 -
conditions that allow Enel to withdraw its financial and operational contribution from the project
in certain circumstances, in which case the EDF group would be obliged to repay the advance.
Since 2010, deferred income has also included the advance paid to the EDF group under the
agreement with the Exeltium consortium.
25. OFF BALANCE SHEET COMMITMENTS
25.1 COMMITMENTS GIVEN
(in millions of Euros) 30/6/2012 31/12/2011
Operating contract performance commitments 25.1.1 20,986 19,791
Investment commitments given 25.1.2 984 629
Financing commitments given 25.1.3 4,411 3,906
Purchase commitments for commodities, energy and nuclear fuels amount to €39,928 million at 31
December 2011. Apart from the effect of full consolidation of Edison, there was no significant
variation in the first half of 2012.
25.1.1 OPERATING CONTRACT PERFORMANCE COMMITMENTS GIVEN
At 30 June 2012, these commitments comprise the following:
(in millions of Euros) 30/6/2012 31/12/2011
Satisfactory performance, completion and bid guarantees 560 566
Commitments related to orders for operating items 4,807 4,354
Commitments related to orders for fixed assets 11,699 12,083
Other operating commitments 3,920 2,788
Operating contract performance commitments given 20,986 19,791
The change in off balance sheet commitments observed over the first half of 2012 mainly includes
the effect of the change to full consolidation for Edison since 24 May 2012.
25.1.2 INVESTMENT COMMITMENTS GIVEN
Commitments related to investments are as follows:
(in millions of Euros) 30/6/2012 31/12/2011
Investment commitments 948 427
Other commitments related to Group investments 36 202
Investment commitments given 984 629
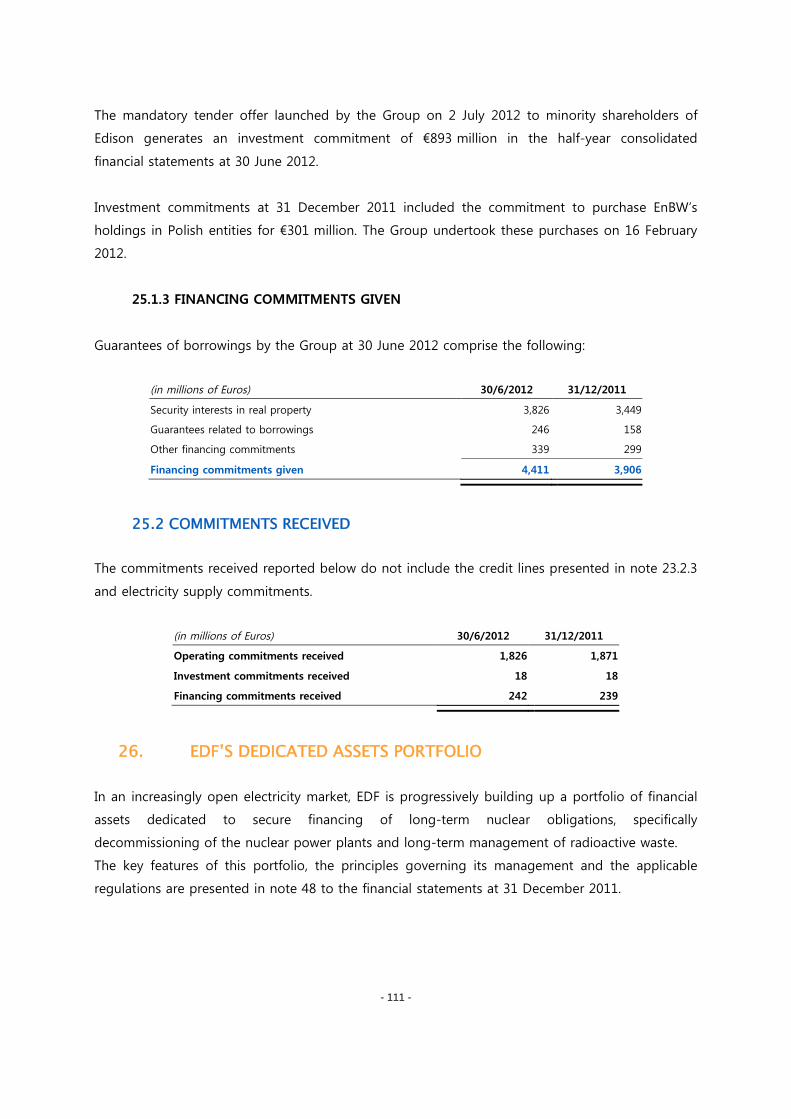
- 111 -
The mandatory tender offer launched by the Group on 2 July 2012 to minority shareholders of
Edison generates an investment commitment of €893 million in the half-year consolidated
financial statements at 30 June 2012.
Investment commitments at 31 December 2011 included the commitment to purchase EnBW’s
holdings in Polish entities for €301 million. The Group undertook these purchases on 16 February
2012.
25.1.3 FINANCING COMMITMENTS GIVEN
Guarantees of borrowings by the Group at 30 June 2012 comprise the following:
(in millions of Euros) 30/6/2012 31/12/2011
Security interests in real property 3,826 3,449
Guarantees related to borrowings 246 158
Other financing commitments 339 299
Financing commitments given 4,411 3,906
25.2 COMMITMENTS RECEIVED
The commitments received reported below do not include the credit lines presented in note 23.2.3
and electricity supply commitments.
(in millions of Euros) 30/6/2012 31/12/2011
Operating commitments received 1,826 1,871
Investment commitments received 18 18
Financing commitments received 242 239
26. EDF’S DEDICATED ASSETS PORTFOLIO
In an increasingly open electricity market, EDF is progressively building up a portfolio of financial
assets dedicated to secure financing of long-term nuclear obligations, specifically
decommissioning of the nuclear power plants and long-term management of radioactive waste.
The key features of this portfolio, the principles governing its management and the applicable
regulations are presented in note 48 to the financial statements at 31 December 2011.
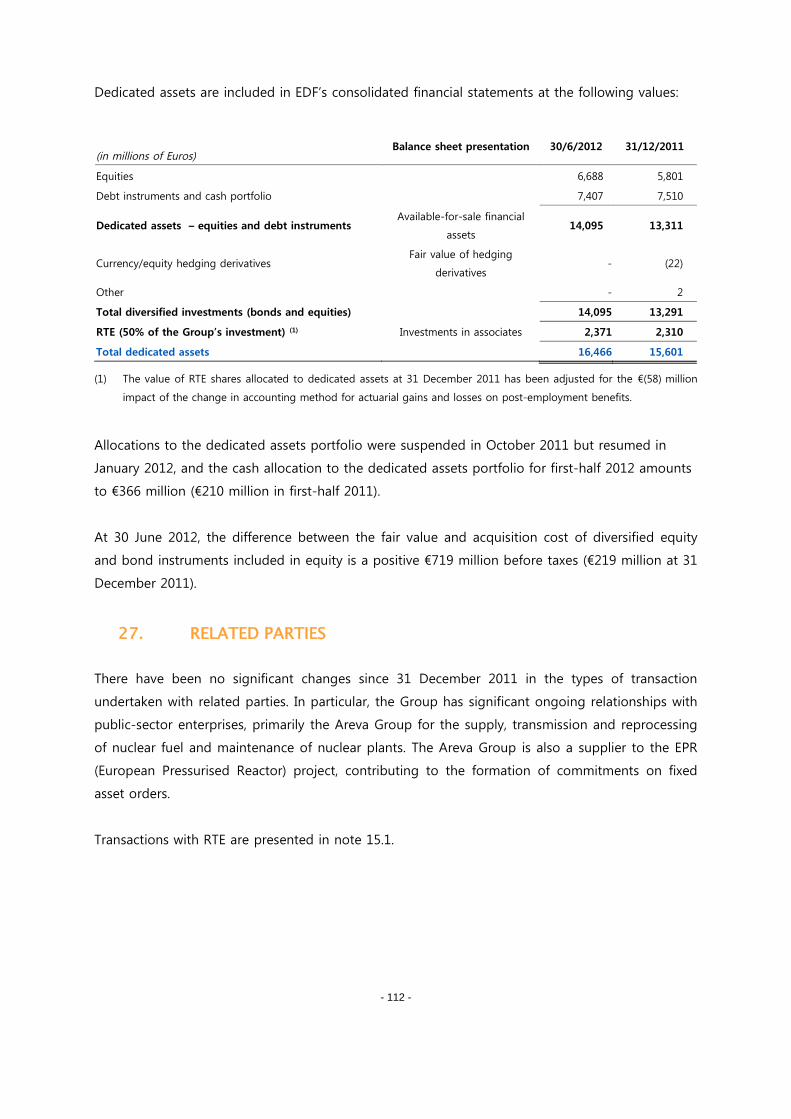
- 112 -
Dedicated assets are included in EDF’s consolidated financial statements at the following values:
Balance sheet presentation 30/6/2012 31/12/2011(in millions of Euros)
Equities 6,688 5,801
Debt instruments and cash portfolio 7,407 7,510
Dedicated assets – equities and debt instrumentsAvailable-for-sale financial
assets14,095 13,311
Currency/equity hedging derivativesFair value of hedging
derivatives- (22)
Other - 2
Total diversified investments (bonds and equities) 14,095 13,291
RTE (50% of the Group’s investment) (1) Investments in associates 2,371 2,310
Total dedicated assets 16,466 15,601
(1) The value of RTE shares allocated to dedicated assets at 31 December 2011 has been adjusted for the €(58) million
impact of the change in accounting method for actuarial gains and losses on post-employment benefits.
Allocations to the dedicated assets portfolio were suspended in October 2011 but resumed in
January 2012, and the cash allocation to the dedicated assets portfolio for first-half 2012 amounts
to €366 million (€210 million in first-half 2011).
At 30 June 2012, the difference between the fair value and acquisition cost of diversified equity
and bond instruments included in equity is a positive €719 million before taxes (€219 million at 31
December 2011).
27. RELATED PARTIES
There have been no significant changes since 31 December 2011 in the types of transaction
undertaken with related parties. In particular, the Group has significant ongoing relationships with
public-sector enterprises, primarily the Areva Group for the supply, transmission and reprocessing
of nuclear fuel and maintenance of nuclear plants. The Areva Group is also a supplier to the EPR
(European Pressurised Reactor) project, contributing to the formation of commitments on fixed
asset orders.
Transactions with RTE are presented in note 15.1.
- 113 -
28. SUBSEQUENT EVENTS
28.1 MANDATORY TENDER OFFER BY THE EDF GROUP FOR EDISON SHARES
On 27 June 2012 the Italian market authority CONSOB authorised Transalpina di Energia S.r.l.
(TdE), a fully-owned EDF group subsidiary, to launch the mandatory tender offer as announced for
the ordinary shares in Edison S.p.A. it does not yet own. This concerns 1,003,045,298 shares
representing 19.36% of the capital of Edison and the offer price is €0.89 per share.
The offer opened on 2 July 2012 and will close on 3 August 2012 unless it is extended.
- 114 -
STATUTORY AUDITORS' REVIEW REPORT ON THE FIRST HALF-YEAR FINANCIAL
INFORMATION FOR 2012
This is a free translation into English of the statutory auditors’ review report issued in French and is
provided solely for the convenience of English-speaking readers. This report includes information
relating to the specific verification of information presented in the Group’s interim management report.
This report should be read in conjunction with, and is construed in accordance with, French law and
professional auditing standards applicable in France.
Electricité de France S.A.
Registered office: 22-30, avenue de Wagram – 75008 Paris
Statutory Auditors’ Review Report on the interim condensed consolidated financial statements
For the six-month period ended June 30, 2012
To the Shareholders,
Following our appointment as statutory auditors by your General Meeting, and in accordance with
article L.451-1-2 III of the French Monetary and Financial Law (“Code monétaire et financier”), we
hereby report to you on:
- the review of the accompanying interim condensed consolidated financial statements of
Electricité de France S.A. for the six-month period ended June 30, 2012;
- the verification of information contained in the half-yearly management report.
These interim condensed consolidated financial statements are the responsibility of your Board of
Directors. Our role is to express a conclusion on these financial statements based on our review.
I. Conclusion on the financial statements
We conducted our review in accordance with professional standards applicable in France. A review of
interim financial information consists of making inquiries, primarily of persons responsible for financial
and accounting matters, and applying analytical and other review procedures. A review is substantially
less in scope than an audit conducted in accordance with professional standards applicable in France.
Consequently this does not enable us to obtain assurance that we would become aware of all
significant matters that might be identified in an audit. Accordingly, we do not express an audit opinion.
Based on our review, nothing has come to our attention that causes us to believe that the
accompanying interim condensed consolidated financial statements are not prepared in all material
respects in accordance with IAS 34 – the standard of IFRS as adopted by the European Union
applicable to interim financial reporting.
Without qualifying our opinion, we draw your attention to the following matters set out in the notes to
the interim condensed consolidated financial statements:
· the change in accounting policy set out in note 1.2 related to the accounting for actuarial gains and
losses on provisions for post-employment benefits;
- 115 -
· the allocation of the cost of the business combination to identifiable assets acquired and liabilities
assumed related to Edison in accordance with IFRS 3 revised, and the methodologies and main
assumptions being considered for measurement of those assets and liabilities at fair values, as set out
in note 3.1.;
· the shortfall in the collection of the Contribution to the Electricity Public Service Costs (Contribution
au Service Public de l’Electricité), in continuous increase, amounts to approximately €700 million for
the first semester of 2012, for an aggregate amount of €4.5 billion as of June 30th, 2012. As indicated
in the assumptions set forth in note 18, the shortfall is accounted for at its nominal value as accrued
income, does not bear interest, and the timing of collection is currently expected for 2016;
· the valuation of long-term provisions relating to nuclear electricity production, which results from
management’s best estimates, as described in notes 21.2 and 21.3. This valuation is sensitive to the
assumptions made concerning costs, inflation and long-term discount rates, as well as forecast cash
outflows. Changes in these parameters could lead to a material revision of the level of provisioning;
II. Specific verification
We have also verified information presented in the half-year management report on the interim
condensed consolidated financial statements that were subject to our review. We have no matters to
report as to its fair presentation and consistency with the interim condensed consolidated financial
statements.
Paris la Défense and Neuilly-sur-Seine on July 30, 2012
The Statutory Auditors
KPMG Audit
Department of KPMG S.A.Deloitte & Associés
Bernard CattenozJacques-François
LethuAlain Pons Patrick E. Suissa
- 116 -
Electricité de France S.A.
Siège social : 22-30, avenue de Wagram - 75008 Paris
Rapport des Commissaires aux comptes sur l’information financière semestrielle 2012
Période du 1er janvier au 30 juin 2012
Mesdames, Messieurs les Actionnaires,
En exécution de la mission qui nous a été confiée par votre Assemblée générale et en application de
l’article L.451-1-2 III du Code monétaire et financier, nous avons procédé à :
● l'examen limité des comptes semestriels consolidés résumés de la société Electricité de
France S.A., relatifs à la période du 1er janvier au 30 juin 2012, tels qu'ils sont joints au
présent rapport ;
● la vérification des informations données dans le rapport semestriel d'activité.
Ces comptes semestriels consolidés résumés ont été établis sous la responsabilité de votre Conseil
d’administration. Il nous appartient, sur la base de notre examen limité, d'exprimer notre conclusion
sur ces comptes.
I – Conclusion sur les comptes
Nous avons effectué notre examen limité selon les normes d'exercice professionnel applicables en
France. Un examen limité consiste essentiellement à s'entretenir avec les membres de la direction en
charge des aspects comptables et financiers et à mettre en œuvre des procédures analytiques. Ces
travaux sont moins étendus que ceux requis pour un audit effectué selon les normes d'exercice
professionnel applicables en France. En conséquence, l’assurance que les comptes, pris dans leur
ensemble, ne comportent pas d’anomalies significatives obtenue dans le cadre d’un examen limité est
une assurance modérée, moins élevée que celle obtenue dans le cadre d’un audit.
Sur la base de notre examen limité, nous n'avons pas relevé d'anomalies significatives de nature à
remettre en cause la conformité des comptes semestriels consolidés résumés avec la norme IAS 34
du référentiel IFRS tel qu’adopté dans l’Union européenne relative à l’information financière
intermédiaire.
- 117 -
Sans remettre en cause la conclusion exprimée ci-dessus, nous attirons votre attention sur les points
suivants exposés dans les notes aux comptes semestriels consolidés résumés :
● le changement de méthode comptable décrit en note 1.2 et relatif à la comptabilisation des
écarts actuariels relatifs aux avantages du personnel postérieurs à l'emploi ;
● l'allocation du coût du regroupement aux actifs identifiables acquis et passifs repris d'Edison
conformément aux dispositions de la norme IFRS 3 révisée, ainsi que les méthodologies et
les principales hypothèses retenues pour évaluer ces actifs et passifs à leur juste valeur,
présentées en note 3.1 ;
● le déficit de collecte de la Contribution au Service Public de l'Electricité, en progression
constante, s'élève à environ 700 millions d'euros sur le premier semestre 2012 et atteint un
montant de 4,5 milliards d'euros au 30 juin 2012. Conformément aux indications et
hypothèses mentionnées en note 18, ce déficit est comptabilisé à sa valeur nominale en
produits à recevoir, ne porte pas intérêt et l'horizon de recouvrement est actuellement estimé
à 2016 ;
● l'évaluation des provisions de long terme liées à la production nucléaire, qui résulte des
meilleures estimations de la Direction et dont les modalités de détermination sont décrites
dans les notes 21.2 et 21.3. Cette évaluation est sensible aux hypothèses retenues en termes
de coûts, de taux d'inflation et d'actualisation à long terme ainsi que d'échéanciers de
décaissements. La modification de certains de ces paramètres pourrait conduire à une
révision significative des provisions comptabilisées.
II – Vérification spécifique
Nous avons également procédé à la vérification des informations données dans le rapport semestriel
d'activité commentant les comptes semestriels consolidés résumés sur lesquels a porté notre examen
limité. Nous n'avons pas d'observation à formuler sur leur sincérité et leur concordance avec les
comptes semestriels consolidés résumés.
Paris La Défense et Neuilly-sur-Seine, le 30 juillet 2012
Les Commissaires aux comptes
KPMG Audit
Département de KPMG S.A.Deloitte & Associés
Bernard CattenozJacques-François
LethuAlain Pons Patrick E. Suissa
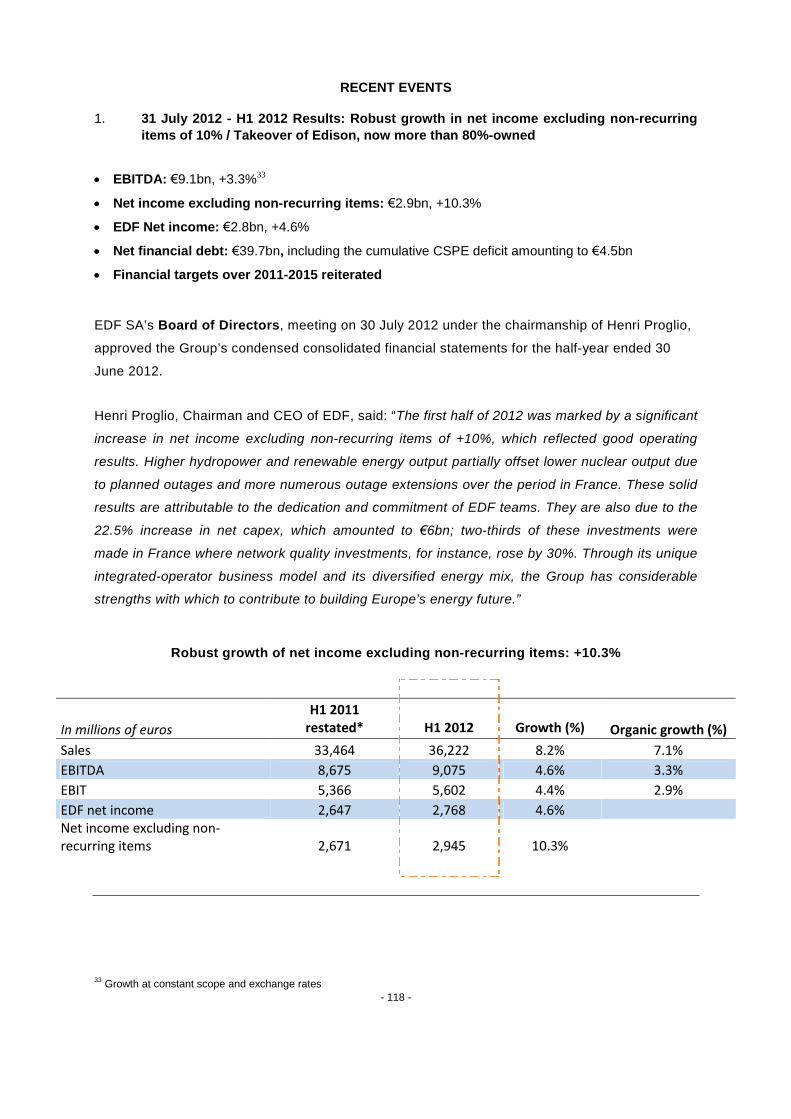
- 118 -
RECENT EVENTS
1. 31 July 2012 - H1 2012 Results: Robust growth in net income excluding non-recurring
items of 10% / Takeover of Edison, now more than 80%-owned
EBITDA: €9.1bn, +3.3%33
Net income excluding non-recurring items: €2.9bn, +10.3%
EDF Net income: €2.8bn, +4.6%
Net financial debt: €39.7bn, including the cumulative CSPE deficit amounting to €4.5bn
Financial targets over 2011-2015 reiterated
EDF SA’s Board of Directors, meeting on 30 July 2012 under the chairmanship of Henri Proglio,
approved the Group’s condensed consolidated financial statements for the half-year ended 30
June 2012.
Henri Proglio, Chairman and CEO of EDF, said: “The first half of 2012 was marked by a significant
increase in net income excluding non-recurring items of +10%, which reflected good operating
results. Higher hydropower and renewable energy output partially offset lower nuclear output due
to planned outages and more numerous outage extensions over the period in France. These solid
results are attributable to the dedication and commitment of EDF teams. They are also due to the
22.5% increase in net capex, which amounted to €6bn; two-thirds of these investments were
made in France where network quality investments, for instance, rose by 30%. Through its unique
integrated-operator business model and its diversified energy mix, the Group has considerable
strengths with which to contribute to building Europe’s energy future.”
Robust growth of net income excluding non-recurring items: +10.3%
In millions of euros
H1 2011restated* H1 2012 Growth (%) Organic growth (%)
Sales 33,464 36,222 8.2% 7.1%
EBITDA 8,675 9,075 4.6% 3.3%
EBIT 5,366 5,602 4.4% 2.9%
EDF net income 2,647 2,768 4.6%Net income excluding non-recurring items 2,671 2,945 10.3%
33 Growth at constant scope and exchange rates
- 119 -
*Data restated for the impact of the IAS 19 option (SoRIE method). (Refer to the appendices for more details on
this restatement).
EDF Net income rose to €2,768 million, versus €2,647 million in H1 2011, representing an increase of
4.6%. It includes negative non-recurring items net of tax totalling €177 million (-€24 million in H1
2011).
Net income excluding non-recurring items reached €2,945 million, up sharply by 10.3% versus H1
2011.
This strong growth resulted particularly from a significant increase in operating results in H1 2012 and
the stability of the net financial charge.
Group EBITDA reached €9,075 million, i.e. organic growth of 3.3%, driven by regulated activities in
France and renewable energies.
In France, organic EBITDA growth was 6.3%, led by regulated activities, which posted organic growth
of 34.1%, while unregulated activities were down 4.2% in organic terms. This major increase in
EBITDA in France amid a difficult environment reflects, notably, a good control over costs, which are
falling in real terms34.
EBITDA from International and Other Activities was down slightly by 2.6% in organic terms and would
have increased if stripped off the accounting impact of the initial consolidation of British Energy35.
International Activities were marked by a busier nuclear tranche outage programme in the United
Kingdom and to an unfavourable economic and regulatory environment respectively in the Italy and
the Other International segments.
Growth of EBITDA from the Other Activities segment was strong, with an organic increase of 28.4%,
on the back of a substantial contribution from EDF Energies Nouvelles (+70.5% in organic growth).
34 Excluding the impact of the government’s measures on social contributions35 Impact of the fair value adjustment on certain items from the acquisition of British Energy (organic change of -€100
million)
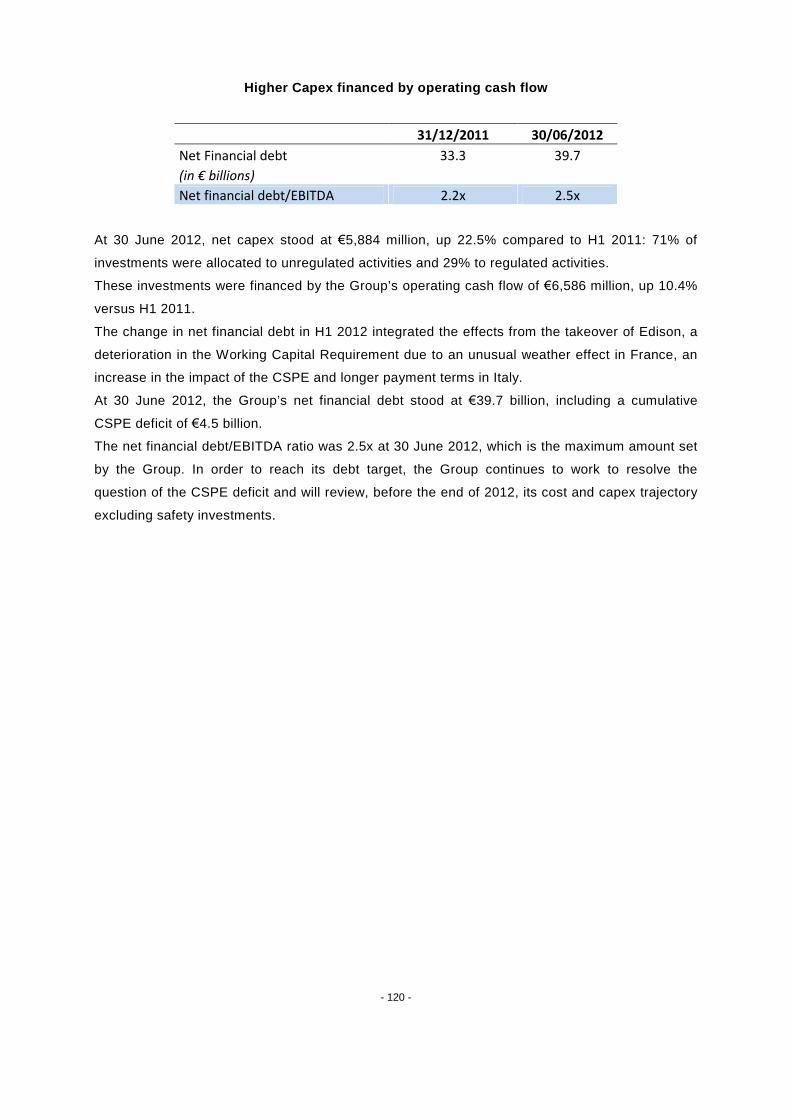
- 120 -
Higher Capex financed by operating cash flow
31/12/2011 30/06/2012
Net Financial debt 33.3 39.7
(in € billions)
Net financial debt/EBITDA 2.2x 2.5x
At 30 June 2012, net capex stood at €5,884 million, up 22.5% compared to H1 2011: 71% of
investments were allocated to unregulated activities and 29% to regulated activities.
These investments were financed by the Group’s operating cash flow of €6,586 million, up 10.4%
versus H1 2011.
The change in net financial debt in H1 2012 integrated the effects from the takeover of Edison, a
deterioration in the Working Capital Requirement due to an unusual weather effect in France, an
increase in the impact of the CSPE and longer payment terms in Italy.
At 30 June 2012, the Group’s net financial debt stood at €39.7 billion, including a cumulative
CSPE deficit of €4.5 billion.
The net financial debt/EBITDA ratio was 2.5x at 30 June 2012, which is the maximum amount set
by the Group. In order to reach its debt target, the Group continues to work to resolve the
question of the CSPE deficit and will review, before the end of 2012, its cost and capex trajectory
excluding safety investments.
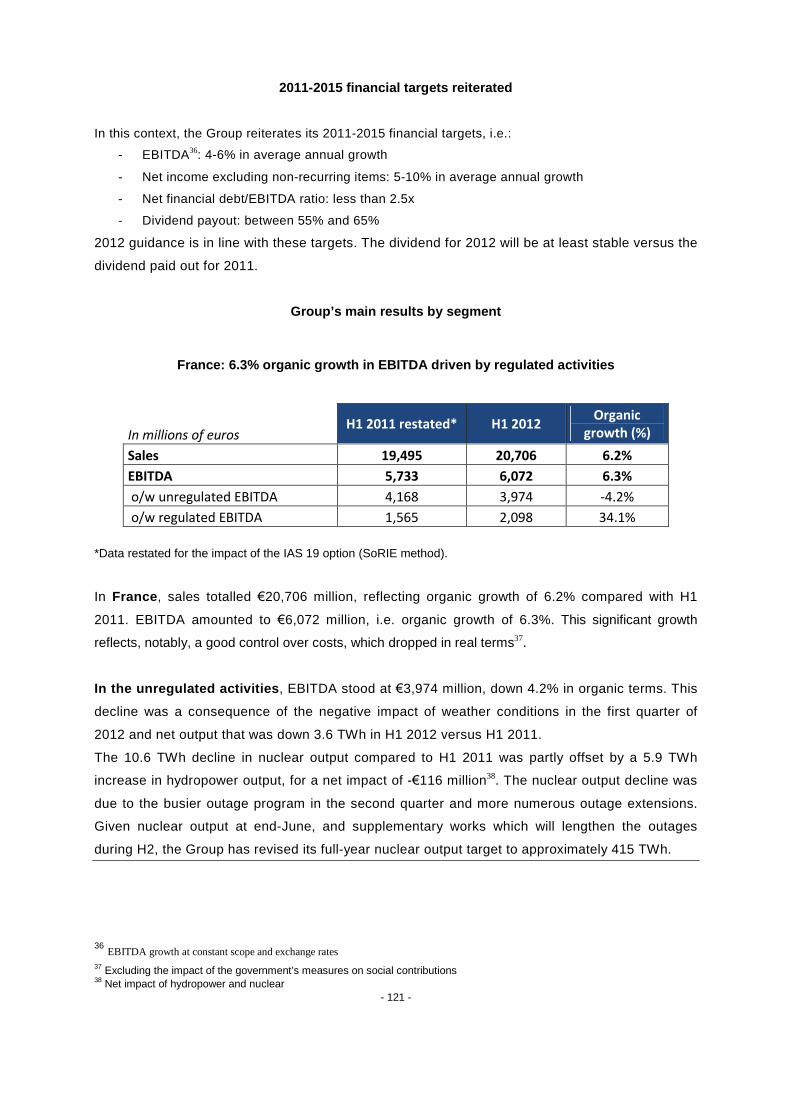
- 121 -
2011-2015 financial targets reiterated
In this context, the Group reiterates its 2011-2015 financial targets, i.e.:
- EBITDA36: 4-6% in average annual growth
- Net income excluding non-recurring items: 5-10% in average annual growth
- Net financial debt/EBITDA ratio: less than 2.5x
- Dividend payout: between 55% and 65%
2012 guidance is in line with these targets. The dividend for 2012 will be at least stable versus the
dividend paid out for 2011.
Group’s main results by segment
France: 6.3% organic growth in EBITDA driven by regulated activities
In millions of eurosH1 2011 restated* H1 2012
Organicgrowth (%)
Sales 19,495 20,706 6.2%
EBITDA 5,733 6,072 6.3%
o/w unregulated EBITDA 4,168 3,974 -4.2%
o/w regulated EBITDA 1,565 2,098 34.1%
*Data restated for the impact of the IAS 19 option (SoRIE method).
In France, sales totalled €20,706 million, reflecting organic growth of 6.2% compared with H1
2011. EBITDA amounted to €6,072 million, i.e. organic growth of 6.3%. This significant growth
reflects, notably, a good control over costs, which dropped in real terms37.
In the unregulated activities, EBITDA stood at €3,974 million, down 4.2% in organic terms. This
decline was a consequence of the negative impact of weather conditions in the first quarter of
2012 and net output that was down 3.6 TWh in H1 2012 versus H1 2011.
The 10.6 TWh decline in nuclear output compared to H1 2011 was partly offset by a 5.9 TWh
increase in hydropower output, for a net impact of -€116 million38. The nuclear output decline was
due to the busier outage program in the second quarter and more numerous outage extensions.
Given nuclear output at end-June, and supplementary works which will lengthen the outages
during H2, the Group has revised its full-year nuclear output target to approximately 415 TWh.
36EBITDA growth at constant scope and exchange rates
37 Excluding the impact of the government’s measures on social contributions38 Net impact of hydropower and nuclear
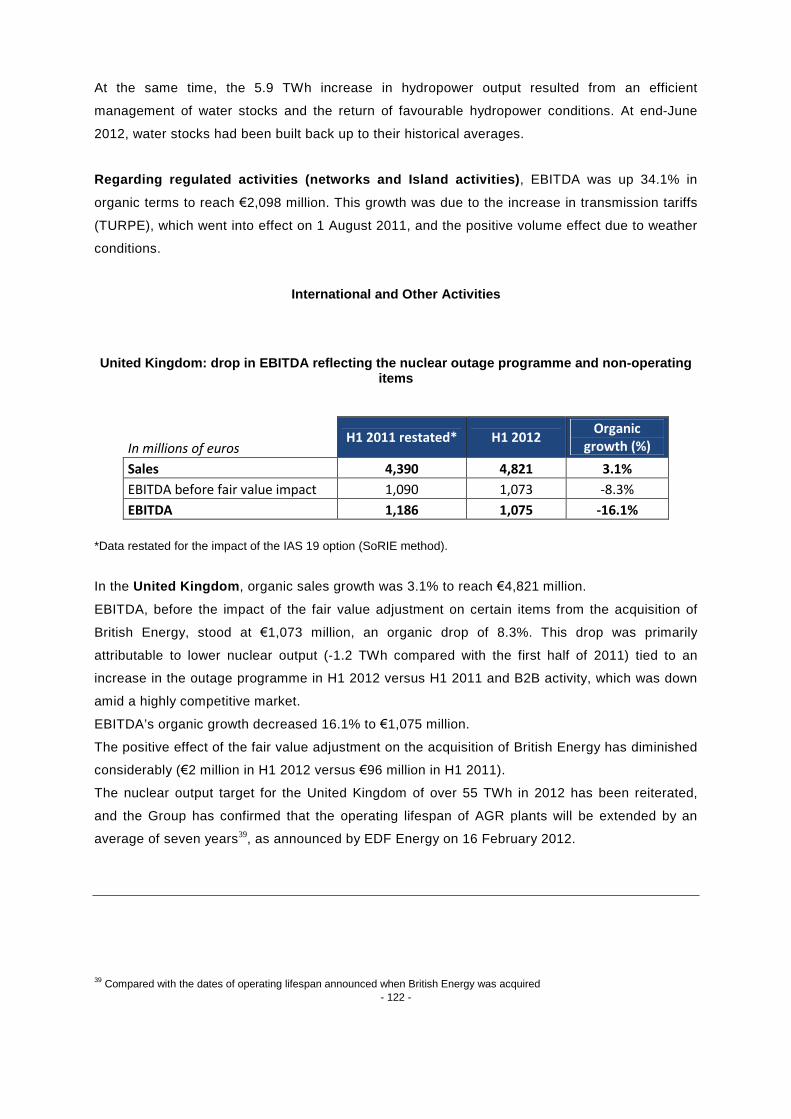
- 122 -
At the same time, the 5.9 TWh increase in hydropower output resulted from an efficient
management of water stocks and the return of favourable hydropower conditions. At end-June
2012, water stocks had been built back up to their historical averages.
Regarding regulated activities (networks and Island activities), EBITDA was up 34.1% in
organic terms to reach €2,098 million. This growth was due to the increase in transmission tariffs
(TURPE), which went into effect on 1 August 2011, and the positive volume effect due to weather
conditions.
International and Other Activities
United Kingdom: drop in EBITDA reflecting the nuclear outage programme and non-operatingitems
In millions of eurosH1 2011 restated* H1 2012
Organicgrowth (%)
Sales 4,390 4,821 3.1%
EBITDA before fair value impact 1,090 1,073 -8.3%
EBITDA 1,186 1,075 -16.1%
*Data restated for the impact of the IAS 19 option (SoRIE method).
In the United Kingdom, organic sales growth was 3.1% to reach €4,821 million.
EBITDA, before the impact of the fair value adjustment on certain items from the acquisition of
British Energy, stood at €1,073 million, an organic drop of 8.3%. This drop was primarily
attributable to lower nuclear output (-1.2 TWh compared with the first half of 2011) tied to an
increase in the outage programme in H1 2012 versus H1 2011 and B2B activity, which was down
amid a highly competitive market.
EBITDA’s organic growth decreased 16.1% to €1,075 million.
The positive effect of the fair value adjustment on the acquisition of British Energy has diminished
considerably (€2 million in H1 2012 versus €96 million in H1 2011).
The nuclear output target for the United Kingdom of over 55 TWh in 2012 has been reiterated,
and the Group has confirmed that the operating lifespan of AGR plants will be extended by an
average of seven years39, as announced by EDF Energy on 16 February 2012.
39 Compared with the dates of operating lifespan announced when British Energy was acquired
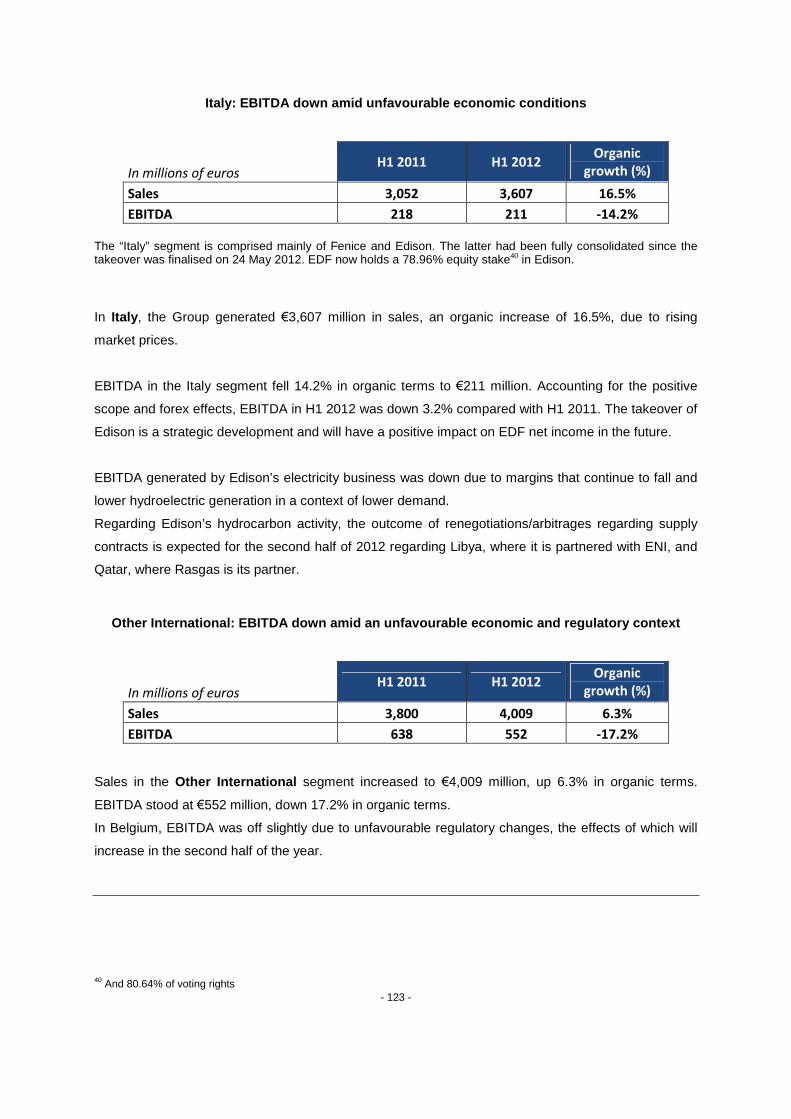
- 123 -
Italy: EBITDA down amid unfavourable economic conditions
In millions of eurosH1 2011 H1 2012
Organicgrowth (%)
Sales 3,052 3,607 16.5%
EBITDA 218 211 -14.2%
The “Italy” segment is comprised mainly of Fenice and Edison. The latter had been fully consolidated since thetakeover was finalised on 24 May 2012. EDF now holds a 78.96% equity stake40 in Edison.
In Italy, the Group generated €3,607 million in sales, an organic increase of 16.5%, due to rising
market prices.
EBITDA in the Italy segment fell 14.2% in organic terms to €211 million. Accounting for the positive
scope and forex effects, EBITDA in H1 2012 was down 3.2% compared with H1 2011. The takeover of
Edison is a strategic development and will have a positive impact on EDF net income in the future.
EBITDA generated by Edison’s electricity business was down due to margins that continue to fall and
lower hydroelectric generation in a context of lower demand.
Regarding Edison’s hydrocarbon activity, the outcome of renegotiations/arbitrages regarding supply
contracts is expected for the second half of 2012 regarding Libya, where it is partnered with ENI, and
Qatar, where Rasgas is its partner.
Other International: EBITDA down amid an unfavourable economic and regulatory context
In millions of eurosH1 2011 H1 2012
Organicgrowth (%)
Sales 3,800 4,009 6.3%
EBITDA 638 552 -17.2%
Sales in the Other International segment increased to €4,009 million, up 6.3% in organic terms.
EBITDA stood at €552 million, down 17.2% in organic terms.
In Belgium, EBITDA was off slightly due to unfavourable regulatory changes, the effects of which will
increase in the second half of the year.
40 And 80.64% of voting rights
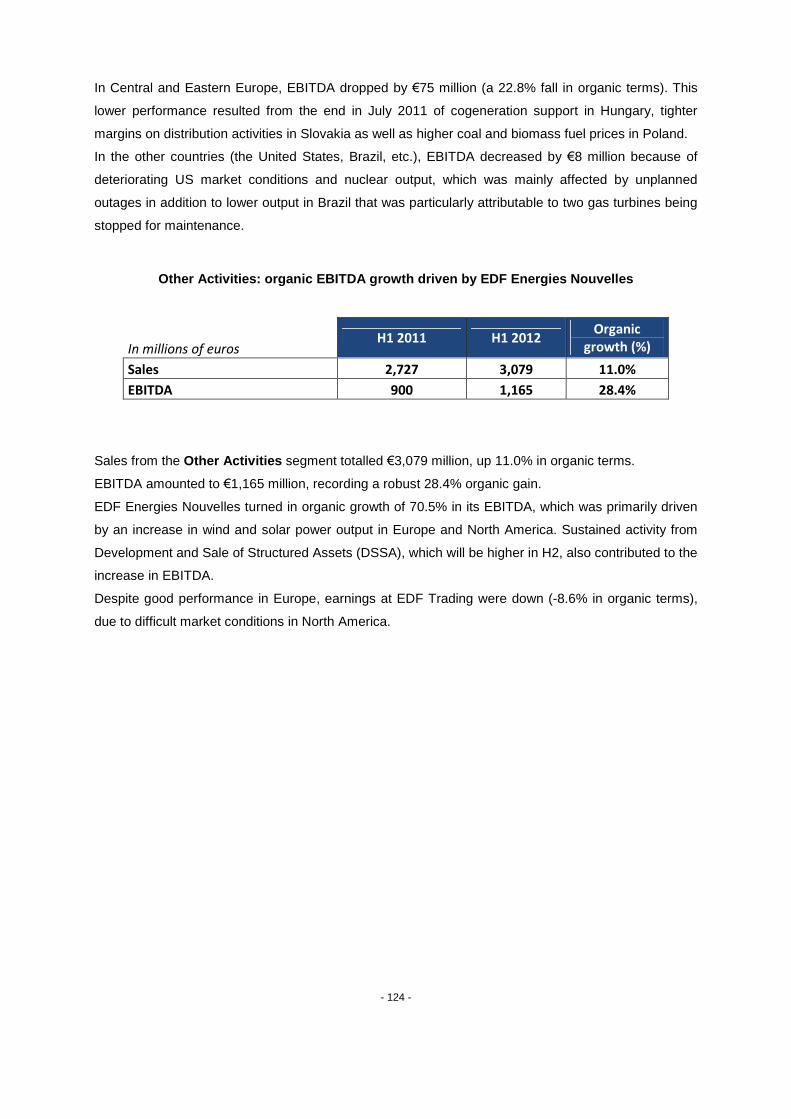
- 124 -
In Central and Eastern Europe, EBITDA dropped by €75 million (a 22.8% fall in organic terms). This
lower performance resulted from the end in July 2011 of cogeneration support in Hungary, tighter
margins on distribution activities in Slovakia as well as higher coal and biomass fuel prices in Poland.
In the other countries (the United States, Brazil, etc.), EBITDA decreased by €8 million because of
deteriorating US market conditions and nuclear output, which was mainly affected by unplanned
outages in addition to lower output in Brazil that was particularly attributable to two gas turbines being
stopped for maintenance.
Other Activities: organic EBITDA growth driven by EDF Energies Nouvelles
In millions of eurosH1 2011 H1 2012
Organicgrowth (%)
Sales 2,727 3,079 11.0%
EBITDA 900 1,165 28.4%
Sales from the Other Activities segment totalled €3,079 million, up 11.0% in organic terms.
EBITDA amounted to €1,165 million, recording a robust 28.4% organic gain.
EDF Energies Nouvelles turned in organic growth of 70.5% in its EBITDA, which was primarily driven
by an increase in wind and solar power output in Europe and North America. Sustained activity from
Development and Sale of Structured Assets (DSSA), which will be higher in H2, also contributed to the
increase in EBITDA.
Despite good performance in Europe, earnings at EDF Trading were down (-8.6% in organic terms),
due to difficult market conditions in North America.
- 125 -
H1 2012 highlights (after 10 May 2012)
French Ministerial order related to regulated tariffs on electricity sales
On 20 July 2012, the French minister of the economy and finances and the minister of ecology,
sustainable development and energy decreed that the regulated tariffs on sales (not including tax) of
electricity would increase 2% on average for all tariffs (yellow, green, blue).
EDF will carry out the work needed to fulfil the ASN’s (French Nuclear Safety Authority)
recommendations at its nuclear fleet
Following the recommendations put forward by the ASN on 28 June 2012 as part of its additional
safety assessments, EDF confirms its commitment to completing the work needed to increase the
safety level at its nuclear facilities.
EDF’s mandatory tender offer on Edison
On 27 June 2012, the Consob, the Italian financial markets authority, authorised EDF’s subsidiary
Transalpina di Energia S.r.l to launch a mandatory tender offer on the ordinary shares of Edison S.p.A
that EDF did not own (1,003,045,298 shares representing 19.36% of the company’s capital) at a price
of €0.89 per share. The offer period started on 2 July 2012 and will end on 3 August 2012, subject to
possible extension.
Gazprom and EDF sign a Cooperation Agreement on gas power generation in Europe
On 22 June 2012, EDF and Gazprom signed a cooperation agreement in respect of a potential
collaboration for gas-fired power plants in Europe. The document provides for the possibility of joint
construction of gas-fired power plants and acquisition of existing ones on a parity basis. The
agreement also states that Gazprom will be the exclusive supplier of gas for the needs of jointly-held
gas power plants.
The European Commission conditionally approves existing aid on regulated electricity
tariffs in France
On 12 June 2012, the European Commission approved existing State aid contained in regulated
electricity tariffs for large and medium-sized electricity consumers in France, subject to compliance
with several conditions, namely the reform of the French electricity market and an annual review of the
standard tariffs, followed by their elimination at the end of 2015. The tariffs in question are the
regulated standard tariffs for corporates (“green” and “yellow” tariffs) and the transitional market
adjustment tariff (“TaRTAM”) that applied under the system implemented between 2006 and 2011,
which has been repealed since. The Commission took the view that the tariffs are compatible with the
EU rules on State aid due to the fact that they will help limit the market power of the incumbent
operator over a transitional period.
- 126 -
China: the construction of the EPR reactor Unit 1 at Taishan takes a major step forward
with the installation of the vessel
On 5 June 2012, the construction of the EPR reactor at Taishan in China, coordinated by EDF,
CGNPC and AREVA, has reached a milestone in its development with the lowering of the vessel into
the Unit 1 reactor building, after which it was installed in its final location in the reactor pit.
EnBW arbitration
On 25 May 2012, the Group announced that it had received an arbitration notice from the German
company Neckarpri GmbH (an investment vehicle set up by the Land of Baden-Württemberg under the
framework of EDF group’s sale of EnBW, which was finalised on 17 February 2011). Neckarpri claims
that the price it paid for acquiring EDF group’s stake in EnBW was excessive and requests restitution
for the excessive amount. Alternatively, Neckarpri requests cancellation of the sale of the EDF group’s
stake in EnBW. EDF considers this request to be completely unfounded and exorbitant.
Record drop in CO2 emissions for EDF in 2011
On 15 May 2012, EDF group announced a record fall in its CO2 emissions in 2011, with 99.6g of CO2
per kWh produced, equivalent to a reduction of 11% compared to 2010. For the first time, the Group
has fallen below the threshold of 100g/kWh for all of its electricity production facilities combined. In
France, the fall has been even more impressive, with a 25% reduction in CO2 emissions in just one
year: EDF’s CO2 emissions fell to 30.4g/kWh, in no small part due to its carbon-free production plants
(nuclear, hydraulic etc.).
EDF launches Electranova Capital, investment fund
On 15 May 2012, EDF announced that it was joining forces with Idinvest Partners, a well-known
expert when it comes to funding SMEs, to create a venture capital fund called Electranova Capital.
The aim of this fund, endowed with a minimum investment capacity of €60 million, is to encourage the
emergence of innovative projects focusing on new, environmentally-friendly technologies with a view
to embracing the challenge of a low-carbon energy model, for both energy generation and usage. The
goal of this fund is to finance innovative young companies in the energy sector with strong potential for
growth, both in France and in Europe, via minority shareholdings.
- 127 -
APPENDICES
1. Change in booking method of actuarial gains and losses related to employee
benefits (SoRIE method)
From 1 January 2012 onwards, the Group changed the method of recognition of actuarial gains or
losses related to post-employment benefits, pursuant to the option offered in IAS 19
This change in accounting method has the following consequences:
- Actuarial gains or losses are now recorded in equity
- The « corridor » method (and the amortization in result of actuarial gains or losses) is
abandoned
The reasons underlying this change in accounting method (retrospective application) for the financial
statements published in 2012 in respect of 2011 full-year are:
- Elimination of the volatility due to the “corridor” method in the profit and loss account
- Better readability of the financial statements
- Implementation of an option already used by the majority of CAC 40 companies and European
peers and compulsory as of 1 January 2013
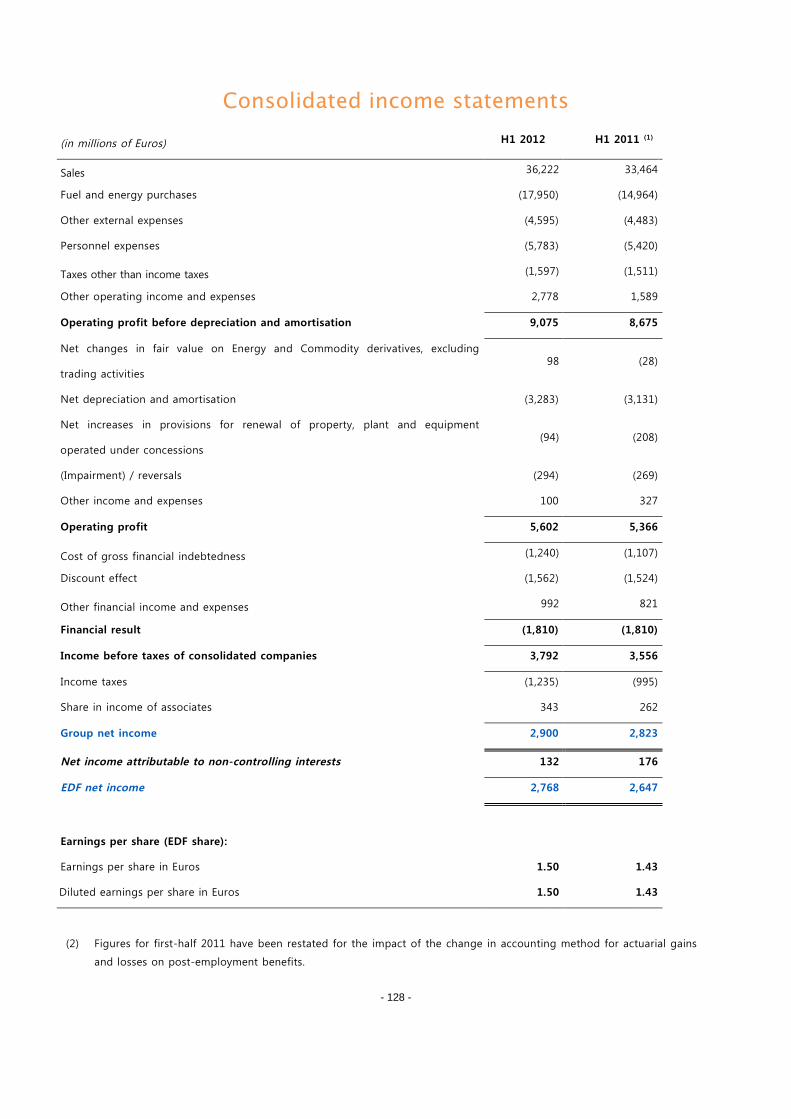
- 128 -
Consolidated income statements
(in millions of Euros) H1 2012 H1 2011 (1)
Sales 36,222 33,464
Fuel and energy purchases (17,950) (14,964)
Other external expenses (4,595) (4,483)
Personnel expenses (5,783) (5,420)
Taxes other than income taxes (1,597) (1,511)
Other operating income and expenses 2,778 1,589
Operating profit before depreciation and amortisation 9,075 8,675
Net changes in fair value on Energy and Commodity derivatives, excluding
trading activities98 (28)
Net depreciation and amortisation (3,283) (3,131)
Net increases in provisions for renewal of property, plant and equipment
operated under concessions(94) (208)
(Impairment) / reversals (294) (269)
Other income and expenses 100 327
Operating profit 5,602 5,366
Cost of gross financial indebtedness (1,240) (1,107)
Discount effect (1,562) (1,524)
Other financial income and expenses 992 821
Financial result (1,810) (1,810)
Income before taxes of consolidated companies 3,792 3,556
Income taxes (1,235) (995)
Share in income of associates 343 262
Group net income 2,900 2,823
Net income attributable to non-controlling interests 132 176
EDF net income 2,768 2,647
Earnings per share (EDF share):
Earnings per share in Euros 1.50 1.43
Diluted earnings per share in Euros 1.50 1.43
(2) Figures for first-half 2011 have been restated for the impact of the change in accounting method for actuarial gains
and losses on post-employment benefits.
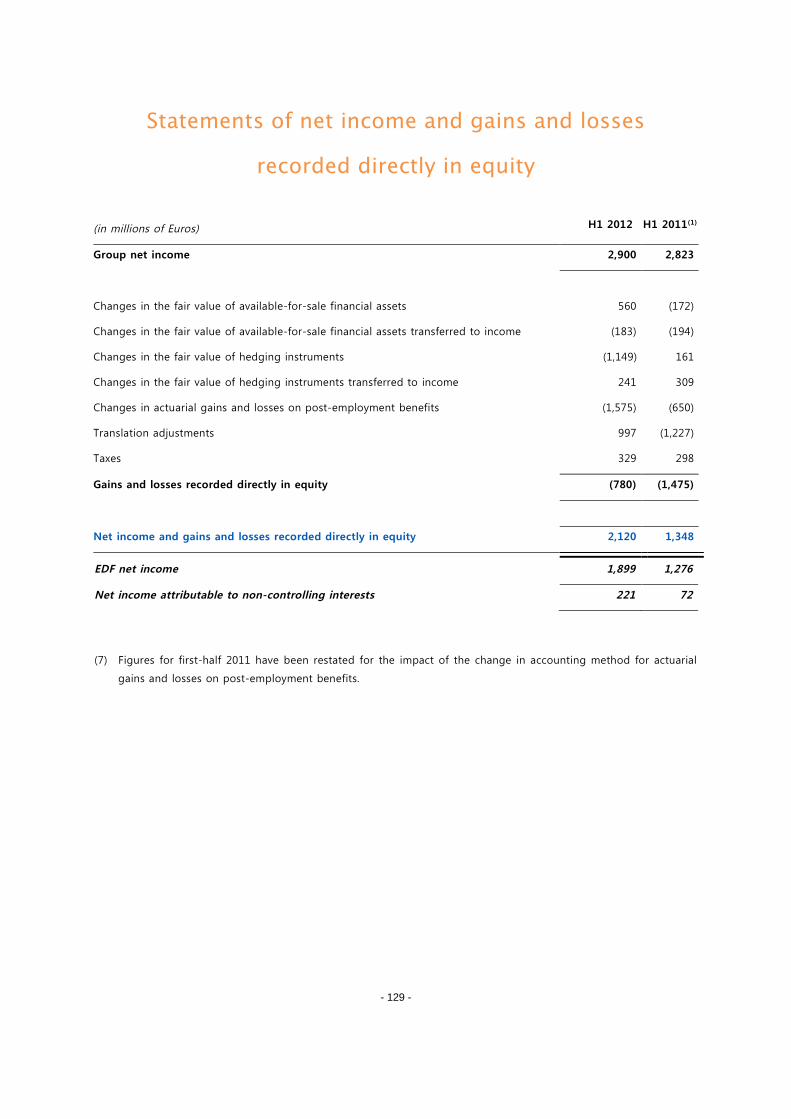
- 129 -
Statements of net income and gains and losses
recorded directly in equity
(in millions of Euros) H1 2012 H1 2011(1)
Group net income 2,900 2,823
Changes in the fair value of available-for-sale financial assets 560 (172)
Changes in the fair value of available-for-sale financial assets transferred to income (183) (194)
Changes in the fair value of hedging instruments (1,149) 161
Changes in the fair value of hedging instruments transferred to income 241 309
Changes in actuarial gains and losses on post-employment benefits (1,575) (650)
Translation adjustments 997 (1,227)
Taxes 329 298
Gains and losses recorded directly in equity (780) (1,475)
Net income and gains and losses recorded directly in equity 2,120 1,348
EDF net income 1,899 1,276
Net income attributable to non-controlling interests 221 72
(7) Figures for first-half 2011 have been restated for the impact of the change in accounting method for actuarial
gains and losses on post-employment benefits.
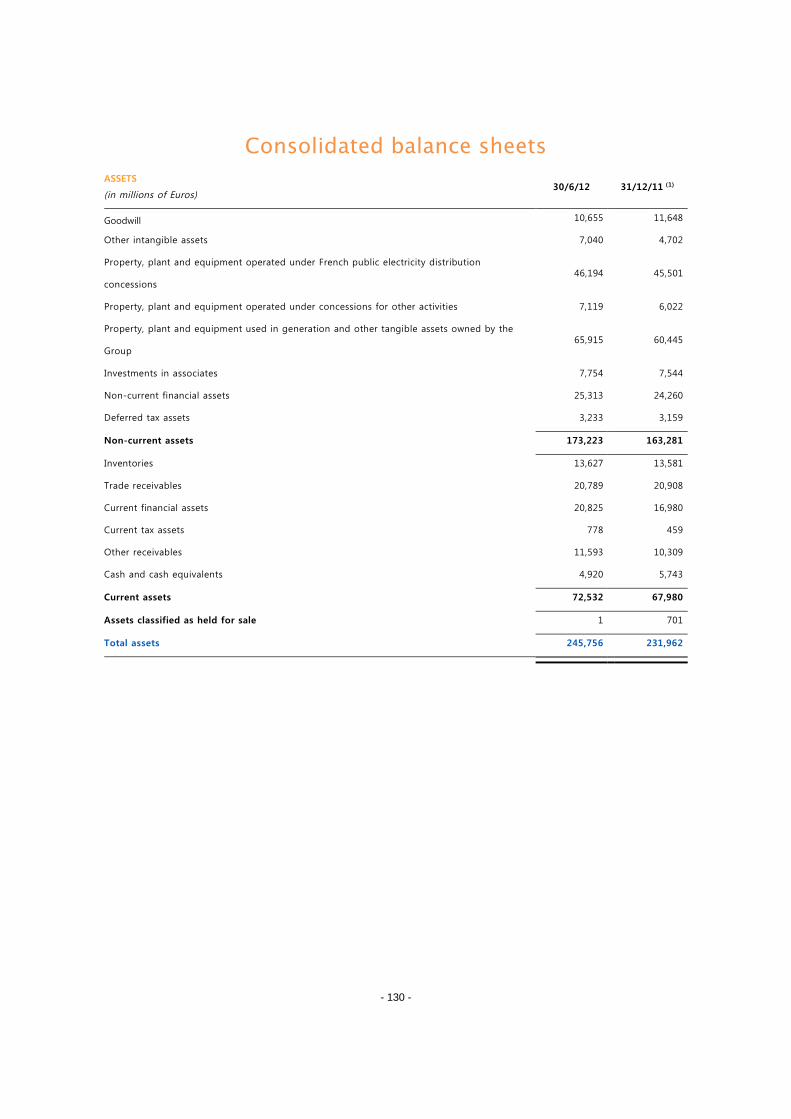
- 130 -
Consolidated balance sheets
ASSETS
(in millions of Euros)30/6/12 31/12/11 (1)
Goodwill 10,655 11,648
Other intangible assets 7,040 4,702
Property, plant and equipment operated under French public electricity distribution
concessions46,194 45,501
Property, plant and equipment operated under concessions for other activities 7,119 6,022
Property, plant and equipment used in generation and other tangible assets owned by the
Group65,915 60,445
Investments in associates 7,754 7,544
Non-current financial assets 25,313 24,260
Deferred tax assets 3,233 3,159
Non-current assets 173,223 163,281
Inventories 13,627 13,581
Trade receivables 20,789 20,908
Current financial assets 20,825 16,980
Current tax assets 778 459
Other receivables 11,593 10,309
Cash and cash equivalents 4,920 5,743
Current assets 72,532 67,980
Assets classified as held for sale 1 701
Total assets 245,756 231,962
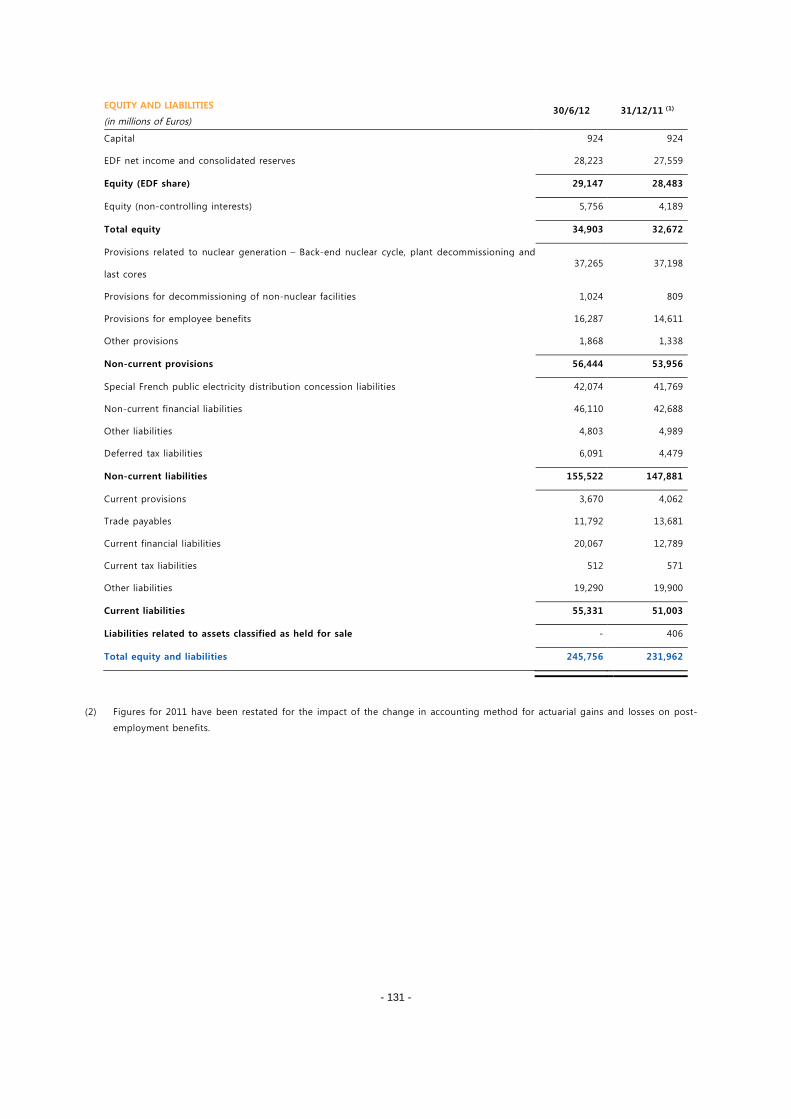
- 131 -
EQUITY AND LIABILITIES
(in millions of Euros)30/6/12 31/12/11 (1)
Capital 924 924
EDF net income and consolidated reserves 28,223 27,559
Equity (EDF share) 29,147 28,483
Equity (non-controlling interests) 5,756 4,189
Total equity 34,903 32,672
Provisions related to nuclear generation – Back-end nuclear cycle, plant decommissioning and
last cores37,265 37,198
Provisions for decommissioning of non-nuclear facilities 1,024 809
Provisions for employee benefits 16,287 14,611
Other provisions 1,868 1,338
Non-current provisions 56,444 53,956
Special French public electricity distribution concession liabilities 42,074 41,769
Non-current financial liabilities 46,110 42,688
Other liabilities 4,803 4,989
Deferred tax liabilities 6,091 4,479
Non-current liabilities 155,522 147,881
Current provisions 3,670 4,062
Trade payables 11,792 13,681
Current financial liabilities 20,067 12,789
Current tax liabilities 512 571
Other liabilities 19,290 19,900
Current liabilities 55,331 51,003
Liabilities related to assets classified as held for sale - 406
Total equity and liabilities 245,756 231,962
(2) Figures for 2011 have been restated for the impact of the change in accounting method for actuarial gains and losses on post-
employment benefits.
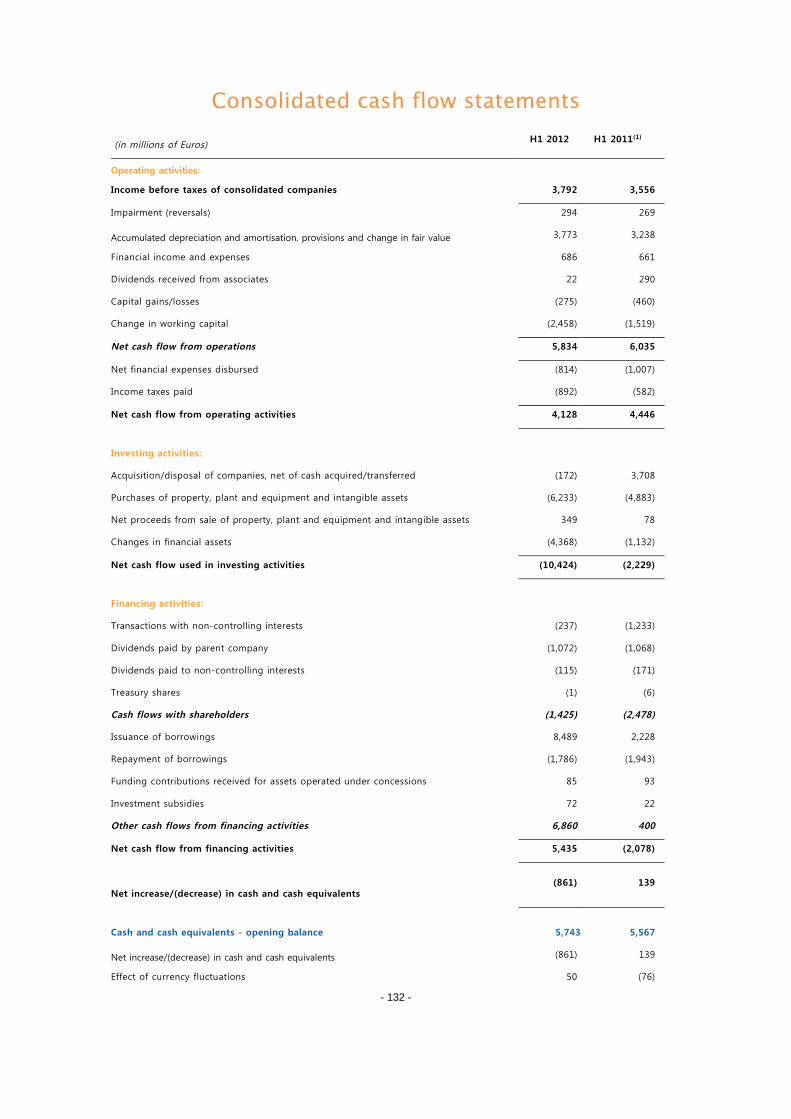
- 132 -
Consolidated cash flow statements
(in millions of Euros)H1 2012 H1 2011(1)
Operating activities:
Income before taxes of consolidated companies 3,792 3,556
Impairment (reversals) 294 269
Accumulated depreciation and amortisation, provisions and change in fair value 3,773 3,238
Financial income and expenses 686 661
Dividends received from associates 22 290
Capital gains/losses (275) (460)
Change in working capital (2,458) (1,519)
Net cash flow from operations 5,834 6,035
Net financial expenses disbursed (814) (1,007)
Income taxes paid (892) (582)
Net cash flow from operating activities 4,128 4,446
Investing activities:
Acquisition/disposal of companies, net of cash acquired/transferred (172) 3,708
Purchases of property, plant and equipment and intangible assets (6,233) (4,883)
Net proceeds from sale of property, plant and equipment and intangible assets 349 78
Changes in financial assets (4,368) (1,132)
Net cash flow used in investing activities (10,424) (2,229)
Financing activities:
Transactions with non-controlling interests (237) (1,233)
Dividends paid by parent company (1,072) (1,068)
Dividends paid to non-controlling interests (115) (171)
Treasury shares (1) (6)
Cash flows with shareholders (1,425) (2,478)
Issuance of borrowings 8,489 2,228
Repayment of borrowings (1,786) (1,943)
Funding contributions received for assets operated under concessions 85 93
Investment subsidies 72 22
Other cash flows from financing activities 6,860 400
Net cash flow from financing activities 5,435 (2,078)
Net increase/(decrease) in cash and cash equivalents(861) 139
Cash and cash equivalents - opening balance 5,743 5,567
Net increase/(decrease) in cash and cash equivalents (861) 139
Effect of currency fluctuations 50 (76)
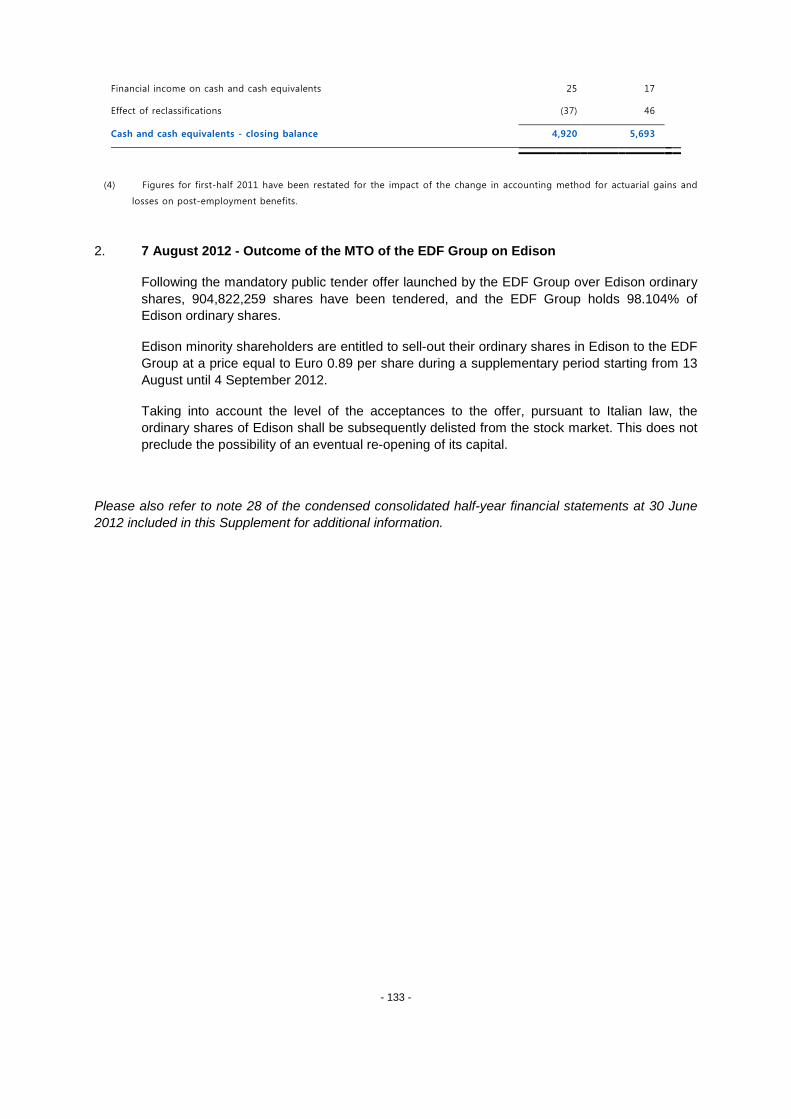
- 133 -
Financial income on cash and cash equivalents 25 17
Effect of reclassifications (37) 46
Cash and cash equivalents - closing balance 4,920 5,693
(4) Figures for first-half 2011 have been restated for the impact of the change in accounting method for actuarial gains and
losses on post-employment benefits.
2. 7 August 2012 - Outcome of the MTO of the EDF Group on Edison
Following the mandatory public tender offer launched by the EDF Group over Edison ordinary
shares, 904,822,259 shares have been tendered, and the EDF Group holds 98.104% of
Edison ordinary shares.
Edison minority shareholders are entitled to sell-out their ordinary shares in Edison to the EDF
Group at a price equal to Euro 0.89 per share during a supplementary period starting from 13
August until 4 September 2012.
Taking into account the level of the acceptances to the offer, pursuant to Italian law, the
ordinary shares of Edison shall be subsequently delisted from the stock market. This does not
preclude the possibility of an eventual re-opening of its capital.
Please also refer to note 28 of the condensed consolidated half-year financial statements at 30 June
2012 included in this Supplement for additional information.
134
PERSONS RESPONSIBLE FOR THE SUPPLEMENT
Individual assuming responsibility for the Supplement
In the name of the Issuer
Having taken all reasonable measures for this purpose, I declare that the information contained in
this Supplement is in accordance with the facts and contains no omission likely to affect its
import.
The consolidated condensed financial statements for the first half-year of 2012, prepared in
accordance with IAS-IFRS standards and included in chapter 2 of the Supplement were subject
to a report by the statutory auditors set forth in chapter 3 of the Supplement and which included
comments inter alia in relation to the valuation of long-term provisions relating to nuclear
electricity production and the shortfall in the collection of the Contribution to the Electricity Public
Service Costs (Contribution au Service Public de l’Electricité), in continuous increase, which
amounts to approximately €700 million for the first semester of 2012, for an aggregate amount of
€4.5 billion as of June 30th, 2012. As indicated in the assumptions set forth in note 18 of such
consolidated condensed financial statements, the shortfall is accounted for at its nominal value as
accrued income, does not bear interest, and the timing of collection is currently expected for
2016.
The consolidated financial statements for the financial year ended 31 December 2011, prepared
in accordance with IAS-IFRS standards, as adopted by the European Union, and included in the
2011 Document de Référence filed with the Autorité des marches financiers (hereafter the
"AMF") on 10 April 2012 under number D.12-0321, were subject to a report by the statutory
auditors set forth in section 20.2 of such 2011 Document de Référence and which includes a
comment in relation to the valuation of long-term provisions relating to nuclear electricity
production (which is set out on page 386 of such 2011 Document de Référence).
The consolidated financial statements for the financial year ended 31 December 2010, prepared
in accordance with IAS-IFRS standards, as adopted by the European Union, and included in the
2010 Document de Référence filed with the AMF on 18 April 2011 under number D.11-0320,
were subject to a report by the statutory auditors set forth in section 20.2 of such 2010 Document
de Référence and which included comments inter alia in relation to the valuation of long-term
provisions relating to nuclear electricity production (which are set out on page 384 of such 2010Document de Référence).
Issued in Paris, on 3 September 2012
_______________________
Henri Proglio
Chief Executive Officer
Electricité de France
135
VISA OF THE AUTORITÉ DES MARCHÉS FINANCIERS
In accordance with Articles L.412-1 and L.621-8 of the French Code monétaire et financier and
with the General Regulations (Réglement général) of the Autorité des marchés financiers (the
"AMF"), in particular Articles 212-31 to 212-33, the AMF has granted to this Supplement the visa
No. 12-418 on 3 September 2012. It was prepared by the Issuer and its signatories assume
responsibility for it.
In accordance with Article L.621-8-1-I of the French Code monétaire et financier, the visa was
granted following an examination by the AMF of "whether the document is complete and
comprehensible, and whether the information it contains is coherent". It does not imply that the
AMF has verified the accounting and financial data set out in it.
In accordance with Article 212- 32 of the Règlement général of the AMF, all Notes issued or
admitted pursuant to this Supplement will result in the publication of the applicable Final Terms.
136
RESPONSABILITE DU SUPPLEMENT
Personne qui assume la responsabilité du présent Supplément
Au nom de l'Émetteur
Après avoir pris toute mesure raisonnable à cet effet, j'atteste que les informations contenues
dans le présent Supplément sont, à ma connaissance, conformes à la réalité et ne comportent
pas d'omission de nature à en altérer la portée.
Les comptes semestriels consolidés résumés de la société relatifs à la période du 1er janvier au
30 juin 2012, préparés conformément au référentiel IAS-IFRS et inclus au sein du chapitre 2 du
Supplément, ont fait l’objet d’un rapport des contrôleurs légaux figurant au chapitre 3 du
Supplément, qui contient des observations relatives notamment à l'évaluation des provisions de
long terme liées à la production nucléaire et au déficit de collecte de la Contribution au Service
Public de l'Electricité, en progression constante, qui s'élève à environ 700 millions d'euros sur le
premier semestre 2012 et atteint un montant de 4,5 milliards d'euros au 30 juin 2012.
Conformément aux indications et hypothèses mentionnées en note 18 des comptes semestriels
consolidés résumés concernés, ce déficit est comptabilisé à sa valeur nominale en produits à
recevoir, ne porte pas intérêt et l'horizon de recouvrement est actuellement estimé à 2016.
Les comptes consolidés de l'exercice clos le 31 décembre 2011, préparés conformément au
référentiel IAS-IFRS, tel qu’adopté par l’Union Européenne, et inclus dans le Document de
Référence 2011 déposé auprès de l'Autorité des marchés financiers (ci-après l'"AMF") en date du
10 avril 2012 sous le numéro D.12-0321, ont fait l'objet d'un rapport des contrôleurs légaux
figurant à la section 20.2 dudit Document de Référence 2011, qui contient une observation
relative à l'évaluation des provisions de long terme liées à la production nucléaire (qui est
mentionnée à la page 386 du Document de Référence 2011).
Les comptes consolidés de l'exercice clos le 31 décembre 2010, préparés conformément au
référentiel IAS-IFRS, tel qu’adopté par l’Union Européenne, et inclus dans le Document de
Référence 2010 déposé auprès de l'AMF en date du 18 avril 2011 sous le numéro D.11- 0320,
ont fait l'objet d'un rapport des contrôleurs légaux figurant à la section 20.2 dudit Document de
Référence 2010, qui contient des observations relatives notamment à l'évaluation des provisions
de long terme liées à la production nucléaire (qui sont mentionnées à la page 384 du Document
de Référence 2010).
A Paris, le 3 septembre 2012
_______________________
Henri Proglio
Président-Directeur Général
Electricité de France
- 137 -
VISA DE L'AUTORITE DES MARCHES FINANCIERS
En application des articles L. 412-1 et L. 621-8 du Code monétaire et financier et de son règlement
général, notamment de ses articles 212-31 à 212-33, l’Autorité des marchés financiers (l'"AMF") a
apposé le visa n° 12-418 en date du 3 septembre 2012 sur le présent Supplément. Ce Supplément a
été établi par l’Emetteur et engage la responsabilité de ses signataires.
Le visa, conformément aux dispositions de l’Article L. 621-8-1-I du Code monétaire et financier, a été
attribué après que l’AMF a vérifié "si le document est complet et compréhensible, et si les informations
qu’il contient sont cohérentes". Il n’implique ni approbation de l’opportunité de l’opération, ni
authentification des éléments comptables et financiers présentés.
Conformément à l'article 212-32 du règlement général de l'AMF, toute émission ou admission de titres
réalisée sur la base de ce Supplément donnera lieu à la publication de conditions définitives.
Recommended