1
Properties of Photocured Epoxy Resin Materials for Application in Piezoelectric Ultrasonic
Transducer Matching Layers
Alexander Trogé1, Richard L. O’Leary2, Gordon Hayward2, Richard A. Pethrick1 and Anthony J. Mullholland3 1 Department of Pure and Applied Chemistry, Thomas Graham Building,
University of Strathclyde, 295 Cathedral Street, Glasgow G1 1XL. 2 Centre for Ultrasonic Engineering, Dept. of Electronic and Electrical Engineering, Royal College Building,
University of Strathclyde, 204 George Street, Glasgow G1 1XW, Scotland 3 Department of Mathematics, Livingstone Tower, University of Strathclyde, 26 Richmond Street,
Glasgow G1 1XH
Abstract
This paper describes the acoustic properties of a range of epoxy resins prepared by photocuring
that are suitable for application in piezoelectric ultrasonic transducer matching layers. Materials,
based on blends of digylcidyl ether of Bisphenol A and 1,4-cyclohexanedimethanol diglycidyl
ether, are described. Furthermore, in order to vary the elastic character of the base resin, samples
containing polymer microspheres or barium sulphate particles are also described. The acoustic
properties of the materials are determined by a liquid coupled through transmission
methodology, capable of determining the velocity and attenuation of longitudinal and shear
waves propagating in an isotropic layer. Measured acoustic properties are reported which
demonstrate materials with specific acoustic impedance varying in the range 0.88 - 6.25 MRayls.
In the samples comprising blends of resin types, a linear variation in the acoustic velocities and
density was observed. In the barium sulphate filled samples, acoustic impedance showed an
approximately linear variation with composition, reflecting the dominance of the density
variation. While such variations can be predicted by simple mixing laws, relaxation and
scattering effects influence the attenuation in both the blended and filled resins. These
phenomena are discussed with reference to dynamic mechanical thermal analysis and differential
scanning calorimetry of the samples.
Author to whom correspondence should be addressed - Richard O'Leary, Centre for Ultrasonic Engineering,
University of Strathclyde, 204 George Street, Glasgow, G1 1XW [email protected]

2
I. INTRODUCTION
Piezoelectric transducers are used in a wide variety of ultrasonic applications in biomedicine,
sonar and non-destructive evaluation. Typically, the properties of the transducer front end can be
tailored to the specific task through appropriate design of acoustic matching layers and backing
block to promote efficient and wideband operation. DeSilets et al [1] described a number of
relationships for determining the required specific acoustic impedance of the matching layer(s)
given the impedance of the transducer and load. For example, in the case of a transducer
operating into a relatively low impedance load, such as water or biological tissue, it is
commonplace to add a quarter wavelength matching layer whose impedance is determined from
the geometric mean of the transducer and the load [1]. Where a wideband transducer is required,
a single quarter wavelength matching layer should ideally possess a specific acoustic impedance,
Zm:
31221ZZZm , (1)
Where Z1 and Z2 represent the impedance of the piezoelectric element and the load, respectively.
More recently, Cannata et al [2] showed that for a system comprising two matching layers, the
ideal inner, Zm1, and outer, Zm2, are found to be:
7132
411 ZZZm , (2)
716212 ZZZm . (3)
Such relationships typically reflect some kind of theoretical optimality. However, in practice the
availability of suitable materials with the desired specific acoustic impedance will govern the
transducer design, resulting in some compromise being implemented, employing materials with
the closest available match in terms of the specific acoustic impedance. In addition to matching
layers applied to liquid, tissue or solid coupled probes, appropriately designed matching layers
can be employed to facilitate gas coupling of piezoelectric devices. Various materials have been
cited in the literature for use as air or gas coupled matching layers, such as silicone rubber [3, 4]
or aero-gels of silica [5, 6], with varying degrees of success.

3
In general, the motivation for acoustic matching is to enhance sensitivity or bandwidth of the
piezoelectric transducer in a given application. Acoustic matching can be designed using discrete
layers [1, 2] or by employing a continuously varying impedance profile within the layer [7]. A
recent study by the authors [8, 9] proposed a matching material that can be envisaged as a series
of discrete layers wherein each layer possesses a slightly different acoustic impedance. Such a
matching layer exhibits a profile of acoustic impedances through the thickness dimension,
ranging from an acoustic impedance close to that of the transducer at the transducer side to an
acoustic impedance close to the load at the load side of the layer. The impedance gradient of the
matching layer is designed using a Chebyshev polynomial approach in order to reduce the
degrees of freedom and arrive at an algorithm for a device design. Transducers designed using
this approach can exhibit a threefold improvement, in terms of bandwidth, when compared to the
standard single matching-layer design [9].
Polymer resins can be employed to manufacture layers with impedances in the range 2-3 MRayls
[2, 10, 11]. In order to obtain materials exhibiting increased specific acoustic impedance, 0-3
connectivity composite materials, comprising a polymer resin and a particulate filler, can be used
[12, 13, 14]. The properties of the 0-3 composite obey a standard mixing rule [12, 13].
In this paper, a methodology is described to realise polymer materials with a range of elastic
properties that are suitable for application in piezoelectric transducer and array assemblies. The
approach allows the fabrication of polymer materials by successively photocuring thin layers of
polymer [15, 16]. The photocuring method can produce samples of homopolymers or a blend of
homopolymers. Selection of a suitable particle filler also enables loaded systems to be produced.
The materials investigated are based upon the glycidyl ether of bisphenol A (BisA) and the less
well known 1,4-cyclohexanedimethanol diglycidyl ether (CHDG). BisA produces a rigid high
glass transition [Tg] material on cure whereas CHDG cures to a more flexible lower Tg material.
Combining these two basic resins systems allows the possibility of creating layers with acoustic
properties designed to achieve optimum matching of the transducer to the media. The acoustic
properties of BisA, cured with various amines, has been reported by a number of workers [17,
18, 19, 20, 21, 22]. In the case of a photo cured epoxy resin system there is no additional amine-
curing reagent, only a photo catalyst. Consequently, the physical properties of the materials in
the current context will be very different from those of the amine cured materials previously
investigated. Moreover, the method that is described in this paper cures the epoxy resin via

4
opening of the epoxy rings to form an ether linked polymer backbone [15, 16]. The structure of
these polymers is therefore very different from those created by the conventional amine cure
reaction, where the polymer backbone contains carbon nitrogen linkages. The use of blends of
epoxy amine resins to vary the acoustic impedance of the passive phase in fabrication of
piezoelectric composite transducers has been reported [23, 24]. Significant variations in the
acoustic impedance were achieved by variation of the composition of the blend. The photo-
polymerisation method described here for the creation of epoxy resins has the advantage of
allowing the rapid creation of micron thin films [15, 16]. The samples presented have been
formed in film format with thicker layers created by multiple progressive layer deposition.
In the following Section the materials and methodology employed to generate photo-cured epoxy
resins are described. This is followed by a description of the method to carry out through
transmission acoustic characterisation of the photo-cured materials. The results of the acoustic
measurements are supported by dynamic mechanical thermal analysis (DMTA) and differential
scanning calorimetry (DSC), in order to elucidate the behaviour of the materials as a function of
temperature. Finally, in order to investigate the modification of the elastic character of the base
resins, materials comprising low density gas filled microspheres or high density particulates
encapsulated in a polymer resin are described. Incorporation of high density particles into the
base resin allows, in principle, the acoustic impedance to be increased through an increase in the
density and the propagation velocity. Likewise, the incorporation of hollow spheres creates the
possibility of lowering the acoustic impedance. However, dispersing particulate materials in a
resin, can create scattering effects which can make prediction of the effects of changes in the
acoustic properties difficult.
II. PREPARATION OF PHOTO-CURED POLYMERS
The BisA material selected for this study has an epoxy equivalent of 182-192 g/eq and was
obtained from Huntsman, Duxford, Cambridge, UK. CHDG has a lower molar mass but is more
flexible than BisA and, as will be demonstrated in the course of this paper, has a lower glass
transition temperature (Tg). The photo-cure is initiated by a photoacid generator (PAG), in this
case. The PAG and CHDG materials were obtained from Aldrich Chemical Co., Poole, Dorset,
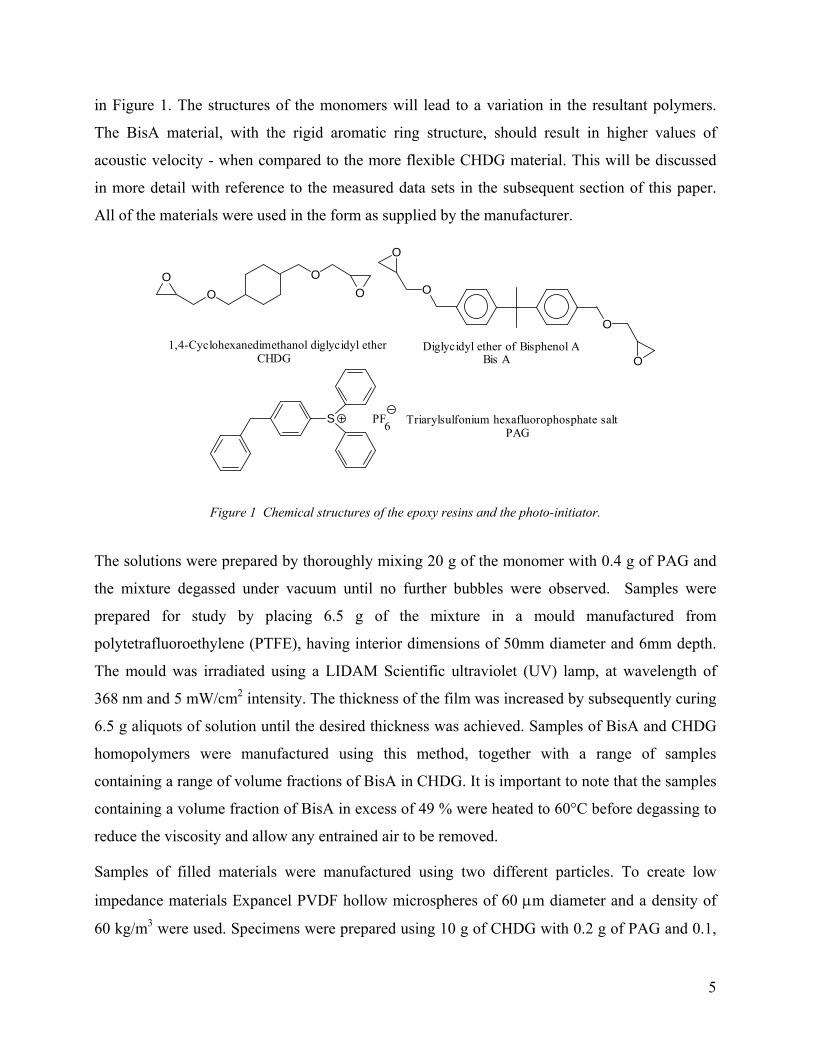
UK. The chemical structures of the BisA and CHGD monomers and the PAG material are shown
5
in Figure 1. The structures of the monomers will lead to a variation in the resultant polymers.
The BisA material, with the rigid aromatic ring structure, should result in higher values of
acoustic velocity - when compared to the more flexible CHDG material. This will be discussed
in more detail with reference to the measured data sets in the subsequent section of this paper.
All of the materials were used in the form as supplied by the manufacturer.
O
O O
O
O
O
O
O
1,4-Cyclohexanedimethanol diglycidyl ether CHDG
Diglycidyl ether of Bisphenol ABis A
S PF6
Triarylsulfonium hexafluorophosphate salt PAG
Figure 1 Chemical structures of the epoxy resins and the photo-initiator.
The solutions were prepared by thoroughly mixing 20 g of the monomer with 0.4 g of PAG and
the mixture degassed under vacuum until no further bubbles were observed. Samples were
prepared for study by placing 6.5 g of the mixture in a mould manufactured from
polytetrafluoroethylene (PTFE), having interior dimensions of 50mm diameter and 6mm depth.
The mould was irradiated using a LIDAM Scientific ultraviolet (UV) lamp, at wavelength of
368 nm and 5 mW/cm2 intensity. The thickness of the film was increased by subsequently curing
6.5 g aliquots of solution until the desired thickness was achieved. Samples of BisA and CHDG
homopolymers were manufactured using this method, together with a range of samples
containing a range of volume fractions of BisA in CHDG. It is important to note that the samples
containing a volume fraction of BisA in excess of 49 % were heated to 60°C before degassing to
reduce the viscosity and allow any entrained air to be removed.
Samples of filled materials were manufactured using two different particles. To create low
impedance materials Expancel PVDF hollow microspheres of 60 m diameter and a density of
60 kg/m3 were used. Specimens were prepared using 10 g of CHDG with 0.2 g of PAG and 0.1,
6
0.2, 0.3, 0.4 and 0.5 g of Expancel to achieve 16, 27, 36.5, 43.4 and 49 % volume fraction of
spheres, respectively. Higher impedance materials were produced using barium sulphate
(BaSO4), having a density of 4100 kg/m3 and particle size in the range 8-12 μm. Specimens were
produced containing 12, 18, 26, 35 and 51 g of BaSO4 with 20 g of BisA with 0.4 g of PAG to
obtain 13, 19, 25, 31 and 40 % volume fractions of BaSO4, respectively. The Expancel and
BaSO4 materials were obtained from Boud Minerals (Sutton Bridge, Lincolnshire, UK).
III. ACOUSTIC VELOCITY MEASUREMENTS
Measurements were made at 500 kHz by a through transmission method [19, 21, 25, 26, 27, 28].
All of the materials under test possess specific acoustic impedances close to water, making
ultrasonic reflection/refraction measurements more difficult. Consequently the coupling fluid
employed in the measurement technique is a low velocity oil. The material is a perfluorinated
poly(ether) synthetic lubricant, sold under the trade name Krytox® (Du Pont Krytox® Synthetic
Lubricants, K. S. Paul Group, London, UK). The acoustic velocity, density and specific acoustic
impedance of the liquid are 670 ms-1, 1870 kgm-3 and 1.25 MRayl, respectively. The velocity of
the sample under consideration is determined by a narrowband through transmission time of
flight technique. The theoretical consideration for the determination of the longitudinal and shear
wave velocities will now be described.
A. Determination of acoustic velocity
The longitudinal velocity was determined using a pair transducers, each having a centre
frequency of 500 kHz and a 6 dB bandwidth of 200 kHz, with the sample configured such that
the transmitted wavefront would be normally incident on the sample. The transducer and
specimen were arranged to be axially aligned as shown in Figure 2, and detailed in the
photograph of the apparatus. The sample holder is mounted on a high resolution rotary stage,
supplied by Time and Precision Industries, (Hampshire, UK). The rotary stage gives an angular
resolution of 0.01o over 360o and allows for the accurate alignment of the sample between the
transmitting and receiving transducers. The transducers are used to acquire signals, transmitted
through the coupling liquid, both without the sample and with the sample in place and normal to
the transducers. Cross-correlation of the acquired signals allows the time difference for
longitudinal propagation in the sample, tl, to be calculated. Consider D is the transducer

7
separation, ci is the velocity in the coupling medium, d is the sample thickness, cl is the
longitudinal velocity in the sample, we may write an expression for tl
liliil c
d
c
d
c
d
c
dD
c
Dttt
21 . (4)
Determination of the shear wave velocity is carried out in a similar fashion; the sample is rotated
until only the shear wave is propagated in the sample. This condition will not occur if ci is
greater than cl, in the case of polymer material this is often the case and is the reason for
employing the low velocity coupling medium Krytox rather than water in the experimental
arrangement. As before acquiring signals transmitted through the coupling liquid, both without
the sample and with the sample in place under conditions of shear wave propagation cross
correlation can be employed to determine the time difference for shear wave propagation in the
sample, ts. An expression for ts can be written as follows [28]
2
22
2
22
2
2
22
sin1
1
sin1
sinsin1cos
i
iss
i
isi
i
is
i
isi
s
c
cc
c
cc
c
c
c
c
dt
. (5)
Where cs is the shear wave velocity in the sample and i is the incident angle at which the signal
was acquired, determined from the rotary stage, cs in the sample can be found using a numerical
solution of Equation 5. Since the materials under study are isotropic, the complete compliance
and stiffness matrices and the salient moduli of the material be calculated from cl and cs and the
sample density, ,. [31, 32].
B. Experimental Measurement of Acoustic Properties
For convenience, the experimental methodology for the determination of the longitudinal and
shear wave velocities and attenuation will be described using a sample of photocured CHDG.
The data obtained for the other samples will then be presented in tabular form.

8
Figure 2 Photograph of the experimental apparatus
The transducers employed in the measurements were a pair of matched devices, operating at
500 kHz with a 6 dB bandwidth of 200 kHz, supplied by Alba Ultrasound Ltd, Glasgow,
Scotland. The sample is positioned in the far-field of both devices, in order to approximate plane
wave conditions.
The CHDG sample was placed in the sample holder - this was carried out on a surface table to
ensure that the sample was correctly aligned in the holder. The sample holder was then mounted
in the apparatus, with the sample axially aligned with the transducers. The angle was then
adjusted to ensure the sample faces were parallel with the transducer faces under conditions of
normal incidence. The velocity of the coupling medium and the signal transmitted through the
coupling medium alone were recorded using the digitising oscilloscope. In the remainder of the
analysis, this signal will be termed the reference signal. With the sample under consideration
between the transducers, the signal transmitted through the specimen was recorded at normal
incidence - this signal is the longitudinal transmitted signal. The reference signal and the
longitudinal transmitted signal are then correlated in the time domain using Matlab, in order to
determine the time difference, tl in Equation 4. Since the other sample thickness and the
incident velocity can be measured the longitudinal velocity in the sample, cl, can be determined
by rearranging Equation 4. The sample is then rotated until, and provided the cl is greater than ci
a shear wave is propagated into the sample. The angle of incidence is adjusted until the signal
Rotary Stage
Sample Holder

9
amplitude reaches a maximum, the received signal and the angle of incidence ( 30.4o in this case)
are both recorded. As before, the time domain signals are cross-correlated using Matlab to
determine the time difference between the two signals in order to determine, ts in Equation 5.
The time data can then be used to calculate the longitudinal and shear wave velocities. In the
case of the CHDG sample the longitudinal and shear wave velocities were found to be
1784.8 m/s and 766.3 m/s, respectively.
C. Determination of Longitudinal and Shear Wave Attenuation
Since the velocities in the material have been determined, the appropriate velocity data can then
be used in order to determine the attenuation of the individual wave types by employing a
methodology similar to that reported by Selfridge [29], extended to consider oblique
incidence [28] and so include the contribution of mode conversion at the fluid-solid boundary at
the front-face of the sample and solid-fluid interface at the rear of the sample.
Following Brekhovskikh [30], the transmission coefficient for a fluid coupled isotropic solid
layer, for lossless longitudinal waves can be written
slss
slss
sil
lil
ZZZ
ZZZ
c
cWD
2cos2sin
2cos2sin1
2coscos
cos22
22
2. (6)
Where
ZZZ
ZW
sssl
sl
2sin2cos
2cos222
1
i
icZ
cos ,
l
ll
cZ
cos1 and
s
ss
cZ
cos1
(7)
and the densities of the fluid and sample are and 1, respectively. Similarly the transmission
coefficient for a fluid coupled isotropic solid layer, for lossless shear waves, Ds , can be written

10
sssl
sssl
s
is ZZZ
ZZZPD
2sin2cos
2sin2cos1
sin2
tan22
22
2. (8)
Where
ZZZ
ZP
sssl
ss
2sin2cos
2sin222
1
(9)
And the other symbols are as previously defined. The losses associated with the reflection and
transmission at the boundaries in a fluid coupled isotropic layer for longitudinal and shear waves
are defined by Equations 6 and 8, respectively. Modifying Equations 6 and 8 to incorporate an
exponential loss term will therefore accommodate the attenuation of each wave type as it is
propagated through the sample [28, 31]
slss
slss
sil
li
d
lZZZ
ZZZ
c
cWeD l
l
2cos2sin
2cos2sin1
2coscos
cos22
22
2
cos , (10)
sssl
sssl
s
i
d
s ZZZ
ZZZPeD s
s
2sin2cos
2sin2cos1
sin2
tan22
22
2
cos , (11)
where l and s are the attenuation factors in nepers per metre of the longitudinal and shear
waves, respectively. These equations can then be used to determine attenuation of the
longitudinal and shear waves, since the appropriate acoustic velocities in the sample can be
determined using the method presented previously. The experimentally measured transmitted
amplitude data for both the longitudinal and shear waves can then be compared to the
theoretically determined transmission coefficient of the associated wave type using Equations 10
and 11. The loss term in the appropriate equation can then be adjusted order to determine the
attenuation of the wave type propagating in the sample as a function of incident angle.

11
In order to quantify attenuation in the sample, the velocity of the coupling medium was
measured, as was the peak-to-peak voltage of the signal transmitted through the coupling
medium. The sample was then aligned in the holder as before and the peak-to-peak voltage of the
signal transmitted through the sample measured using the oscilloscope, from normal incidence
over a range of incident angles large enough to encompass both longitudinal and shear wave
propagation in the sample, with measurements taken at one-degree intervals. The experimental
data obtained undergoes numerical manipulation to account for the amplitude of the reference
signal, such that the amplitude incident at the sample can be considered to be unity.
The theoretical transmission coefficient was calculated from the appropriate velocities and
densities over the angular range of interest using Equations 10 and 11. The theoretical and
experimental data is plotted together for comparison. The figure for attenuation of each wave
type, l and s in Equations 10 and 11, respectively, is then adjusted and the theoretical
transmission coefficient recalculated and compared to the experimentally measured data. This
process is repeated until the best fit is obtained between the theoretical and experimental data.
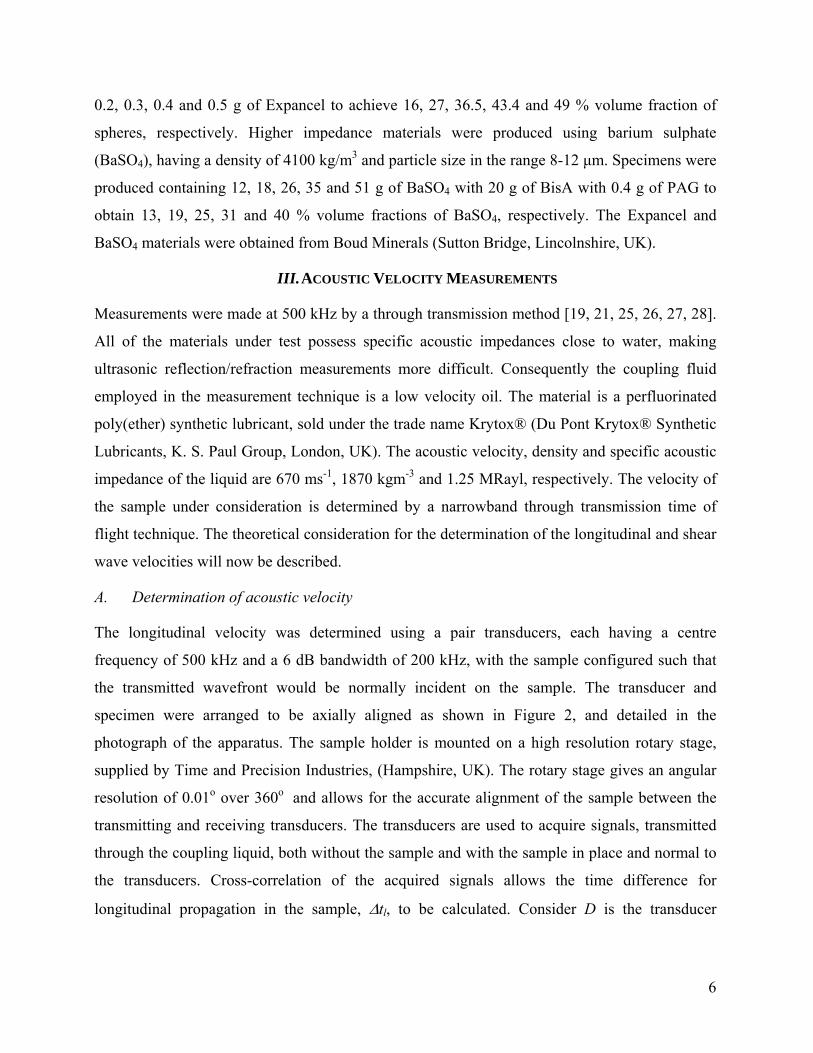
Figure 3 details a plot of the theoretically determined transmission coefficients for the
longitudinal and shear wave considering attenuation in the sample of CHDG; the experimentally
measured amplitude data is also plotted for comparison. The error bars in experimental data
show in Figure 3 are determined from the accuracy of measuring the peak-to-peak voltage using
the oscilloscope. The curve fitting approach, covering the complete data set, produces a more
robust result since the entire range of incident angles is being considered. In the case of the
CHDG material the longitudinal and shear wave attenuation were found to be 573 dB/m and
6228 dB/m at 500 kHz. The measurements were undertaken at this frequency, since the materials
were intended for use in device designs with a nominal centre frequency of 500 kHz. The
methodology described, is applicable across a wide range of frequencies, only the pair of
transducers need to be substituted in order to perform measurements at different frequencies. It is
important to note, that the attenuation in the materials under investigation would increase with
increasing frequency. In addition, velocity dispersion will also be observed as the centre
frequency of the measurement is altered, although to a significantly lesser extent than in the case
of loss [32].
12
10 20 30 40 50 60Incidence Angle, Degree
0
0.1
0.2
0.3
0.4
0.5
0.6
Tra
nsm
issi
on C
oeffi
cien
t
TheoryExperimental Data
0 10 20 30 40 50 60 70Incidence Angle, Degree
0.0e+00
5.0e-04
1.0e-03
1.5e-03
2.0e-03
Tra
nsm
issi
on C
oeffi
cien
t
TheoryExperimental Data
Figure 3 Curve Fitting for the determination of attenuation in CHDG,
upper plot - Longitudinal data and lower plot - Shear data
D. Acoustic and Mechanical Properties of Polymer Blends
In this paper we are interested in measuring the variation of physical properties for CHDG Bis A
blends. The data presented in Table 1 are for a range of formulations – the 0% volume fraction
BisA in CHDG represents the CHDG homopolymer. The density data detailed in Table 1 was
determined using a flotation method [21]. The density of the mixture for which the polymer
sample just floats was determined using an Anton Paar Digital DMA601 density-measuring cell
and a DMA60 density meter (Stanton Redcroft, London). A saturated solution of potassium
bromide was used for measurements on the high-density materials and a mixture of n-
hexane/dichloromethane was used for low-density materials. The experimentally determined
data detailed in Table 1 was subject to uncertainty analysis determined by propagation of errors
[33] for Equations 4 and 5 and the associated calculations for acoustic impedance and elastic
moduli [31] in order to determine the error bars that will be employed in the ensuing Figures.

13
Formulation
Volume Fraction of
BisA in CHDG
0 9.8 19.7 29.6 40.0 50.0 59.6 69.6 79.7 89.8 100
cl (m.s-1) 1784.8 1956.3 2003.2 2091.0 2232.6 2246.9 2356.8 2392.7 2441.4 2531.0 2568.3
cs (m.s-1) 766.3 800.4 799.5 870.7 910.5 924.0 943.8 971.9 1004.7 1048.5 1092.7
Density (kg.m-3) 1157.3 1156.0 1158.8 1152.9 1162.0 1172.4 1178.0 1181.0 1170.8 1180.9 1177.9
Poisson’s Ratio 0.387 0.400 0.405 0.395 0.400 0.398 0.405 0.401 0.398 0.396 0.390
Z (MRayls) 2.066 2.261 2.321 2.411 2.594 2.634 2.776 2.826 2.858 2.989 3.025
E (GPa) 1.885 2.073 2.082 2.439 2.698 2.799 2.948 3.126 3.305 3.626 3.908
K (GPa) 2.780 3.437 3.662 3.875 4.508 4.584 5.144 5.274 5.403 5.834 5.894
G (GPa) 0.679 0.741 0.741 0.8740 0.963 1.001 1.049 1.116 1.182 1.298 1.406
l (dB.m-1) 573 426 252 174 156 130 52 43 26 35 35
s (dB.m-1) 6228 5993 4334 3839 2562 2493 1729 1416 973 643 356
Tg (°C) 23 ± 1 30 ± 1 35 ± 1 44 ± 1 48 ± 1 52 ± 1 57 ± 1 61 ± 1 65 ± 1 66 ± 1 62 ± 1
Table 1 Mechanical and acoustic properties of the BisA-CHDG mixture polymers determined by through transmission where cl is the longitudinal velocity, cs the shear
velocity, Z the acoustic impedance, E the Young modulus, K the bulk modulus, G the shear modulus, l the longitudinal attenuation and s the shear attenuation.

14
As would be expected, the elastic moduli of the materials detailed in Table 1vary linearly
with the material composition and can be described by an equation of the form:-
21 )1( EEEeff (12)
where effE is the Young’s modulus of a composition of two polymers, P1 and P2,
Young’s moduli in the pure state are represented by E1 and E2, respectively, and is the
volume fraction of P1 in the composition. Expressions, taking the same form as
Equation 12, can be written for both the shear and bulk moduli. Figure 4 illustrates the
experimentally determined values for the Young’s, shear and bulk moduli of the
materials described in Table 1 and compares each data set to the respective mixing rule.
In each case effective modulus is calculated using the mixing rule and the appropriate
modulus of the BisA and CHDG materials in their pure state. The BisA material
generates a more highly packed morphology, as a result of the rigid aromatic ring
structure in the monomer, shown in Figure 1. This generates a closely packed chain
morphology, resulting in higher modulus values for the BisA than the more flexible
CHDG. It is clear from Figure 4, that the mixing rule defined in Equation 12 describes
the behaviour of either the longitudinal or shear wave velocity as the composition is
varied.

15
0 20 40 60 80 100Volume Fraction BisA
0.0e+00
1.0e+09
2.0e+09
3.0e+09
4.0e+09
5.0e+09
6.0e+09
7.0e+09
Mod
ulus
, Pa
Figure 4 Comparison of experimentally determined moduli as the composition is varied,
Bulk modulus, Young’s modulus, Shear modulus and ▬ data derived from the mixing rule.
Error bars determined by propagation of uncertainty
In a similar fashion, an expression for the variation in density as a function of the
composition can be written as follows,
21 1 eff . (13)
Where eff is the density of the composition; 1 and 2 are the densities of the
component polymers P1 and P2 in the pure state, respectively. As before is the volume
fraction of P1 in the composition. Since the intended application of the materials is in the
construction of acoustic matching layers it is of interest to derive and expression for the
variation in velocity and hence acoustic impedance. The bulk and shear moduli of an
isotropic material can be expressed in terms acoustic velocities as follows [23]
22
3
4sl ccK . and 2
scG (14)

16
Where K is the bulk modulus and G is the shear modulus and the other symbols are as
previously defined. An expression for longitudinal velocity can be written as follows
GK
cl3
4
. (15)
Employing Equations 12, 13 and 15 and the appropriate moduli and density data for BisA
and CHDG in the pure state, the variation in acoustic impedance as a function of
composition can be determined – the experimentally determined data and that calculated
using the mixing rule are shown in Figure 5.
0 20 40 60 80 100Volume Fraction BisA
1.5
2.0
2.5
3.0
3.5
Impe
danc
e, M
Ray
ls
Figure 5 Variation in acoustic impedance of the polymer blend as the composition is varied
Measured Acoustic Impedance and ▬ Acoustic Impedance data derived from the mixing rule.
Error bars determined by propagation of uncertainty
Considering the acoustic impedance data, detailed in Table 1 and plotted in Figure 5,
indicates that it is possible to achieve impedances in the range 2 to 3 MRayls by choosing
appropriate proportions of monomers in the mixture. The longitudinal and shear
attenuation however, shows a more complex variation as a function of composition.

17
Figure 6 details a plot of the log of the attenuation versus composition for both
longitudinal and shear wave attenuation. The slope coefficient for the longitudinal
attenuation is -0.03783 and -0.02332 for shear attenuation. The plots shown in are linear
over the range 0 - 80% volume fraction BisA for both the longitudinal and shear
attenuation.
0 20 40 60 803
4
5
6
7ln
( l),
dB
/m
0 20 40 60 80Volume Fraction BisA
6
7
8
9
ln ( s),
dB
/m
Figure 6 Variation in attenuation measured at 500kHz as a function of composition,
Longitudinal Attenuation, Shear Attenuation and ▬ linear fit determined by least squares method
Thermal Analysis of Polymer Blends
To further investigate the materials dynamic mechanical thermal analysis (DMTA) and
differential scanning calorimetry (DSC) was also employed. The results of these analyses
for the BisA – CHDG blends will now be described. A Polymer Laboratories DMTA
(Church Stretton, Cheshire, UK) was used to measure the modulus and loss over the
temperature range from -140 to 150 0C at an oscillatory frequency of 1 Hz using a single
cantilever mode. Measurements were performed using strips 4 mm wide, 1.5 to 2 mm
thick and 25 mm in length. A clamp torque from 10 to 40 N was used, depending on the
hardness of the sample at room temperature. The method used has been described
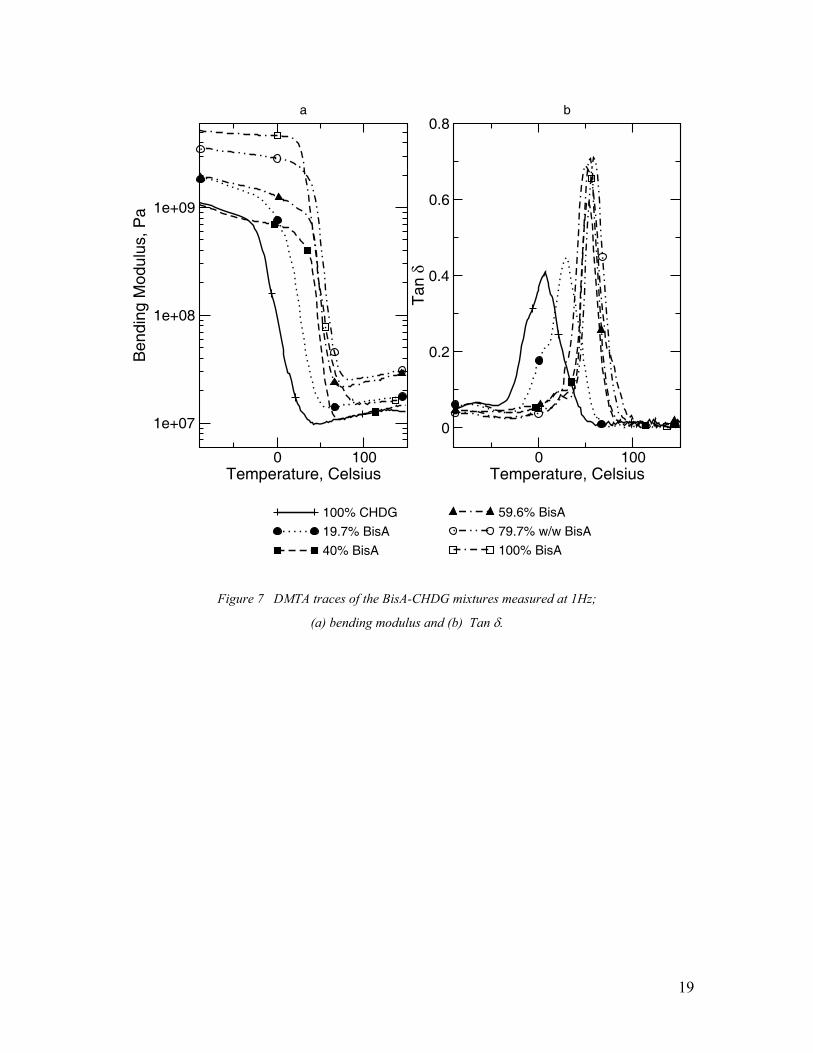
previously [21, 34]. DMTA analysis of samples with 0 - 100% volume fraction of BisA
are shown in Figure 7, where the 0% volume fraction BisA represents 100% CHGD. The
low temperature modulus decreases with increasing CHDG content, apart for the initial
18
20% volume fraction BisA that exhibits a higher value. The Tg is also increased for this
sample and then decreases progressively with increasing CHDG content. Similar
behaviour was observed for variation of the rubbery modulus. The tan plots indicate
that the glass transition becomes broader as the amount of CHDG is increased. The boat-
chair isomerisation of polymers containing cyclohexane groups has been studied
previously using DMTA for various polymers containing cyclohexane groups [35]. The
location of the tan peaks for the CHDG ring, Figure 7(b), occurs at a significantly
higher temperature than that for polycyclohexylmethacrylate, wherein the tan peaks
occurs at –100oC [35]. In the CHDG material the peak in tan , occurring at
approximately 0 oC, reflects the restrictions imposed by the cyclohexane ring being
linked at both ends into the matrix. Incorporation of the cyclohexane ring of the CHDG in
the BisA matrix produces plasticization, as a result there is a progressive decrease in the
temperature at which the peak in tan occurs with increasing CHDG content.
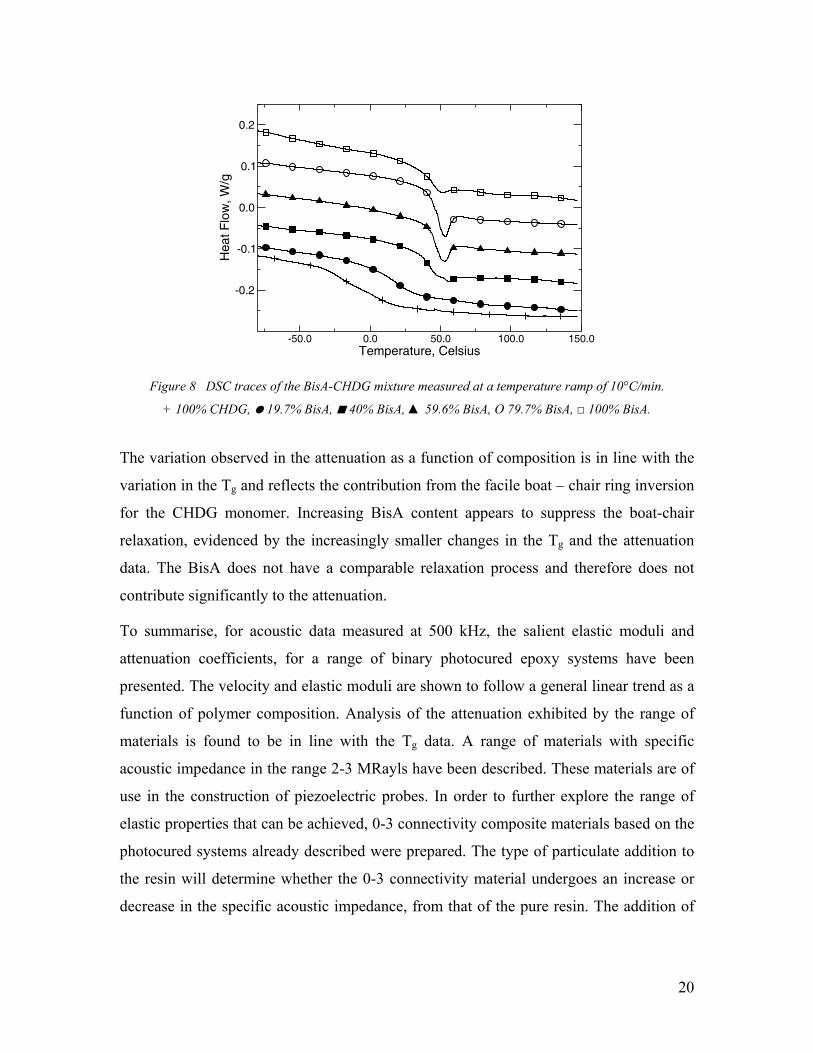
DSC measurements were performed using a TA Q1000 DSC instrument (TA
Instruments, Crawley, UK). A sample of polymer, nominal mass 5mg, was placed in a
sealed aluminium pan and heated from –50 to 150 °C at a rate of 10 °C per minute under
a flow of 20ml.min-1 of nitrogen gas. As before, the method used has been described
previously [16,34]. The results of the DSC analysis for the 0 - 100 % volume fraction of
BisA are shown in Figure 8. The data confirm the decrease in the Tg with increasing
CHGD content. A stress peak is observed for the 60, 80 and 100% volume fraction BisA
just after the glass transition temperature reflecting the effects of shrinkage of the sample
during the polymerisation process. The more flexible CHDG does not exhibit this peak
indicating that stress relaxation can occur more readily as a result of increased flexibility.
19
0 100Temperature, Celsius
1e+07
1e+08
1e+09
Ben
ding
Mod
ulus
, Pa
59.6% BisA
79.7% w/w BisA
100% BisA
a
0 100Temperature, Celsius
0
0.2
0.4
0.6
0.8
Tan
100% CHDG
19.7% BisA
40% BisA
b
Figure 7 DMTA traces of the BisA-CHDG mixtures measured at 1Hz;
(a) bending modulus and (b) Tan .
20
-50.0 0.0 50.0 100.0 150.0Temperature, Celsius
-0.2
-0.1
0.0
0.1
0.2
Hea
t Flo
w, W
/g
Figure 8 DSC traces of the BisA-CHDG mixture measured at a temperature ramp of 10°C/min.
+ 100% CHDG, 19.7% BisA, 40% BisA, ▲ 59.6% BisA, O 79.7% BisA, □ 100% BisA.
The variation observed in the attenuation as a function of composition is in line with the
variation in the Tg and reflects the contribution from the facile boat – chair ring inversion
for the CHDG monomer. Increasing BisA content appears to suppress the boat-chair
relaxation, evidenced by the increasingly smaller changes in the Tg and the attenuation
data. The BisA does not have a comparable relaxation process and therefore does not
contribute significantly to the attenuation.
To summarise, for acoustic data measured at 500 kHz, the salient elastic moduli and
attenuation coefficients, for a range of binary photocured epoxy systems have been
presented. The velocity and elastic moduli are shown to follow a general linear trend as a
function of polymer composition. Analysis of the attenuation exhibited by the range of
materials is found to be in line with the Tg data. A range of materials with specific
acoustic impedance in the range 2-3 MRayls have been described. These materials are of
use in the construction of piezoelectric probes. In order to further explore the range of
elastic properties that can be achieved, 0-3 connectivity composite materials based on the
photocured systems already described were prepared. The type of particulate addition to
the resin will determine whether the 0-3 connectivity material undergoes an increase or
decrease in the specific acoustic impedance, from that of the pure resin. The addition of

21
air filled microspheres and inorganic salts of barium have been investigated and the
behaviour of these materials will now be dealt with in turn.
IV. LOW DENSITY FILLED SYSTEMS
To investigate the potential of the photocured resin systems to produce materials
exhibiting low acoustic impedance, a number of formulations incorporating low density
Expancel microspheres, obtained from Boud Minerals (Sutton Bridge, Lincolnshire, UK),
were investigated. Expancel microspheres comprise polyvinylidene fluoride (PVDF)
shell filled with a gas. A range of samples were prepared using the CHDG material as the
host matrix and the percentage of Expancel spheres incorporated in the resin varied in the
range 16-49 % volume fraction. For low filler loadings, when the polymerization was
carried out with the pure monomer, phase separation was observed in the resulting cured
polymer. To avoid this problem, the resin was pre-polymerized to increase the viscosity
so that phase separation did not occur. This phenomenon will be discussed in more detail
in relation to the DMTA of these materials. It is also important to note that it was not
possible to create viable films with greater than 49 % volume fraction of Expancel. At
such loadings the polymerisation was inhibited by the large volume of Expancel in the
formulation. As before, the mechanical properties of the materials were measured using
the through transmission method. Table 2 summarises the results. The incorporation of
the microspheres leads to the predicted reduction in impedance. The longitudinal
attenuation in these materials is very high, and increases with increasing microsphere
content - the attenuation reflects multiple scattering of the sound wave propagating in the
samples. Similar phenomena have been observed for polymers loaded with glass
spheres [36] and talc filler [37]. In the materials presented the wavelength is in the range
2.9 - 3.4 mm and the Expancel dimensions were in the range 20-40 m. The reductions in
the density and acoustic impedance are varying approximately linearly with the filler
content. The minimum acoustic impedance reached is 0.88 MRayls, which is low enough
for the design of a matching layer for an air coupled piezoelectric composite transducer
[3]. The increasing levels of attenuation in the microsphere filled materials will affect the
performance of such a matching layer. Therefore, it is necessary to balance the reduction
in acoustic impedance with the increasing attenuation. Yano et al [3] have demonstrated

22
improved air coupled transducers employing matching layer materials with acoustic
attenuation in the range 3000-10000 dB/m, significantly higher levels of acoustic
attenuation than observed in the current context.
As has already been stated, visual observations of the microsphere filled materials
indicated that phase separation occurred at low microsphere loadings. The acoustic
characterisation method employed, essentially measures the properties of the bulk of the
material, with any variations in the formulation averaged out in the measurement. In
order to investigate the properties of the materials in more detail, DMTA of these
samples was carried out. The traces are shown in Figure 9.
Sample 1 wt %
(16% Vol)
2wt %
(27% Vol)
3 wt %
(36.5% Vol)
4 wt %
(43.4% Vol)
5 wt %
(49% Vol)
cl (m.s-1) 1691.3 1718.5 1439.8 1481.8 1486.7
cs (m.s-1) 904.7 824.4 771.5 762.2 794.4
Density (kg.m-3) 1032 820 678 650 595
Poisson Ratio 0.300 0.351 0.299 0.320 0.300
Z (MRayls) 1.745 1.41 0.976 0.963 0.885
E (GPa) 2.20 1.51 1.05 0.997 0.976
B (GPa) 1.83 1.68 0.867 0.923 0.815
G (GPa) 0.844 0.557 0.404 0.378 0.376
l (dB.m-1) 695 695 868 1303 1303
s (dB.m-1) 1477 1780 2172 2172 2302
Table 2 Mechanical properties of the CHDG-low density filler mixture determined by through
transmission methodology at 500kHz
23
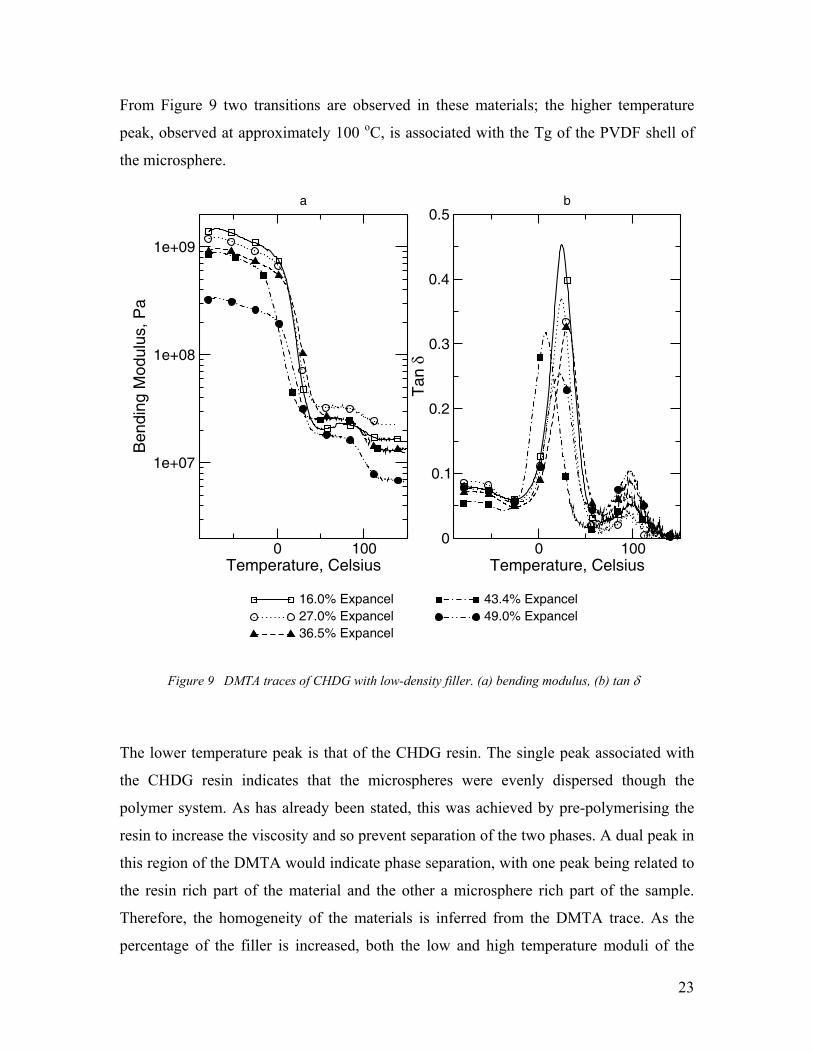
From Figure 9 two transitions are observed in these materials; the higher temperature
peak, observed at approximately 100 oC, is associated with the Tg of the PVDF shell of
the microsphere.
0 100Temperature, Celsius
1e+07
1e+08
1e+09
Ben
ding
Mod
ulus
, Pa
16.0% Expancel27.0% Expancel36.5% Expancel
a
0 100Temperature, Celsius
0
0.1
0.2
0.3
0.4
0.5
Tan
43.4% Expancel49.0% Expancel
b
Figure 9 DMTA traces of CHDG with low-density filler. (a) bending modulus, (b) tan
The lower temperature peak is that of the CHDG resin. The single peak associated with
the CHDG resin indicates that the microspheres were evenly dispersed though the
polymer system. As has already been stated, this was achieved by pre-polymerising the
resin to increase the viscosity and so prevent separation of the two phases. A dual peak in
this region of the DMTA would indicate phase separation, with one peak being related to
the resin rich part of the material and the other a microsphere rich part of the sample.
Therefore, the homogeneity of the materials is inferred from the DMTA trace. As the
percentage of the filler is increased, both the low and high temperature moduli of the

24
materials decrease. In general the Tg of the different systems are similar, but Tg is
lowered significantly once the addition of the microspheres is increased above 43%
volume fraction.
V. HIGH DENSITY FILLER
Attaining polymer-particle systems with a range of acoustic impedance is of interest in a
number of applications in transducer design and manufacture, examples of which have
been previously described in the preceding sections of this paper. Typically, such
materials comprise tungsten particles in a polymer matrix with high values of specific
acoustic impedance being attained [12]. Particle loaded polymer systems incorporating
other metallic or metallic oxide particles have been reported in the literature [38, 39]. In
the current context the use of tungsten to modify the impedance of the base resin was not
possible since it inhibited the photocure of the polymer. In an attempt to achieve polymer
particle composites exhibiting increased acoustic impedance, a high-density inorganic
salt, BaSO4 having a density of 4400 kg.m-3, was incorporated into the BisA
homopolymer. BaSO4 was selected since it is readily dispersed in the monomer and has a
low UV absorbance and hence will not impede the cure of the resin. This system allows
for materials with varying volume fractions of filler to be realised. Samples with BaSO4
volume fraction in the range 13-39% were synthesised. Table 3 details the elastic
properties of the materials determined by the through transmission method at 500 kHz.
Considering the longitudinal wave velocity data in Table 3, at low volume fractions of
BaSO4 the velocity initially decreases from that of the base resin. This is a consequence
of the particle inclusions in the polymer causing the scattered propagating wave front to
negotiate a more tortuous path than in the base resin. As the filler content is increased
particle contiguity means that the energy will navigate a more straight forward path
through the material and the longitudinal velocity will increase. This is a common
phenomenon in such particle loaded systems [40]. The dominance of the density in
determining the acoustic impedance leads to an increase of acoustic impedance with
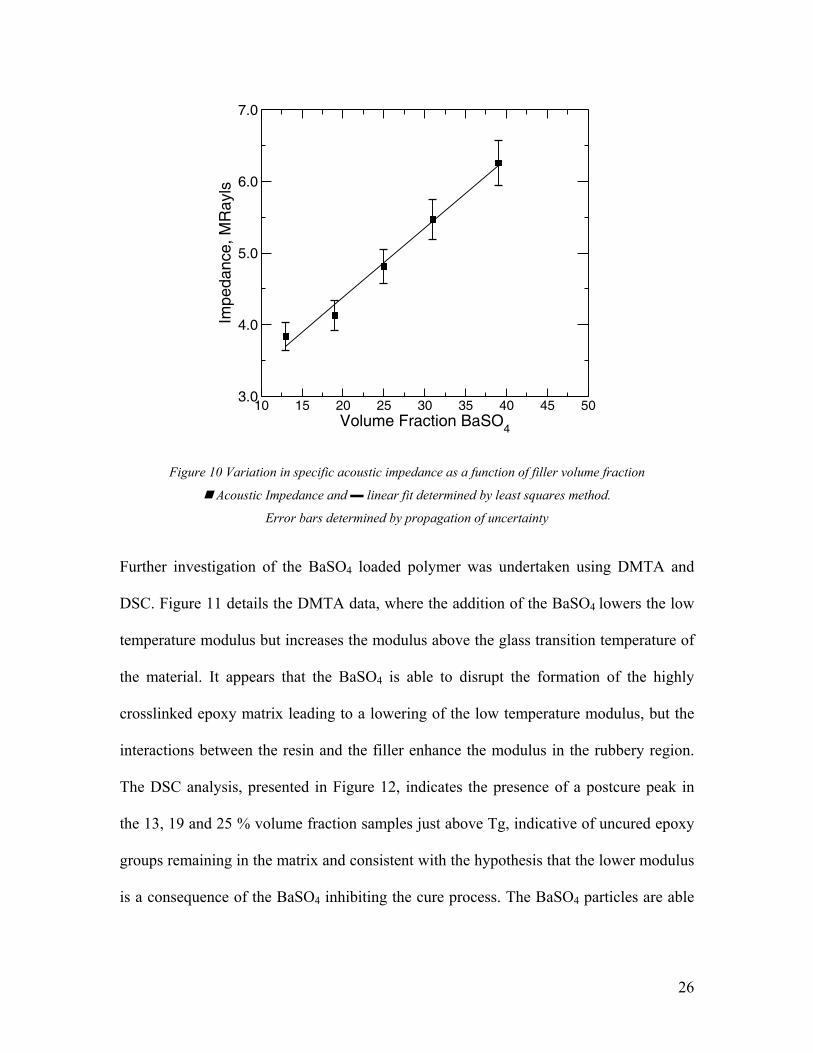
increasing BaSO4 concentration, despite the reduction in the longitudinal velocity. The
maximum value of the acoustic impedance obtained was 6.25 MRayls and, as can be seen

25
from Figure 10, the variation in acoustic impedance as function of filler composition is
approximately linear.
Filler volume
fraction (%) 13 19 25 31 39
cl (m.s-1) 2368.4 2257.4 2416.9 2472.8 2519.2
cs (m.s-1) 1153.2 1155.5 1195.5 1208.1 1281.0
Density (kg.m-3) 1624.8 1828.9 1990.6 2213.7 2486.6
Poisson Ratio 0.34 0.32 0.34 0.34 0.33
Z (MRayls) 3.84 4.13 4.81 5.47 6.26
E (GPa) 5.81 6.46 7.61 8.68 10.8
B (GPa) 6.23 6.06 7.83 9.23 10.3
G (GPa) 2.16 2.44 2.85 3.23 4.08
l (dB.m-1) 63 61 78 117 200
s (dB.m-1) 243 243 208 191 243
Table 3 Mechanical and acoustic properties of the BaSO4 loaded BisA samples determined by through
transmission method at 500 kHz
26
10 15 20 25 30 35 40 45 50Volume Fraction BaSO4
3.0
4.0
5.0
6.0
7.0
Impe
danc
e, M
Ray
ls
Figure 10 Variation in specific acoustic impedance as a function of filler volume fraction
Acoustic Impedance and ▬ linear fit determined by least squares method.
Error bars determined by propagation of uncertainty
Further investigation of the BaSO4 loaded polymer was undertaken using DMTA and
DSC. Figure 11 details the DMTA data, where the addition of the BaSO4 lowers the low
temperature modulus but increases the modulus above the glass transition temperature of
the material. It appears that the BaSO4 is able to disrupt the formation of the highly
crosslinked epoxy matrix leading to a lowering of the low temperature modulus, but the
interactions between the resin and the filler enhance the modulus in the rubbery region.
The DSC analysis, presented in Figure 12, indicates the presence of a postcure peak in
the 13, 19 and 25 % volume fraction samples just above Tg, indicative of uncured epoxy
groups remaining in the matrix and consistent with the hypothesis that the lower modulus
is a consequence of the BaSO4 inhibiting the cure process. The BaSO4 particles are able

27
to interact with the polymer and hence effectively enhance the crosslink density in the
rubbery phase with the net result of increased high temperature modulus being observed.
0 100Temperature, Celsius
1e+08
1e+09
1e+10
Ben
ding
Mod
ulus
, Pa
BisA13% BaSO4
19% BaSO4
a
0 100Temperature, Celsius
0
0.2
0.4
0.6
0.8
Tan
25% BaSO4
31% BaSO4
39% BaSO4
b
Figure 11 DMTA traces of BisA with high-density filler; (a) bending modulus, (b) tan

28
-50.0 0.0 50.0 100.0 150.0Temperature, Celsius
-0.3
-0.2
-0.1
0.0
0.1
Hea
t Flo
w, W
/g
Figure 12 DSC traces of BaSO4 loaded BisA
+ BisA polymer , filler volume fraction: □ 13%, ○ 19%, ▲ 25, 31%, 39%.
VI. CONCLUDING REMARKS
This paper has presented the ultrasonic characterisation of polymer materials by a
through transmission methodology. The method described, employs time of flight to
initially determine the longitudinal and shear acoustic properties of isotropic samples of
polymer. A method to determine the attenuation of each wave type is then described
using a curve fitting method, based on the transmission coefficients of a liquid coupled
isotropic polymer layer, to each of the propagating waves. The polymer samples
investigated are cured via a novel UV initiated method and a variety of samples have
been prepared including homopolymers, blends of different monomers and filled systems
comprising either BaSO4 particles or polymer microspheres. Such materials are of interest
to the transducer design community since it has been demonstrated that by combining
blends of two photocurable epoxy monomers and the incorporation of hollow and dense
fillers it is possible to adjust the acoustic impedance of the material over a significant
range of values. For each of the systems studied, DMTA and DSC have been employed
to further analyse the mechanical behaviour. In the case of the particle and microsphere
filled materials DMTA and DSC have been used to elucidate the interaction of the filler

29
material with the host polymer resin. The flexibility of one of the monomers, CHDG,
gives rise to a significant increase in the acoustic attenuation which needs to be
recognised when incorporating these materials into a probe design. Moreover, the
scattering effects of the highly loaded hollow spheres must also be recognised. Finally,
the BaSO4 loaded materials where found to exhibit a reduction in the crosslink density as
a result of the particles inhibiting the course of the reaction. Post-cure peaks were
observed in the DSC analysis of some of the samples, this phenomenon should be
recognised when constructing probes and the ancillary layers using such particle filled
materials.
The materials described exhibit a wide range of specific acoustic impedance, ranging
from 0.88 MRayls to 6.25 MRayls and as such are suitable for a wide variety of
ultrasonic matching layer applications. Moreover, since these materials can all be created
by UV-initiated polymerisation, the samples presented have been formed in thin film
format with thicker layers created by multiple progressive layer deposition. In principle,
it is feasible to employ spin coating methods to create layers with variable thickness and
acoustic impedance such that an impedance gradient from the transducer to the acoustic
load can be achieved. This is the subject of further study by the authors.
Acknowledgements
The financial support of the UK Engineering and Physical Sciences Research Council
under GR/S31235/01 to undertake this study, including the provision of the studentship
for Alexandre Trogé, is acknowledged. The authors also wish to acknowledge the
diligence of Mr Grant Smillie in undertaking the acoustic characterisation measurements.

30
References
1. C.S. DeSilets, J.D. Fraser, and G.S. Kino, “The Design of Efficient Broad- Band
Piezoelectric Transducers”, IEEE Transactions on Sonics and Ultrasonics, Vol.
SU-25, No. 3, pp. 115-125, (1978)
2. J.M. Cannata, T.A. Ritter, W.H. Chen, R.H. Silverman and K.K. Shung, ‘Design of
Efficient, Broadband Single Element (20-80MHz) Ultrasonic Transducers for
Medical Imaging Applications’ IEEE Transactions on Ultrasonics Ferroelectrics
and Frequency Control, Vol. 50, No. 11, pp. 1548-1557, (2003)
3. T. Yano, M. Tone, and A. Fukumoto, ‘Range finding and surface characterisation
using high frequency air transducers’ IEEE Transactions on Ultrasonics,
Ferroelectrics and Frequency Control, Vol. 34 No2, pp. 232-236, (1987)
4. S.P. Kelly, G. Hayward, and T.E. Gómez Alvarez-Arenas, ‘Characterisation and
Assessment of an integrating matching layer for Air-coupled ultrasonic
applications’ IEEE Transactions on Ultrasonics, Ferroelectrics and Frequency
Control, Vol. 51, No 10, pp. 1314-1323, (2004)
5. O. Krauss, R. Gerlach, and J. Fricke, ‘Experimental and theoretical investigations
of SiO2-aerogel matched piezoelectric transducers’, Ultrasonics, Vol. 32 No. 3,
pp. 217-222, (1994)
6. T.E. Gómez, F. Montero, E. Rodriguez, A., Roig, and E. Molins, ‘Fabrication and
characterisation of silica aerogel films for air-coupled piezoelectric transducers in
the megahertz range’ Proceedings 2002 IEEE Ultrasonics Symposium,
pp. 1107-1110, (2002)
31
7. P.C. Pedersen, O. Tretiak and P. He, ‘Impedance-matching properties of an
inhomogeneous matching layer with continuously changing acoustic impedance’
Journal of the Acoustical Society of America, Vol. 72, pp. 327-336, (1982)
8. S.N. Ramadas, G. Hayward, R.L. O'Leary, T. McCunnie, A.J. Mulholland, A.
Trogé, R.A. Pethrick, D. Robertson, and V. Murray, 'A Three-Port Acoustic Lattice
Model for Piezoelectric Transducers Containing Opposing Zones of Polarization'
Proceedings of the 2006 IEEE International Ultrasonics Symposium,
pp. 1899-1902, (2006)
9. A.J. Mulholland, S.N. Ramadas, R.L. O'Leary, , A.C.S. Parr, , A. Trogé, R.A.
Pethrick and G. Hayward, 'Enhancing the performance of piezoelectric ultrasound
transducers by the use of multiple matching layers' IMA Journal of Applied
Mathematics, Vol. 73, pp. 936-949, (2008)
10. H. Tohmyoh, ‘Polymer acoustic matching layer for broadband ultrasonic
applications’, Journal of the Acoustical Society of America, Vol. 120, pp. 31-34
(2006)
11. R.L. O’Leary, A.C.S. Parr, G. Hayward and G. Smillie, ‘CUE Materials
Database’ [Online] http://www.cue.ac.uk/cue_materials_database_ver1.2_aug_200
5.pdf - (date last viewed May 17th 2010)
12. M.G. Grewe, T.R. Gururaja, T.R. Shrout and R.E. Newnham, ‘Acoustic Properties
of Particle/Polymer Composites for Ultrasonic Transducer Backing Applications’
IEEE Transactions on Ultrasonics, Ferroelectrics and Frequency Control, Vol. 37,
No. 6, pp. 506-514, (1990)
13. H. Wang, T.A. Ritter, W. Cao and K.K. Shung, ‘High Frequency Properties of
Passive Materials for Ultrasonic Transducers’ IEEE Transactions on Ultrasonics,
Ferroelectrics and Frequency Control, Vol. 48, No. 1, pp. 78-84, (2001)

32
14. K. Saito, K. Yamaguchi and M. Kawabuchi, ‘Piezoelectric ultrasonic probe using
and epoxy resin and iron carbonyl acoustic matching layer’ United States Patent
number 4,616,152, (October 7, 1986)
15. A. Trogé, ‘A new range of ultrasonic transducers’ Ph.D. Thesis, University of
Strathclyde, Glasgow
16. A.R. Mackintosh, A.J.C. Kuehne, R.A. Pethrick, B. Guilhabert, E. Gu, C.L. Lee,
M.D. Dawson, G. Heliotis and D.D.C. Bradley ‘Novel polymer systems for deep
UV microlens arrays’ Journal of Physics D: Applied Physics , Vol. 41, No. 9,
Article 094007, (2008)
17. S. Dixon, D. Jacques, S. D. Palmer and G. Rowlands, ‘The measurement of shear
and compression waves in curing epoxy adhesives using ultrasonic reflection and
transmission techniques simultaneously’ Measurement Science and Technology
Vol. 15, pp. 939-947, (2004)
18. F. El-Tantawy and Y.K. Sung, ‘A novel ultrasonic transducer backing from porous
epoxy resin–titanium–silane coupling agent and plasticizer composites’ Materials
Letters Vol. 58, pp. 154-158, (2003)
19. B. Faiz, G. Maze, D. Decoultot, A. Moudden, E. H. Assif and M. Ezzaidi,
‘Ultrasonic Characterization of the Quality of an Epoxy Resin Polymerization’
IEEE Transactions on Ultrasonics, Ferroelectrics and Frequency Control, Vol. 46,
pp. 188-196, (1999)
20. S. Dixon and B. Lanyon, ‘Phase change measurement of ultrasonic shear waves on
reflection from a curing epoxy system’ Journal of Physics D: Applied Physics, Vol.
38, pp. 4115-4125, (2005)
21. L. G. Bunton, J. H. Daly, I. D. Maxwell and R. A. Pethrick, ‘Investigation of cure
in epoxy-resins - ultrasonic and thermally stimulated current measurements’
Journal of Applied Polymer Science, Vol. 27, pp. 4283-4294, (1982)

33
22. M. Frigione, A. Maffezzoli, D. Acierno, V. Luprano and G. Montagna,
‘Nondestructive and in-situ monitoring of mechanical property build up in epoxy
adhesives for civil applications by propagation of ultrasonic waves’ Polymer
Engineering and Science, Vol. 40, pp. 656-664, (2000)
23. K. Liang, H. Kunkel, C. Oakley and W. Huebner, ‘Acoustic characterisation of
ultrasonic transducer materials: I. Blends of rigid and flexible epoxy resins used in
piezocomposites’ Ultrasonics, Vol. 36, No. 10, pp. 979-986, (1998)
24. R.E. Montgomery, F.J. Weber, D.F. White and C.M. Thompson, ‘On the
development of acoustically transparent structural plastics’ Journal of the
Acoustical Society of America, Vol. 71, No. 3, pp. 735-741, (1982)
25. J. Krautkrämer, and H. Krautkrämer, Ultrasonic Testing of Materials. Second
Edition; Springer-Verlag: Berlin; New York, pp. 528-550, (1977)
26. V.A. Shutilov, Fundamental Physics of Ultrasound. Gordon and Breach Science
Publishers, New York, pp. 211-216, (1988),
27. R.J. Freemantle and R.E. Challis, ‘Combined compression and shear wave
ultrasonic measurements on curing adhesive’, Measurement Science and
Technology, Vol. 9, pp. 1291-1302, (1998)
28. R.L. O'Leary, ‘An Investigation into the Passive Polymer Materials Utilised in the
Construction of Piezoelectric Composite Transducers’ PhD. Thesis, University of
Strathclyde, Glasgow, Scotland, (2003).
29. A.R., Selfridge ‘Approximate Material Properties in Isotropic Materials’, IEEE
Transactions on Sonics and Ultrasonics, Vol. SU-32, No. 3, (1985)
30. L.M. Brekhovskikh and O.A. Godin Acoustics of Layered Media I, Springer
Verlag, Berlin, Second Edition, pp. 94-98, (1998)

34
31. B.A. Auld, Acoustic Fields and Waves in Solids, Vol. 1, Krieger Publishing
Company, Florida, pp. 86-99, (1990)
32. H. Kolsky, Stress Waves in Solids, New York: Dover Publications, pp. 116-122,
(1963)
33. J.R. Taylor, An introduction to error analysis : the study of uncertainties in
physical measurements University Science Books, Sausalito, CA, pp. 45-91, (1997)
34. A.C.S. Parr, R.L. O’Leary and G. Hayward, ‘'Improving the thermal stability of
piezoelectric composite transducers', IEEE Transactions on Ultrasonics,
Ferroelectrics and Frequency Control, Vol. 52, No. 4, pp. 550-563, (2005)
35. J. Heijboer, ‘The Movement of the Cyclohexyl Group in Glassy Polymers’ Kolloid
Zeitschrift, Vol. 171, pp. 7-15 (1960)
36. P.K. Datta and R.A. Pethrick, ‘Ultrasonic Studies of Glass-Filled Polymer Solids’
Journal of Physics D – Applied Physics, Vol. 13, pp. 153-161, (1980)
37. R.E. Challis, A.K. Holmes, J.S. Tebbutt and R.P. Cocker, ‘Scattering of ultrasonic
compression waves by particulate filler in a cured epoxy continuum’ Journal of the
Acoustical Society of America, Vol. 103, pp. 1413-1420, (1998)
38. Y. Hosono, Y. Yamashita and K. Itsumi, ‘Effects of metal particle dopant on
acoustic attenuation properties of silicone rubber lens for medical echo array probe’
Japanese Journal of Applied Physics, Vol. 44, No. 6B, pp. 4558-4560, (2005)
39. Y. Hosono, Y. Yamashita and K. Itsumi, ‘Effects of fine metal oxide particle
dopant on acoustic properties of silicone rubber lens for medical array probe’ IEEE
Transactions on Ultrasonics, Ferroelectrics and Frequency Control, Vol. 54, No 8,
pp. 796-799, (2007)

35
40. T.E. Gómez Alvarez-Arenas, A.J. Mulholland, G. Hayward and J. Gomatam,
‘Wave propagation in 0-3/3-3 connectivity composites with complex
microstructure’, Ultrasonics, Vol. 38, No. 9, pp. 897-907, (2000)

36
Table 1 Mechanical and acoustic properties of the BisA-CHDG mixture polymers determined by through transmission where cl is the longitudinal velocity, cs the shear
velocity, Z the acoustic impedance, E the Young modulus, K the bulk modulus, G the shear modulus, l the longitudinal attenuation and s the shear attenuation
Formulation
Volume Fraction of
BisA in CHDG
0 9.8 19.7 29.6 40.0 50.0 59.6 69.6 79.7 89.8 100
cl (m.s-1) 1784.8 1956.3 2003.2 2091.0 2232.6 2246.9 2356.8 2392.7 2441.4 2531.0 2568.3
cs (m.s-1) 766.3 800.4 799.5 870.7 910.5 924.0 943.8 971.9 1004.7 1048.5 1092.7
Density (kg.m-3) 1157.3 1156.0 1158.8 1152.9 1162.0 1172.4 1178.0 1181.0 1170.8 1180.9 1177.9
Poisson’s Ratio 0.387 0.400 0.405 0.395 0.400 0.398 0.405 0.401 0.398 0.396 0.390
Z (MRayls) 2.066 2.261 2.321 2.411 2.594 2.634 2.776 2.826 2.858 2.989 3.025
E (GPa) 1.885 2.073 2.082 2.439 2.698 2.799 2.948 3.126 3.305 3.626 3.908
K (GPa) 2.780 3.437 3.662 3.875 4.508 4.584 5.144 5.274 5.403 5.834 5.894
G (GPa) 0.679 0.741 0.741 0.8740 0.963 1.001 1.049 1.116 1.182 1.298 1.406
l (dB.m-1) 573 426 252 174 156 130 52 43 26 35 35
s (dB.m-1) 6228 5993 4334 3839 2562 2493 1729 1416 973 643 356
Tg (°C) 23 ± 1 30 ± 1 35 ± 1 44 ± 1 48 ± 1 52 ± 1 57 ± 1 61 ± 1 65 ± 1 66 ± 1 62 ± 1

37
Table 2 Mechanical properties of the CHDG-low density filler mixture determined by through transmission
methodology at 500kHz
Sample 1 wt %
(16% Vol)
2wt %
(27% Vol)
3 wt %
(36.5% Vol)
4 wt %
(43.4% Vol)
5 wt %
(49% Vol)
cl (m.s-1) 1691.3 1718.5 1439.8 1481.8 1486.7
cs (m.s-1) 904.7 824.4 771.5 762.2 794.4
Density (kg.m-3) 1032 820 678 650 595
Poisson Ratio 0.300 0.351 0.299 0.320 0.300
Z (MRayls) 1.745 1.41 0.976 0.963 0.885
E (GPa) 2.20 1.51 1.05 0.997 0.976
B (GPa) 1.83 1.68 0.867 0.923 0.815
G (GPa) 0.844 0.557 0.404 0.378 0.376
l (dB.m-1) 695 695 868 1303 1303
s (dB.m-1) 1477 1780 2172 2172 2302

38
Table 3 Mechanical and acoustic properties of the BaSO4 loaded BisA samples determined by through
transmission method at 500kHz
Filler volume
fraction (%) 13 19 25 31 39
cl (m.s-1) 2368.4 2257.4 2416.9 2472.8 2519.2
cs (m.s-1) 1153.2 1155.5 1195.5 1208.1 1281.0
Density (kg.m-3) 1624.8 1828.9 1990.6 2213.7 2486.6
Poisson Ratio 0.34 0.32 0.34 0.34 0.33
Z (MRayls) 3.84 4.13 4.81 5.47 6.26
E (GPa) 5.81 6.46 7.61 8.68 10.8
B (GPa) 6.23 6.06 7.83 9.23 10.3
G (GPa) 2.16 2.44 2.85 3.23 4.08
l (dB.m-1) 63 61 78 117 200
s (dB.m-1) 243 243 208 191 243

39
Figure 1 Chemical structures of the epoxy resins and the photo-initiator
Figure 2 Photograph of the experimental apparatus
Figure 3 Curve Fitting for the determination of attenuation in CHDG,
upper plot - Longitudinal data and lower plot - Shear data
Figure 4 Comparison of experimentally determined moduli as the composition is varied,
Bulk modulus, Young’s modulus, Shear modulus and ▬ data derived from the mixing rule.
Error bars determined by propagation of uncertainty
Figure 5 Variation in acoustic impedance of the polymer blend as the composition is varied
Measured Acoustic Impedance and ▬ Acoustic Impedance data derived from the mixing rule.
Error bars determined by propagation of uncertainty
Figure 6 Variation in attenuation measured at 500kHz as a function of composition,
Longitudinal Attenuation, Shear Attenuation and ▬ linear fit determined by least squares method
Figure 7 DMTA traces of the BisA-CHDG mixtures measured at 1Hz;
(a) bending modulus and (b) Tan .
Figure 8 DSC traces of the BisA-CHDG mixture measured at a temperature ramp of 10°C/min.
+ 100% CHDG, 19.7% BisA, 40% BisA, ▲ 59.6% BisA, O 79.7% BisA, □ 100% BisA.
Figure 9 DMTA traces of CHDG with low-density filler. (a) bending modulus, (b) tan �
Figure 10 Variation in specific acoustic impedance as a function of filler volume fraction
Acoustic Impedance and ▬ linear fit determined by least squares method.
Error bars determined by propagation of uncertainty
Figure 11 DMTA traces of BisA with high-density filler; (a) bending modulus, (b) tan
Figure 12 DSC traces of BaSO4 loaded BisA
+ BisA polymer , filler volume fraction: □ 13%, ○ 19%, ▲ 25, 31%, 39%.
Recommended