Promoting Eco-Driving Habits: A Randomised Controlled Trial
Dimitrios Xenias Lorraine Whitmarsh Paul Haggar Cardiff UniversitySteve Skippon Shell
Habits
• Much (most?) of what we do is habitual (contra. most soc. psych. models)
• 3 ingredients to habit:
...frequency
...automaticity
...cued by stable contexts (i.e. spatial, social and temporal environment)
Verplanken & Wood (2006)
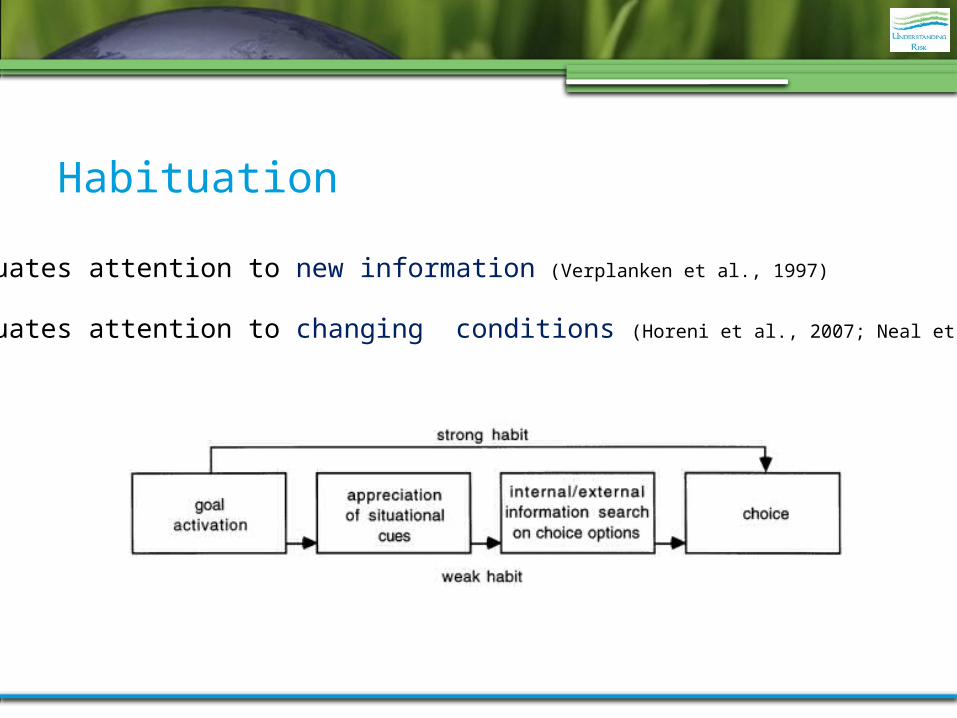
Habituation
...attenuates attention to new information (Verplanken et al., 1997)
...attenuates attention to changing conditions (Horeni et al., 2007; Neal et al., 2011)
Habit discontinuity
Habit
Context
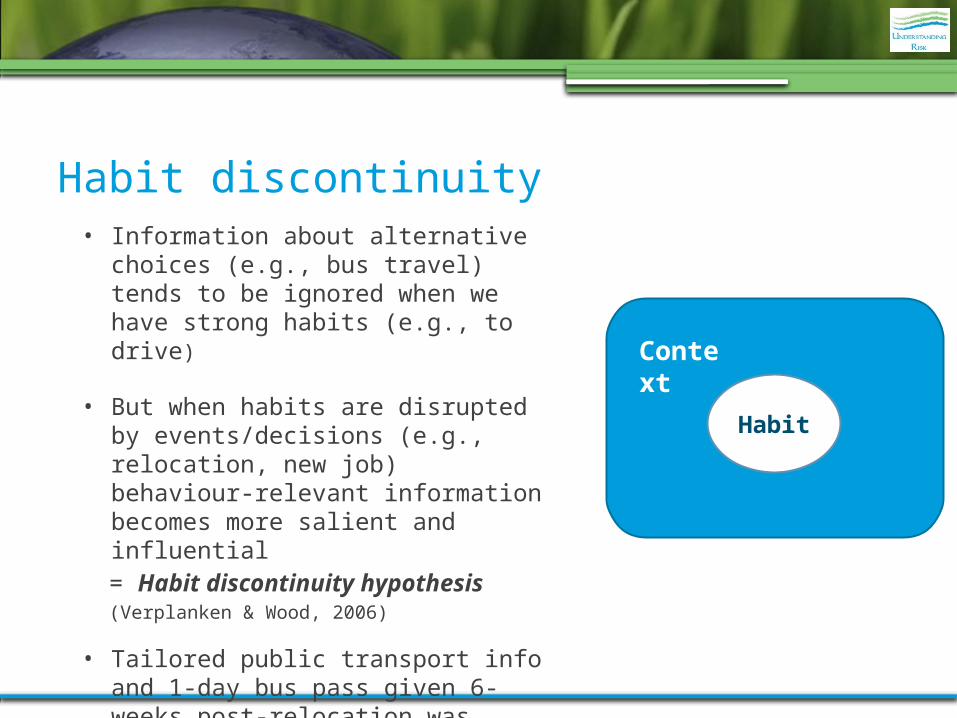
• Information about alternative choices (e.g., bus travel) tends to be ignored when we have strong habits (e.g., to drive)
• But when habits are disrupted by events/decisions (e.g., relocation, new job) behaviour-relevant information becomes more salient and influential = Habit discontinuity hypothesis (Verplanken & Wood, 2006)
• Tailored public transport info and 1-day bus pass given 6-weeks post-relocation was significantly more effective (increase from 18% to 47%) than when given to those not relocating (18% to 25%, n.s.; Bamberg, 2006)
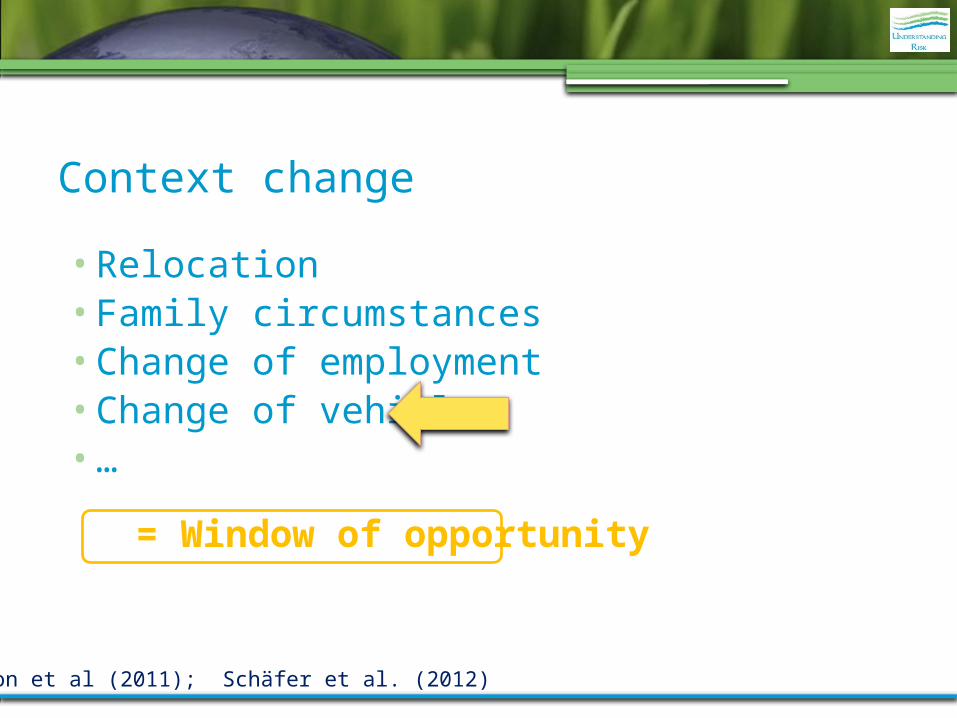
Context change
•Relocation•Family circumstances•Change of employment•Change of vehicle•…
= Window of opportunity
Thompson et al (2011); Schäfer et al. (2012)
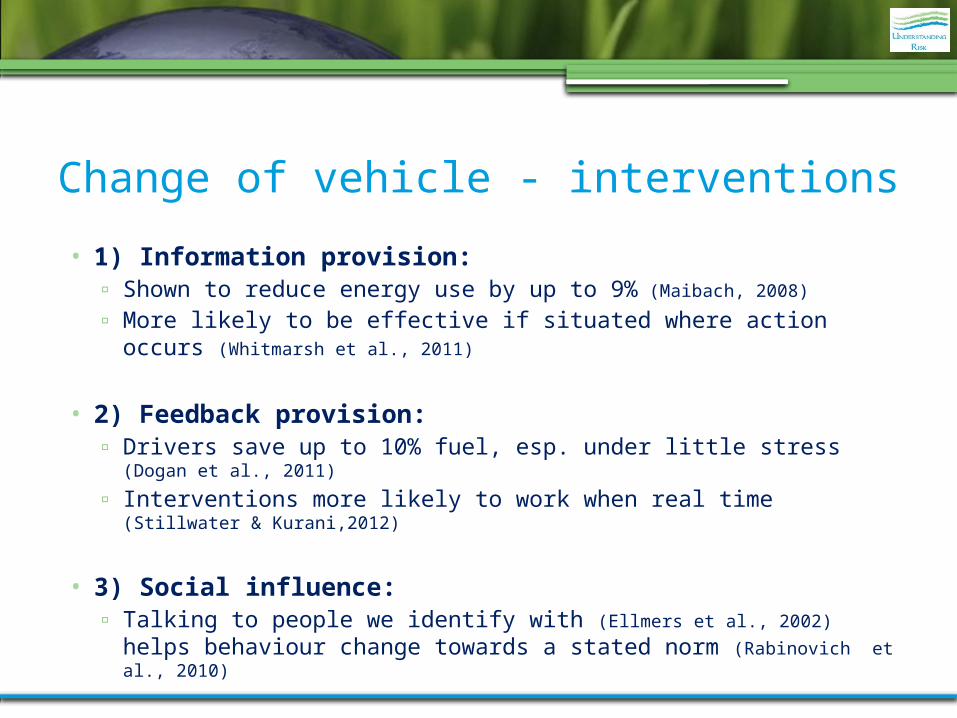
Change of vehicle - interventions
• 1) Information provision: ▫ Shown to reduce energy use by up to 9% (Maibach, 2008)
▫ More likely to be effective if situated where action occurs (Whitmarsh et al., 2011)
• 2) Feedback provision:▫ Drivers save up to 10% fuel, esp. under little stress (Dogan et al., 2011)
▫ Interventions more likely to work when real time (Stillwater & Kurani,2012)
• 3) Social influence:▫ Talking to people we identify with (Ellmers et al., 2002) helps behaviour change
towards a stated norm (Rabinovich et al., 2010)
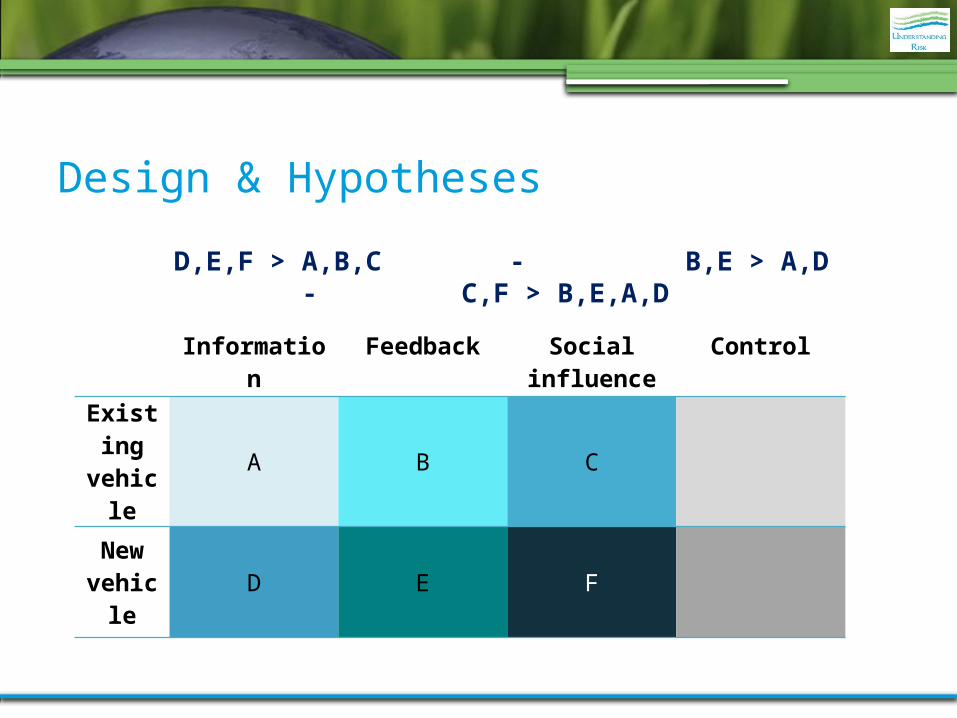
Design & Hypotheses
Information Feedback Social influence
Control
Existing vehicle A B C
New vehicle D E F
D,E,F > A,B,C - B,E > A,D - C,F > B,E,A,D
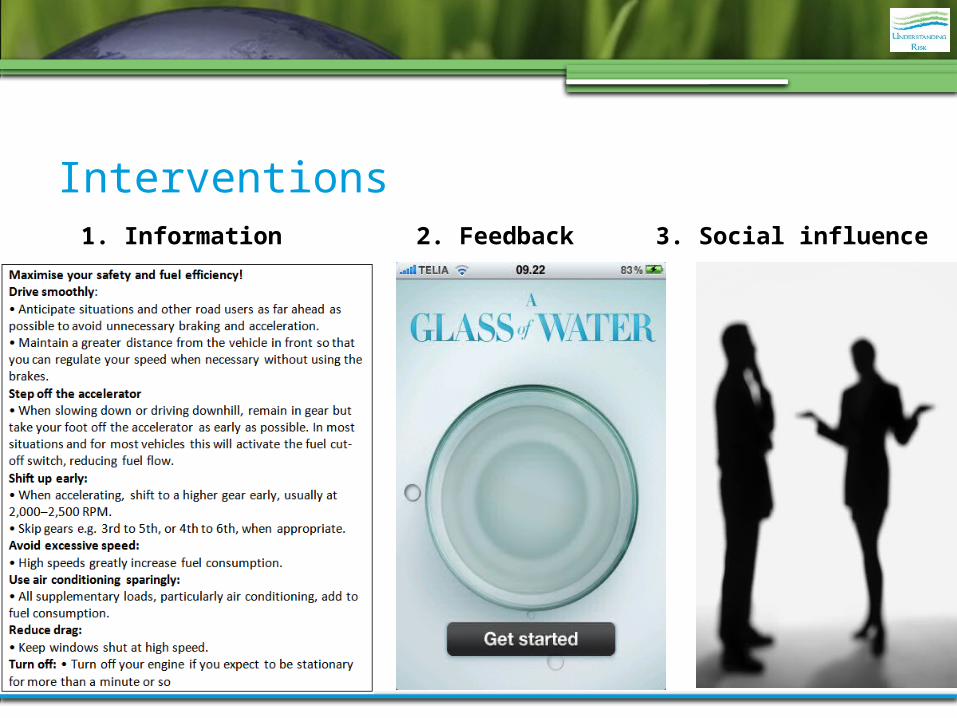
Interventions1. Information 2. Feedback 3. Social influence
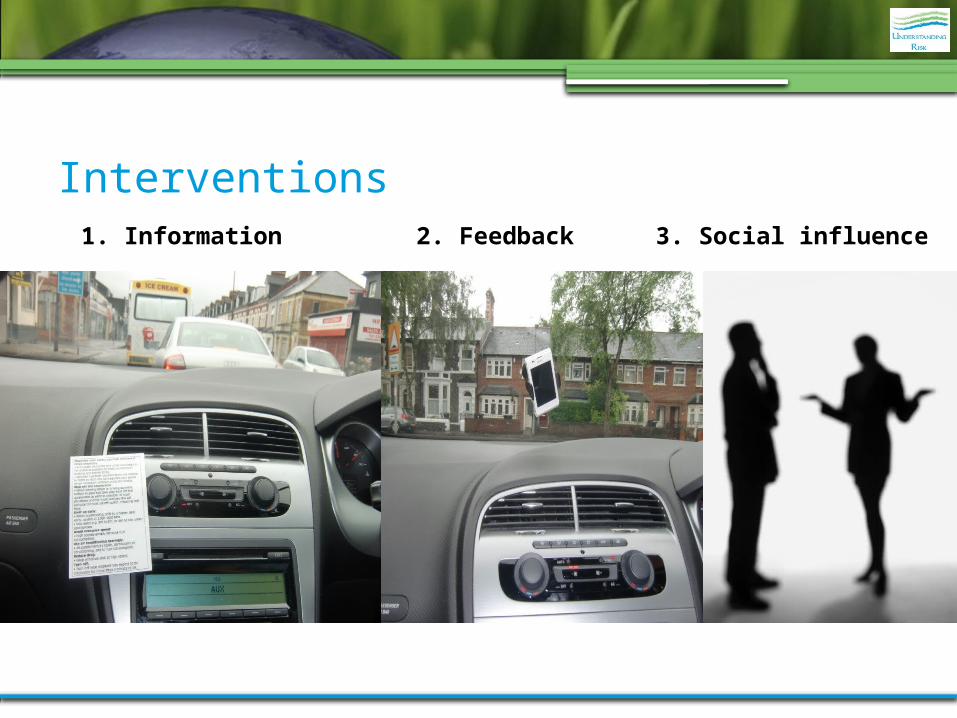
Interventions1. Information 2. Feedback 3. Social influence
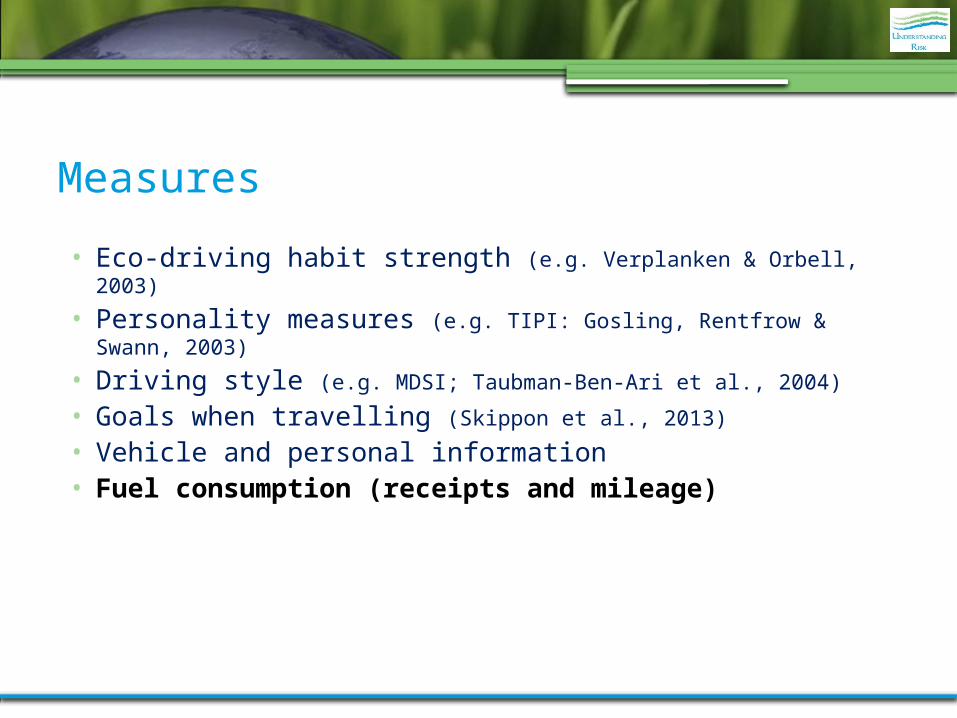
Measures
• Eco-driving habit strength (e.g. Verplanken & Orbell, 2003)
• Personality measures (e.g. TIPI: Gosling, Rentfrow & Swann, 2003)
• Driving style (e.g. MDSI; Taubman-Ben-Ari et al., 2004)
• Goals when travelling (Skippon et al., 2013)
• Vehicle and personal information• Fuel consumption (receipts and mileage)
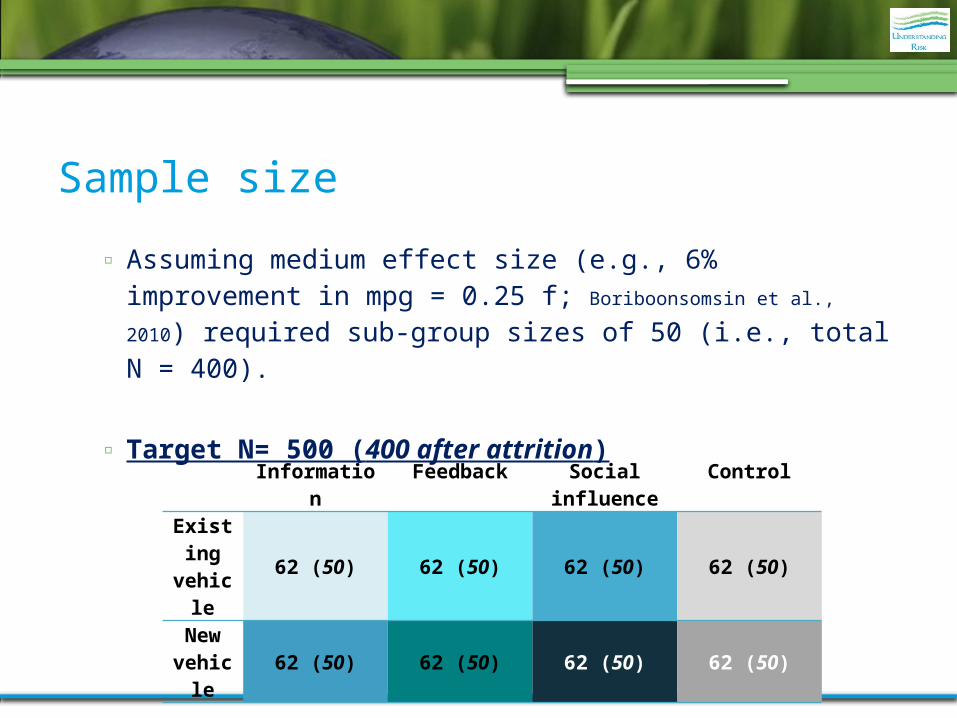
Sample size
Information Feedback Social influence Control
Existing vehicle 62 (50) 62 (50) 62 (50) 62 (50)
New vehicle 62 (50) 62 (50) 62 (50) 62 (50)
▫ Assuming medium effect size (e.g., 6% improvement in mpg = 0.25 f; Boriboonsomsin et al., 2010) required sub-group sizes of 50 (i.e., total N = 400).
▫ Target N= 500 (400 after attrition)
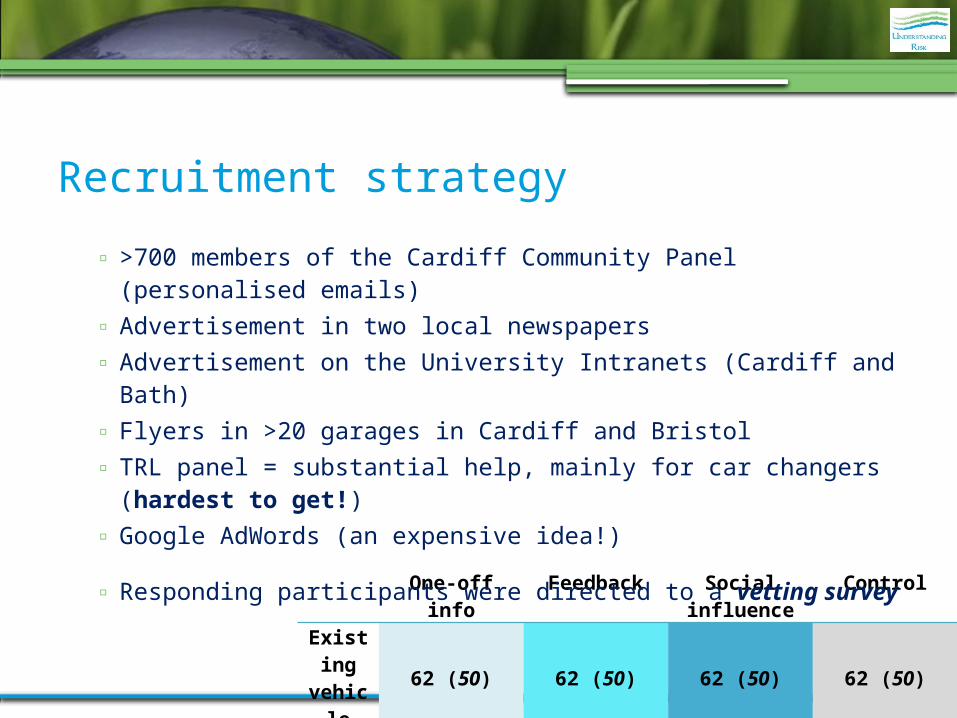
Recruitment strategy
One-off info Feedback Social influence Control
Existing vehicle 62 (50) 62 (50) 62 (50) 62 (50)
New vehicle 62 (50) 62 (50) 62 (50) 62 (50)
▫ >700 members of the Cardiff Community Panel (personalised emails)▫ Advertisement in two local newspapers▫ Advertisement on the University Intranets (Cardiff and Bath)▫ Flyers in >20 garages in Cardiff and Bristol▫ TRL panel = substantial help, mainly for car changers (hardest to get!)▫ Google AdWords (an expensive idea!)
▫ Responding participants were directed to a vetting survey
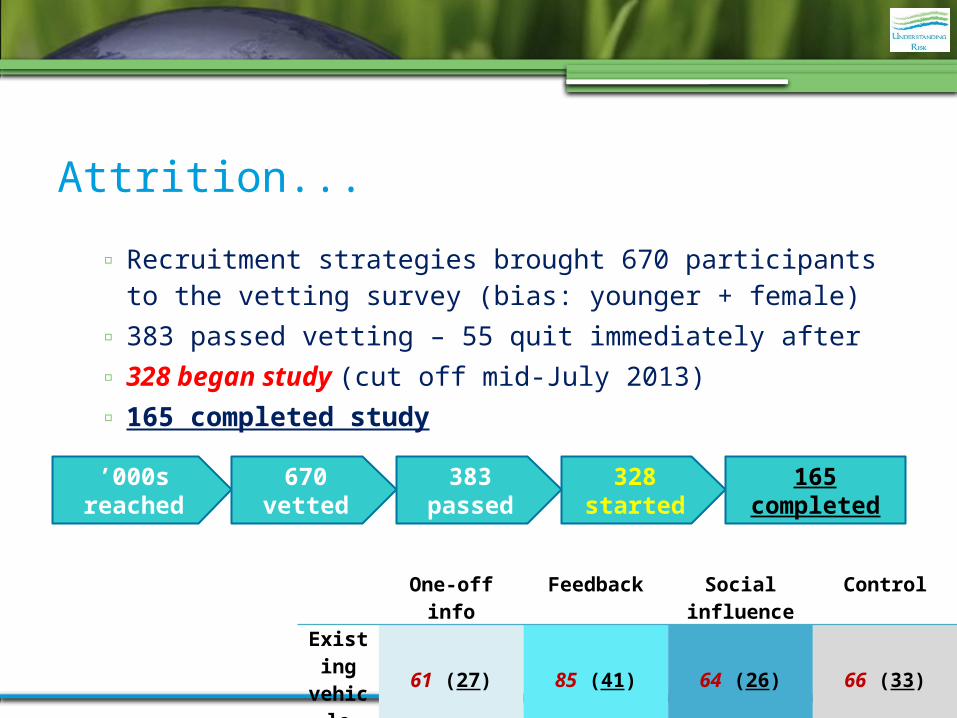
Attrition...
One-off info Feedback Social influence Control
Existing vehicle 61 (27) 85 (41) 64 (26) 66 (33)
New vehicle 03 (03) 36 (12) 07 (04) 29 (19)
▫ Recruitment strategies brought 670 participants to the vetting survey (bias: younger + female)
▫ 383 passed vetting – 55 quit immediately after▫ 328 began study (cut off mid-July 2013)▫ 165 completed study
’000s reached 670 vetted 383 passed 328 started 165 completed
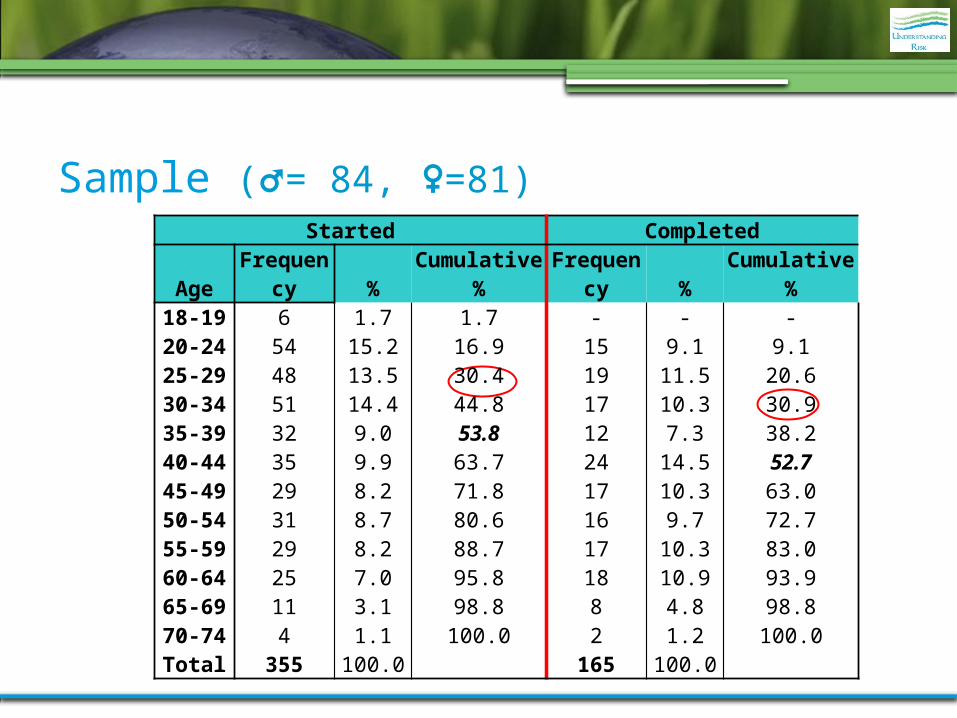
Sample (♂= 84, ♀=81)Started Completed
Age Frequency % Cumulative % Frequency % Cumulative %18-19 6 1.7 1.7 - - -20-24 54 15.2 16.9 15 9.1 9.125-29 48 13.5 30.4 19 11.5 20.630-34 51 14.4 44.8 17 10.3 30.935-39 32 9.0 53.8 12 7.3 38.240-44 35 9.9 63.7 24 14.5 52.745-49 29 8.2 71.8 17 10.3 63.050-54 31 8.7 80.6 16 9.7 72.755-59 29 8.2 88.7 17 10.3 83.060-64 25 7.0 95.8 18 10.9 93.965-69 11 3.1 98.8 8 4.8 98.870-74 4 1.1 100.0 2 1.2 100.0Total 355 100.0 165 100.0
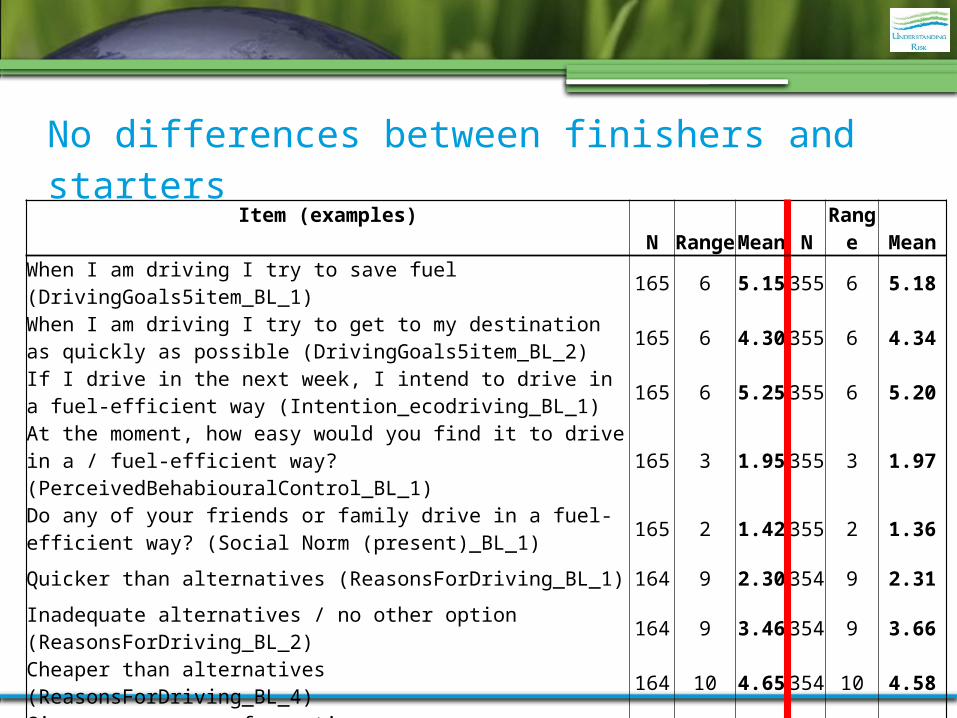
No differences between finishers and startersItem (examples) N Range Mean N Range Mean
When I am driving I try to save fuel (DrivingGoals5item_BL_1) 165 6 5.15 355 6 5.18
When I am driving I try to get to my destination as quickly as possible (DrivingGoals5item_BL_2) 165 6 4.30 355 6 4.34
If I drive in the next week, I intend to drive in a fuel-efficient way (Intention_ecodriving_BL_1) 165 6 5.25 355 6 5.20
At the moment, how easy would you find it to drive in a / fuel-efficient way? (PerceivedBehabiouralControl_BL_1) 165 3 1.95 355 3 1.97
Do any of your friends or family drive in a fuel-efficient way? (Social Norm (present)_BL_1) 165 2 1.42 355 2 1.36
Quicker than alternatives (ReasonsForDriving_BL_1) 164 9 2.30 354 9 2.31
Inadequate alternatives / no other option (ReasonsForDriving_BL_2) 164 9 3.46 354 9 3.66
Cheaper than alternatives (ReasonsForDriving_BL_4) 164 10 4.65 354 10 4.58
Gives me a sense of prestige (ReasonsForDriving_BL_10) 164 9 9.32 354 9 9.23
How much time pressure are you usually under / when you are driving to work / studies? (Time Pressure_BL) 128 2 .87 281 2 .92
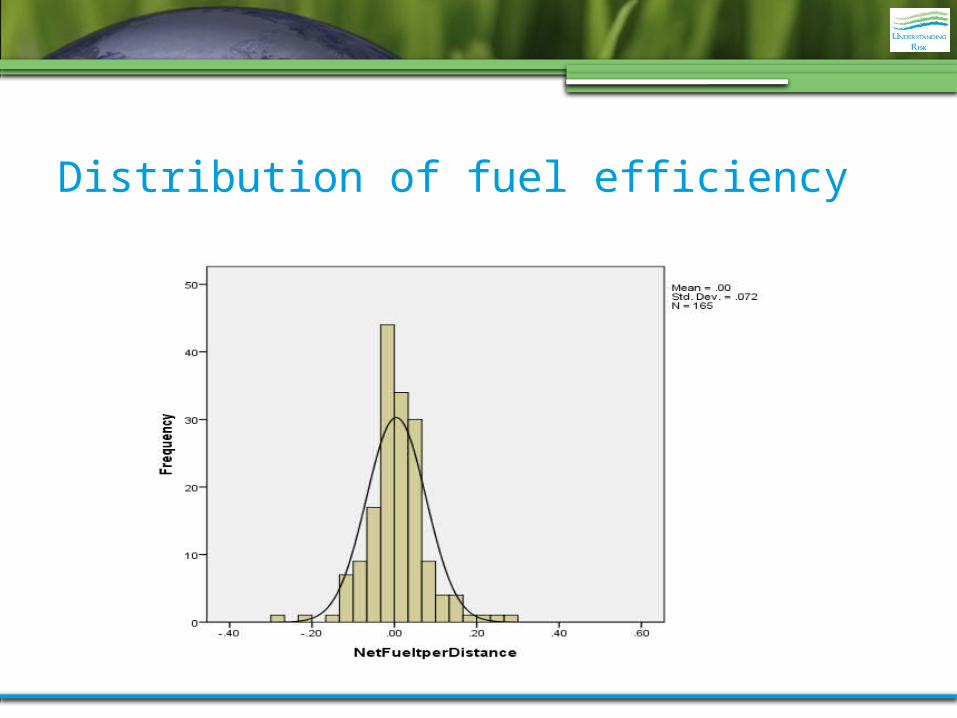
Distribution of fuel efficiency
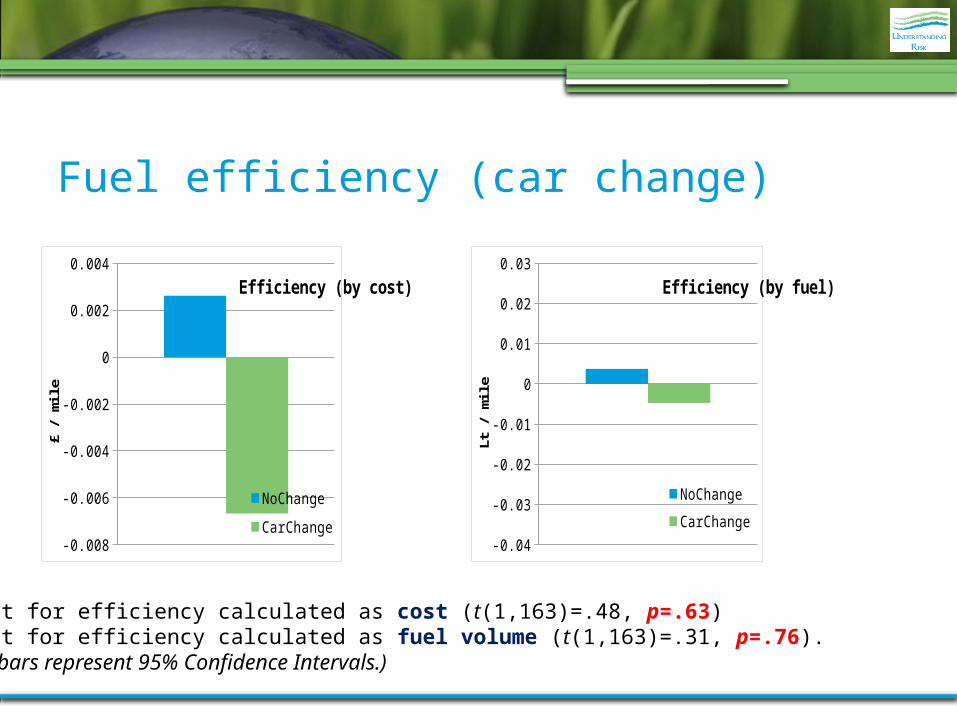
Fuel efficiency (car change)
-0.008
-0.006
-0.004
-0.002
0
0.002
0.004Efficiency (by cost)
NoChange
CarChange
£ /
mil
e
-0.04
-0.03
-0.02
-0.01
0
0.01
0.02
0.03Efficiency (by fuel)
NoChange
CarChange
Lt /
mil
e
T-test for efficiency calculated as cost (t(1,163)=.48, p=.63) T-test for efficiency calculated as fuel volume (t(1,163)=.31, p=.76).(Error bars represent 95% Confidence Intervals.)
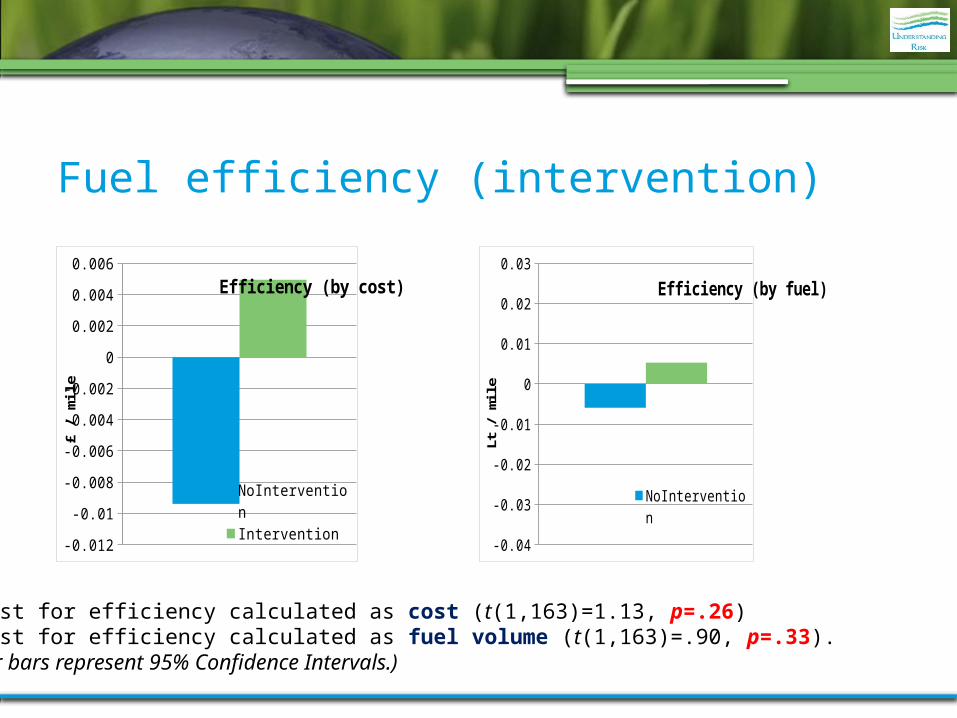
Fuel efficiency (intervention)
T-test for efficiency calculated as cost (t(1,163)=1.13, p=.26) T-test for efficiency calculated as fuel volume (t(1,163)=.90, p=.33).(Error bars represent 95% Confidence Intervals.)
-0.012
-0.01
-0.008
-0.006
-0.004
-0.002
0
0.002
0.004
0.006Efficiency (by cost)
NoIntervention
Intervention
£ /
mil
e
-0.04
-0.03
-0.02
-0.01
0
0.01
0.02
0.03
Efficiency (by fuel)
NoIntervention
Intervention
Lt /
mil
e
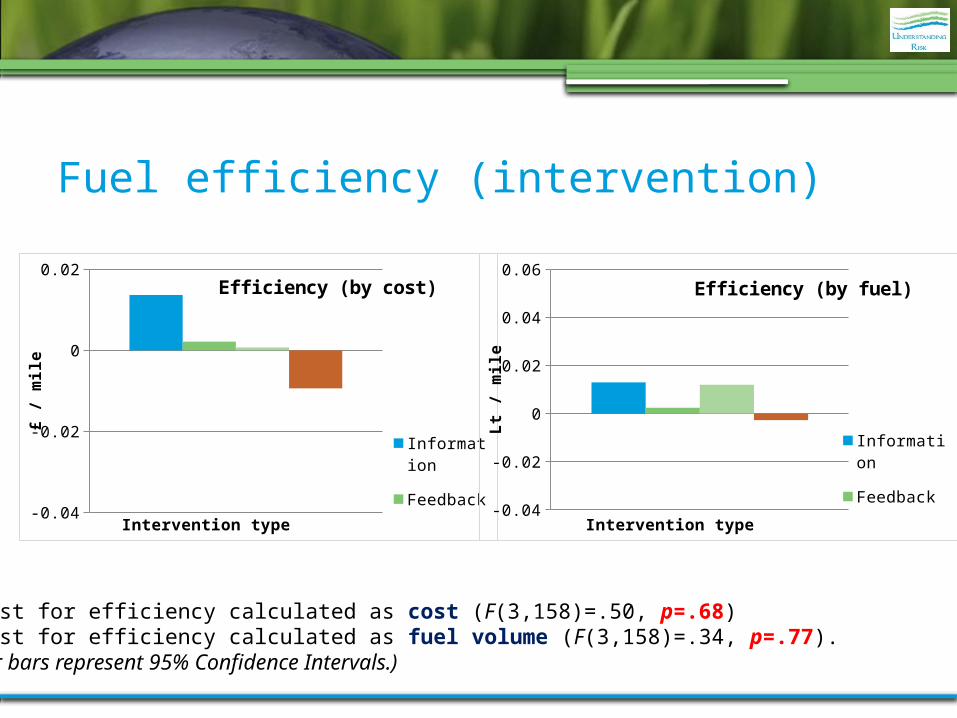
Fuel efficiency (intervention)
F-test for efficiency calculated as cost (F(3,158)=.50, p=.68) F-test for efficiency calculated as fuel volume (F(3,158)=.34, p=.77).(Error bars represent 95% Confidence Intervals.)
-0.04
-0.02
0
0.02Efficiency (by cost)
Infor-mationFeedbackDiscussionControl
Intervention type
£ /
mil
e
-0.04
-0.02
0
0.02
0.04
0.06Efficiency (by fuel)
Infor-mation FeedbackDiscussionControl
Intervention type
Lt
/ m
ile
-0.4
-0.2
0
0.2
0.4
0.6
0.8
1Habit strength
SRHI_ Base-line
SRHI_Halfway
SRHI_Final
Time of measurement
Mean
habit
str
en
gth
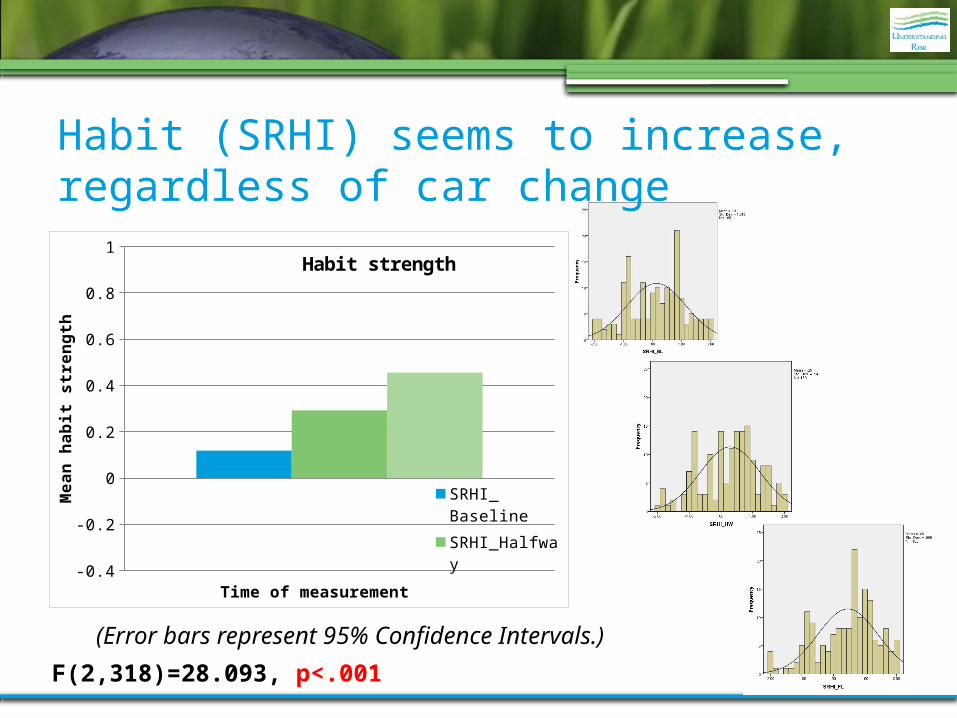
(Error bars represent 95% Confidence Intervals.)
F(2,318)=28.093, p<.001
Habit (SRHI) seems to increase, regardless of car change
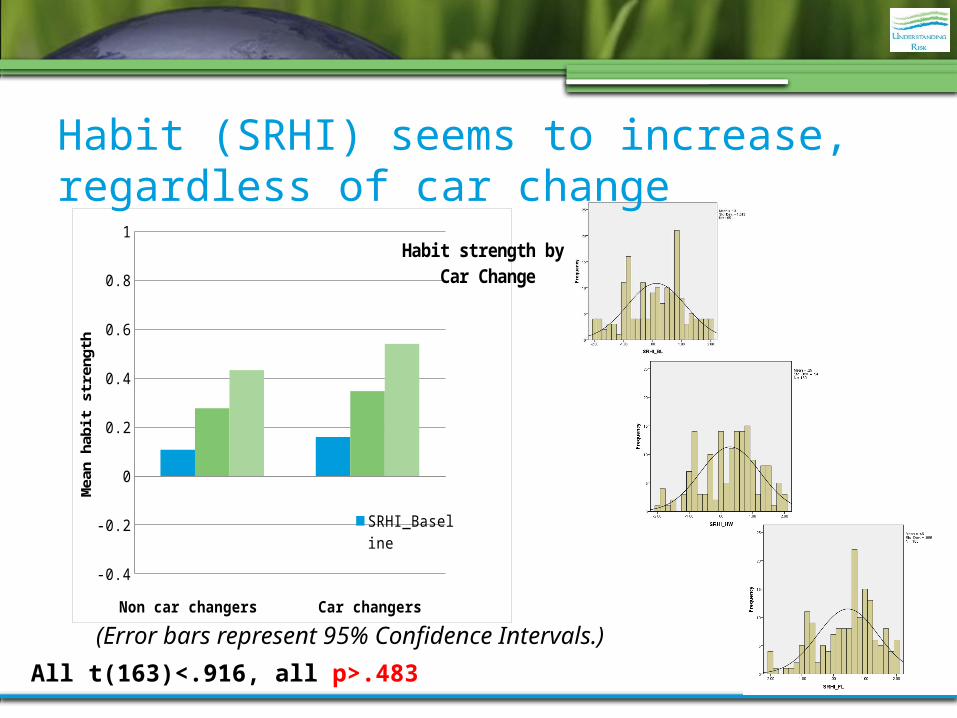
All t(163)<.916, all p>.483
-0.4
-0.2
0
0.2
0.4
0.6
0.8
1Habit strength by
Car Change
SRHI_BaselineSRHI_Halfway
Non car changers Car changers
Mea
n h
abit
str
ength
(Error bars represent 95% Confidence Intervals.)
Habit (SRHI) seems to increase, regardless of car change
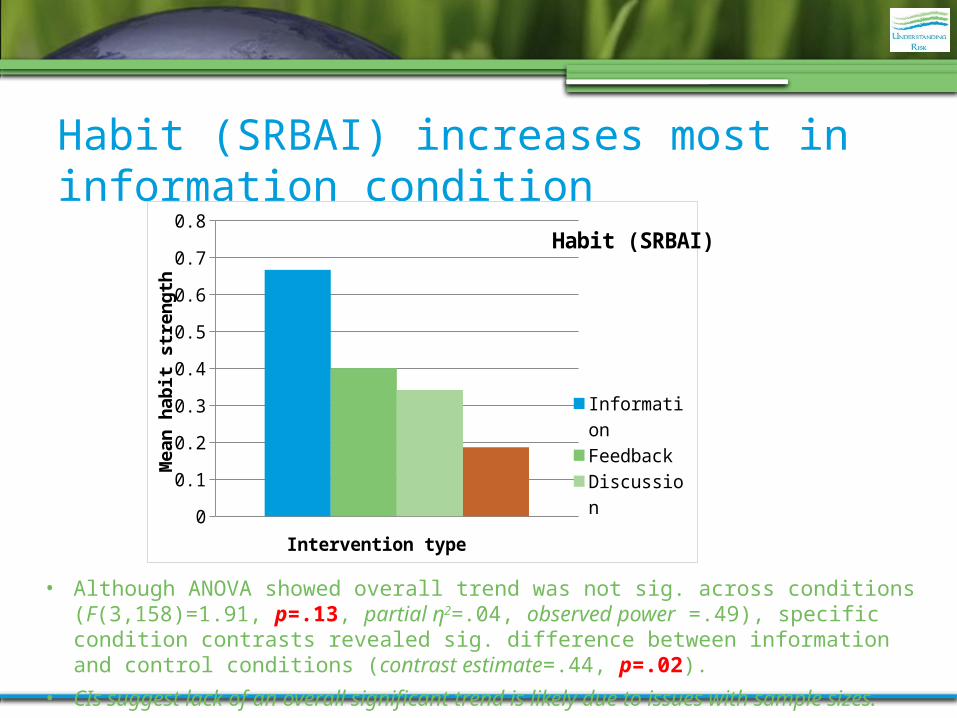
• Although ANOVA showed overall trend was not sig. across conditions (F(3,158)=1.91, p=.13, partial η2=.04, observed power =.49), specific condition contrasts revealed sig. difference between information and control conditions (contrast estimate=.44, p=.02).
• CIs suggest lack of an overall significant trend is likely due to issues with sample sizes.
Habit (SRBAI) increases most in information condition
0
0.1
0.2
0.3
0.4
0.5
0.6
0.7
0.8Habit (SRBAI)
Infor-mationFeedbackDiscussionControl
Intervention type
Mean
hab
it s
tren
gth
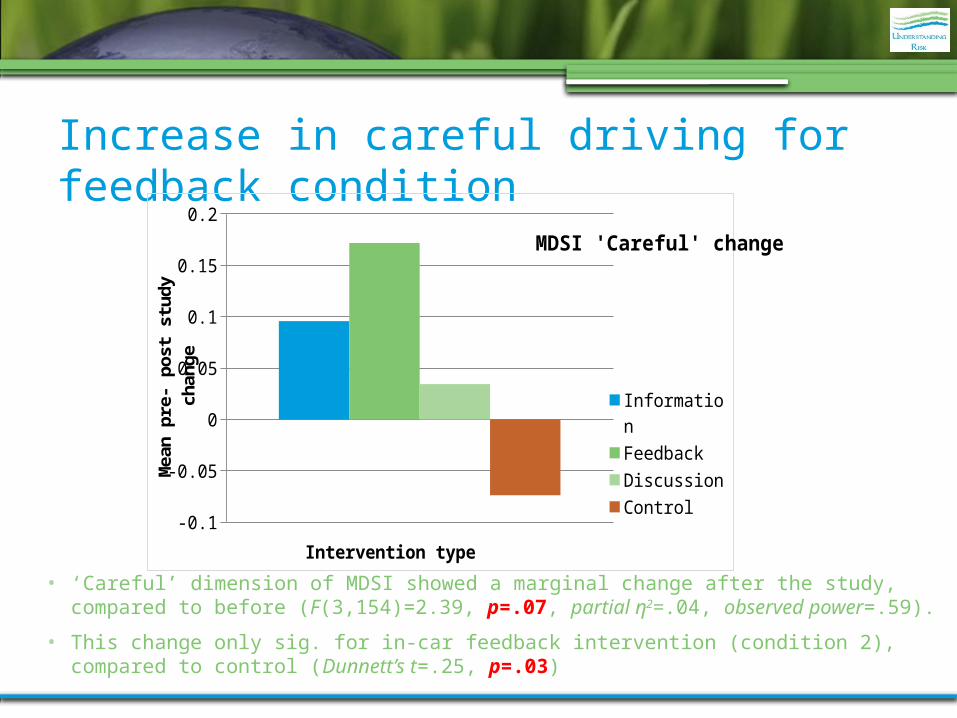
Increase in careful driving for feedback condition
• ‘Careful’ dimension of MDSI showed a marginal change after the study, compared to before (F(3,154)=2.39, p=.07, partial η2=.04, observed power=.59).
• This change only sig. for in-car feedback intervention (condition 2), compared to control (Dunnett’s t=.25, p=.03)
-0.1
-0.05
0
0.05
0.1
0.15
0.2
MDSI 'Careful' change
Information
Feedback
Discussion
Control
Intervention type
Mean
pre
- po
st s
tudy
ch
an
ge
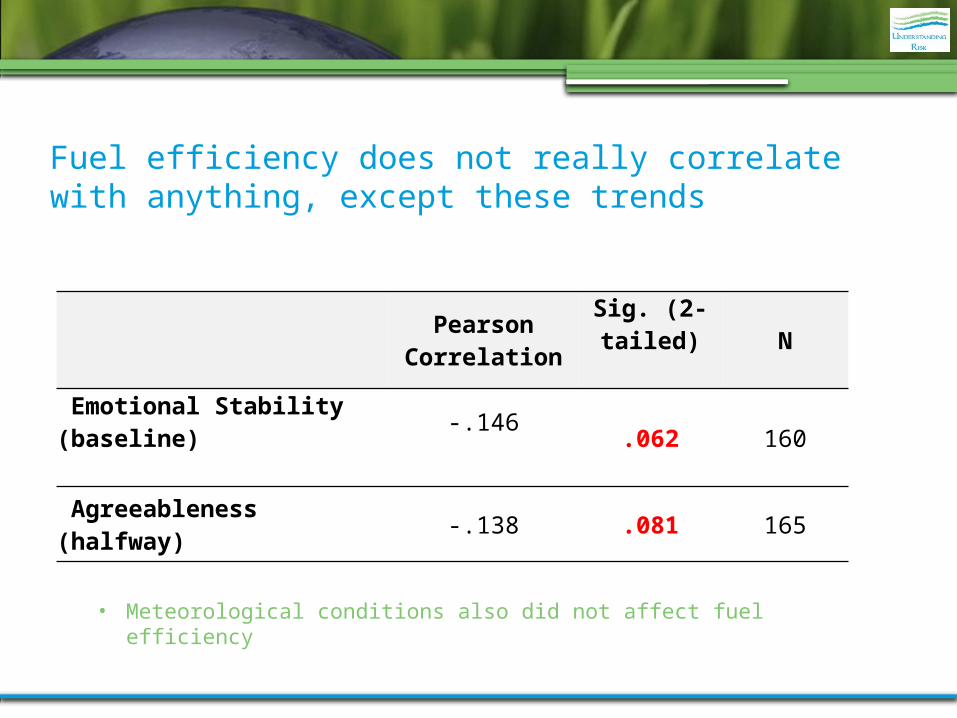
Fuel efficiency does not really correlate with anything, except these trends
Pearson Correlation
Sig. (2-tailed) N
Emotional Stability (baseline) -.146 .062 160
Agreeableness (halfway) -.138 .081 165
• Meteorological conditions also did not affect fuel efficiency
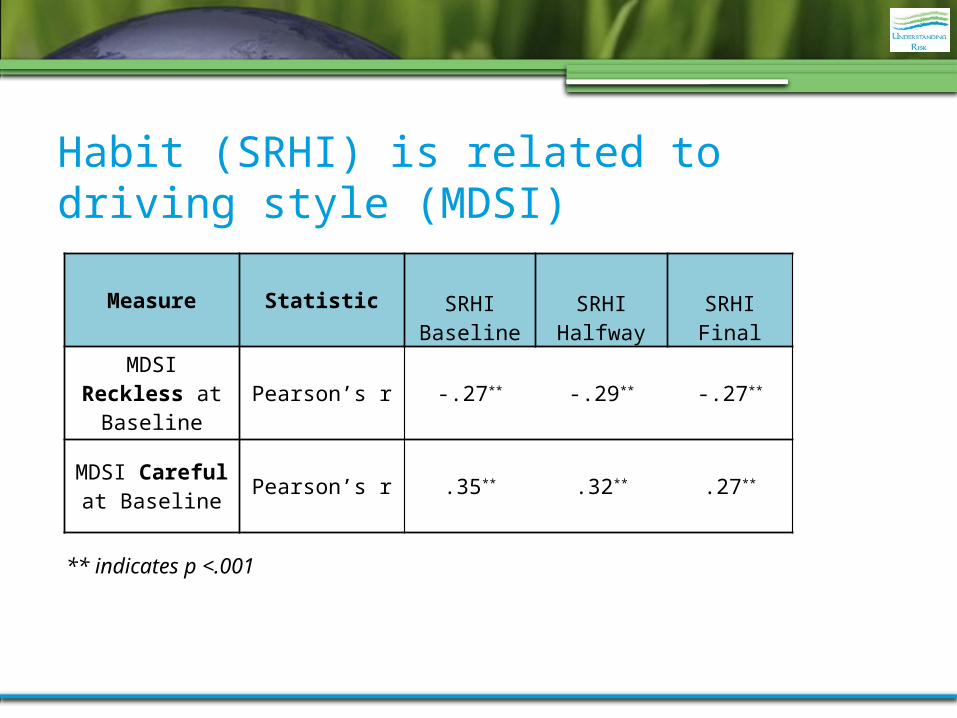
Habit (SRHI) is related to driving style (MDSI)
Measure StatisticSRHI
BaselineSRHI
HalfwaySRHIFinal
MDSI Reckless at Baseline Pearson’s r -.27** -.29** -.27**
MDSI Careful at Baseline Pearson’s r .35** .32** .27**
** indicates p <.001
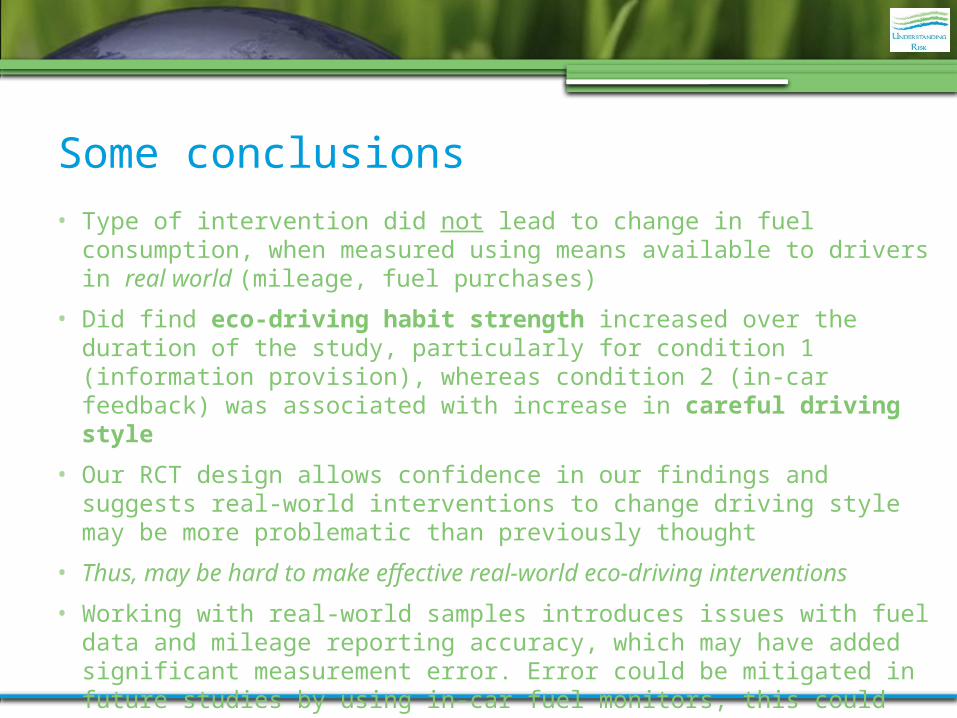
Some conclusions• Type of intervention did not lead to change in fuel consumption,
when measured using means available to drivers in real world (mileage, fuel purchases)
• Did find eco-driving habit strength increased over the duration of the study, particularly for condition 1 (information provision), whereas condition 2 (in-car feedback) was associated with increase in careful driving style
• Our RCT design allows confidence in our findings and suggests real-world interventions to change driving style may be more problematic than previously thought
• Thus, may be hard to make effective real-world eco-driving interventions
• Working with real-world samples introduces issues with fuel data and mileage reporting accuracy, which may have added significant measurement error. Error could be mitigated in future studies by using in-car fuel monitors, this could compromise external validity: if an intervention does not lead to changes the drivers themselves can perceive/measure, it is rather unlikely to succeed

Thank you
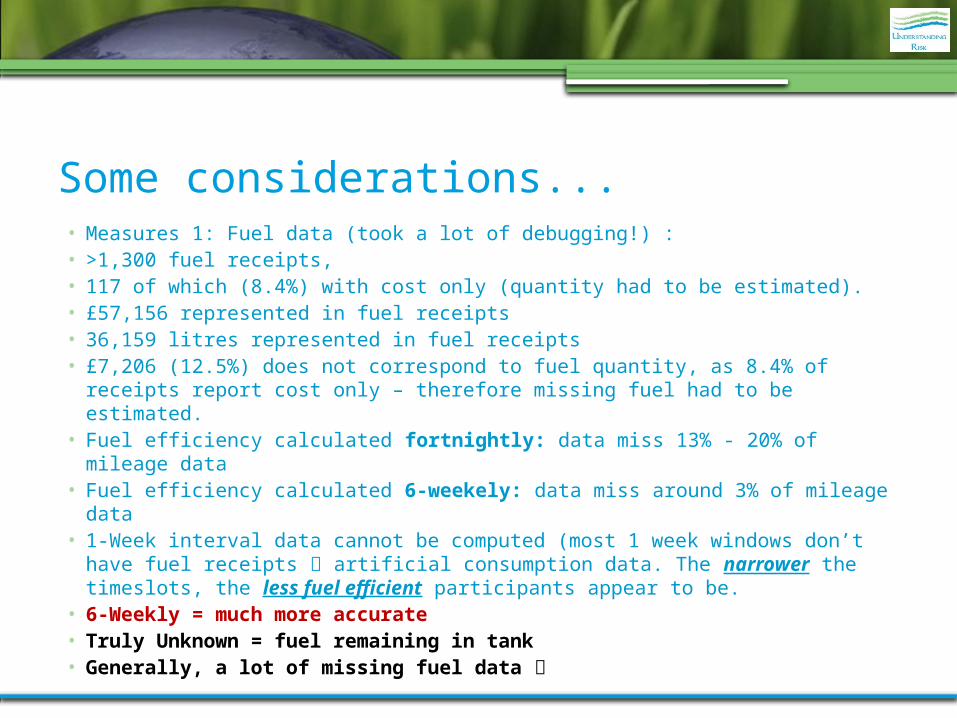
Some considerations...• Measures 1: Fuel data (took a lot of debugging!) : • >1,300 fuel receipts, • 117 of which (8.4%) with cost only (quantity had to be estimated).• £57,156 represented in fuel receipts• 36,159 litres represented in fuel receipts• £7,206 (12.5%) does not correspond to fuel quantity, as 8.4% of receipts report
cost only – therefore missing fuel had to be estimated.• Fuel efficiency calculated fortnightly: data miss 13% - 20% of mileage data• Fuel efficiency calculated 6-weekely: data miss around 3% of mileage data• 1-Week interval data cannot be computed (most 1 week windows don’t have fuel
receipts artificial consumption data. The narrower the timeslots, the less fuel efficient participants appear to be.
• 6-Weekly = much more accurate• Truly Unknown = fuel remaining in tank• Generally, a lot of missing fuel data
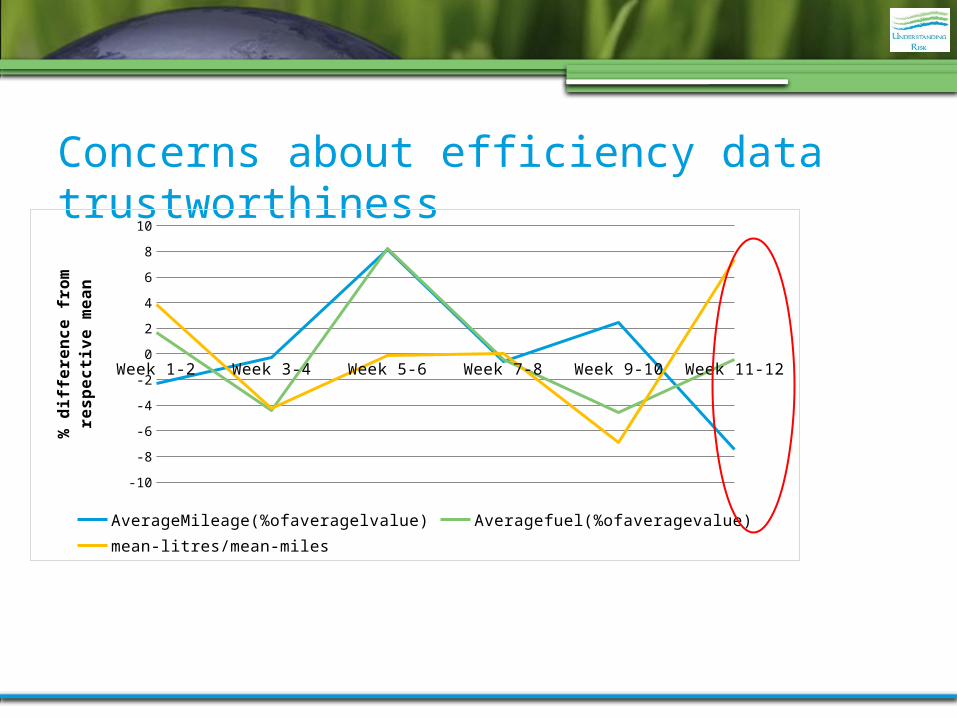
Concerns about efficiency data trustworthiness
Week 1-2 Week 3-4 Week 5-6 Week 7-8 Week 9-10 Week 11-12
-10
-8
-6
-4
-2
0
2
4
6
8
10
AverageMileage(%ofaveragelvalue) Averagefuel(%ofaveragevalue)mean-litres/mean-miles
% d
iffer
ence
from
res
pecti
ve m
ean
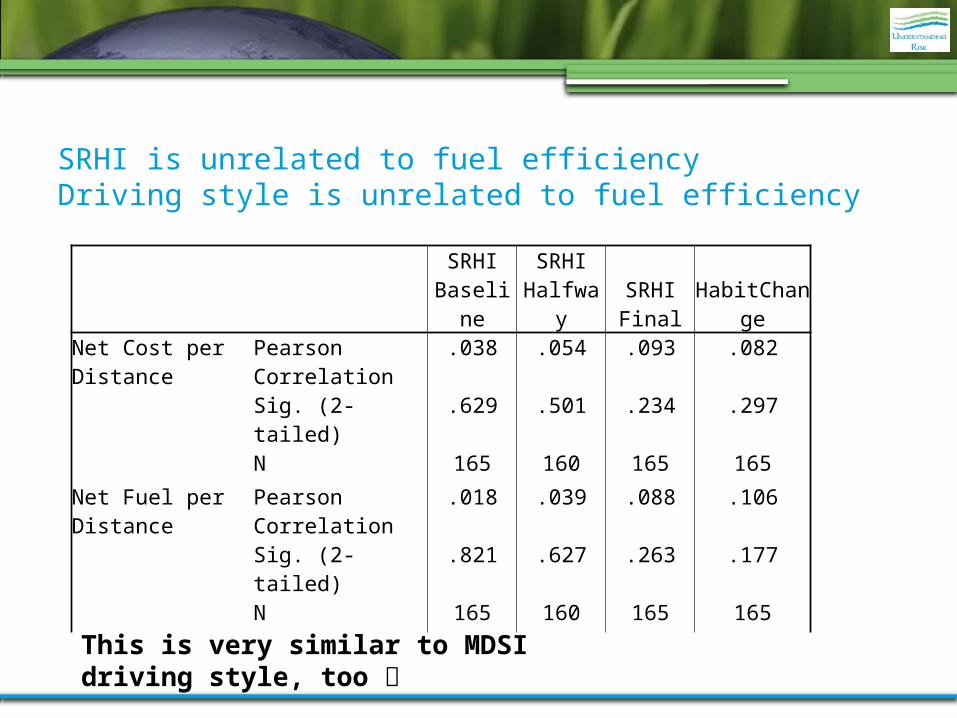
SRHI is unrelated to fuel efficiencyDriving style is unrelated to fuel efficiency
SRHI
BaselineSRHI
Halfway SRHI Final HabitChangeNet Cost per Distance
Pearson Correlation .038 .054 .093 .082
Sig. (2-tailed) .629 .501 .234 .297
N 165 160 165 165
Net Fuel per Distance
Pearson Correlation .018 .039 .088 .106
Sig. (2-tailed) .821 .627 .263 .177
N 165 160 165 165
This is very similar to MDSI driving style, too
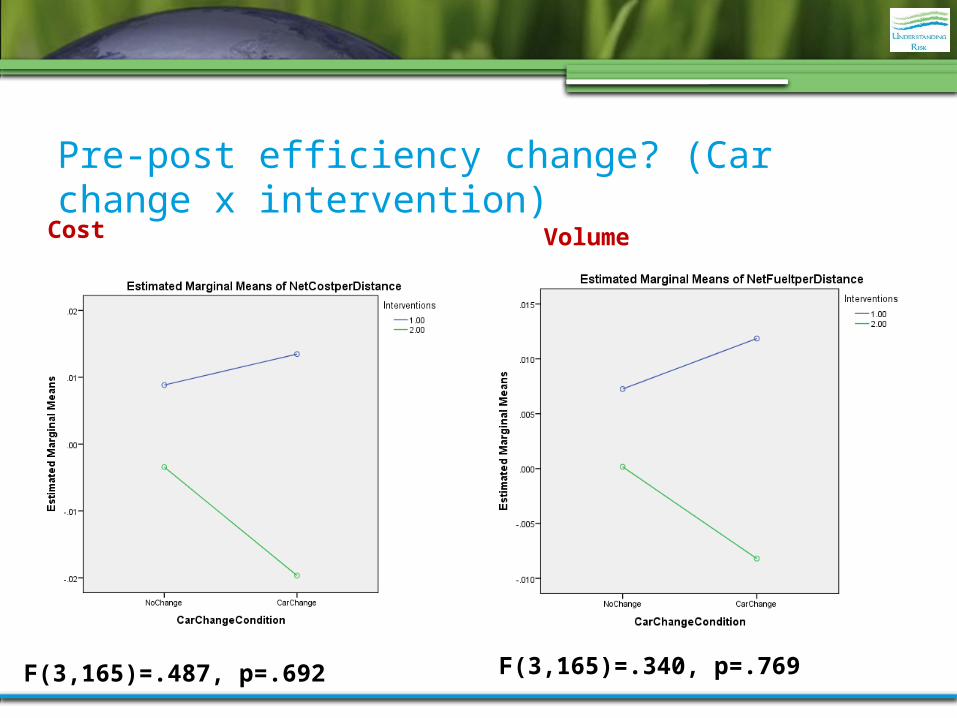
Pre-post efficiency change? (Car change x intervention)
F(3,165)=.487, p=.692
Cost Volume
F(3,165)=.340, p=.769
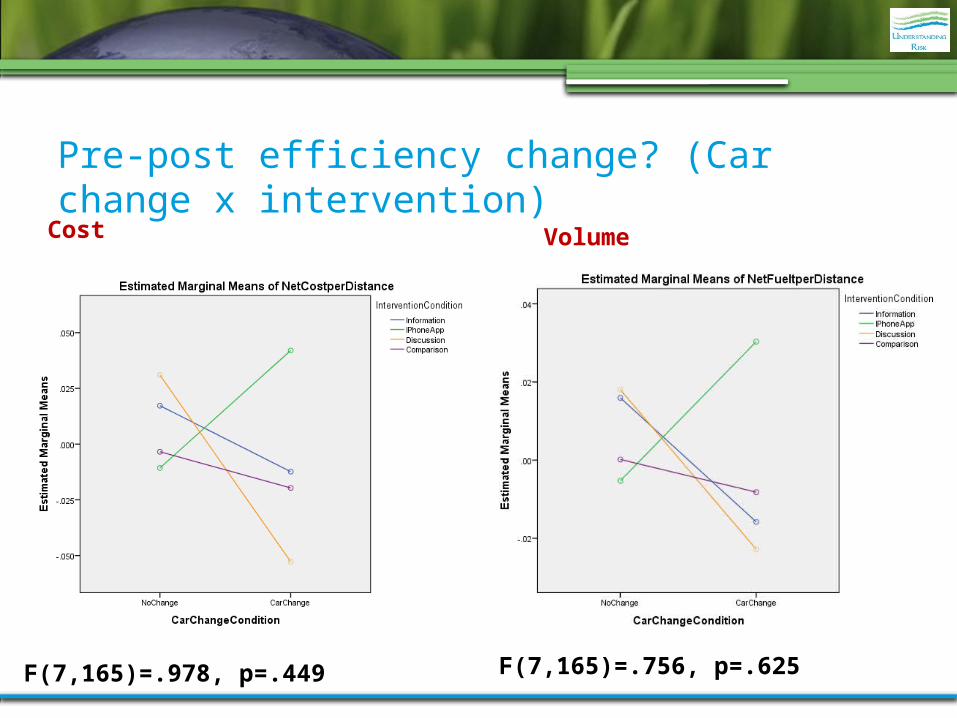
Pre-post efficiency change? (Car change x intervention)
F(7,165)=.978, p=.449
Cost Volume
F(7,165)=.756, p=.625
Recommended