ProjectsMarch 30, 2017Tim Watson, SVP, Project Development and Engineering Alex Christopher, SVP, Exploration, Projects and Technical Services

Projects
Forward Looking InformationBoth these slides and the accompanying oral presentation contain certain forward-looking statements within the meaning of the United States Private SecuritiesLitigation Reform Act of 1995 and forward-looking information within the meaning of the Securities Act (Ontario) and comparable legislation in other provinces.Forward-looking statements can be identified by the use of words such as “plans”, “expects” or “does not expect”, “is expected”, “budget”, “scheduled”,“estimates”, “forecasts”, “intends”, “anticipates” or “does not anticipate”, or “believes”, or variation of such words and phrases or state that certain actions, eventsor results “may”, “could”, “should”, “would”, “might” or “will” be taken, occur or be achieved. Forward-looking statements involve known and unknown risks,uncertainties and other factors which may cause the actual results, performance or achievements of Teck to be materially different from any future results,performance or achievements expressed or implied by the forward-looking statements. These forward-looking statements relating to Fort Hills include statementsrelating to management’s expectations with respect to production capacity and scheduling, expectations about the timing and budget to project completion andthe statement that Fort Hills is expected to generate 45 years of cash flows. These forward-looking statements relating to Quebrada Blanca Phase 2 includemineral resource disclosure, life of mine, projected capital cost and C1 costs, and other financial projections regarding the project, anticipated production andprojected project economics, including annual EBITDA, as well as other statements regarding the anticipated attributes of the project.
These forward-looking statements involve numerous assumptions, risks and uncertainties and actual results may vary materially. These statements are based ona number of assumptions, including, but not limited to, assumptions noted in the various slides and oral presentation, assumptions regarding general businessand economic conditions, the supply and demand for, inventories of, and the level and volatility of prices of copper and other primary metals and mineralsproduced by Teck as well as oil, the accuracy of Teck’s reserve and resource estimates (including with respect to size, grade and recoverability) and thegeological, operational and price assumptions on which these are based, the resolution of environmental and other proceedings, receipt of permits for ourprojects, our ongoing relations with our employees and partners and joint venturers, and the future operational and financial performance of the companygenerally. The foregoing list of assumptions is not exhaustive. Assumptions regarding Fort Hills also include the assumption that project development andfunding proceed as planned, as well as assumptions noted on the relevant slides discussing Fort Hills. Assumptions regarding Quebrada Blanca Phase 2 alsoinclude the assumptions that the project is developed in accordance with the feasibility study.
Events or circumstances could cause actual results to differ materially. Factors that may cause actual results to vary include, but are not limited to: factors notedin the various slides and oral presentation, unanticipated developments in business and economic conditions in the principal markets for Teck’s products or in thesupply, demand, and prices for metals and other commodities to be produced, inaccurate geological or metallurgical assumptions (including with respect to thesize, grade and recoverability of mineral or oil and gas reserves and resources), changes in taxation laws or tax authority assessing practices, legal disputes orunanticipated outcomes of legal proceedings, unanticipated operational difficulties (including failure of plant, equipment or processes to operate in accordancewith specifications or expectations, cost escalation, unavailability of materials and equipment, government action or delays in the receipt of permits orgovernment approvals, industrial disturbances or other job action, and unanticipated events related to health, safety and environmental matters), decisions madeby our partners or co-venturers, political events, social unrest, lack of available financing for Teck or its partners or co-venturers, and changes in generaleconomic conditions or conditions in the financial markets. Our Fort Hills project is not controlled by us and construction and production schedules may beadjusted by our partners. Our Quebrada Blanca project is jointly owned.
We assume no obligation to update forward-looking statements except as required under securities laws. Further information concerning assumptions, risks anduncertainties associated with these forward-looking statements and our business can be found in our Annual Information Form for the year ended December 31,2016, filed under our profile on SEDAR (www.sedar.com) and on EDGAR (www.sec.gov) under cover of Form 40-F, and management discussion and analysisreports and other public filings filed on www.sedar.com or www.sec.gov.
2

Projects
Agenda
Fort Hills
Quebrada Blanca Phase 2
3

Fort Hills
Project Overview• Nameplate capacity increased to 194 kbpd• Steady state production increased to 186 kbpd• First oil end of 2017• Expect to achieve 90% of nameplate capacity by end 2018
Source: Fort Hills Energy Limited Partnership, Fall 2016.4
Fort Hills
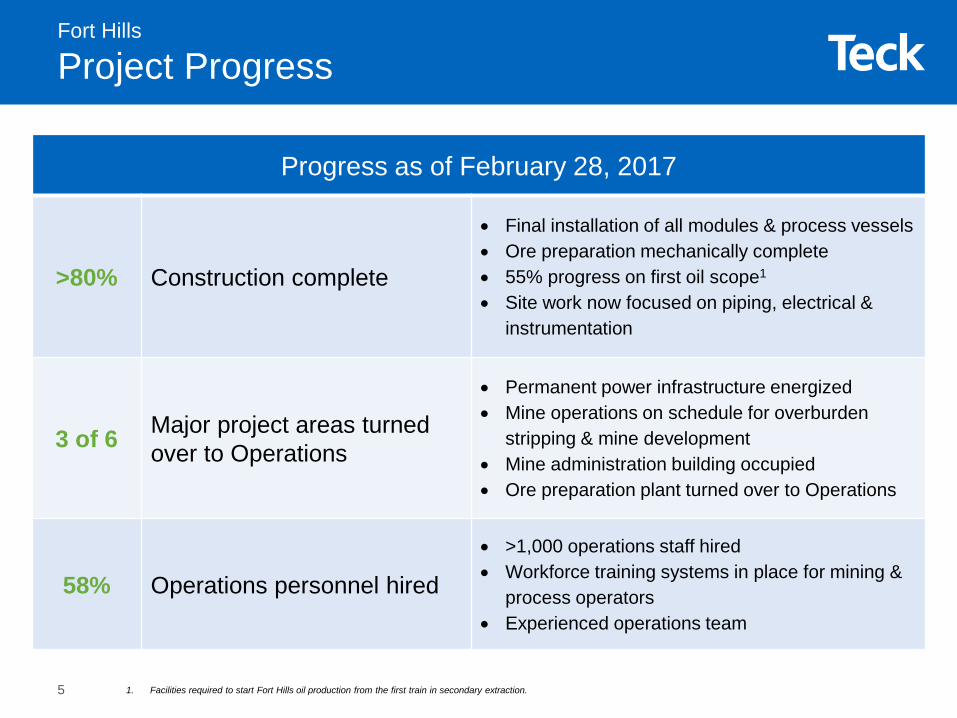
Project Progress
Progress as of February 28, 2017
>80% Construction complete
• Final installation of all modules & process vessels • Ore preparation mechanically complete• 55% progress on first oil scope1
• Site work now focused on piping, electrical & instrumentation
3 of 6 Major project areas turned over to Operations
• Permanent power infrastructure energized• Mine operations on schedule for overburden
stripping & mine development• Mine administration building occupied• Ore preparation plant turned over to Operations
58% Operations personnel hired
• >1,000 operations staff hired • Workforce training systems in place for mining &
process operators• Experienced operations team
1. Facilities required to start Fort Hills oil production from the first train in secondary extraction.5

Six Major Project Areas Target Date / Status
1. Mining1 Completed
2. Ore Prep1 Completed
3. Major Infrastructure1 Completed 4. Primary Extraction & Tailings
‒ Primary Extraction‒ Tailings
April 2017August 2017
5. Utilities June 2017
6. Secondary Extraction (First Train) First Oil in December 2017
1. Construction completed. Turned over to operations.2. Facilities required to start Fort Hills oil production from the first train in secondary extraction.
Fort Hills
Major Milestones
Other Milestones Target Date / Status
Power Transmission & Distribution1 Completed
50% First Oil Scope2 Completed
Five of six major project areas tracking to plan
6

Fort Hills
Ore Preparation: Crusher
Fall 2016
Source: Fort Hills Energy Limited Partnership
1
9

Fort Hills
Ore Preparation: Slurry Prep
Fall 2016
Source: Fort Hills Energy Limited Partnership
1
11
Fort Hills
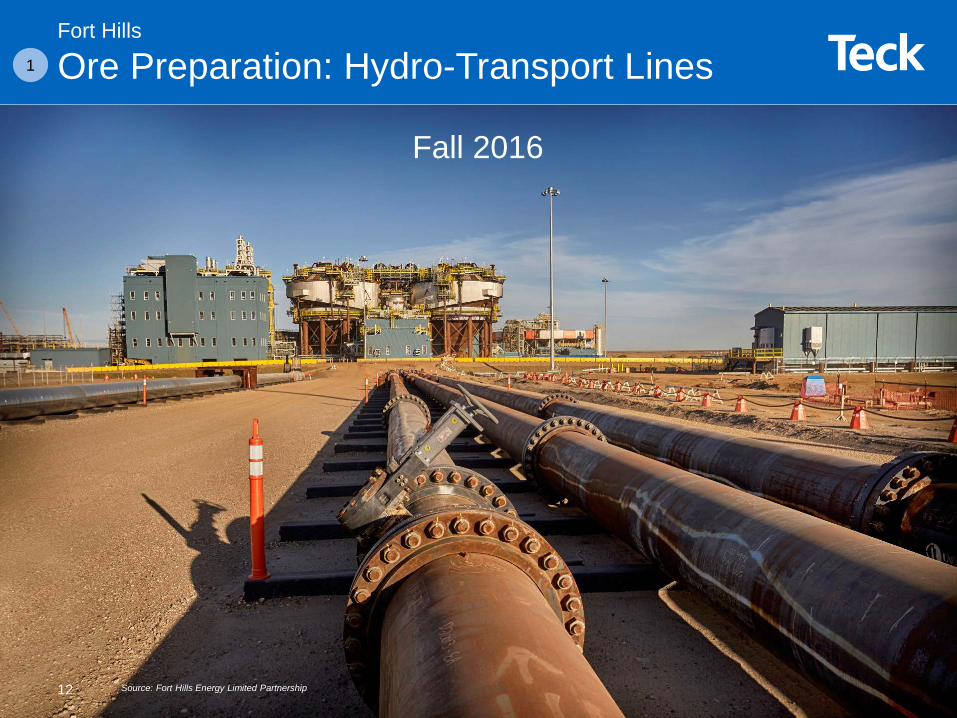
Ore Preparation: Hydro-Transport Lines
Fall 2016
Source: Fort Hills Energy Limited Partnership
1
12

Fort Hills
Primary Extraction: Primary Separation Cell
Fall 2016
Source: Fort Hills Energy Limited Partnership
2
15

Fort Hills
Utilities
Fall 2016
Source: Fort Hills Energy Limited Partnership
3
18

Fort Hills
River Water Intake
Fall 2016
Source: Fort Hills Energy Limited Partnership
4
21

Fort Hills
Main Substation
Fall 2016
Source: Fort Hills Energy Limited Partnership
5
23

Fort Hills
Tank Farm: Trans Canada Pipeline Limited
Fall 2016
Source: Fort Hills Energy Limited Partnership
6
25

Fort Hills
East Tank Farm
Fall 2016
Source: Fort Hills Energy Limited Partnership
7
27
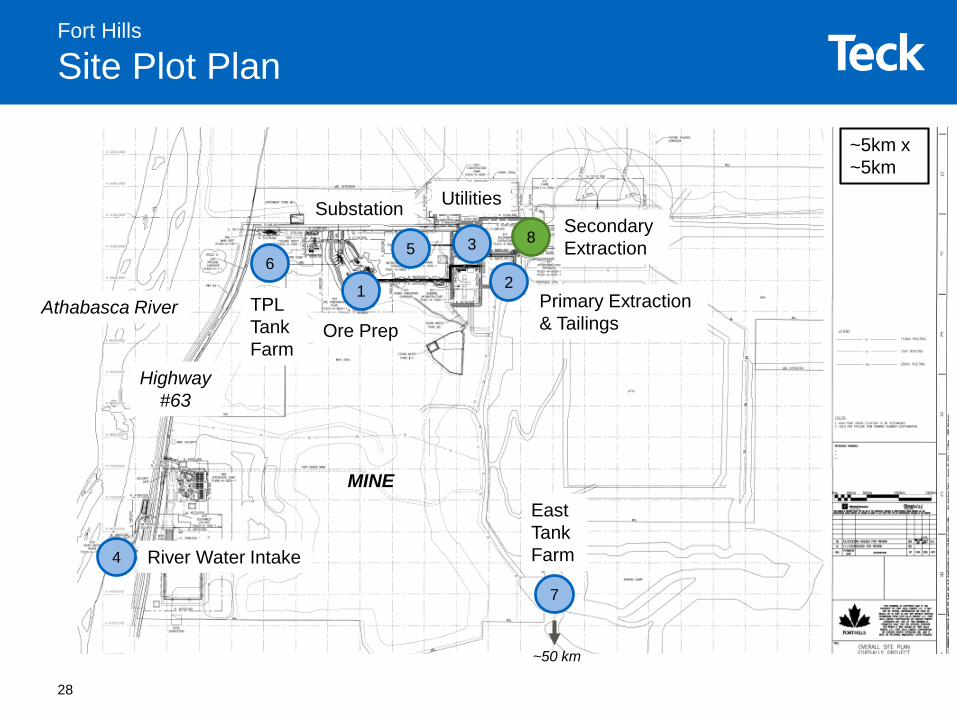
Ore Prep
MINE
Athabasca River
Highway#63
Fort Hills
Site Plot Plan
1
Secondary Extraction83
Utilities
River Water Intake4
5
Substation
6
TPL Tank Farm
7
EastTank Farm
~50 km
2Primary Extraction & Tailings
~5km x ~5km
28

Fort Hills
Secondary Extraction Plot Plan
Source: Fort Hills Energy Limited Partnership
8
29

Fort Hills
Secondary Extraction
Fall 2016
Source: Fort Hills Energy Limited Partnership
8
32
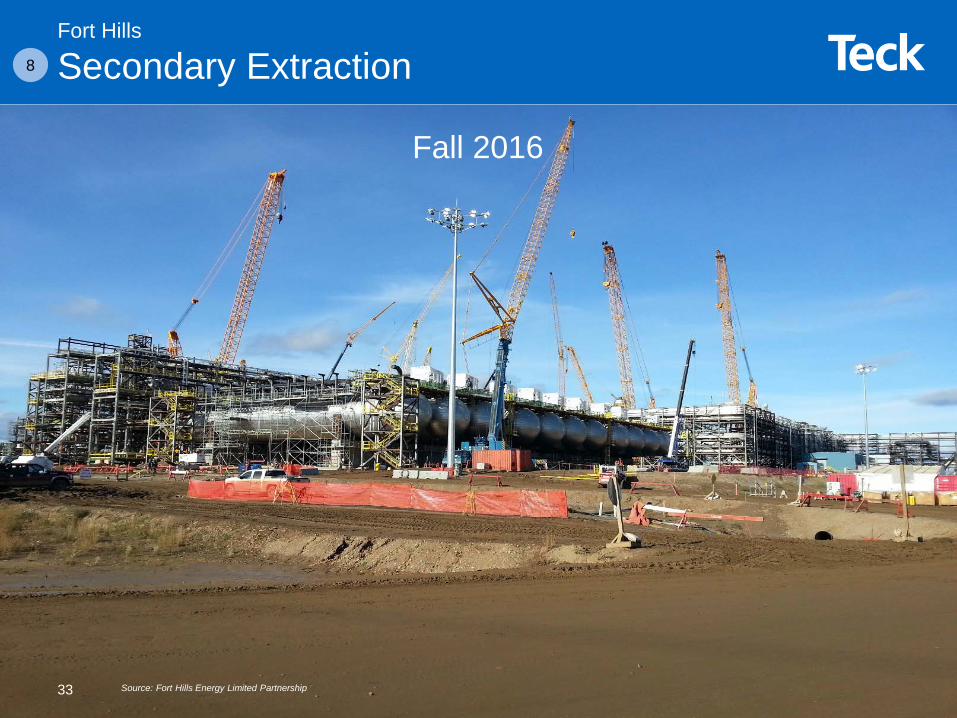
Fort Hills
Secondary Extraction
Fall 2016
Source: Fort Hills Energy Limited Partnership
8
33

Fort Hills
Secondary Extraction Aerial View
Source: Fort Hills Energy Limited Partnership
Fall 2016
8
34
Fort Hills
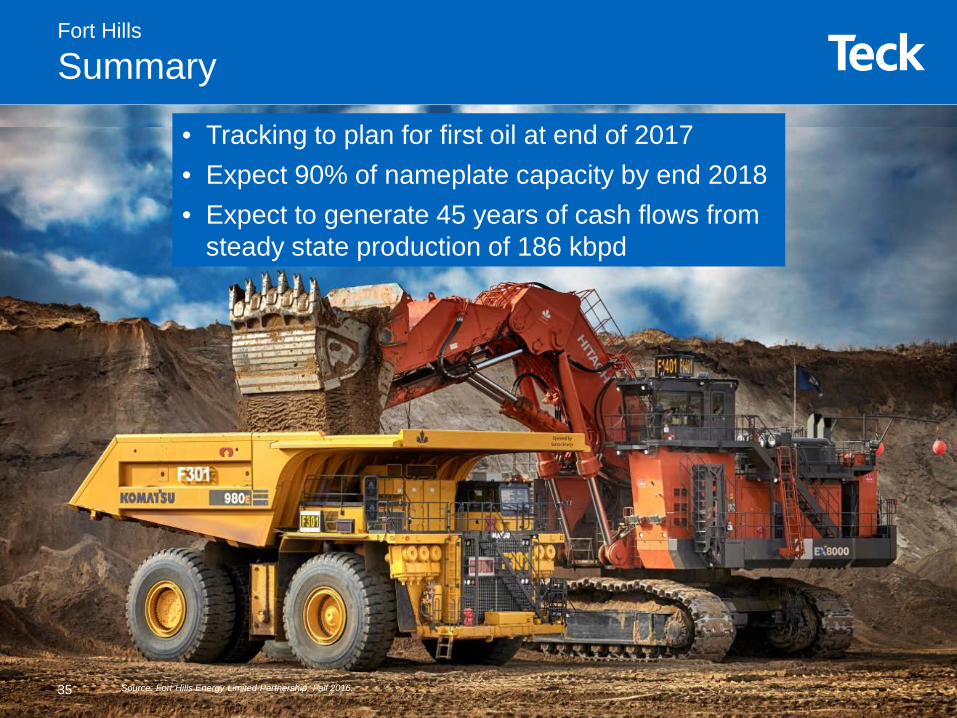
Summary
• Tracking to plan for first oil at end of 2017• Expect 90% of nameplate capacity by end 2018• Expect to generate 45 years of cash flows from
steady state production of 186 kbpd
Source: Fort Hills Energy Limited Partnership, Fall 2016.35
Projects
Agenda
Fort Hills
Quebrada Blanca Phase 2
36

Quebrada Blanca Phase 2
Feasibility Study Overview
Project Capital1
US$4.7billion
Capital Intensity2
~US$16,000$/tonnes annual CuEq
C1 Cash Costs2
US$1.28per pound
Note: Based on Feasibility Study.1. 100% basis, in constant first quarter of 2016 dollars, excluding working capital and interest during construction. Teck owns a 76.5% share.2. Average production rates, copper equivalent production rates, C1 cash costs and initial development capital are based on the first full five years of operations. C1 cash costs are
net of by-product credits.
• Competitive capital intensity• Tier 1 metal producer• AISC well in the low half of the cost curve• Very low strip (included as cash cost) and low sustaining capital
Throughput
140,000tonnes per day
Copper Equivalent Production2
300,000tonnes per year
Molybdenum Production2
7,700tonnes per year
37
Quebrada Blanca Phase 2
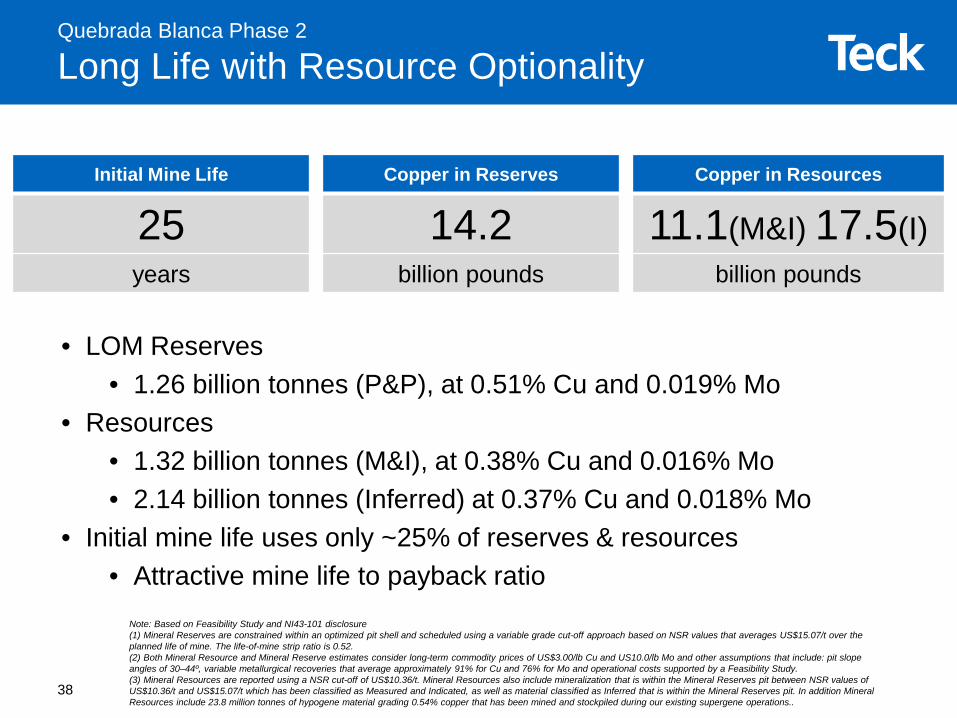
Long Life with Resource Optionality
• LOM Reserves• 1.26 billion tonnes (P&P), at 0.51% Cu and 0.019% Mo
• Resources • 1.32 billion tonnes (M&I), at 0.38% Cu and 0.016% Mo• 2.14 billion tonnes (Inferred) at 0.37% Cu and 0.018% Mo
• Initial mine life uses only ~25% of reserves & resources• Attractive mine life to payback ratio
Initial Mine Life
25years
Copper in Reserves
14.2billion pounds
Copper in Resources
11.1(M&I) 17.5(I)billion pounds
Note: Based on Feasibility Study and NI43-101 disclosure(1) Mineral Reserves are constrained within an optimized pit shell and scheduled using a variable grade cut-off approach based on NSR values that averages US$15.07/t over the planned life of mine. The life-of-mine strip ratio is 0.52.(2) Both Mineral Resource and Mineral Reserve estimates consider long-term commodity prices of US$3.00/lb Cu and US10.0/lb Mo and other assumptions that include: pit slope angles of 30–44º, variable metallurgical recoveries that average approximately 91% for Cu and 76% for Mo and operational costs supported by a Feasibility Study.(3) Mineral Resources are reported using a NSR cut-off of US$10.36/t. Mineral Resources also include mineralization that is within the Mineral Reserves pit between NSR values of US$10.36/t and US$15.07/t which has been classified as Measured and Indicated, as well as material classified as Inferred that is within the Mineral Reserves pit. In addition Mineral Resources include 23.8 million tonnes of hypogene material grading 0.54% copper that has been mined and stockpiled during our existing supergene operations..
38
Quebrada Blanca Phase 2
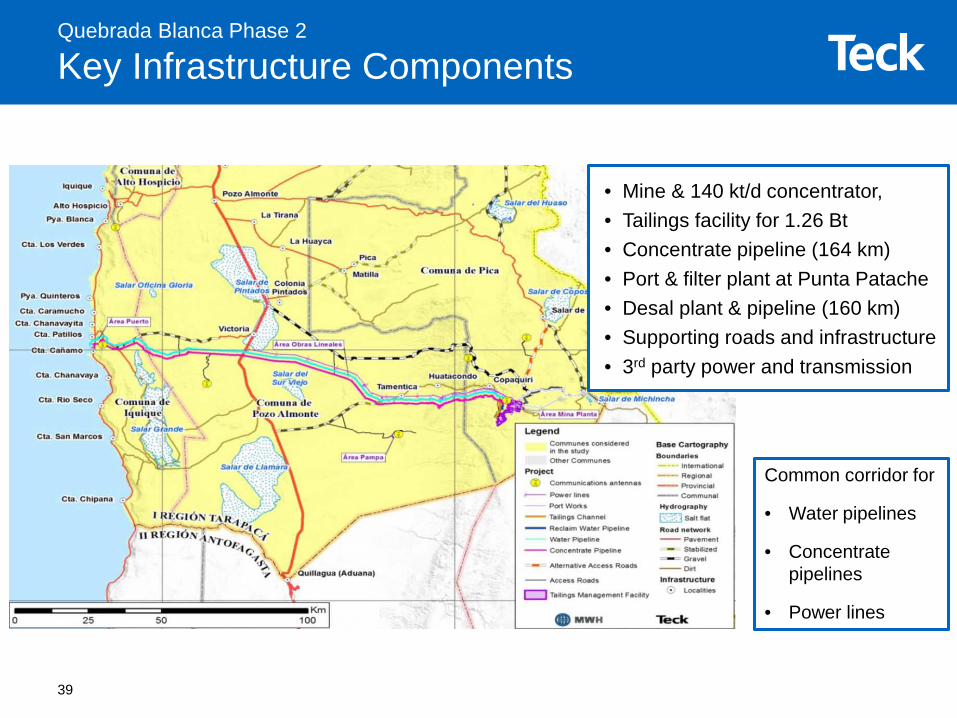
Key Infrastructure Components
• Mine & 140 kt/d concentrator,• Tailings facility for 1.26 Bt• Concentrate pipeline (164 km) • Port & filter plant at Punta Patache• Desal plant & pipeline (160 km) • Supporting roads and infrastructure• 3rd party power and transmission
Common corridor for
• Water pipelines
• Concentrate pipelines
• Power lines
39
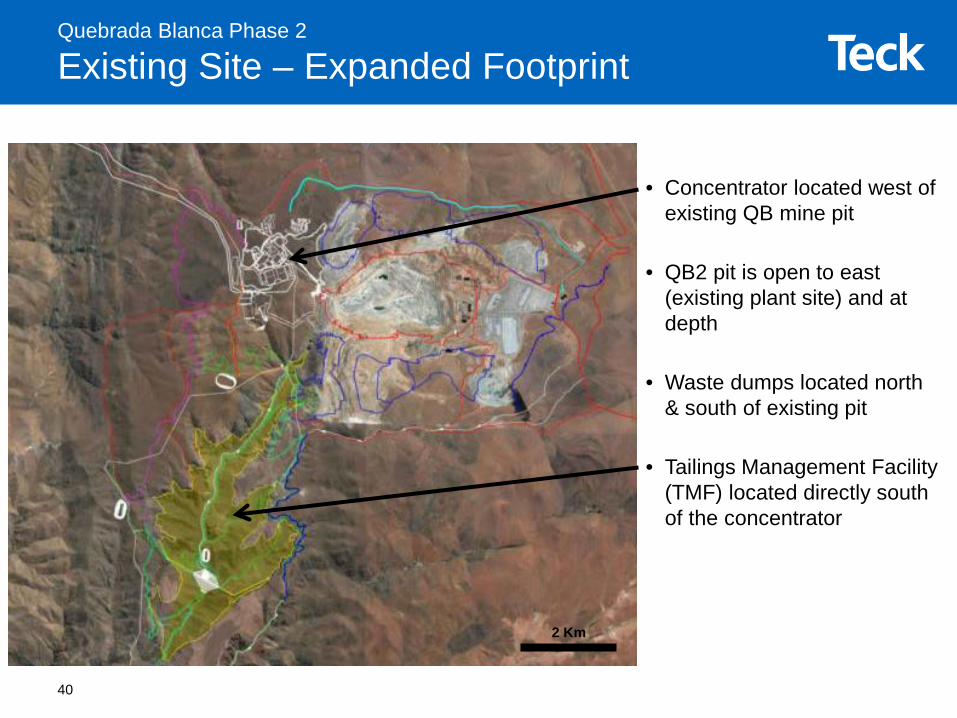
Quebrada Blanca Phase 2
Existing Site – Expanded Footprint
• Concentrator located west of existing QB mine pit
• QB2 pit is open to east (existing plant site) and at depth
• Waste dumps located north & south of existing pit
• Tailings Management Facility (TMF) located directly south of the concentrator
2 Km
40

Quebrada Blanca Phase 2
Project Wide Optimization Since 2012
CONCENTRATOR TAILINGS FACILITY METALLURGY
Increased milling rate+5 kt/d (135 to 140 kt/d)
New Location: 7 km vs 45 km from concentrator
Updated recovery to reflect use of desalinated water
Deleted two ore reclaim feeders and coarse ore stockpile cover
Reduced capacity: 25-year life vs 38-year life
+ 6% Cu recovery (absolute values)+ 19% Mo Recovery
Reduced layout footprint of process facilities PIPELINES PORT
Removed SAG mills discharge screens and optimized pebble
crushing circuit
Reduced Tailings Transport System length by relocating Tailings
Management Facility
Consolidated all port facilities into one area
Changed flotation cells in cleaning circuit
Reduced Reclaim Water System length and optimized use of gravity
flow in the system
Optimized port layout and concentrate storage shed capacity
Eliminated flotation regrind building
Mass Earthworks 18% Concrete 31% Structural Steel 24%41

Quebrada Blanca Phase 2
Attractive Production Metrics
Category UnitAnnual Average
First 5 Years
First 10 Years LOM
Mining Total material moved million t 97.7 96.2 82.4
Processing Total ore processed million t 50.7 50.9 50.9Head grade – copper % 0.60% 0.56% 0.51%Head grade – molybdenum % 0.020% 0.021% 0.019%
Production1 Copper production thousand t 275 258 238Molybdenum production thousand t 7.7 8.2 7.3Copper equivalent production thousand t 301 286 262
Cash Costs2 Before by-product credits USD/lb Cu 1.51 1.59 1.64After by-product credits USD/lb Cu 1.28 1.33 1.39
Category UnitTotal(1)
LOM
Capital Costs3 Initial capital costs US $M 4,714Sustaining capital costs US $M 492Closure costs US $M 184
1. Copper equivalent figures are calculated by converting margin from molybdenum by-products into equivalent copper tonnages at project price assumptions.2. C1 cash costs allocate all costs to the payable copper produced and are inclusive of all stripping costs during operations. C1 cash costs after by-product credit are
presented assuming US$10 per pound of molybdenum. 3. Capital based on Q1 2016 pricing, study +/- 15% accuracy. Partial years not included in averages.
42
$0
$5,000
$10,000
$15,000
$20,000
$25,000
2008 2009 2010 2011 2012 2013 2014 2015
US$
per
Ann
ual T
onne
CuE
qPr
oduc
tion
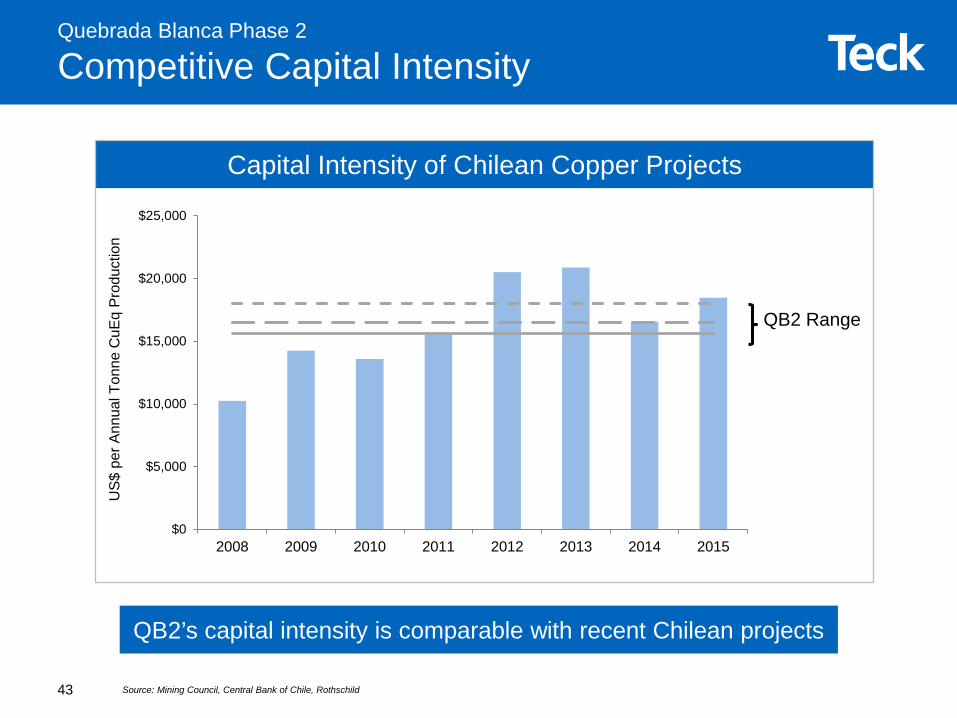
Quebrada Blanca Phase 2
Competitive Capital Intensity
Source: Mining Council, Central Bank of Chile, Rothschild
QB2’s capital intensity is comparable with recent Chilean projects
Capital Intensity of Chilean Copper Projects
QB2 Range
43

Quebrada Blanca Phase 2
Robust Economics and Tier 1 Attributes
Copper Price (US$ per pound) $2.75 $3.00 $3.25 $3.50Net present value at 8% (US$ millions) 565 1,253 1,932 2,604Internal rate of return (%) 9.7% 11.7% 13.5% 15.2%Payback from first production (years) 6.8 5.8 5.0 4.4
Annual EBITDAFirst Full Five Years (US$M pa) 856 1,002 1,148 1,294First Full Ten Years (US$M pa) 781 918 1,055 1,192Life of Mine (US$ million pa) 685 811 937 1,063
NI 43-101 Case
Long life (25 years plus optionality)Attractive production metrics (top 15 copper producer globally)Low cost (low half of AISC cost curve)Competitive capital intensity (~$16k per tonne)Attractive jurisdiction for long term ownership
44

ProjectsMarch 30, 2017Tim Watson, SVP, Project Development and Engineering Alex Christopher, SVP, Exploration, Projects and Technical Services
Recommended