Language in India www.languageinindia.com ISSN 1930-2940 16:1 January 2016
Professor E. Suresh Kumar and Dr. Sunita Vijay Kumar
English Affricates as Pronounced by Telugu-English Speakers 280
===================================================================
Language in India www.languageinindia.com ISSN 1930-2940 Vol. 16:1 January 2016
===================================================================
English Affricates as Pronounced by Telugu-English Speakers
Professor E. Suresh Kumar and Dr. Sunita Vijay Kumar ====================================================================
Abstract
This is an articulatory and acoustic study of English affricates / t∫/, / d∫ / as spoken by
Telugu speakers of English in terms of acoustic features such as time duration and amplitude, as
well as, its articulatory features. Speech produced by eight informants of Telugu speaking
background formed the basis of the study. It was noticed that the articulatory as well as the
acoustic features the Telugu speaking informants produced were very distinctly different from
the English affricates.
Key words: English Affricates, pronunciation, Telugu speakers
Introduction
In this paper we are going to analyse the articulatory and acoustic features of English
Affricates / t∫ /, / d∫ /. Speech sounds may be broadly divided into two categories, namely,
vowels and consonants. During the production of consonant sounds, there is friction or
restriction of air passing out of the oral cavity. Affricates are consonants. They may be described
as Palato-alveolars There are two affricates in English / t∫ /, / d∫ / A speaker of English should
be able to articulate each of these sounds correctly.
Articulation of Affricates
Affricates are mostly said to be stops with a fricative release. In English, they are said to
be homorganic - as a distinct individual type of a sound and not as a combination of two sounds -
post alveolar. They have a combination of stop and fricative characteristics that is closure and
burst followed by short silence and then frication. The affricates can be distinguished from the
fricatives by the presence of closure and by the duration of noise which is longer for the
fricatives. The shorter the duration of noise, the shorter is the silence necessary to elicit an
Language in India www.languageinindia.com ISSN 1930-2940 16:1 January 2016
Professor E. Suresh Kumar and Dr. Sunita Vijay Kumar
English Affricates as Pronounced by Telugu-English Speakers 281
affricate response. Affricates have a shorter rise time than fricatives. Rise time is the time from
onset to peak intensity of frication. Voicing is similar to the voicing for fricatives, but, Voice
Onset Time applies as well. Hence an affricate is seen as a sound which combines the
articulation of stop and fricative characteristics - closure, burst followed by short silence and
then frication.
Acoustic Dimensions of Affricates
Consonants are produced with a constriction of the vocal cords at one place or the other
so they have a weaker resonance, they can be produced as periodic / voiced, aperiodic / voiceless
for affricates - the laryngeal and vocal tract forms the main sources of sounds Affricates are stops
with a fricative release that is homorganic. In English, they are post alveolar or palato-alveolar.
Duration
Time or duration is an important dimension in assessing the acoustic and articulatory
analysis of the segmental aspects of sounds, it depends mostly on manner and place of
articulation and also on the position it appears in a word as well as in connected speech. In this
study the duration was measured based on acoustic and perceptive measures, it was measured
from the data of the waveform, recorded in milliseconds, the duration variation for the different
sounds as well as variations among speakers are studied. The claim is that the same duration
patterns are universally associated with the same syllable structures (Lehiste (1970); Maddieson
(1985), Ladefoged (2001), Fischer-Jorgensen, (1955), Nagamma Reddy, (1988).
Description of Frequency of sounds F0, F1, F2 and F3
A speech signal has many acoustic features from which measurements can be taken.
Beginning as a vibration at the vocal cords, the speech signals have a pitch or fundamental
frequency, denoted F0, which is determined by the mass, length and tension of the speaker’s
vocal cords. Articulation changes the sound that exits in the mouth simply because it changes the
shape and size of the air cavities used for speech. In the context of speech production, the
resonance frequencies of the vocal tract tube are called formant frequencies or formants. The
formant frequencies depend upon the shape and dimensions of the vocal tract, each shape being
characterized by a set of formant frequencies. (Stevens and House, 1955; Fant, 1960).
Language in India www.languageinindia.com ISSN 1930-2940 16:1 January 2016
Professor E. Suresh Kumar and Dr. Sunita Vijay Kumar
English Affricates as Pronounced by Telugu-English Speakers 282
F1- transition indicates the manner of articulation. The first formant provides important
acoustic information about the voicing characteristics. F1 is very low during complete closure.
F2 & F3- transition indicate place of articulation they can also provide information about
manner and place of articulation (Öhman, 1966; Fant, 1973; Cassidy & Harrington, 1995).
Description of Amplitude of Affricates
Amplitude is the objective measurement of the degree of change, positive or negative, in
air pressure or the compression and rarefaction of air molecules caused by sound waves.
Acoustic intensity is a measure of corresponding loudness. Intensity is proportional to the
average size or amplitude of the variations in the air pressure, measured in highest intensity. In
any utterance the actual intensity of a segment depends on factors such as its position in the
sentence, degree of stress on each word and the personal characteristics of a speaker’s speech
According to Laver (1994) and Stevens (1993), the voiceless sounds have low intensity in
comparison to voiced sounds.
Methodology
The study involved collecting the data by audio recording the speech as read by the
informants, The informants for the data collection were eight. Four of them were male and the
other four female. The eight speakers represented the four dialectal zones of Andhra Pradesh.
Analysis and description of the speech data was made by using a software tool Wave Surfer. It
consisted of the affricate sounds occurring in all the entire word positions - initial, medial and
end in different phonetic contexts directly spoken by the informants. The data was collected on
the basis of English word-lists prepared by the scholar for the purpose. The words were in
isolation and in connected speech. The articulatory description was based on perception as well
as interpretation of the articulatory information derived from spectrograms.
Three methods of acoustic analysis chosen are:
1) Temporal measurements to distinguish manner of articulation.
2) Spectral characteristics of frequency analysis to distinguish place of articulation.
3) Amplitudinal analysis of frequency bands as a dynamic approach to place of articulation
Language in India www.languageinindia.com ISSN 1930-2940 16:1 January 2016
Professor E. Suresh Kumar and Dr. Sunita Vijay Kumar
English Affricates as Pronounced by Telugu-English Speakers 283
Procedure
The speech by the informants was recorded onto the computer through the speech
analysis software ‘Wave Surfer’ and saved onto a hard disk the recording speed was at f LIN-16
and digitized at 16,000 KHz and the recording was done through the software with the
parameters already set in. Spectrograms were drawn using Wave Surfer with panes for
spectrogram, waveform, duration, pitch contour, frequency and amplitudes and a Linear
Predictive Coding (LPC) analysis was done. The speech wave for each sound was hand labeled.
The entire speech of the informants was transcribed and presented in the form of broad
transcripts made in International Phonetic Alphabet (IPA) made to match the speech as realized
by the informants. The articulatory analysis was done based on audio recordings of the speech by
the informants through the software. Wave Surfer was used to play back the speech and the
transcriptions were done following the IPA broad transcript conventions
i. The total duration taken by the speaker for the utterance of the sound in milliseconds
(Ms).
ii. The pitch contour for the entire utterance was done by assigning values for the
fundamental frequency (F0) in Hertz (Hz).
iii. The values of the first three formants for the obstruent position (F1, F2, F3) were
recorded.
iv. The time varying amplitude across the set period in decibels (Db) was recorded.
Analysis and Discussion
The mean values of duration of the sound in all word positions as well as in connected
speech were recorded; the mean amplitude and the mean of the whole range of frequencies were
tabulated for analysis and discussion.
The data values were tabulated and statistically the mean values were evaluated for
discussion.
Duration of Affricates
Language in India www.languageinindia.com ISSN 1930-2940 16:1 January 2016
Professor E. Suresh Kumar and Dr. Sunita Vijay Kumar
English Affricates as Pronounced by Telugu-English Speakers 284
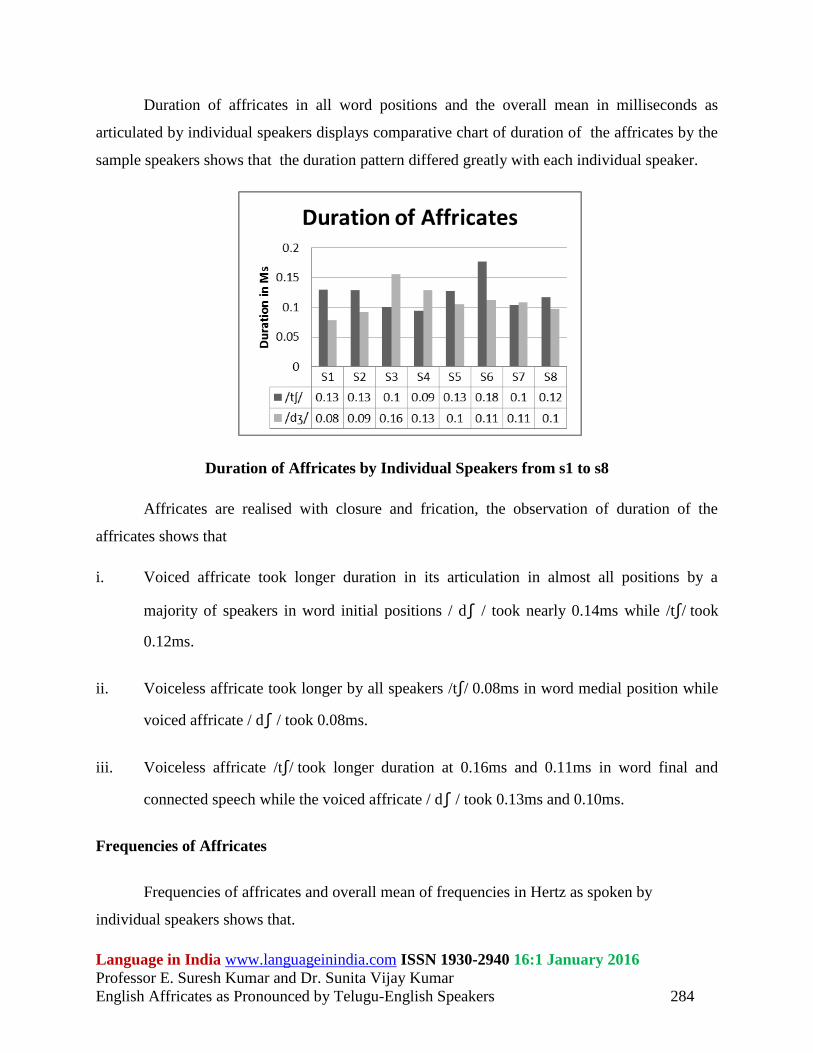
Duration of affricates in all word positions and the overall mean in milliseconds as
articulated by individual speakers displays comparative chart of duration of the affricates by the
sample speakers shows that the duration pattern differed greatly with each individual speaker.
Duration of Affricates by Individual Speakers from s1 to s8
Affricates are realised with closure and frication, the observation of duration of the
affricates shows that
i. Voiced affricate took longer duration in its articulation in almost all positions by a
majority of speakers in word initial positions / d∫ / took nearly 0.14ms while /tʃ/ took
0.12ms.
ii. Voiceless affricate took longer by all speakers /tʃ/ 0.08ms in word medial position while
voiced affricate / d∫ / took 0.08ms.
iii. Voiceless affricate /tʃ/ took longer duration at 0.16ms and 0.11ms in word final and
connected speech while the voiced affricate / d∫ / took 0.13ms and 0.10ms.
Frequencies of Affricates
Frequencies of affricates and overall mean of frequencies in Hertz as spoken by
individual speakers shows that.
Language in India www.languageinindia.com ISSN 1930-2940 16:1 January 2016
Professor E. Suresh Kumar and Dr. Sunita Vijay Kumar
English Affricates as Pronounced by Telugu-English Speakers 285
Voiceless Palato- Alveolar Affricate / tʃ /
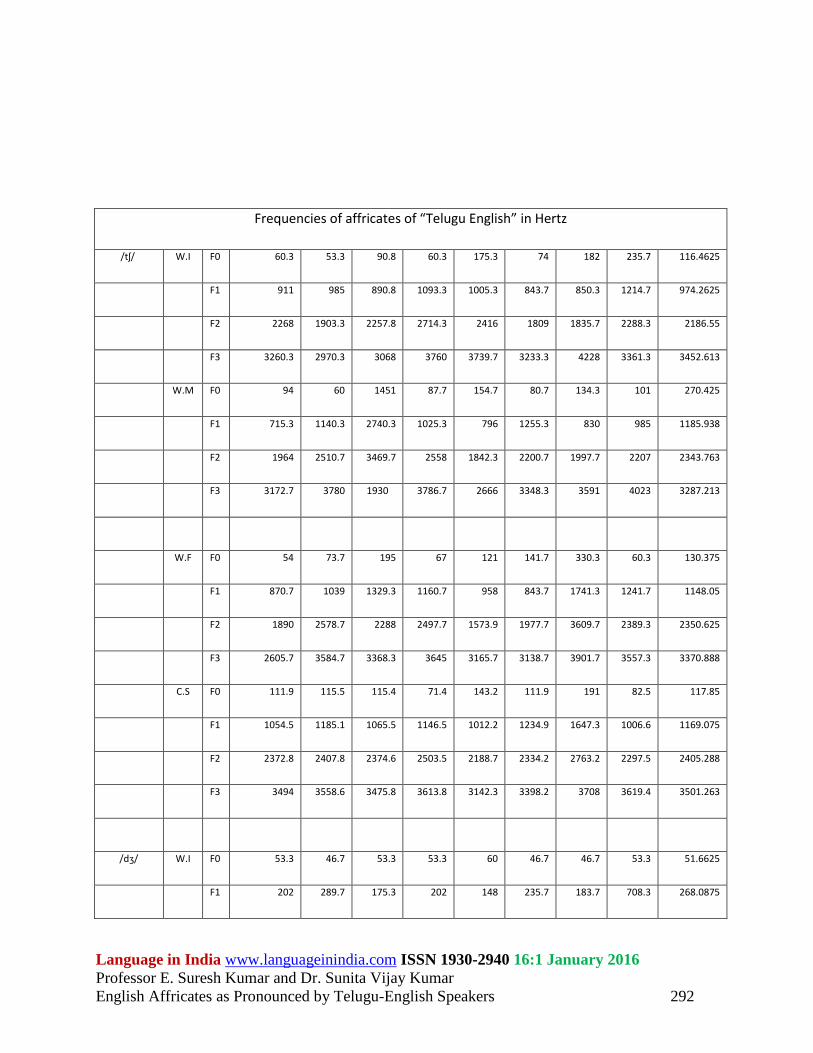
The f0 ranges are between 53.3-235.7 Hz in word initial position with a mean of 116.4
Hz, between 60 - 1451 Hz in word medial positions with a mean of 270.4 Hz, in word final
between 40 - 61.7 Hz with a mean of the range was 130.3 Hz, in connected speech between 71.5
- 115.5 Hz with a mean of117.8 Hz.
The f1 ranges are between 843.7 - 1214.7 Hz in word initial position with a mean of
947.2 Hz, between 715.3 - 1255.3 Hz in word medial positions with a mean of 1185.9 H, in word
final between 843.7 - 1741.3.Hz with a mean of 148.05 Hz, in connected speech between 1006.6
- 1234.9 Hz with a mean of 1169.07 the range was Hz.
The f2 ranges are between 809 - 2288.3 Hz in word initial position with a mean of 2186.5
Hz, between 1842.3 - 3469.7 Hz in word medial positions with a mean of 2186.5 Hz, in word
final position between 1573.9-3609.7 Hz with a mean at 2350.6 Hz, in connected speech
between 2188.7 - 2503.5 Hz and the mean was at 2405.2 Hz.
The f3 ranges are between 2970.3 - 4228 Hz in word initial position with the mean at
3452.6 Hz, between 1930 - 4023 Hz in word medial positions with the mean at 3287.2 Hz, in
word final position between 2605.7 - 3901.7 Hz with the mean at 3370.8 Hz, in connected
speech between 3142.3 - 3708 Hz with the mean at 3501.2 Hz
Voiced Palato-Alveolar Affricate / d∫ /
The f0 ranges are between 46.7 - 60 Hz in word initial position with the mean at 51.6 Hz,
between 46.7 - 65.2 Hz in word medial positions with the mean at 55.6 Hz, in word final
positions between 40 - 61.7 Hz with the mean at 51.8 Hz, in connected speech between 40 - 57.8
Hz and the mean was at 49.3 Hz.
The f1 ranges are between 148 - 708.3 Hz in word initial position with the mean at 268
Hz, between115 - 723 Hz in word medial positions with the mean at 411.6 Hz, in word final
position between 215.7 - 1160.7 Hz with the mean at 728.4 Hz, in connected speech between
256.2 - 836.7 Hz with the mean at 526.1 Hz.
Language in India www.languageinindia.com ISSN 1930-2940 16:1 January 2016
Professor E. Suresh Kumar and Dr. Sunita Vijay Kumar
English Affricates as Pronounced by Telugu-English Speakers 286
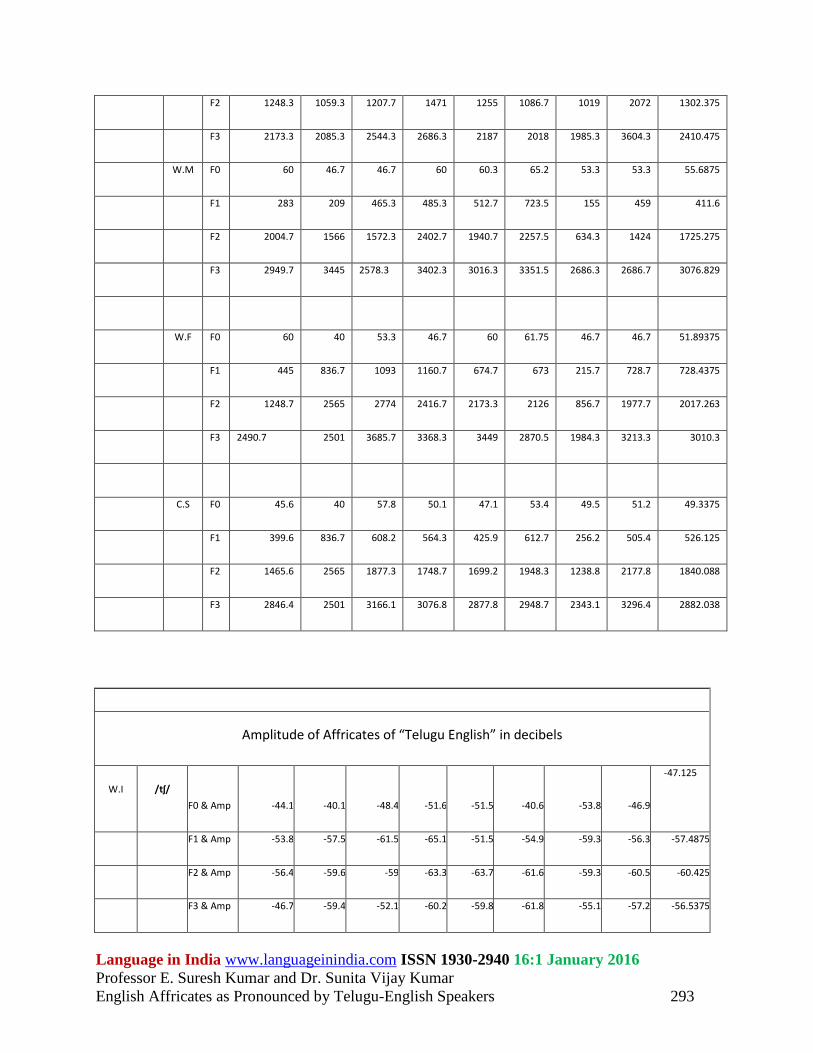
The f2 ranges are between 1019 - 2072 Hz in word initial position with the mean at
1302.3 Hz, between 634.3 - 2402.7 Hz in word medial positions with the mean at 1725.2 Hz, in
word final position between 856.7 - 2774 Hz with the mean at 2017.2 Hz, in connected speech
between 1238.8 - 3296.4 Hz with the mean at 1840 Hz.
The f3 ranges are between 1985.3 - 3604.3 Hz in word initial position with the mean at
2410.4 Hz, between 2686.3 - 3402.3 Hz in word medial positions with the mean at 3076.8 Hz, in
word final position between 1984.3 - 3685.7 Hz with the mean at 3010.3 Hz, in connected
speech between 2343.1 - 3296.4 Hz with the mean at 2882.02 Hz.
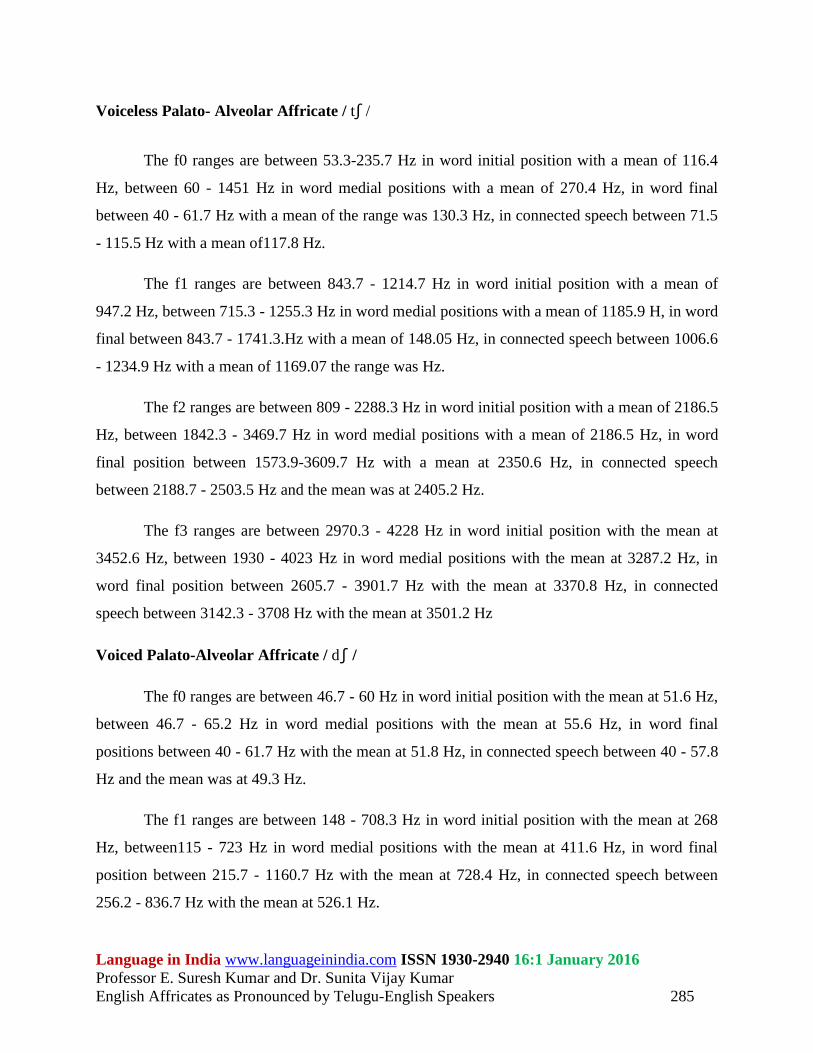
Fig. Frequencies of Affricates by Individual Speakers
The above displays the comparative chart of frequencies of the affricates by the sample speakers
which shows that voiceless palato-alveolar affricate / tʃ / has recorded higher frequencies by all
the speakers,followed by its voiced counter part / dʒ /.
1. The affricates had consistently lower f0 as in plosives.
2. Since both the affricates in English are at palato-alveolar region, the frication and noise
as in fricatives was higher at f2 andf3 region.
Amplitude of Affricates
Voiceless Palato-Alveolar Affricate/tʃ/
Language in India www.languageinindia.com ISSN 1930-2940 16:1 January 2016
Professor E. Suresh Kumar and Dr. Sunita Vijay Kumar
English Affricates as Pronounced by Telugu-English Speakers 287
The f0 amplitudes in word initial position ranges are from -40.1 to -53.8 dB with the
mean at -47.1 dB, in word medial position from -39.4 to -56.4 dB with the mean at -46.6 dB, in
word final position from -30.1 to -50.7 dB and the mean was -45.8 dB, in connected speech from
-44.2 to -49.7 dB with the mean at -47 dB.
The f1 amplitudes in word initial position ranges from -51.5 to -65.1 dB with the mean at
-57.4 dB, in word medial position are from -16.6 to -66.8 dB with the mean at -56.7 dB, in word
final position are from -39.7 to -63.6 dB and the mean was -57.7 dB in connected speech are
from -56.9 to -66.6 dB with the mean at -62.3 dB.
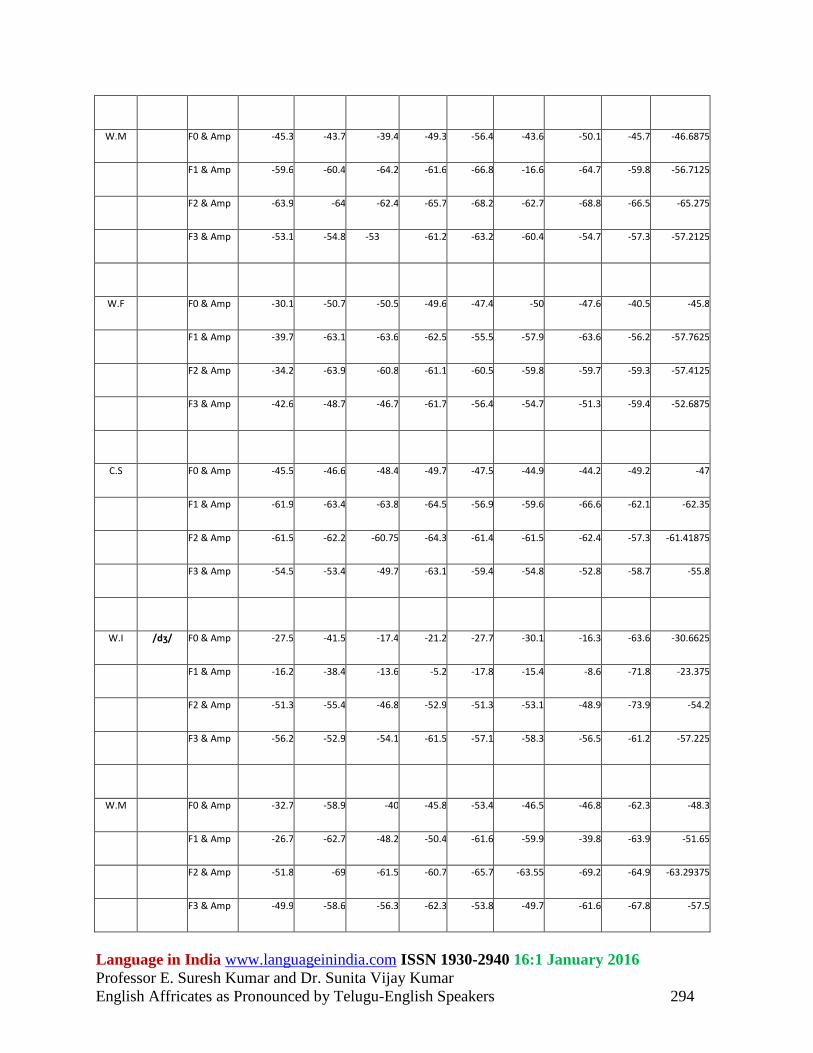
The f2 amplitudes in word initial position ranges from -56.4 to -63.7 dB with the mean at
-60.4 dB, in word medial position are from -62.4 to -68.8 dB with the mean at -65.2 dB, in word
final position are from -34.2 to -63.9 dB and the mean was -57.4 dB in connected speech are
from -57.3 to -64.3 dB with the mean at -61.4 dB.
The f3 amplitudes in word initial position ranges from -46.7 to -61.8 dB with the mean at
-56.5 dB, in word medial position are from -53 to -63.2 dB with the mean at -57.2 dB, in word
final position are from -42.6.1 to -61.7 dB and the mean was -52.6 dB in connected speech are
from -49.7 to -63.1 dB with the mean at -55.8 dB.
Voiced Palato-Alveolar Affricate / d∫ /
The f0 amplitudes in word initial position ranges from -16.3 to -63.6 dB with the mean at
-30.6 dB, in word medial position are from -32.7 to -62.3 dB with the mean at -48.3 dB, in word
final position are from -47.2 to -58.2 dB and the mean was -52.7dB in connected speech are from
-35.1 to -55.9 dB with the mean at -43.7 dB.
The f1 amplitudes in word initial position ranges from -56.9 to -66.6 dB with the mean at
-62.3 dB, in word medial position are from -15.2 to -71.8 dB with the mean at -23.3dB, in word
final position are from -26.7 to -63.9 dB and the mean was -51.6 dB in connected speech are
from -46.6 to -72.7 dB, with the mean at -65.2 dB.
The f2 amplitudes in word initial position ranges from -46.8 to -73.9 dB with the mean at
-54.2 dB, in word medial position are from -51.8 to -69.2 dB with the mean at -63.2 dB, in word
Language in India www.languageinindia.com ISSN 1930-2940 16:1 January 2016
Professor E. Suresh Kumar and Dr. Sunita Vijay Kumar
English Affricates as Pronounced by Telugu-English Speakers 288
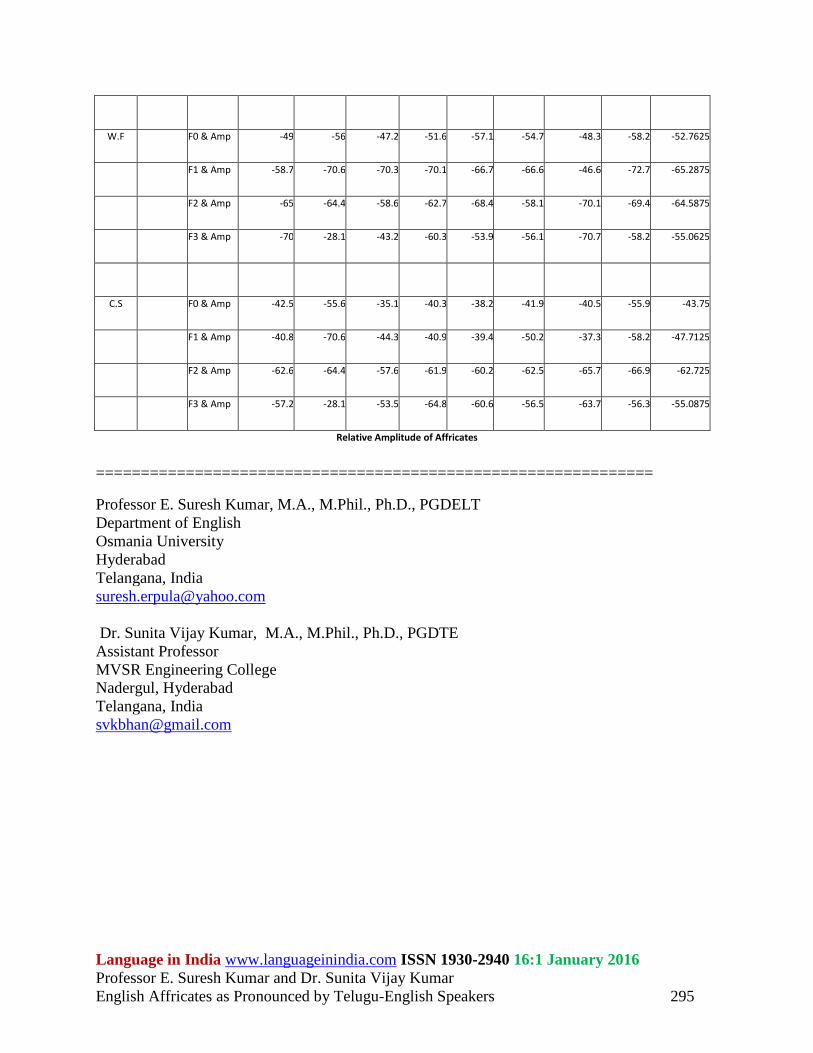
final position are from -58.1 to -70.1 dB and the mean was -64.5 dB in connected speech are
from -57.6 to -66.9 dB with the mean at -62.7 dB.
The f3 amplitudes in word initial position ranges from -52.9 to -61.5 dB with the mean at
-57.2 dB, in word medial position are from -49.7 to -678 dB with the mean at -57.5 dB, in word
final position are from -28.1 to -70.7 dB and the mean was -55.06 dB in connected speech are
from -28.1 to -64.8 dB with the mean at -55.08 dB.
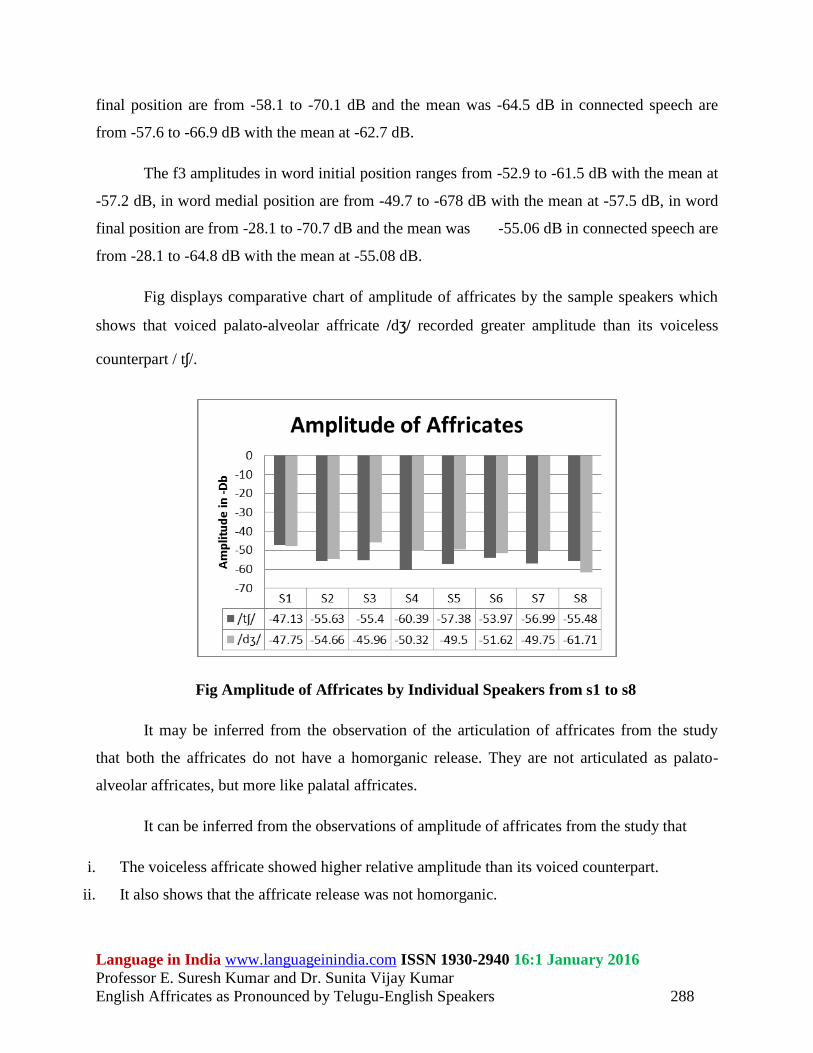
Fig displays comparative chart of amplitude of affricates by the sample speakers which
shows that voiced palato-alveolar affricate /dʒ/ recorded greater amplitude than its voiceless
counterpart / tʃ/.
Fig Amplitude of Affricates by Individual Speakers from s1 to s8
It may be inferred from the observation of the articulation of affricates from the study
that both the affricates do not have a homorganic release. They are not articulated as palato-
alveolar affricates, but more like palatal affricates.
It can be inferred from the observations of amplitude of affricates from the study that
i. The voiceless affricate showed higher relative amplitude than its voiced counterpart.
ii. It also shows that the affricate release was not homorganic.
Language in India www.languageinindia.com ISSN 1930-2940 16:1 January 2016
Professor E. Suresh Kumar and Dr. Sunita Vijay Kumar
English Affricates as Pronounced by Telugu-English Speakers 289
iii. In connected speech the affricates showed greater amplitudes in f0s and in word initial
positions than in F3 zones.
Findings
1. Palato-alveolar affricates / tʃ/./dʒ/, homorganic were articulated as palatal fricatives
2. No two speakers’ duration match perfectly with each other, yet, within the set
duration of each of the informants there was a set pattern of similarity that was
generalisable.
3. It was observed that voicing showed more energy in the lower frequency zones
especially with alveolars than their voiceless counterparts which showed energy in
higher frequency zones.
4. Voiced sounds showed higher amplitudes.
5. Connected speech showed higher amplitudes than word final position of sounds.
6. Female speakers displayed longer durations of voiceless obstruent sounds.
7. Female speakers showed greater range of frequencies of voiceless obstruent sound
8. Female speakers displayed greater amplitudes with regard to voiceless obstruents.
9. Male speakers showed higher range of frequencies, took longer and displayed greater
amplitudes of voiced obstruent sound.
Conclusion
The study shows that there is a clearly discernable difference in the duration, frequencies
and amplitude of individual speakers, across the speakers, not a single sound of Telugu is
pronounced exactly like those of English sounds, there is absolutely no one-to-one
correspondence of the phonemes of both languages. The sounds of Telugu are different from the
normal English sounds there is mother tongue influence in articulation of affricate sounds by
Telugu speakers of English in all word positions as well as in connected speech Affricates/ tʃ/.
and /dʒ/ were not realized as palato-alveolar affricates but as a palatal fricative sounds. However,
it is realized that certain speakers had relative ease at articulating palato-alveolar fricatives and
voiced alveolar fricatives, which the rest of the speakers had problem in. Affricates / tʃ/. and /dʒ/
Language in India www.languageinindia.com ISSN 1930-2940 16:1 January 2016
Professor E. Suresh Kumar and Dr. Sunita Vijay Kumar
English Affricates as Pronounced by Telugu-English Speakers 290
were not realized as palato-alveolar affricates but as palatal fricative sounds. It is realized that
only two speakers had relative ease at articulating palato-alveolar fricatives. The rest of the six
speakers had problem in articulating these sounds. The study was conducted mainly to describe
“Telugu English” as it was felt that there exists no such description of “Telugu English”
(Telgish).The study could serve an academic purpose to inform the teachers as well as the
learners, the extent of mother tongue interference in the speech of learned/educated speakers of
Telugu. Neutralization has gained an urgency and prominence in the academic scenario
especially at the tertiary level as it boosts up the speakers’ employability as well as the speakers’
intelligibility could also be of diagnostic influence of errors in pronunciation and help in the
therapeutic purpose of error correction in pronunciation can also be useful in identifying the
areas where communication is hampered due to mispronunciation. The knowledge and reasons
of this nature could bring about awareness among speakers to aid intelligible speech. Software
can be specially planned and produced indigenously to handle speech/pronunciation training in
English for Telugu Speakers. It could help in the compilation of online “Pronouncing
Dictionaries”. It could contribute in Speech Recognition Systems as they are increasingly being
built to cover a wider range of speaker accents. The need for developing a quality Indian English
Text-To-Speech synthesis (TTS) is acute. TTS in Telugu- English is useful for delivering
messages stored in computers and web to the Telugu users unfamiliar with Standard English
accent.
===================================================================
References
Cassidy, S., Harrington, J.1995. The place of articulation distinction in voiced oral stops: evidence from
burst spectra and formant transitions. Phonetica, 52, pp263-284.
Fant, 1960.The Acoustics of Speech., In Sir, Alexander Ewing, (ed.)The Educational Treatment of
Deafness, Manchester University Press.
Fant. 1973, Speech Sounds and Features, Cambridge, MA: MIT Press
Fischer-Jorgensen, 1955. "Acoustic Analysis of Stop Consonants," Chapter 11 in Readings in Acoustic
Phonetics, I. Lehiste, ed. 1967,Cambridge, MA: MIT Press.
Ladefoged, Peter. 2001. Vowels and consonants: An introduction to the sounds of languages. Oxford:
Blackwells
Language in India www.languageinindia.com ISSN 1930-2940 16:1 January 2016
Professor E. Suresh Kumar and Dr. Sunita Vijay Kumar
English Affricates as Pronounced by Telugu-English Speakers 291
Laver, John. 1994. Introduction to theoretical Phonetics. Cambridge University Press.
Lehiste, Ilse. 1970. Suprasegmentals. Cambridge, MA: MIT Press
Maddieson1985. Patterns of Sounds. Cambridge: Cambridge University Press.
Nagamma Reddy, 1988.The Duration of Telugu speech sounds: An acoustic study, JETE. 34.1:3
Öhman, S. 1966. Coarticulation in VCV utterances: Spectrographic measurements. Journal of the
Acoustical Society of America vol-39 pp151-168
Stevens, K. N., & House, A. S. (1955). Development of a quantitative description of vowel articulation.
Journal of the Acoustical Society of America, 27, 401-493.
Stevens, K.N. 1993 Modelling affricate consonant in Speech Communication 13, pp 33-43.
==============================================================
Appendices
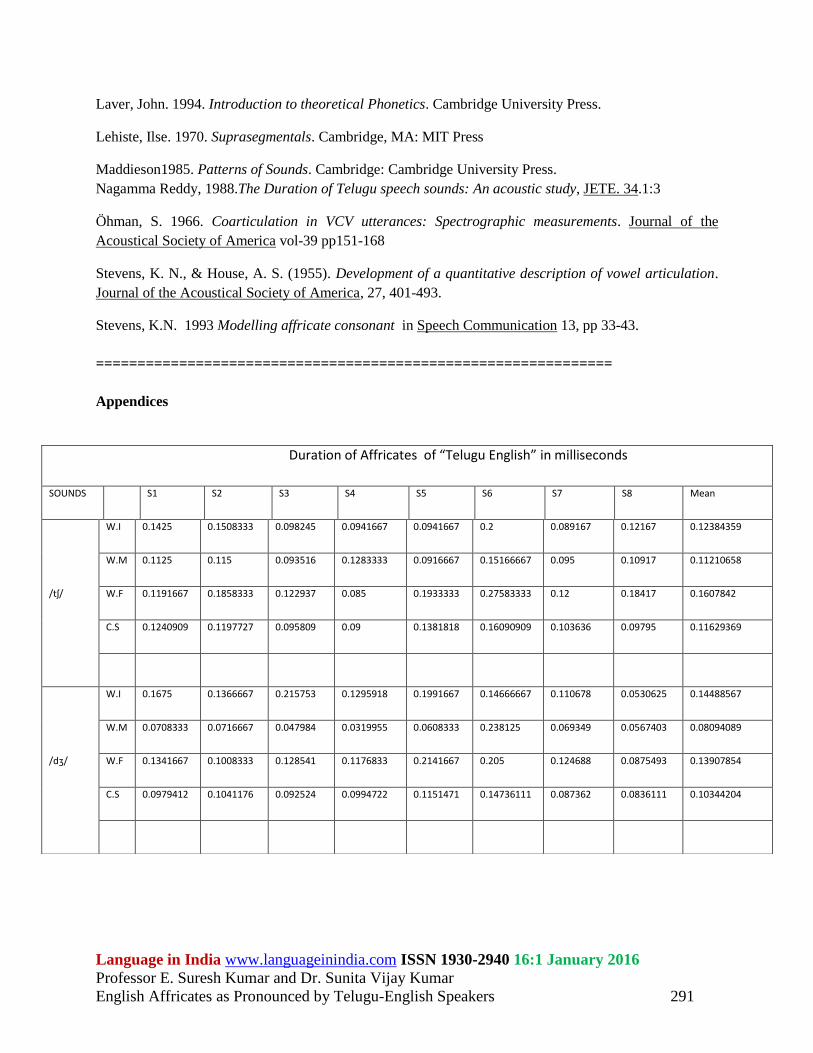
Duration of Affricates of “Telugu English” in milliseconds
SOUNDS S1 S2 S3 S4 S5 S6 S7 S8 Mean
/tʃ/
W.I 0.1425 0.1508333 0.098245 0.0941667 0.0941667 0.2 0.089167 0.12167 0.12384359
W.M 0.1125 0.115 0.093516 0.1283333 0.0916667 0.15166667 0.095 0.10917 0.11210658
W.F 0.1191667 0.1858333 0.122937 0.085 0.1933333 0.27583333 0.12 0.18417 0.1607842
C.S 0.1240909 0.1197727 0.095809 0.09 0.1381818 0.16090909 0.103636 0.09795 0.11629369
/dʒ/
W.I 0.1675 0.1366667 0.215753 0.1295918 0.1991667 0.14666667 0.110678 0.0530625 0.14488567
W.M 0.0708333 0.0716667 0.047984 0.0319955 0.0608333 0.238125 0.069349 0.0567403 0.08094089
W.F 0.1341667 0.1008333 0.128541 0.1176833 0.2141667 0.205 0.124688 0.0875493 0.13907854
C.S 0.0979412 0.1041176 0.092524 0.0994722 0.1151471 0.14736111 0.087362 0.0836111 0.10344204
Language in India www.languageinindia.com ISSN 1930-2940 16:1 January 2016
Professor E. Suresh Kumar and Dr. Sunita Vijay Kumar
English Affricates as Pronounced by Telugu-English Speakers 292
Frequencies of affricates of “Telugu English” in Hertz
/tʃ/ W.I F0 60.3 53.3 90.8 60.3 175.3 74 182 235.7 116.4625
F1 911 985 890.8 1093.3 1005.3 843.7 850.3 1214.7 974.2625
F2 2268 1903.3 2257.8 2714.3 2416 1809 1835.7 2288.3 2186.55
F3 3260.3 2970.3 3068 3760 3739.7 3233.3 4228 3361.3 3452.613
W.M F0 94 60 1451 87.7 154.7 80.7 134.3 101 270.425
F1 715.3 1140.3 2740.3 1025.3 796 1255.3 830 985 1185.938
F2 1964 2510.7 3469.7 2558 1842.3 2200.7 1997.7 2207 2343.763
F3 3172.7 3780 1930 3786.7 2666 3348.3 3591 4023 3287.213
W.F F0 54 73.7 195 67 121 141.7 330.3 60.3 130.375
F1 870.7 1039 1329.3 1160.7 958 843.7 1741.3 1241.7 1148.05
F2 1890 2578.7 2288 2497.7 1573.9 1977.7 3609.7 2389.3 2350.625
F3 2605.7 3584.7 3368.3 3645 3165.7 3138.7 3901.7 3557.3 3370.888
C.S F0 111.9 115.5 115.4 71.4 143.2 111.9 191 82.5 117.85
F1 1054.5 1185.1 1065.5 1146.5 1012.2 1234.9 1647.3 1006.6 1169.075
F2 2372.8 2407.8 2374.6 2503.5 2188.7 2334.2 2763.2 2297.5 2405.288
F3 3494 3558.6 3475.8 3613.8 3142.3 3398.2 3708 3619.4 3501.263
/dʒ/ W.I F0 53.3 46.7 53.3 53.3 60 46.7 46.7 53.3 51.6625
F1 202 289.7 175.3 202 148 235.7 183.7 708.3 268.0875
Language in India www.languageinindia.com ISSN 1930-2940 16:1 January 2016
Professor E. Suresh Kumar and Dr. Sunita Vijay Kumar
English Affricates as Pronounced by Telugu-English Speakers 293
F2 1248.3 1059.3 1207.7 1471 1255 1086.7 1019 2072 1302.375
F3 2173.3 2085.3 2544.3 2686.3 2187 2018 1985.3 3604.3 2410.475
W.M F0 60 46.7 46.7 60 60.3 65.2 53.3 53.3 55.6875
F1 283 209 465.3 485.3 512.7 723.5 155 459 411.6
F2 2004.7 1566 1572.3 2402.7 1940.7 2257.5 634.3 1424 1725.275
F3 2949.7 3445 2578.3 3402.3 3016.3 3351.5 2686.3 2686.7 3076.829
W.F F0 60 40 53.3 46.7 60 61.75 46.7 46.7 51.89375
F1 445 836.7 1093 1160.7 674.7 673 215.7 728.7 728.4375
F2 1248.7 2565 2774 2416.7 2173.3 2126 856.7 1977.7 2017.263
F3 2490.7 2501 3685.7 3368.3 3449 2870.5 1984.3 3213.3 3010.3
C.S F0 45.6 40 57.8 50.1 47.1 53.4 49.5 51.2 49.3375
F1 399.6 836.7 608.2 564.3 425.9 612.7 256.2 505.4 526.125
F2 1465.6 2565 1877.3 1748.7 1699.2 1948.3 1238.8 2177.8 1840.088
F3 2846.4 2501 3166.1 3076.8 2877.8 2948.7 2343.1 3296.4 2882.038
Amplitude of Affricates of “Telugu English” in decibels
W.I /tʃ/
F0 & Amp -44.1 -40.1 -48.4 -51.6 -51.5 -40.6 -53.8 -46.9
-47.125
F1 & Amp -53.8 -57.5 -61.5 -65.1 -51.5 -54.9 -59.3 -56.3 -57.4875
F2 & Amp -56.4 -59.6 -59 -63.3 -63.7 -61.6 -59.3 -60.5 -60.425
F3 & Amp -46.7 -59.4 -52.1 -60.2 -59.8 -61.8 -55.1 -57.2 -56.5375
Language in India www.languageinindia.com ISSN 1930-2940 16:1 January 2016
Professor E. Suresh Kumar and Dr. Sunita Vijay Kumar
English Affricates as Pronounced by Telugu-English Speakers 294
W.M F0 & Amp -45.3 -43.7 -39.4 -49.3 -56.4 -43.6 -50.1 -45.7 -46.6875
F1 & Amp -59.6 -60.4 -64.2 -61.6 -66.8 -16.6 -64.7 -59.8 -56.7125
F2 & Amp -63.9 -64 -62.4 -65.7 -68.2 -62.7 -68.8 -66.5 -65.275
F3 & Amp -53.1 -54.8 -53 -61.2 -63.2 -60.4 -54.7 -57.3 -57.2125
W.F F0 & Amp -30.1 -50.7 -50.5 -49.6 -47.4 -50 -47.6 -40.5 -45.8
F1 & Amp -39.7 -63.1 -63.6 -62.5 -55.5 -57.9 -63.6 -56.2 -57.7625
F2 & Amp -34.2 -63.9 -60.8 -61.1 -60.5 -59.8 -59.7 -59.3 -57.4125
F3 & Amp -42.6 -48.7 -46.7 -61.7 -56.4 -54.7 -51.3 -59.4 -52.6875
C.S F0 & Amp -45.5 -46.6 -48.4 -49.7 -47.5 -44.9 -44.2 -49.2 -47
F1 & Amp -61.9 -63.4 -63.8 -64.5 -56.9 -59.6 -66.6 -62.1 -62.35
F2 & Amp -61.5 -62.2 -60.75 -64.3 -61.4 -61.5 -62.4 -57.3 -61.41875
F3 & Amp -54.5 -53.4 -49.7 -63.1 -59.4 -54.8 -52.8 -58.7 -55.8
W.I /dʒ/ F0 & Amp -27.5 -41.5 -17.4 -21.2 -27.7 -30.1 -16.3 -63.6 -30.6625
F1 & Amp -16.2 -38.4 -13.6 -5.2 -17.8 -15.4 -8.6 -71.8 -23.375
F2 & Amp -51.3 -55.4 -46.8 -52.9 -51.3 -53.1 -48.9 -73.9 -54.2
F3 & Amp -56.2 -52.9 -54.1 -61.5 -57.1 -58.3 -56.5 -61.2 -57.225
W.M F0 & Amp -32.7 -58.9 -40 -45.8 -53.4 -46.5 -46.8 -62.3 -48.3
F1 & Amp -26.7 -62.7 -48.2 -50.4 -61.6 -59.9 -39.8 -63.9 -51.65
F2 & Amp -51.8 -69 -61.5 -60.7 -65.7 -63.55 -69.2 -64.9 -63.29375
F3 & Amp -49.9 -58.6 -56.3 -62.3 -53.8 -49.7 -61.6 -67.8 -57.5
Language in India www.languageinindia.com ISSN 1930-2940 16:1 January 2016
Professor E. Suresh Kumar and Dr. Sunita Vijay Kumar
English Affricates as Pronounced by Telugu-English Speakers 295
W.F F0 & Amp -49 -56 -47.2 -51.6 -57.1 -54.7 -48.3 -58.2 -52.7625
F1 & Amp -58.7 -70.6 -70.3 -70.1 -66.7 -66.6 -46.6 -72.7 -65.2875
F2 & Amp -65 -64.4 -58.6 -62.7 -68.4 -58.1 -70.1 -69.4 -64.5875
F3 & Amp -70 -28.1 -43.2 -60.3 -53.9 -56.1 -70.7 -58.2 -55.0625
C.S F0 & Amp -42.5 -55.6 -35.1 -40.3 -38.2 -41.9 -40.5 -55.9 -43.75
F1 & Amp -40.8 -70.6 -44.3 -40.9 -39.4 -50.2 -37.3 -58.2 -47.7125
F2 & Amp -62.6 -64.4 -57.6 -61.9 -60.2 -62.5 -65.7 -66.9 -62.725
F3 & Amp -57.2 -28.1 -53.5 -64.8 -60.6 -56.5 -63.7 -56.3 -55.0875
Relative Amplitude of Affricates
==============================================================
Professor E. Suresh Kumar, M.A., M.Phil., Ph.D., PGDELT
Department of English
Osmania University
Hyderabad
Telangana, India
Dr. Sunita Vijay Kumar, M.A., M.Phil., Ph.D., PGDTE
Assistant Professor
MVSR Engineering College
Nadergul, Hyderabad
Telangana, India
Recommended