PROBING THE FLAVIVIRUS LIFE CYCLE: REPURPOSING AMODIAQUINE AS AN
INHIBITOR OF FLAVIVIRUS INFECTIVITY AND FUNCTIONAL ANALYSIS OF
FLAVIVIRAL NS5 IN 5’CAPPING
A Dissertation
submitted to the Faculty of the
Graduate School of Arts and Sciences
of Georgetown University
in partial fulfillment of the requirements for the
degree of
Doctor of Philosophy
in Microbiology and Immunology
By
Siwaporn Boonyasuppayakorn, M.D.
Washington, DC
December 3, 2013
ii
Copyright 2013 by Siwaporn Boonyasuppayakorn
All Rights Reserved

iii
PROBING THE FLAVIVIRUS LIFE CYCLE: REPURPOSING AMODIAQUINE AS AN
INHIBITOR OF FLAVIVIRUS INFECTIVITY AND FUNCTIONAL ANALYSIS OF
FLAVIVIRAL NS5 IN 5’CAPPING
Siwaporn Boonyasuppayakorn, M.D.
Thesis Advisor: Radhakrishnan Padmanabhan, Ph.D.
ABSTRACT
Dengue virus serotypes 1-4 (DENV1-4) are transmitted by mosquitoes and are the most frequent
cause of arboviral infections in the world. Neither vaccine nor antiviral drug is currently
available. In this study, we discovered amodiaquine (AQ), one of 4-aminoquinoline drugs,
inhibited DENV2 infectivity with an EC90 of 2.69 ± 0.47 μM and DENV2 RNA replication with
an EC50 of 7.41 ± 1.09 μM in the replicon expressing cells. Cytotoxic concentration on BHK-21
cells was 52.09 ± 4.25 μM. The replication inhibition was confirmed by an infectivity assay
measured by plaque assay of the extracellular virions, and by qRT-PCR of the intracellular and
extracellular viral RNA levels. AQ was stable for at least 96 h and had minor inhibitory effect on
entry, translation, and post-replication stages in the viral life cycle. Flaviviral enzymes including
protease, methyltransferase, and RNA dependent RNA polymerase do not seem to be targets of
AQ. Both p-hydroxyanilino and diethylaminomethyl moieties are important for AQ to inhibit
DENV2 replication and infectivity. With a proven efficacy in vivo, AQ will become a new anti-
flaviviral candidate for clinical trials.
Flaviviral genome contains a 7Me
GpppA2’OMe cap structure mimicking that of eukaryotic mRNA
so as to evade the host immune system and initiate translation. Synthesis of this cap requires the
enzymatic functions of NS3, NS5, and additional unknown factors. Full-length flaviviral NS5
(NS5FL) displayed higher methyltransferase activity than the N-terminal domain alone.

iv
Heterologous flaviviral NS5FL proteins were equally active as methyltransferases. A complete
understanding of guanylyltransferase activity remains to be explored as NS5 alone is insufficient
to add the GMP cap to the 5’-diphosphorylated RNA substrate. An additional cofactor may be
required in the transfer of GMP to diphosphorylated RNA, the second step of 5’-capping. Both
NS3 and NS5 possess GTP hydrolysis activities resulting in GDP and GMP products,
respectively. NS3 is more active than NS5 in GTP hydrolysis such that GDP becomes the
predominant product. NS5 acquires higher efficiency in GTP hydrolysis to GMP in the presence
of 5’terminal RNAnt1-200. These findings will guide further investigations towards a complete
understanding of the flaviviral capping process.

v
ACKNOWLEDGEMENT
First of all, I would like to thank my advisor, Dr. Radhakrishnan Padmanabhan, for
giving me this opportunity to work in his lab. I have learnt a lot during these five years. He
allows me to explore the scientific world through basic and translational projects. He always
inspires students with his insight, knowledge, and experience in the field. He never runs out of
new ideas and always surprises us with his extraordinary problem-solving skills. And most of all,
he is a living example of success is gained through perseverance.
Next, I would like to thank my Committee Chair, Dr. William Fonzi, for his continuous
supports throughout the Ph.D. study. He is kind, supportive, and thoughtful, without
compromising the precision in his academic profession. He also challenges students with high
expectations. Indeed, he is a role model of a good teacher. Moreover, I would like to thank my
committee members; Dr. John Casey, Dr. Brent Korba, and Dr. David Yang for valuable
inputs. Insights from their specialties have polished this thesis to perfection. Thanks to Dr.
Kuppuswami Nagarajan for suggesting the antimalarial drugs to the replicon assays for the
first time.
In addition, I would like to express my gratitude to Faculty of Medicine, Chulalongkorn
University for sponsoring my Ph.D. education. I would like to thank Dr. Parvapan
Bhattarakosol for introducing me to the Virology world, and for never giving up on me. Thanks
to Dr. Pokrath Hansasuta, Dr. Ekasit Kowitdamrong, and all staffs from the Virology unit for
helpful instruction, tips, and methods in Virology. Thanks to Dr. Kamjorn Tatiyakavee for his
help during the process of my scholarship application. Thanks to Dr. Taweesak

vi
Tirawatanapong, and Dr. Nattiya Hirankarn for introducing me to Dr. Padmanabhan and
Georgetown University.
In addition, I appreciate a good collaboration from my colleagues; Dr. Tadahisa
Teramoto, Dr. Priya Srinivasan, Dr. Huiguo Lai, Dr. Mark Manzano, Rupa Guha, Shira
Saperstein, Rohit Mukherjee, Jessica Connor, and Stephen Lim. Special thanks to my
friends; Dr. Peera Hemarajata, Dr. Yuwares Malila, Dr. Prasanth Viswanathan, Dr.
Satjana Patanasak, Shruti Jayakumar, Brittany Griffin, Chris Obara, Mounavya Agileti,
and Minnie An. Without them, my life in a foreign country would have been difficult and
lonely. And I am deeply thankful for Dr. Sarapee Hirankarn for her supporting hands in my
first rough winter.
Finally, I would like to thank Dr. Saran Salakij for his positive thinking and mental
support. Most importantly, thanks to my family, Sanguan and Kunwadee
Boonyasuppayakorn, Lim Jung, and The Siripatrachais for their holistic supports. I am
grateful for their love, care, inspiration, and encouragement throughout my Ph.D. life.
Many thanks,
Siwaporn Boonyasuppayakorn

vii
TABLE OF CONTENTS
PART I REPURPOSING AMODIAQUINE AS AN INHIBITOR OF FLAVIVIRUS
INFECTIVITY ................................................................................................................. 1
CHAPTER 1 INTRODUCTION I ............................................................................................. 2
1.1.General knowledge on Dengue diseases .................................................................... 2
1.1.1. Epidemiology ................................................................................................. 2
1.1.2. Classification.................................................................................................. 3
1.1.3. Molecular biology and life cycle ................................................................... 4
1.1.4. Molecular Pathogenesis ................................................................................. 6
1.1.4.1.Humoral immunity ................................................................................... 7
1.1.4.2.Cell mediated immunity ........................................................................... 8
1.1.5. Clinical Manifestation, Diagnosis, and treatment ........................................... 9
1.2.Current knowledge on flaviviral drug discovery ..................................................... 11
1.2.1. Viral target based approach ......................................................................... 12
1.2.1.1.Protease .................................................................................................. 12
1.2.1.2.Helicase ................................................................................................... 13
1.2.1.3.Methyltransferase ................................................................................... 14
1.2.1.4.RNA dependent RNA polymerase ......................................................... 14
1.2.1.5.NS3-NS5 binding inhibitors .................................................................. 15
1.2.2. Host target based approach .......................................................................... 16
1.2.2.1.Host factors in the viral life cycle .......................................................... 16
1.2.2.2.Host factors involved in severe clinical manifestations ......................... 16
1.2.3. Structure based approach ............................................................................. 17
1.2.3.1.Virtual screening .................................................................................... 17
1.2.3.2.Compound database ............................................................................... 18
1.2.3.3.Drug target ............................................................................................. 19
1.2.4. Cell based approach ..................................................................................... 19
1.2.4.1.Live virus assay...................................................................................... 20
1.2.4.2.Artificial system mimicking viral infection ........................................... 20
viii
1.3.Scope of the thesis I ................................................................................................. 22
1.4.Figures....................................................................................................................... 24
Fig. 1.1 Constructs of plasmid pRS424 containing flaviviral replicons . 24
CHAPTER 2 MATERIALS AND METHODS I ....................................................................... 25
2.1. Materials I ............................................................................................................... 25
2.1.1. Compounds .................................................................................................. 25
2.1.2. Cells and Virus ............................................................................................. 25
2.1.3. Mammalian cell culture media and reagents ................................................ 26
2.1.4. Replicon assay reagents and equipment ....................................................... 26
2.1.5. Cytotoxicity assay reagents and equipment .................................................. 26
2.1.6. qRT-PCR reagents and equipment............................................................... 27
2.1.7. Reagents for plaque assay ............................................................................ 27
2.1.8. In vitro protease assay reagents and equipment ........................................... 27
2.1.9. In vitro MTase assay reagents and equipment ............................................. 28
2.1.10. In vitro RdRP assay reagents and equipment .............................................. 29
2.1.11. Analytical software ...................................................................................... 29
2.2. Methods I .............................................................................................................. 30
2.2.1. Replicon inhibition assays for HTS ............................................................. 30
2.2.2. Replicon inhibition assays for EC50 measurement....................................... 31
2.2.3. Cytotoxicity assays ...................................................................................... 32
2.2.4. Inhibition of Rluc reporter activity by AQ .................................................. 33

ix
2.2.5. qRT-PCR quantification of BHK-21/DENV2 replication inhibition
by AQ ........................................................................................................... 33
2.2.6. Inhibition of DENV2 infectivity .................................................................. 34
2.2.7. Confirmation of AQ inhibition on DENV2 replication and infectivity ...... 35
2.2.8. Plaque assay ................................................................................................. 36
2.2.9. Time-course analysis of AQ inhibition of DENV2 infectivity .................... 37
2.2.10. Measurement of AQ inhibition of DENV2 infectivity by
direct plaque assay ....................................................................................... 38
2.2.11. Order of addition assay ................................................................................ 38
2.2.12. Time of addition assays ............................................................................... 39
2.2.13. In vitro protease assay ................................................................................... 40
2.2.14. In vitro MTase assay .................................................................................... 40
2.2.15. In vitro RdRP assay ..................................................................................... 41
CHAPTER 3 SCREENING QUINOLINE DERIVATIVES FOR INHIBITION OF FLAVIVIRUS
REPLICATION USING REPLICON ASSAYS ........................................................................... 43
3.1. Initial screening with quinoline compounds from NCI/DTP
and Dr. Nagarajan’s library .................................................................................... 43
3.2. Therapeutic indices of selected compounds ......................................................... 44
3.3. Screening of chloroquine derivatives from Dr. Wolf ............................................ 45
3.4. Discussion ............................................................................................................. 45
3.5. Tables .................................................................................................................... 47
Table 3.1 List of quinoline derivatives from NCI/DTP ............................. 47
Table 3.2 List of 8-hydroxyquinoline derivatives from

x
Dr. Nagarajan (Alkem laboratories, Inc., Bangalore, India) ..... 51
Table 3.3 List of CQ derivatives from Dr. Wolf (Georgetown University,
Washington, DC, USA) .............................................................. 55
Table 3.4 EC50, CC50, and TIs of selected compounds .............................. 58
Table 3.5 Percent replicon inhibition and percent cell death from
CQ derivatives screening ........................................................... 59
CHAPTER 4 CHARACTERIZATION OF AQ INHIBITION OF DENV2 REPLICATION USING
REPLICON EXPRESSING CELLS AND INFECTIVITY ASSAYS ................................................. 60
4.1. Inhibition of DENV2, DENV4, WNV replicon replication
measured by Rluc activity ..................................................................................... 60
4.2. AQ did not inhibit Rluc reporter .......................................................................... 61
4.3. AQ did not inhibit BHK-21/DENV2 replication as quantified by qRT-PCR ...... 61
4.4. Inhibition of DENV2 infectivity by AQ as quantified by plaque assay ............... 62
4.5. Confirmation of inhibition of DENV2 replication and infectivity by AQ............ 63
4.6. Discussion ............................................................................................................. 64
4.7. Figures................................................................................................................... 66
Fig 4.1 EC50 of AQ on DENV2 replicon replication (% Rluc)
and CC50 of AQ on BHK-21/DENV2 cells (% cell viability) .... 66
Fig 4.2 EC50 of AQ on DENV4 replicon replication (% Rluc)
and CC50 of AQ on Vero/DENV4 cells (% cell viability) ......... 67
Fig 4.3 EC50 of AQ on WNV replicon replication (% Rluc)
and CC50 of AQ on Vero/WNV cells (% cell viability).............. 68
Fig 4.4 AQ effect on Rluc reporter ......................................................... 69
Fig 4.5 AQ effect of DENV2 RNA levels in BHK-21/DENV2 cells
measured by qRT-PCR ............................................................... 70
Fig 4.6 AQ inhibition of DENV2 infectivity in BHK-21 cells
(MOI of 1) ................................................................................... 71
Fig 4.7 AQ inhibition of DENV2 infectivity in BHK-21 cells
(MOI of 0.01) .............................................................................. 72
Fig 4.8 Titer (pfu/ml) showing AQ inhibition of DENV2 infectivity
in BHK-21 cells (MOI of 0.01) from supernatants collected
at 48, 72, 96 h post-infection ...................................................... 73
Fig 4.9 EC90 values of AQ of DENV2 infectivity in BHK-21 cells
(MOI of 1 and 0.01) .................................................................... 74
xi
Fig 4.10 Confirmation of AQ inhibition of DENV2 replication
and infectivity ............................................................................. 75
CHAPTER 5 MODE OF ACTION AND TARGET IDENTIFICATION STUDY OF AQ INHIBITION
OF DENV2 INFECTION ................................................................................................... 76
5.1. Time-course analysis of DENV2 infectivity............................................................ 76
5.2. Effect of AQ on viral entry and early stages of the viral life cycle ........................ 77
5.3. Effect of AQ on late stages of the viral life cycle ................................................... 78
5.4. In vitro assays of viral replication enzymes ............................................................ 80
5.5. Discussion ............................................................................................................... 81
5.6. Figures..................................................................................................................... 83
Fig 5.1 Time-course analysis of AQ inhibition of DENV2 infectivity. .. 83
Fig 5.2 Measurement of AQ inhibition of DENV2 infectivity by
direct plaque assay. .................................................................... 84
Fig 5.3 Order of addition assay. .............................................................. 85
Fig 5.4 Time of addition assay following the viral replication ............... 86
Fig 5.5 Time of addition assay following the viral translation. .............. 87
Fig 5.6 AQ inhibition of DENV2 protease in vitro ................................. 88
Fig 5.7 AQ inhibition of DENV2 MTase in vitro. .................................. 89
Fig 5.8 AQ inhibition of DENV2 RdRP in vitro..................................... 90
CHAPTER 6 STRUCTURE-ACTIVITY RELATIONSHIP STUDY OF AQ AND DERIVATIVES
USING A DENV2 INFECTIVITY ASSAY ............................................................................. 91
6.1. Diethylaminomethyl group ..................................................................................... 91
6.2. p-hydroxyanilino group .......................................................................................... 91
6.3. Discussion ............................................................................................................... 92
6.4. Figures..................................................................................................................... 93
Fig 6.1 Inhibition of DENV2 infectivity in BHK-21 cells (MOI of 1)
by AQ, CQ, and AQD8 .............................................................. 93
xii
CHAPTER 7 CONCLUSION AND FUTURE DIRECTION I ...................................................... 94
PART II FUNCTIONAL ANALYSIS OF FLAVIVIRAL NS5 IN 5’CAPPING ......... 97
CHAPTER 1 INTRODUCTION II ......................................................................................... 98
1.1.Flaviviral RNA capping .......................................................................................... 98
1.2.Scope of the thesis II ................................................................................................. 99
1.3.Figures.................................................................................................................... 101
Fig 7.1 Flaviviral 5’-capping mechanism ............................................ 101
CHAPTER 2 MATERIALS AND METHODS II ..................................................................... 102
2.1. Materials II ............................................................................................................ 102
2.1.1. Molecular cloning reagents ........................................................................ 102
2.1.2. Protein purification reagents and preparation ............................................ 102
2.1.3. RNA substrate preparation ......................................................................... 103
2.1.4. MTase assay reagents ................................................................................ 104
2.1.5. GTase assay reagents ................................................................................. 104
2.1.6. GTPase assay reagents ............................................................................... 105
2.2. Methods II ............................................................................................................ 105
2.2.1. Construction of DENV2 NS5 MTase1-265aa and DENV2 NS51-405aa .......... 105
2.2.2. Expression and purification of the NS3 and NS5 proteins ........................ 106
2.2.3. MTase assay ............................................................................................... 107
2.2.4. GTase assay ............................................................................................... 108
2.2.5. GTPase assay ............................................................................................. 109
xiii
2.3. Table and Figures ................................................................................................ 110
Table 8.1 List of oligodeoxynucleotide primers ...................................... 110
Fig 8.1 Diagram of flaviviral NS5 ....................................................... 111
Fig 8.2 DENV2 RNA nt1-200 substrate and its DNA template shown on
2% native agarose gel electrophoresis ..................................... 112
Fig 8.3 DENV2 NS51-265aa (left panel) and DENV2 NS51-405aa (right
panel) after His-tag purification shown on 12% SDS-PAGE ... 113
Fig 8.4 DENV2 NS5FL after His-tag purification (lane 2) and size
exclusion by FPLC (lane 3) shown on 10% SDS-PAGE ........ 114
CHAPTER 3 CHARACTERIZATION OF FLAVIVIRAL MTASE ACTIVITY ............................. 115
3.1. MTase activity test ................................................................................................ 115
3.1.1. Identification of radiolabeled 5’-capped products ...................................... 115
3.1.2. Time-course of DENV2 NS51-265aa N7 and 2’O methyltransferase
catalyzed reactions ..................................................................................... 116
3.1.3. Validation of DENV2 MTase assay using a known inhibitor,
S-adenosylhomocysteine (SAH) ................................................................. 117
3.2. Comparison of the methyltransferase activities of DENV2 NS5FL and
DENV2 NS5 1-265aa in a time course experiment .................................................. 117
3.3. Comparison of the methyltransferase activities of various flaviviral NS5s ......... 118
3.4. Discussion ............................................................................................................. 119
3.5. Figures................................................................................................................... 121
Fig 9.1 Guanine cap analogs on TLC analysis ...................................... 121
Fig 9.2 Time-course analysis of DENV2 NS51-265aa MTase activities.
................................................................................................... 122
Fig 9.3 SAH inhibition of DENV2 MTase in vitro ............................... 123
Fig 9.4 Time-course analysis comparing MTase activities of
DENV2 NS5FL and DENV2 NS5 1-265aa.. .................................. 124
Fig 9.5 MTase activities of various flaviviral NS5s.............................. 125
CHAPTER 4 CHARACTERIZATION OF FLAVIVIRAL GTASE AND GTPASE ACTIVITIES ..... 126
4.1. GTase activity of DENV2 NS5 ............................................................................. 126

xiv
4.2. GTPase activity of DENV2 NS3 and NS5 ........................................................... 127
4.3. Discussion ............................................................................................................. 128
4.4. Figures................................................................................................................... 131
Fig 10.1 GTase activity of DENV2 NS5s. ............................................. 131
Fig 10.2 GTPase activity of DENV2 NS3 and/or NS5 and
the effect of SAM...................................................................... 132
Fig 10.3 GTPase activity of DENV2 NS3 and the effect of
triphosphorylated RNA. ............................................................ 133
Fig 10.4 GTPase activity of DENV2 NS5 and the effect of
diphosphorylated RNA ............................................................. 134
Fig 10.5 Time-course analysis of GTPase activity ................................. 135
CHAPTER 5 CONCLUSION AND FUTURE DIRECTION II ................................................... 136
Bibliography ................................................................................................................ 138

xv
LIST OF ABBREVIATIONS
AST aspartate aminotransferase (liver function test)
ALT alanine aminotransferase (liver function test)
AQ Amodiaquine
AQD Amodiaquine derivative
BHK-21 Baby Hamster Kidney cell line
BHK-21/DENV2 subgenomic DENV2 replicon stably expressed in BHK-21 cell
C capsid protein
CC50 cytotoxic concentrations at 50%
CD cluster of differentiation
CDC Center of disease control
CobY GTP:adenosylcobinamide-phosphate guanylyltransferase
CQ Chloroquine
DENV dengue virus
DENV2 dengue virus type 2
DENV2 NS51-265aa nonstructural protein 5 containing amino acids 1 to 265 of DENV2
DENV2 NS51-405aa nonstructural protein 5 containing amino acids 1 to 405 of DENV2
DENV2 NS5FL nonstructural protein 5 containing amino acids 1 to 900 of DENV2
DMEM Dulbecco’s Modified Eagle Medium
DMSO dimethylsulfoxide
E envelope protein
EC50 effective concentrations at 50%
xvi
EC90 effective concentrations at 50%
FBS fetal bovine serum
FMDV 2A foot-and-mouth disease virus 2A oligopeptide
G-418 Geneticin
GpppA unmethylated cap
GpppA2’ OMe mono methylated cap
7MeGpppA mono methylated cap (cap 0)
7MeGpppA2’ OMe double methylated cap (cap 1)
GTP guanosine triphosphate
GDP guanosine diphosphate
GMP guanosine monophosphate
GTase guanylyltransferase enzyme/activity
GTPase guanosine hydrolysis enzyme/activity
HCV hepatitis C virus
HTS high-throughput screening
IC50 inhibitory concentrations at 50%
IFN interferon
IL interleukin
IRES internal ribosome entry site
JEV Japanese encephalitis virus
M mature protein
MEM minimal essential medium

xvii
MOI multiplicity of infection
MTase methyltransferase enzyme/activity
NCI/DTP Developmental Therapeutic Program, a branch of National Cancer
Institute
NS3 nonstructural protein 3
NS5 nonstructural protein 5
NTPase nucleotide triphosphatase
PAGE polyacrylamide gel electrophoresis
PFU plaque forming unit
Pi inorganic phosphate
PPi inorganic diphosphate
ppRNA diphosphorylated RNA
pppRNA triphosphorylated RNA
prM premature protein
qRT-PCR quantitative reverse transcription polymerase chain reaction
RdRP RNA-dependent RNA polymerase enzyme/activity
RNA Ribonucleic acid
Rluc Renilla luciferase enzyme/signal
RTPase 5’ RNA triphosphatase
SAH S-adenosylhomocysteine
SAM S-adenosylmethionine
SAR structure activity relationship
xviii
TGN trans-goigi network
TNF tumor necrosis factor
UTR untranslated region
Vero African green monkey kidney cell line
Vero/DENV4 subgenomic DENV4 replicon stably expressed in Vero cell
Vero/WNV subgenomic WNV replicon stably expressed in Vero cell
WNV West Nile virus
YFV yellow fever virus

1
PART I
REPURPOSING AMODIAQUINE AS AN
INHIBITOR OF FLAVIVIRUS INFECTIVITY
2
CHAPTER 1
INTRODUCTION I
1.1. General knowledge on Dengue diseases
1.1.1. Epidemiology
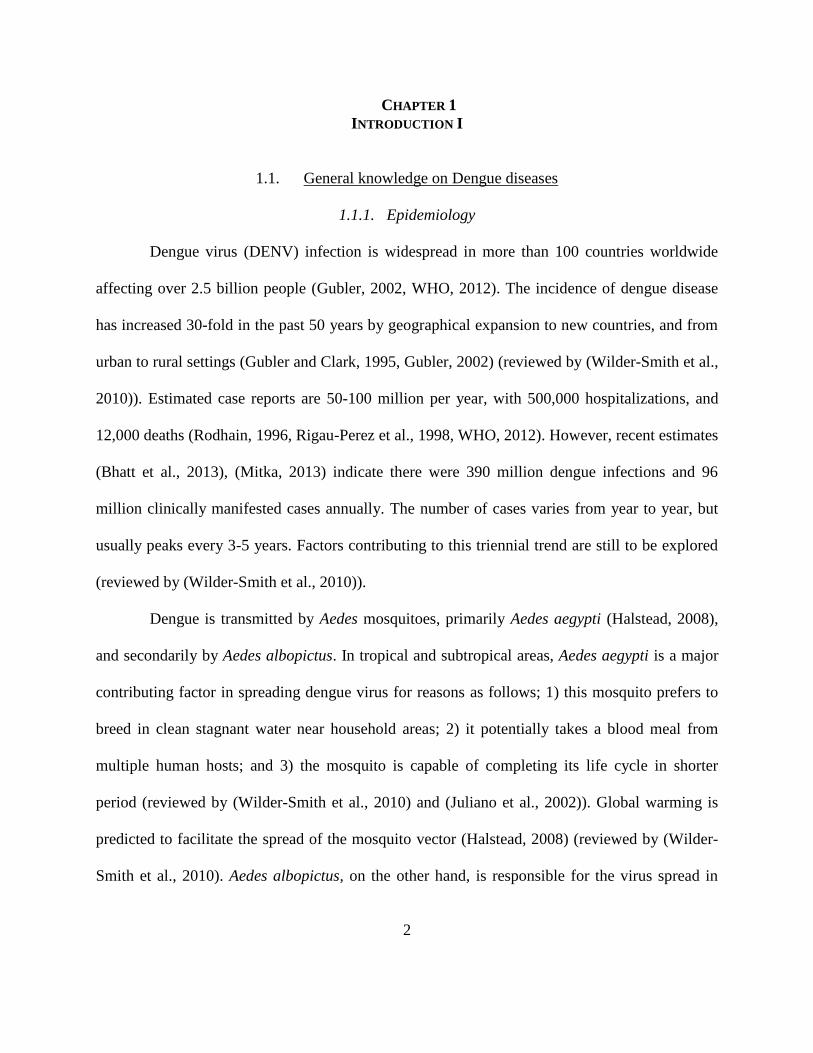
Dengue virus (DENV) infection is widespread in more than 100 countries worldwide
affecting over 2.5 billion people (Gubler, 2002, WHO, 2012). The incidence of dengue disease
has increased 30-fold in the past 50 years by geographical expansion to new countries, and from
urban to rural settings (Gubler and Clark, 1995, Gubler, 2002) (reviewed by (Wilder-Smith et al.,
2010)). Estimated case reports are 50-100 million per year, with 500,000 hospitalizations, and
12,000 deaths (Rodhain, 1996, Rigau-Perez et al., 1998, WHO, 2012). However, recent estimates
(Bhatt et al., 2013), (Mitka, 2013) indicate there were 390 million dengue infections and 96
million clinically manifested cases annually. The number of cases varies from year to year, but
usually peaks every 3-5 years. Factors contributing to this triennial trend are still to be explored
(reviewed by (Wilder-Smith et al., 2010)).
Dengue is transmitted by Aedes mosquitoes, primarily Aedes aegypti (Halstead, 2008),
and secondarily by Aedes albopictus. In tropical and subtropical areas, Aedes aegypti is a major
contributing factor in spreading dengue virus for reasons as follows; 1) this mosquito prefers to
breed in clean stagnant water near household areas; 2) it potentially takes a blood meal from
multiple human hosts; and 3) the mosquito is capable of completing its life cycle in shorter
period (reviewed by (Wilder-Smith et al., 2010) and (Juliano et al., 2002)). Global warming is
predicted to facilitate the spread of the mosquito vector (Halstead, 2008) (reviewed by (Wilder-
Smith et al., 2010). Aedes albopictus, on the other hand, is responsible for the virus spread in
3
cold climates (Juliano et al., 2002). The mosquito was found northernmost in Chicago, IL (CDC,
2012).
In America, the disease incidence increased from 16.4/100,000 in the 1980s to
35.9/100,000 in 1990s, and to 71.5/100,000 in 2000-7 (San Martin et al., 2010). Most DENV
infections in the United States are travel-associated (Wilder-Smith and Schwartz, 2005). There
were sporadic outbreaks in Hawaii (2001) (Effler et al., 2005), and South Texas (2005) (Ramos
et al., 2008). The disease is endemic in Puerto Rico with the latest outbreak in 2010 (Prince et
al., 2011, Anez et al., 2012). Declared by the CDC, Dengue is an emerging infectious disease
and since 2009, all dengue fever (DF) and dengue hemorrhagic fever (DHF) cases in the US
must be reported to the CDC (CDC, 2012, Tomashek, 2012).
1.1.2. Classification
The World Health Organization has revised the classification criteria for diagnosis and
management guideline of dengue diseases. The terminology dengue fever (DF) and grade 1-4
dengue hemorrhagic fever (DHF) were replaced with dengue (± warning signs) and severe
dengue (WHO, 2009), respectively. The new criteria were designed to support a diversing
clinical spectrum due to geographic expansion and increased incidence in older age groups
(adolescence to young adult) (Srikiatkhachorn et al., 2011, Hadinegoro, 2012). Moreover, the
new criteria are more sensitive and specific in detecting severe dengue in retrospective studies
(Narvaez et al., 2011). However, in a prospective study, a significant number of false positive
cases were recruited because the new criteria were not specific (Srikiatkhachorn et al., 2011).
4
Dengue virus (DENV) is classified as a member of the genus Flavivirus within a family
Flaviviridae (Lindenbach et al., 2007). Other flaviviruses with clinical importance include
Yellow fever virus (YFV), West Nile virus (WNV), and Japanese encephalitis virus (JEV).
Flavivirus has a positive single stranded RNA genome with a methylated nucleotide cap at the 5’
terminus, but lacking a poly A tail at the 3’ terminus. Its enveloped virion is spherical to
pleomorphic in shape, and 40-60 nm in diameter (Lindenbach et al., 2007). Most members are
primarily arthropod-borne. There are 4 serologically distinctive types of dengue (DENV 1-4)
sharing about 65% homology at the amino acid level (Westaway, 1997).
1.1.3. Molecular biology and life cycle
An infectious virion contains a single-stranded positive-sense RNA genome of
approximately 11 kilobases in length associated with the capsid protein (C), and covered with
host derived lipid membrane containing precursor membrane proteins (prM), mature proteins
(M), and envelope proteins (E) (Mukhopadhyay et al., 2005). The genome is decorated with a
dimethylated cap called a type I cap (7Me
GpppA2’ OMe) at the 5’terminus. A single open reading
frame encoding all viral proteins is flanked with highly structured 5’ and 3’ untranslated regions
(UTR) (Lindenbach et al., 2007). The viral polyprotein is synthesized by host ribosomes (cap-
dependent translation), and processed by viral protease (NS3) and host proteases (signal
peptidase, furin) into 3 structural proteins, C, prM, and E, and 7 nonstructural proteins, NS1,
NS2A, NS2B, NS3, NS4A, NS4B, and NS5.
DENV enters the cell via receptor-mediated endocytosis. To date, several host receptors
have been reported including heparin sulphate, chondroitin sulphate, mannose binding lectin, and
5
Dendritic Cell - Specific Intercellular adhesion molecule-3-Grabbing Non-integrin (DC-SIGN)
or cluster of differentiation 209 (CD209) (reviewed by (Sampath and Padmanabhan, 2009)).
DENV infects a wide range of cell lines from human, mosquito, monkey, and mice implying that
the virus is capable of utilizing several receptor types for its binding (reviewed by (Rodenhuis-
Zybert et al., 2010)). After internalization, the clathrin-coated viral endosome is acidified. This
leads to a conformational change of envelope (E) proteins, which subsequently induces the
fusion of endosomal membrane and viral envelope, and release of viral nucleocapsid into the
cytoplasm (reviewed by (Rodenhuis-Zybert et al., 2010)).
The genomic RNA is a template of both translation and transcription. Firstly, cap
dependent translation by host machinery gives rise to a single polyprotein containing all viral
proteins (C, prM, E, NS1-5). NS3 and NS5 are multifunctional enzymes responsible for the viral
replication (Morozova et al., 1991) (Kapoor et al., 1995). The viral replication occurs in ER-
derived highly-structured membranous compartments (Welsch et al., 2009) by the replicative
complex consisting of NS3, NS5, and unidentified host proteins (reviewed by (Nagy and Pogany,
2012)). A negative strand transcription starts when NS5 binds to the 5’ UTR of circularized RNA
genome and then to the 3’UTR (Alvarez et al., 2008). The negative strands are transcribed into
the nascent genomic RNA in a semi-conservative manner resulting in a 10:1 ratio of positive:
negative RNA in the cytoplasm (Ackermann and Padmanabhan, 2001, Nomaguchi et al., 2003).
Theoretically, the genomic RNA is capped and methylated co-transcriptionally.
The nascent RNA genome and capsid proteins are assembled to form a nucleocapsid.
The prM and E proteins form a heterodimer. The nucleocapsid and the heterodimers are
transported into the ER lumen where the immature virion is assembled. This process is not

6
completely understood. The nascent virion contains 180 copies of prM/E heterodimer on its
surface (reviewed by (Rodenhuis-Zybert et al., 2010)). Immature virions mature during transport
through the trans-golgi network (TGN), wherein the acidified environment (pH 5.8-6.0) triggers
cleavage of prM, and M/E heterodimer dissociation. The prM protein is cleaved by the cellular
endoprotease furin resulting in membrane associated M and secretory pr peptide. The E protein
reorganizes and forms a homodimer.
1.1.4. Molecular Pathogenesis
The virus life cycle requires both mammalian and arthropod hosts. From current
knowledge, dengue virus is still confined to the Aedes mosquito vector and human host whereas
its neighbors, WNV, SLEV, YFV were reported with alternative vectors (Billoir et al., 2000). A
DENV infection of the human host starts with an infected mosquito taking a blood meal. The
virus from the saliva infects nearby immature dendritic cells (DC) via the DC-SIGN receptor.
The infected DC matures while migrating to regional lymph nodes. At the lymph nodes,
monocyte-macrophage lineage cells are highly susceptible to DENV, thereby amplifying the
infection. Primary viremia is characterized by dissemination of the virus throughout the
lymphatic and vascular system, establishing the infection in liver, lung, and spleen. Following
this event, acute phase responses (prodromic symptoms) vary from asymptomatic, to acute
febrile illness, to high fever with severe myalgia. Note that the more clinically severe the
prodrome, the more likely severe hemorrhage will occur. Details will be discussed in subheading
1.5.
7
Severe manifestations occur in a secondary heterotypic DENV infection because the
host immunity is driven towards the memorized primary infection. Robust, but incompetent,
humoral and cell-mediated immunities play a role in this pathologic event. From several
prospective cohort studies, a secondary infection is an epidemiological risk factor for severe
dengue, whereas tertiary and quaternary heterotypic infections are mostly subclinical (Gibbons et
al., 2007). The highest incidence of primary infection is found in 6-8 month old infants whose
mother’s protective immunity is tapering off. Moreover, severe manifestation relies on host
susceptibility (age, gender, ethnic group, and preexisting comorbidity) and viral factors (strain
virulence).
1.1.4.1. Humoral immunity
Antibody dependent enhancement (ADE) was the first hypothesis put forth to explain the
hemorrhagic disease (Halstead and O'Rourke, 1977). Overproduction of non-neutralizing
immunoglobulin (Ig)G during a secondary heterotypic infection facilitates the viral entry
mediated by Fc receptor. Mononuclear myeloid leukocytes become more permissive in such an
environment, thus making them a major target of dengue replication (Green and Rothman, 2006,
Kurane, 2007, Halstead et al., 2010, Whitehorn and Simmons, 2011, Srikiatkhachorn et al.,
2012). Moreover, the level of antibody enhancement increases by several factors including the
level of highly immunogenic target (prM) (Nelson et al., 2008), the number of antibodies per
virion (Pierson et al., 2007), etc. Monoclonal antibody to prM was the most highly cross-
reactive, non-neutralizing antibody (Dejnirattisai et al., 2010). Infants at a specific age range (6-8
months) from dengue immune mother are at risk for severe dengue since the antibody level is
optimized to generate ADE (Kliks et al., 1988). Although the role of antibody enhancing the
8
disease severity has been extensively studied for decades, still more work remains to be done
towards a complete understanding of the mechanisms.
Levels of complement components are reduced in patients with severe dengue. Excessive
complement activation at endothelial cell surface was suggested. This effect alters the vascular
permeability, causing plasma leakage, and finally leading to hypovolemic shock (Avirutnan et
al., 2006). NS1 was recently discovered to degrade C4 to C4b, thus affecting the mannose
binding lectin (MBL) activation pathway (Avirutnan et al., 2010, Shresta, 2012). Moreover, the
plasma levels of NS1 and terminal complement components (C5b-9) were correlated with the
disease severity (Avirutnan et al., 2006).
1.1.4.2. Cell mediated immunity
Original antigenic sin manifests not only in the antibody profile, but also in memory T-
cell mediated responses (Mongkolsapaya et al., 2003). Triggered by viral peptides presented on
the infected cell surface, memory T cells proliferate and produce pro-inflammatory cytokines
that indirectly affect vascular endothelial cells (Mongkolsapaya et al., 2003). Correlations
between the magnitude of T cell responses to DENV NS3 and severe disease is also documented
(Duangchinda et al., 2010). Levels of pro-inflammatory cytokines such as IFN-γ, TNF-α, and
CD107a are significantly increased in dengue hemorrhagic fever compared to dengue fever
(Duangchinda et al., 2010). Besides IFN-γ and TNF-α, alteration of IL-6, IL-10 and nitric oxide
(NO) levels is involved in dengue pathogenesis (Khare and Chaturvedi, 1997, Juffrie et al., 2001,
Perez et al., 2004). Moreover, the relative level of cytokine can shift from a mild Th1 response to
the more aggressive Th2 response resulting in severe dengue (Chaturvedi et al., 2000). However,
9
the actual roles of these cytokines and their interactions towards endothelial pathophysiology
leading to plasma leakage are still to be elucidated.
TNF-α is one of the pro-inflammatory cytokines in acute phase reaction. It is one of the
key triads observed in severe thrombocytopenic mice with hemorrhage besides high viral titer,
and macrophage infiltration (Chen et al., 2007a). In the same study, high tissue level of TNF-α
was also shown to correlate with endothelial cell apoptosis. Pathologically high level of TNF-α is
also observed in autoimmune diseases such as rheumatoid arthritis, ankylosing spondylitis,
psoriasis, and refractory asthma. TNF signaling is antagonized by histamine, the local
inflammatory mediator (Wang et al., 2003).
1.1.5. Clinical Manifestation, Diagnosis, and Treatment
DENV infection, like most viral infections, follows the iceberg concept. The “tip of the
iceberg” (symptomatic dengue and severe dengue) is a small subset of the number of exposures
and asymptomatic dengue infections (Halstead, 2007). Clinical severity could range from
asymptomatic to life-threatening conditions. Classical dengue manifestation consists of 3 phases;
febrile, critical, and convalescent occurring 3-5 days after the mosquito bite (reviewed by (WHO,
2009, Whitehorn and Simmons, 2011)). Viremia and increasing levels of pro-inflammatory
cytokines are observed at the febrile state. The fever is usually accompanied by headache and
myalgia, which are mostly resolved within 4-7 days. In severe dengue, high-grade fever with
severe myalgia (breakbone fever) has been documented. Clinical manifestation and disease
severity differ in young children and adults. Moreover, mortality rate is significantly higher in
young children than older children or adults (Anders et al., 2011) (reviewed by (Whitehorn and

10
Simmons, 2011)). Upon the critical phase, the temperature drops rapidly along with a decreasing
platelet count and increasing hematocrit. The period usually lasts 24-48 hours and the presence
of warning signs will indicate the case severity. Some patients skip this phase and proceed
directly to convalescence. Others have non-severe, self-limited plasma leakage. In severe cases,
vascular hypoperfusion from extensive plasma leakage, profound bleeding, or multiple organ
failure can lead to hypovolemic shock. Patients have to be closely monitored for a prompt
treatment throughout this state. Surviving the critical period, patients’ clinical status will be
stabilized in the recovery period. The hematological profile returns to normal as the fluid returns
to the system. Generalized macular rash can be observed.
According to the 2009 guideline (WHO, 2009), probable symptomatic dengue infection
is diagnosed by the presence of fever with at least two signs and symptoms as follows; nausea,
vomiting, rash, aches and pain, tourniquet test positive, and any of the warning signs (abdominal
pain and tenderness, persistent vomiting, mucosal bleeding, clinical fluid accumulation, lethargy
or restlessness, liver enlargement > 2 cm, increase hematocrit with rapid decrease in platelet
count). Serological confirmation is not strictly required if the case occurs at the same time and
location with other confirmed dengue cases.
Severe dengue includes any of the following conditions; 1) severe plasma leakage
leading to shock or respiratory distress, 2) severe bleeding (evaluated by clinicians), or 3) severe
organ impairment such as liver (AST, ALT > 1000), central nervous system (impaired
consciousness), heart and other organs; whereas the 1997 WHO guideline has focused only on
the plasma leakage.
11
Currently, there is no vaccine or antiviral drug. Supportive treatment with adequate fluid
management is of importance. Oral rehydration solution (ORS) can be supplemented in non-
severe cases. In severe cases, warning signs and body temperature have to be frequently assessed
(2-4 hours) to predict the timing and severity of the critical stage. Fluid resuscitation has to be
carefully adjusted to maintain the volume in cardiovascular system without causing fluid
overload. The benefit from platelet supplement is still controversial, lacking a clear evidence
based support (Lye et al., 2009, Thomas et al., 2009) (reviewed by (Whitehorn and Simmons,
2011)).
1.2. Current knowledge on flaviviral drug discovery
Despite extensive attempts for decades, there is still no vaccine or drug treatment for
dengue diseases. Several constructs of tetravalent and trivalent vaccines have been on trial
(Durbin and Whitehead, 2010). Gaining a safe and highly immunogenic tetravalent vaccine is
still a challenging quest for vaccine research. For antiviral drug development, the objective is to
find a small molecule capable of inhibiting all serotypes. Developing HTS assays to screen
millions of compounds in libraries is equally important to finding lead compounds. So far, HTS
assays developed in flaviviral drug discovery employ various approaches, ranging from in silico
structure-based, to in vitro biochemical, to in vivo cell culture assay systems (reviewed by
(Noble et al., 2010)).
12
1.2.1. Viral target-based approach
The ~11 kilobase flaviviral RNA genome codes for a single polyprotein that is processed
to yield 10 mature viral proteins. Of the seven nonstructural (NS) proteins, NS2B in conjunction
with NS3, as well as mature NS3 and NS5, possess enzymatic functions. Targeting a flaviviral
enzyme in a high throughput format is of importance in drug discovery because these enzymes
are crucial and conserved in all serotypes. The small-molecule inhibitors are expected to interfere
with the viral life cycle. For example, an inhibitor targeting DENV E protein fusion function was
discovered and its structure activity relationship (SAR) was studied (Poh et al., 2009, Wang et
al., 2009).
1.2.1.1. Protease
DENV protease is extensively studied as a drug target. The biochemical assay in the HTS
format is continuously being improved (Johnston et al., 2007, Mueller et al., 2007, Mueller et al.,
2008, Tomlinson and Watowich, 2012, Nitsche and Klein, 2013). Located at the N-terminal
domain of NS3, the serine protease catalytic triad requires NS2B as a cofactor for protease
activity in viral polyprotein processing. The NS2B/NS3pro prefers substrates containing basic
amino acids (R, K) prior to the cleavage site and a small chain amino acid at the C-terminus of
the cleavage site (Chambers et al., 1990, Preugschat et al., 1990), (reviewed by (Noble et al.,
2010)). Several potential inhibitors have been identified by HTS using a synthetic tetrapeptide
substrate attached to a 7-amino-4-methylcoumarin fluorophore (AMC). The release of AMC was
measured and analyzed for calculation of kinetic parameters of the protease activity. A Bovine
pancreatic trypsin inhibitor (BPTI), also known as aprotinin, is used as a positive control. The Ki
of aprotinin to DENV2 protease is 26 nM (Mueller et al. 2007). Flaviviral proteases in the assay
13
are constructed from hydrophilic NS2B and N-terminal NS3 domain linked together with the C-
terminal residues of NS2B, QR, or non-viral, AAAAA, residues. This recombinant form is
expressed and purified in soluble and enzymatically active form, thus suitable for HTS. One
drawback is that the optimal condition of the in vitro flaviviral protease assay is nonphysiologic.
To achieve the optimum activity, it requires high pH, 9.5, and 20-30% glycerol. The high pH
condition could protonate particular classes of small-molecules, and the high viscosity could
cause high pipetting error in a small assay volume. Positive hits identified from this method are
mostly charged molecules which are poorly transported across the cell membrane. Subsequently,
their nanomolar range IC50s in the in vitro assays do not usually correlate well with those EC50
obtained from the cell-based assay systems.
1.2.1.2. Helicase
The C-terminal domain of NS3 (amino acid residues 171-618) contains at least 4
enzymatic activities; nucleotide triphosphatase (NTPase), RNA triphosphatase (RTPase), RNA
helicase (Takegami et al., 1995, Grassmann et al., 1999, Matusan et al., 2001)(reviewed by
(Bollati et al., 2010)), and ATP independent RNA annealing activity (Gebhard et al., 2012). A
flaviviral helicase assay has recently been developed for HTS using the molecular beacon-based
technology (Belon and Frick, 2008) (Byrd et al., 2013). In principle, the fluorophore and its
quencher are attached to each strand of the complementary oligonucleotides. A fluorescent signal
increases as the helicase unwinds the duplex. However, a DENV helicase usually generates a
weak signal in this assay. Improving sensitivity, specificity, and cost-effectiveness is needed for
the assay to be suitable for HTS.
14
1.2.1.3. Methyltransferase
The N-terminal domain of flaviviral NS5 contains two methyltransferase activities (N7
and 2’O) requiring S-adedosylmethionine (SAM) as the methyl donor. A mutagenesis study
revealed that the methyltransferase activity is essential for viral replication (Kroschewski et al.,
2008). Small-molecular compounds inhibiting flaviviral methyltransferase are considered
attractive candidates. Assays suitable for HTS have been described; for example, a scintillation
proximity assay (SPA) detects 3H-labeled methyl group transferred from SAM to the guanylated
RNA (Lim et al., 2008, Barral et al., 2013). Inhibitors, S-adenosylhomocysteine (SAH) and its
derivatives, were identified using this assay. Fluorescence-based methyltransferase assays have
not been successfully developed.
1.2.1.4. RNA dependent RNA polymerase
Flaviviral RdRP is located in the C-terminal domain of NS5, the most highly conserved
protein across the mosquito-borne flaviviruses. Undoubtedly, RdRP is highly potential for drug
development since it is essential for viral replication and encoded by all flaviviruses. In vitro
RdRP assays have been developed to screen potential RdRP inhibitors (You and Padmanabhan,
1999). A fluorescence-based alkaline phosphatase coupled assay (FAPA) was recently developed
for HTS (Niyomrattanakit et al., 2011). Polymerase inhibitors can be classified into 2 major
groups; nucleoside analogs, and non-nucleoside analogs.
Nucleoside analogs are structurally resembled nucleoside/nucleotide substrates, in which
some analogs function as chain terminators. The nucleoside analogs usually undergo structural
modification by host enzymes; therefore, their efficacies are usually evaluated by cell-based
assays rather than in vitro enzymatic assays. Most nucleoside analogs are synthesized and tested
15
in a triphosphorylated form. Moreover, in the cell-based assay, the candidate compound has to
exhibit preference for the viral polymerase over host DNA-dependent RNA polymerase, without
any detectable mitochondrial toxicity.
Non-nucleoside analogs usually target allosteric cavities or pockets and function as non-
competitive inhibitors. Two common pockets were identified from crystal structures of DENV3
and WNV RdRp (Malet et al., 2007). A possible drawback of this approach is that the non-
conserved region is highly mutable regarding from the heterogeneity of RNA viruses. The HTS
assays have recently been developed; hence more potent inhibitors are expected to be identified
in the near future. An example of successfully developed drugs is the NNRTIs (Non-Nucleoside
Reverse Transcriptase Inhibitors) targeting RNA-dependent DNA polymerase of HIV.
1.2.1.5. NS3-NS5 binding inhibitors
NS3 and NS5 were shown to interact with each other in vivo (Kapoor et al., 1995) and in
vitro (Johansson et al., 2001). Recently, using a protein-protein interaction assay (AlphaScreen)
Takahashi et al. (Takahashi et al., 2012) detected a specific interaction between NS3 and NS5
with a Z-factor of 0.71. A Z-factor is used to interprete an efficacy of a high-throughput
screening assay, in which the factor scoring between 0.5 and 1 indicates an excellent assay. The
binding assay is available in HTS format (384-well) and ready for screening of NS3/NS5
interaction inhibitors.
16
1.2.2. Host target based approach
1.2.2.1. Host factors in the viral life cycle
Flaviviruses, like most viruses, utilize host machinery in every step of its life cycle.
Blocking the role of host factors in a critical step of the virus life cycle can be useful for
development of antivirals. However, cytotoxicity of the compounds targeting a host factor should
be carefully evaluated since the factor may be equally crucial for the host. Significant host
factors that are important for the flavivirus life cycle include host cell-specific receptors for
entry, host proteases (furin and signal peptidase) (Stadler et al., 1997, Elshuber et al., 2003),
glucosidase (Courageot et al., 2000), kinases (Hirsch et al., 2005, Chu and Yang, 2007), and host
factors involved in cholesterol biosynthesis, assembly and egress (Stiasny et al., 2003, Hirsch et
al., 2005, Lee et al., 2008, Rothwell et al., 2009) (reviewed by (Noble et al., 2010, Pastorino et
al., 2010)).
An HTS assay is available for furin protease and several furin inhibitors have been
identified. Furin catalyzes prMM cleavage on the surface of the virion’s host-derived
membrane in the low pH environment of the Trans-Golgi Network, triggering E protein
rearrangement and virion maturation (described in 1.3.). However, a risk-benefit analysis of furin
inhibition in flaviviral infection has not been conducted.
1.2.2.2. Host factors involved in severe clinical manifestations
As described in 1.4., several factors including pathologic immunoglobulin G and
proinflamatory cytokines are involved in severe dengue. Fc modified antibody was proven
effective in severe dengue prophylaxis and therapy in an animal model (Balsitis et al., 2010);
whereas monoclonal antibodies targeting TNF-α prevented vascular leakage (Shresta et al.,
17
2006). These proinflammatory cytokines are potential targets for development of small
molecular inhibitors.
1.2.3. Structure based approach
High-resolution atomic structures of several DENV proteins, especially those that are
viral enzymes, have been solved over the past decade, providing a protein database for
computational analysis of protein-ligand binding (Murthy et al., 1999, Murthy et al., 2000,
Egloff et al., 2002, Benarroch et al., 2004, Xu et al., 2005, Erbel et al., 2006, Egloff et al., 2007,
Yap et al., 2007, Luo et al., 2008) (reviewed by (Tomlinson et al., 2009)). The three dimensional
structures of proteins are essentially determined using X-ray crystallography, and to a lesser
extent using cryo-EM and NMR spectroscopy. Computational approaches using the crystal
structure coordinates of a target are useful for virtual screening that can be performed in an HTS
format against millions of compounds available in large chemical libraries such as ZINC and
PubChem databases.
1.2.3.1. Virtual screening
Virtual screening systematically evaluates each compound (or pharmacophore)
interaction with each cavity of a macromolecular target, so called docking program (Jones et al.,
1997, Campbell et al., 2003, Kitchen et al., 2004, Cummings et al., 2005, Mohan et al., 2005).
Virtual screening requires a 3-dimensional compound library, a 3-dimensional structure of a
target macromolecule (usually a protein), a defined region (cavity or pocket) on the target
surface to be examined, and a docking program. Until now, many docking programs have been
developed and some of them are commercially available (Morris et al., 1996, Jones et al., 1997,
18
Kramer et al., 1999, Ewing et al., 2001, Pang et al., 2001, Friesner et al., 2004, Thomsen and
Christensen, 2006, Chen et al., 2007b, Morris et al., 2009) (reviewed by (Tomlinson et al.,
2009)). Protein-ligand binding affinity is achieved by calculation and scoring all intermolecular
interactions between the molecules. In order to perform virtual HTS with thousands to millions
of 3D compounds in the library, a supercomputing resource is required. Identification of lead
compounds can be further validated with other experimental methods such as biochemical and
cell-based assays. In current virtual screening, the target is considered as ‘rigid’ and the
conformational changes arising from induced-fit mechanisms of ligand binding to the target are
not being examined.
1.2.3.2. Compound database
A compound database is a virtual library of 3D structures of small molecules determined
by X-ray crystallography. An example of a large, publicly available compound database with
cross-references is PubChem from NIH. Small molecules that are ‘drug-like’ usually fall into
Lipinski’s rule of 5 (molecular weight < 500 Da, log P < 5, H-bond donor < 5, and H-bond
acceptor < 10) determining proper solubility and permeability (Lipinski et al., 2001). Results
from HTSs lead to structure activity relationship (SAR) analysis, which subsequently reveals
potential lead compounds.
A fragment database is a library of chemical functional groups or very low molecular
weight compounds (< 300 Da) containing less than 5,000 compounds (Leach et al., 2006,
Hesterkamp and Whittaker, 2008). A fragment is mainly used to determine a manner of
interactions in the subset of target protein binding site. Data from the fragment-based approach is
19
utilized to generate potential compounds with strong binding moieties. For lead optimization, the
fragments can be screened with X-ray crystallography, or NMR spectroscopy (Mooij et al., 2006,
Antonysamy et al., 2008) (reviewed by (van de Waterbeemd and Gifford, 2003, Jhoti et al.,
2007, Tomlinson et al., 2009, Noble et al., 2010)).
1.2.3.3. Drug target
Biophysical techniques to determine the protein-ligand structures are X-ray
crystallography and NMR spectroscopy. X-ray crystallography provides atomic positions as a
framework, whereas NMR reveals the possible conformations from molecular rotations. Ligands
are either co-crystallized or soaked in pre-formed protein crystals before solving the structures.
Recently, HTS crystallization was done with 100 nl of compound-protein mixture per drop and
crystals were analyzed by synchrotron radiation (reviewed by (Noble et al., 2010)).
1.2.4. Cell based approach
Cell-based assays have a role in confirming the positive hits identified by other methods
or identifying new hits from primary screens. Classical assays (e.g., plaque reduction assay)
usually are labor-intensive and time consuming, and not applicable for HTS. Attempts to develop
high throughput assays are facilitated by advances in molecular biology techniques to generate
infectious cDNA clones and cDNAs of self-replicating reporters expressing replicon RNAs
(Puig-Basagoiti et al., 2005, Green et al., 2008, Alcaraz-Estrada et al., 2010, Manzano et al.,
2011, Alcaraz-Estrada et al., 2013). Cell-based approaches cover multiple steps of the viral life
cycle and are therefore a valuable part of drug discovery efforts for antivirals. One of the
disadvantages of the cell-based assay is that the target is unknown and it could be either cellular

20
or viral. Identifying the target of a small molecule compound could become a major effort. One
of the advantages of using cell-based approaches for screening is that compounds identified as
inhibitors of the virus life cycle have already demonstrated membrane permeability and stability
during the incubation period. A number of cell-based assays have been developed for antiviral
screens in high-throughput format.
1.2.4.1. Live virus assay
Dengue virus infection of mammalian cells causes a cytopathic effect (CPE) and
compounds inhibiting CPE could be scored as potential hits. An assay was developed to detect
inhibition of CPE using DENV infected Huh-7 cells (Green et al., 2008). In principle, an
inhibitor would impair at least one step of the viral infection cycle, reduce virulence, and thereby
prolong cell survival. Instead of counting plaques to measure CPE, ATP levels from the
surviving cells were measured using a commercial kit (CellTiterGlo from Promega) in a high
throughput format. Designed as a rapid counter screen, highly cytotoxic or false positive
compounds will be detected and eliminated from the pipeline.
1.2.4.2. Artificial system mimicking viral infection
In West Nile virus drug discovery, a luciferase-encoding gene was genetically engineered
into cDNA clones of a WNV subgenomic replicon. Puig-Basagoiti et al. (Puig-Basagoiti et al.,
2005) designed three high throughput assays with a luciferase reporting system for screening of
WNV inhibitors.
First, a subgenomic replicon (Khromykh and Westaway, 1997) (i.e. cDNA encoding
nonstructural proteins NS1-5) fused in-frame with a luciferase gene, as well as a selectable
marker gene (e.g. neomycin resistant gene), was constructed for screening of replication
21
inhibitors (Shi et al., 2002, Ng et al., 2007, Mosimann et al., 2010). The replicon was stably
expressed in Vero cells in the presence of the neomycin analog G418. The stable replicon
expressing cells were used to screen 96,958 compounds from the commercial libraries collected
at NSRB; Harvard medical school (Puig-Basagoiti et al., 2009). Positive hits were predicted to
interfere with the viral replication either through inhibiting viral factors or host factors.
A second assay used a virus-like particle (VLP) containing subgenomic replicon RNA
encoding a reporter such as GFP or luciferase gene. In principle, VLPs are made by co-
transfection of cells with a subgenomic replicon and a plasmid encoding all structural genes. The
VLPs are collected by harvesting the supernatant. Subgenomic RNA is delivered into
mammalian (or insect) cells by infection of cells with VLPs. The infection is validated by an
indirect immunofluorescent assay (IFA) using an antibody against a nonstructural protein such as
NS1. A positive signal reflects the replication of replicon RNA. The infection proceeds only one
round starting with the virus entry through translation and viral RNA replication (Khromykh et
al., 1998, Pierson et al., 2006). However, the assembly, release, or cell-to-cell spread will not
happen. The VLP assay was validated against known positive inhibitors (Puig-Basagoiti et al.,
2005, Mueller et al., 2008) and was demonstrated for HTS (Qing et al., 2010).
Third, an assay using an infectious clone (cDNA of the genome) fused with a luciferase
encoding gene was used for screening multiple steps in the virus life cycle including entry,
replication, and assembly. The genetically engineered virus containing cap independent
translation of luciferase encoding gene required BSL-2 containment for DENV and BSL-3
containment for WNV.

22
1.3. Scope of the thesis I
Dr. Padmanabhan’s laboratory has recently established DENV2, DENV4, and WNV
replicons stably maintained in BHK-21, Vero, and Vero cells, respectively for HTS. A number of
potential inhibitors have been identified and confirmed using this approach. The constructs in
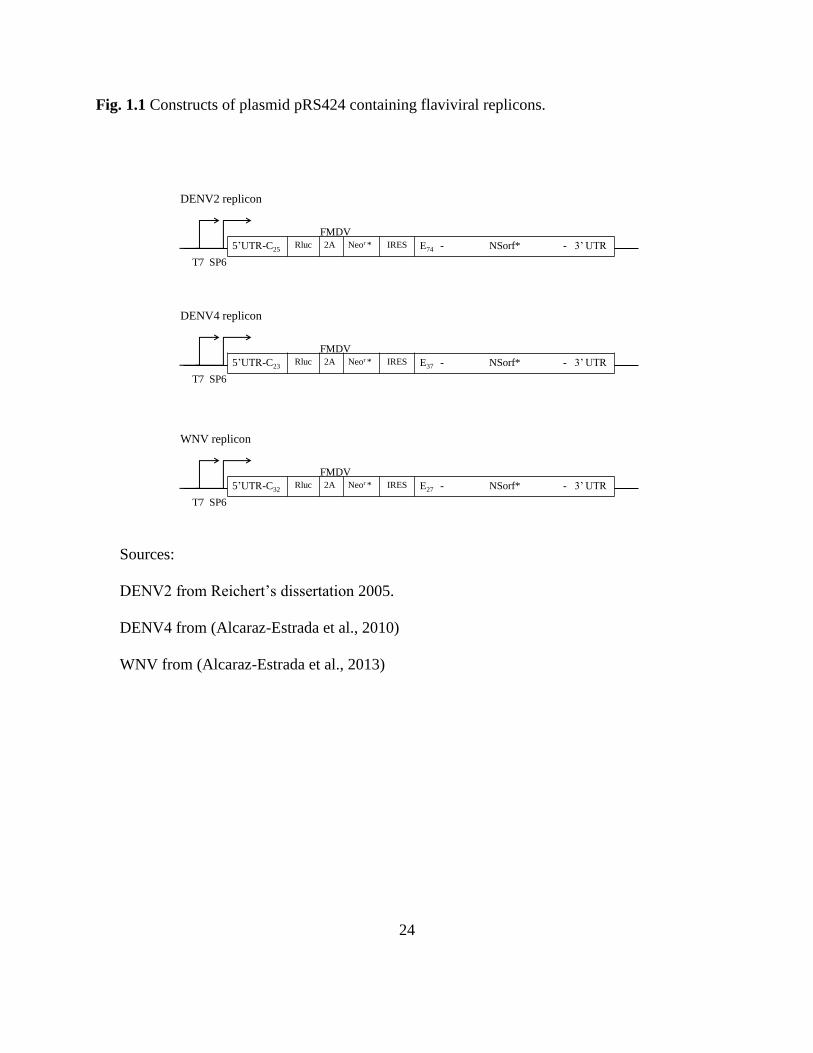
plasmid pRS424 are shown in Fig. 1.1 (Reichert, unpublished) (Alcaraz-Estrada et al., 2010,
Alcaraz-Estrada et al., 2013). Briefly, structural genes were replaced with the Renilla luciferase
reporter gene (Rluc), the antibiotic resistant gene (Neor), and the encephalomyocarditis virus
internal ribosome entry site (EMCV IRES) element. Rluc and Neor are expressed by cap-
dependent translation, whereas nonstructural proteins (NS1-5) are produced by cap-independent
translation directed by the IRES element.
Positive hits were identified from in vitro protease HTS of 32,337 compounds (Mueller et
al., 2008). Compounds containing a 8-hydroxyquinoline core were identified as protease
inhibitors (Mueller et al., 2008, Lai et al., 2013). We sought to establish a structure activity
relationship by analysis of several quinolone derivatives in my thesis project.
The rationale for analysis of other quinoline derivatives was that several known
antimalarial drugs contain a quinoline scaffold in their core structures. Quinine, the first
antimalarial drug, was discovered in 1908 from the bark extracts of a cinchona tree (reviewed by
(O'Neill et al., 1998)). In 1920-40, the 8-aminoquinoline (pamaquine), 7-chloroquinoline
(chloroquine), 6-methoxyquinoline (primaquine), and others were synthesized and tested as
antimalarial drugs. Chloroquine had a good activity/toxicity profile so it was used as a major
chemotherapeutic for malaria eradication campaigns in the 1960s. Structural modification of 7-
chloroquinoline was extensively studied after chloroquine-resistant strains of Plasmodium
23
falciparum emerged. Chloroquine and its derivatives kill asexual stages of the malarial parasite
in the erythrocyte by at least 3 mechanisms; increasing intracellular pH, inhibiting heme
polymerization, and inhibiting DNA and RNA synthesis (reviewed by (O'Neill et al., 1998)).
Besides antimalarial activity, chloroquine is an immunomodulatory agent used in treating
rheumatoid arthritis, ankylosing spondylitis, psoriasis, etc. (Goldman et al., 2000, Weber and
Levitz, 2000, Wozniacka et al., 2008) (reviewed by (Lee et al., 2011, Ben-Zvi et al., 2012); as
well as an antiviral agent inhibiting HIV replication (Savarino et al., 2004).
Aims of this dissertation are as follows;
Aim 1. Screen quinoline antimalarial drugs and derivatives to find potential
inhibitor(s) of flaviviral replication.
Aim 2. Establish inhibitory effects of AQ (the positive hit) against DENV2
replication and infectivity by various methods
Aim 3. Study mode of action and target identification by in vitro and cell based
assays
Aim 4. Correlate structure-activity relationships from currently available compounds
acquired from National Cancer Institute/Developmental Therapeutics program (NCI/DTP)
24
Fig. 1.1 Constructs of plasmid pRS424 containing flaviviral replicons.
5’UTR-C25Rluc 2A Neor * IRES E74 - NSorf* - 3’ UTR
T7 SP6
FMDV
DENV2 replicon
5’UTR-C23Rluc 2A Neor * IRES E37 - NSorf* - 3’ UTR
T7 SP6
FMDV
DENV4 replicon
5’UTR-C32Rluc 2A Neor * IRES E27 - NSorf* - 3’ UTR
T7 SP6
FMDV
WNV replicon
Sources:
DENV2 from Reichert’s dissertation 2005.
DENV4 from (Alcaraz-Estrada et al., 2010)
WNV from (Alcaraz-Estrada et al., 2013)

25
CHAPTER 2
MATERIALS AND METHODS I
2.1. Materials I
2.1.1 Compounds
Quinoline compounds used in the primary screening were obtained from National Cancer
Institute/Developmental Therapeutics program (NCI/DTP) in 10 mg quantities (Table 3.1).
Amodiaquine dihydrochloride dihydrate (AQ) was obtained from Sigma Aldrich (St. Louis,
MO). Derivatives of 8-hydroxyquinolines were obtained from Dr. Kuppuswamy Nagarajan
(Alkem Laboratories, Inc., Bangalore, India) (Table 3.2). Moreover, chloroquine derivatives
were obtained from Prof. Christian Wolf (Georgetown University, Washington, DC) (Table 3.3).
Dimethyl sulfoxide (BP231-100 ml) was purchased from Fisher Scientific (Pittsburgh, PA). All
chemical structures were drawn using ChemBioDraw Ultra 11 (trial version).
2.1.2 Cells and Virus
The BHK-21 cell line (BHK-21/DENV2) stably expressing a subgenomic DENV2
replicon with a Renilla luciferase reporter (Rluc) was established by Dr. Erin Reichert
(Georgetown University, Washington, DC) (Reichert, unpublished). Stable subgenomic DENV4
replicon expressing Vero cells (Vero/DENV4) and WNV replicon expressing Vero cells
(Vero/WNV) with a Renilla luciferase reporter (Rluc) were established by Dr. Sofia L. Alcaraz-
Estrada (Division de Medicina Genomica, Centro Medico Nacional-ISSSTE, Mexico, DF,
Mexico) (Alcaraz-Estrada et al., 2010, Alcaraz-Estrada et al., 2013). Baby hamster kidney cells
(BHK-21) of passage 53 and Vero cells of passage 93 were originally purchased from ATCC

26
(Manassas, VA). DENV2 New Guinea C strain was obtained from Walter Reed Army Institute
of Research (WRAIR), propagated and stored in aliquots by Dr. Ratree Takhampunya (Mahidol
University, Bangkok, Thailand).
2.1.3 Mammalian cell culture media and reagents
Dulbecco’s Modified Eagle Medium (DMEM), Minimal Essential Media (MEM), 10,000
U/ml penicillin and 10,000 μg/ml streptomycin (100 X solution of 100 I.U./ml penicillin and 100
µg/ml streptomycin), fetal bovine serum (FBS), and nonessential amino acids were purchased
from Mediatech, Inc. (Manassas, VA). G-418 powder was purchased from Fisher Scientific
(Pittsburgh, PA). Cell culture dishes and plates were purchased from Greiner Bio-One (Monroe,
NC).
2.1.4 Replicon assay reagents and equipment
The 96-well μClear black microtiter plates were purchased from Greiner Bio-One. The
Renilla luciferase assay system was purchased from Promega (Madison, WI). Luciferase activity
was measured in Centro LB 960 luminometer from Berthold technologies (Oak Ridge, TN).
2.1.5 Cytotoxicity assay reagents and equipment
The 96-well μClear black microtiter plates were purchased from Greiner Bio-One
(Monroe, NC). Cell Counting Kit-8, which uses the WST-8 tetrazolium salt for determination of
cell viability, was purchased from Dojindo Molecular Technologies (Rockville, MD). The
colorimetric signal was read in a Concert TRIAD plate reader from Dynex (Chantilly, VA). The

27
CellTiter-Glo Luminescence cell viability kit was purchased from Promega (Madison, WI).
Centro LB 960 luminometer was from Berthold technologies (Oak Ridge, TN).
2.1.6 qRT-PCR reagents and equipment
TRIzol Reagent was purchased from Invitrogen (Grand Island, NY). QIAamp Viral RNA
minikit was purchased from QIAgen (Valencia, CA). Amicon-0.5 was purchased from Millipore
(Billerica, MA). iScript cDNA Synthesis Kit iQ SYBR Green Supermix and Bio-Rad iQ5
Multicolor Real-Time PCR detection system were from Bio-Rad (Hercules, CA). Forward and
reverse primers amplifying DENV2 NS1 gene fragment were 5’-
CTGCGACTCAAAACTCATGTCAG-3’ and 5’-GGCTTTCTCTATCTTCCATGTGTC-3’,
respectively. Forward and reverse primers amplifying glyceraldehyde 3-phosphate
dehydrogenase (GAPDH) gene fragment were 5’-AACTCCCTCAAGATTGTCAGC-3’ and 5’-
TGAGTCCTTCCACAATGCC-3’, respectively. All primers were purchased from Integrated
DNA Technologies (Coralville, IA).
2.1.7 Reagents for plaque assay
Formaldehyde (37% by weight), isoproponal (99.9%), and Crystal Violet (powder) were
purchased from Fisher Scientific (Pittsburgh, PA).
2.1.8 In vitro protease assay reagents and equipment
The 96-well half area black plates were purchased from Greiner Bio-One (Monroe, NC).
Fluorogenic tetrapeptide substrate, Bz-Nle-Lys-Arg-Arg-AMC, was purchased from Bachem

28
(Torrance, CA). The fluorescence plate reader, SpectraMax Gemini EM, was from Molecular
Devices (Sunnyvale, CA). The DENV2 NS2B-NS3 expression plasmid encoding the protease
precursor (DENV2 NS2BH-(QR) NS3pro) containing the hydrophilic domain of NS2B cofactor
(48 amino acids) and the protease domain of NS3 protein (185 amino acids) was constructed by
Dr. Tadahisa Teramoto (Yon et al., 2005). Talon Metal Affinity resin was purchased from
Clontech (Mountain View, CA).
2.1.9 In vitro MTase assay reagents and equipment
The DENV2 RNAnt1-200 template forward and reverse primers (5’-
TAATACGACTCACTATTAAGTTGTTAGTCTACGTGGAC-3’ and 5’-
TTATTCATCAGAGATCT-3’, respectively) were purchased from Integrated DNA
Technologies (Coralville, IA). The pSY2 template was constructed by Dr. Shihyou You (You
and Padmanabhan, 1999). MEGAshortscript T7 RNA polymerase was purchased from
Ambion/Life Technologies (Grand Island, NY). ScriptCap m7G capping system was purchased
from CellScript (Madison, WI). The [α-32
P]GTP isotope was purchased from Perkin-Elmer
(Waltham, MA). Micro Bio-Spin 30 columns were purchased from Bio-Rad (Hercules, CA).
RNA clean and concentrators (TM-5, and TM-25) were purchased from Zymo research (Irvine,
CA). Nuclease P1 and cellulose PEI plates were purchased from Sigma Aldrich (St Louis, MO).
The DENV2 NS5FL expression plasmid containing a small ubiquitin-like modifier 1 (35
amino acids) at N-terminus was a gift from Dr. Craig Cameron (Penn State University, State
college, PA). SUMO protease or Ubl specific protease 1 was purchased from LifeSensors
(Malvern, PA). HiPrep 16/60 Sephacryl S-100 HR column chromatography was purchased from

29
GE Healthcare Biosciences (Piscataway, NJ) and AKTAprime Plus FPLC system was from
Amersham Biosciences (Sunnyvale, CA).
2.1.10. In vitro RdRP assay reagents and equipment.
The assay was performed by Mark Manzano. Briefly, the positive sense RNA substrate
was transcribed in vitro from pSY2 mini genome (719 nucleotides) RNA template (You and
Padmanabhan, 1999). Negative sense DNA template was generated by PCR amplification of the
pSY2 template with 5’ – AGTTGTTAGTCTACGTGGACC - 3’ and 5’ –
TAATACGACTCACTATAGGGAGAACCTGTTGATTCAACAGCACCATTCCATTTTCTG
G - 3’ as forward and reverse primers respectively; then, the negative sense RNA was transcribed
in vitro. The RdRp assay buffer was prepared as a 5 X stock (250 mM Tris HCl, pH 8, 250 mM
NaCl, 25 mM MgCl2) and stored at ambient temperature. The assays were performed using
DENV2 NS5FL enzyme as described (subheading 2.2.14) (Ackermann and Padmanabhan, 2001,
Nomaguchi et al., 2003). AQ stock solution (50 μM) was prepared in DMSO.
2.1.11 Analytical software
Statistical analysis and 2D graphs were done using GraphPad Prism v5 (La Jolla, CA).
Image J (http://rsbweb.nih.gov/ij/) was used for quantification of radioactive signal from
phosphoimager screen (Amersham Bioscience, Sunnyvale, CA). Before quantification, pictures
derived from the screen were processed using ImageJ program with the following steps.
1) Transform to 32-bit format using this command; (Image>Type>32-bit).
30
2) Optimize the signal using these commands; (Process>Math>square, and
Process>Math>divided by 21,427, respectively).
3) Adjust the brightness and contrast using this command;
(Image>Adjust>Brightness/Contrast).
2.2. Methods I
2.2.1. Replicon inhibition assays for HTS
All compounds were dissolved in DMSO to prepare 50 mM stock solutions and stored in
amber glass vials at -20oC. Replicon expressing cell lines (BHK-21/DENV2, Vero/DENV4, and
Vero/WNV) were maintained in DMEM supplemented with 10% FBS, 100 I.U/ml penicillin,
100 μg/ml streptomycin, and 300 μg/ml G418.
Cells (~104 in 100 μl) were seeded into each well of a 96-well plate containing DMEM
supplemented with 10% FBS. Cells were incubated for 6 h at 37 oC in a humidified incubator
under 5% CO2 before addition of compounds to 50 μM final concentration. DMSO (1%) alone
was used as the no-inhibitor control (100% Rluc activity or 0% inhibition). All compounds were
assayed in triplicate. Following compound addition, cells were incubated at 37 oC in a
humidified incubator under 5% CO2 for 24 hours prior to lysis and measurement of Rluc
activities. Medium was removed and cells were washed with PBS. Cells were lysed using 20
μl/well of lysis buffer from the Renilla luciferase assay kit and rocking for at least 40 min. The
substrate was added and the Rluc activities were measured using a luminometer. Data was
reported as percent inhibition (% inhibition = 100 - % activity) relative to DMSO (0%
31
inhibition). Mycophenolic acid (MPA) was used as a positive control referring to 100%
inhibition.
The quinoline compounds from NCI/DTP and from Dr. K. Nagarajan’s collection
(Alkem Laboratories, Inc., Bangalore, India), were screened at 50 μM final concentration. The
chloroquine derivatives from Dr. Christian Wolf were assayed at 25 μM final concentration.
Cytotoxicity was measured in parallel with the Rluc activity measurement.
2.2.2. Replicon inhibition assays for EC50 measurement
Selected compounds were further analyzed to determine the concentration of each
compound causing 50% inhibition of replication (EC50). Compounds were serially diluted to final
concentrations of 10-4
– 10-9
molar in the initial trial. Cells were plated, incubated with a
compound, and assayed for Rluc activity as described in the screening section. The % activity
values at various concentrations of the compound were analyzed by nonlinear regression using
GraphPad Prism 5. Each concentration was tested in triplicate and the results were confirmed by
two independent experiments.
In addition, AQ at final concentrations of 0, 0.01, 0.1, 1, 2.5, 5, 7.5, 10, 20, 30, 40, 50,
60, 70, 80, or 100 µM in DMSO concentration of 1% were added to BHK-21/DENV2,
Vero/DENV4, and Vero/WNV cells (~104 in 100 μl). Cells were incubated at 37
oC for 48 h in a
humidified incubator under 5% CO2. Cells were washed, lysed, and Rluc activities from the
replicons were measured according to manufacturer’s protocol. Each concentration was tested in
triplicate and the results were confirmed by two independent experiments.

32
2.2.3. Cytotoxicity assays
In parallel to replicon assays, cell viability was assessed in order to exclude false
positives arising from cytotoxicity of the compounds. The concentration at which the cell
viability was reduced by 50% (CC50) was determined for each compound. CC50 values of
NCI/DTP and KN compounds were determined using the same concentrations used in
determining EC50 values. Naïve BHK-21 and Vero cells (~104 in 100 μl) were seeded into each
well of a 96-well plate and incubated for 6 h before compound addition. Each compound was
assayed in triplicate and cells were incubated for 24 h before measuring the ATP level using
CellTiter-Glo® luminescent cell viability assay kit. Data were plotted and the CC50 values were
calculated by nonlinear regression analysis. Results were confirmed by two independent
experiments.
For chloroquine derivatives, cytotoxicity was measured simultaneously rather than in
parallel. Before Rluc readout in replicon inhibition screening, highly soluble tetrazolium salt
(WST-8 in CCK-8 cell viability assay kit) was introduced into the experimental cultures. After 2
h incubation at 37 oC under 5% CO2, absorbance was read at 485 nm. Cells were subsequently
washed, lysed, and Rluc activities were measured. Data were plotted and the CC50 values were
calculated by nonlinear regression analysis. Each drug concentration was tested in triplicate and
the results were confirmed by two independent experiments. Therapeutic index (TI) was
calculated as the ratio of CC50/EC50.

33
2.2.4. Inhibition of Rluc reporter activity by AQ
To exclude the possibility that AQ inhibits Rluc activity directly, BHK-21/DENV2 cells
(~104 in100 μl) were plated into each well of a 96-well μClear black microtiter plate and
incubated for 24 h at 37 oC. AQ at the final concentrations of 0, 0.1, 1, 2.5, 5, 10, 25, or 100 µM
in DMSO concentration of 1% were added during cell lysis. The substrate was added and the
Rluc activities were measured according to manufacturer’s protocol.
2.2.5. qRT-PCR quantification of BHK-21/DENV2 replication inhibition by AQ
BHK-21/DENV2 cells (~2.5 x 10⁵ in 2.5 ml) were seeded into a 6-well plate and
incubated overnight at 37 oC under 5% CO2 in a humidified chamber. AQ, dissolved in DMSO,
was added to final concentrations of 0, 0.1, 0.5, 1, 2.5, 5, 10, or 25 μM and the cultures were
incubated for an additional 48 h. Total RNAs were extracted from the cells by treatment with
TRIzol reagent according to the manufacturer’s protocol. Sample RNA concentration was
calculated based on the absorbance at 260 nm and adjusted to 1 µg/µl. Quantitative RT-PCR
(qRT-PCR) was performed as previously described (Manzano et al., 2011). Briefly, the region of
viral RNA encoding DENV2 NS1 and the housekeeping reference gene GAPDH were copied by
reverse transcriptase and amplified by quantitative PCR. The ratio (r) of NS1 to GAPDH
calculated from the threshold cycle (Ct) values with the formula: Ratio =
(Pfaffl, 2001). Each sample was tested in triplicate and the results
were confirmed by two independent experiments.
34
2.2.6. Inhibition of DENV2 infectivity
BHK-21 cells were cultured in MEM, supplemented with 10% FBS, 100 I.U/ml
penicillin and 100 µg/ml streptomycin in MEM supplemented with 2% FBS and 100 I.U./ml
penicillin and 100 µg/ml streptomycin for 1 at 37 oC under 5% CO2. BHK-21 cells were seeded
into 12-well plate and incubated overnight at 37 oC under 5% CO2 in a humidified chamber.
Cells were infected with DENV2 (New Guinea C strain) at a multiplicity of infection (MOI) of 1
with gentle rocking every 15 min. After infection, cells were washed with PBS and incubated
with 1.5 ml of MEM supplemented with 2% FBS, 100 I.U./ml penicillin and 100 µg/ml
streptomycin. AQ at the final concentrations of 0.1, 0.5, 1, 2.5, 5, or 10 μM in DMSO
concentration of 1%, or DMSO alone, was added during infection and to the maintenance
medium (MEM supplemented with 2% FBS, 100 I.U./ml penicillin and 100 µg/ml
streptomycin). Cells were then incubated for 72 h at 37 oC. Supernatants were collected and
DENV2 infectivity was analyzed by plaque assay. Data were plotted and the EC90 values were
calculated by nonlinear regression analysis. Each AQ concentration was tested in duplicate and
the results were confirmed by two independent experiments.
Moreover, in structure-activity relationship study, CQ and AQD8 at the at the final
concentrations of 0.1, 0.5, 1, 2.5, 5, 10, 25, or 50 μM in DMSO concentration of 1% were added
onto DENV2 infected BHK-21 cells (MOI of 1) during infection and post-infection. Cells were
incubated and supernatants were collected for analysis as described. EC90 values were calculated
by nonlinear regression analysis. Data was plotted in comparison to that of AQ. Each drug
concentration was tested in duplicate and the results were confirmed by two independent
experiments.
35
In addition, we performed AQ inhibition to DENV2 infectivity using a different viral
load. Briefly, BHK-21 cells were infected with DENV2 (New Guinea C strain) at a multiplicity
of infection (MOI) of 0.01. AQ at the final concentrations of 0, 0.01, 0.1, 0.5, 0.75, 1, 2.5, 5, 7.5,
10, or 25 μM in DMSO concentration of 1% was added during infection and to the maintenance
medium. Cells were then incubated at 37 oC and supernatants were collected at 48, 72, and 96 h
post-infection. DENV2 infectivity was analyzed by plaque assay. Data were plotted and the EC90
values were calculated by nonlinear regression analysis from supernatants collected at 96 h. Each
AQ concentration was tested in duplicate and was confirmed by two independent experiments.
2.2.7. Confirmation of AQ inhibition on DENV2 replication and infectivity
BHK-21 cells (105 cells in 1 ml) were seeded into a 12-well plate and incubated
overnight at 37 oC under 5% CO2 in a humidified chamber. Cells were infected with DENV2
(New Guinea C strain) at a multiplicity of infection (MOI) of 1 in MEM supplemented with 2%
FBS and 100 I.U./ml penicillin and 100 µg/ml streptomycin for 1 h at 37 oC under 5% CO2 with
gentle rocking every 15 min. After infection, cells were washed with PBS and incubated with 1.5
ml of MEM supplemented with 2% FBS, 100 I.U./ml penicillin and 100 µg/ml streptomycin. AQ
(5 μM in DMSO concentration of 1%), or DMSO alone (concentration of 1%), was added during
infection and post-infection to the maintenance medium (MEM supplemented with 2% FBS, 100
I.U./ml penicillin and 100 µg/ml streptomycin). Cells were then incubated for 72 h at 37 oC in a
humidified chamber under 5% CO2. Intracellular RNAs were extracted from the infected cells by
treatment with TRIzol reagent according to manufacturer’s protocol. Total RNAs were
quantified by spectroscopy (Nanodrop 1000, Thermo Fisher Scientific, Waltham, MA) and
36
adjusted to 1 µg/µl for reverse transcription using the iScript cDNA synthesis protocol, (Bio-
Rad). The qRT-PCR was performed as previously described (subheading 2.2.5). The relative
amount of DENV2 NS1 RNA from AQ (5 μM in DMSO concentration of 1%) treated cells was
based upon normalization to that of untreated cells (DMSO concentration of 1%). Supernatants
from the experiment were also collected and stored in aliquots (1 ml) at -70 oC. Supernatants
were concentrated by Amicon-15 (Millipore). Viral RNAs were extracted using the QIAamp
viral RNA mini kit (Qiagen, Valencia, CA) and reverse transcribed using the iScript cDNA
synthesis kit according to the manufacturer’s protocol. Extracellular viral RNA copies were
measured by quantification of NS1 gene by qRT-PCR. Moreover, DENV2 infectivity in the
presence and absence of AQ was analyzed by plaque assay. Results were reported as the
percentage of infectivity normalized by the DMSO treated group. Each set of samples was
assayed in duplicate and the results were confirmed by three independent experiments.
Differences between the AQ treated group and the DMSO treated group derived from each of the
three approaches were evaluated by paired t-test, two tailed.
2.2.8. Plaque assay
BHK-21 cells (~105 cells in 1 ml, or ~5 x 10
4 cells in 0.5 ml) were seeded into 12-well or
24 well plates, respectively. Cells were incubated at 37 oC under 5% CO2 in a humidified
chamber until reaching 90% confluence. Cells were infected with previously collected
supernatants for 1 h at 37 oC under 5% CO2, and rocking gently every 15 min. Control samples
were with 100% infectivity derived from DENV2-infected cells treated with DMSO
concentration of 1%; whereas, the samples with 0% infectivity derived from non-infected cells.

37
Cells were washed with PBS, and maintained with 1.5 ml of MEM supplemented with 2% FBS,
100 I.U./ml penicillin and 100 µg/ml streptomycin, and 1% methylcellulose. The plates were
incubated for 3-4 days at 37 oC under 5% CO2. After plaques became visually apparent by
microscopy, cells were fixed with 11.1% formaldehyde, 4.75% isopropanol, and stained with 1%
crystal violet for 30 min. Plaques were counted and the values of plaque forming units (PFU) per
ml were determined. Each sample was tested in duplicate and the results were confirmed by two
independent experiments.
2.2.9. Time-course analysis of AQ inhibition of DENV2 infectivity
The protocol was adapted from Stahla-Beek et al. (Stahla-Beek et al., 2012). Briefly,
BHK-21 cells were cultured in MEM, supplemented with 10% FBS, 100 I.U./ml penicillin and
100 µg/ml streptomycin at 37 oC in a humidified chamber under 5% CO2. Cells were seeded at
~2.5 x 10⁵
cells in 2.5 ml into a 6-well plate and incubated overnight at 37 oC. Cells were
infected with DENV2 at an MOI of 0.01 in MEM supplemented with 2% FBS and 100 I.U./ml
penicillin and 100 µg/ml streptomycin for 1 hour at 37 oC under 5% CO2 by gentle rocking every
15 min. After infection, cells were washed with PBS. Cells were incubated with 3 ml of MEM
supplemented with 2% FBS, 100 I.U./ml penicillin and 100 µg/ml streptomycin. AQ at a final
concentrations of 0, 1, 5, 10, or 25 µM in DMSO (1% final concentration) were added during
adsorption and post-infection. Supernatants were sampled at 4, 12, 24, 36, 48, 72, and 96 h post-
infection and stored in aliquots at -70 o
C for plaque assays. Each sample was tested in duplicate
and the results were confirmed by two independent experiments.

38
2.2.10 Measurement of AQ inhibition of DENV2 infectivity by direct plaque assay
Instead of determining PFU in the supernatants from the drug-treated BHK-21 cells as
described above, the virus titers were determined directly in the infected and drug-treated cell
monolayers and controls as follows: BHK-21 cells (~105 cells in 1 ml) were seeded into a 12-
well plate and incubated at 37 oC under 5% CO2 until reaching 90% confluence. AQ at the final
concentrations of 0, 1, 5, 10, or 25 µM in DMSO concentration of 1% were added to DENV2
(MOI of 0.01) during adsorption for 1 h at 37 oC with gentle rocking every 15 min. Cells were
washed with PBS and maintained with overlay medium (MEM supplemented with 2% FBS, 100
I.U/ml penicillin and 100 µg/ml streptomycin, and 1% methylcellulose). AQ was not present in
the overlay medium post-infection. Cells were incubated for 3-4 days at 37 oC under 5% CO2 in
a humidified chamber. Cells were fixed and stained as previously described. The assay was done
in duplicate and the results were confirmed by two independent experiments.
2.2.11 Order of addition assay
The protocol was adapted from Schmidt et al. (Schmidt et al., 2012). BHK-21 cells (~105
cells in 1 ml) were seeded into a 12-well plate and incubated at 37 oC under 5% CO2 in a
humidified chamber overnight. AQ (5 µM in DMSO concentration of 1%) was added to DENV2
(MOI of 1) diluted in growth medium for 15 min at 37 oC before absorption (pre-incubation),
during absorption (co-infection), and after absorption, wash, and medium replacement (post-
infection). The adsorption was done by incubating BHK-21 monolayer with the virus for 1 h at
37 oC with gentle rocking every 15 min. Then, cells were washed with PBS and maintained in
MEM supplemented with 2% FBS, 100 I.U/ml penicillin and 100 µg/ml streptomycin. The result

39
from samples with virus in the medium containing DMSO alone (concentration of 1%) was taken
as 100% infectivity. Supernatants were collected at 24, 48, and 72 h post-infection for plaque
assay. Each sample was tested in duplicate and the results were confirmed by two independent
experiments.
2.2.12 Time of addition assays
The protocol was adapted from Wang et al. (Wang et al., 2011). We designed the
experiment to study the viral replication. Briefly, BHK-21 cells (~105 cells in 1 ml) were seeded
into a 12-well plate and incubated at 37 oC under 5% CO2 in a humidified chamber overnight.
Cells were infected with DENV2 (MOI of 1) as described above. AQ (5 µM in DMSO
concentration of 1%) or DMSO alone (concentration of 1%) was added to DENV2 (MOI of 1) at
1, 3, 6, 9, 12, 15, 18, 21, 24, 30, 36, or 48 h post-infection. Supernatants were collected at 72 h
post-infection for plaque assay. Supernatants and pellets were collected for analysis by qRT-PCR
as previously described. Each sample was tested in duplicate and the results were confirmed by
two independent experiments.
In addition, we performed a time of addition assay with modification to study the viral
translation focusing on the first 12 h post-infection period. Briefly, AQ (5 µM in DMSO
concentration of 1%) or DMSO alone (concentration of 1%) was added to DENV2 (MOI of 1) at
1, 2, 3, 4, 5, 6, 8, 10, 12, 24, or 48 h post-infection. Supernatants were collected at 48 h post-
infection for plaque assay.
40
2.2.13 In vitro protease assay
Assays were performed in triplicate in a 96-well half area black plate (Greiner Bio-One).
The reaction mixture (100 μl) contained 200 mM Tris-HCl, pH 9.5, 30% glycerol, 0.1% CHAPS,
1% DMSO, 50 nM DENV2 NS2BH-(QR)-NS3pro enzyme (Yon et al., 2005), 10 µM
fluorogenic tetrapeptide substrate, Bz-Nle-Lys-Arg-Arg-AMC, and 0, 7.81, 15.63, 31.25, 62.5,
125, 250, or 500 μM AQ in DMSO (concentration of 1%). The compound-enzyme mixture was
pre-incubated for 15 min at room temperature before addition of the substrate. The reaction was
continued at 37 οC for 30 min. The release of AMC from the substrate was recorded every 1.5
min at 380 nm excitation and 460 nm emission in a SpectraMax Gemini EM spectrofluorometer
(Molecular Devices, Sunnyvale, CA). DMSO alone (concentration of 1%) was used as the no-
inhibitor control (100% protease activity) and the bovine pancreatic trypsin inhibitor (BPTI, also
known as aprotinin), which has a Ki of 26 nM against the DENV2 protease, was used at 5 µM in
DMSO concentration of 1% as a positive control (0% protease activity). Data were plotted and
the IC50 value was calculated by nonlinear regression analysis using a GraphPad Prism software
v5.
2.2.14 In vitro MTase assay
RNAnt1-200 substrate for MTase was derived from the PCR fragment amplified from pSY2
plasmid template (You and Padmanabhan, 1999) using forward and reverse primers as described
in Materials section. The forward primer included the T7 promoter. The RNA substrate was
synthesized by in vitro transcription using T7 RNA polymerase (MEGAshortscript).
Radiolabeled capped RNA was generated in a reaction containing 1 μCi [α-32
P]GTP, 1 μM
41
unlabeled GTP and vaccinia virus-encoded capping enzyme (m7ScriptCap from CellScript)
following the manufacturer’s protocol. The unincorporated nucleotides were removed by
chromatography on a P-30 column (Bio-Rad), and the RNA was recovered by RNA clean and
concentrator kit (Zymo research). The MTase reaction contained 50 mM Tris-HCl, pH 7.5, 10
mM KCl, 2 mM MgCl2, 1 mM dithiothreitol (DTT), 4 units RNase Inhibitor, 500 nM DENV2
NS5FL, 1 μg RNAnt1-200, and 0, 100, 200, 400, 600, 800, or 1000 μM AQ in water. The
compound-enzyme mixture was pre-incubated for 15 min at room temperature before addition of
the substrate, 400 nM S-adenosylmethionine (SAM). The reaction was incubated at 37 oC for 1
h. RNA was extracted by RNA clean and concentrator (Zymo research), and treated with
nuclease P1. The reaction products were fractionated by thin layer chromatography (TLC) on
cellulose PEI plate using 0.45 M ammonium sulfate as solvent. The plate was dried, exposed to a
phosphoimaging screen. Radioactive signals were quantified by ImageJ software.
2.2.15 In vitro RdRP assay
The positive and negative sense subgenomic RNA templates were constructed and
transcribed in vitro (You and Padmanabhan, 1999, Nomaguchi et al., 2003). The RdRp assay
was performed using DENV2 NS5FL enzyme as described (Ackermann and Padmanabhan, 2001,
Nomaguchi et al., 2003). Briefly, the reaction mixture contained 50 mM Tris-HCl, pH 8, 50 mM
NaCl, 5 mM MgCl2, 1 μg RNA template, 500 μM of ATP, CTP, and UTP, 10 μM unlabeled
GTP and 10 μCi [α-32
P]GTP, 500 nM DENV2 NS5FL, and AQ (50 μM in DMSO concentration
of 1%), and incubated for 1 hour at 30 oC. The RNA product was extracted by acid

42
phenol/chloroform, and then was analyzed by denaturing PAGE. Radioactive signals from the
newly synthesized RNAs were quantified by phosphoimaging.
43
CHAPTER 3
SCREENING QUINOLINE DERIVATIVES FOR INHIBITION OF FLAVIVIRUS REPLICATION USING
REPLICON ASSAYS
3.1 Initial screening with quinoline compounds from NCI/DTP and Dr. Nagarajan’s library
Previous work in our lab by N. Mueller identified 8-hydroxyquinoline as an important
core inhibiting WNV protease in vitro (Mueller et al., 2008). Compound B, one of the 8-
hydroxyquinoline derivatives, was later identified as having an EC50 value of 1.4 ± 0.4 μM
(Mueller et al., 2008). In addition, E. Reichert and S. Alcaraz-Estrada developed DENV2,
DENV4, and WNV replicons stably expressed in mammalian cell lines for drug discovery.
Based on these developments, we investigated the potencies of quinoline derivatives as potential
inhibitors of flavivirus replication using replicon based assays. The initial screening involved
quinoline derivatives obtained from NCI/DTP (11 compounds) and from Dr. K. Nagarajan’s
library (19 KN compounds) at 50 μM (final concentration) on BHK-21/DENV2 cells and
Vero/WNV cells (Table 3.1-3.2). From these results, four NCI/DTP compounds (AQ and 3
derivatives with a dichloroethylamino side chain) and eleven KN compounds were selected for
further analysis based on strong (≥ 80%) replication inhibition of DENV2 and WNV replicons.
We were interested in AQ because it is an FDA-approved antimalarial drug. Because of the
promising results with AQ in the preliminary assays, we searched for other AQ derivatives
within the NCI/DTP collection and obtained all available AQ derivatives (8 compounds). Upon
screening these compounds at 50 μM (final concentration) (Table 3.1), most derivatives, except
AQD5 and AQD8, showed strong replication inhibition of DENV2 and WNV replicons. These
compounds were also selected for further analysis (Table 3.4).

44
3.2 Therapeutic indices of selected compounds
Compounds with potent inhibition (≥ 80%) of replication in the screen were selected for
further analysis. Briefly, replicon cells were seeded and incubated for 6 h before compound
addition. The experiments were continued for 24 h before Rluc measurement and calculation of
EC50 values. We also analyzed cytotoxicity to naïve BHK-21 and Vero cells in parallel. The
CC50 values were evaluated by measuring the cellular ATP level with CellTiterGlo assay kit as
described in the Methods section. Therapeutic indices (TI) calculated from the ratios of CC50 and
EC50 are shown (Table 3.4).
Therapeutic indices (TIs) of NCI/DTP compounds including amodiaquine, quinacrine
mustard, chloroquine mustard, and chloroquine ethyl phenyl mustard, were higher for the BHK-
21/DENV2 replicon system compared to Vero/WNV. We hypothesized that Vero cells were
more sensitive to drug toxicities than BHK-21 cells. Moreover, the AQ derivatives had
therapeutic indices close to one, suggesting that their effect on the replicons was a consequence
of their cytotoxicity. Due to the fact that AQ has been used in a regimen for malarial treatment
since the 1990s, this drug has a long history of pharmacological and toxicological investigations.
We were interested in identifying its antiviral efficacy, which would be an alternative application
of the drug. For the mustard derivatives, our literature search revealed that compounds with a
dichloroethylamino side chain could potentially be persistent and powerful blister agents (Keyes,
2004). For this reason, we decided not to continue studying these derivatives. Results from KN
compounds (or 8-hydroxyquinoline derivatives) showed that the high level of replicon inhibition
observed in screening were false positives due to their cytotoxicities.
45
3.3 Screening of chloroquine derivatives from Dr. Wolf
We obtained 19 chloroquine derivatives from Dr. Christian Wolf (GU Chemistry
department) for initial screening using our replicon system at 25 μM to minimize the false
positive effect due to potential cytotoxicity (Noble et al., 2010), (self observation). BHK-
21/DENV2 and Vero/DENV4 cells were treated with the compounds and Rluc activities were
measured after 24 h incubation. Each compound was analyzed in triplicate and two independent
experiments were performed to confirm the results (Table 3.3). Cell viability in the presence of
these compounds was estimated using a WST-8 tetrazolium salt from the CCK-8 kit prior to
measurement of Rluc activities as described earlier (Table 3.5). All CQ derivatives displayed a
high degree of replicon inhibition and a similar degree of cytotoxicity. We concluded that the
strong inhibitory effect on virus replication was most likely due to cytotoxicity. Hence, these
derivatives were not pursued further.
3.4 Discussion
We utilized a cell-based approach to screen quinoline compounds for their antiviral
activities. The positive hits from this type of screen are expected to be more practical for drug
development. The cell-based assay is more biologically relevant compared to in vitro enzymatic
assays, as the latter approach ignores permeability issues. However, the cytotoxicity of
compounds can be a major false positive issue. It is necessary to exclude this effect by running
parallel cytotoxicity assays. Our finding showed that most quinoline compounds except the
FDA-approved drugs were most likely cytotoxic, rather than true replicon inhibitors. The only
46
drug that showed promising anti-DENV2 replicon replication effects was AQ. We have
confirmed the finding with various experiments and controls which will be discussed in Chapter
4. Moreover, mode-of-action studies were later performed in order to find a specific target for
further SAR development. Details will be discussed in Chapter 5.
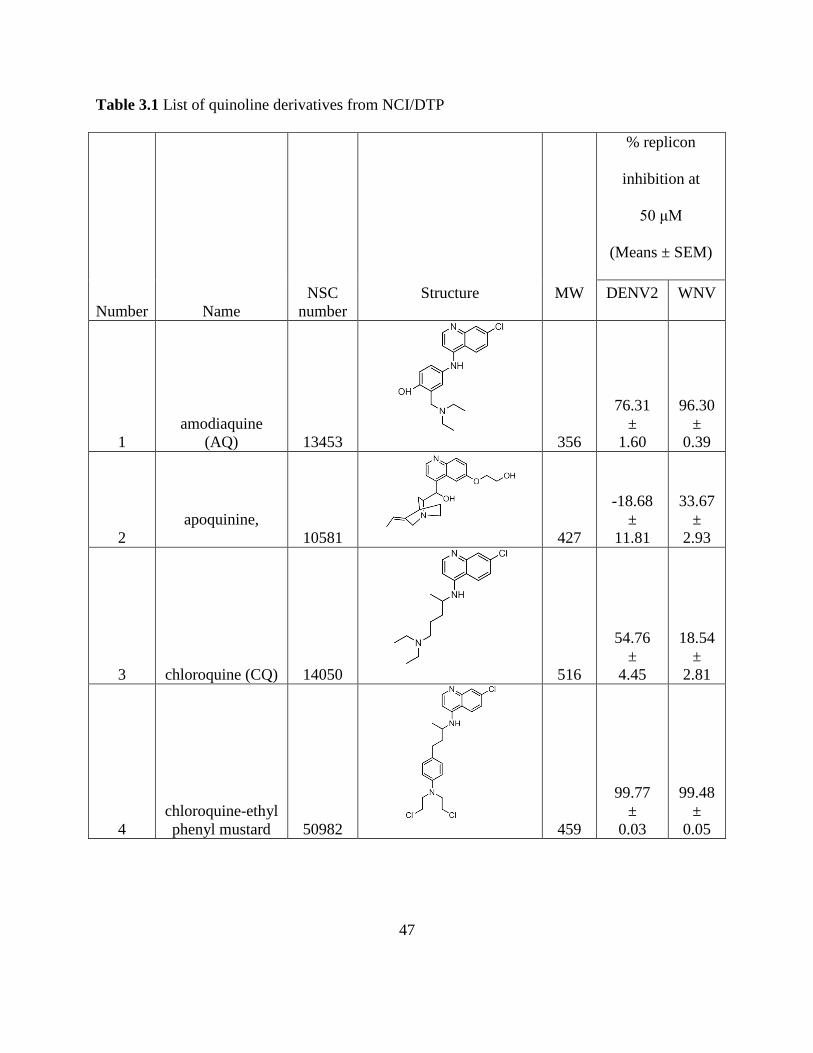
47
Table 3.1 List of quinoline derivatives from NCI/DTP
Number Name
NSC
number
Structure MW
% replicon
inhibition at
50 μM
(Means ± SEM)
DENV2 WNV
1
amodiaquine
(AQ) 13453
356
76.31
±
1.60
96.30
±
0.39
2
apoquinine,
10581
427
-18.68
±
11.81
33.67
±
2.93
3 chloroquine (CQ) 14050
516
54.76
±
4.45
18.54
±
2.81
4
chloroquine-ethyl
phenyl mustard 50982
459
99.77
±
0.03
99.48
±
0.05
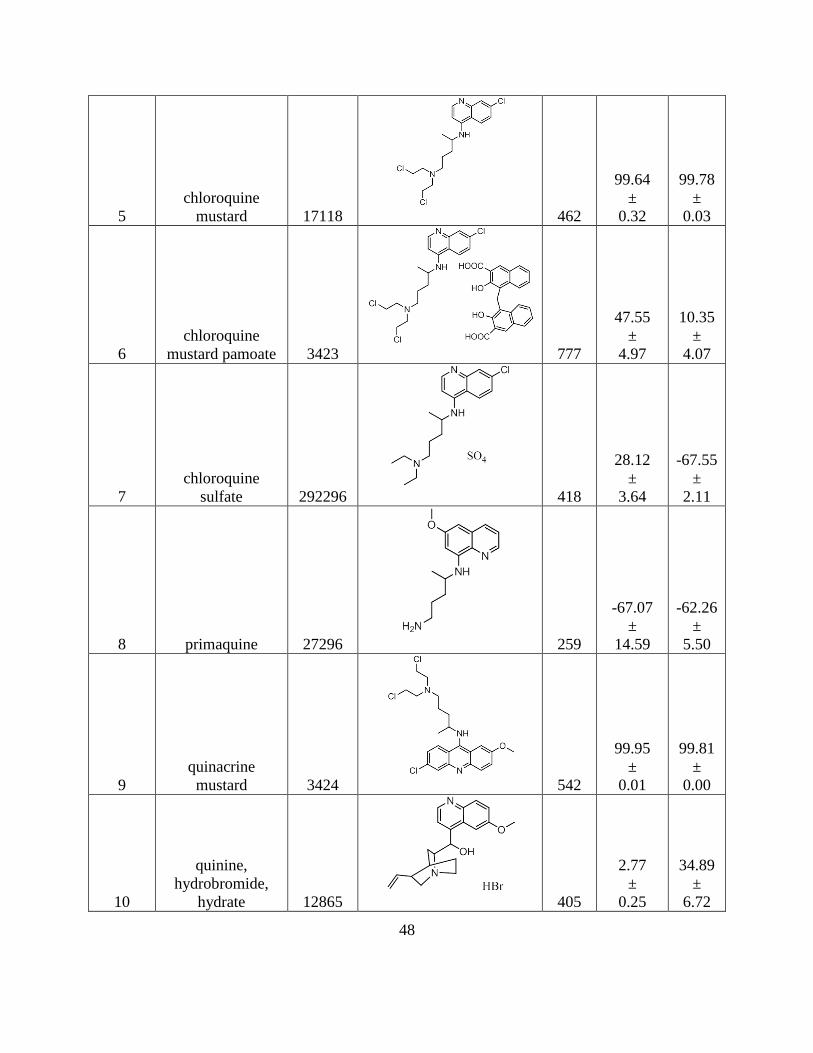
48
5
chloroquine
mustard 17118
462
99.64
±
0.32
99.78
±
0.03
6
chloroquine
mustard pamoate 3423
777
47.55
±
4.97
10.35
±
4.07
7
chloroquine
sulfate 292296
418
28.12
±
3.64
-67.55
±
2.11
8 primaquine 27296
259
-67.07
±
14.59
-62.26
±
5.50
9
quinacrine
mustard
3424
542
99.95
±
0.01
99.81
±
0.00
10
quinine,
hydrobromide,
hydrate 12865
405
2.77
±
0.25
34.89
±
6.72

49
11 quinine, polymers 131458 (324)x
-42.74
±
3.90
-93.39
±
8.58
12 AQ derivative 1
14225 406
89.79
±
10.65
97.91
±
0.49
13 AQ derivative 2 14715 406
69.86
±
3.41
50.63
±
4.40
14 AQ derivative 3 29459 439
99.86
±
0.07
99.86
±
0.02
15 AQ derivative 4 69350 438
99.99
±
0.00
99.86
±
0.01
16 AQ derivative 5 69351 412
20.74
±
2.87
84.50
±
5.43

50
17 AQ derivative 6 74823 353
98.50
±
1.31
99.51
±
0.15
18 AQ derivative 7 101670 453
93.04
±
2.56
97.70
±
1.09
19 AQ derivative 8 130792 307
3.91
±
0.34
57.19
±
5.12
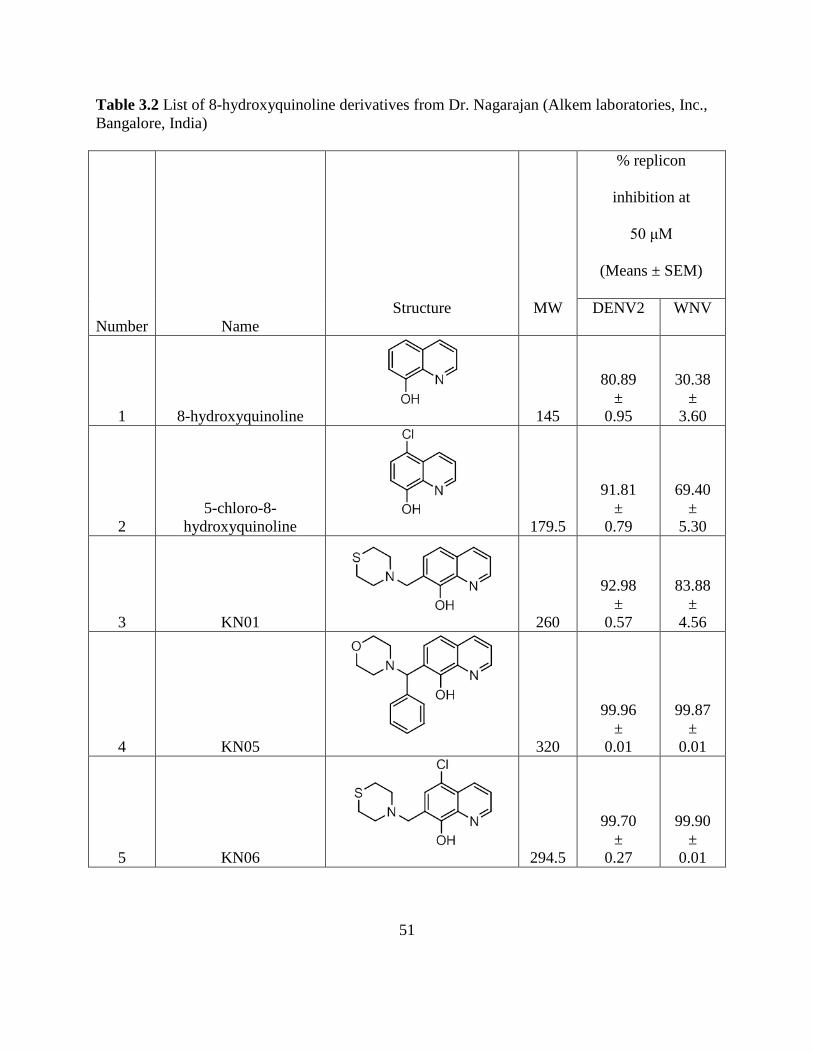
51
Table 3.2 List of 8-hydroxyquinoline derivatives from Dr. Nagarajan (Alkem laboratories, Inc.,
Bangalore, India)
Number Name
Structure MW
% replicon
inhibition at
50 μM
(Means ± SEM)
DENV2 WNV
1 8-hydroxyquinoline
145
80.89
±
0.95
30.38
±
3.60
2
5-chloro-8-
hydroxyquinoline
179.5
91.81
±
0.79
69.40
±
5.30
3 KN01
260
92.98
±
0.57
83.88
±
4.56
4 KN05
320
99.96
±
0.01
99.87
±
0.01
5 KN06
294.5
99.70
±
0.27
99.90
±
0.01
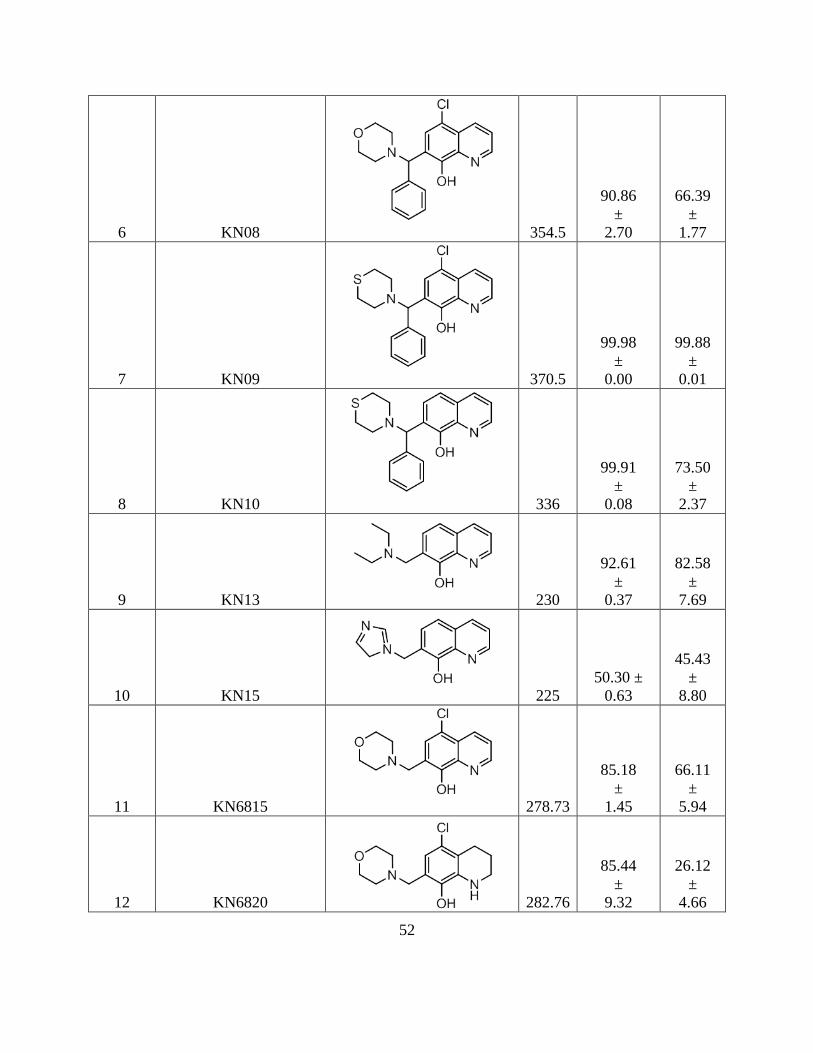
52
6 KN08
354.5
90.86
±
2.70
66.39
±
1.77
7 KN09
370.5
99.98
±
0.00
99.88
±
0.01
8 KN10
336
99.91
±
0.08
73.50
±
2.37
9 KN13
230
92.61
±
0.37
82.58
±
7.69
10 KN15
225
50.30 ±
0.63
45.43
±
8.80
11 KN6815
278.73
85.18
±
1.45
66.11
±
5.94
12 KN6820 282.76
85.44
±
9.32
26.12
±
4.66
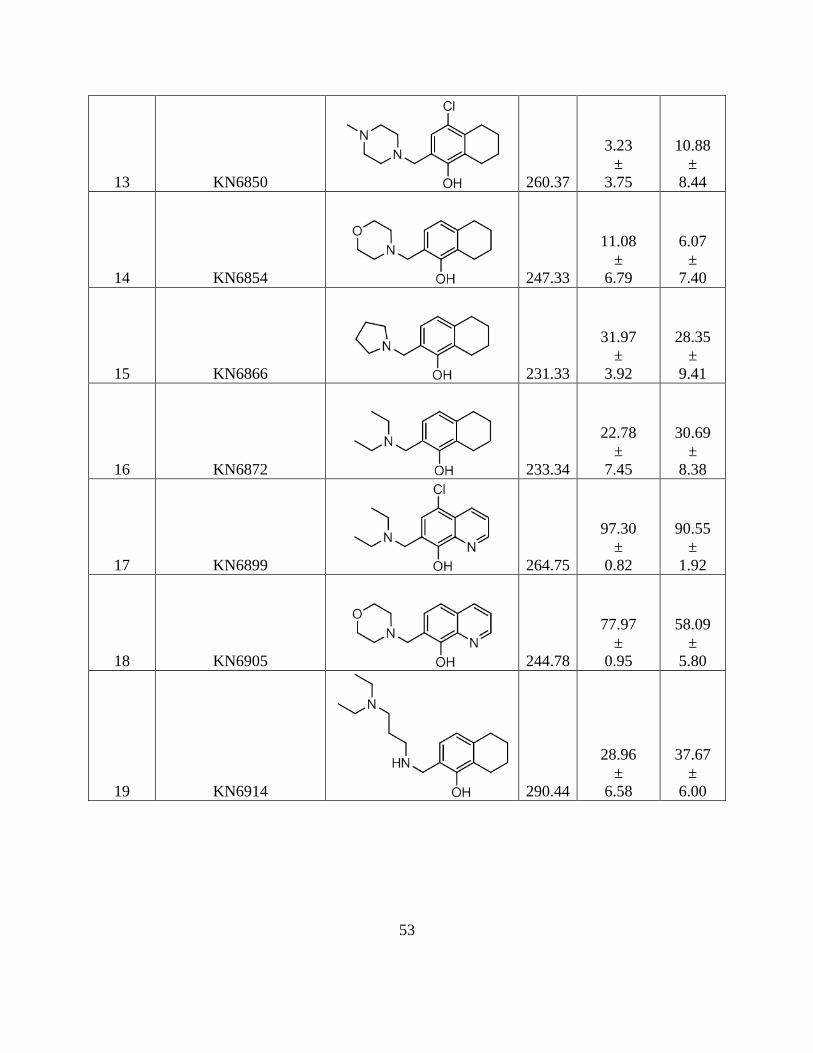
53
13 KN6850 260.37
3.23
±
3.75
10.88
±
8.44
14 KN6854 247.33
11.08
±
6.79
6.07
±
7.40
15 KN6866 231.33
31.97
±
3.92
28.35
±
9.41
16 KN6872 233.34
22.78
±
7.45
30.69
±
8.38
17 KN6899 264.75
97.30
±
0.82
90.55
±
1.92
18 KN6905 244.78
77.97
±
0.95
58.09
±
5.80
19 KN6914 290.44
28.96
±
6.58
37.67
±
6.00
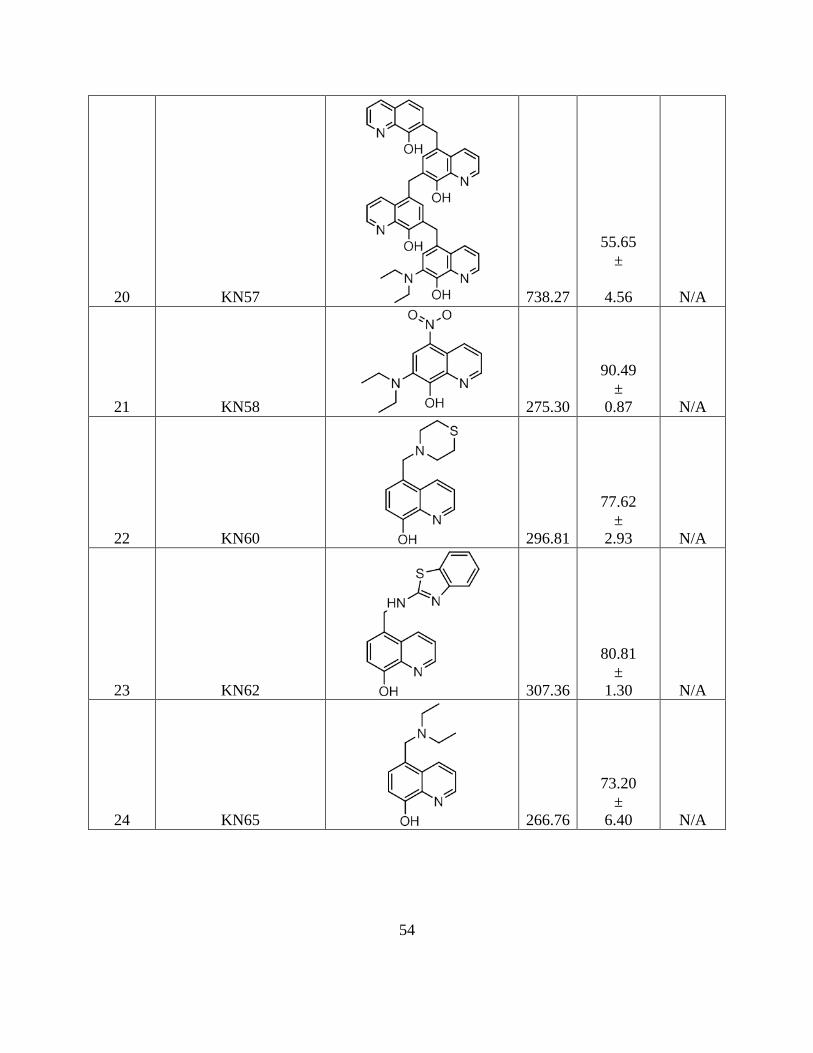
54
20 KN57 738.27
55.65
±
4.56 N/A
21 KN58 275.30
90.49
±
0.87 N/A
22 KN60 296.81
77.62
±
2.93 N/A
23 KN62 307.36
80.81
±
1.30 N/A
24 KN65 266.76
73.20
±
6.40 N/A
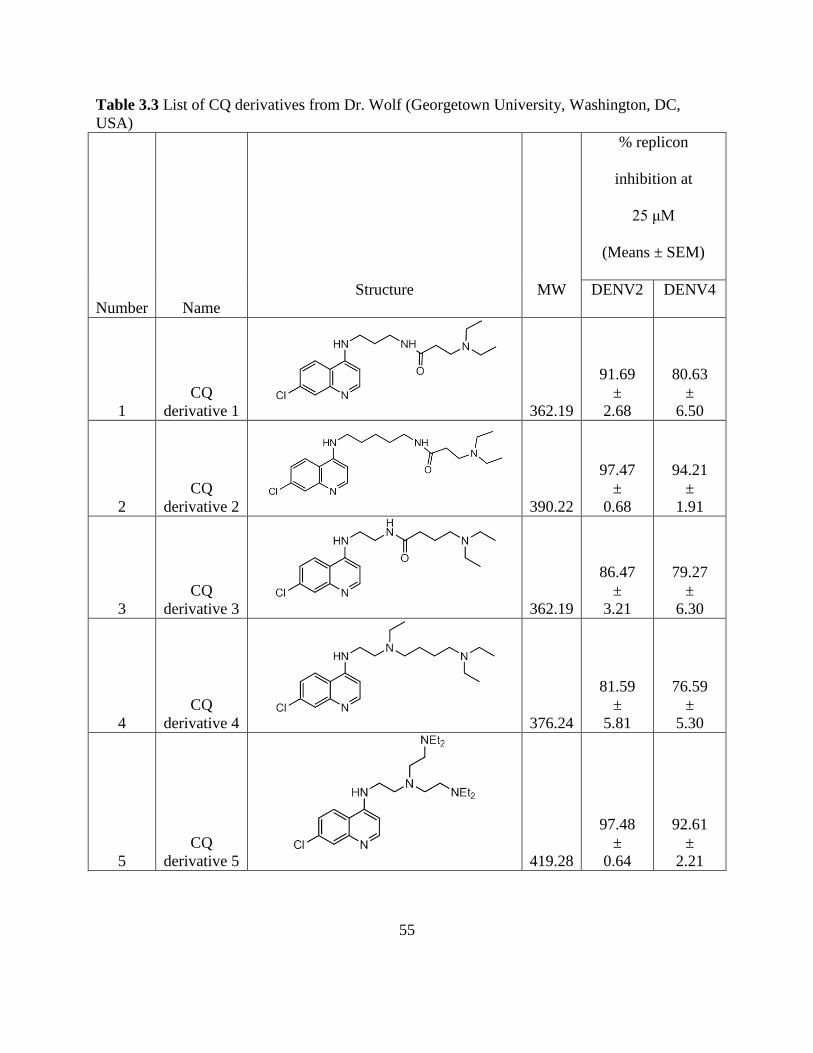
55
Table 3.3 List of CQ derivatives from Dr. Wolf (Georgetown University, Washington, DC,
USA)
Number Name
Structure MW
% replicon
inhibition at
25 μM
(Means ± SEM)
DENV2 DENV4
1
CQ
derivative 1
362.19
91.69
±
2.68
80.63
±
6.50
2
CQ
derivative 2
390.22
97.47
±
0.68
94.21
±
1.91
3
CQ
derivative 3
362.19
86.47
±
3.21
79.27
±
6.30
4
CQ
derivative 4
376.24
81.59
±
5.81
76.59
±
5.30
5
CQ
derivative 5
419.28
97.48
±
0.64
92.61
±
2.21

56
6
CQ
derivative 6
334.16
78.76
±
7.10
63.00
±
4.22
7
CQ
derivative 7
348.21
92.16
±
2.28
83.00
±
3.45
8
CQ
derivative 8
349.16
94.64
±
2.29
94.79
±
0.67
9
CQ
derivative 9
383.18
82.85
±
2.87
81.29
±
1.58
10
CQ
derivative
10
413.19
90.68
±
0.97
91.81
±
1.24
11
CQ
derivative
11 446.12
63.14
±
5.17
63.40
±
1.18
12
CQ
derivative
12 384.14
71.04
±
3.62
81.14
±
2.98

57
13
CQ
derivative
13 397.17
78.12
±
2.79
83.62
±
2.72
14
CQ
derivative
14 429.12
87.29
±
1.98
88.78
±
0.45
15
CQ
derivative
15 384.14
77.87
±
4.43
96.17
±
0.41
16
CQ
derivative
16 400.11
94.12
±
0.93
96.70
±
0.09
17
CQ
derivative
17 445.10
99.88
±
0.03
99.92
±
0.01
18
CQ
derivative
18 413.14
97.55
±
0.37
98.19
±
0.39
19
CQ
derivative
19 463.16
99.08
±
0.18
99.06
±
0.36

58
Table 3.4 EC50, CC50, and TIs of selected compounds
Drugs/compounds
DENV2 replicon WNV replicon
EC50 (μM) CC50 (μM) TI EC50 (μM) CC50 (μM) TI
amodiaquine 10.81 ± 1.43 80.01 ± 6.27 7.40 14.63 ± 2.21 24.40 ± 2.49 1.66
quinacrine mustard 0.39 ± 0.10 2.40 ± 0.63 6.15 0.36 ± 0.09 0.97 ± 0.11 2.69
chloroquine
mustard 2.90 ± 0.78 30.47 ± 9.77 10.50 2.95 ± 0.77 3.64 ± 0.93 1.23
chloroquine ethyl
phenyl mustard 3.60 ± 0.83 74.13 ± 21.50 20.57 1.55 ± 0.40 5.02 ± 1.23 3.24
AQ derivative 1 21.09 ± 1.22 44.57 ± 2.98 2.11 14.85 ± 0.48 66.37 ± 4.64 4.47
AQ derivative 2 29.68 ± 2.26 35.97 ± 5.04 1.21 30.15 ± 6.05 23.15 ± 10.83 0.76
AQ derivative 3 4.76 ± 0.63 14.05 ± 2.57 2.95 8.00 ± 1.27 9.36 ± 1.08 1.17
AQ derivative 4 15.36 ± 1.31 16.88 ± 2.06 1.10 3.31± 0.73 14.58 ± 0.51 4.40
AQ derivative 5 88.71 ± 3.88 >100 N/A 33.40 ± 3.09 >100 N/A
AQ derivative 6 12.49 ± 2.19 16.39 ± 0.46 1.31 6.29 ± 0.52 18.20 ± 1.05 2.90
AQ derivative 7 18.97 ± 1.73 17.73 ± 1.96 0.93 14.84 ± 1.14 34.77 ± 1.78 2.34
AQ derivative 8 >100 >100 N/A >100 >100 N/A
8-
hydroxyquinoline 1.38 ± 0.35 2.49 ± 0.82 0.82 N/A N/A N/A
5-chloro-8-
hydroxyquinoline 16.61 ± 2.31 20.65 ± 4.20 1.81 N/A N/A N/A
KN01 5.55 ± 1.88 4.22 ± 1.31 1.24 N/A N/A N/A
KN05 19.78 ± 5.48 17.71 ± 2.23 0.90 N/A N/A N/A
KN06 5.95 ± 0.59 6.86 ± 1.05 1.15 N/A N/A N/A
KN08 23.75 ± 6.48 37.16 ± 5.92 1.56 N/A N/A N/A
KN09 10.41 ± 0.85 28.58 ± 2.97 2.75 N/A N/A N/A
KN10 6.14 ± 1.10 21.26 ± 5.79 3.46 N/A N/A N/A
KN13 12.02 ± 1.40 >100 N/A N/A N/A N/A
KN6815 3.80 ± 0.50 13.82 ± 1.67 3.64 N/A N/A N/A
KN6899 3.86 ± 0.44 5.69 ± 0.59 1.47 N/A N/A N/A
KN6905 5.61 ± 0.52 19.91 ± 2.83 3.55 N/A N/A N/A
Note : TI of AQ on Vero/DENV4 = 2.76 (EC50 10.18 ± 0.46 μM, CC50 28.13 ± 5.45 μM)
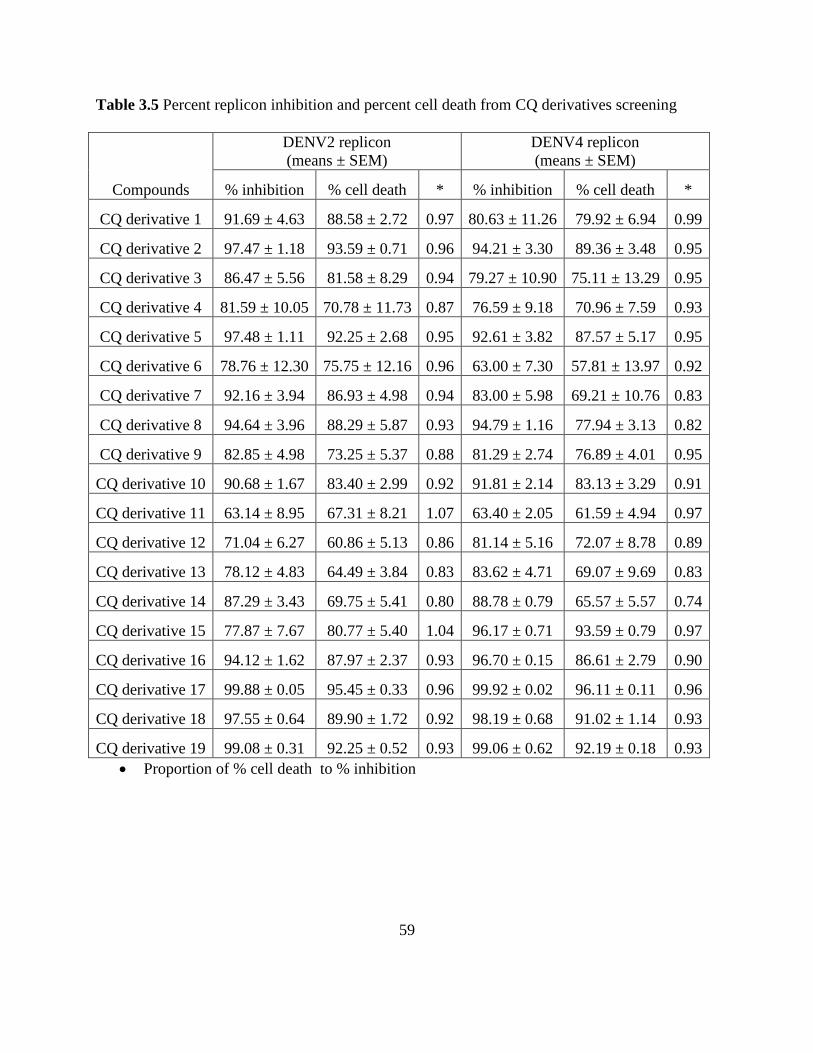
59
Table 3.5 Percent replicon inhibition and percent cell death from CQ derivatives screening
Compounds
DENV2 replicon
(means ± SEM)
DENV4 replicon
(means ± SEM)
% inhibition % cell death * % inhibition % cell death *
CQ derivative 1 91.69 ± 4.63 88.58 ± 2.72 0.97 80.63 ± 11.26 79.92 ± 6.94 0.99
CQ derivative 2 97.47 ± 1.18 93.59 ± 0.71 0.96 94.21 ± 3.30 89.36 ± 3.48 0.95
CQ derivative 3 86.47 ± 5.56 81.58 ± 8.29 0.94 79.27 ± 10.90 75.11 ± 13.29 0.95
CQ derivative 4 81.59 ± 10.05 70.78 ± 11.73 0.87 76.59 ± 9.18 70.96 ± 7.59 0.93
CQ derivative 5 97.48 ± 1.11 92.25 ± 2.68 0.95 92.61 ± 3.82 87.57 ± 5.17 0.95
CQ derivative 6 78.76 ± 12.30 75.75 ± 12.16 0.96 63.00 ± 7.30 57.81 ± 13.97 0.92
CQ derivative 7 92.16 ± 3.94 86.93 ± 4.98 0.94 83.00 ± 5.98 69.21 ± 10.76 0.83
CQ derivative 8 94.64 ± 3.96 88.29 ± 5.87 0.93 94.79 ± 1.16 77.94 ± 3.13 0.82
CQ derivative 9 82.85 ± 4.98 73.25 ± 5.37 0.88 81.29 ± 2.74 76.89 ± 4.01 0.95
CQ derivative 10 90.68 ± 1.67 83.40 ± 2.99 0.92 91.81 ± 2.14 83.13 ± 3.29 0.91
CQ derivative 11 63.14 ± 8.95 67.31 ± 8.21 1.07 63.40 ± 2.05 61.59 ± 4.94 0.97
CQ derivative 12 71.04 ± 6.27 60.86 ± 5.13 0.86 81.14 ± 5.16 72.07 ± 8.78 0.89
CQ derivative 13 78.12 ± 4.83 64.49 ± 3.84 0.83 83.62 ± 4.71 69.07 ± 9.69 0.83
CQ derivative 14 87.29 ± 3.43 69.75 ± 5.41 0.80 88.78 ± 0.79 65.57 ± 5.57 0.74
CQ derivative 15 77.87 ± 7.67 80.77 ± 5.40 1.04 96.17 ± 0.71 93.59 ± 0.79 0.97
CQ derivative 16 94.12 ± 1.62 87.97 ± 2.37 0.93 96.70 ± 0.15 86.61 ± 2.79 0.90
CQ derivative 17 99.88 ± 0.05 95.45 ± 0.33 0.96 99.92 ± 0.02 96.11 ± 0.11 0.96
CQ derivative 18 97.55 ± 0.64 89.90 ± 1.72 0.92 98.19 ± 0.68 91.02 ± 1.14 0.93
CQ derivative 19 99.08 ± 0.31 92.25 ± 0.52 0.93 99.06 ± 0.62 92.19 ± 0.18 0.93
Proportion of % cell death to % inhibition
60
CHAPTER 4
CHARACTERIZATION OF AQ INHIBITION OF DENV2 REPLICATION USING REPLICON
EXPRESSING CELLS AND INFECTIVITY ASSAYS
4.1 Inhibition of DENV2, DENV4, WNV replicon replication measured by Rluc activity
From the screening in Chapter 3, AQ inhibited replicon replication of BHK-21/DENV2
with a TI of 7.4 (Table 3.4), but did not inhibit Vero/DENV4 and Vero/WNV replicon
replication. TIs of Vero/DENV4 and Vero/WNV were 2.76 and 1.66, respectively. In a detailed
study of AQ, we extended the incubation period to 48 h with AQ at the final concentrations of 0,
0.01, 0.1, 1, 2.5, 5, 7.5, 10, 20, 30, 40, 50, 60, 70, 80, or 100 µM, each with a final DMSO
concentration of 1%. TI values of AQ to BHK-21/DENV2, Vero/DENV4 and Vero/WNV
replicon expressing cells were 7.31, 1.13, and 4.98, respectively (Fig. 4.1-4.3). In these
experiments, we directly measured cytotoxicity of the replicon cells using highly soluble
tetrazolium salt (WST-8) before reading the Rluc. EC50 and CC50 values were reduced in this
experimental setting; however, therapeutic indices remained similar to those of 24 h experiments.
For BHK-21/DENV2, TIs were 7.40, and 7.31 in the 24, and 48 h experiments, respectively,
suggesting that AQ was consistently effective in inhibiting DENV2 replicon replication (Table
3.4, Fig. 4.1). TIs of Vero/DENV4 from both experiments were low suggesting cytotoxity of AQ
on both naïve Vero cells and replicon Vero cells (Table 3.4, Fig. 4.2). As of Vero/WNV, the TI
of the 24 h experiment was low because of cytotoxicity but the TI of 48 h experiment was higher
at 4.98 with increasing CC50 at 39.94 ± 17.67 μM (Table 3.4, Fig. 4.3). Both Vero/WNV TIs
were not statistically different because the CC50 of the 48 h experiment spanned a wide-range.
We concluded that replicon Vero cells were also sensitive to AQ cytotoxicity, similar to naïve

61
Vero cells. To accurately measure AQ inhibition on DENV4 and WNV, infectivity assays with
qRT-PCR and/or plaque assay quantification were recommended.
4.2 AQ did not inhibit Rluc reporter
To exclude the possibility that AQ was directly inhibiting the Rluc reporter, rather than
inhibiting replication, BHK-21/DEN2 cells (~104 cells in 100 μl) were plated in the exact
condition as previous experiments and incubated for 24 h at 37 oC. AQ was added during cell
lysis. Substrate was added and Rluc activities were measured. No Rluc inhibition was observed
at any AQ concentration (0, 0.1, 1, 2.5, 5, 10, 25, or 100 µM) (Fig. 4.4) indicating that the
luciferase activity per se was not inhibited by the drug. Thus, AQ appears to cause a dose-
dependent inhibition of replicon replication.
4.3 AQ did not inhibit BHK-21/DENV2 replication as quantified by qRT-PCR
In addition to measuring the inhibition of Rluc reporter expression, we analyzed the AQ-
mediated inhibition of viral replication by quantifying DENV2 replicon RNA levels. BHK-
21/DENV2 cells were treated with AQ for 48 h at the final concentrations of 0, 0.1, 0.5, 1, 2, 2.5,
5, 10, or 25 μM containing in the presence of 1% DMSO. Replicon RNAs were extracted and
analyzed by qRT-PCR, comparing DENV2 NS1 and the control GAPDH genes. Each sample
was tested in triplicate and results were confirmed by two independent experiments. Data
represented means and standard errors derived from two independent experiments (Fig. 4.5).
From this experiment, AQ had no measurable effect on the amount of replicon RNA. We
concluded that AQ had little effect on continuously replicating subgenomic RNA. In time-of-
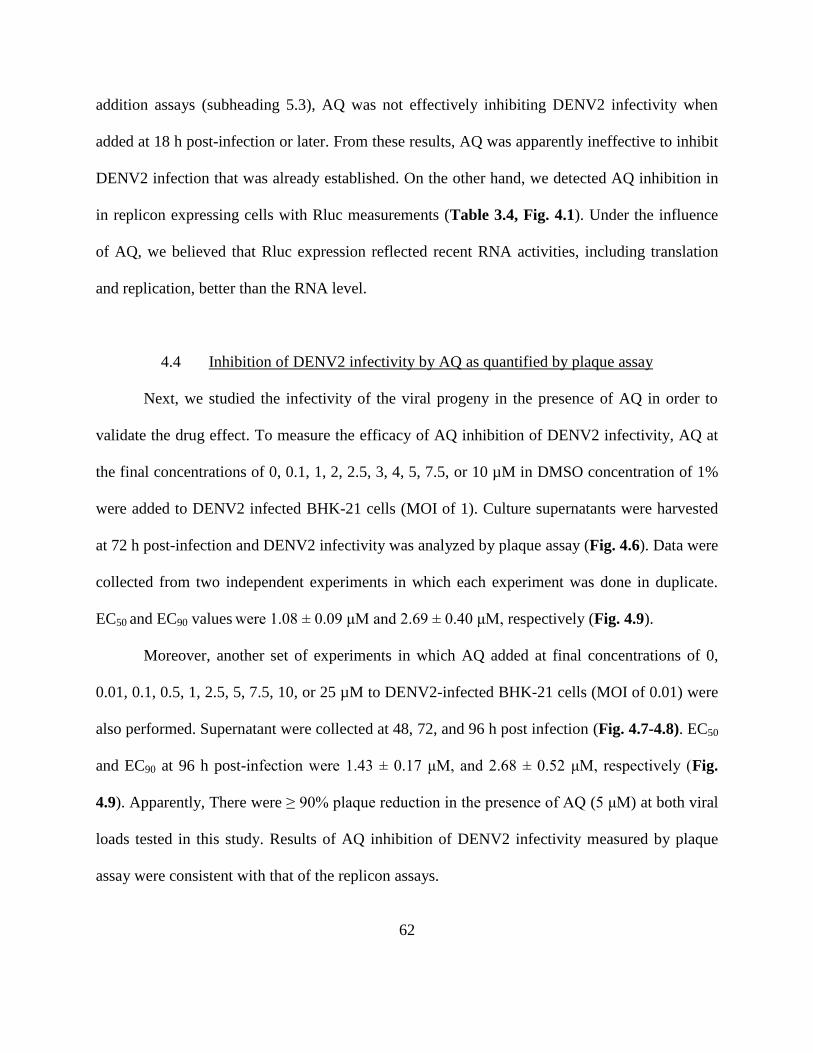
62
addition assays (subheading 5.3), AQ was not effectively inhibiting DENV2 infectivity when
added at 18 h post-infection or later. From these results, AQ was apparently ineffective to inhibit
DENV2 infection that was already established. On the other hand, we detected AQ inhibition in
in replicon expressing cells with Rluc measurements (Table 3.4, Fig. 4.1). Under the influence
of AQ, we believed that Rluc expression reflected recent RNA activities, including translation
and replication, better than the RNA level.
4.4 Inhibition of DENV2 infectivity by AQ as quantified by plaque assay
Next, we studied the infectivity of the viral progeny in the presence of AQ in order to
validate the drug effect. To measure the efficacy of AQ inhibition of DENV2 infectivity, AQ at
the final concentrations of 0, 0.1, 1, 2, 2.5, 3, 4, 5, 7.5, or 10 µM in DMSO concentration of 1%
were added to DENV2 infected BHK-21 cells (MOI of 1). Culture supernatants were harvested
at 72 h post-infection and DENV2 infectivity was analyzed by plaque assay (Fig. 4.6). Data were
collected from two independent experiments in which each experiment was done in duplicate.
EC50 and EC90 values were 1.08 ± 0.09 μM and 2.69 ± 0.40 μM, respectively (Fig. 4.9).
Moreover, another set of experiments in which AQ added at final concentrations of 0,
0.01, 0.1, 0.5, 1, 2.5, 5, 7.5, 10, or 25 µM to DENV2-infected BHK-21 cells (MOI of 0.01) were
also performed. Supernatant were collected at 48, 72, and 96 h post infection (Fig. 4.7-4.8). EC50
and EC90 at 96 h post-infection were 1.43 ± 0.17 μM, and 2.68 ± 0.52 μM, respectively (Fig.
4.9). Apparently, There were ≥ 90% plaque reduction in the presence of AQ (5 μM) at both viral
loads tested in this study. Results of AQ inhibition of DENV2 infectivity measured by plaque
assay were consistent with that of the replicon assays.

63
4.5 Confirmation of inhibition of DENV2 replication and infectivity by AQ
In addition, we verified AQ inhibition to DENV2 replication using DENV2 infected
BHK-21 cells and measured the intracellular viral RNA, extracellular viral RNA quantified by
qRT-PCR, and viral infectivity quantified by plaque assay. We expected significant reductions of
the viral RNAs, and the viral infectivity in AQ treated samples as the drug stopped the
replication. As described in subheading 4.4, we selected the AQ concentration of 5 μM because
it was sufficient to inhibit DENV2 infectivity by ≥ 90% with no cytotoxic effect on BHK-21
cells. DENV2 infected BHK-21 cells (MOI of 1) were incubated for 72 h in the presence and
absence of AQ (5 μM). Intracellular RNAs were collected from cell lysates using TRIzol and
analyzed DENV2 NS1 by qRT-PCR. Extracellular RNAs were extracted using QIAamp kit from
culture supernatants (10 ml) concentrated using Amicon-15 and analyzed DENV2 NS1 by qRT-
PCR. The culture supernatants were also used to analysis DENV2 infectivity using plaque assay.
Each sample was tested in triplicate and results were confirmed by three independent
experiments. Results showed significant difference (p < 0.001) between the treated and untreated
groups (paired t test, two tailed) (Fig. 4.10). Therefore, AQ effectively inhibited DENV2
replication so that the levels of intracellular and extracellular RNAs, as well as DENV2
infectivity were all reduced. Noted that within AQ treated group, we did not observed any
significant difference between the levels of intracellular RNA and extracellular RNA, (unpaired
t-test, two tailed), as well as extracellular RNA and infectivity (unpaired t-test, two tailed) (Fig.
4.10).

64
4.6 Discussion
Our results taken together indicate that AQ inhibited DENV2 replication. First, using
Rluc reporter assays at two different incubation periods, 24 and 48 h, we observed similar
inhibition of viral replicon replication. Although EC50 and CC50 values were reduced at 48 h
incubation period compared to 24 h, TI values remained similar at 7.31 to 7.40 (Table 3.4, Fig.
4.1). The effect of AQ was not due to inhibition of Rluc enzyme activity as the drug did not have
any effect when added during cell lysis (Fig. 4.4). These results support the conclusion that the
reduction of Rluc activity when AQ was added to the DENV2 replicon expressing cells was due
to an inhibitory effect of AQ on DENV2 replicon replication. However, we did not observe a
corresponding reduction of DENV2 replicon RNA detected by qRT-PCR (Fig. 4.5). AQ potently
inhibited DENV2 infectivity measured by plaque assays of the extracellular virions, as well as by
measuring the intracellular and extracellular viral RNA levels using qRT-PCR (Fig. 4.10). AQ
inhibited DENV2 infectivity similarly in both viral loads (MOI of 1 and 0.01) (Fig. 4.9). In
conclusion, our results show that AQ inhibits DENV2 replication and infectivity.
AQ was first synthesized in the 1980s by addition of a 4-hydroxyanilino group to
chloroquine (CQ). AQ was proven effective against chloroquine-resistant strains of the parasite
Plasmodium falciparum (reviewed by (O'Neill et al., 1998)). In the 1990s, the drug was
withdrawn from use in long-term antimalarial prophylaxis due to its rare but serious side effects,
agranulocytosis and hepatotoxicity (WHO 1990; reviewed by (Olliaro and Mussano, 2003)).
Cochrane’s systematic review in 1996, however, supported the use of AQ for treatment of
uncomplicated malaria. The impact of this review forced WHO in 1997 to modify its
recommendation and AQ became an optional treatment of uncomplicated malaria (reviewed by
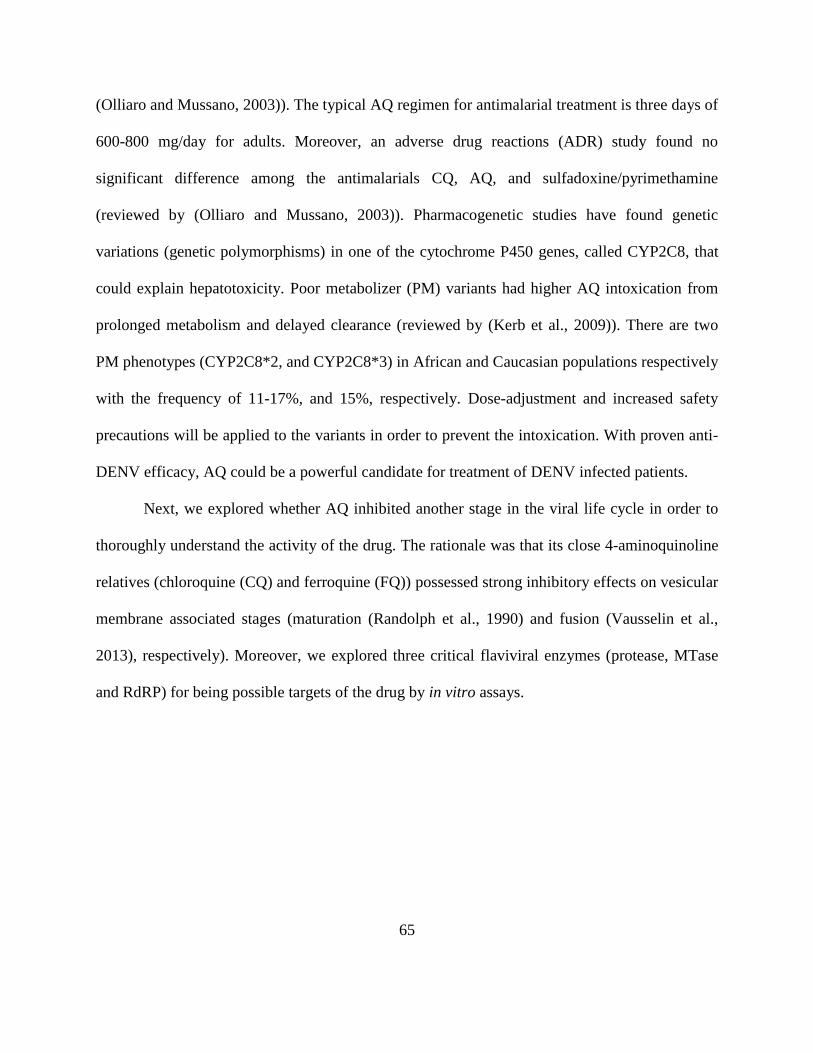
65
(Olliaro and Mussano, 2003)). The typical AQ regimen for antimalarial treatment is three days of
600-800 mg/day for adults. Moreover, an adverse drug reactions (ADR) study found no
significant difference among the antimalarials CQ, AQ, and sulfadoxine/pyrimethamine
(reviewed by (Olliaro and Mussano, 2003)). Pharmacogenetic studies have found genetic
variations (genetic polymorphisms) in one of the cytochrome P450 genes, called CYP2C8, that
could explain hepatotoxicity. Poor metabolizer (PM) variants had higher AQ intoxication from
prolonged metabolism and delayed clearance (reviewed by (Kerb et al., 2009)). There are two
PM phenotypes (CYP2C8*2, and CYP2C8*3) in African and Caucasian populations respectively
with the frequency of 11-17%, and 15%, respectively. Dose-adjustment and increased safety
precautions will be applied to the variants in order to prevent the intoxication. With proven anti-
DENV efficacy, AQ could be a powerful candidate for treatment of DENV infected patients.
Next, we explored whether AQ inhibited another stage in the viral life cycle in order to
thoroughly understand the activity of the drug. The rationale was that its close 4-aminoquinoline
relatives (chloroquine (CQ) and ferroquine (FQ)) possessed strong inhibitory effects on vesicular
membrane associated stages (maturation (Randolph et al., 1990) and fusion (Vausselin et al.,
2013), respectively). Moreover, we explored three critical flaviviral enzymes (protease, MTase
and RdRP) for being possible targets of the drug by in vitro assays.
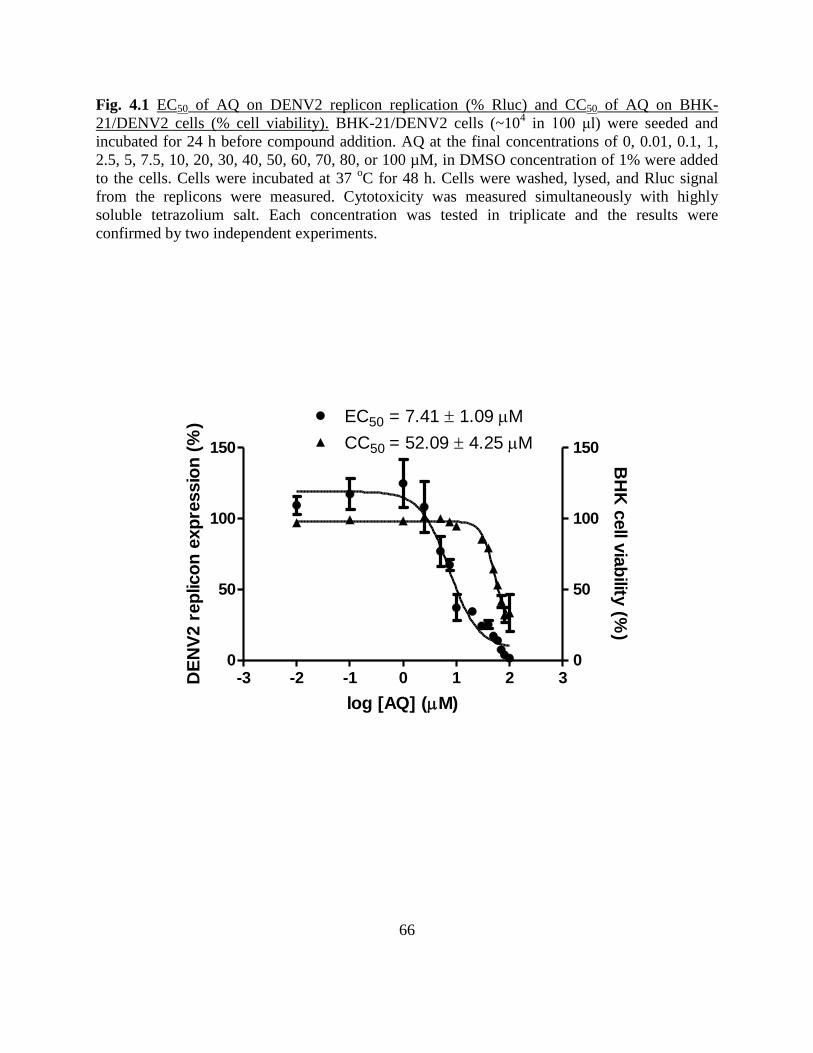
66
Fig. 4.1 EC50 of AQ on DENV2 replicon replication (% Rluc) and CC50 of AQ on BHK-
21/DENV2 cells (% cell viability). BHK-21/DENV2 cells (~104 in 100 μl) were seeded and
incubated for 24 h before compound addition. AQ at the final concentrations of 0, 0.01, 0.1, 1,
2.5, 5, 7.5, 10, 20, 30, 40, 50, 60, 70, 80, or 100 µM, in DMSO concentration of 1% were added
to the cells. Cells were incubated at 37 oC for 48 h. Cells were washed, lysed, and Rluc signal
from the replicons were measured. Cytotoxicity was measured simultaneously with highly
soluble tetrazolium salt. Each concentration was tested in triplicate and the results were
confirmed by two independent experiments.
-3 -2 -1 0 1 2 30
50
100
150
0
50
100
150
EC50 = 7.41 1.09 M
CC50 = 52.09 4.25 M
log [AQ] (M)
DE
NV
2 r
ep
lico
n e
xp
ressio
n (
%)
BH
K c
ell v
iab
ility (%
)

67
Fig. 4.2 EC50 of AQ on DENV4 replicon replication (% Rluc) and CC50 of AQ on Vero/DENV4
cells (% cell viability). Vero/DENV4 cells (~104 in 100 μl) were seeded and incubated for 24 h
before compound addition. AQ at the final concentrations of 0, 0.01, 0.1, 1, 2.5, 5, 7.5, 10, 20,
30, 40, 50, 60, 70, 80, or 100 µM, in DMSO concentration of 1% were added to the cells. Cells
were incubated at 37 oC for 48 h. Cells were washed, lysed, and Rluc signal from the replicons
were measured. Cytotoxicity was measured simultaneously with highly soluble tetrazolium salt.
Each concentration was tested in triplicate and the results were confirmed by two independent
experiments.
-3 -2 -1 0 1 2 30
50
100
150
200
0
50
100
150
200CC50 = 20.09 1.27 M
EC50 = 17.67 1.74 M
log [AQ] (M)
DE
NV
4 r
ep
lico
n e
xp
ressio
n (
%)
Vero
cell v
iab
ility (%
)
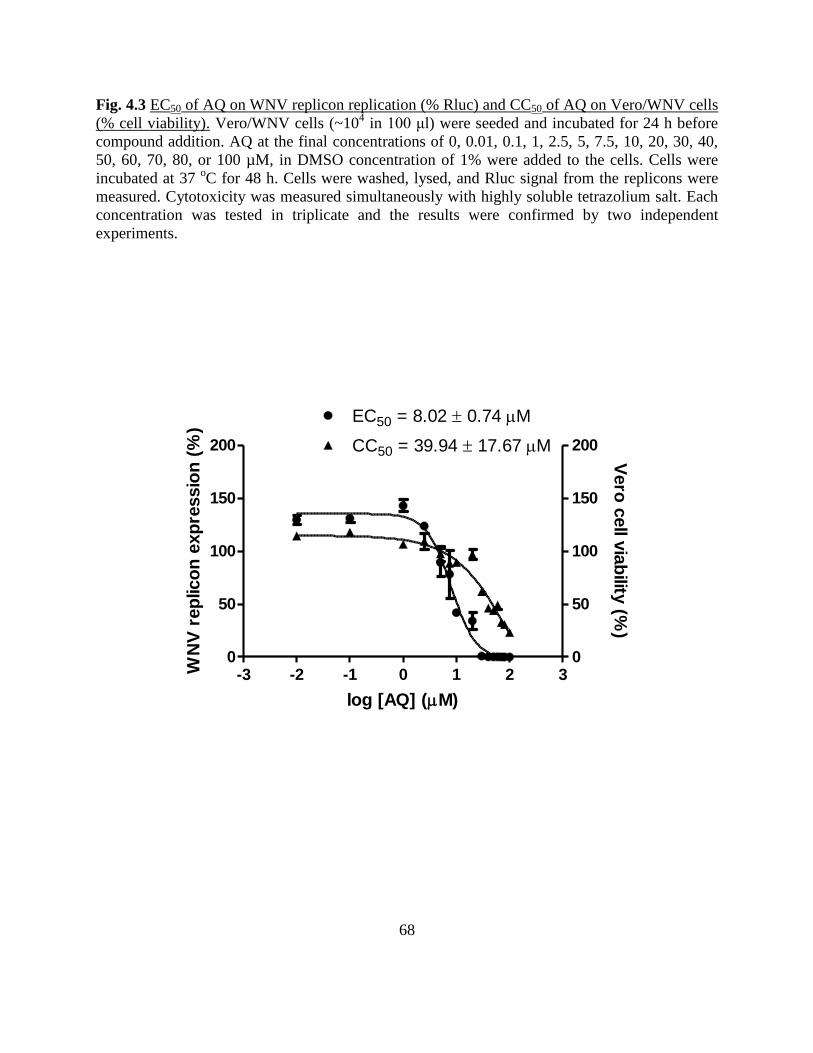
68
Fig. 4.3 EC50 of AQ on WNV replicon replication (% Rluc) and CC50 of AQ on Vero/WNV cells
(% cell viability). Vero/WNV cells (~104 in 100 μl) were seeded and incubated for 24 h before
compound addition. AQ at the final concentrations of 0, 0.01, 0.1, 1, 2.5, 5, 7.5, 10, 20, 30, 40,
50, 60, 70, 80, or 100 µM, in DMSO concentration of 1% were added to the cells. Cells were
incubated at 37 oC for 48 h. Cells were washed, lysed, and Rluc signal from the replicons were
measured. Cytotoxicity was measured simultaneously with highly soluble tetrazolium salt. Each
concentration was tested in triplicate and the results were confirmed by two independent
experiments.
-3 -2 -1 0 1 2 30
50
100
150
200
0
50
100
150
200CC50 = 39.94 17.67 M
EC50 = 8.02 0.74 M
log [AQ] (M)
WN
V r
ep
lico
n e
xp
ressio
n (
%)
Vero
cell v
iab
ility (%
)

69
Fig. 4.4 AQ effect on Rluc reporter. BHK-21/DENV2 cells (~104 in100 μl) were seeded and
incubated for 24 h at 37 oC. AQ at the final concentrations 0, 0.1, 1, 2.5, 5, 10, 25, or 100 µM in
DMSO concentration of 1% were added during cell lysis. The substrate was added and the Rluc
activities were measured.
-2 -1 0 1 2 30
50
100
log [AQ] (M)
% R
luc

70
Fig. 4.5 AQ effect of DENV2 RNA levels in BHK-21/DENV2 cells measured by qRT-PCR.
BHK-21/DENV2 cells (~2.5 x 10⁵ in 2.5 ml) were seeded and incubated overnight at 37
oC. AQ
at the final concentrations of 0, 0.1, 0.5, 1, 2.5, 5, 10, or 25 μM in DMSO concentration of 1%
were added. Cells were incubated at 37 oC for 48 h. Total RNAs were extracted from the cells by
treatment with TRIzol reagent. Sample RNA concentration was adjusted to 1 µg/µl. The region
of viral RNA encoding DENV2 NS1 and the housekeeping reference gene (GAPDH) were
quantified by qRT-PCR. Each sample was tested in triplicate and results were confirmed by two
independent experiments.
-1 0 1 20
1
2
3
log [AQ] (M)
rela
tive D
EN
V2 R
NA
co
pie
s
(pro
po
rtio
n t
o D
MS
O c
on
tro
l)
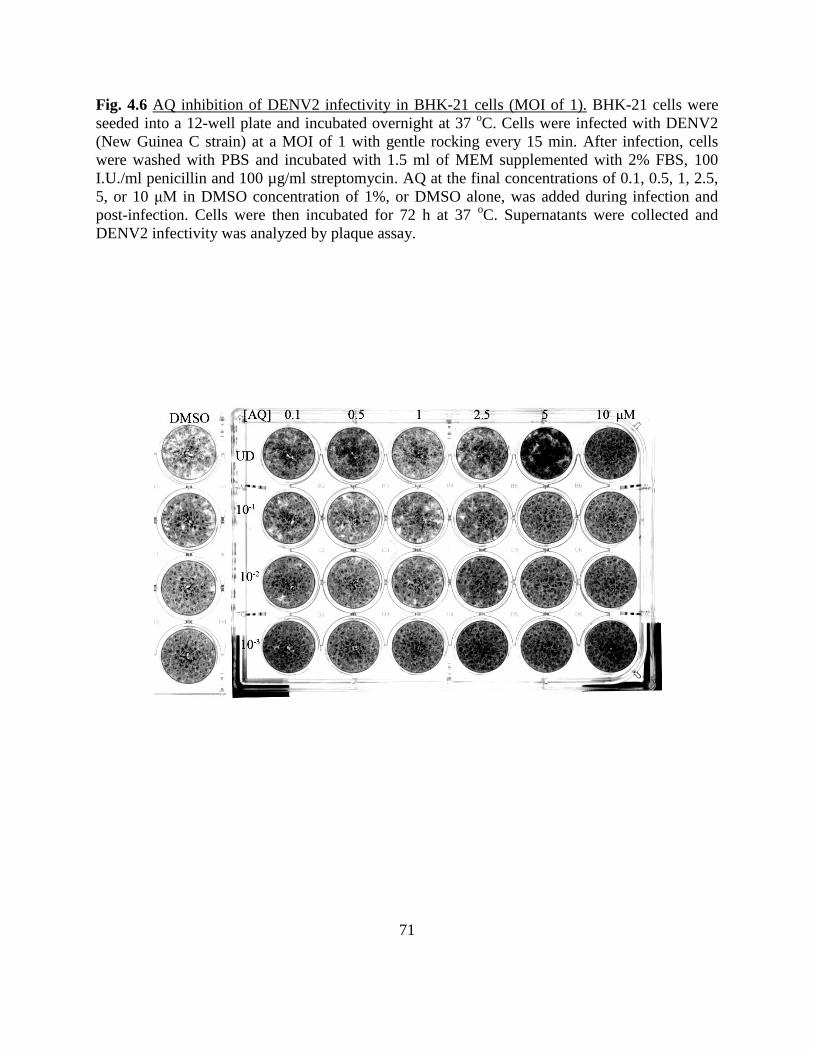
71
Fig. 4.6 AQ inhibition of DENV2 infectivity in BHK-21 cells (MOI of 1). BHK-21 cells were
seeded into a 12-well plate and incubated overnight at 37 oC. Cells were infected with DENV2
(New Guinea C strain) at a MOI of 1 with gentle rocking every 15 min. After infection, cells
were washed with PBS and incubated with 1.5 ml of MEM supplemented with 2% FBS, 100
I.U./ml penicillin and 100 µg/ml streptomycin. AQ at the final concentrations of 0.1, 0.5, 1, 2.5,
5, or 10 μM in DMSO concentration of 1%, or DMSO alone, was added during infection and
post-infection. Cells were then incubated for 72 h at 37 oC. Supernatants were collected and
DENV2 infectivity was analyzed by plaque assay.
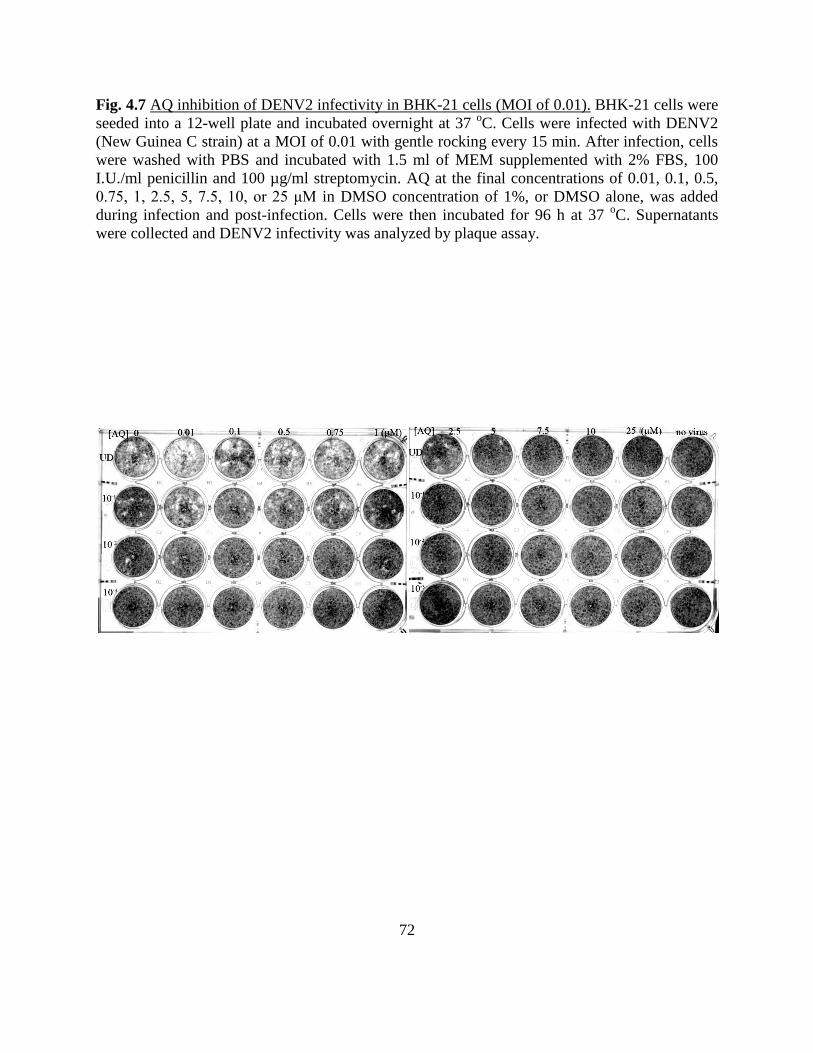
72
Fig. 4.7 AQ inhibition of DENV2 infectivity in BHK-21 cells (MOI of 0.01). BHK-21 cells were
seeded into a 12-well plate and incubated overnight at 37 oC. Cells were infected with DENV2
(New Guinea C strain) at a MOI of 0.01 with gentle rocking every 15 min. After infection, cells
were washed with PBS and incubated with 1.5 ml of MEM supplemented with 2% FBS, 100
I.U./ml penicillin and 100 µg/ml streptomycin. AQ at the final concentrations of 0.01, 0.1, 0.5,
0.75, 1, 2.5, 5, 7.5, 10, or 25 μM in DMSO concentration of 1%, or DMSO alone, was added
during infection and post-infection. Cells were then incubated for 96 h at 37 oC. Supernatants
were collected and DENV2 infectivity was analyzed by plaque assay.

73
Fig. 4.8 Titer (pfu/ml) showing AQ inhibition of DENV2 infectivity in BHK-21 cells (MOI of
0.01) from supernatants collected at 48, 72, 96 h post-infection. BHK-21 cells were seeded into a
12-well plate and incubated overnight at 37 oC. Cells were infected with DENV2 (New Guinea C
strain) at a MOI of 0.01 with gentle rocking every 15 min. After infection, cells were washed
with PBS and incubated with 1.5 ml of MEM supplemented with 2% FBS, 100 I.U./ml penicillin
and 100 µg/ml streptomycin. AQ at the final concentrations of 0.01, 0.1, 0.5, 0.75, 1, 2.5, 5, 7.5,
10, or 25 μM in DMSO concentration of 1%, or DMSO alone, was added during infection and
post-infection. Cells were then incubated for 96 h at 37 oC. Supernatants were collected at 48, 72,
and 96 h post-infection. DENV2 infectivity was analyzed by plaque assay. Each AQ
concentration was tested in duplicate and was confirmed by two independent experiments.
0 0.01 0.1 0.5 0.75 1 2.5 5 7.5 10 25100
101
102
103
104
48 h PI
72 h PI
96 h PI
[AQ] (M)
DE
NV
2 t
iter
(pfu
/ml)
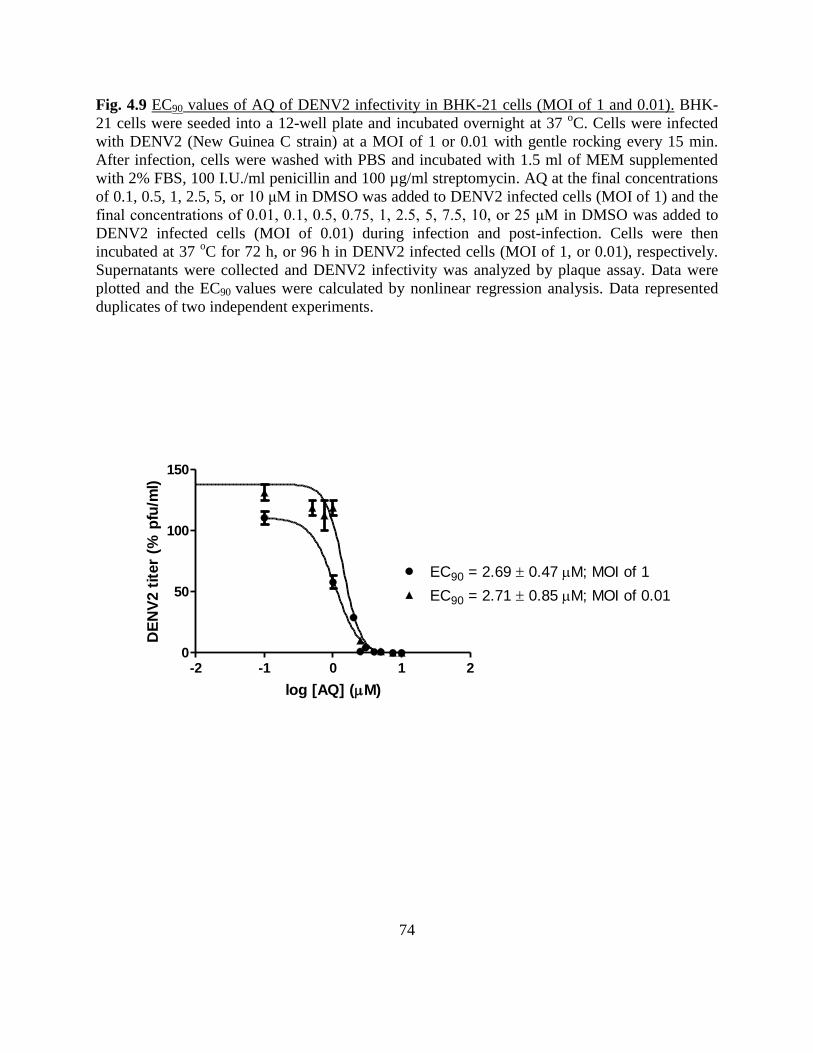
74
Fig. 4.9 EC90 values of AQ of DENV2 infectivity in BHK-21 cells (MOI of 1 and 0.01). BHK-
21 cells were seeded into a 12-well plate and incubated overnight at 37 oC. Cells were infected
with DENV2 (New Guinea C strain) at a MOI of 1 or 0.01 with gentle rocking every 15 min.
After infection, cells were washed with PBS and incubated with 1.5 ml of MEM supplemented
with 2% FBS, 100 I.U./ml penicillin and 100 µg/ml streptomycin. AQ at the final concentrations
of 0.1, 0.5, 1, 2.5, 5, or 10 μM in DMSO was added to DENV2 infected cells (MOI of 1) and the
final concentrations of 0.01, 0.1, 0.5, 0.75, 1, 2.5, 5, 7.5, 10, or 25 μM in DMSO was added to
DENV2 infected cells (MOI of 0.01) during infection and post-infection. Cells were then
incubated at 37 oC for 72 h, or 96 h in DENV2 infected cells (MOI of 1, or 0.01), respectively.
Supernatants were collected and DENV2 infectivity was analyzed by plaque assay. Data were
plotted and the EC90 values were calculated by nonlinear regression analysis. Data represented
duplicates of two independent experiments.
-2 -1 0 1 20
50
100
150
EC90 = 2.69 0.47 M; MOI of 1
EC90 = 2.71 0.85 M; MOI of 0.01
log [AQ] (M)
DE
NV
2 t
iter
(% p
fu/m
l)

75
Fig. 4.10 Confirmation of AQ inhibition of DENV2 replication and infectivity. BHK-21 cells
(105 cells in 1 ml) were seeded into a 12-well plate and incubated overnight at 37
oC. Cells were
infected with DENV2 (New Guinea C strain) at a multiplicity of infection (MOI) of 1 for 1 h at
37 oC under 5% CO2 with gentle rocking every 15 min. After infection, cells were washed with
PBS and incubated with 1.5 ml of MEM supplemented with 2% FBS, 100 I.U./ml penicillin and
100 µg/ml streptomycin. AQ (5 μM) in DMSO concentration of 1%, or DMSO alone, was added
during infection and post-infection. Cells were then incubated for 72 h at 37 oC. Intracellular
RNAs were extracted from the infected cells by treatment with TRIzol reagent. Sample RNA
concentration was adjusted to 1 µg/µl. The region of viral RNA encoding DENV2 NS1 and the
housekeeping reference gene (GAPDH) were quantified by qRT-PCR. Extracellular viral RNAs
were extracted from supernatants using the QIAamp viral RNA mini kit. The region of viral
RNA encoding DENV2 NS1 was quantified by qRT-PCR. Infectious virions were analyzed from
DENV2 infectivity measured by plaque assay. The relative amount from AQ (5 μM in DMSO
concentration of 1%) treated cells was based upon normalization to that of untreated cells
(DMSO concentration of 1%). Each sample was tested in duplicate and results were confirmed
by three independent experiments. Difference between AQ treated and DMSO treated groups
derived from each approach was evaluated by paired t-test, two tailed.
intrac
ellu
lar R
NA
extrac
ellu
lar RNA
infe
ctio
us vi
rion
0
50
100
DMSO
AQ (5 M)
*** p < 0.001
*** *** ***
% R
NA
co
pie
s o
r p
laq
ue f
orm
ati
on
rela
tive t
o D
MS
O t
reatm
en
t
76
CHAPTER 5
MODE OF ACTION AND TARGET IDENTIFICATION STUDY OF AQ INHIBITION OF DENV2
INFECTION
5.1. Time-course analysis of DENV2 infectivity
In this chapter, we asked the question whether AQ also inhibited any other stages of the
DENV2 life cycle. As an antimalarial drug, AQ had several mechanisms of action including
interfering with vesicular acidification and inhibiting RNA polymerase (reviewed by (O'Neill et
al., 1998)). Although the drug efficacy to overall DENV2 infectivity was not significantly
superior to DENV2 replication alone, the knowledge will strengthen our understanding of the
drug property and learn to maximize its potency. We started investigating the drug effect on
DENV2 infectivity pattern in time-course analysis with four different concentrations (0, 1, 5, 10,
25 μM) of AQ.
In this assay, we infected BHK-21 cells with DENV2 (MOI of 0.01) and collected the
supernatants at 4, 12, 24, 36, 48, 72, and 96 h post-infection. The drug was introduced to the
DENV2 infected cells during infection and post-infection. In the DMSO control (0 μM AQ), titer
of DENV2 infectivity gradually increased over time. The number of plaques (pfu/ml) was
significantly reduced in the presence of AQ in dose dependent manner (p < 0.05, one way
ANOVA) (Fig. 5.1-5.2). At 5 μM, plaque formation was reduced ≥ 90%, corresponding to
previous results on AQ efficacy. In addition, AQ was effectively inhibited DENV2 infectivity for
96 h period and did not require drug supplement at 48 h, or 72 h post-infection.

77
5.2. Effect of AQ on viral entry and early stages of the viral life cycle
To analyze the effect of AQ on viral entry, we used a direct plaque assay. A BHK-21
monolayer was infected with DENV2 (MOI of 0.01) in the presence of AQ (0, 1, 5, 10, 25 μM).
After washing with PBS, cells were maintained with overlay medium (MEM supplemented with
2% FBS, 100 I.U./ml penicillin and 100 µg/ml streptomycin, and 1% methylcellulose) and in the
absence of drug for 3-4 days. The plaques were fixed, stained and counted as described earlier.
Data obtained from this experiment is referred to as direct plaques (Fig. 5.3, dotted bars).
Indirect plaques (Fig. 5.3, clear bars) reflected the data obtained from the previous time-course
analysis after 96 h. Means and error bars represented duplicate results from two independent
experiments. Indirect plaques (Fig. 5.3, clear bars) showed significant inhibition of DENV2
infectivity by AQ at 5 μM compared with its DMSO control (p < 0.01, paired t-test, two-tailed).
However, with direct plaques, (Fig. 5.3, dotted bars), DENV2 infectivity by AQ at 5 μM was
not significantly different from its DMSO control. These results indicate that the 5 μM does not
inhibit DENV2 adsorption. However, the inhibition of DENV2 infectivity were increased to
69.23 ± 1.57 % and 82.70 ± 2.48 % by increasing the AQ concentrations to 10 and 25 μM,
respectively, during adsorption (Fig. 5.3, dotted bars). We concluded that the inhibition of
DENV2 entry by AQ was possible when the drug was provided in high dose (10 or 25 μM).
Since much higher concentrations of AQ were required to detect an effect on adsorption, AQ
seems to have its greatest effect post-infection.
In addition to direct plaque assay, we analyzed the levels of DENV2 infectivity
impairments with order of addition assay. The assay was designed to characterize compounds
with neutralization property (Schmidt et al., 2012). AQ was added to DENV2 infected BHK-21

78
cells in various orders mentioned as pre-incubation, co-infection and post-infection. Pre-
incubation was the addition of AQ (5 μM) to DENV2 (MOI of 1) and incubated for 15 min at 37
oC. The mixture was later used to infect BHK-21 cells. Co-infection was the addition of AQ (5
µM) to DENV2 (MOI of 1) during BHK-21 cells infection (adsorption). Post-infection was the
addition of AQ (5 µM) to BHK-21 cells after DENV2 infection was established. DENV2
infection was done by incubation of the virus at 37 oC under 5% CO2 for 1 h with gentle rocking
every 15 min. Supernatants were collected at 24, 48, and 72 h post-infection for analysis by
plaque assay (Fig. 5.4). Results indicated that the inhibitions of DENV2 infectivity by AQ were
maximized (≥ 90% plaque titer reduction from its DMSO control) when the drug was
administered post-infection for 48 and 72 h PI (Fig. 5.4, striped bars). From these results, the
major pathway for inhibition by AQ is obviously post-entry and fusion events. Late stages
including viral translation, replication, and assembly of the virus life cycle were involved. So far,
we have identified viral replication as the critical step affected by the drug.
5.3. Effect of AQ on late stages of the viral life cycle
Next, to pinpoint the post-infection stage of inhibition more precisely, we added AQ at 5
μM to DENV2 infected BHK-21 cells (MOI of 1) at 1, 3, 6, 9, 12, 15, 18, 21, 24, 30, and 36 h
post-infection. Supernatants were collected at 72 h post-infection and were analyzed for time-
dependent plaque reduction. The inhibition (≥ 90% plaque titer reduction) was found even when
the drug was added as late as 15 h post-infection (Fig. 5.5, left upper panel). At 21 h post-
infection and later time points, the drug lost its inhibitory effect to the viral infectivity. These
results support our conclusion that AQ inhibits a late stage in the DENV2 life cycle and that viral

79
replication is one of the drug targets. It is unlikely that AQ is a translation inhibitor because a
true translation inhibitor would lose its inhibitory effect within 12 h post-infection (Wang et al.,
2011). For more understanding, we also quantified viral RNAs by qRT-PCR from supernatants
(Fig. 5.5, right upper panel) and pellets (Fig. 5.5, middle panel) to measure extracellular and
intracellular viral RNA copy numbers, respectively. Extracellular viral RNA copy numbers in
AQ treated samples were at the limit of detection, but we still noticed the inhibition by AQ at
early time-points (Fig. 5.5, right upper panel). The inhibition of intracellular viral RNA copy
numbers by AQ (5 μM) was ≥ 90% at 1-12 h PI (Fig. 5.5, middle panel), and the inhibitory
effect declined when AQ was introduced at later time-points. DENV2 replication starts after 12 h
post-infection as suggested by rapidly increase of intracellular RNA levels in BHK-21 cells
quantified by qRT-PCR (Shrivastava et al., 2011). We concluded that AQ effectively inhibited
viral replication in the infected cells when introduced prior to 15 h post-infection. To validate the
intracellular viral RNA quantification, GAPDH was analyzed and its Ct value was reported side
by side to the Ct value of DENV2 NS1 (Fig. 5.5, lower panels).
In addition, we modified a time of addition assay focusing on the first 12 h post-infection
to study the viral translation. Results indicated an effective inhibition of AQ when the drug was
introduced at 1, 2, 3, 4, 5, 6, 8, 10, or 12 h post-infection (Fig. 5.6). The true translation inhibitor
completely lost its efficacy by 12 h post-infection (Wang et al., 2011). Therefore, AQ was
unlikely a translation inhibitor.
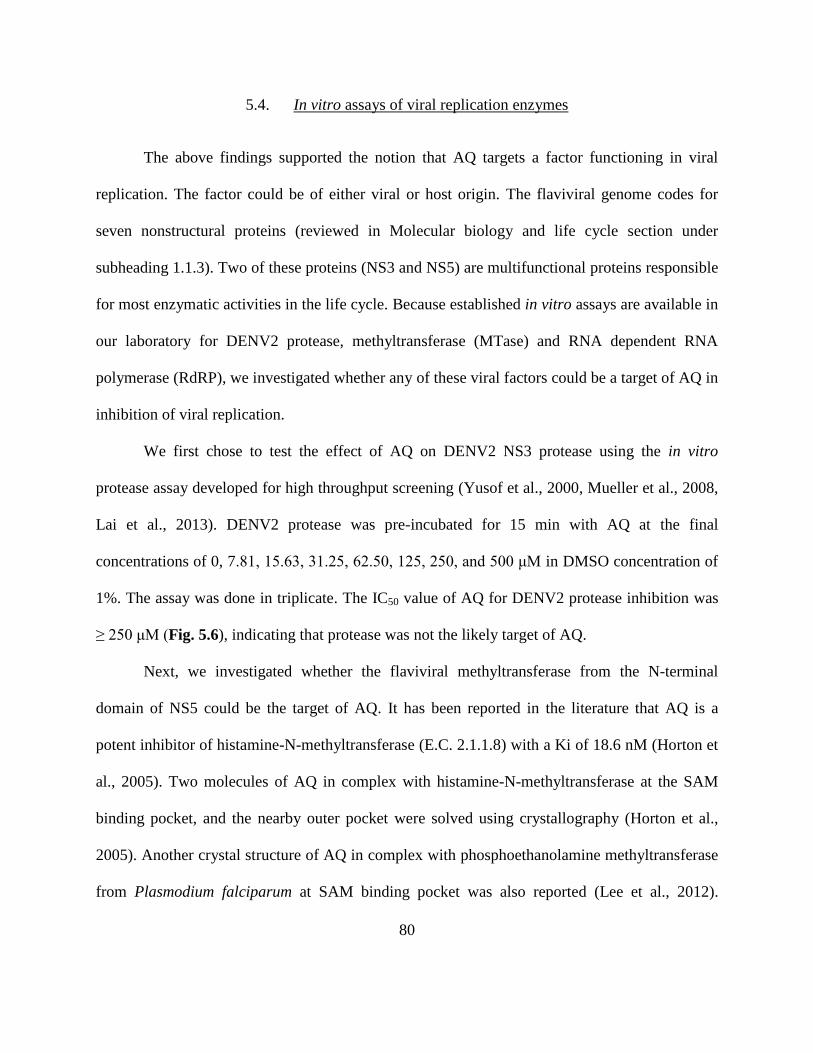
80
5.4. In vitro assays of viral replication enzymes
The above findings supported the notion that AQ targets a factor functioning in viral
replication. The factor could be of either viral or host origin. The flaviviral genome codes for
seven nonstructural proteins (reviewed in Molecular biology and life cycle section under
subheading 1.1.3). Two of these proteins (NS3 and NS5) are multifunctional proteins responsible
for most enzymatic activities in the life cycle. Because established in vitro assays are available in
our laboratory for DENV2 protease, methyltransferase (MTase) and RNA dependent RNA
polymerase (RdRP), we investigated whether any of these viral factors could be a target of AQ in
inhibition of viral replication.
We first chose to test the effect of AQ on DENV2 NS3 protease using the in vitro
protease assay developed for high throughput screening (Yusof et al., 2000, Mueller et al., 2008,
Lai et al., 2013). DENV2 protease was pre-incubated for 15 min with AQ at the final
concentrations of 0, 7.81, 15.63, 31.25, 62.50, 125, 250, and 500 μM in DMSO concentration of
1%. The assay was done in triplicate. The IC50 value of AQ for DENV2 protease inhibition was
≥ 250 μM (Fig. 5.6), indicating that protease was not the likely target of AQ.
Next, we investigated whether the flaviviral methyltransferase from the N-terminal
domain of NS5 could be the target of AQ. It has been reported in the literature that AQ is a
potent inhibitor of histamine-N-methyltransferase (E.C. 2.1.1.8) with a Ki of 18.6 nM (Horton et
al., 2005). Two molecules of AQ in complex with histamine-N-methyltransferase at the SAM
binding pocket, and the nearby outer pocket were solved using crystallography (Horton et al.,
2005). Another crystal structure of AQ in complex with phosphoethanolamine methyltransferase
from Plasmodium falciparum at SAM binding pocket was also reported (Lee et al., 2012).

81
Flaviviral methyltransferase was responsible for N7 and 2’O methylations (Ray et al., 2006,
Dong et al., 2008a). In this study, we used NS5FL for the assay because its catalytic efficiency is
higher than that of the MTase domain alone (Fig. 9.6). DENV2 MTase was pre-incubated for 15
min with AQ at final concentrations of 0, 100, 200, 400, 600, 800, and 1000 μM in water. The
results showed no inhibition of DENV2 MTase with AQ concentrations upto 1 mM (Fig. 5.7,
upper panel). The values represent the mean and standard error of triplicate results from the
experiment (Fig. 5.7, lower panel). We concluded that DENV2 methyltransferase was not the
target of AQ drug.
Since multiple lines of evidence were consistent with inhibition of replication by AQ, we
examined whether RNA synthesis by the flaviviral RdRP might be the target of AQ. Both
positive (+) and negative (-) strand RNAs were used as templates in an in vitro RdRP assay in
the presence of 50 µM AQ for 60 min. Inhibition of RdRP activity by AQ was only 10.58 ± 0.94
% for positive strand synthesis and -17.12 ± 4.37 % for the negative strand synthesis (Fig. 5.8,
upper panel), implying that flaviviral RdRP is not a likely target of AQ. The values represent
the mean and standard error of triplicate results from the experiment (Fig. 5.8, lower panel).
5.5. Discussion
In this section, we studied the mode of inhibition of DENV2 replication and infectivity
by AQ and investigated potential targets of AQ using in vitro enzyme assays. Time-course
analysis suggested that the drug was stable and persistently inhibited DENV2 infectivity up to 96
h post infection. We also learned that viral entry and internalization was partially inhibited by the
drug but the major effect of drug occurred at a late stage of the viral life cycle. AQ was

82
ineffective to inhibit replication that is already established as seen in the time of addition assay.
The drug was less effective when added later than 15 h post-infection measured by intracellular
RNAs, and 18 h post-infection as measured by viral infectivity. It was unlikely that post
replication processes are affected since AQ treatment had a similar quantitative effect on the
amount of intracellular and extracellular RNAs (Fig. 4.10).
Viral replication requires both viral and host factors (reviewed by (Sampath and
Padmanabhan, 2009, Bollati et al., 2010, Nagy and Pogany, 2012). Our findings excluded some
enzymatic activities of NS3 and NS5 as targets of AQ. It is possible that AQ targets a
nonstructural protein without an enzymatic function. Isolation and characterization of AQ
resistant mutants and mapping these mutations by sequence analysis might reveal the identity of
the viral targets, assuming viral proteins are the target. Although most DENV2 infected BHK-21
cells die within 12 days under 5 μM AQ selective pressure (unpublished results), a longer
incubation period, up to 30 days, might reveal an escape mutant. An in vitro RdRP system
(Ackermann and Padmanabhan, 2001, Nomaguchi et al., 2003) could provide an insight into
whether the initiation factors of viral replication are targets of AQ. Although the flaviviral
replication complex is not fully understood, some host components have been identified and
characterized (reviewed by (Nagy and Pogany, 2012)). Searching for potential AQ targets could
start with an examination of identified host factors necessary to provide optimal conditions for
initiation of viral replication.
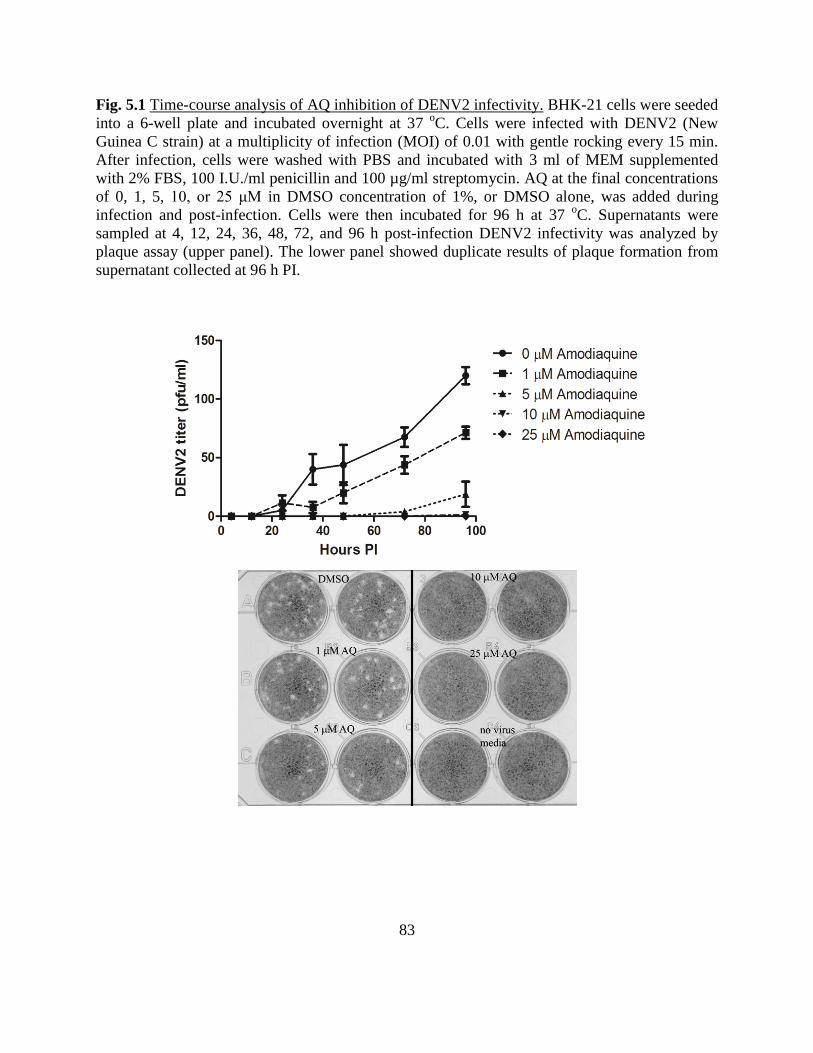
83
Fig. 5.1 Time-course analysis of AQ inhibition of DENV2 infectivity. BHK-21 cells were seeded
into a 6-well plate and incubated overnight at 37 oC. Cells were infected with DENV2 (New
Guinea C strain) at a multiplicity of infection (MOI) of 0.01 with gentle rocking every 15 min.
After infection, cells were washed with PBS and incubated with 3 ml of MEM supplemented
with 2% FBS, 100 I.U./ml penicillin and 100 µg/ml streptomycin. AQ at the final concentrations
of 0, 1, 5, 10, or 25 μM in DMSO concentration of 1%, or DMSO alone, was added during
infection and post-infection. Cells were then incubated for 96 h at 37 oC. Supernatants were
sampled at 4, 12, 24, 36, 48, 72, and 96 h post-infection DENV2 infectivity was analyzed by
plaque assay (upper panel). The lower panel showed duplicate results of plaque formation from
supernatant collected at 96 h PI.

84
Fig. 5.2 Measurement of AQ inhibition of DENV2 infectivity by direct plaque assay. BHK-21
cells (~105 cells in 1 ml) were seeded into a 12-well plate and incubated at 37
oC until reaching
90% confluence. AQ at final concentrations of 0, 1, 5, 10, or 25 µM in DMSO concentration of
1% were added to DENV2 (MOI of 0.01) during adsorption for 1 h at 37oC with gentle rocking
every 15 min. Cells were washed with PBS and maintained with overlay medium (MEM
supplemented with 2% FBS, 100 I.U/ml penicillin and 100 µg/ml streptomycin, and 1%
methylcellulose). AQ was not present in the overlay medium post-infection. Plaque formation
(pfu/ml) after 3-4 days incubation was normalized using AQ at 0 µM as 100%. Indirect plaque
assay was performed by addition of AQ at 0, 1, 5, 10, 25 µM in DMSO concentration of 1%
during DENV2 infection (MOI of 0.01), and post-infection for 96 h. Supernatants were collected
at 96 h PI for DENV2 infectivity analysis. Titer (pfu/ml) was normalized to using AQ at 0 µM
as 100%. Data represented means and SEM of two independent experiments.
DM
SO M1
M5
M10
M
25
Med
ia
0
50
100
150
Direct plaque
Indirect plaque
DE
NV
2 t
iter
(% p
fu/m
l)

85
Fig. 5.3 Order of addition assay. BHK-21 cells (~105 cells in 1 ml) were seeded into a 12-well
plate and incubated overnight at 37 oC. AQ (5 µM in DMSO concentration of 1%) and DENV2
(MOI of 1) were assayed by 1) pre-incubation of drug and virus at 37 oC for 15 min before
adsorption for 1 h, 2) co-infection of drug and virus for 1 h, or 3) post-infection of drug after
viral adsorption and PBS wash. Supernatants were collected at 24, 48, and 72 h post-infection for
analysis by plaque assay. DMSO (concentration of 1%) was used as a mock treatment. Error bars
indicated the standard error of the means of experiments done in duplicate. The assay was
performed in duplicate and confirmed by two independent experiments.
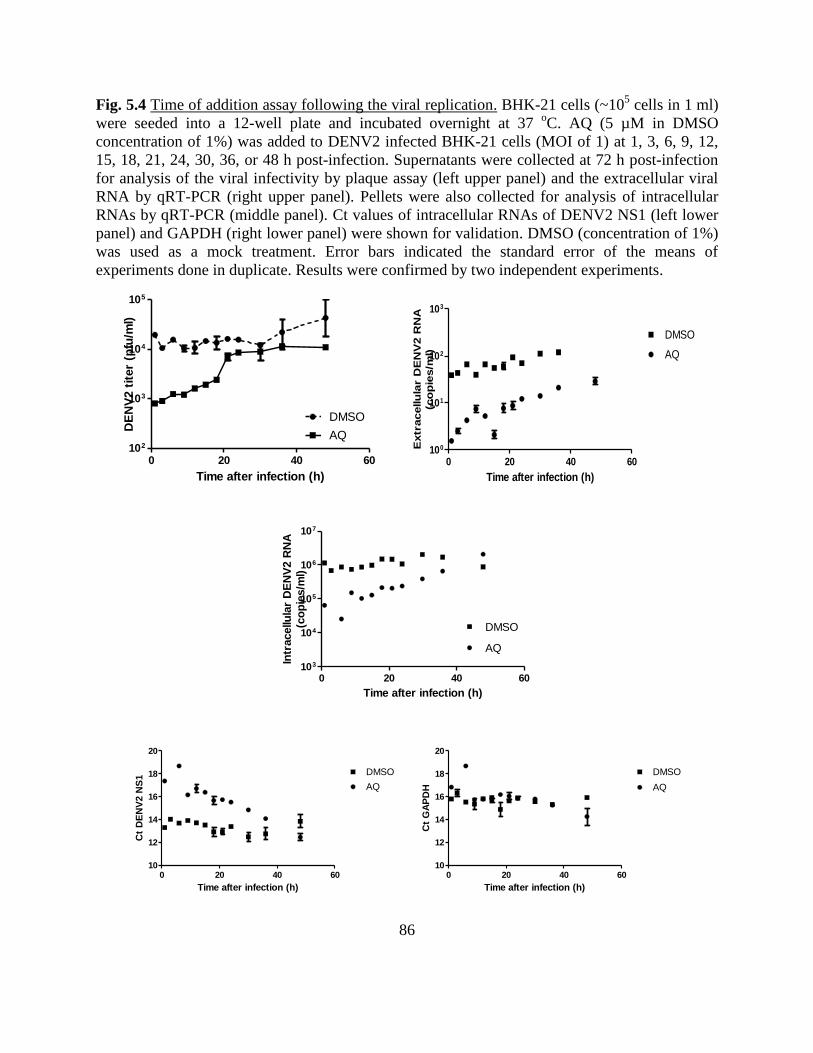
86
Fig. 5.4 Time of addition assay following the viral replication. BHK-21 cells (~105 cells in 1 ml)
were seeded into a 12-well plate and incubated overnight at 37 oC. AQ (5 µM in DMSO
concentration of 1%) was added to DENV2 infected BHK-21 cells (MOI of 1) at 1, 3, 6, 9, 12,
15, 18, 21, 24, 30, 36, or 48 h post-infection. Supernatants were collected at 72 h post-infection
for analysis of the viral infectivity by plaque assay (left upper panel) and the extracellular viral
RNA by qRT-PCR (right upper panel). Pellets were also collected for analysis of intracellular
RNAs by qRT-PCR (middle panel). Ct values of intracellular RNAs of DENV2 NS1 (left lower
panel) and GAPDH (right lower panel) were shown for validation. DMSO (concentration of 1%)
was used as a mock treatment. Error bars indicated the standard error of the means of
experiments done in duplicate. Results were confirmed by two independent experiments.
0 20 40 60102
103
104
105
DMSO
AQ
Time after infection (h)
DE
NV
2 t
iter
(pfu
/ml)
0 20 40 60100
101
102
103
AQ
DMSO
Time after infection (h)
Extr
acellu
lar D
EN
V2 R
NA
(co
pie
s/m
l)
0 20 40 60103
104
105
106
107
AQ
DMSO
Time after infection (h)
Intr
acellu
lar
DE
NV
2 R
NA
(co
pie
s/m
l)
0 20 40 6010
12
14
16
18
20
AQ
DMSO
Time after infection (h)
Ct
DE
NV
2 N
S1
0 20 40 6010
12
14
16
18
20
AQ
DMSO
Time after infection (h)
Ct
GA
PD
H
87
Fig. 5.5 Time of addition assay following the viral translation. BHK-21 cells (~105 cells in 1 ml)
were seeded into a 12-well plate and incubated overnight at 37 oC. AQ (5 µM in DMSO
concentration of 1%) or DMSO alone (concentration of 1%) was added to DENV2 (MOI of 1) at
1, 2, 3, 4, 5, 6, 8, 10, 12, 24, or 48 h post-infection. Supernatants were collected at 48 h post-
infection for analysis by plaque assay. Error bars indicated the standard error of the means of
experiments done in duplicate.
0 10 20 30 40 50101
102
103
104
DMSO
AQ
Time after infection (h)
DE
NV
2 t
iter
(pfu
/ml)

88
Fig. 5.6 AQ inhibition of DENV2 protease in vitro. The reaction mixture (100 μl) contained 200
mM Tris-HCl, pH 9.5, 30% glycerol, 0.1% CHAPS, 1% DMSO, 50 nM DENV2 NS2BH-(QR)-
NS3pro enzyme (Yon et al., 2005), 10 µM fluorogenic tetrapeptide substrate, Bz-Nle-Lys-Arg-
Arg-AMC, and 0, 7.81, 15.63, 31.25, 62.5, 125, 250, or 500 μM AQ in DMSO concentration of
1% at final. The compound-enzyme mixture was pre-incubated for 15 min at room temperature
before addition of the substrate. The reaction was continued at 37 οC for 30 min. DMSO alone
(concentration of 1%) was used as the no-inhibitor control (100% protease activity) and the
bovine pancreatic trypsin inhibitor (BPTI, also known as aprotinin), which has a Ki of 26 nM
against the DENV2 protease, was used at 5 µM in DMSO concentration of 1% as a positive
control (0% protease activity). Data were plotted and the IC50 value was calculated by nonlinear
regression analysis.
IC50 > 250 μM

89
Fig. 5.7 AQ inhibition of DENV2 MTase in vitro. The radiolabeled cap of RNAnt1-200 substrate (1
μg) was methylated in the reaction containing 50 mM Tris-HCl, pH 7.5, 10 mM KCl, 2 mM
MgCl2, 1 mM dithiothreitol, 4 units RNase Inhibitor, 500 nM DENV2 NS5FL, and 0, 100, 200,
400, 600, 800, or 1000 μM AQ in water. The compound-enzyme mixture was pre-incubated for
15 min at room temperature before addition of the substrate, 400 nM S-adenosylmethionine
(SAM). The reaction was incubated at 37 oC for 1 h. RNA was extracted and treated with
nuclease P1. The products were fractionated by thin layer chromatography (TLC) on cellulose
PEI plate using 0.45 M ammonium sulfate as solvent (upper panel). Radioactive guanine cap
analogs were quantified by phosphoimaging. (lower panel).
[AQ] (μM)
7MeGpppA2’ OMe GpppA2’ OMe GpppA
mean SEM mean SEM mean SEM
no enzyme 8.93 0.07 14.84 0.14 41.77 0.11
0 (DMSO) 25.07 0.32 24.23 0.05 26.37 0.26
100 26.63 0.30 26.24 0.05 24.79 0.14
200 22.01 0.59 22.74 0.31 28.91 0.31
400 22.87 0.19 23.13 0.31 28.52 0.10
600 18.26 0.39 20.71 0.10 32.23 0.20
800 23.03 0.17 24.97 0.05 27.47 0.23
1000 21.60 0.36 22.75 0.23 29.34 0.41
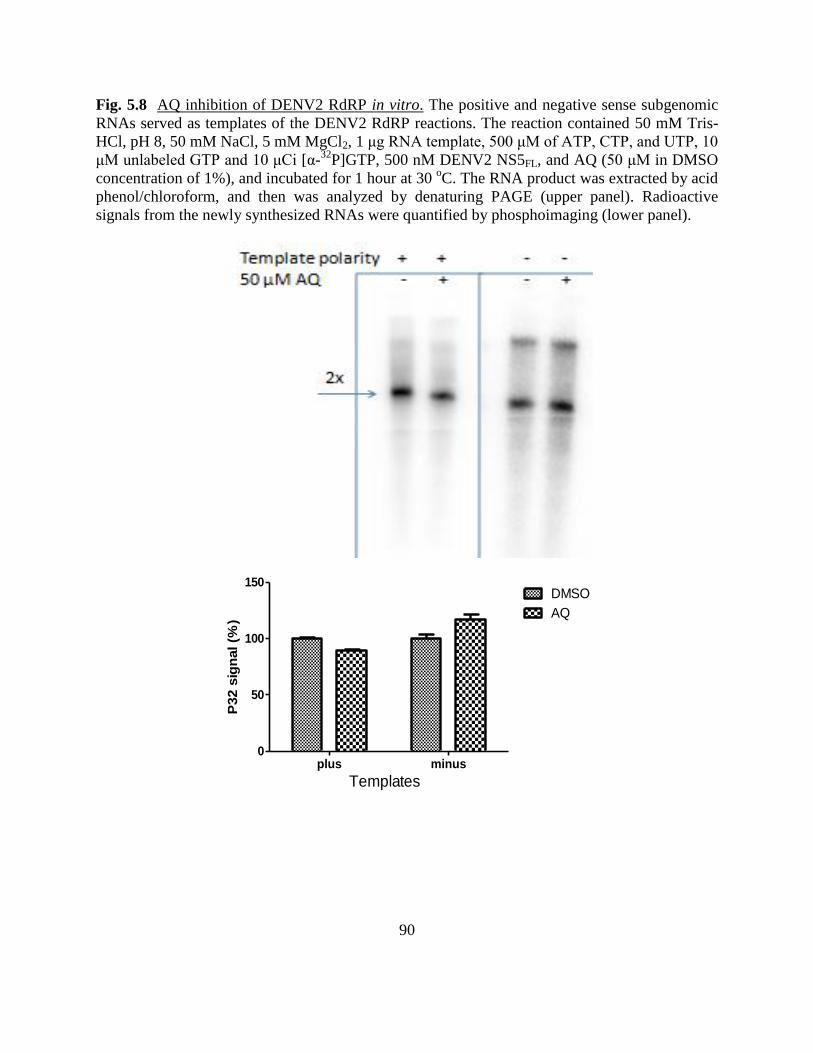
90
Fig. 5.8 AQ inhibition of DENV2 RdRP in vitro. The positive and negative sense subgenomic
RNAs served as templates of the DENV2 RdRP reactions. The reaction contained 50 mM Tris-
HCl, pH 8, 50 mM NaCl, 5 mM MgCl2, 1 μg RNA template, 500 μM of ATP, CTP, and UTP, 10
μM unlabeled GTP and 10 μCi [α-32
P]GTP, 500 nM DENV2 NS5FL, and AQ (50 μM in DMSO
concentration of 1%), and incubated for 1 hour at 30 oC. The RNA product was extracted by acid
phenol/chloroform, and then was analyzed by denaturing PAGE (upper panel). Radioactive
signals from the newly synthesized RNAs were quantified by phosphoimaging (lower panel).
plus minus0
50
100
150DMSO
AQ
P32 s
ign
al (%
)
Templates

91
CHAPTER 6
STRUCTURE-ACTIVITY RELATIONSHIP STUDY OF AQ AND DERIVATIVES USING A DENV2
INFECTIVITY ASSAY
6.1. Diethylaminomethyl group
From the analysis of AQ and its derivatives using BHK-21/DENV2 cells (subheading
3.2), compounds lacking a diethylaminomethyl group (AQD5 and AQD8) failed to inhibit
replicon replication. The EC50 values were ~100 μM (Table 3.4), at least 10 fold higher than that
of AQ. We chose AQD8 for further study using the infectivity assay. AQD8 at various
concentrations was added to DENV2 infected BHK-21 cells (MOI of 1). After 72 h incubation,
supernatants were collected for plaque assay. Results showed an EC90 of AQD8 at 31.20 ± 5.15
μM (Fig. 6.1), which is > 20 fold higher than that of AQ (EC90 of 2.69 ± 0.47 μM). Thus, AQD8
failed not only to inhibit replicon replication, but also failed to suppress the viral infectivity. We
concluded that the diethylaminomethyl group was a key chemical structure AQ contributing to
inhibition of DENV2 replication and infectivity.
6.2. p-hydroxyanilino group
Recently, Farias et al. (Farias et al., 2013) demonstrated CQ as an inhibitor of DENV2
infectivity in Vero cells. We also found that CQ inhibited DENV2 infectivity (MOI of 1) in
BHK-21 cells (EC90 = 5.04 ± 0.72 μM) (Fig. 6.1), but not DENV2 replicon replication (Fig. 3.1).
CQ at 100 μM increased prM/M composition of gradient-purified DENV2 extracellular virions
(Randolph et al., 1990), suggesting that the drug inhibits virion maturation. Based on our

92
findings, we hypothesized that AQ and CQ inhibited DENV2 infectivity by different
mechanisms.
6.3. Discussion
Due to limited availability of AQ derivatives, we could not thoroughly study structure-
activity relationship of AQ. However, we obtained an important piece of information from the
analysis of derivatives AQD5 and AQD8. We concluded that the presence of a
diethylaminomethyl group was crucial for AQ to be active. Also, CQ was widely studied as an
antiviral agent against many viruses including DENV2. CQ inhibited DENV2 infectivity by
interfering with prM to M cleavage of the virion maturation. Moreover, ferroquine (FQ), a CQ
derivative structurally similar to AQ, inhibited HCV infection at an early step by interfering with
fusion (Vausselin et al., 2013) and had minor inhibitory effects on viral replication and assembly.
From the currently available data, we conclude that each quinoline compound inhibits flaviviral
infection with a unique mechanism of action.
Structurally, AQ contains intramolecular H-bonding (Warhurst et al., 2003) between the
hydroxyl group of 4-aniline ring and N of diethylaminomethyl group. This bond generates an
angle between the quinoline and the aniline rings (reviewed by (O'Neill et al., 1998)). This
special character is absent in CQ since CQ does not possess an electron donor (hydroxyl group)
for H-bonding. Since CQ was not a potent inhibitor of replicon replication, we hypothesized that
the angular structure might be involved in contributing to replication inhibition. Future work on
lead optimization should focus on modification of AQ taking into consideration this
intramolecular H-bonding.
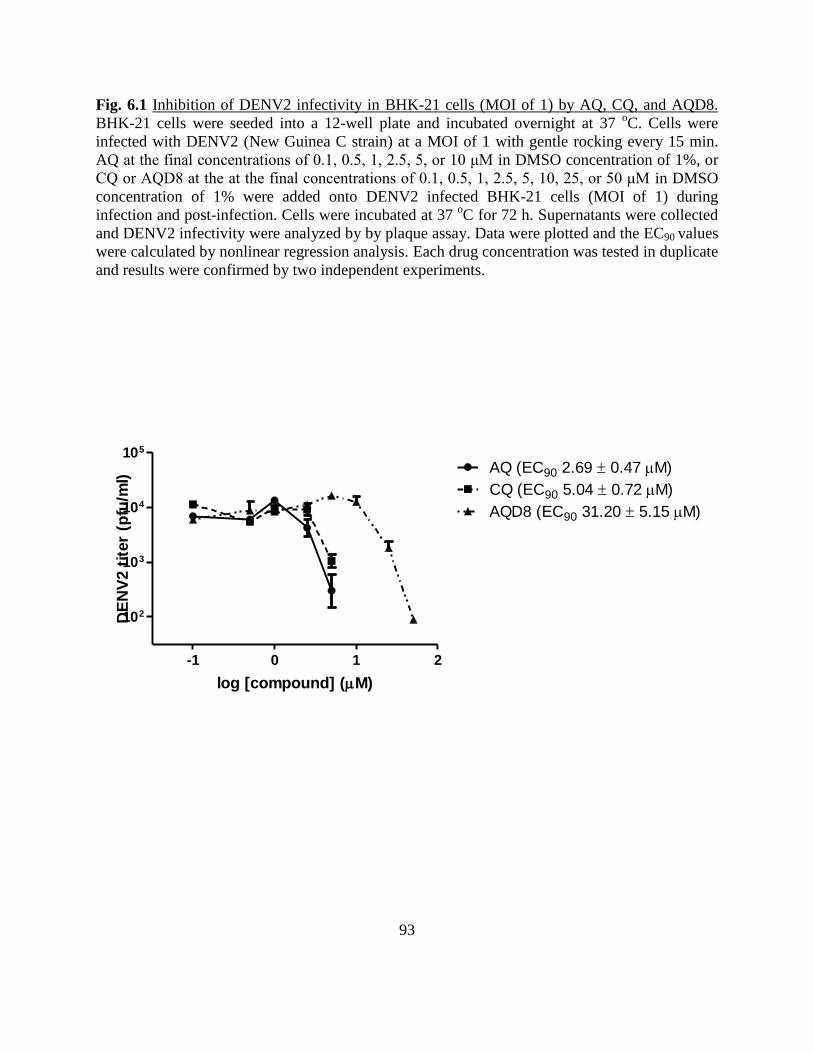
93
Fig. 6.1 Inhibition of DENV2 infectivity in BHK-21 cells (MOI of 1) by AQ, CQ, and AQD8.
BHK-21 cells were seeded into a 12-well plate and incubated overnight at 37 oC. Cells were
infected with DENV2 (New Guinea C strain) at a MOI of 1 with gentle rocking every 15 min.
AQ at the final concentrations of 0.1, 0.5, 1, 2.5, 5, or 10 μM in DMSO concentration of 1%, or
CQ or AQD8 at the at the final concentrations of 0.1, 0.5, 1, 2.5, 5, 10, 25, or 50 μM in DMSO
concentration of 1% were added onto DENV2 infected BHK-21 cells (MOI of 1) during
infection and post-infection. Cells were incubated at 37 oC for 72 h. Supernatants were collected
and DENV2 infectivity were analyzed by by plaque assay. Data were plotted and the EC90 values
were calculated by nonlinear regression analysis. Each drug concentration was tested in duplicate
and results were confirmed by two independent experiments.
-1 0 1 2
102
103
104
105
AQ (EC90 2.69 0.47 M)
CQ (EC90 5.04 0.72 M)
AQD8 (EC90 31.20 5.15 M)
log [compound] (M)
DE
NV
2 t
iter
(pfu
/ml)

94
CHAPTER 7
CONCLUSION AND FUTURE DIRECTION I
In the past decade, drug repositioning was one of the major areas of activity in academic
drug discovery (Oprea et al., 2011). The field requires a multidisciplinary collaboration from
basic, translational, to clinical research, and often times, new mode of actions of the approved
drugs have been discovered. Examples of drugs or classes of drugs are raltegravir,
cyclobenzaprine, benzbromarone, mometasone furoate, astemizole, R-naproxen, ketorolac,
tolfenamic acid, phenothiazines, methylergonovine maleate and beta-adrenergic receptor
drugs. Based on this idea and our previous data on 8-OHQ inhibiting flaviviruses (Mueller et al.,
2008, Lai et al., 2013), we looked into related quinolone compounds for possible antiviral
properties. Quinoline derivatives have been widely studied as antimalarial drugs since the 1900s
((O'Neill et al., 1998). However, several FDA-approved drugs were discontinued due to
emergence of drug resistance. Drug resistant pathogens are a serious problem for long-term
treatment regimens. However, since DENV causes acute infections, emergence of drug resistant
strains of DENV may not be a serious concern.
AQ is an FDA-approved drug and is currently prescribed to treat uncomplicated malaria
(600-800 mg/day for 3 days). As discussed in Chapter 4, extensive pharmacogenetic and toxicity
studies have given clinically useful information for dose-adjustment and increased safety
precautions for poor metabolizer patients.
A series of experiments were done to validate AQ efficacy against DENV2 replicon
replication. AQ effectively inhibited DENV2 replicon replication measured by Rluc expression.
In two different experimental settings, we showed that AQ inhibited DENV2 replicon replication
95
with a consistent therapeutic index of 7.3 and 7.4. The inhibition was not due to the drug
interfering with the Rluc reporter activity. However, there was no reduction in replicon RNA
levels between AQ-treated and untreated DENV2/BHK-21 cells measured by qRT-PCR. On the
other hand, AQ effectively inhibited DENV2 infectivity with an EC90 of 2.69 ± 0.40 μM as
determined by plaque assays. We also detected corresponding significant reductions of
intracellular RNA, extracellular RNA, and infectious virions in DENV2 infected BHK-21 cells.
Our results suggested that AQ is a potentially good antiviral compound for treatment of DENV
infection.
We studied the mode of action of AQ in order to understand the drug’s effect at each
stage of the virus life cycle. Time-course analysis indicated that the drug was stable and effective
until at least 96 h post-infection. Early stages including viral attachment, internalization, and
fusion were slightly affected by the drug. However, the viral replication step was strongly
affected by the drug. Inhibition of viral replication was maximized when AQ was added to
DENV2 infected BHK-21 cells within 15 h post-infection. Data from the in vitro enzyme assays
indicated that AQ did not target viral protease, methyltransferase, or RNA-dependent RNA
polymerase. It is tempting to speculate that AQ’s target is likely to be a component of viral
replicase complex involved in the assembly of the complex, replication initiation, or viral
replication. Deciphering the exact mechanism of action of the drug would be useful in lead
optimization.
Structurally similar quinolines, chloroquine (CQ) and ferroquine (FQ), were also shown
to inhibit infectivity of DENV2 (Farias et al., 2013), and HCV (Vausselin et al., 2013),
respectively. Although these drugs acted at different stages, their mechanisms of action were
96
strongly associated with acidification of endosomes. However, we did not find any correlation
between AQ and vesicular acidification in our study. Our structure-activity relationship study
revealed the importance of diethylaminomethyl group of AQ for its antiviral activity.
As a follow-up to our in vitro studies, we will be studying the efficacy of AQ in vivo
using the AG129 mouse model of DENV pathogenesis (Johnson and Roehrig, 1999) (Williams
et al., 2009) (Calvert et al., 2006, Kyle et al., 2008, Perry et al., 2011, Tan et al., 2011). AG129
mouse has IFN-α/β and IFN-γ receptor deficiencies and is used for testing the efficacy of not
only antivirals (Schul et al., 2007) (Schul et al., 2013) (Lim et al., 2013) (Chen et al., 2010) but
also candidate vaccines for DENV (Huang et al., 2003) (Johnson and Roehrig, 1999) (Suzuki et
al., 2009, Brewoo et al., 2012). Available data on AQ pharmacology and toxicology will be
useful in designing proper dosing regimen in mice. According to the Registry of Toxic Effects of
Chemical Substances (RTECS, 1985-1986), lethal doses (LD50) in mice were 225 mg/kg
(intraperitoneal) and 550 mg/kg (oral) (Wayne A. Temple, 1993). We will first study the toxicity
of AQ on AG129 mice and test the efficacy for protection of mice challenge with DENV.
97
PART II
FUNCTIONAL ANALYSIS OF FLAVIVIRAL NS5
IN 5’CAPPING

98
CHAPTER 1
INTRODUCTION II
1.1. Flaviviral RNA capping
The mosquito-borne Flaviviruses are classified as positive strand RNA viruses as their
genomes serve as mRNAs in the infected host and are translated by the host translational
machinery. The 5’-end of flavivirus RNA has a conserved dinucleotide AG and a type I cap
structure (7Me
GpppA2’OMe) in which the guanine base at the 7-position and the 2’OH of the ribose
moiety of 5’-A are methylated (Wengler et al., 1978) like most eukaryotic mRNAs (reviewed by
(Decroly et al., 2012). Mimicking the host mRNA, the viral capped RNA can utilize the host’s
cap-dependent translational machinery. The 5’-cap also protects the genome from
5’exonuclease-mediated degradation and/or evasion of innate immunity (RIG-I/MDA5 pathway)
that targets uncapped ssRNA (Xagorari and Chlichlia, 2008). The 5’- capping of flavivirus RNA
consists of 4 sequential steps: removal of the -phosphate of triphosphorylated RNA generating
diphosphorylated RNA (pp-A—RNA), addition of guanine monophosphate from GTP to the
diphosphorylated RNA to form GpppA—RNA, and the two methylation reactions catalyzed by
NS5 MTase domain (N7 MTase and 2’O MTase) in the presence of SAM to form
7MeGpppA2’OMe —RNA,
7MeGpppA —RNA, and GpppA2’OMe —RNA (Egloff et al., 2002, Ray et
al., 2006, Dong et al., 2007, Egloff et al., 2007, Zhou et al., 2007, Liu et al., 2010, Dong et al.,
2012) (Fig. 7.1).
The N terminal domain (265 amino acids) of the nonstructural protein 5 (NS5) is
sufficient for both N7 and 2’O methylations (reviewed by (Bollati et al., 2010). Methylations
occur at N7 followed by 2’OH in both WNV (Zhou et al., 2007) and DENV2 (Chung et al.,
99
2010). An RNA substrate of at least 74 nucleotides in length is required for N7 MTase activity
(Dong et al., 2007), whereas short RNA oligonucleotides (7Me
GpppAC(5) and GpppAC(5)) are
sufficient to serve as substrates for the 2’O MTase activity (Selisko et al., 2010). Mutational
analysis (Ray et al., 2006, Zhou et al., 2007) revealed distinct mechanisms involved in the two
catalytic steps; D146 is critical for N7 methylation whereas the KDKE motif (K61-D146-K181-
E217 in DENV2 and K61-D146-K182-E218 in WNV) is important for 2’O methylation. A
substrate repositioning model has been proposed (Dong et al., 2008b) for sequential N7 and 2’O
methylation reactions.
The C-terminal domain of flaviviral NS3 has an RNA triphosphatase activity that
hydrolyzes the g-P of the triphosphorylated RNA (Yon et al., 2005) and this activity is enhanced
by interaction with NS5. Recently, the N-terminal region of NS5 was also reported to have a
guanylyltransferase activity (GTase) which transfers GMP from the hydrolysis of GTP to the
diphosphorylated RNA produced by NS3 (Issur et al., 2009a). The GTase activity was reported
to be enhanced by interaction with NS3. NS3 and NS5 proteins are two crucial components of
the replication and 5’-capping complexes involved in the flaviviral life cycle (Kapoor et al.,
1995). Their interaction domains have been mapped (Johansson et al., 2001).
1.2. Scope of the thesis II
From current knowledge, NS3 and NS5 are essential factors involved in flaviviral 5’-
capping. It is a generally accepted notion that the cap is added at some stage during the positive
strand RNA synthesis. In this section, I summarize my results obtained toward a better
understanding of the 5’-capping mechanism although more work remains to be done.

100
Aims of this dissertation are as follows;
Aim 1: To characterize MTase activity in vitro
Aim 2: To characterize GTase and GTPase activities in vitro

101
Fig.7.1 Flaviviral 5’-capping mechanism
pppA----------
SAM
NS3
NS5
ppA----------
GpppA----------
GTP
7MeGpppA----------
GpppA2’OMe-------
7MeGpppA2’OMe---------
RNA triphosphatase
Guanylyltransferase
MethyltransferaseNS5
RNA
RNA
RNA
RNA
RNA
RNA

102
CHAPTER 2
MATERIALS AND METHODS II
2.1. Materials II
2.1.1. Molecular cloning reagents
All stock solutions of buffers and reagents were prepared using molecular biology grade
chemicals and Milli-Q H2O. RNase-free water was used in all assays involving RNA substrate.
All reagents were stored at room temperature unless indicated otherwise. All recombinant DNA
work was done following established protocols and regulations by the Institutional Biosafety
Committee for handling biohazard materials such as recombinant DNA and plasmid-transformed
E. coli waste disposal.
Phusion (High Fidelity) DNA polymerase was purchased from Thermo Scientific
(Pittsburgh, PA). Oligodeoxynucleotides primers were purchased from Integrated DNA
Technology (Table 8.1). Deoxyribonucleoside triphosphates mixture (10 mM each), 100 bp and
1 kb ladders, restriction enzymes (NdeI and HindIII-HF), and DH5α and BL21 (DE3) competent
cells, were purchased from New England Biolab. T4 DNA ligase, Luria-Bertani (LB) powder,
glucose, kanamycin, isopropyl-β-d-thiogalactopyranoside (IPTG) and other chemicals were
purchased from Fisher Scientific.
2.1.2. Protein purification reagents and preparation
Protein purification reagents: Buffer A (50 mM Tris-HCl, pH 7, 300 mM NaCl, 10%
glycerol) was prepared by mixing autoclaved 2X buffer-salt solution (100 mM Tris-HCl, pH 7,
600 mM NaCl) with 50% glycerol (5X) and deionized H2O. Lysis buffer (50 ml per 1 L bacterial

103
culture) was freshly prepared from buffer A (50 ml) and 500 μL NP-40 (Nonidet P-40;
octylphenoxypolyethoxyethanol) to the final concentration of 1%, a tablet or 500 μl of protease
inhibitor cocktails, and 2-3 mg lysozyme. Imidazole (1 M in buffer A) was freshly prepared just
before use. To make 500 mM imidazole elution buffer, the stock was diluted in buffer A (1:1).
Wash buffers (buffer A with 5, 10, 15, 20, or 25 mM imidazole) were prepared by serial dilution
of the imidazole stock. Protease inhibitor cocktails (without EDTA), Talon resin and a column
were purchased from Fisher Scientific (Pittsburgh, PA). Dialysis buffer: 50 mM Tris-HCl, pH
7.5, 50 mM NaCl, 2 mM MgCl2, and 40% glycerol was prepared by mixing autoclaved buffer,
salt and glycerol. DTT (1 mM at the final concentration) was added to the buffer just before the
dialysis step. The dialysis membrane (10,000 Daltons cut-off) was prepared according to the
manufacturer’s protocol. Quantification of nucleic acids (DNA and RNA) was done by
spectrophotometry and confirmed by gel electrophoresis. The gel conditions for DNA and RNA
were 0.7-2% native agarose electrophoresis, and 7 M urea-8% TBE (89 mM Tris-HCl, pH 8.3,
89 mM Boric acid, 2 mM EDTA) -polyacrylamide gel electrophoresis, respectively.
Quantification of protein was done by Pierce BCA (bicinchoninic acid) protein assay kit, and
confirmed by 10-12% SDS-PAGE.
2.1.3. RNA substrate preparation
The RNA substrate consists of the 5’- terminal 200 nucleotides of DENV2 genome. The
cDNA was PCR amplified from DENV2 mini genome (pSY2) (You and Padmanabhan, 1999)
using the following forward and reverse primers, respectively: D2_200_F and D2_200_R (Table
8.1). MEGAshortscript from Ambion (Life Technologies, Grand Island, NY) was used for T7
104
RNA polymerase-catalyzed in vitro transcription. Micro Bio-Spin 30 columns Bio-Rad
(Hercules, CA) were used to remove unincorporated nucleotides. Acid Phenol/Chloroform
(RNase free) was purchased from Invitrogen (Life Technologies). RNA clean and concentrator
kits (TM-5, TM-25) were purchased from Zymo research.
2.1.4. MTase assay reagents
MTase assay: 10x MTase Buffer (500 mM Tris-HCl, pH 7.5, 100 mM KCl, 20 mM
MgCl2, and 10 mM DTT) was prepared with RNase-free water, and stored in aliquots (10 µL) at
-20 oC. Radioactive [α-
32P]GTP was purchased from Perkin-Elmers. S-adenosylmethionine
(SAM, 32 mM) was purchased from New England Biolab, dissolved in RNase-free water to give
a stock solution of 0.8 mM, and stored in aliquots (10 µL) at -20 oC. ScriptGuard RNase
inhibitor (40 U/µL) was purchased from CellScript (Madison, WI). Nuclease P1 and PEI
cellulose plates were purchased from Sigma Aldrich. Nuclease P1 was diluted with RNase free
water to the concentrations of 4 U/µL; and stored in aliquots at -20 oC.
Vaccinia virus capping enzymes: ScriptCap m7G capping system and ScriptCap 2’O
methyltransferase kit were purchased from Cellscript (Madison, WI). Phosphoimager screen and
the Storm 840 scanner were from Amersham Bioscience (Sunnyvale, CA).
2.1.5. GTase assay reagents
GTase assay: 10x GTase buffer (500 mM Tris-HCl, pH 7.5, 50 mM MgCl2, and 50 mM
DTT) was prepared with RNase-free water, and stored in aliquots (10 µL) at -20 oC. RNA
substrate was prepared by in vitro transcription. Gel-loading buffer II (denaturing PAGE)
105
consisting of 95% Formamide, 18 mM EDTA, and 0.025% SDS, Xylene Cyanol, and
Bromophenol Blue was purchased from Ambion (Life Technologies). Vaccinia virus capping
enzyme (m7ScriptCap), and [α-32
P]GTP were purchased as described above.
2.1.6. GTPase assay reagents
GTPase assay: 10x GTPase buffer (500 mM Tris-HCl, pH 7.5, 100 mM KCl, 20 mM
MgCl2, and 20 mM DTT) was prepared with RNase-free water, and stored in aliquots (10 µL) at
-20 oC. Calf intestinal alkaline phosphatase (CIP) was purchased from NEB.
2.2. Methods II
2.2.1. Construction of DENV2 NS5 MTase1-265aa and DENV2 NS51-405aa
The coding regions for DENV2 NS51-265aa and DENV2 NS51-405aa were amplified from a
DENV2 NS5 expression plasmid (Ackermann and Padmanabhan, 2001) with the forward primer
D2MT F TG, and the reverse primers D2MT R HindIII for the construction of DENV2 NS5-
MTase1-265aa plasmid, and D2MTE1215 R HindIII for the construction of DENV2 NS51-405aa
plasmid (Table 8.1). The PCR fragments were cloned into the pET28b vector using standard
recombinant DNA techniques. Escherichia coli (E. coli) DH5α competent cells were transformed
with the expression plasmids and the positive clones were identified and verified by DNA
sequence analysis.
106
2.2.2. Expression and purification of the NS3 and NS5 proteins
E. coli BL21(DE3) competent cells were transformed with DENV2 NS5-MTase1-265aa and
DENV2 NS51-405aa recombinant plasmids. The transformed bacteria were grown in LB
supplemented with 30 µg/ml kanamycin and 0.5% w/v glucose at 37 oC until an OD600nm of 0.6
was reached. Cells were pelleted and suspended in LB containing 30 µg/ml kanamycin and 1
mM isopropyl-β-d-thiogalactopyranoside and incubated at 16 oC for 24 h. Cells were harvested
by centrifugation at 5000 x g at 4 oC for 10 min, washed once with 50 mM Tris-HCl, pH 7.5 and
200 mM NaCl, centrifuged at 5000 x g 4 oC for 10 min, and stored at -80
oC until use. The
pellets were suspended in lysis buffer (50 mM Tris-HCl, pH 7, 300 mM NaCl, 10% glycerol, 1%
NP-40, 0.5 mM protease inhibitors cocktail VII (Calbiochem), 2-3 mg per 50 ml lyzozyme and
incubated on ice for 30 min. The cell membranes were disrupted by 15 cycles of a 10 sec
ultrasonic burst with a 50 sec interval on ice (Misonix Sonicator Model 3000). The bacterial
lysates were centrifuged at 18,000 x g at 4 oC for 60 min and the supernatants were collected and
filtered through 0.45 µm filters (Millipore Corp.). The soluble fraction was incubated at 4 oC
overnight with Talon resin (Clontech) which was pre-equilibrated with buffer A (50 mM Tris-
HCl, pH 7, 300 mM NaCl, 10% glycerol). The protein bound resin was centrifuged at 500 x g 4
oC for 10 min, and washed with 3 volumes of 4
oC buffer A. Proteins were eluted with freshly
prepared buffer A containing 500 mM imidazole and dialyzed at 4 oC overnight against 2 liters
of dialysis buffer containing 50 mM Tris-HCl, pH 7.5, 50 mM NaCl, 1 mM MgCl2, 40%
glycerol, and 1 mM DTT. The concentrations and purity were checked with BCA assay kits
(Pierce) and SDS-PAGE (12%) gel, respectively.
107
DENV2 NS5FL was expressed and purified as previously described (Manzano et al.,
2011) except for the inclusion of an additional FPLC step. A deletion mutant encoding the RdRP
domain alone at the C-terminal of NS5 was cloned by Dr. Tadahisa Teramoto (Georgetown
University) expressed and purified as described for the pQE32-NS5FL protein (Ackermann and
Padmanabhan, 2001). The WNV NS5FL was expressed and purified as described (Nomaguchi et
al., 2004). The DENV3 NS5FL protein was a gift from Dr. Kay Choi (The University of Texas
Medical Branch).
DENV2 NS2BH-NS3FL(H51A) mutant was expressed and purified as described (Yon et al.,
2005).
2.2.3. MTase assay
The G- capped RNA was generated using the vaccinia virus-encoded capping enzyme
(m7ScriptCap) following the manufacturer’s protocol. Briefly, the reaction mixture containing 1
mM GTP, 1 µCi [α-32
P]GTP, 4 units RNase inhibitor in the buffer provided by the manufacturer
and 1 μg RNA were incubated at 37 oC for 1 h. The G-capped RNA was recovered from the
reaction by passage through a P-30 column (Bio-Rad), followed by concentration using the RNA
Clean and Concentrator kit (Zymo research). The MTase assay was performed in a reaction
mixture containing 50 mM Tris-HCl, pH 7.5, 10 mM KCl, 2 mM MgCl2, 1 mM DTT, 4 units
RNase inhibitor 400 nM S-adenosylmethionine (SAM), 1 μg RNA, and 500 nM DENV2 NS5FL
or as specified. The reaction mixture was incubated at 37 oC for 1 h. The RNAs were extracted
and treated with nuclease P1 (Sigma Aldrich). The products were fractionated by thin layer
chromatography (TLC) on cellulose PEI plates, which were developed for ~90 min with 0.45 M
108
ammonium sulfate as the solvent. The plate was dried and exposed to a phosphoimaging screen.
The resulting images were quantified using ImageJ. In later experiments, the concentration of
NS5 was reduced to 50 nM/assay.
2.2.4. GTase assay
The RNA substrate consists of the N terminal 200 nucleotides of the DENV2 genome.
The cDNA was PCR amplified from a DENV2 mini genome (pSY2) (You and Padmanabhan,
1999) using D2_200_F and D2_200_R as the forward and reverse primers, respectively (Table
8.1). The PCR fragment was used as a template for in vitro transcription catalyzed by T7 RNA
polymerase (MEGAshortscript) at 37 oC for 6 h following the manufacturer’s protocol. The
transcription reaction products were then digested with DNase to remove the DNA template. The
RNA was quantified by spectrophotometry and stored in aliquots (1 µg) at -80 oC per tube. The
GTase assay was started with pretreatment of 1 µg DENV2 RNA substrate with vaccinia virus-
encoded capping enzyme (m7ScriptCap) at 37 oC for 1 h in 50 mM Tris-HCl, pH 7.5, 10 mM
KCl, 2 mM MgCl2, 1 mM DTT, 4 units of RNase Inhibitor (NEB, Ipswich, MA). The RNA was
recovered using the RNA clean and concentrator kit (Zymo research) and incubated with 500 nM
DENV2 NS5FL (in the same buffer containing 1 mM GTP, 1 µCi [α-32
P]GTP, 4 units RNase
Inhibitor at 37 oC for 1 h. The reaction mixture was then inactivated with gel loading buffer II
(Ambion), heated to 95 oC for 5 min and fractionated by PAGE (8%) containing 7 M urea. The
position of the RNA in the gel was detected using ethidium bromide staining and visualized
under UV. Radiolabeled RNA was quantified by phosphoimaging and ImageJ software. Data
was plotted using GraphPad Prism v5 software.

109
2.2.5. GTPase assay
The substrates, 1 mM GTP and 1 µCi [α-32
P]GTP, were incubated with 500 nM DENV2
NS5FL, 500 nM DENV2-NS2BH-NS3FLH51A, 1 μg di or triphosphorylated RNA, 80 µM SAM in
buffer containing 50 mM Tris-HCl, pH 7.5, 10 mM KCl, 2.5 mM MgCl2, 1 mM DTT, 4 units of
RNase inhibitor. The reaction was incubated at 37 oC for 2 h and stopped by heating to 95
oC
for
5 min. Guanosine species were fractionated by thin layer chromatography (TLC) on PEI
cellulose plates, which were developed with 0.45 M ammonium sulfate as the solvent. Plates
were dried, exposed and quantified as previously described in MTase assay.
In time-course analyses, 1 mM GTP, 1 µCi [α-32
P]GTP, 50 nM DENV2 NS5FL, 50 nM
DENV2-NS2BH-NS3FLH51A, and 80 µM SAM were incubated in 50 mM Tris-HCl, pH 7.5, 10
mM KCl, 2.5 mM MgCl2, 1 mM DTT, 4 units of RNase inhibitor for 120 min at 37 oC. Samples
were collected at 1, 5, 10, 15, 20, 25, 30, 60, 90, and 120 min time points by heating to 95 oC
for
5 min. Guanosine species were analyzed as discussed above.
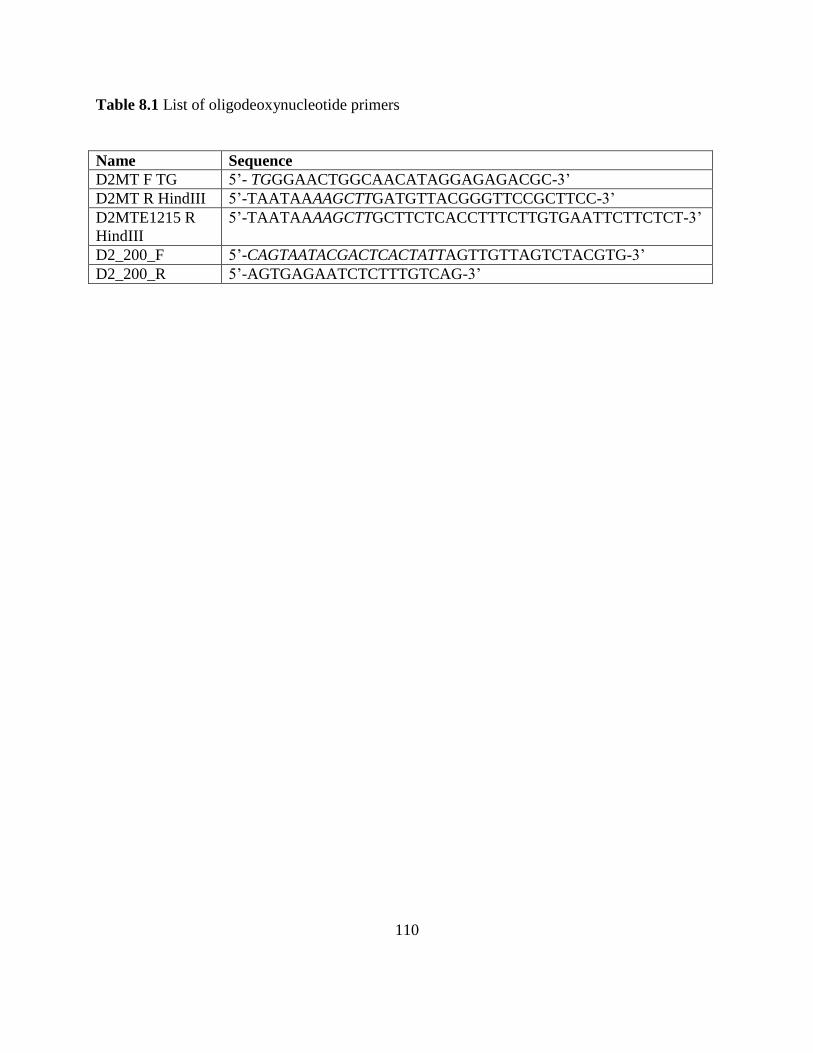
110
Table 8.1 List of oligodeoxynucleotide primers
Name Sequence
D2MT F TG 5’- TGGGAACTGGCAACATAGGAGAGACGC-3’
D2MT R HindIII 5’-TAATAAAAGCTTGATGTTACGGGTTCCGCTTCC-3’
D2MTE1215 R
HindIII
5’-TAATAAAAGCTTGCTTCTCACCTTTCTTGTGAATTCTTCTCT-3’
D2_200_F 5’-CAGTAATACGACTCACTATTAGTTGTTAGTCTACGTG-3’
D2_200_R 5’-AGTGAGAATCTCTTTGTCAG-3’
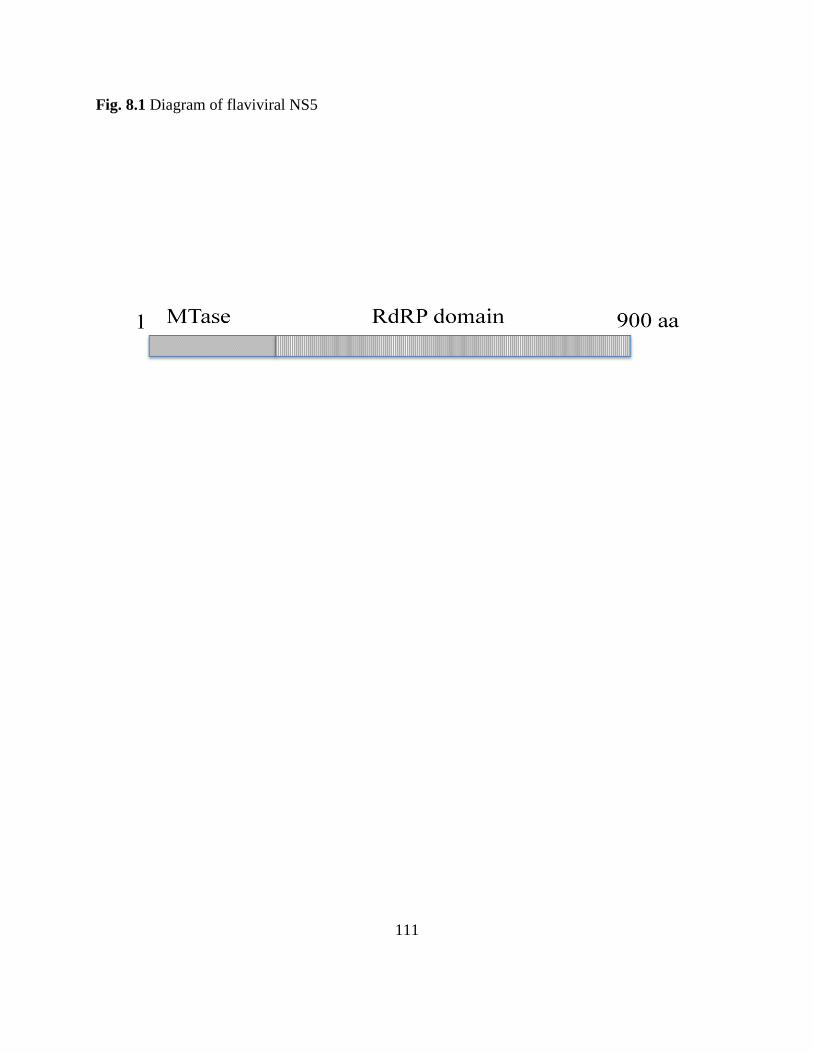
111
Fig. 8.1 Diagram of flaviviral NS5
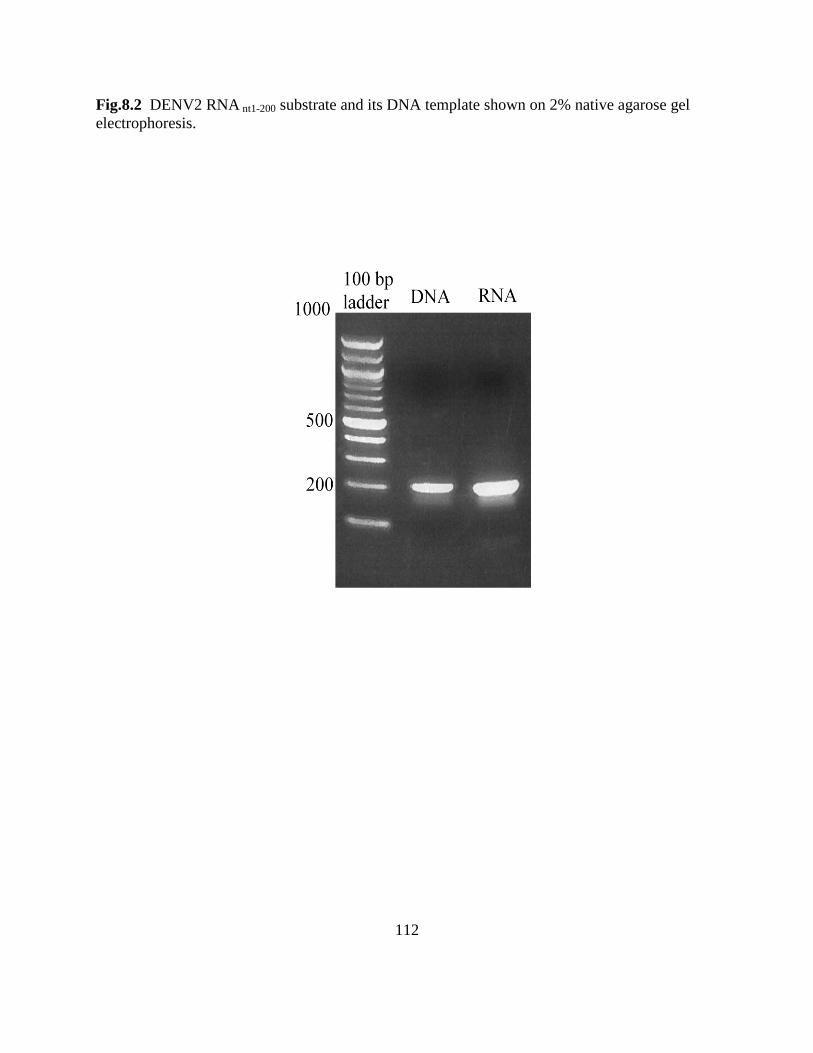
112
Fig.8.2 DENV2 RNA nt1-200 substrate and its DNA template shown on 2% native agarose gel
electrophoresis.

113
Fig. 8.3 DENV2 NS51-265aa (left panel) and DENV2 NS51-405aa (right panel) after His-tag
purification shown on 12% SDS-PAGE.

114
Fig. 8.4 DENV2 NS5FL after His-tag purification (lane 2) and size exclusion by FPLC (lane 3)
shown on 10% SDS-PAGE.
1 2 3
115
CHAPTER 3
CHARACTERIZATION OF FLAVIVIRAL MTASE ACTIVITY
3.1 MTase activity test
3.1.1 Identification of radiolabeled 5’-capped products
To detect the methylated species, [α-32
P]GTP was used as the substrate for the vaccinia
virus-encoded GTase-catalyzed addition of the guanosine cap to the diphosphorylated RNA prior
to the two methylation steps. Gp*ppA—RNA (* represents [32
P]-label) that is formed prior to the
two methylations has an advantage of visualizing directly the unmethylated, mono- and di-
methylated species (Gp*ppA, Gp*ppA2’OMe, 7Me
Gp*ppA, and 7Me
Gp*ppA2’OMe) by
autoradiography using a phosphoimaging. The unmethylated capped RNA (GpppA---RNA) was
treated with no enzyme (Fig. 9.1, lane 1), vaccinia virus N7 MTase (m7ScriptCap) (Fig. 9.1,
lane 2), vaccinia virus 2’O MTase (ScriptCap 2’O) (Fig. 9.1, lane 3), and both vaccinia virus
MTases (Fig. 9.1, lane 4). The RNAs were extracted and recovered as described in subheading
2.2.3. Thin layer chromatography (TLC) had been used to separate the unmethylated,
monomethylated and dimethylated species (Rahmeh et al., 2009) using solvents such as 1.2 M
LiCl or 0.4 M (NH4)2SO4 (Rahmeh et al., 2009). In this study, we used 0.45 M (NH4)2SO4 for
separation of GpppA, GpppA2’OMe, 7Me
GpppA, and 7Me
GpppA2’OMe by TLC on PEI cellulose
coated plates. The 5’-capped species formed in the reactions catalyzed by the vaccinia virus N7
and/or 2’O methyltransferases were used as mobility markers for detection of the corresponding
species formed in the DENV2 NS5 MTase catalyzed reaction (Fig. 9.1).

116
3.1.2 Time-course of DENV2 NS51-265aa N7 and 2’O methyltransferase catalyzed reactions
In previous studies, buffers at different pH and ionic strengths were used for the two
methylation reactions, pH 7 for N7 and pH 10 for 2’O MTases. However, more recently, a pH
7.5 buffer with slight difference in ionic strength that was applicable to both methylation steps
was described (Chung et al., 2010). In this study, we used a buffer containing 50 mM Tris-HCl,
pH 7.5, 10 mM KCl, 2 mM MgCl2, and 1 mM DTT for both 2’O and N7 methylations (replacing
20 mM NaCl with 10 mM KCl, 2 mM MgCl2). Construction of the expression plasmid encoding
the DENV2 MTase domain (NS51-265aa) was described in Methods section. The MTase domain
was expressed in E. coli and the protein was purified, as well as RNA substrate. The MTase
activities of the purified proteins were tested using both unmethylated and N7 methylated capped
RNA (Fig 9.2). The reactions were incubated for 90 min and samples were taken at 1, 5, 10, 15,
20, 25, 30, and 60 min time points.
With the modified buffer and unmethylated G*ppp-RNA substrate, the double
methylated cap analog (7Me
G*pppA2’OMe) was detected as the final product, as well as the single
methylated byproduct (G*pppA2’OMe). Both species were produced at similar rates and
proportion. Moreover, the G*pppA2’OMe species was recognized for the first time as a product of
DENV2 NS5 methyltrasnferase activity. Using the N7-methylated RNA substrate, we also
observed the double methylated product (7Me
G*pppA2’OMe) generated by 2’O methyltransferase
activity of DENV2 NS51-265aa. In conclusion, this modified buffer, incubation, and conditions of
fractionation of products yielded optimal results to further study DENV2 NS5 methyltransferase
activity.
117
3.1.3 Validation of DENV2 MTase assay using a known inhibitor, S-adenosylhomocysteine
(SAH)
In order to develop the assay for screening compound libraries we tested its sensitivity
using a known inhibitor of MTase, SAH (Dong et al., 2007, Zhou et al., 2007). SAH was serially
diluted (4-fold) and pre-incubated with DENV2 NS51-265aa and G*pppA-RNA for 15 min before
addition of the SAM substrate. The assay was continued for 60 min and the cap analogs were
analyzed as described. IC50 of SAH (33.06 ± 9.42 μM) was calculated from non-linear regression
curve fit of quantitated methylated cap products (7Me
G*pppA2’OMe and 7Me
G*pppA) combined.
IC50 of SAH derived from our assay was similar to that of a previous report (IC50 ~75 μM)
(Chen et al., 2013). We conclude that the assay is suitable to screen methyltransferase inhibitors.
3.2 Comparison of the methyltransferase activities of DENV2 NS5FL and DENV2 NS5 1-265aa
in a time course experiment
Unmethylated capped RNA substrate was used as a substrate in this assay. The
experiment was conducted using the buffers and conditions as described above. Time points
were taken at 1, 5, 10, 20, 30, 60, and 90 min. The 0 min time point was a no-enzyme control.
Guanine cap analogs were fractionated by TLC (Fig. 9.4, upper panel), and quantification of the
final product (7Me
GpppA2’OMe, or type I cap) (Fig. 9.4, lower left panel) and the byproduct
(GpppA2’OMe) (Fig. 9.4, lower right panel), were done using a phosphoimaging. DENV2 NS5FL
showed a higher level of the final type I cap product (7Me
GpppA2’OMe) compared to the NS5
MTase domain alone (DENV2 NS51-265aa). In 10 minutes, DENV2 NS5FL produced a saturating
level of type I cap species (~40%), while DENV2 NS51-265aa produced only ~24%. The

118
byproduct, GpppA2’OMe species, was also saturated (~49%) at 10 minutes in the DENV2 NS5FL-
catalyzed reaction whereas only it took ~60 minutes to reach this level (48%) in the DENV2
NS51-265aa-catalyzed reaction.
3.3 Comparison of the methyltransferase activities of various flaviviral NS5s
The experiment was conducted using the buffers and conditions as described in the
preceding experiment (subheading 2.2.3). Guanine cap analogs generated from vaccinia virus
species were used as markers; GpppA, GpppA2’OMe, 7Me
GpppA, and 7Me
GpppA2’OMe. Various
NS5s at 500 nM were used in MTase reactions as described in each lane (Fig. 9.5, upper panel).
We noticed that NS5FL regardless of the species of origin; DENV2 NS5FL (Fig. 9.5, lane 1),
WNV NS5FL (Fig. 9.5, lane 5), DENV3 NS5FL (Fig. 9.5, lane 6), chimeric DENV4 NS51-270aa-
DENV2 NS5271-900aa (Fig. 9.5, lane 7), and chimeric DENV4 NS51-270aa(K74I)-DENV2 NS5271-900aa
(Fig. 9.5, lane 8) were equally efficient in type I cap species (7Me
GpppA2’OMe) production. On the
contrary, homologous NS5 domains; DENV2 NS51-265aa (Fig. 9.5, lane 2), DENV2 NS51-405aa
(Fig. 9.5, lane 3), and DENV2 NS5271-900aa (Fig. 9.5, lane 4), were less active in type I cap
species (7Me
GpppA2’OMe) production. The radiolabeled cap analogs were measured and calculated
as percentage of the total radiolabeled substrate used. The table (Fig. 9.5, lower panel) shows
the percent of each species relative to that obtained with DENV2 NS5FL (Fig. 9.5, lane 1) set at
100%. Results showed that type I cap species (7Me
GpppA2’OMe) were relatively higher in
reactions by all heterologous NS5FLs (Fig. 9.5, lane 5-8), but relatively lower in homologous
DENV2 NS5 domains; DENV2 NS51-265aa (Fig. 9.5, lane 2), and DENV2 NS51-405aa (Fig. 9.5,
lane 3) (MTase1-265aa and NS51-405aa containing the NS3 binding domain of 369-405aa). The type

119
I cap species (7Me
GpppA2’OMe) was undetected in DENV2 NS5271-900aa (RdRp domain) (Fig. 9.5,
lane 4). We concluded that flaviviral MTase reactions were independent of the sources species
and that intact full-length NS5s were more efficient in performing MTase activities than partial
NS5s.
3.4 Discussion
Until now, the only HTS assay utilized 3H-SAM as a radiolabeled substrate. However, a
false positive occurring from internal methylation of the RNA substrate could interfere with the
screening (Dong et al., 2012). The 32
P- labeled capped RNA can be used as an alternative HTS of
in vitro methyltransferase assay. This assay has an advantage on characterization of the cap
analogs. However, it still requires slight modification to be suitable for HTS.
The N-terminal domain of NS5 consisting of 265 amino acids is sufficient for the
methyltransferase activity. Our results clearly showed that DENV2 NS5FL was more efficient in
producing the type I cap species than the DENV2 NS51-265 domain suggesting that the folding of
the full length NS5 is optimum in presenting the catalytic center of the MTase enzyme.
Contrary to the previous claim that flaviviral capped RNA serves as a serotype specific
template for methylation (Dong et al., 2007), we find that DENV2 RNA serves equally well as a
methylation template for heterologous NS5s.
We also reproducibly found for the first time the monomethylated, GpppA2’OMe, species
as a byproduct in our MTase assays. This particular cap species is uncommon since it has never
been recorded in mammalian cells. The only document we found was in the mRNAs of insect

120
oocytes, which was proposed as the translational inactivation mechanism prior to switching to
fertilization (Kastern and Berry, 1976).

121
Fig. 9.1 Guanine cap analogs on TLC analysis. The cap analogs generated from MTase reactions
of GpppA—RNA with no enzyme (lane 1), vaccinia virus N7 MTase (ScriptCap m7G) (lane 2),
vaccinia virus 2’O MTase (ScriptCap 2’O) (lane 3), and both vaccinia virus MTases (lane 4).
Guanine cap analogs processed from nuclease P1 treated RNA were fractionated by TLC and
visualized by phosphoimaging.
1 2 3 4
7MeGpppA2’OMe
7MeGpppA
GpppA2’OMe
GpppA
GDP
GTP

122
Fig. 9.2 Time-course analysis of DENV2 NS51-265aa MTase activities. The G*pppA-RNA (left
upper panel) and 7Me
G*pppA-RNA (right upper panel) substrates (1 μg) were incubated in the
reaction containing 50 mM Tris-HCl, pH 7.5, 10 mM KCl, 2 mM MgCl2, 1 mM DTT, 4 units
RNase inhibitor, 400 nM SAM, and 50 nM DENV2 NS51-265aa at 37 oC for 90 min. Samples were
taken at 1, 5, 10, 15, 20, 25, 30, 60 min time points. Guanine cap analogs processed from
nuclease P1 treated RNA were fractionated by TLC and quantified by phosphoimaging. Each cap
species was identified by comparing their retardation factors (Rf) to those of the established
markers. The 7Me
G*pppA2’OMe product and G*pppA2’OMe byproduct from GpppA-RNA (left
lower panel) and 7Me
GpppA-RNA (right lower panel) substrates were quantified and plotted as
percentage of the products over time.
7MeGpppA2’OMe
GpppA
GDP
1 5 10 15 20 25 30 60 90 min 1 5 10 15 20 25 30 60 90
GpppA RNA substrate7MeGpppA RNA substrate
7MeGpppA
GpppA2’OMe
Origin
10
20
30
40
50
60
70
80
90
-10
0
10
20
30
40
%7MeGpppA2'OMe
%GpppA2'OMe
minute
% p
ro
du
cts
0
10
20
30
40
50
60
70
80
90
0
10
20
30
40
50
%7MeGpppA2'OMe
minute
% p
ro
du
cts
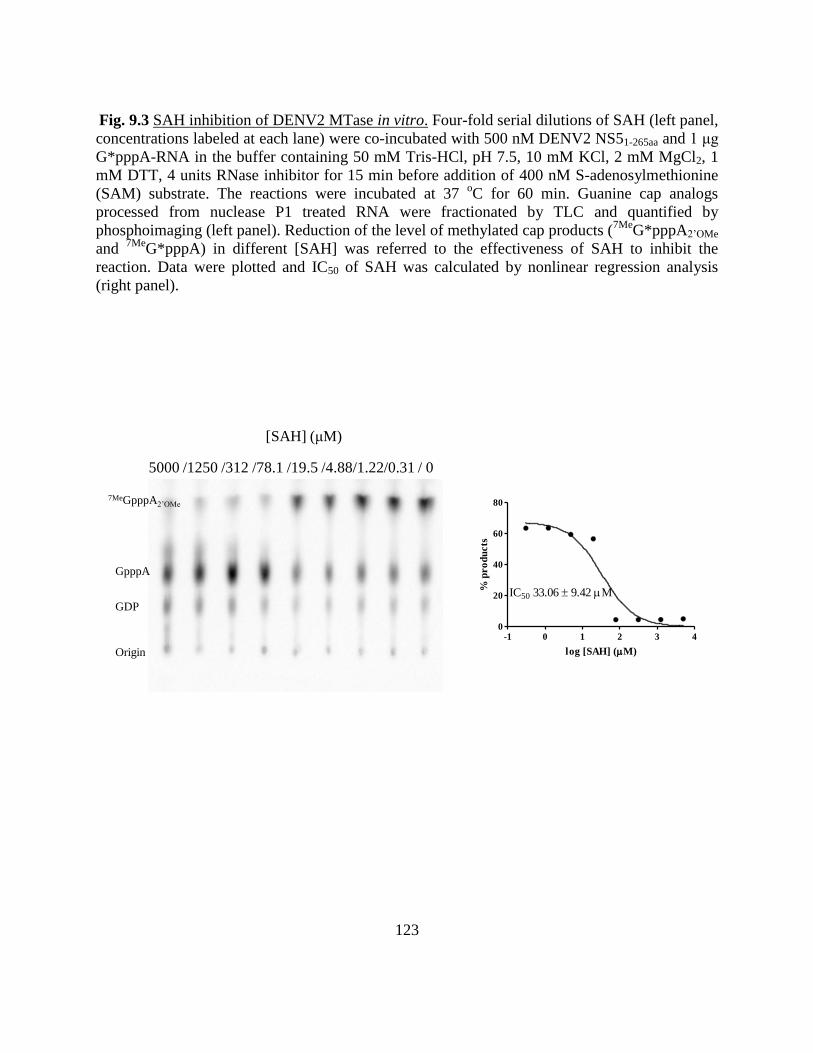
123
Fig. 9.3 SAH inhibition of DENV2 MTase in vitro. Four-fold serial dilutions of SAH (left panel,
concentrations labeled at each lane) were co-incubated with 500 nM DENV2 NS51-265aa and 1 μg
G*pppA-RNA in the buffer containing 50 mM Tris-HCl, pH 7.5, 10 mM KCl, 2 mM MgCl2, 1
mM DTT, 4 units RNase inhibitor for 15 min before addition of 400 nM S-adenosylmethionine
(SAM) substrate. The reactions were incubated at 37 oC for 60 min. Guanine cap analogs
processed from nuclease P1 treated RNA were fractionated by TLC and quantified by
phosphoimaging (left panel). Reduction of the level of methylated cap products (7Me
G*pppA2’OMe
and 7Me
G*pppA) in different [SAH] was referred to the effectiveness of SAH to inhibit the
reaction. Data were plotted and IC50 of SAH was calculated by nonlinear regression analysis
(right panel).
-1 0 1 2 3 40
20
40
60
80
IC50 33.06 9.42 M
log [SAH] (M)
% p
ro
du
cts
5000 /1250 /312 /78.1 /19.5 /4.88/1.22/0.31 / 0
[SAH] (μM)
7MeGpppA2’OMe
GpppA
GDP
Origin

124
Fig.9.4 Time-course analysis comparing MTase activities of DENV2 NS5FL and DENV2 NS51-
265aa. The G*pppA-RNA (upper panel) was incubated in the reaction containing 50 mM Tris-
HCl, pH 7.5, 10 mM KCl, 2 mM MgCl2, 1 mM DTT, 4 units RNase inhibitor, 400 nM SAM, and
50 nM DENV2 NS5FL or DENV2 NS51-265aa at 37 oC for 90 min. Samples taken at 0, 1, 5, 10, 20,
30, 60, and 90 min time points (labeled at each lane). Guanine cap analogs processed from
nuclease P1 treated RNA were fractionated by TLC and quantified by phosphoimaging. Each
guanine cap analog was identified by comparing their retardation factors (Rf) to those of the
established markers. The 7Me
G*pppA2’OMe product (lower left panel) and the G*pppA2’OMe
byproduct (lower right panel) from DENV2 NS5FL and DENV2 NS51-265aa MTase activities were
quantified and plotted as percentage of the products over time.
DENV2 NS51-265DENV2 NS5FL
7MeGpppA2’OMe
7MeGpppA
GpppA2’OMe
GpppA
GDP
GTP
Origin
Time
(min)
0 1 5 10 20 30 60 90 0 1 5 10 20 30 60 90
0 20 40 60 80 1000
10
20
30
40
50
NS5FL
NS51-265
time (min)
7M
eG
pp
pA
2'O
Me (
%)
0 20 40 60 80 1000
10
20
30
40
50
NS5FL
NS51-265
time (min)
Gp
pp
A2
'OM
e (
%)

125
Fig. 9.5 MTase activities of various flaviviral NS5s. Various flaviviral NS5s at 500 nM (upper
panel, labeled at each lane) were incubated with the DENV2 G*pppA-RNA in the reaction
containing 50 mM Tris-HCl, pH 7.5, 10 mM KCl, 2 mM MgCl2, 1 mM DTT, 4 units RNase
inhibitor, and 400 nM SAM at 37 oC for 60 min. Radiolabeled guanine cap analogs generated
from vaccinia virus MTases were used as markers. Guanine cap analogs processed from nuclease
P1 treated RNA were fractionated by TLC and quantified by phosphoimaging. Each guanine cap
species was normalized as percentage of the total radiolabeled substrate, and compared to
DENV2 NS5FL (set as 100%) (lower panel).
7MeGpppA2’OMe
7MeGpppA
GpppA2’OMe
GpppA
GDP
GTP
Origin
MarkerD
EN
V2
NS
5F
L
DE
NV
2 N
S5
1-2
65
DE
NV
2 N
S5
1-4
05
DE
NV
2 N
S5
27
1-9
00
WN
V N
S5
FL
DE
NV
3 N
S5
FL
DE
NV
4 N
S5
1-2
70
DE
NV
2 N
S5
27
1-9
00
DE
NV
4 N
S5
1-2
70
(K7
4I)
DE
NV
2 N
S5
27
1-9
00
1 2 3 4 5 6 7 8
lane 1 2 3 4 5 6 7 8
Outp
ut
(% s
pec
ies)
7MeGpppA2’OMe 100 75 53 0 144 203 179 192
7MeGpppA 0 0 0 0 0 0 0 0
GpppA2’OMe 100 112 122 0 79 51 82 80
GpppA 0 0 0 99 0 0 0 0

126
CHAPTER 4
CHARACTERIZATION OF FLAVIVIRAL GTASE AND GTPASE ACTIVITIES
4.1 GTase activity of DENV2 NS5
Guanylyltransferase is involved in the second step of flaviviral 5’-capping. The enzyme
carries out two consecutive steps; (1) GTP hydrolysis to GMP and (2) transfer of GMP moiety to
diphosphorylated RNA. These enzyme activities were reported to be part of the N-terminal
domain of NS5 by Issur et al 2009 (Issur et al., 2009b). In the study, the N-terminal domain of
NS5 was shown to be covalently linked to GMP via a specific lysine residue. Also, the authors
demonstrated the transfer of GMP to diphosphorylated WNV RNAnt1-81 by WNV NS5FL. This
activity was shown to be enhanced by interaction with NS3. Moreover, NS5 preferred binding to
diphosphorylated RNA with a 5’ adenine and in the presence of GTP (Henderson et al., 2011).
However, we could not demonstrate the guanylyltransferase activity of DENV2 NS5FL
under conditions described in the literature. We used the vaccinia virus capping enzyme (m7G
ScriptCap) as the source of RNA triphosphatase. To generate a 5’-diphosphorylated RNA
substrate, the DENV2 RNAnt1-200 from the 5’ terminus of DENV2 was treated with vaccinia virus
capping enzyme in the absence of GTP and SAM. The RNA was extracted and incubated with
no enzyme (1), DENV2 NS5 MTase1-265 (2), DENV2 NS5FL (3) or vaccinia virus capping
enzyme (4) in the presence of GTP. The reaction mixtures were treated with proteinase K and
extracted with phenol/chloroform. RNA was purified using RNA clean and concentrator kit.
RNA was characterized in 7 M urea 8% PAGE gel (Fig. 10.1). Each lane had 500 ng or 7.5 μM
of RNA substrate (except lane 4 containing 200 ng RNA) and was confirmed by ethidium
bromide staining. Radiolabeled RNA signals from reactions that contained DENV2 NS51-265aa (2)

127
or DENV2 NS5FL (3) were indistinguishable from that of the reaction buffer (1) (Fig. 10.1, lanes
1-3). Moreover, in the presence of NS3, most GTP added to the reaction as a substrate for GTase
was hydrolyzed to GDP instead of GMP by the NS5 proteins.
4.2 GTPase activity of DENV2 NS3 and NS5
For a better understanding of GTase activity of NS5, we sought to characterize the
activities of NS5 in GTP hydrolysis, the first step in the GTase reaction to produce GMP and PPi
prior to the transfer of GMP to the 5’-end of diphosphorylated RNA. In parallel, we also studied
the classic GTPase activity of NS3. NS3 can hydrolyze any of the four NTPs and produce NDP
and Pi. Activity varies with the substrate, ATP and GTP being the best substrates compared to
CTP and UTP (Li et al. 1999).
To characterize the GTPase activities of these two proteins, GTP was treated with calf
intestinal alkaline phosphatase (CIP). The GTP hydrolysis products produced by the phosphatase
after one minute incubation were fractionated by TLC (Fig. 10.2, lane 8). GDP and GMP were
formed as expected and served as the mobility markers on the TLC for the analysis of the
products formed by NS5- and NS3-catalyzed hydrolysis of GTP. We observed that NS3
completely hydrolyzed GTP to GDP within 2 h at 37 oC (Fig. 10.2, lane 3). However, we found
only a trace amount of GMP product when NS5 alone was incubated with GTP (Fig. 10.2, lane
1). Co-incubation of NS3 and NS5 (Fig. 10.2, lane 5) with GTP resulted in GDP as the
predominant product suggesting that GTP hydrolysis activity of NS3 outcompeted that of NS5
GTPase activity as it was shown to be very weak. GTase and MTase activities in capping could
be concerted reactions and RNA template and SAM are also involved as substrates in these
128
sequential reactions. Therefore, we investigated the effect of SAM addition on the GTP
hydrolysis by NS5. SAM had no effect on NS5 (Fig. 10.2, lane 2) and NS3-NS5 co-incubation
(Fig. 10.2, lane 6). The GTPase activity of NS3 could be inhibited by SAM (Fig. 10.2, lane 4),
but not by triphosphorylated RNA (Fig. 10.3, lane 1-2).
In the presence of diphosphorylated RNA (ppRNA), NS5 had increased GTPase activity
to produce GMP (Fig. 10.4, lane 3-4). The ppRNA was prepared from pretreatment of pppRNA
with NS3 which has the 5’-RNA triphosphatase activity. NS3 was later removed and RNA was
recovered by RNA clean and concentrator kit. In a time-course experiment, we showed that
formation of GMP increased with time of incubation with NS5FL (Fig. 10.5). In summary, we
confirmed that NS5 was responsible for the first step of guanylyltransferase, GTP hydrolysis to
GMP, and RNA was necessary for this activity. However, we are unable to demonstrate the
transfer of GMP to the diphosphorylated RNA template produced by using either vaccinia virus
5’-RNA triphosphatase activity or that of DENV2 NS3. When we did the experiments in parallel
using the vaccinia virus GTase (ScriptCap m7G), the transfer of GMP to the 5’-end of
diphosphorylated RNA was very efficient (Fig. 10.1, lane 4)
4.3 Discussion
GTase structures and catalytic mechanisms are well conserved throughout all kingdoms
of life with an N-terminal nucleotide transferase domain and a C-terminal
oligonucleotide/oligosaccharide binding fold (OB fold) (Ferron et al., 2012). GTase has been
difficult to identify in certain viruses since it is transiently formed (Orthoreovirus) or embedded
within another protein (O. Mononegavirales). However, the conserved catalytic site always uses
129
a lysine residue in hydrolyzing GTP and forming a covalent link with GMP. Alignment of the
DENV2 sequence with a known guanylyltransferase enzyme (CobY, PDB code 3rsb) revealed
that the GTP binding domain of DENV2 could be within NS4A (2k region) and NS4B
(hydrophilic region and trans-membrane domain 4) sequences (unpublished data). In future
studies, we will explore the role of NS4B and NS4A as cofactors for the GTase activity of NS5.
Both flaviviral enzymes (NS3 and NS5) have GTP binding sites although they perform
different enzymatic functions with different RNA and/or GTP substrates. Crystal structures have
shown that NS5 amino acid F25 (DENV2) or F24 (WNV) is responsible for GTP/GpppA
binding (Geiss et al., 2009, Yap et al., 2010). Also, the C-terminal domain of NS3 contains a
DExH RNA helicase/NTPase catalytic triad and mutation at a K199E mutation attenuated the
activities (Li et al., 1999). We believed that understanding the GTP hydrolysis pathway of NS3
and NS5 would give an insight to the capping mechanism.
The flaviviral NTPase activity of NS3 was stimulated by non-specific RNAs such as
poly(A) and poly (U) (Li et al., 1999). On the contrary, the RNA triphosphatase (RTPase)
activity was inhibited by ATP in a dose dependent manner due to competitive inhibition for the
shared catalytic site (Bartelma and Padmanabhan, 2002). Moreover, the RTPase activity was
enhanced by NS5 (Yon et al., 2005). We could not detect an RNA stimulated GTPase activity of
NS3 using DENV2 RNAnt1-200 (Fig. 10.3, lane 1-2). Detailed study of genomic RNA and NS3
GTPase activity is required in order to validate the finding. The NS3 GTPase activity (GTP to
GDP) is undesirable in the capping reaction since it will deplete the GTP required for the
capping enzyme. SAM inhibited NS3 GTPase only when NS3 alone was present in the system

130
(Fig. 10.2, lane 4). It might be possible that SAM is a regulator of the GTPase/RTPase switch
but more detailed study is also required to validate this conclusion.
We also found that NS5 was not a good GTPase since only a trace amount of GMP was
formed when NS5 was incubated with GTP (Fig. 10.2, lane 1). However, the proportion of GMP
produced increased in the presence of diphosphorylated RNA (ppRNA) formed by NS3 (Fig.
10.4, lane 3-4). Diphosphorylated RNA had the highest binding affinity for flaviviral NS5
(Henderson et al., 2011). We hypothesized that GTase activity could be enhanced with ppRNA
by an induced fit mechanism of the other substrate (GTP). Detailed study will be done in the
future.

131
Fig. 10.1 GTase activity of DENV2 NS5s. The diphosphorylated DENV2 RNAnt1-200 substrate
was incubated with no enzyme (1), DENV2 NS51-265aa (2), DENV2 NS5FL (3), and vaccinia virus
caping system (m7ScriptCap) (4) in the reaction containing 50 mM Tris-HCl, pH 7.5, 10 mM
KCl, 2 mM MgCl2, 1 mM DTT, 1 mM GTP, 1 µCi [α-32
P]GTP, 4 units of RNase inhibitor at 37 oC for 1 h. The RNAs were characterized by denaturing PAGE and radioactive signals were
quantified by phosphoimaging. Signals from radiolabeled DENV2 RNAnt1-200 were compared to
DENV2 NS5FL (3) set at 100%.
n
o e
nzy
me
DE
NV
2-N
S5
-
MT
ase 1
-26
5
DE
NV
2-N
S5
FL
m7S
crip
tCap
200 nt
Signal (%) 87.89 83.32 100 493.87

132
Fig.10.2 GTPase activity of DENV2 NS3 and/or NS5 and the effect of SAM. The substrates, 1
mM GTP and 1 µCi [α-32
P]GTP, were incubated with 500 nM DENV2 NS5 (lane 1, 2), 500 nM
DENV2 NS3 (lane 3, 4), or both NS3 and NS5 (lane 5, 6), and 80 μM SAM (lane 2, 4, 6) in the
buffer containing 50 mM Tris-HCl, pH 7.5, 10 mM KCl, 2.5 mM MgCl2, 1 mM DTT. The
reaction was incubated at 37 oC for 2 h and stopped by heating to 95
oC
for 5 min. Guanosine
species were fractionated by TLC and quantified by phosphoimaging. The reaction with no-
enzyme was used as a negative control (lane 7). CIP was used to generate radiolabeled guanosine
species (lane 8).
Pi
GMP
GDP
GTP
lane 1 2 3 4 5 6 7 8In
gre
die
nt
GTP + + + + + + + +
NS5 + + - - + + - -
NS3 - - + + + + - -
SAM - + - + - + - -
CIP - - - - - - - +
Outp
ut
(% s
pec
ies)
Pi 2 2 2 1 4 4 1
mar
ker
sGMP 1 1 2 1 6 3 1
GDP 22 13 94 12 87 91 11
GTP 75 84 2 87 3 1 871 2 3 4 5 6 7 8
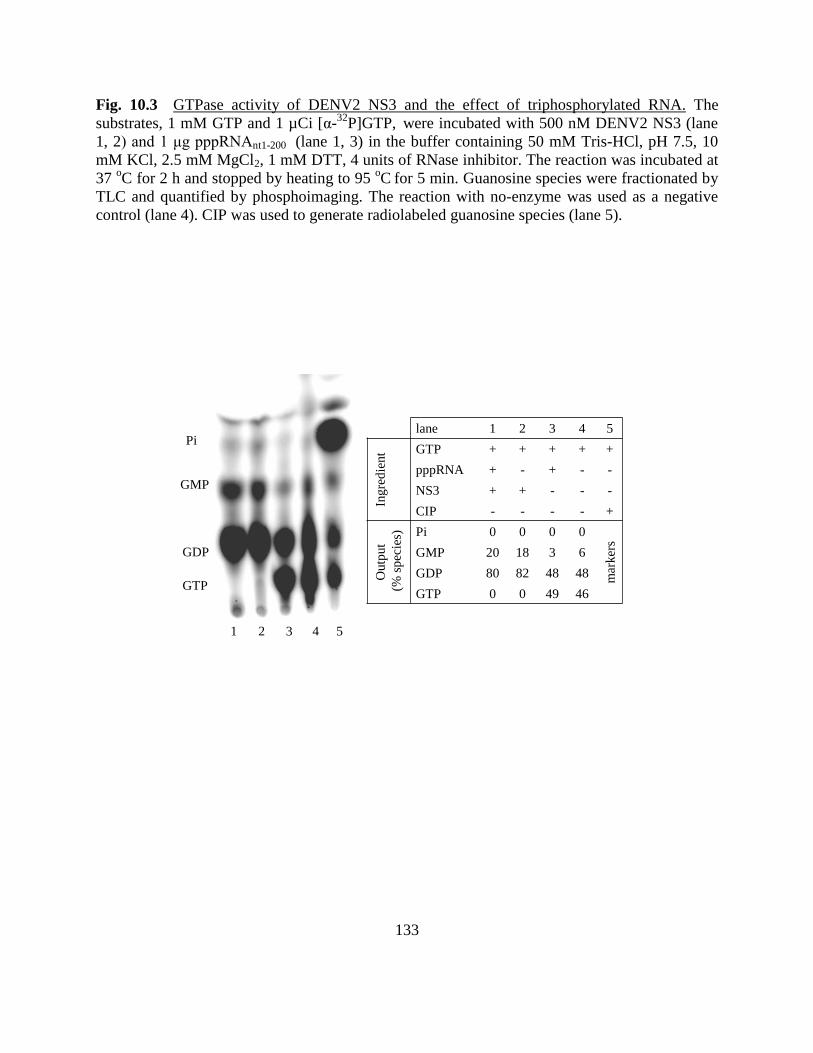
133
Fig. 10.3 GTPase activity of DENV2 NS3 and the effect of triphosphorylated RNA. The
substrates, 1 mM GTP and 1 µCi [α-32
P]GTP, were incubated with 500 nM DENV2 NS3 (lane
1, 2) and 1 μg pppRNAnt1-200 (lane 1, 3) in the buffer containing 50 mM Tris-HCl, pH 7.5, 10
mM KCl, 2.5 mM MgCl2, 1 mM DTT, 4 units of RNase inhibitor. The reaction was incubated at
37 oC for 2 h and stopped by heating to 95
oC
for 5 min. Guanosine species were fractionated by
TLC and quantified by phosphoimaging. The reaction with no-enzyme was used as a negative
control (lane 4). CIP was used to generate radiolabeled guanosine species (lane 5).
Pi
GMP
GDP
GTP
1 2 3 4 5
lane 1 2 3 4 5
Ingre
die
nt GTP + + + + +
pppRNA + - + - -
NS3 + + - - -
CIP - - - - +
Outp
ut
(% s
pec
ies) Pi 0 0 0 0
mar
ker
s
GMP 20 18 3 6
GDP 80 82 48 48
GTP 0 0 49 46
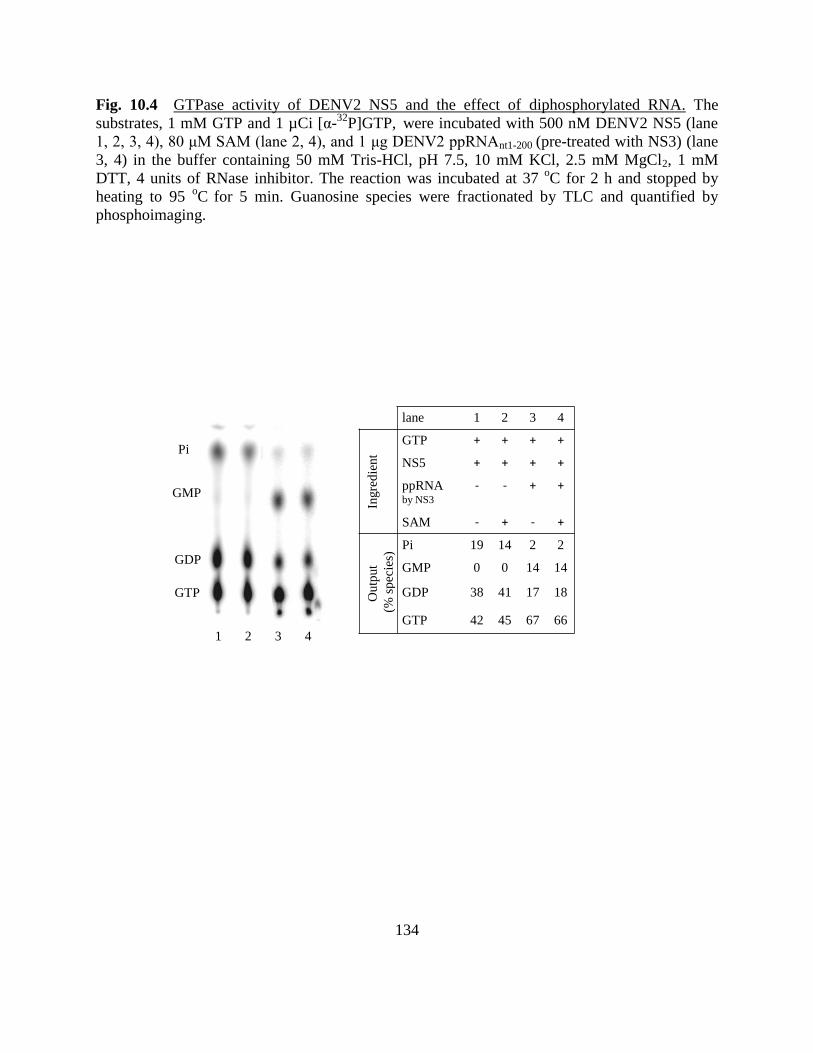
134
Fig. 10.4 GTPase activity of DENV2 NS5 and the effect of diphosphorylated RNA. The
substrates, 1 mM GTP and 1 µCi [α-32
P]GTP, were incubated with 500 nM DENV2 NS5 (lane
1, 2, 3, 4), 80 μM SAM (lane 2, 4), and 1 μg DENV2 ppRNAnt1-200 (pre-treated with NS3) (lane
3, 4) in the buffer containing 50 mM Tris-HCl, pH 7.5, 10 mM KCl, 2.5 mM MgCl2, 1 mM
DTT, 4 units of RNase inhibitor. The reaction was incubated at 37 oC for 2 h and stopped by
heating to 95 oC
for 5 min. Guanosine species were fractionated by TLC and quantified by
phosphoimaging.
Pi
GMP
GDP
GTP
lane 1 2 3 4
Ingre
die
nt
GTP + + + +
NS5 + + + +
ppRNAby NS3
- - + +
SAM - + - +
Outp
ut
(% s
pec
ies)
Pi 19 14 2 2
GMP 0 0 14 14
GDP 38 41 17 18
GTP 42 45 67 66
1 2 3 4
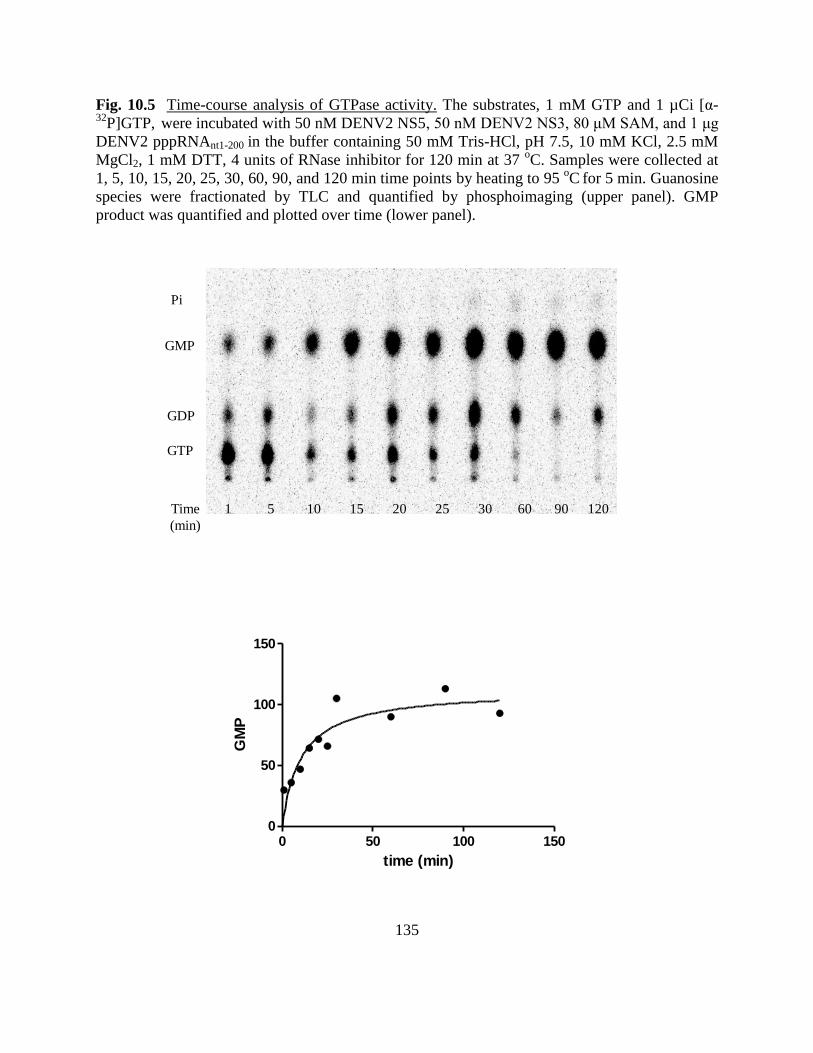
135
Fig. 10.5 Time-course analysis of GTPase activity. The substrates, 1 mM GTP and 1 µCi [α-32
P]GTP, were incubated with 50 nM DENV2 NS5, 50 nM DENV2 NS3, 80 μM SAM, and 1 μg
DENV2 pppRNAnt1-200 in the buffer containing 50 mM Tris-HCl, pH 7.5, 10 mM KCl, 2.5 mM
MgCl2, 1 mM DTT, 4 units of RNase inhibitor for 120 min at 37 oC. Samples were collected at
1, 5, 10, 15, 20, 25, 30, 60, 90, and 120 min time points by heating to 95 oC
for 5 min. Guanosine
species were fractionated by TLC and quantified by phosphoimaging (upper panel). GMP
product was quantified and plotted over time (lower panel).
Pi
GMP
GDP
GTP
Time
(min)
1 5 10 15 20 25 30 60 90 120
0 50 100 1500
50
100
150
time (min)
GM
P
136
CHAPTER 5
CONCLUSION AND FUTURE DIRECTION II
In antiviral research, the 5’-capping has become a novel drug target for its specificity and
potency (Geiss et al., 2011, Li et al., 2013, Saeedi and Geiss, 2013). Flavivirus requires a cap to
start its initial translation (Lindenbach et al., 2007) and to evade from innate immunity (Xagorari
and Chlichlia, 2008). Flavivirus encodes its own capping enzymes. There are structural
differences in the viral and cellular capping machineries that the viral capping enzymes could
potentially be a good drug target (reviewed by (Bartenschlager et al., 2013)). Although DENV
RNA is 5’-capped and the cap is required for translation, in the presence of an inhibitor of eIF4E
(the cap-binding translation initiation factor). DENV can switch from cap-dependent to a non-
canonical cap-independent translation mode (Edgil et al., 2006). However, it has been reported
that inhibitors of flaviviral N7-MTase lead to a complete suppression of viral replication (Ray et
al., 2006, Dong et al., 2008b). The guanine cap is essential for viral translation and N7-
methylation enhanced translation efficiency by 25 fold (Ray et al., 2006). Therefore, considering
both specificity and potency, the 5’-capping machinery is a promising drug target.
Several questions still remain to be answered. For example, does the 5’-capping and
positive strand synthesis occur in a concerted and coupled manner? Are there any cofactors
involved for the GTase activity of NS5 that would enhance its activity in transfer of GMP to the
dephosphorylated RNA? At what step of the viral replication, the 5’-cap is added? The RdRP
activity of NS5 and the helicase activity of NS3 have been implicated in both negative and
positive strands RNA synthesis. NS5 and NS3 exist as a complex in DENV-infected cells
(Kapoor et al., 1995); and their activities are required in both viral replication and 5’-capping in
137
virus-induced membranous organelles ((Chu and Westaway, 1992, Salonen et al., 2005,
Roosendaal et al., 2006, Mackenzie et al., 2007) (reviewed by (Bartenschlager et al., 2013)).
Common host factors involving in positive strand RNA systhesis had been categorized by their
functions as follows; 1) RNA binding proteins facilitating the viral RNA synthesis 2) proteins
involving in membrane-bound replication complex; 3) lipid synthesis enzymes (such as FASN);
and 4) chaperones facilitating the protein folding (such as HSP70) reviewed by (Nagy and
Pogany, 2012). We believe that the listed questions could be better demonstrated with the
knowledge of components in replication complex, as well as their functions, contributions, and
interactions with the viral RNA synthesis and the 5’-capping.
138
BIBLIOGRAPHY
Ackermann M and Padmanabhan R (2001) De novo synthesis of RNA by the dengue virus
RNA-dependent RNA polymerase exhibits temperature dependence at the initiation but
not elongation phase. J Biol Chem 276, 39926-37.
Alcaraz-Estrada SL, Manzano MI, Del Angel RM, Levis R, and Padmanabhan R (2010)
Construction of a dengue virus type 4 reporter replicon and analysis of temperature-
sensitive mutations in non-structural proteins 3 and 5. J Gen Virol 91, 2713-8.
Alcaraz-Estrada SL, Reichert ED, and Padmanabhan R (2013) Construction of self-replicating
subgenomic west nile virus replicons for screening antiviral compounds. Methods Mol
Biol 1030, 283-99.
Alvarez DE, Filomatori CV, and Gamarnik AV (2008) Functional analysis of dengue virus
cyclization sequences located at the 5' and 3'UTRs. Virology 375, 223-35.
Anders KL, Nguyet NM, Chau NV, Hung NT, Thuy TT, Lien le B et al. (2011) Epidemiological
factors associated with dengue shock syndrome and mortality in hospitalized dengue
patients in Ho Chi Minh City, Vietnam. Am J Trop Med Hyg 84, 127-34.
Anez G, Heisey DA, Espina LM, Stramer SL, and Rios M (2012) Phylogenetic analysis of
dengue virus types 1 and 4 circulating in Puerto Rico and Key West, Florida, during 2010
epidemics. Am J Trop Med Hyg 87, 548-53.
Antonysamy SS, Aubol B, Blaney J, Browner MF, Giannetti AM, Harris SF et al. (2008)
Fragment-based discovery of hepatitis C virus NS5b RNA polymerase inhibitors. Bioorg
Med Chem Lett 18, 2990-5.
Avirutnan P, Fuchs A, Hauhart RE, Somnuke P, Youn S, Diamond MS et al. (2010) Antagonism
of the complement component C4 by flavivirus nonstructural protein NS1. J Exp Med
207, 793-806.
Avirutnan P, Punyadee N, Noisakran S, Komoltri C, Thiemmeca S, Auethavornanan K et al.
(2006) Vascular leakage in severe dengue virus infections: a potential role for the
nonstructural viral protein NS1 and complement. J Infect Dis 193, 1078-88.
Balsitis SJ, Williams KL, Lachica R, Flores D, Kyle JL, Mehlhop E et al. (2010) Lethal antibody
enhancement of dengue disease in mice is prevented by Fc modification. PLoS Pathog 6,
e1000790.
Barral K, Sallamand C, Petzold C, Coutard B, Collet A, Thillier Y et al. (2013) Development of
specific dengue virus 2'-O- and N7-methyltransferase assays for antiviral drug screening.
Antiviral Res
Bartelma G and Padmanabhan R (2002) Expression, purification, and characterization of the
RNA 5'-triphosphatase activity of dengue virus type 2 nonstructural protein 3. Virology
299, 122-32.
Bartenschlager R, Lohmann V, and Penin F (2013) The molecular and structural basis of
advanced antiviral therapy for hepatitis C virus infection. Nat Rev Microbiol 11, 482-96.
Belon CA and Frick DN (2008) Monitoring helicase activity with molecular beacons.
Biotechniques 45, 433-40, 42.
Ben-Zvi I, Kivity S, Langevitz P, and Shoenfeld Y (2012) Hydroxychloroquine: from malaria to
autoimmunity. Clin Rev Allergy Immunol 42, 145-53.
139
Benarroch D, Egloff MP, Mulard L, Guerreiro C, Romette JL, and Canard B (2004) A structural
basis for the inhibition of the NS5 dengue virus mRNA 2'-O-methyltransferase domain
by ribavirin 5'-triphosphate. J Biol Chem 279, 35638-43.
Bhatt S, Gething PW, Brady OJ, Messina JP, Farlow AW, Moyes CL et al. (2013) The global
distribution and burden of dengue. Nature 496, 504-7.
Billoir F, de Chesse R, Tolou H, de Micco P, Gould EA, and de Lamballerie X (2000) Phylogeny
of the genus flavivirus using complete coding sequences of arthropod-borne viruses and
viruses with no known vector. J Gen Virol 81 Pt 9, 2339.
Bollati M, Alvarez K, Assenberg R, Baronti C, Canard B, Cook S et al. (2010) Structure and
functionality in flavivirus NS-proteins: perspectives for drug design. Antiviral Res 87,
125-48.
Brewoo JN, Kinney RM, Powell TD, Arguello JJ, Silengo SJ, Partidos CD et al. (2012)
Immunogenicity and efficacy of chimeric dengue vaccine (DENVax) formulations in
interferon-deficient AG129 mice. Vaccine 30, 1513-20.
Byrd CM, Grosenbach DW, Berhanu A, Dai D, Jones KF, Cardwell KB et al. (2013) Novel
benzoxazole inhibitor of dengue virus replication that targets the NS3 helicase.
Antimicrob Agents Chemother 57, 1902-12.
Calvert AE, Huang CY, Kinney RM, and Roehrig JT (2006) Non-structural proteins of dengue 2
virus offer limited protection to interferon-deficient mice after dengue 2 virus challenge.
J Gen Virol 87, 339-46.
Campbell SJ, Gold ND, Jackson RM, and Westhead DR (2003) Ligand binding: functional site
location, similarity and docking. Curr Opin Struct Biol 13, 389-95.
CDC (2012) Arboviral Encephalitides. In Information on Aides albopictus. (ed.), Vol. pp.
http://www.cdc.gov/ncidod/dvbid/arbor/albopic_new.htm, Division of Vector Borne
Diseases, CDC, Atlanta.
Chambers TJ, Weir RC, Grakoui A, McCourt DW, Bazan JF, Fletterick RJ et al. (1990)
Evidence that the N-terminal domain of nonstructural protein NS3 from yellow fever
virus is a serine protease responsible for site-specific cleavages in the viral polyprotein.
Proc Natl Acad Sci U S A 87, 8898-902.
Chaturvedi UC, Agarwal R, Elbishbishi EA, and Mustafa AS (2000) Cytokine cascade in dengue
hemorrhagic fever: implications for pathogenesis. FEMS Immunol Med Microbiol 28,
183-8.
Chen H, Zhou B, Brecher M, Banavali N, Jones SA, Li Z et al. (2013) S-adenosyl-homocysteine
is a weakly bound inhibitor for a flaviviral methyltransferase. PLoS One 8, e76900.
Chen HC, Hofman FM, Kung JT, Lin YD, and Wu-Hsieh BA (2007a) Both virus and tumor
necrosis factor alpha are critical for endothelium damage in a mouse model of dengue
virus-induced hemorrhage. J Virol 81, 5518-26.
Chen HM, Liu BF, Huang HL, Hwang SF, and Ho SY (2007b) SODOCK: swarm optimization
for highly flexible protein-ligand docking. J Comput Chem 28, 612-23.
Chen YL, Yin Z, Lakshminarayana SB, Qing M, Schul W, Duraiswamy J et al. (2010) Inhibition
of dengue virus by an ester prodrug of an adenosine analog. Antimicrob Agents
Chemother 54, 3255-61.
Chu JJ and Yang PL (2007) c-Src protein kinase inhibitors block assembly and maturation of
dengue virus. Proc Natl Acad Sci U S A 104, 3520-5.
140
Chu PW and Westaway EG (1992) Molecular and ultrastructural analysis of heavy membrane
fractions associated with the replication of Kunjin virus RNA. Arch Virol 125, 177-91.
Chung KY, Dong H, Chao AT, Shi PY, Lescar J, and Lim SP (2010) Higher catalytic efficiency
of N-7-methylation is responsible for processive N-7 and 2'-O methyltransferase activity
in dengue virus. Virology 402, 52-60.
Courageot MP, Frenkiel MP, Dos Santos CD, Deubel V, and Despres P (2000) Alpha-
glucosidase inhibitors reduce dengue virus production by affecting the initial steps of
virion morphogenesis in the endoplasmic reticulum. J Virol 74, 564-72.
Cummings MD, DesJarlais RL, Gibbs AC, Mohan V, and Jaeger EP (2005) Comparison of
automated docking programs as virtual screening tools. J Med Chem 48, 962-76.
Decroly E, Ferron F, Lescar J, and Canard B (2012) Conventional and unconventional
mechanisms for capping viral mRNA. Nat Rev Microbiol 10, 51-65.
Dejnirattisai W, Jumnainsong A, Onsirisakul N, Fitton P, Vasanawathana S, Limpitikul W et al.
(2010) Cross-reacting antibodies enhance dengue virus infection in humans. Science 328,
745-8.
Dong H, Chang DC, Hua MH, Lim SP, Chionh YH, Hia F et al. (2012) 2'-O methylation of
internal adenosine by flavivirus NS5 methyltransferase. PLoS Pathog 8, e1002642.
Dong H, Ray D, Ren S, Zhang B, Puig-Basagoiti F, Takagi Y et al. (2007) Distinct RNA
elements confer specificity to flavivirus RNA cap methylation events. J Virol 81, 4412-
21.
Dong H, Ren S, Li H, and Shi PY (2008a) Separate molecules of West Nile virus
methyltransferase can independently catalyze the N7 and 2'-O methylations of viral RNA
cap. Virology 377, 1-6.
Dong H, Ren S, Zhang B, Zhou Y, Puig-Basagoiti F, Li H et al. (2008b) West Nile virus
methyltransferase catalyzes two methylations of the viral RNA cap through a substrate-
repositioning mechanism. J Virol 82, 4295-307.
Duangchinda T, Dejnirattisai W, Vasanawathana S, Limpitikul W, Tangthawornchaikul N,
Malasit P et al. (2010) Immunodominant T-cell responses to dengue virus NS3 are
associated with DHF. Proc Natl Acad Sci U S A 107, 16922-7.
Durbin AP and Whitehead SS (2010) Dengue vaccine candidates in development. Curr Top
Microbiol Immunol 338, 129-43.
Edgil D, Polacek C, and Harris E (2006) Dengue virus utilizes a novel strategy for translation
initiation when cap-dependent translation is inhibited. J Virol 80, 2976-86.
Effler PV, Pang L, Kitsutani P, Vorndam V, Nakata M, Ayers T et al. (2005) Dengue fever,
Hawaii, 2001-2002. Emerg Infect Dis 11, 742-9.
Egloff MP, Benarroch D, Selisko B, Romette JL, and Canard B (2002) An RNA cap (nucleoside-
2'-O-)-methyltransferase in the flavivirus RNA polymerase NS5: crystal structure and
functional characterization. EMBO J 21, 2757-68.
Egloff MP, Decroly E, Malet H, Selisko B, Benarroch D, Ferron F et al. (2007) Structural and
functional analysis of methylation and 5'-RNA sequence requirements of short capped
RNAs by the methyltransferase domain of dengue virus NS5. J Mol Biol 372, 723-36.
Elshuber S, Allison SL, Heinz FX, and Mandl CW (2003) Cleavage of protein prM is necessary
for infection of BHK-21 cells by tick-borne encephalitis virus. J Gen Virol 84, 183-91.
141
Erbel P, Schiering N, D'Arcy A, Renatus M, Kroemer M, Lim SP et al. (2006) Structural basis
for the activation of flaviviral NS3 proteases from dengue and West Nile virus. Nat Struct
Mol Biol 13, 372-3.
Ewing TJ, Makino S, Skillman AG, and Kuntz ID (2001) DOCK 4.0: search strategies for
automated molecular docking of flexible molecule databases. J Comput Aided Mol Des
15, 411-28.
Farias KJ, Machado PR, and da Fonseca BA (2013) Chloroquine inhibits dengue virus type 2
replication in vero cells but not in C6/36 cells. ScientificWorldJournal 2013, 282734.
Ferron F, Decroly E, Selisko B, and Canard B (2012) The viral RNA capping machinery as a
target for antiviral drugs. Antiviral Res 96, 21-31.
Friesner RA, Banks JL, Murphy RB, Halgren TA, Klicic JJ, Mainz DT et al. (2004) Glide: a new
approach for rapid, accurate docking and scoring. 1. Method and assessment of docking
accuracy. J Med Chem 47, 1739-49.
Gebhard LG, Kaufman SB, and Gamarnik AV (2012) Novel ATP-independent RNA annealing
activity of the dengue virus NS3 helicase. PLoS One 7, e36244.
Geiss BJ, Stahla-Beek HJ, Hannah AM, Gari HH, Henderson BR, Saeedi BJ et al. (2011) A
high-throughput screening assay for the identification of flavivirus NS5 capping enzyme
GTP-binding inhibitors: implications for antiviral drug development. J Biomol Screen 16,
852-61.
Geiss BJ, Thompson AA, Andrews AJ, Sons RL, Gari HH, Keenan SM et al. (2009) Analysis of
flavivirus NS5 methyltransferase cap binding. J Mol Biol 385, 1643-54.
Gibbons RV, Kalanarooj S, Jarman RG, Nisalak A, Vaughn DW, Endy TP et al. (2007) Analysis
of repeat hospital admissions for dengue to estimate the frequency of third or fourth
dengue infections resulting in admissions and dengue hemorrhagic fever, and serotype
sequences. Am J Trop Med Hyg 77, 910-3.
Goldman FD, Gilman AL, Hollenback C, Kato RM, Premack BA, and Rawlings DJ (2000)
Hydroxychloroquine inhibits calcium signals in T cells: a new mechanism to explain its
immunomodulatory properties. Blood 95, 3460-6.
Grassmann CW, Isken O, and Behrens SE (1999) Assignment of the multifunctional NS3 protein
of bovine viral diarrhea virus during RNA replication: an in vivo and in vitro study. J
Virol 73, 9196-205.
Green N, Ott RD, Isaacs RJ, and Fang H (2008) Cell-based Assays to Identify Inhibitors of Viral
Disease. Expert Opin Drug Discov 3, 671-6.
Green S and Rothman A (2006) Immunopathological mechanisms in dengue and dengue
hemorrhagic fever. Curr Opin Infect Dis 19, 429-36.
Gubler DJ (2002) The global emergence/resurgence of arboviral diseases as public health
problems. Arch Med Res 33, 330-42.
Gubler DJ and Clark GG (1995) Dengue/dengue hemorrhagic fever: the emergence of a global
health problem. Emerg Infect Dis 1, 55-7.
Hadinegoro SR (2012) The revised WHO dengue case classification: does the system need to be
modified? Paediatr Int Child Health 32 Suppl 1, 33-8.
Halstead SB (2007) Dengue. Lancet 370, 1644-52.
Halstead SB (2008) Dengue virus-mosquito interactions. Annu Rev Entomol 53, 273-91.

142
Halstead SB, Mahalingam S, Marovich MA, Ubol S, and Mosser DM (2010) Intrinsic antibody-
dependent enhancement of microbial infection in macrophages: disease regulation by
immune complexes. Lancet Infect Dis 10, 712-22.
Halstead SB and O'Rourke EJ (1977) Dengue viruses and mononuclear phagocytes. I. Infection
enhancement by non-neutralizing antibody. J Exp Med 146, 201-17.
Henderson BR, Saeedi BJ, Campagnola G, and Geiss BJ (2011) Analysis of RNA binding by the
dengue virus NS5 RNA capping enzyme. PLoS One 6, e25795.
Hesterkamp T and Whittaker M (2008) Fragment-based activity space: smaller is better. Curr
Opin Chem Biol 12, 260-8.
Hirsch AJ, Medigeshi GR, Meyers HL, DeFilippis V, Fruh K, Briese T et al. (2005) The Src
family kinase c-Yes is required for maturation of West Nile virus particles. J Virol 79,
11943-51.
Horton JR, Sawada K, Nishibori M, and Cheng X (2005) Structural basis for inhibition of
histamine N-methyltransferase by diverse drugs. J Mol Biol 353, 334-44.
Huang CY, Butrapet S, Tsuchiya KR, Bhamarapravati N, Gubler DJ, and Kinney RM (2003)
Dengue 2 PDK-53 virus as a chimeric carrier for tetravalent dengue vaccine
development. J Virol 77, 11436-47.
Issur M, Despins S, Bougie I, and Bisaillon M (2009a) Nucleotide analogs and molecular
modeling studies reveal key interactions involved in substrate recognition by the yeast
RNA triphosphatase. Nucleic Acids Res 37, 3714-22.
Issur M, Geiss BJ, Bougie I, Picard-Jean F, Despins S, Mayette J et al. (2009b) The flavivirus
NS5 protein is a true RNA guanylyltransferase that catalyzes a two-step reaction to form
the RNA cap structure. RNA 15, 2340-50.
Jhoti H, Cleasby A, Verdonk M, and Williams G (2007) Fragment-based screening using X-ray
crystallography and NMR spectroscopy. Curr Opin Chem Biol 11, 485-93.
Johansson M, Brooks AJ, Jans DA, and Vasudevan SG (2001) A small region of the dengue
virus-encoded RNA-dependent RNA polymerase, NS5, confers interaction with both the
nuclear transport receptor importin-beta and the viral helicase, NS3. J Gen Virol 82, 735-
45.
Johnson AJ and Roehrig JT (1999) New mouse model for dengue virus vaccine testing. J Virol
73, 783-6.
Johnston PA, Phillips J, Shun TY, Shinde S, Lazo JS, Huryn DM et al. (2007) HTS identifies
novel and specific uncompetitive inhibitors of the two-component NS2B-NS3 proteinase
of West Nile virus. Assay Drug Dev Technol 5, 737-50.
Jones G, Willett P, Glen RC, Leach AR, and Taylor R (1997) Development and validation of a
genetic algorithm for flexible docking. J Mol Biol 267, 727-48.
Juffrie M, Meer GM, Hack CE, Haasnoot K, Sutaryo, Veerman AJ et al. (2001) Inflammatory
mediators in dengue virus infection in children: interleukin-6 and its relation to C-
reactive protein and secretory phospholipase A2. Am J Trop Med Hyg 65, 70-5.
Juliano SA, O'Meara GF, Morrill JR, and Cutwa MM (2002) Desiccation and thermal tolerance
of eggs and the coexistence of competing mosquitoes. Oecologia 130, 458-69.
Kapoor M, Zhang L, Ramachandra M, Kusukawa J, Ebner KE, and Padmanabhan R (1995)
Association between NS3 and NS5 proteins of dengue virus type 2 in the putative RNA
replicase is linked to differential phosphorylation of NS5. J Biol Chem 270, 19100-6.
143
Kastern WH and Berry SJ (1976) Non-methylated guanosine as the 5' terminus of capped mRNA
from insect oocytes. Biochem Biophys Res Commun 71, 37-44.
Kerb R, Fux R, Morike K, Kremsner PG, Gil JP, Gleiter CH et al. (2009) Pharmacogenetics of
antimalarial drugs: effect on metabolism and transport. Lancet Infect Dis 9, 760-74.
Keyes DC, Jonathan L. Burstein, Richard B. Schwartz, Raymond E. Swienton (2004) In Medical
Response to Terrorism: Preparedness and Clinical Practice. Vol. pp. 16, Lippincott
Williams & Wilkins
Khare M and Chaturvedi UC (1997) Role of nitric oxide in transmission of dengue virus specific
suppressor signal. Indian J Exp Biol 35, 855-60.
Khromykh AA, Varnavski AN, and Westaway EG (1998) Encapsidation of the flavivirus kunjin
replicon RNA by using a complementation system providing Kunjin virus structural
proteins in trans. J Virol 72, 5967-77.
Khromykh AA and Westaway EG (1997) Subgenomic replicons of the flavivirus Kunjin:
construction and applications. J Virol 71, 1497-505.
Kitchen DB, Decornez H, Furr JR, and Bajorath J (2004) Docking and scoring in virtual
screening for drug discovery: methods and applications. Nat Rev Drug Discov 3, 935-49.
Kliks SC, Nimmanitya S, Nisalak A, and Burke DS (1988) Evidence that maternal dengue
antibodies are important in the development of dengue hemorrhagic fever in infants. Am J
Trop Med Hyg 38, 411-9.
Kramer B, Rarey M, and Lengauer T (1999) Evaluation of the FLEXX incremental construction
algorithm for protein-ligand docking. Proteins 37, 228-41.
Kroschewski H, Lim SP, Butcher RE, Yap TL, Lescar J, Wright PJ et al. (2008) Mutagenesis of
the dengue virus type 2 NS5 methyltransferase domain. J Biol Chem 283, 19410-21.
Kurane I (2007) Dengue hemorrhagic fever with special emphasis on immunopathogenesis.
Comp Immunol Microbiol Infect Dis 30, 329-40.
Kyle JL, Balsitis SJ, Zhang L, Beatty PR, and Harris E (2008) Antibodies play a greater role than
immune cells in heterologous protection against secondary dengue virus infection in a
mouse model. Virology 380, 296-303.
Lai H, Sridhar Prasad G, and Padmanabhan R (2013) Characterization of 8-hydroxyquinoline
derivatives containing aminobenzothiazole as inhibitors of dengue virus type 2 protease
in vitro. Antiviral Res 97, 74-80.
Leach AR, Hann MM, Burrows JN, and Griffen EJ (2006) Fragment screening: an introduction.
Mol Biosyst 2, 430-46.
Lee CJ, Lin HR, Liao CL, and Lin YL (2008) Cholesterol effectively blocks entry of flavivirus. J
Virol 82, 6470-80.
Lee SG, Alpert TD, and Jez JM (2012) Crystal structure of phosphoethanolamine
methyltransferase from Plasmodium falciparum in complex with amodiaquine. Bioorg
Med Chem Lett 22, 4990-3.
Lee SJ, Silverman E, and Bargman JM (2011) The role of antimalarial agents in the treatment of
SLE and lupus nephritis. Nat Rev Nephrol 7, 718-29.
Li H, Clum S, You S, Ebner KE, and Padmanabhan R (1999) The serine protease and RNA-
stimulated nucleoside triphosphatase and RNA helicase functional domains of dengue
virus type 2 NS3 converge within a region of 20 amino acids. J Virol 73, 3108-16.

144
Li SH, Dong H, Li XF, Xie X, Zhao H, Deng YQ et al. (2013) Rational design of a flavivirus
vaccine by abolishing viral RNA 2'-O methylation. J Virol 87, 5812-9.
Lim SP, Wang QY, Noble CG, Chen YL, Dong H, Zou B et al. (2013) Ten years of dengue drug
discovery: Progress and prospects. Antiviral Res
Lim SP, Wen D, Yap TL, Yan CK, Lescar J, and Vasudevan SG (2008) A scintillation proximity
assay for dengue virus NS5 2'-O-methyltransferase-kinetic and inhibition analyses.
Antiviral Res 80, 360-9.
Lindenbach D, Thiel HJ, and Rice C (2007) Flaviviridae: The viruses and their replication. In
Field's Virology. Knipe DM and Howley PM (ed.), 5 (ed.), Vol. 1, pp. 1101-52.
Lippincott-Raven Publishers, Philadelphia.
Lipinski CA, Lombardo F, Dominy BW, and Feeney PJ (2001) Experimental and computational
approaches to estimate solubility and permeability in drug discovery and development
settings. Adv Drug Deliv Rev 46, 3-26.
Liu L, Dong H, Chen H, Zhang J, Ling H, Li Z et al. (2010) Flavivirus RNA cap
methyltransferase: structure, function, and inhibition. Front Biol 5, 286-303.
Luo D, Xu T, Hunke C, Gruber G, Vasudevan SG, and Lescar J (2008) Crystal structure of the
NS3 protease-helicase from dengue virus. J Virol 82, 173-83.
Lye DC, Lee VJ, Sun Y, and Leo YS (2009) Lack of efficacy of prophylactic platelet transfusion
for severe thrombocytopenia in adults with acute uncomplicated dengue infection. Clin
Infect Dis 48, 1262-5.
Mackenzie JM, Kenney MT, and Westaway EG (2007) West Nile virus strain Kunjin NS5
polymerase is a phosphoprotein localized at the cytoplasmic site of viral RNA synthesis.
J Gen Virol 88, 1163-8.
Malet H, Egloff MP, Selisko B, Butcher RE, Wright PJ, Roberts M et al. (2007) Crystal structure
of the RNA polymerase domain of the West Nile virus non-structural protein 5. J Biol
Chem 282, 10678-89.
Manzano M, Reichert ED, Polo S, Falgout B, Kasprzak W, Shapiro BA et al. (2011)
Identification of cis-acting elements in the 3'-untranslated region of the dengue virus type
2 RNA that modulate translation and replication. J Biol Chem 286, 22521-34.
Matusan AE, Pryor MJ, Davidson AD, and Wright PJ (2001) Mutagenesis of the Dengue virus
type 2 NS3 protein within and outside helicase motifs: effects on enzyme activity and
virus replication. J Virol 75, 9633-43.
Mitka M (2013) Dengue more prevalent than previously thought. JAMA 309, 1882.
Mohan V, Gibbs AC, Cummings MD, Jaeger EP, and DesJarlais RL (2005) Docking: successes
and challenges. Curr Pharm Des 11, 323-33.
Mongkolsapaya J, Dejnirattisai W, Xu XN, Vasanawathana S, Tangthawornchaikul N,
Chairunsri A et al. (2003) Original antigenic sin and apoptosis in the pathogenesis of
dengue hemorrhagic fever. Nat Med 9, 921-7.
Mooij WT, Hartshorn MJ, Tickle IJ, Sharff AJ, Verdonk ML, and Jhoti H (2006) Automated
protein-ligand crystallography for structure-based drug design. ChemMedChem 1, 827-
38.
Morozova OV, Belyavskaya NA, Zaychikov EF, Kvetkova EA, Mustaev AA, and Pletnev AG
(1991) Identification of RNA replicase subunits responsible for initiation of RNA
synthesis of tick-borne encephalitis virus by affinity labelling. Biomed Sci 2, 183-6.
145
Morris GM, Goodsell DS, Huey R, and Olson AJ (1996) Distributed automated docking of
flexible ligands to proteins: parallel applications of AutoDock 2.4. J Comput Aided Mol
Des 10, 293-304.
Morris GM, Huey R, Lindstrom W, Sanner MF, Belew RK, Goodsell DS et al. (2009)
AutoDock4 and AutoDockTools4: Automated docking with selective receptor flexibility.
J Comput Chem 30, 2785-91.
Mosimann AL, de Borba L, Bordignon J, Mason PW, and dos Santos CN (2010) Construction
and characterization of a stable subgenomic replicon system of a Brazilian dengue virus
type 3 strain (BR DEN3 290-02). J Virol Methods 163, 147-52.
Mueller NH, Pattabiraman N, Ansarah-Sobrinho C, Viswanathan P, Pierson TC, and
Padmanabhan R (2008) Identification and biochemical characterization of small-
molecule inhibitors of west nile virus serine protease by a high-throughput screen.
Antimicrob Agents Chemother 52, 3385-93.
Mueller NH, Yon C, Ganesh VK, and Padmanabhan R (2007) Characterization of the West Nile
virus protease substrate specificity and inhibitors. Int J Biochem Cell Biol 39, 606-14.
Mukhopadhyay S, Kuhn RJ, and Rossmann MG (2005) A structural perspective of the flavivirus
life cycle. Nat Rev Microbiol 3, 13-22.
Murthy HM, Clum S, and Padmanabhan R (1999) Dengue virus NS3 serine protease. Crystal
structure and insights into interaction of the active site with substrates by molecular
modeling and structural analysis of mutational effects. J Biol Chem 274, 5573-80.
Murthy HM, Judge K, DeLucas L, and Padmanabhan R (2000) Crystal structure of Dengue virus
NS3 protease in complex with a Bowman-Birk inhibitor: implications for flaviviral
polyprotein processing and drug design. J Mol Biol 301, 759-67.
Nagy PD and Pogany J (2012) The dependence of viral RNA replication on co-opted host
factors. Nat Rev Microbiol 10, 137-49.
Narvaez F, Gutierrez G, Perez MA, Elizondo D, Nunez A, Balmaseda A et al. (2011) Evaluation
of the traditional and revised WHO classifications of Dengue disease severity. PLoS Negl
Trop Dis 5, e1397.
Nelson S, Jost CA, Xu Q, Ess J, Martin JE, Oliphant T et al. (2008) Maturation of West Nile
virus modulates sensitivity to antibody-mediated neutralization. PLoS Pathog 4,
e1000060.
Ng CY, Gu F, Phong WY, Chen YL, Lim SP, Davidson A et al. (2007) Construction and
characterization of a stable subgenomic dengue virus type 2 replicon system for antiviral
compound and siRNA testing. Antiviral Res 76, 222-31.
Nitsche C and Klein CD (2013) Fluorimetric and HPLC-based dengue virus protease assays
using a FRET substrate. Methods Mol Biol 1030, 221-36.
Niyomrattanakit P, Abas SN, Lim CC, Beer D, Shi PY, and Chen YL (2011) A fluorescence-
based alkaline phosphatase-coupled polymerase assay for identification of inhibitors of
dengue virus RNA-dependent RNA polymerase. J Biomol Screen 16, 201-10.
Noble CG, Chen YL, Dong H, Gu F, Lim SP, Schul W et al. (2010) Strategies for development
of Dengue virus inhibitors. Antiviral Res 85, 450-62.
Nomaguchi M, Ackermann M, Yon C, You S, and Padmanabhan R (2003) De novo synthesis of
negative-strand RNA by Dengue virus RNA-dependent RNA polymerase in vitro:
nucleotide, primer, and template parameters. J Virol 77, 8831-42.
146
Nomaguchi M, Teramoto T, Yu L, Markoff L, and Padmanabhan R (2004) Requirements for
West Nile virus (-)- and (+)-strand subgenomic RNA synthesis in vitro by the viral RNA-
dependent RNA polymerase expressed in Escherichia coli. J Biol Chem 279, 12141-51.
O'Neill PM, Bray PG, Hawley SR, Ward SA, and Park BK (1998) 4-Aminoquinolines--past,
present, and future: a chemical perspective. Pharmacol Ther 77, 29-58.
Olliaro P and Mussano P (2003) Amodiaquine for treating malaria. Cochrane Database Syst Rev
CD000016.
Oprea TI, Bauman JE, Bologa CG, Buranda T, Chigaev A, Edwards BS et al. (2011) Drug
Repurposing from an Academic Perspective. Drug Discov Today Ther Strateg 8, 61-9.
Pang YP, Perola E, Xu K, and Prendergast FG (2001) EUDOC: a computer program for
identification of drug interaction sites in macromolecules and drug leads from chemical
databases. J Comput Chem 22, 1750-71.
Pastorino B, Nougairede A, Wurtz N, Gould E, and de Lamballerie X (2010) Role of host cell
factors in flavivirus infection: Implications for pathogenesis and development of antiviral
drugs. Antiviral Res 87, 281-94.
Perez AB, Garcia G, Sierra B, Alvarez M, Vazquez S, Cabrera MV et al. (2004) IL-10 levels in
Dengue patients: some findings from the exceptional epidemiological conditions in Cuba.
J Med Virol 73, 230-4.
Perry ST, Buck MD, Lada SM, Schindler C, and Shresta S (2011) STAT2 mediates innate
immunity to Dengue virus in the absence of STAT1 via the type I interferon receptor.
PLoS Pathog 7, e1001297.
Pfaffl MW (2001) A new mathematical model for relative quantification in real-time RT-PCR.
Nucleic Acids Res 29, e45.
Pierson TC, Sanchez MD, Puffer BA, Ahmed AA, Geiss BJ, Valentine LE et al. (2006) A rapid
and quantitative assay for measuring antibody-mediated neutralization of West Nile virus
infection. Virology 346, 53-65.
Pierson TC, Xu Q, Nelson S, Oliphant T, Nybakken GE, Fremont DH et al. (2007) The
stoichiometry of antibody-mediated neutralization and enhancement of West Nile virus
infection. Cell Host Microbe 1, 135-45.
Poh MK, Yip A, Zhang S, Priestle JP, Ma NL, Smit JM et al. (2009) A small molecule fusion
inhibitor of dengue virus. Antiviral Res 84, 260-6.
Preugschat F, Yao CW, and Strauss JH (1990) In vitro processing of dengue virus type 2
nonstructural proteins NS2A, NS2B, and NS3. J Virol 64, 4364-74.
Prince HE, Matud JL, and Lieberman JM (2011) Dengue virus immunoglobulin M detection in a
reference laboratory setting during the 2010 dengue virus outbreak on Caribbean islands.
Clin Vaccine Immunol 18, 1104-7.
Puig-Basagoiti F, Deas TS, Ren P, Tilgner M, Ferguson DM, and Shi PY (2005) High-
throughput assays using a luciferase-expressing replicon, virus-like particles, and full-
length virus for West Nile virus drug discovery. Antimicrob Agents Chemother 49, 4980-
8.
Puig-Basagoiti F, Qing M, Dong H, Zhang B, Zou G, Yuan Z et al. (2009) Identification and
characterization of inhibitors of West Nile virus. Antiviral Res 83, 71-9.
Qing M, Liu W, Yuan Z, Gu F, and Shi PY (2010) A high-throughput assay using dengue-1
virus-like particles for drug discovery. Antiviral Res 86, 163-71.

147
Rahmeh AA, Li J, Kranzusch PJ, and Whelan SP (2009) Ribose 2'-O methylation of the
vesicular stomatitis virus mRNA cap precedes and facilitates subsequent guanine-N-7
methylation by the large polymerase protein. J Virol 83, 11043-50.
Ramos MM, Mohammed H, Zielinski-Gutierrez E, Hayden MH, Lopez JL, Fournier M et al.
(2008) Epidemic dengue and dengue hemorrhagic fever at the Texas-Mexico border:
results of a household-based seroepidemiologic survey, December 2005. Am J Trop Med
Hyg 78, 364-9.
Randolph VB, Winkler G, and Stollar V (1990) Acidotropic amines inhibit proteolytic
processing of flavivirus prM protein. Virology 174, 450-8.
Ray D, Shah A, Tilgner M, Guo Y, Zhao Y, Dong H et al. (2006) West Nile virus 5'-cap
structure is formed by sequential guanine N-7 and ribose 2'-O methylations by
nonstructural protein 5. J Virol 80, 8362-70.
Rigau-Perez JG, Clark GG, Gubler DJ, Reiter P, Sanders EJ, and Vorndam AV (1998) Dengue
and dengue haemorrhagic fever. Lancet 352, 971-7.
Rodenhuis-Zybert IA, Wilschut J, and Smit JM (2010) Dengue virus life cycle: viral and host
factors modulating infectivity. Cell Mol Life Sci 67, 2773-86.
Rodhain F (1996) [The situation of dengue in the world]. Bull Soc Pathol Exot 89, 87-90.
Roosendaal J, Westaway EG, Khromykh A, and Mackenzie JM (2006) Regulated cleavages at
the West Nile virus NS4A-2K-NS4B junctions play a major role in rearranging
cytoplasmic membranes and Golgi trafficking of the NS4A protein. J Virol 80, 4623-32.
Rothwell C, Lebreton A, Young Ng C, Lim JY, Liu W, Vasudevan S et al. (2009) Cholesterol
biosynthesis modulation regulates dengue viral replication. Virology 389, 8-19.
Saeedi BJ and Geiss BJ (2013) Regulation of flavivirus RNA synthesis and capping. Wiley
Interdiscip Rev RNA 4, 723-35.
Salonen A, Ahola T, and Kaariainen L (2005) Viral RNA replication in association with cellular
membranes. Curr Top Microbiol Immunol 285, 139-73.
Sampath A and Padmanabhan R (2009) Molecular targets for flavivirus drug discovery. Antiviral
Res 81, 6-15.
San Martin JL, Brathwaite O, Zambrano B, Solorzano JO, Bouckenooghe A, Dayan GH et al.
(2010) The epidemiology of dengue in the americas over the last three decades: a
worrisome reality. Am J Trop Med Hyg 82, 128-35.
Savarino A, Lucia MB, Rastrelli E, Rutella S, Golotta C, Morra E et al. (2004) Anti-HIV effects
of chloroquine: inhibition of viral particle glycosylation and synergism with protease
inhibitors. J Acquir Immune Defic Syndr 35, 223-32.
Schmidt AG, Lee K, Yang PL, and Harrison SC (2012) Small-molecule inhibitors of dengue-
virus entry. PLoS Pathog 8, e1002627.
Schul W, Liu W, Xu HY, Flamand M, and Vasudevan SG (2007) A dengue fever viremia model
in mice shows reduction in viral replication and suppression of the inflammatory
response after treatment with antiviral drugs. J Infect Dis 195, 665-74.
Schul W, Yip A, and Shi PY (2013) Testing antiviral compounds in a dengue mouse model.
Methods Mol Biol 1030, 269-81.
Selisko B, Peyrane FF, Canard B, Alvarez K, and Decroly E (2010) Biochemical
characterization of the (nucleoside-2'O)-methyltransferase activity of dengue virus

148
protein NS5 using purified capped RNA oligonucleotides (7Me)GpppAC(n) and
GpppAC(n). J Gen Virol 91, 112-21.
Shi PY, Tilgner M, and Lo MK (2002) Construction and characterization of subgenomic
replicons of New York strain of West Nile virus. Virology 296, 219-33.
Shresta S (2012) Role of complement in dengue virus infection: protection or pathogenesis?
MBio 3,
Shresta S, Sharar KL, Prigozhin DM, Beatty PR, and Harris E (2006) Murine model for dengue
virus-induced lethal disease with increased vascular permeability. J Virol 80, 10208-17.
Shrivastava N, Sripada S, Kaur J, Shah PS, and Cecilia D (2011) Insights into the internalization
and retrograde trafficking of Dengue 2 virus in BHK-21 cells. PLoS One 6, e25229.
Srikiatkhachorn A, Rothman AL, Gibbons RV, Sittisombut N, Malasit P, Ennis FA et al. (2011)
Dengue--how best to classify it. Clin Infect Dis 53, 563-7.
Srikiatkhachorn A, Wichit S, Gibbons RV, Green S, Libraty DH, Endy TP et al. (2012) Dengue
viral RNA levels in peripheral blood mononuclear cells are associated with disease
severity and preexisting dengue immune status. PLoS One 7, e51335.
Stadler K, Allison SL, Schalich J, and Heinz FX (1997) Proteolytic activation of tick-borne
encephalitis virus by furin. J Virol 71, 8475-81.
Stahla-Beek HJ, April DG, Saeedi BJ, Hannah AM, Keenan SM, and Geiss BJ (2012)
Identification of a novel antiviral inhibitor of the flavivirus guanylyltransferase enzyme. J
Virol 86, 8730-9.
Stiasny K, Koessl C, and Heinz FX (2003) Involvement of lipids in different steps of the
flavivirus fusion mechanism. J Virol 77, 7856-62.
Suzuki R, Winkelmann ER, and Mason PW (2009) Construction and characterization of a single-
cycle chimeric flavivirus vaccine candidate that protects mice against lethal challenge
with dengue virus type 2. J Virol 83, 1870-80.
Takahashi H, Takahashi C, Moreland NJ, Chang YT, Sawasaki T, Ryo A et al. (2012)
Establishment of a robust dengue virus NS3-NS5 binding assay for identification of
protein-protein interaction inhibitors. Antiviral Res 96, 305-14.
Takegami T, Sakamuro D, and Furukawa T (1995) Japanese encephalitis virus nonstructural
protein NS3 has RNA binding and ATPase activities. Virus Genes 9, 105-12.
Tan GK, Ng JK, Lim AH, Yeo KP, Angeli V, and Alonso S (2011) Subcutaneous infection with
non-mouse adapted Dengue virus D2Y98P strain induces systemic vascular leakage in
AG129 mice. Ann Acad Med Singapore 40, 523-32.
Thomas L, Kaidomar S, Kerob-Bauchet B, Moravie V, Brouste Y, King JP et al. (2009)
Prospective observational study of low thresholds for platelet transfusion in adult dengue
patients. Transfusion 49, 1400-11.
Thomsen R and Christensen MH (2006) MolDock: a new technique for high-accuracy molecular
docking. J Med Chem 49, 3315-21.
Tomashek KM (2012) Dengue Fever & Dengue Hemorrhagic Fever -. In Chapter 3 - 2012
Yellow Book - Travelers' Health - CDC. (ed.), Vol. pp.
http://wwwnc.cdc.gov/travel/yellowbook/2012/chapter-3-infectious-diseases-related-to-
travel/dengue-fever-and-dengue-hemorrhagic-fever.htm, CDC, Atlanta.
Tomlinson SM, Malmstrom RD, and Watowich SJ (2009) New approaches to structure-based
discovery of dengue protease inhibitors. Infect Disord Drug Targets 9, 327-43.
149
Tomlinson SM and Watowich SJ (2012) Use of parallel validation high-throughput screens to
reduce false positives and identify novel dengue NS2B-NS3 protease inhibitors. Antiviral
Res 93, 245-52.
van de Waterbeemd H and Gifford E (2003) ADMET in silico modelling: towards prediction
paradise? Nat Rev Drug Discov 2, 192-204.
Vausselin T, Calland N, Belouzard S, Descamps V, Douam F, Helle F et al. (2013) The
antimalarial ferroquine is an inhibitor of hepatitis C virus. Hepatology 58, 86-97.
Wang J, Al-Lamki RS, Zhang H, Kirkiles-Smith N, Gaeta ML, Thiru S et al. (2003) Histamine
antagonizes tumor necrosis factor (TNF) signaling by stimulating TNF receptor shedding
from the cell surface and Golgi storage pool. J Biol Chem 278, 21751-60.
Wang QY, Kondreddi RR, Xie X, Rao R, Nilar S, Xu HY et al. (2011) A translation inhibitor
that suppresses dengue virus in vitro and in vivo. Antimicrob Agents Chemother 55,
4072-80.
Wang QY, Patel SJ, Vangrevelinghe E, Xu HY, Rao R, Jaber D et al. (2009) A small-molecule
dengue virus entry inhibitor. Antimicrob Agents Chemother 53, 1823-31.
Warhurst DC, Craig JC, Adagu IS, Meyer DJ, and Lee SY (2003) The relationship of physico-
chemical properties and structure to the differential antiplasmodial activity of the
cinchona alkaloids. Malar J 2, 26.
Wayne A. Temple RF (1993) Amodiaquine Hydrochloride (PIM 030). In (ed.), Vol. pp.
http://www.inchem.org/documents/pims/pharm/amodiaqn.htm, IPCS-Inchem,
Weber SM and Levitz SM (2000) Chloroquine interferes with lipopolysaccharide-induced TNF-
alpha gene expression by a nonlysosomotropic mechanism. J Immunol 165, 1534-40.
Welsch S, Miller S, Romero-Brey I, Merz A, Bleck CK, Walther P et al. (2009) Composition and
three-dimensional architecture of the dengue virus replication and assembly sites. Cell
Host Microbe 5, 365-75.
Wengler G, Wengler G, and Gross HJ (1978) Studies on virus-specific nucleic acids synthesized
in vertebrate and mosquito cells infected with flaviviruses. Virology 89, 423-37.
Westaway EGaJB (1997) Taxonomy and evolutionary relationships of flaviviruses. In Dengue
and dengue hemorrhagic fever. Kuno DJGaG (ed.), Vol. pp. 147- 73. CAB
International, London.
Whitehorn J and Simmons CP (2011) The pathogenesis of dengue. Vaccine 29, 7221-8.
WHO (2012) Dengue and severe dengue, Fact Sheet No117. In (ed.), Vol. pp.
http://www.who.int/mediacentre/factsheets/fs117/en/index.html, WHO, Geneva,
Switzerland.
WHO (2009) Dengue Guideline for Diagnosis, Treatment, Prevention, and Control. In 2009
(ed.), Vol. http://whqlibdoc.who.int/publications/2009/9789241547871_eng.pdf, pp.
WHO, Geneva, Switzerland.
Wilder-Smith A, Ooi EE, Vasudevan SG, and Gubler DJ (2010) Update on dengue:
epidemiology, virus evolution, antiviral drugs, and vaccine development. Curr Infect Dis
Rep 12, 157-64.
Wilder-Smith A and Schwartz E (2005) Dengue in travelers. N Engl J Med 353, 924-32.
Williams KL, Zompi S, Beatty PR, and Harris E (2009) A mouse model for studying dengue
virus pathogenesis and immune response. Ann N Y Acad Sci 1171 Suppl 1, E12-23.

150
Wozniacka A, Lesiak A, Boncela J, Smolarczyk K, McCauliffe DP, and Sysa-Jedrzejowska A
(2008) The influence of antimalarial treatment on IL-1beta, IL-6 and TNF-alpha mRNA
expression on UVB-irradiated skin in systemic lupus erythematosus. Br J Dermatol 159,
1124-30.
Xagorari A and Chlichlia K (2008) Toll-like receptors and viruses: induction of innate antiviral
immune responses. Open Microbiol J 2, 49-59.
Xu T, Sampath A, Chao A, Wen D, Nanao M, Chene P et al. (2005) Structure of the Dengue
virus helicase/nucleoside triphosphatase catalytic domain at a resolution of 2.4 A. J Virol
79, 10278-88.
Yap LJ, Luo D, Chung KY, Lim SP, Bodenreider C, Noble C et al. (2010) Crystal structure of
the dengue virus methyltransferase bound to a 5'-capped octameric RNA. PLoS One 5,
Yap TL, Xu T, Chen YL, Malet H, Egloff MP, Canard B et al. (2007) Crystal structure of the
dengue virus RNA-dependent RNA polymerase catalytic domain at 1.85-angstrom
resolution. J Virol 81, 4753-65.
Yon C, Teramoto T, Mueller N, Phelan J, Ganesh VK, Murthy KH et al. (2005) Modulation of
the nucleoside triphosphatase/RNA helicase and 5'-RNA triphosphatase activities of
Dengue virus type 2 nonstructural protein 3 (NS3) by interaction with NS5, the RNA-
dependent RNA polymerase. J Biol Chem 280, 27412-9.
You S and Padmanabhan R (1999) A novel in vitro replication system for Dengue virus.
Initiation of RNA synthesis at the 3'-end of exogenous viral RNA templates requires 5'-
and 3'-terminal complementary sequence motifs of the viral RNA. J Biol Chem 274,
33714-22.
Yusof R, Clum S, Wetzel M, Murthy HM, and Padmanabhan R (2000) Purified NS2B/NS3
serine protease of dengue virus type 2 exhibits cofactor NS2B dependence for cleavage
of substrates with dibasic amino acids in vitro. J Biol Chem 275, 9963-9.
Zhou Y, Ray D, Zhao Y, Dong H, Ren S, Li Z et al. (2007) Structure and function of flavivirus
NS5 methyltransferase. J Virol 81, 3891-903.
Recommended