C:\Users\tracey_h-
butters\Desktop\Mathematics\year_levels\math_stage6\General\hsc\probability\probability3_4.docx
1
Probability
� and �
Preliminary � HSC Name� ����������

C:\Users\tracey_h-butters\Desktop\Mathematics\year_levels\math_stage6\General\hsc\probability\probability3_4.docx 2
HSC CAPACITY MATRIX – GENERAL MATHEMATICS
TOPIC: Probability 3 & 4 2 weeks
Your say!
What was the most important thing you learned?_____________________________________
What was something new you learnt? _____________________________________________
What part(s) of this topic will you need to work on? __________________________________
CONTENT CAPACITY
BREAKDOWN!
DONE
IT!!!!
GOT
IT!!!!!
ON MY
WAY!
WORKING
ON IT! HELP!!!!
1. Constructing tree diagrams Ex 6A Q1, 3, 5, 6, 8-19
2. Counting techniques and ordered selections Ex 6B
Ex 6C
3. Probability trees to solve problems involving two-
stage events Ex 6D odd questions
4. Expected number of outcomes
Medical prob. task
Ex 7A
S/S task - simulations
5. Calculating financial expectation Ex 7B
6. Two-way tables Ex 7C odd questions
C:\Users\tracey_h-
butters\Desktop\Mathematics\year_levels\math_stage6\General\hsc\probability\probability3_4.docx
3
Tree diagramsTree diagramsTree diagramsTree diagrams
Remember: x In any probability experiment that has more than one stage, a tree diagram
can be used to calculate the sample space; x The tree diagram branches once for each stage and the number of
branches at each stage is equal to the number of outcomes; x The SAMPLE SPACE is found by following the path to the end of each
branch; x Once the sample space has been found, the probability of each outcome
is calculated using the probability formula:
�������� � ���� �� ���� ���� �������
����� ���� �� �������
eg A coin is tossed three times. Draw a tree diagram to represent all outcomes and list the sample space.

C:\Users\tracey_h-
butters\Desktop\Mathematics\year_levels\math_stage6\General\hsc\probability\probability3_4.docx
4
eg A two digit number is formed using the digits 1, 2, 3 and 4 without repetition.
(i) Draw a tree diagram to represent all outcomes;
(ii) Calculate the probability that:
a. The number will be even;
b. The number will end in a 2;
c. The number is divisible by 3

GENERAL MATHEMATICS (HSC) – PROBABILITY NOTES 1
C:\Users\tracey_h-
butters\Desktop\Mathematics\year_levels\math_stage6\General\hsc\probability\probability3_4.docx 5
Counting Techniques � Counting Techniques � Counting Techniques � Counting Techniques � ordered selectionsordered selectionsordered selectionsordered selections
A group of n different items can be arranged in n! ways.
( ) ( ) 121! ××−×−×= …nnnn
eg 6! = _______
eg Nine people are standing in a line, In how many ways can the nine
people be arranged?
When an ordered selection is made, the number of selections can be
calculated by multiplying the number of first choices that can be made
by the number of second choices that can be made and so on.
An example of an ordered selection is ___________________________
eg In a netball team of seven players, a captain and vice captain are to
be chosen. In how many ways can this be done?
HINT: Is order important? _________

GENERAL MATHEMATICS (HSC) – PROBABILITY NOTES 1
C:\Users\tracey_h-
butters\Desktop\Mathematics\year_levels\math_stage6\General\hsc\probability\probability3_4.docx 6
To calculate the number of unordered selections that can be made, we
divide the number of ordered selections by the number of arrangements
of those selected.
An example of an unordered selection is
________________________________
eg In Lotto, a player must select six numbers out of 44. In how many
ways can the six numbers be chosen?
HINT: Is order important? _________

GENERAL MATHEMATICS (HSC) – PROBABILITY NOTES 1
C:\Users\tracey_h-
butters\Desktop\Mathematics\year_levels\math_stage6\General\hsc\probability\probability3_4.docx 7
Probability � counting techniques
eg The letters Y, C, A, T, R and E are written on separate cards. The
cards are shuffled and then laid out face up in a line. Calculate the
probability that the cards form the word TRACEY.
HINT: Is order important?
eg From Belinda, Luke, Phoebe, Elliott and Caitlin, a representative and
a reserve are selected. Calculate the probability that Elliott and Luke
occupy the two positions.
HINT: Is order important?
eg There are 45 balls in a Lotto game. Calculate the probability of
winning? (You need 6 numbers in a selection)

GENERAL MATHEMATICS (HSC) – PROBABILITY NOTES 1
C:\Users\tracey_h-
butters\Desktop\Mathematics\year_levels\math_stage6\General\hsc\probability\probability3_4.docx 8
Probability Trees
x IMPORTANT POINTS:
x READ the question CAREFULLY to note if the probabilities change
during the experiment.
x CONSIDER what outcomes you need to include – sometimes you may
need only to consider if one event occurs or not.
x To calculate a probability, MULTIPLY along the branches that give the
required outcome.
x If an outcome can be obtained in two or more ways, ADD the
probability of each.
x For questions that state “at least one”, use the complementary event
method: (1- P(event not occurring))
eg In a bag there are six green marbles and eight purple marbles. A marble is drawn,
colour noted and then it is replaced in the bag. A second marble is then drawn.

GENERAL MATHEMATICS (HSC) – PROBABILITY NOTES 1
C:\Users\tracey_h-
butters\Desktop\Mathematics\year_levels\math_stage6\General\hsc\probability\probability3_4.docx 9
a) Draw a probability tree to represent the sample space;
b) Calculate the probability that:
(i) both marbles are green;
(ii) the two marbles are different colours.
eg In a barrel there are 20 white counters and thirty red counters. A counter is drawn, its
colour noted and it is not replaced. A second counter is then drawn.
Find the probability that:
a) A white counter is drawn first, followed by a red counter.
b) Both counters are the same colour.
GENERAL MATHEMATICS (HSC) – PROBABILITY NOTES 1
C:\Users\tracey_h-
butters\Desktop\Mathematics\year_levels\math_stage6\General\hsc\probability\probability3_4.docx 10
eg Mary travels a street that has three traffic lights. The probability of catching a green light
is 0.42. Calculate the probability of:
a) Catching all three green lights;
b) Catching one red light;
c) Catching at least one red light.

GENERAL MATHEMATICS HSC – PROBABILITY NOTES 3
C:\Users\tracey_h-
butters\Desktop\Mathematics\year_levels\math_stage6\General\hsc\probability\probability3_4.docx 11
Expected Outcomes
The EXPECTED OUTCOME is the number of times that we expect a particular
outcome to occur in a certain number of trials.
This is calculated by multiplying the probability of that event by the number of
trials.
The number of times we expect an event to occur does NOT mean the event will
occur that number of times. Rather, this is the average number of times we would
expect this event to occur.
eg A die is rolled 150 times. How many “fives” would you expect to occur in 150 rolls of
the die?
eg Ketryn draws a card from a standard deck, notes the suit and replaces the card in the
deck. If Ketryn repeats this process 75 times, how many hearts can Ketryn expect to have
drawn?
eg A psychologist is conducting a study on the upbringing of boys. For the study, the
psychologist selects 100 couples with exactly three children. How many of these couples
would the psychologist expect to have:
a) three boys;
b) two boys;
c) one boy who is the youngest.
GENERAL MATHEMATICS – PROBABILITY NOTES 4
C:\Users\tracey_h-
butters\Desktop\Mathematics\year_levels\math_stage6\General\hsc\probability\probability3_4.docx 12
Financial ExpectationFinancial ExpectationFinancial ExpectationFinancial Expectation
x Financial expectation is the average return in a financial situation.
x The financial expectation is calculated by multiplying each possible financial
outcome by the probability of that financial outcome and adding the results
together.
x A financial loss is indicated by a negative financial outcome while a financial
gain is a positive financial outcome.
eg A game is played in which a fair coin is tossed. If the result is a head you win $5, if the
result is a tail you lose $4. Calculate the financial expectation for the game.
eg A game is played where a die is rolled. If a six is rolled, the player wins $10.00, if a five
is rolled, the player wins $6.00; and if any other number is rolled, the player loses $5.00.
What is the financial expectation from this game?
eg One thousand tickets are sold in a lottery. First prize is $2000, second prize is $1000
and third prize is $500. The tickets cost $10 each. If no ticket can win more than one
prize, calculate the expected financial return for this lottery.

GENERAL MATHEMATICS – PROBABILITY NOTES 4
C:\Users\tracey_h-
butters\Desktop\Mathematics\year_levels\math_stage6\General\hsc\probability\probability3_4.docx 13
INVESTIGATION: http://www.ildado.com/free_roulette.html
Roulette is a popular casino game played around the world. The French roulette wheel,
used in Australian casinos, has 37 slots numbered from 0 to 36.
The wheel is spun and a small marble is thrown in the opposite direction. The marble
comes to rest in one of the numbered slots. Apart from zero, half of the numbers are red
and half are black.
They are chosen so that some are even, odd, low numbers and some are high numbers.
Bets are made by placing tokens on the appropriate places on the table. A player can bet
on red numbers, black numbers, odd numbers, even numbers, pairs of numbers, groups
of 6 numbers etc.
TASK 1 Complete the table below:
TYPE OF BET WIN (for $1)
P(win) P(loss) Financial Expectation
Single number $35
Pair of adjacent numbers
$17
3 numbers in a row $11
4 numbers in a row $8
2 rows of 3 numbers $5
Column of 12 numbers $2
1st 12 numbers $2
2nd 12 numbers $2
3rd 12 numbers $2
Even numbers $1
Odd numbers $1
Red numbers $1
Black numbers $1
Numbers 1-18 $1
Numbers 19-36 $1
a) Would it be better to bet $100 on a single number or make 100 individual $1 bets on a
single number? Give reasons

GENERAL MATHEMATICS – PROBABILITY NOTES 4
C:\Users\tracey_h-
butters\Desktop\Mathematics\year_levels\math_stage6\General\hsc\probability\probability3_4.docx 14
TWO�WAY TABLES
x A 2-way table is a 2-D grid that displays the outcomes of an outcome of an
experiment in terms of two variables.
x A 2-way table is used to display test results and examine the accuracy of
these results.
x The table displays horizontally the numbers with and without a certain
condition and vertically displays information about accuracy.
x The table can be used to make calculations about the accuracy of the test
and about the probability of those test results being accurate in an individual
case.
eg 400 newborn babies are tested for a genetic condition. The results are displayed
below:
Test results Total
Accurate Not accurate
With condition 85 9
Without condition 304 2
Total
Known as a “false
positive”
GENERAL MATHEMATICS – PROBABILITY NOTES 4
C:\Users\tracey_h-
butters\Desktop\Mathematics\year_levels\math_stage6\General\hsc\probability\probability3_4.docx 15
eg A new test was designed to assess the reading ability of students entering high school.
The results were used to determine if the students’ reading level was adequate to cope
with high school. The students’ results were then compared against existing records.
N 150 adequate readers sat for the test and 147 passed;
N 50 adequate readers sat for the test and 9 of them passed;
a) Complete the following table to represent this information
Total
Total
b) How many students sat the exam?
c) How many students did not pass the exam?
d) In what percentage of students who passed the test were noted as inadequate
readers?
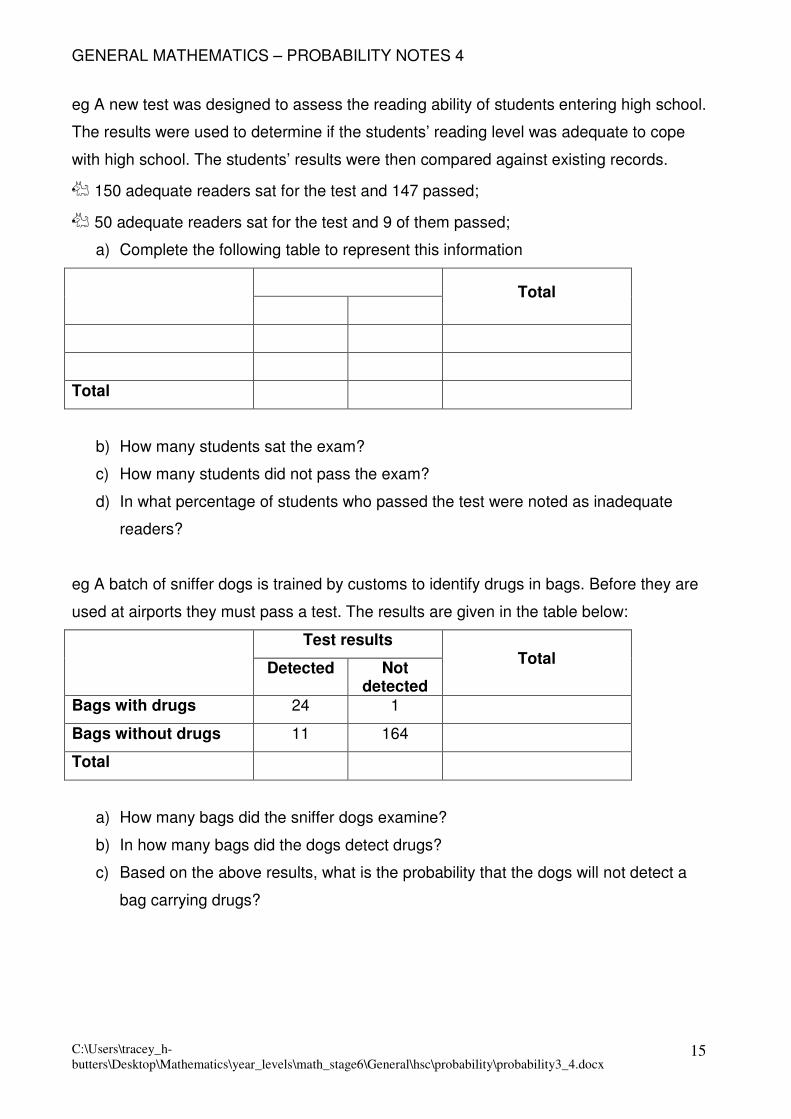
eg A batch of sniffer dogs is trained by customs to identify drugs in bags. Before they are
used at airports they must pass a test. The results are given in the table below:
Test results Total
Detected Not detected
Bags with drugs 24 1
Bags without drugs 11 164
Total
a) How many bags did the sniffer dogs examine?
b) In how many bags did the dogs detect drugs?
c) Based on the above results, what is the probability that the dogs will not detect a
bag carrying drugs?

GENERAL MATHEMATICS – PROBABILITY NOTES 4
C:\Users\tracey_h-
butters\Desktop\Mathematics\year_levels\math_stage6\General\hsc\probability\probability3_4.docx 16
PAST HSC QUESTIONS 2011

GENERAL MATHEMATICS – PROBABILITY NOTES 4
C:\Users\tracey_h-
butters\Desktop\Mathematics\year_levels\math_stage6\General\hsc\probability\probability3_4.docx 17
Recommended