Primary Care Non-physician Clinicians in Delaware
1998 prepared for Delaware Department of Health and Social Services Division of Public Health by Edward C. Ratledge
Center for Applied Demography & Survey Research College of Human Resources, Education and Public Policy
University of Delaware
Newark, Delaware 19716
______________________________________________________________________________
_____________________________________________________________________________________ ii
The University of Delaware is committed to assuring equal opportunity to all persons and does not discriminate on the basis of race, color, gender, religion, ancestry, national origin, sexual preference, veteran status, age, or disability in its educational programs, activities, admissions, or employment practices as required by Title IX of the Educational Amendments of 1972, Title VI of the Civil Rights Act of 1964, the Rehabilitation Act of 1973, the Americans with Disabilities Act, other applicable statutes, and University policy. Inquiries concerning these statutes and information regarding campus accessibility and Title VI should be referred to the Affirmative Action Officer, 305 Hullihen Hall, 302/831-2835 (voice), 302/831-4552(TDD).

______________________________________________________________________________
_____________________________________________________________________________________ iii
TABLE OF CONTENTS
Page List of Figures.............................................................................................................................. iv Overview ..................................................................................................................................... 1 Demographics ............................................................................................................................. 5 Practice Characteristics .............................................................................................................. 13 Spatial Distribution ..................................................................................................................... 21 Observations ................................................................................................................................ 28 APPENDIX ................................................................................................................................. 30

______________________________________________________________________________
_____________________________________________________________________________________ iv
LIST OF FIGURES
Figure Page 1.1 Selected Non-physician Clinicians by Employment Status and Type........................... 1 1.2 Non-physician Clinicians in Primary Care by County and Group ................................ 3 2.1 Barriers: Primary Care NPCs by Group ........................................................................ 5 2.2 Gender: Primary Care NPCs by County and Group...................................................... 6 2.3 Race: Primary Care NPCs by County and Group.......................................................... 7 2.4 Hispanic Origin: Primary Care NPCs by County and Group ........................................ 8 2.5 Age: Primary Care NPCs by County and Group ........................................................... 9 2.6 State of High School Graduation: Primary Care NPCs by Group................................. 9 2.7 State of Training Program: Primary Care NPCs by Group ........................................... 10 2.8 Focus of Training Program: Primary Care NPCs by Group.......................................... 11 2.9 Current Salaries: Primary Care NPCs by County and Group........................................ 12 3.1 Specialty: Primary Care NPCs by Group ...................................................................... 13 3.2 Number of Work Sites: Primary Care NPCs by Group................................................. 14 3.3 Practice Setting: Primary Care NPCs by Group............................................................ 15 3.4 Offer a Sliding Fee Schedule: Primary Care NPCs by County and Group ................... 15 3.5 Treating Medicare Patients: Primary Care NPCs by County and Group ...................... 16 3.6 Treating Medicaid Patients: Primary Care NPCs by County and Group ...................... 17 3.7 Relationship with Physician: Primary Care NPCs by Group ........................................ 18 3.8 Prescribe Medications: Primary Care NPCs by County and Group.............................. 19 3.9 DEA#: Primary Care NPCs by County and Group........................................................ 19 4.1 Persons per Primary Care Physician by Census County Division................................. 24 4.2 Persons per Primary Care Non-physician Clinician by Census County Division ......... 25 4.3 Physicians per Non-physician Clinician in Primary Care by Census County Division 26

_____________________________________________________________________________________
Overview
In 1998, the Division of Public Health began an effort to measure the number, type, and
spatial distribution of non-physician clinicians (NPCs) who were delivering primary care in
Delaware. The objective was to determine how they were complementing primary care
physicians and to understand how they were impacting the supply of primary care services.
Non-physician clinicians have been described as falling into three categories.1 Those in
the traditional group are nurse practitioners, certified nurse-midwives, and physician assistants.
The alternative group includes chiropractors, naturopaths, and practitioners of acupuncture and
herbal medicine. The final group, referred to as specialists includes optometrists, podiatrists,
certified registered nurse anesthetists, and clinical nurse specialists.
Figure 1.1 Selected Non-physician Clinicians2 by Employment Status and Type
Source: Center for Applied Demography & Survey Research, University of Delaware
1 Richard A. Cooper, et al. Current and Projected Workforce of Nonphysician Clinicians. JAMA. 1998:788-794. 2 NP-Nurse practitioner, CNM-Certified nurse midwife, PA-physician assistant; CRNA-certified registered nurse anesthetist, CNS-certified nurse specialist.
NP CNM PA CRNA CNS0
20
40
60
80
100
120
140
NPCs
Full-time 88 8 44 54 33Part-time 46 0 11 12 17
Total 134 8 55 66 50

Primary Care Non-physician Clinicians in Delaware Overview ______________________________________________________________________________
_____________________________________________________________________________________ 2
This report examines five of the ten disciplines mentioned including those in the
traditional group one and nurses in the specialists group. Of particular interest are those in the
first group who are engaged in primary care. The distribution of those five disciplines is shown
in Figure 1.1 above.
The method chosen to gather the information was a mail survey with two follow-up
mailings to non-respondents of the earlier mailings. The survey instrument was based on those
used in other states but was then refined and shortened with the objective of reducing the burden
on the respondents while improving the quality and relevance of the data gathered. To the extent
possible, the content was similar to that gathered from primary care physicians. The primary
source of information about the potential participants was the Delaware medical and nurse
license files.
At the conclusion of the survey, 190 of 302 advanced practice nurses (APN) had
participated in the research. Of the 95 physician assistants (PA), 53 responded to the survey.
Delaware currently has licensed 302 advanced practice nurses and 95 physician
assistants to assume responsibility for providing patient care in Delaware in a number of
circumstances. Of those, an estimated 255 APNs and 55 PAs are actively working either part-
time or full-time in a Delaware practice. The remainder are either not working in Delaware or are
employed in some other capacity. This total is used to produce all estimates presented throughout
this report.
Non-physician clinicians working in primary care are the focus of this report. This group
includes nurse practitioners, nurse-midwives, and physician assistants. The survey to date has
identified 85 APNs and 15 physician assistants acting in this capacity. After weighting for non-
respondents, the expected number of primary care APNs is 122. There are in addition, an
estimated 23 PAs providing primary care. Lay midwives were not included in the survey,
although one is certified to practice in the state.
Not all non-physician clinicians practice full-time. Others practice full-time but do not
deliver direct patient care on a full-time basis. To give a more realistic view of the full-time
equivalent primary care non-physician clinicians available, a second calculation was required. A
non-physician clinician who was engaged in delivering primary care directly to patients 40 or
more hours per week was defined as full-time. Anything less than 40 hours was considered as
Primary Care Non-physician Clinicians in Delaware Overview ______________________________________________________________________________
_____________________________________________________________________________________ 3
less than full-time. For each four hours less than 40 hours, 0.1 FTE was deducted. Anything more
than 40 hours was considered only as full-time.3 In other words, a non-physician clinician
delivering 60 hours per week of primary care was still counted as one full-time equivalent non-
physician clinician.
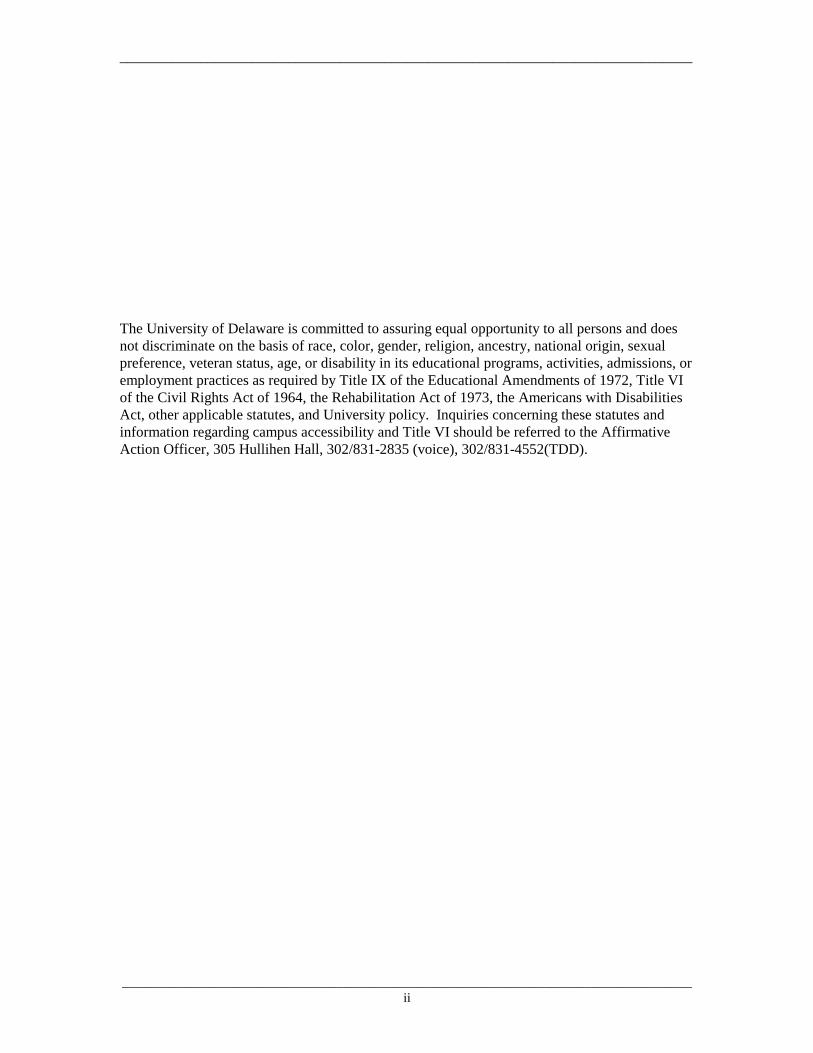
Figure 1.2 below summarizes the current number of primary care non-physician
clinicians in Delaware by county of practice. The number of non-physicians is provided in Figure
1.2 along with estimates of full-time equivalents (FTE).
Figure 1.2 Non-physician Clinicians in Primary Care
by County and Group
Source: Center for Applied Demography & Survey Research, University of Delaware
In the remainder of this report, different aspects of primary care NPCs and their practices
will be examined. Overall the objective is to touch on those attributes that affect the availability
of primary care. In the section that follows, the basic demographics of the primary care NPCs are
discussed. Of particular interest is the age structure and diversity of these clinicians. The next
3 Federal Register/Vol.45, No.223/ Monday, November17, 1980, Part IV Department of Health and Human Services, 42 CFR Part 5, p.76002.
Kent New Castle Sussex Delaware0
20
40
60
80100
120
140
APN/PA
APN 11 89 22 122APN-FTE 9.2 73.7 18.5 101.4
PA 7 10 6 23PA-FTE 6.1 10 4.7 20.8

Primary Care Non-physician Clinicians in Delaware Overview ______________________________________________________________________________
_____________________________________________________________________________________ 4
section deals with practice characteristics. Important issues such as practice setting, supervision,
and patient mix are discussed.

_____________________________________________________________________________________5
Demographics
One of the first items addressed by the survey was the respondents’ perception to barriers
they faced in working as non-physician clinicians (NPC). The barriers presented to the
respondents were extensive. However, only those barriers that were mentioned as being a
problem by at least 25% of the respondents are reported in Figure 2.1 below.
Figure 2.1 Barriers:
Primary Care NPCs by Group
Source: Center for Applied Demography & Survey Research, University of Delaware
The responses are quite consistent within and across both groups. Lack of positions is of
concern to both groups but is significantly higher among PA’s. This may in part be related to the
perception of higher levels of resistance among physicians and it may also reflect the fact that
this category of clinicians developed somewhat later. This result is also consistent with the
concern that the public’s knowledge about these professions is insufficient. If the public is
unaware of the capabilities of NPCs, it is reasonable to expect less demand for their services.
Both groups are concerned with the lack of knowledge about NPCs exhibited by other
health professionals. Consequently, their assignments do not reflect the skills acquired in
becoming NPCs. This finding would seem to suggest that NPCs feel they are being under utilized
Lack of Positions Differentiation Public Knowledge Insurance System Physician Resistance0
10
20
30
40
50
60
70
Percent
APN 30.1 39.3 36.1 26.8 18.9PA 45.8 41.7 66.7 13 26.1

Primary Care Non-physician Clinicians in Delaware Demographics ______________________________________________________________________________
_____________________________________________________________________________________ 6
within their current practice settings. The difference in concern about the health insurance system
is undoubtedly explained by the difference in the practice settings between the two groups.
The topic of demographic diversity within the primary care NPC community may seem
irrelevant. However, some patients may feel more comfortable with and are able to communicate
better with clinicians having particular characteristics. In addition, NPCs with particular
demographic characteristics may be more likely to train in one of the primary care specialties.
Figure 2.2 Gender:
Primary Care NPCs by County and Group
Source: Center for Applied Demography & Survey Research, University of Delaware
The NPC primary care community in Delaware is somewhat more than 90% female
(Figure 2.2 above). In contrast, the physician community is about 70% male. There is however
some variation between the groups and counties. APNs are almost exclusively female while PAs
are about 65% female. All of the male NPCs are located in New Castle and Kent counties. The
differences in gender between the two groups reflects the concentration of females in the overall
nursing profession, the length of time in the profession, and the later appearance of PAs on the
health care scene.
KC-APN NCC-APN SC-APN KC-PA NCC-PA SC-PA0
20
40
60
80
100
Percent
Female 100 96.6 100 42.9 60 100Male 0 3.4 0 57.1 40 0

Primary Care Non-physician Clinicians in Delaware Demographics ______________________________________________________________________________
_____________________________________________________________________________________ 7
Figure 2.3 Race:
Primary Care NPCs by County and Group
Source: Center for Applied Demography & Survey Research, University of Delaware
The racial distribution of primary care NPCs by county is shown in Figure 2.3, above. In
general, NPCs are not a racially diverse group. There is some diversity among APNs in Kent
County and PAs in New Castle County; otherwise the NPCs are Caucasian. This result is in
sharp contrast with the primary care physician community where about 20% of physicians were
from a minority group in all three counties. The broader NPC community shares the same lack of
diversity shown here for primary care NPCs.
Hispanic origin has taken on a particular interest in Delaware with the rapid growth of
that population in the 1990s, particularly in Sussex County. The distribution of primary care
NPCs by Hispanic Origin is found in Figure 2.4, below. The figure shows that there are very few
Hispanic NPCs in Delaware and all of those were located in New Castle County. While the
numbers were also small among primary care physicians, there were Hispanic physicians in
every county and the numbers were highest in Sussex County as might be expected.
There is no obvious reason for the lack of racial and ethnic diversity among NPCs.
Factors that might affect it are preferences for higher education (most APNs hold a masters
degree) and preferences for practice settings.
KC-APN NCC-APN SC-APN KC-PA NCC-PA SC-PA0
20
40
60
80
100
Percent
Caucasian 66.7 97.8 100 100 80 100African-American 11.1 1.1 0 0 10 0
Other 22.2 1.1 0 0 10 0

Primary Care Non-physician Clinicians in Delaware Demographics ______________________________________________________________________________
_____________________________________________________________________________________ 8
Figure 2.4 Hispanic Origin:
Primary Care NPCs by County and Group
Source: Center for Applied Demography & Survey Research, University of Delaware
The age distribution of primary care NPCs is found in Figure 2.5, below. There are
several points of interest in this display. First, PAs are significantly younger than APNs. This is
expected because the PA as a profession developed later and APNs usually develop somewhat
later in the career cycle and generally require an advanced degree. The age distribution of PAs is
similar between the counties with the youngest group working in Kent County.
APNs have a distinctly different age distribution than PAs and there is considerable
variation between the counties. Older APNs seem to be concentrated in Kent and Sussex
counties. In addition, the APNs in the two lower counties are distributed across the age spectrum
more broadly than those located in New Castle County. In New Castle County, 95% of the APNs
are between the ages of 35 and 54. In general the NPC primary care community is younger than
primary care physicians and the concentration is in the middle age ranges.
KC-APN NCC-APN SC-APN KC-PA NCC-PA SC-PA0
20
40
60
80
100
Percent
Hispanic 0 2.3 0 0 10 0Non-Hispanic 100 97.7 100 100 90 100

Primary Care Non-physician Clinicians in Delaware Demographics ______________________________________________________________________________
_____________________________________________________________________________________ 9
Figure 2.5 Age:
Primary Care NPCs by County and Group
Source: Center for Applied Demography & Survey Research, University of Delaware
Figure 2.6 State of High School Graduation:
Primary Care NPCs by Group
Source: Center for Applied Demography & Survey Research, University of Delaware
KC-APN NCC-APN SC-APN KC-PA NCC-PA SC-PA0
10
20
30
40
50
60
Percent
Under 35 10 2.3 8.7 57.1 50 41.735-44 30 43 39.1 42.9 40 45.845-54 20 52.3 30.4 0 10 12.5
55+ 40 2.3 21.7 0 0 0
DE MD NJ NY PA Other0
10
20
30
40
50
Percent
APN 43.4 9.1 7.4 5.7 17.2 17.2PA 28.1 0 16.1 12.1 24.1 19.6

Primary Care Non-physician Clinicians in Delaware Demographics ______________________________________________________________________________
_____________________________________________________________________________________ 10
Some primary care non-physician clinicians choose to practice clinical medicine in
Delaware and others practice in other states. Understanding the factors that influence an NPC’s
choice whether or not to provide clinical care to Delaware residents is important in determining
the future capacity of NPCs to provide primary care services. Two pieces of information
obtained through this survey are useful for this purpose. The first item is the area or state in
which the NPC originally resided as measured by the state from which he/she graduated from
high school. The second data element is the state in which the NPC attended his/her training
program.
In Figure 2.6, the distribution of the state of the primary care NPC’s high school
graduation is shown. The first interesting aspect of this figure is that about 80% of Delaware’s
primary care NPCs grew up in the region and approximately 41% are from Delaware. In general,
NPCs are somewhat more likely to have come from the region than primary care physicians
(80% compared with 66%) and are considerably more likely to have grownup in Delaware (41%
compared with 13%).
Figure 2.7 State of Training Program:
Primary Care NPCs by Group
Source: Center for Applied Demography & Survey Research, University of Delaware
DE DC MD PA Other0
10
20
30
40
50
60
Percent
APN 35.5 4.1 6.6 40.5 13.3PA 0 8.3 8.3 50.1 33.3

Primary Care Non-physician Clinicians in Delaware Demographics ______________________________________________________________________________
_____________________________________________________________________________________ 11
There are significant differences between APNs and PAs as well. While they are about
as likely to come from the region, PAs are less likely to have graduated from high school in
Delaware and are more likely to have come from New York, New Jersey, or Pennsylvania.
The pattern observed for the state of high school graduation is replicated in part for the
state of training program graduation (Figure 2.7 above). Significantly more primary care NPCs
graduate from programs in Pennsylvania than in any other neighboring state. Once again, there is
a significant difference between APNs and PAs. Since there is no PA program in Delaware none
of the PAs either in the primary care group or the broader group was educated in Delaware. The
concentration in PA graduates from Pennsylvania mirrors that for APNs.
Figure 2.8
Focus of Training Program: Primary Care NPCs by Group
Source: Center for Applied Demography & Survey Research, University of Delaware
The focus of the training program was much more diverse for APNs than for PAs as is
shown in Figure 2.8 above. The vast majority of PAs (87%) graduated from programs with an
orientation toward family medicine. In contrast, APNs in primary care are spread across a wide
spectrum. The distribution of APNs is similar to that of primary care physicians.
Family Pediatric Adult Women Midwifery Other0
20
40
60
80
100
Percent
APN 33.6 21.3 12.3 18.9 8.2 20.4PA 87 0 0 0 0 23

Primary Care Non-physician Clinicians in Delaware Demographics ______________________________________________________________________________
_____________________________________________________________________________________ 12
Finally, respondents were asked about their current salaries and these are shown in
Figure 2.9 below. The distributions are similar within each group, however the differences
between APNs and PAs are significant.
Figure 2.9 Current Salaries:
Primary Care NPCs by County and Group
Source: Center for Applied Demography & Survey Research, University of Delaware
Salaries for APNs are distributed fairly well across the spectrum and the distributions
within the counties are not all that different. This in part reflects the broader distribution of
age/experience within the APN ranks. Clearly, PAs tend to be paid more. None of the PAs
responding reported a salary of less than $35,000. Given that the typical age of PAs is younger
than that for APNs, it appears PAs of equivalent experience are better compensated. This may
also be a function of the settings in which PAs practice. It also may be a reflection of differences
in experience. In general, PAs have been practicing as NPCs longer than APNs.
In the next section, the characteristics of the practices in which primary care NPCs in
Delaware operate will be discussed.
KC-APN NCC-APN SC-APN KC-PA NCC-PA SC-PA0
10
20
30
40
50
60
70
Percent
$35K-$45K 22.2 11.1 36.8 0 0 0$45K-$55K 22.2 22.2 5.3 66.7 44.4 50$55K-$65K 33.3 44.4 31.6 0 33.3 50
$65K+ 22.2 22.2 26.3 33.3 22.2 0

_____________________________________________________________________________________13
Practice Characteristics
The 145 primary care non-physician clinicians working in Delaware are distributed
across different specialties and have different types of practices. In this section, some of the key
characteristics of those practices are discussed.
While in theory primary care NPCs deliver similar services, they also practice in their
reported specialties. Figure 3.1 contains the estimates for these specialties by group.
Figure 3.1 Specialty:
Primary Care NPCs by Group
Source: Center for Applied Demography & Survey Research, University of Delaware
For APNs no one specialization really dominates the distribution. In fact, they are split
fairly uniformly among the specialties. Referring back to Figure 2.8, the focus of training for
APNs was also split broadly across the reported categories. In contrast, PAs are concentrated in
Family Medicine as they were in Figure 2.8 earlier. However, they are not as heavily
concentrated as one might have expected. This probably reflects the reported shortage of
positions, reluctance for some primary care physicians to employ PAs, and the need of their
services across the full spectrum of patient care.
Family Pediatrics IM OBGYN Other0
10
20
30
40
50
60
Percent
APN 22.1 24.6 12.3 28.7 12.3PA 54.2 8.3 8.3 4.2 25
Primary Care Non-physician Clinicians in Delaware Practice Characteristics _____________________________________________________________________________________
_____________________________________________________________________________________ 14
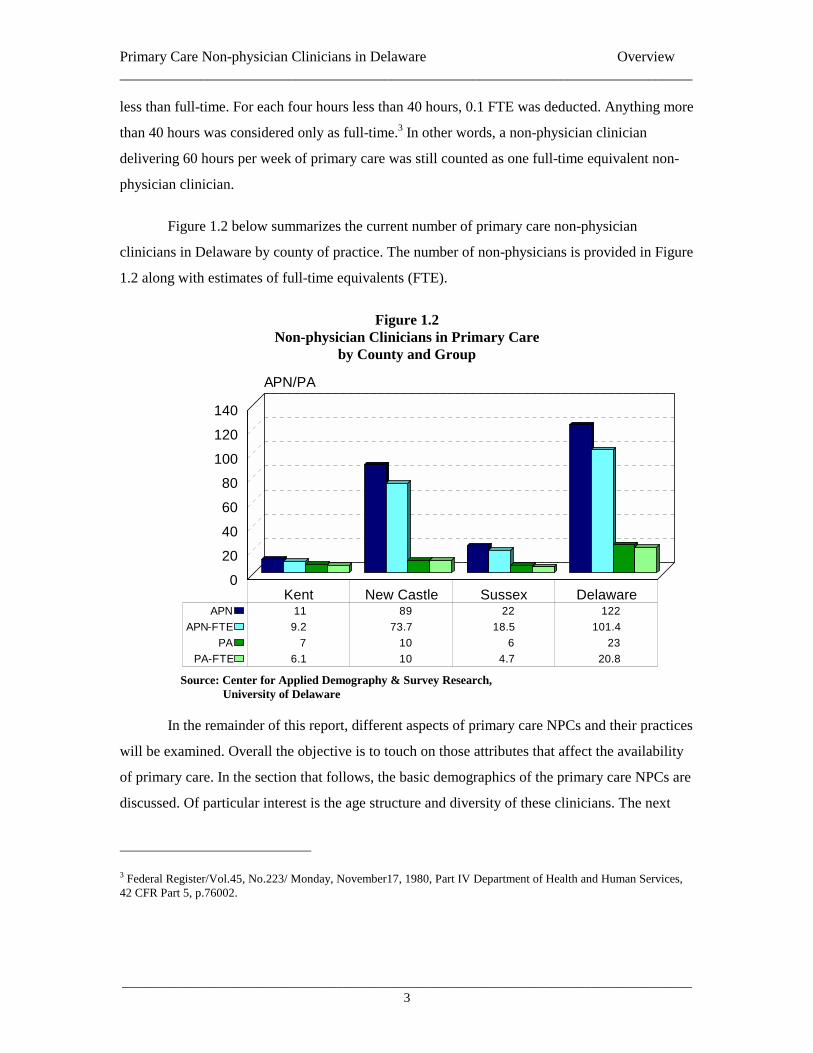
Figure 3.2 Number of Work Sites:
Primary Care NPCs by County and Group
Source: Center for Applied Demography & Survey Research, University of Delaware
Thirty seven percent of NPCs statewide, practice at multiple locations. However, that
proportion varies somewhat by county and significantly by group as is shown in Figure 3.2
above. PAs are more than twice as likely to practice at multiple sites than APNs. This may also
reflect the type of organization that employs the NPC. If PAs were more likely to be employed by
organizations that had multiple locations compared with APNs, then that could explain the
difference.
Sussex County NPCs are the most likely to practice at multiple sites independent of
whether they are an APN or PA. This is probably brought about by the combination of low
population density and the large number of small towns.
There are both similarities and differences in the practice settings experienced by PAs
and APNs (Figure 3.3 below). About 40% of both groups work for physicians in private practice
including both individual and group practices. They are also about as likely to be working in a
school. APNs rarely report working in emergency rooms while about a quarter of all PAs practice
in one. It appears that PAs and APNs work in different parts of the hospital given that many
emergency rooms are in hospitals and PAs do not report working in hospitals outside of the
KC-APN NCC-APN SC-APN KC-PA NCC-PA SC-PA0
20
40
60
80
100
Percent
Multiple Sites 36.4 25.6 47.6 71.4 70 83.3

Primary Care Non-physician Clinicians in Delaware Practice Characteristics _____________________________________________________________________________________
_____________________________________________________________________________________ 15
Figure 3.3 Practice Setting:
Primary Care NPCs by Group
Source: Center for Applied Demography & Survey Research, University of Delaware
Figure 3.4
Offer a Sliding Fee Schedule: Primary Care NPCs by County and Group
Source: Center for Applied Demography & Survey Research, University of Delaware
APN PA05
101520253035
Percent
Emergency 1.7 25.1Hospital 26.1 0
Individual 10.1 20.8Group 29.4 20.8School 10.9 12.5
Public Health 14.3 0Other 7.5 20.8
Kent New Castle Sussex Delaware0
10
20
30
40
50
60
Percent
APN 40.1 38.6 54.5 41.7PA 0 12.5 33.3 15.1

Primary Care Non-physician Clinicians in Delaware Practice Characteristics _____________________________________________________________________________________
_____________________________________________________________________________________ 16
emergency room. Finally, none of the PA respondents work in the public health discipline while
a significant number of APNs do. This may be because public health clinics that utilize NPCs
primarily specialize in the area of women and children’s health. Those are both specialties in
which APNs are more likely to have been trained.
One means of improving access to health care is to lower the cost to patients. One way of
doing this is to utilize a sliding fee schedule. This approach adjusts the professional fee based on
the income of the patient. Respondents were asked if such a practice was implemented at this
primary care practice site. The results are found in Figure 3.4, above.
The responses of APNs were fairly consistent across the state with almost 42% reporting
that such a plan was in place.4 The findings were quite different for PAs where only 15%
statewide used this approach. The results were quite variable by county. Predictably, NPCs in
Sussex County reported the highest use since Sussex County incomes are the lowest in the state.
Figure 3.5 Treating Medicare Patients:
Primary Care NPCs by County and Group
Source: Center for Applied Demography & Survey Research, University of Delaware
NPCs were asked if they were treating Medicare patients at the reference site. These
responses must be interpreted carefully since almost 25% of APNs and 8% of PAs are working in
4 There are 25 APNs that work for Title X Family Planning Clinics that must use a sliding fee scale.
Kent New Castle Sussex Delaware0
20
40
60
80
100
Percent
APN 54.5 56.7 77.3 60.2PA 100 100 42.9 83.3

Primary Care Non-physician Clinicians in Delaware Practice Characteristics _____________________________________________________________________________________
_____________________________________________________________________________________ 17
the area of pediatrics. They may see a small group of children who are covered by SSI (Social
Security Insurance). Statewide 60% of APNs are treating Medicare patients with the highest rate
being in Sussex County. Sussex County has the oldest population and also has a smaller
proportion of pediatric patients. A higher percentage of PAs was treating Medicare patients but
then, there were far fewer PAs in pediatrics. These results are comparable to those gathered from
primary care physicians earlier in the year where 76.9% were treating Medicare patients.
Figure 3.6 Treating Medicaid Patients:
Primary Care NPCs by County and Group
Source: Center for Applied Demography & Survey Research, University of Delaware
Respondents were also asked if they treated Medicaid patients at the reference site. The
results show a high level of acceptance throughout the state by both groups (Figure 3.6, above).
If anything, the levels are slightly higher than those measured for primary care physicians. This
level may be influenced by the APNs located at public health clinics and schools.
NPCs are usually under the supervision of a physician. However, the extent and method
of this supervision can vary. State regulations generally determine the level of autonomy granted
to NPCs. Over time, the nature and extent of state practice prerogatives have grown. Respondents
were asked to describe the nature of their relationship with physicians. The results are found in
Figure 3.7, below.
Kent New Castle Sussex Delaware0
20
40
60
80
100
Percent
APN 81.8 89.7 100 90.8PA 66.7 100 71.4 82.6

Primary Care Non-physician Clinicians in Delaware Practice Characteristics _____________________________________________________________________________________
_____________________________________________________________________________________ 18
The vast majority of NPCs have a physician on site and this is particularly true for PAs.
APNs exhibit somewhat more variability in their arrangements than do PAs. APNs must have a
written collaborative agreement with a physician, but can practice independently. PAs cannot
practice independently.
The significant proportions in the other category reflect combinations of the options
provided rather than some previously unspecified alternative. APNs were most likely to have
written protocols combined with telephone consultation if a physician was not on site.
Figure 3.7 Relationship with Physician:
Primary Care NPCs by Group
Source: Center for Applied Demography & Survey Research, University of Delaware
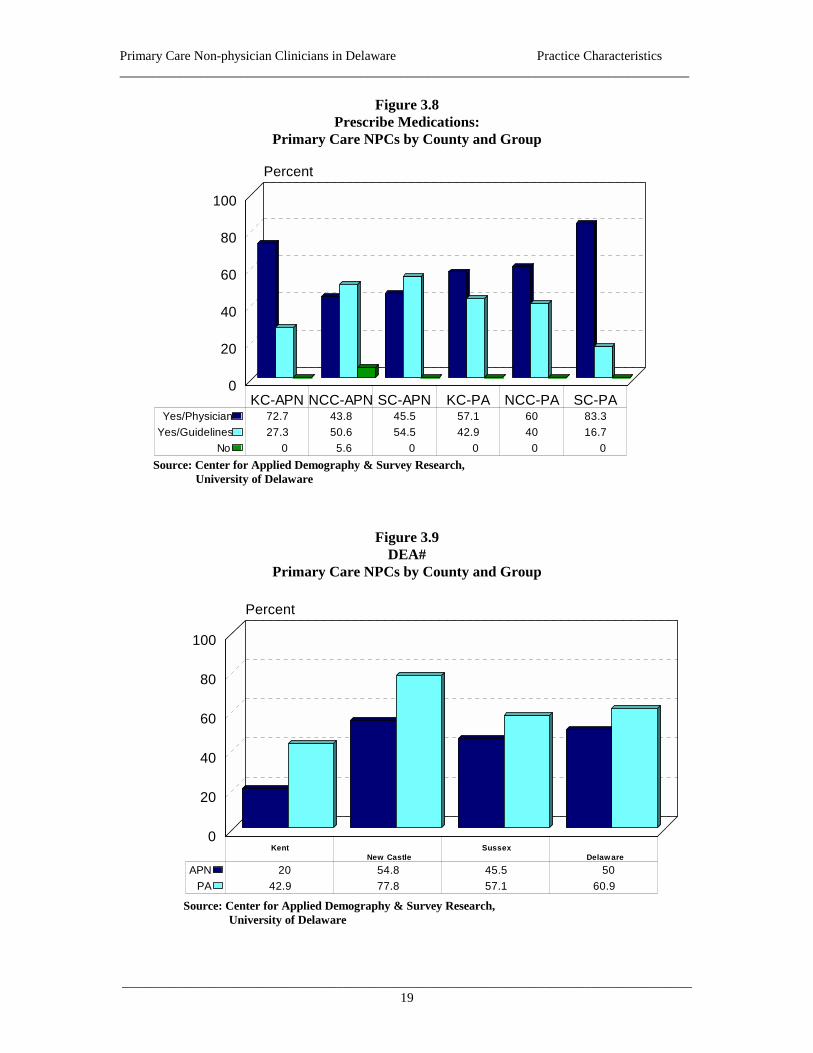
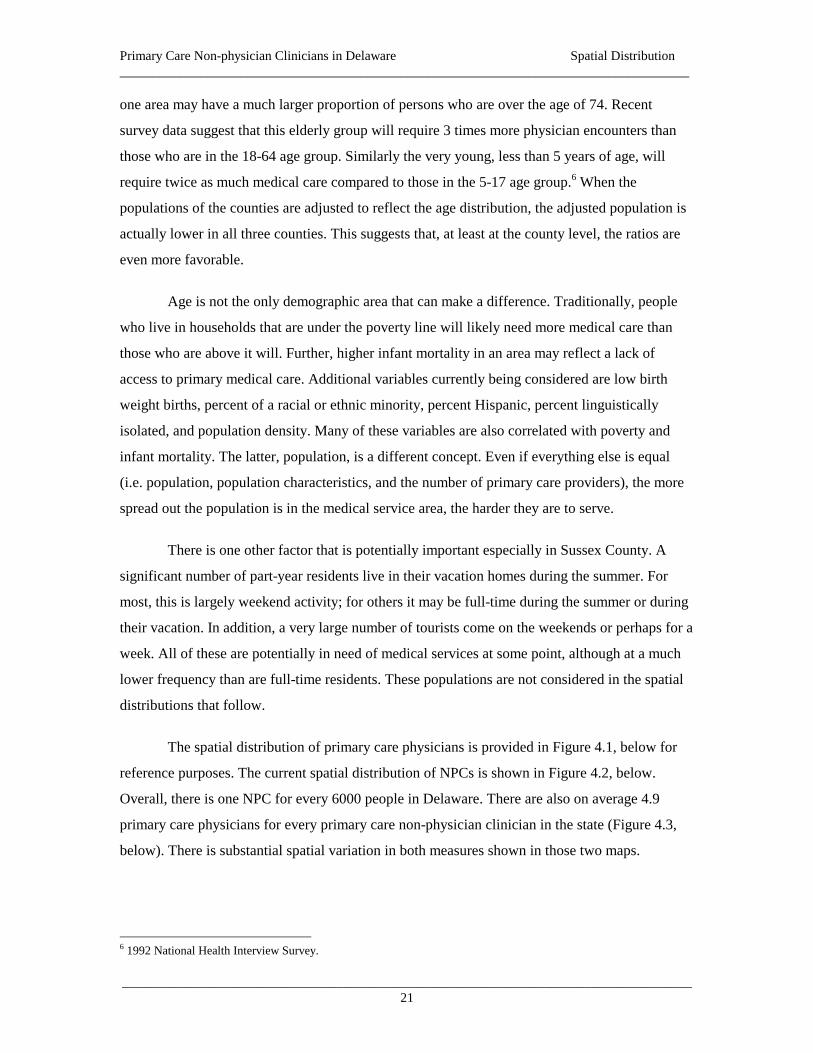
Finally, respondents were asked about their role in prescribing medication (Figure 3.8,
below). Almost everyone reported some role in preparing prescriptions. Overall, there was a
fairly even split between prescribing medication in consultation with a physician and using
institutional guidelines. PAs were more likely to work with a physician while APNs tend to work
at sites where MDs are not always on site. APNs work within the established collaborative
agreements, which includes guidelines for practice. The only exception to this generalization was
APNs in Kent County. However, Kent County APNs were significantly less likely to have a
DEA#. The need for a DEA# depends on the scope of the APN’s practice since some
medicationscan be prescribed without it. (Figure 3.9, above). Overall, PAs statewide were more
likely to have a DEA# than APNs.
No PhysicianPhysician on-site
Physician on phoneWritten Protocols
Other0
20
40
60
80
Percent
APN 1.6 57.4 5.7 7.4 27.9PA 0 75 0 0 25
Primary Care Non-physician Clinicians in Delaware Practice Characteristics _____________________________________________________________________________________
_____________________________________________________________________________________ 19
Figure 3.8 Prescribe Medications:
Primary Care NPCs by County and Group
Source: Center for Applied Demography & Survey Research, University of Delaware
Figure 3.9 DEA#
Primary Care NPCs by County and Group Source: Center for Applied Demography & Survey Research, University of Delaware
KentNew Castle
SussexDelaware
0
20
40
60
80
100
Percent
APN 20 54.8 45.5 50PA 42.9 77.8 57.1 60.9
KC-APN NCC-APN SC-APN KC-PA NCC-PA SC-PA0
20
40
60
80
100
Percent
Yes/Physician 72.7 43.8 45.5 57.1 60 83.3Yes/Guidelines 27.3 50.6 54.5 42.9 40 16.7
No 0 5.6 0 0 0 0

_____________________________________________________________________________________20
Spatial Distribution
In the report entitled “Primary Care Physicians in Delaware 1998” the conclusion was
reached that Delaware probably had a sufficient supply of primary care physicians if they were
spatially distributed with the population. According to the Council on Graduate Medical
Education, a ratio of 1250:1 of persons per primary care physician corresponds to the lower end
of the acceptable range for supply of primary care providers. Delaware currently has a ratio of
1212:1 without considering non-physician clinicians or international medical school graduates
holding J-1 visas. The ratios are 1708:1, 1114:1, and 1267:1 for Kent, New Castle, and Sussex
counties respectively.
The federal government recognizes the importance of having an adequate number of
primary care physicians in areas smaller than states or even counties. In their program for
medically underserved areas and populations (MUA/P), “rational areas for the delivery of
primary medical care services” can be counties, parts of counties, and even neighborhoods within
metropolitan areas with a strong identity and a population of 20,000.5 In general, an underserved
area will have a ratio of 3500:1 (in special cases 3000:1) or higher to qualify. Obviously, none of
the counties would qualify if that were the spatial area considered.
In the new proposed definition of the MUA/P, specific reference is made to non-
physician clinicians. While recognizing that the independence of the NPC is a function of state
regulations a benchmark allowance of 0.5 per primary care NPCs is suggested. If these NPCs
were included along with primary care physicians, the ratio of 1212 persons per primary care
physician in Delaware would fall to 1010:1. This assumes that all of these NPCs are operating
independently when we know that at least 25% are working in hospitals or emergency rooms.
The characteristics of the population do matter. Two areas with equal populations and
equal numbers of primary care physicians are not necessarily in the same condition. For example,
5 In the September 1,1998 Federal Register DHHS proposed new regulations for medically underserved populations (MUP) and health professional shortage areas (HPSA), the Department of Health and Human Services generally recognizes a ratio of 3000:1 as sufficient for an area to be classified as a HPSA. To be classified as an MUP an index of primary care shortage (IPCS) is computed utilizing a number of factors: (1) population to primary care ratio, (2) percent below 200% of the poverty level, (3) infant mortality rate, (4) low birth weight rate, (5) percent of a racial minority, (6) percent of Hispanic ethnicity, (7) percent linguistically isolated, and (8) population density. More importantly, non-physician clinicians are counted as 0.5 physicians or higher depending on state guidelines.
Primary Care Non-physician Clinicians in Delaware Spatial Distribution _____________________________________________________________________________________
_____________________________________________________________________________________ 21
one area may have a much larger proportion of persons who are over the age of 74. Recent
survey data suggest that this elderly group will require 3 times more physician encounters than
those who are in the 18-64 age group. Similarly the very young, less than 5 years of age, will
require twice as much medical care compared to those in the 5-17 age group.6 When the
populations of the counties are adjusted to reflect the age distribution, the adjusted population is
actually lower in all three counties. This suggests that, at least at the county level, the ratios are
even more favorable.
Age is not the only demographic area that can make a difference. Traditionally, people
who live in households that are under the poverty line will likely need more medical care than
those who are above it will. Further, higher infant mortality in an area may reflect a lack of
access to primary medical care. Additional variables currently being considered are low birth
weight births, percent of a racial or ethnic minority, percent Hispanic, percent linguistically
isolated, and population density. Many of these variables are also correlated with poverty and
infant mortality. The latter, population, is a different concept. Even if everything else is equal
(i.e. population, population characteristics, and the number of primary care providers), the more
spread out the population is in the medical service area, the harder they are to serve.
There is one other factor that is potentially important especially in Sussex County. A
significant number of part-year residents live in their vacation homes during the summer. For
most, this is largely weekend activity; for others it may be full-time during the summer or during
their vacation. In addition, a very large number of tourists come on the weekends or perhaps for a
week. All of these are potentially in need of medical services at some point, although at a much
lower frequency than are full-time residents. These populations are not considered in the spatial
distributions that follow.
The spatial distribution of primary care physicians is provided in Figure 4.1, below for
reference purposes. The current spatial distribution of NPCs is shown in Figure 4.2, below.
Overall, there is one NPC for every 6000 people in Delaware. There are also on average 4.9
primary care physicians for every primary care non-physician clinician in the state (Figure 4.3,
below). There is substantial spatial variation in both measures shown in those two maps.
6 1992 National Health Interview Survey.

Primary Care Non-physician Clinicians in Delaware Spatial Distribution _____________________________________________________________________________________
_____________________________________________________________________________________ 22
Figure 4.1 Persons per Primary Care Physician
by Census County Division
Source: Center for Applied Demography & Survey Research, University of Delaware
Persons per Physician
299 to 1250
1250 to 2000
2000 to 3000
3000 to 4000
5000 to 6758
No PCPs Reporting
Miles
20100

Primary Care Non-physician Clinicians in Delaware Spatial Distribution _____________________________________________________________________________________
_____________________________________________________________________________________ 23
Figure 4.2 Persons per Primary Care Non-physician Clinician
by Census County Division
Source: Center for Applied Demography & Survey Research, University of Delaware
Persons per NPC
1000 to 3000
3000 to 4000
4000 to 6000
6000 to 12000
12000 to 61000
No NPCs Reporting
Miles
20100
�

Primary Care Non-physician Clinicians in Delaware Spatial Distribution _____________________________________________________________________________________
_____________________________________________________________________________________ 24
Figure 4.3 Physicians per Non-physician Clinician in Primary Care
by Census County Division
Source: Center for Applied Demography & Survey Research, University of Delaware
Physicians per NPC
1.2 to 2
2 to 5
5 to 7
7 to 11
11 to 27
No NPCs Reporting
Miles
20100
�

Primary Care Non-physician Clinicians in Delaware Spatial Distribution _____________________________________________________________________________________
_____________________________________________________________________________________ 25
One use for this information is to examine areas in Figure 4.1 that are under served.
Those areas are shaded in light and dark red. In New Castle County, those areas are in the
vicinity of Route 40 and the City of New Castle. Unfortunately, the same areas have a paucity of
NPCs. The same situation exists in Kent County. The under served areas are in the southern part
of the county. Those areas are also without NPCs. Essentially the same situation exists in Sussex
County.
The findings indicate that many NPCs do not work independently. They are generally
located within the physician practice site. A potential solution would be to increase the number
of service sites and staff those sites with APNs operating independently with a collaborative
agreement.
Another way of looking at the use of NPCs is as complements to physicians rather than
as substitutes for them. In that context, the ratio of primary care physicians to primary care NPCs
is one way of looking at this issue (Figure 4.3, above). In general, there is one primary care NPC
for every five primary care physicians in Delaware. In the figure, areas shaded blue or green have
more NPCs for each physician so the ratio is lower. Kent County primary care physicians report
using more non-physician resources than the other two counties and the map shows that. Sussex
County physicians use the least and that also is reflected in the figure. New Castle County is
mixed. Clearly, there is a greater use of these resources in hospitals, clinics, and emergency
rooms and that too is found in the figure.
In the final analysis, there is little in this data that suggests that NPCs will help the under
served areas unless the practice settings change. That certainly does not diminish the contribution
NPCs are making in the current practice settings. In the end, the answer is more independent
primary care by NPCs and that may require adjustments by the regulatory agencies, physicians,
and the general public.

_____________________________________________________________________________________26
Observations
The Delaware Non-physician Clinician Survey is only in its first year and as such lacks
the refinements that come with multiple administrations. Still it shows promise for aiding policy-
makers charged with making judgments about the health care system in the State of Delaware.
Approximately 61% of the non-physician clinicians (NPC) participated in the survey, so the
database is still far from complete. There are still refinements to be made to better measure the
key items and, at the same time, to eliminate those items that add to the NPC’s burden without
adding to needed knowledge. Even without complete reporting, a number of findings can be
drawn from the data.
• There is approximately one primary care NPC for every five primary care physicians in Delaware. This ratio varies considerably throughout the state.
• APNs outnumber PAs in primary care by roughly five to one. APNs are almost twice as likely to be working part-time.
• APNs and PAs alike seem to feel underemployed in their current positions. They point to a lack of understanding about their training.
• Continued efforts to increase awareness among both the general public and health care professionals, as to the skills and capabilities of NPCs, are necessary.
• APNs are more likely to be distributed according to their training. PAs are more widely dispersed across the specialties than would be expected based on their training. PAs tend to be concentrated in family medicine and emergency services.
• One third of APNs were trained in Delaware while no PA program is available in the state. This may partially account for the five to one ratio mentioned above.
• There are two college programs in the state offering a masters degree in nursing with different advanced practice specialties.
• PAs are generally younger and are relatively higher paid although the part-time/full-time differential makes this difficult to discern.
• PAs tend to work in emergency rooms of hospitals but seem not to venture outside of that assignment. In contrast, APNs work in hospitals but primarily outside of the emergency room.
• There may be a need to encourage more Hispanic or Spanish speaking NPCs, as that population grows more numerous in the state particularly in Sussex County.

Primary Care Non-physician Clinicians in Delaware - 1998 Observations _____________________________________________________________________________________
_____________________________________________________________________________________ 27
• To expand access to medical services for all citizens, but particularly the under served, it may be necessary to increase independent primary care for NPCs. This may require the revision of existing rules produced by regulatory agencies for some disciplines.

_____________________________________________________________________________________28
APPENDIX

Primary Care Non-physician Clinicians in Delaware - 1998 Appendix _____________________________________________________________________________________
_____________________________________________________________________________________ 29
DELAWARE PHYSICIAN ASSISTANT (PA) SURVEY 1998 1. Indicate the type of program in which you received your education as a PA:
1[ ] Certificate 2[ ] Associates degree 3[ ] Bachelor’s 4[ ] Master’s 5[ ] Post Master’s Certificate 6[ ] Other (Specify)____________________
2. Year of graduation from your PA program: 19___ 3. Name and location of institution where you received your PA education: Institution__________________________ City/State____________________________ 4. What was the major focus of your PA program: (Select ONE of the following):
1[ ] Family 6[ ] Adult 2[ ] Pediatric/Child Health 7 [ ] Women’s Health/Ob-Gyn 3[ ] School Health 8[ ] Neonatal 4[ ] Gerontology 9[ ] Public Health 5[ ] Psychiatric/Mental Health 10[ ] Other (specify)______________
5. What was the primary focus of your PA residency program:
(Select ONE of the following): 1[ ] Did NOT attend a residency program 2[ ] Neonatology 3[ ] Surgery 4[ ] Emergency Medicine 5[ ] Other (specify) __________________
6. Please indicate the highest degree that you currently have:
1[ ] Associates degree 2[ ] Bachelor’s 3[ ] Master’s 4[ ] Post Master’s Certificate 5[ ] Other (Specify)____________________
7. Are you currently working in Delaware as a PA?
1[ ] Yes, full-time (SKIP TO QUESTION 9) 2[ ] Yes, part-time (SKIP TO QUESTION 9) 3[ ] No, but employed in a health related field
4[ ] No, employed in another state 5[ ] No, not employed 6[ ] No, not licensed in Delaware 7[ ] No, recent graduate

Primary Care Non-physician Clinicians in Delaware - 1998 Appendix _____________________________________________________________________________________
_____________________________________________________________________________________ 30
8. Please choose ONE of the following responses which best describes the reason you are not currently working in a physician assistant role:
1[ ] I chose not to for personal reasons. 2[ ] There are no physician assistant positions available in my area. 3[ ] I can earn more money in another position. 4[ ] I am not allowed to practice as educated due to state legal restrictions. 5[ ] I am not allowed to practice as educated due to employment setting restrictions. 6[ ] Recent graduate, seeking employment. 7[ ] Other (specify)______________________________
9. On average, how many hours per week do you currently work as a physician assistant (including teaching, health administration, consulting and/or research)? [ ] hours per week a. What percentage of your time is devoted to direct patient care?
The percentage of time should total to 100% _____ % direct patient care - primary care _____ % direct patient care - specialty care _____ % other activities (please specify)____________________________ 10. If you provide primary care directly to clients, select the category of primary care in which you are chiefly involved: 1[ ] Family Practice 2[ ] Internal Medicine 3[ ] Pediatrics 4[ ] Women’s Health/Ob-Gyn 5[ ] I do NOT provide primary care directly to patients in any employment setting==> Skip to Question 14, Page 5 11. If currently employed full-time as a PA, please indicate the range which captures your annual salary:
1[ ] Less than $35,000 2[ ] $35,000 - $44,999 3[ ] $44,999 - $54,999 4[ ] $55,000 - $64,999 5[ ] $65,000+

Primary Care Non-physician Clinicians in Delaware - 1998 Appendix _____________________________________________________________________________________
_____________________________________________________________________________________ 31
12. If you are currently working as a PA, which (if any) of the following barriers are you experiencing? (please check all that apply)
1[ ] Salary lower than other health care related fields 2[ ] Overabundance of physician assistants 3[ ] Lack of positions for physician assistants 4[ ] Surplus of physicians 5[ ] Lack of adequate educational preparation to function as expected 6[ ] Lack of experience to function as expected 7[ ] Lack of understanding of the insurance system 8[ ] Resistance from registered nurses
9[ ] Resistance from physicians 10[ ] Lack of physician back-up 11[ ] Expected to assume other/administrative functions 12[ ] Lack of understanding/differentiation of all PA roles by other health professionals 13[ ] Lack of public knowledge about physician assistants 14[ ] High cost of malpractice insurance 15[ ] Inability to obtain malpractice insurance 16[ ] Limitation on types of services reimbursed 17[ ] Legislative barriers to fulfilling PA role 18[ ] Inadequate benefits 19[ ] Other (specify)__________________________________ 13. At how many sites do you provide direct patient care as a PA? [ ] site(s) Please provide the following information for your primary practice site.
a. This patient care setting is: 1[ ] Ambulatory 2[ ] Inpatient 3[ ] Both Ambulatory & Inpatient
b. Which of the following best describes this patient care setting (select only one):
1[ ] Emergency Room 7[ ] Corporate 2[ ] Hospital 8[ ] School 3[ ] Other Institution 9[ ] HMO 4[ ] Individual Physician Practice 10[ ] Public Health 5[ ] Group Physician Practice 6[ ] Other (specify)______________________________
c. The primary focus of your practice in this patient care setting is (select only
one): 1[ ] Family Practice 4[ ] Internal Medicine 2[ ] Pediatrics 5[ ] Women’s/Ob-Gyn Health 3[ ] Other (specify)________________________________
d. What is the average number of hours per week that you spend providing
primary care, both ambulatory and hospital follow-up, to patients in the areas of internal medicine, general/family practice, pediatrics or OB/GYN? [ ] hours per week devoted to primary care

Primary Care Non-physician Clinicians in Delaware - 1998 Appendix _____________________________________________________________________________________
_____________________________________________________________________________________ 32
e. What is the name, address, and ZIP Code of this site? ___________________________________ ___________________________________ ___________________________________
f. Is a sliding fee scale in which the professional fee is based upon the patient’s
family income offered at this site? 1[ ] Yes 2[ ] No
g. Are you treating MEDICARE patients at this site?
1[ ] Yes 2[ ] No
h. Are you treating MEDICAID patients at this site? 1[ ] Yes 2[ ] No
i. Which of the following practice arrangements best describes this site?
1[ ] Physician available for consultation for fee 2[ ] Physician available on-site majority of time 3[ ] Physician available by telecommunication 4[ ] Have written protocols 5[ ] Other (specify)______________________
j. Do you prescribe medications?
1[ ] Yes, in conjunction with a physician 2[ ] Yes, within institutional guidelines 3[ ] No
If yes to above, do you have a DEA# ? 1[ ] Yes 2[ ] No 14. Birth date: ___/___/___ (month, day, year)
15. State of residence at time of high school graduation:_____________________
16. Gender: 1[ ] Male 2[ ] Female
17. What is your Race: 1[ ] Caucasian or White 2[ ] Black or African American 3[ ] American Indian/Alaskan native 4[ ] Asian/Pacific Islander 5[ ] Other (specify)______________ 18. Are you of Hispanic origin: 1[ ] Yes 2 [ ] No 19. Please indicate the county, state, and ZIP Code of your current residence: County _________________________ State ___________________________ ZIP Code _______________________
DELAWARE ADVANCED PRACTICAL NURSE (APN) SURVEY

Primary Care Non-physician Clinicians in Delaware - 1998 Appendix _____________________________________________________________________________________
_____________________________________________________________________________________ 33
1998
1. Indicate the type of program in which you received your education as an Advanced Practice Nurse (nurse practitioner, nurse-midwife, clinical nurse specialist, nurse anesthetist): 1[ ] Certificate 2[ ] Master’s 3[ ] Post Master’s Certificate
4[ ] Other (specify)___________________ 2. Year of graduation from your APN program: 19___ 3. Name and location of the institution where you received your APN education:
Institution_____________________________ City/State__________________________
4. What was the major focus of your APN program: (Select ONE of the following): 1[ ] Family 7[ ] Adult 2[ ] Pediatric/Child Health 8[ ] Women’s Health/Ob-Gyn 3[ ] School Health 9[ ] Neonatal 4[ ] Gerontology 10[ ] Public Health 5[ ] Psychiatric/Mental Health 11[ ] Midwifery 6[ ] Nurse Anesthetist 12 [ ] Other (specify)_____________ 5. Are you currently working in Delaware as an Advanced Practice Nurse?
1[ ] Yes, full-time (SKIP TO QUESTION 7) 2[ ] Yes, part-time (SKIP TO QUESTION 7) 3[ ] No, but employed in nursing
What discipline? __________________ 4[ ] No, employed in another state 5[ ] No, employed in another field 6[ ] No, not employed 7[ ] No, not licensed in Delaware 8[ ] No, recent graduate
6. Please choose ONE of the following responses which best describes the reason you are not currently working in an advanced practice role: 1[ ] There are no advanced practice positions available in my area. 2[ ] I can earn more money in another nursing position. 3[ ] I am not allowed to practice as educated due to state legal restrictions. 4[ ] I am not allowed to practice as educated due to employment setting restrictions. 5[ ] Recent graduate, seeking employment. 6[ ] Other (specify) _______________________________

Primary Care Non-physician Clinicians in Delaware - 1998 Appendix _____________________________________________________________________________________
_____________________________________________________________________________________ 34
PLEASE ANSWER THE FOLLOWING QUESTIONS ONLY IF YOU ARE CURRENTLY EMPLOYED AS AN ADVANCED PRACTICE NURSE (APN).
OTHERWISE SKIP TO QUESTION 13 ON PAGE 5. 7. Are you currently working as a: Nurse Practitioner 1[ ] Yes 2[ ] No Nurse-Midwife 1[ ] Yes 2[ ] No Clinical Nurse Specialist 1[ ] Yes 2[ ] No Nurse Anesthetist 1[ ] Yes 2[ ] No 8. On average, how many hours per week do you currently work as an APN (including teaching, health administration, consulting and/or research)? [ ] hours per week
a. What percentage of your time is devoted to direct patient care? (the percentage of time should total to 100%)
______ % direct patient care - primary care ______ % direct patient care - specialty care ______ % other activities (please specify)___________________________ 9. If currently employed full-time as an APN, please indicate the range which captures your annual salary:
1[ ] Less than $35,000 2[ ] $35,000 - $44,999 3[ ] $44,999 - $54,999 4[ ] $55,000 - $64,999 5[ ] $65,000+
10. If you are currently working as an APN, which (if any) of the following barriers are you experiencing?
(please check all that apply) 1[ ] Salary lower than other health care related fields 2[ ] Overabundance of APNs 3[ ] Lack of positions for APNs 4[ ] Surplus of physicians 5[ ] Lack of adequate educational preparation to function as expected 6[ ] Lack of experience to function as expected 7[ ] Lack of understanding of the insurance system 8[ ] Resistance from registered nurses
19[ ] Resistance from physicians 10[ ] Lack of physician back-up 11[ ] Expected to assume other/administrative functions 12[ ] Lack of understanding/differentiation of all advanced practice roles by other health professionals 13[ ] Lack of public knowledge about APNs 14[ ] High cost of malpractice insurance 15[ ] Inability to obtain malpractice insurance 16[ ] Limitation on types of services reimbursed 17[ ] Legislative barriers to fulfilling APN role 18[ ] Inadequate benefits 19[ ] Other (specify)__________________________________ 11. If you provide primary care directly to clients, select the category of primary care in which you are chiefly involved:

Primary Care Non-physician Clinicians in Delaware - 1998 Appendix _____________________________________________________________________________________
_____________________________________________________________________________________ 35
1[ ] Family Practice 2[ ] Internal Medicine 3[ ] Pediatrics 4[ ] Women’s Health/Ob-Gyn 5[ ] I do NOT provide primary care directly to patients in any employment setting==> Skip to Question 13, Page 5
PLEASE ANSWER THE FOLLOWING QUESTIONS ONLY IF: a. YOU ARE PROVIDING DIRECT PATIENT CARE
AND b. YOU ARE PROVIDING PRIMARY CARE.
OTHERWISE SKIP TO QUESTION 13 ON PAGE 5.
12. At how many sites do you provide direct patient care as an Advanced Practice Nurse? [ ] site(s) Please provide the following information for your primary practice site.
a. This patient care setting is: 1[ ] Ambulatory 2[ ] Inpatient 3[ ] Both Ambulatory and Inpatient 12. b. The primary focus of your practice in this patient care setting is (select only one):
1[ ] Family Practice 4[ ] Internal Medicine 2[ ] Pediatrics 5[ ] Women’s Health/Ob-Gyn 3[ ] Other (specify) ___________________________
c. Which of the following best describes this patient care setting (select only one):
1[ ] Emergency Room 7[ ] Corporate 2[ ] Hospital 8[ ] School 3[ ] Other Institutions (Nursing home or Rehab Center) 9[ ] HMO 4[ ] Individual Physician Practice 10[ ] Public Health 5[ ] Group Physician Practice 11[ ] Solo practice 6[ ] Other (specify)____________________________ d. What is the average number of hours per week that you spend providing primary care, both ambulatory and hospital follow-up, to patients in the areas of internal medicine, general/family practice, pediatrics or OB/GYN? [ ] hours per week devoted to primary care e. What is the name, address, and ZIP Code of this site? ___________________________________________________ ___________________________________________________ ___________________________________________________ f. Is a sliding fee scale in which the professional fee is based upon the patient’s family income offered at this site? 1[ ] Yes 2[ ] No

Primary Care Non-physician Clinicians in Delaware - 1998 Appendix _____________________________________________________________________________________
_____________________________________________________________________________________ 36
g. Are you treating MEDICARE patients at this site? 1[ ] Yes 2[ ] No h. Are you treating MEDICAID patients at this site? 1[ ] Yes 2[ ] No
i. Which of the following practice arrangements best describes this site? 1[ ] Do not work with a physician 2[ ] Physician available for consultation for a fee 3[ ] Physician available on-site majority of time 4[ ] Physician available by telecommunication 5[ ] Have written protocols 6[ ] Other (specify)__________________________
j. Do you prescribe medications? 1[ ] Yes, in conjunction with a physician 2[ ] Yes, within institutional guidelines
3[ ] No If yes to above, do you have a DEA# ? 1[ ] Yes 2[ ] No
ALL RESPONDENTS: PLEASE ANSWER THE NEXT SECTION
13. Birth date: ___/___/___ (month, day, year) 14. State of residence at time of high school graduation:_____________________ 15. Gender: 1[ ] Male 2[ ] Female 16. What is your Race: 1[ ] Caucasian or White 2[ ] Black or African American 3[ ] American Indian/Alaskan native 4[ ] Asian/Pacific islander 5[ ] Other (specify)________________ 17. Are you of Hispanic origin: 1[ ] Yes 2[ ] No 18. Please indicate the county, state, and ZIP Code of your current residence: County ________________________ State ________________________ ZIP Code ______________________
Recommended