Price Floors & Ceilings
Government Price Controls
Price
Qty
T-Shirts
D1
S1
--------------------------------------P1
Q1
E1
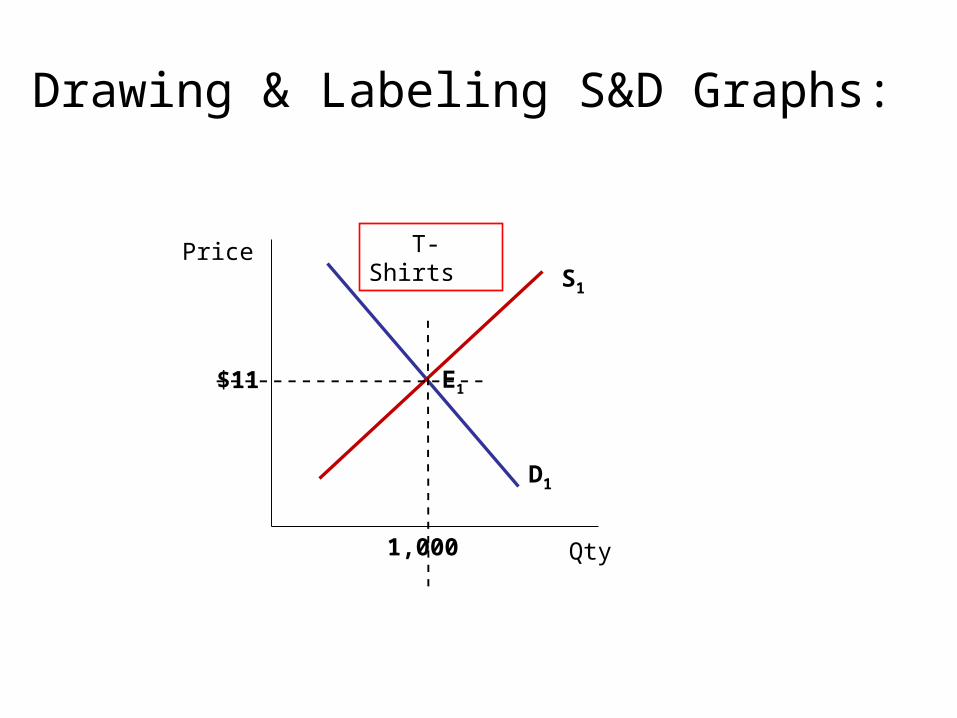
Price
Qty
T-Shirts
D1
S1
--------------------------------------
$11
1,000
E1
Drawing & Labeling S&D Graphs:

Gov’t Price Controls• Government Price controls set a maximum or minimum price for a
specific good or service– Price floors = minimum price & Price ceilings = maximum price
• Price controls often disrupt market equilibrium (E1)
– Usually lead to lower overall market efficiency
– Often create shortages or surpluses of goods/services
• Price controls were used in the 1970’s but are rarely used in the U.S. economy today.
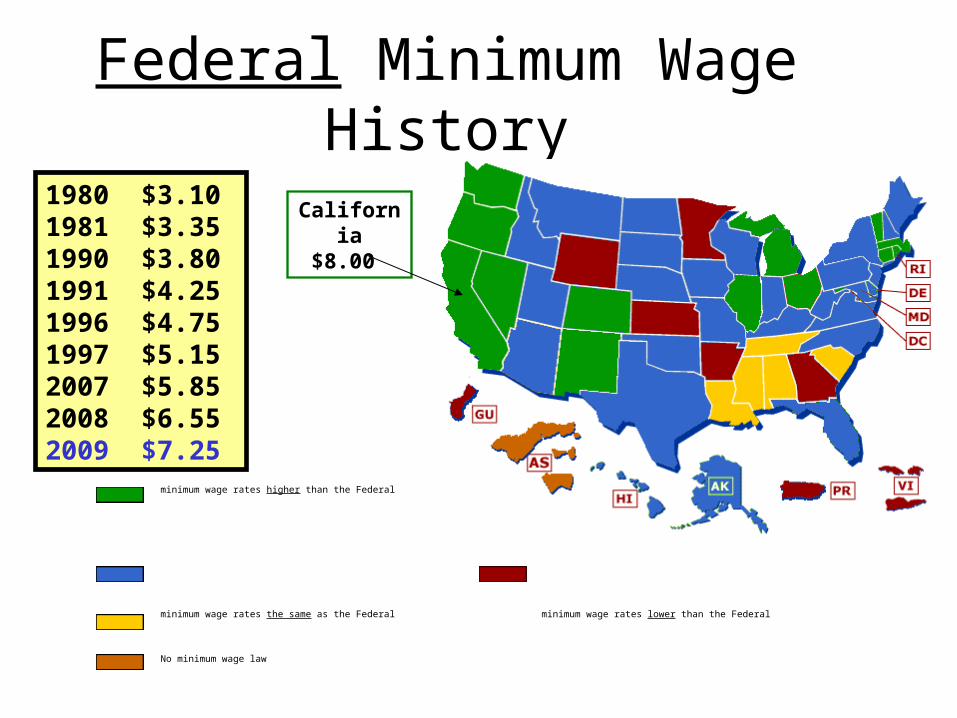
Federal Minimum Wage History
1980 $3.101981 $3.351990 $3.801991 $4.251996 $4.75 1997 $5.152007 $5.85 2008 $6.552009 $7.25
minimum wage rates higher than the Federal
minimum wage rates the same as the Federal
No minimum wage law
minimum wage rates lower than the Federal
American Samoa has special minimum wage rates
California$8.00
Benefits Costs
Raise the Federal Minimum Wage to $1000/hr
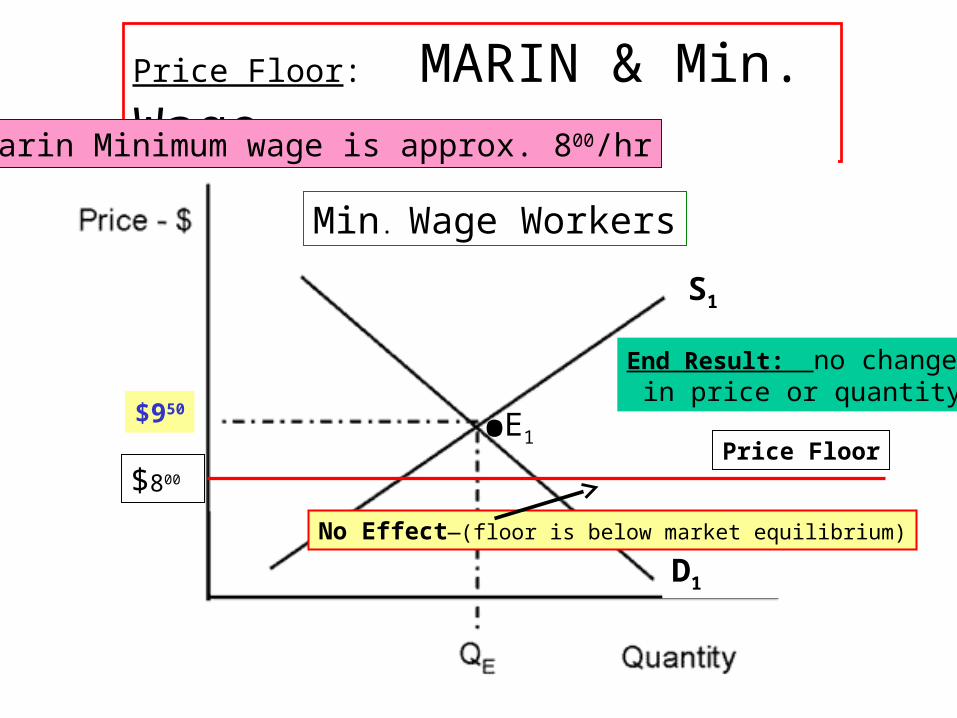
Price Floor: MARIN & Min. Wage
D1
S1
$950E1
Price Floor.
No Effect—(floor is below market equilibrium)
$800
Marin Minimum wage is approx. 800/hr
Min. Wage Workers
End Result: no change in price or quantity
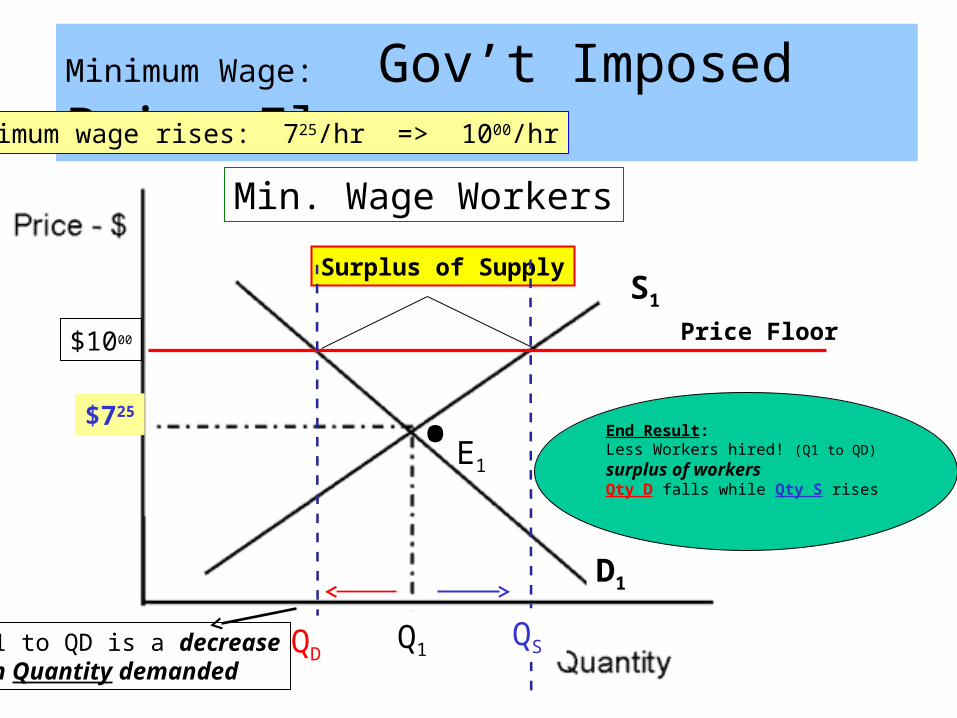
Minimum Wage: Gov’t Imposed Price Floors
D1
S1
$725
Q1
.Surplus of Supply
Price Floor$1000
Minimum wage rises: 725/hr => 1000/hr
Min. Wage Workers
E1
-----------------------
-----------------------
QDQS
End Result: Less Workers hired! (Q1 to QD)
surplus of workersQty D falls while Qty S rises
Q1 to QD is a decrease in Quantity demanded
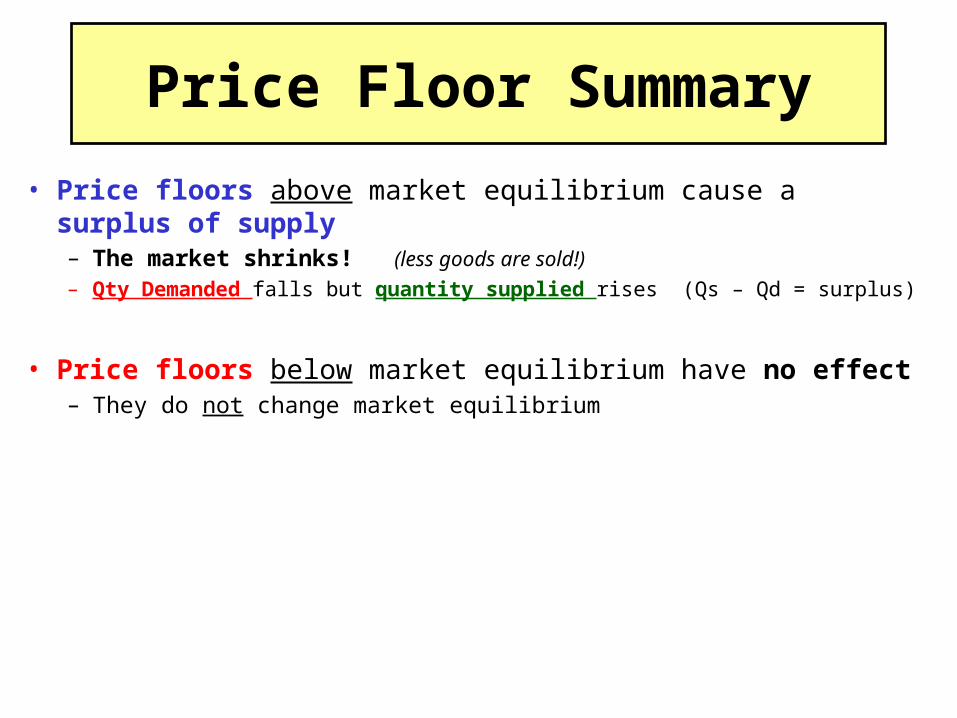
Price Floor Summary
• Price floors above market equilibrium cause a surplus of supply– The market shrinks! (less goods are sold!)
– Qty Demanded falls but quantity supplied rises (Qs – Qd = surplus)
• Price floors below market equilibrium have no effect– They do not change market equilibrium
Benefits Costs
Rent Control
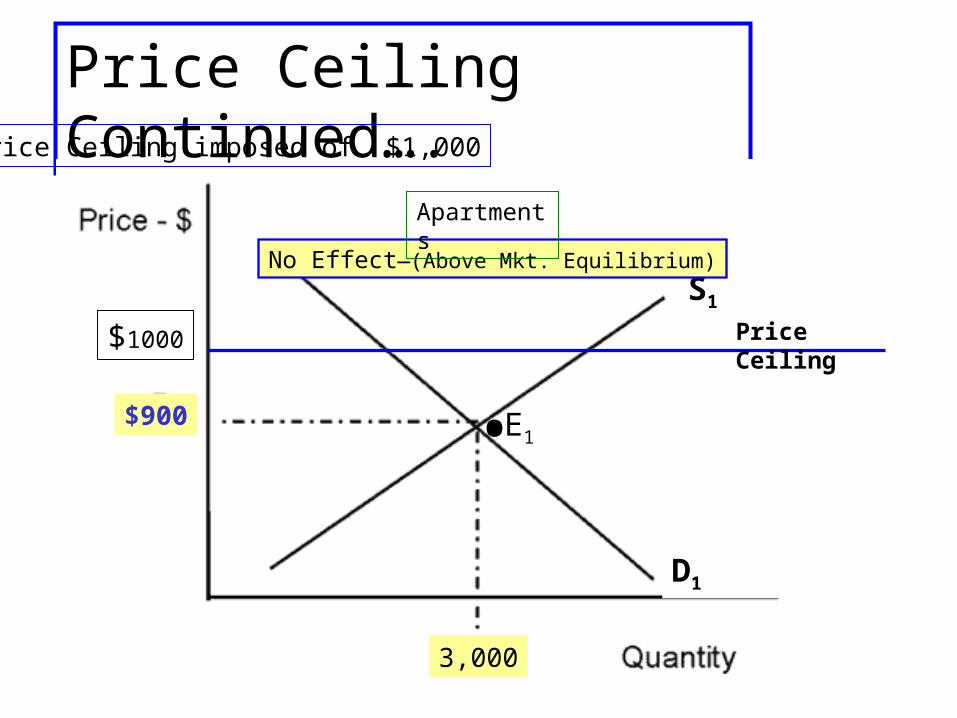
Price Ceiling Continued….
D1
S1
$900 E1
Price Ceiling.
No Effect—(Above Mkt. Equilibrium)
$1000
Price Ceiling imposed of $1,000
3,000
Apartments
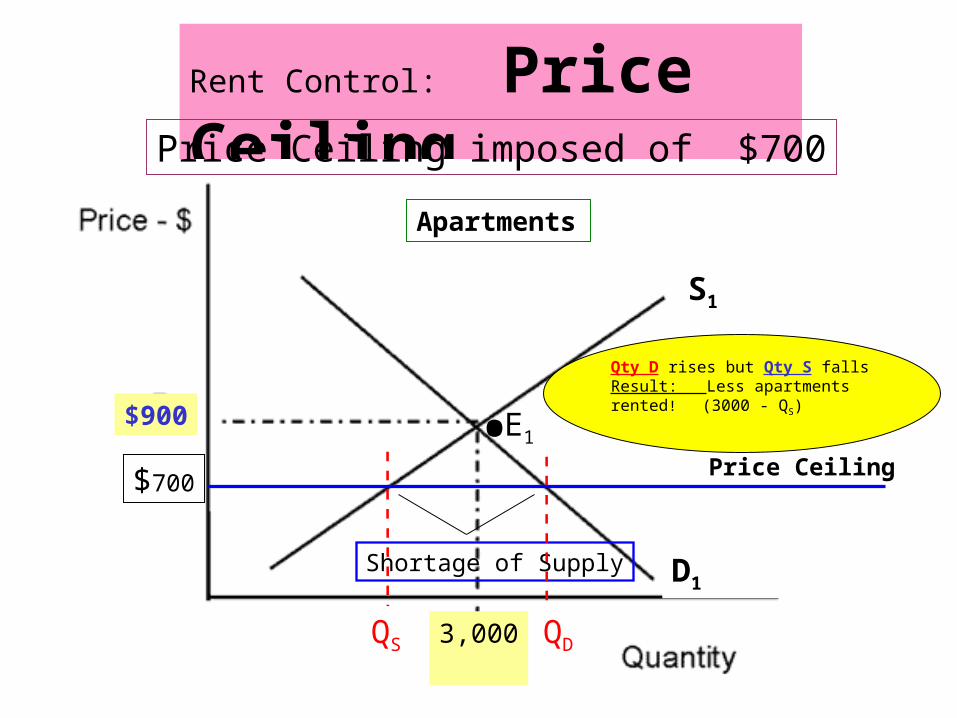
Rent Control: Price Ceiling
D1
S1
$900 E1.Shortage of Supply
Price Ceiling$700
Price Ceiling imposed of $700
3,000
Apartments
----------
----------
QS QD
Qty D rises but Qty S fallsResult: Less apartments rented! (3000 - QS)
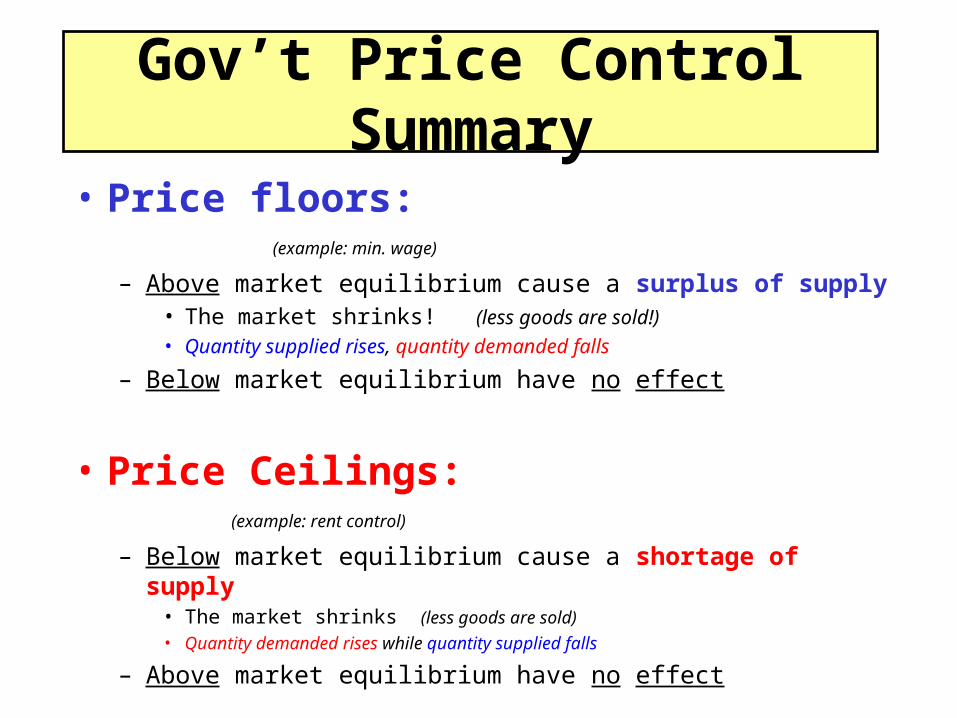
Gov’t Price Control Summary
• Price floors: (example: min. wage)
– Above market equilibrium cause a surplus of supply• The market shrinks! (less goods are sold!)
• Quantity supplied rises, quantity demanded falls
– Below market equilibrium have no effect
• Price Ceilings: (example: rent control)
– Below market equilibrium cause a shortage of supply• The market shrinks (less goods are sold)
• Quantity demanded rises while quantity supplied falls
– Above market equilibrium have no effect
Recommended