Grupa Apator
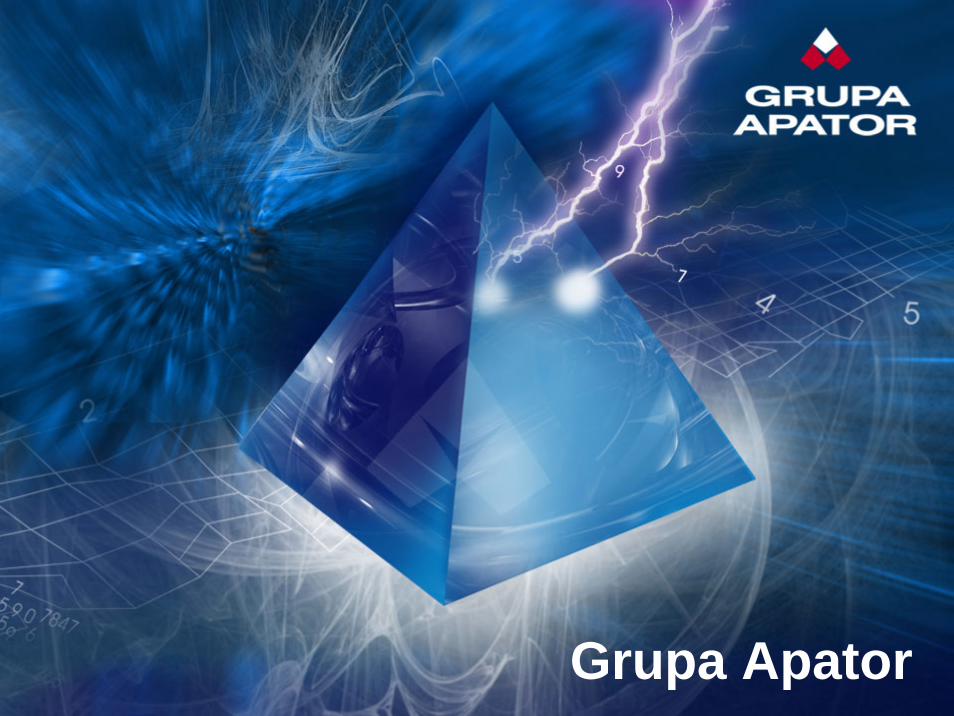
GRUPA APATOR[GRUPA APATOR
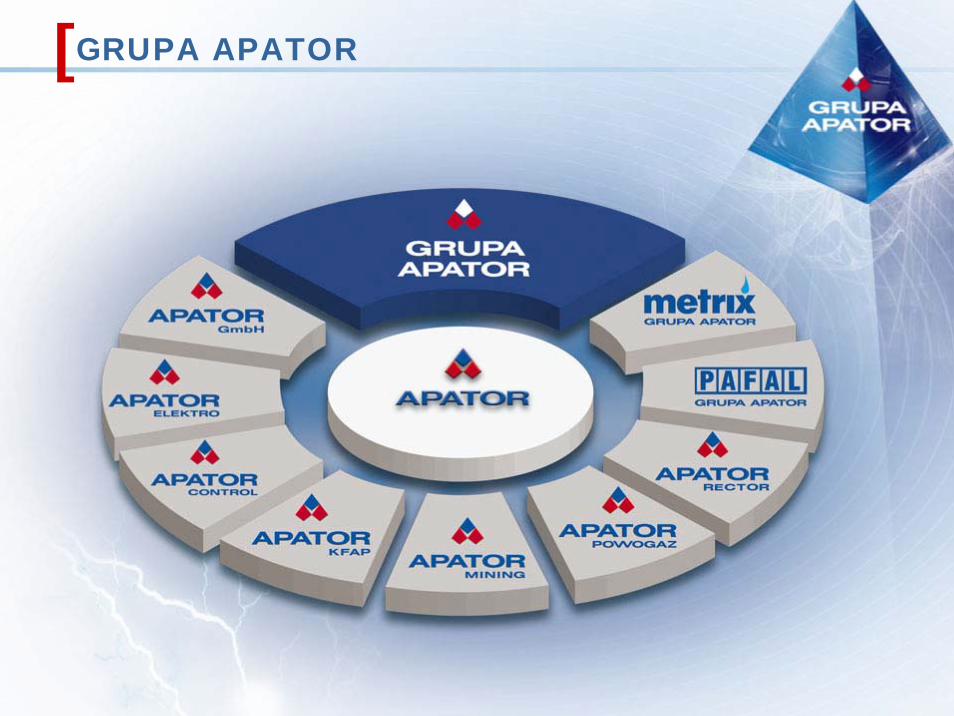
Markets - GRUPA APATOR
Power
engineering
Building industry
Mining
Industry
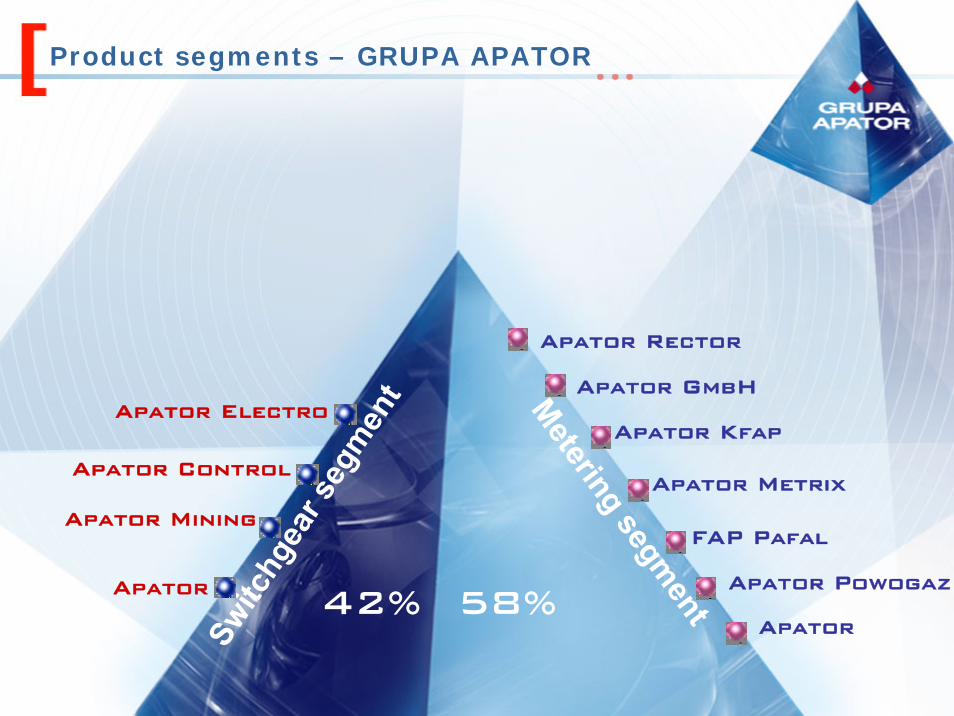
Product segments – GRUPA APATOR
Switc
hgea
r seg
men
t Meteringsegm
ent
Apator
FAP Pafal
Apator Kfap
Apator Metrix
Apator GmbH
Apator
Apator Control
Apator Mining
Apator Electro
Apator Rector
42% 58%Apator Powogaz
2007GRUPA APATOR
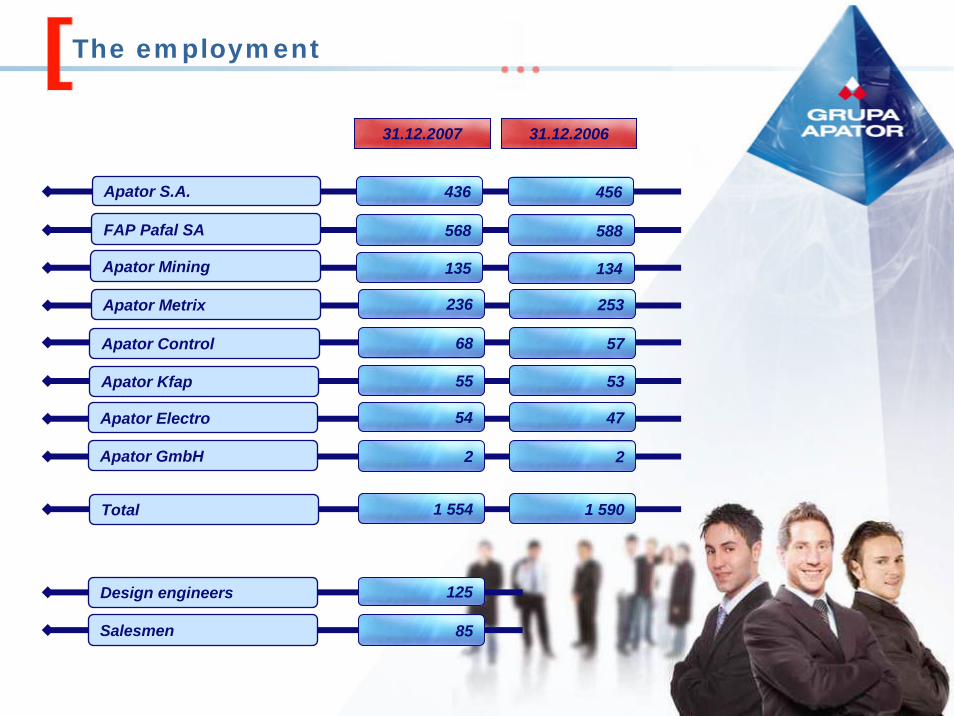
The employment
Apator S.A. 436
FAP Pafal SA 568
Apator Mining 42 290135
Apator Control
Apator Kfap
Apator Metrix
Apator Electro
Apator GmbH
236
68
42 29055
54
2
Total
Design engineers
Salesmen
42 2901 554
125
85
456
588
42 290134
253
57
42 29053
47
2
42 2901 590
31.12.2007 31.12.2006
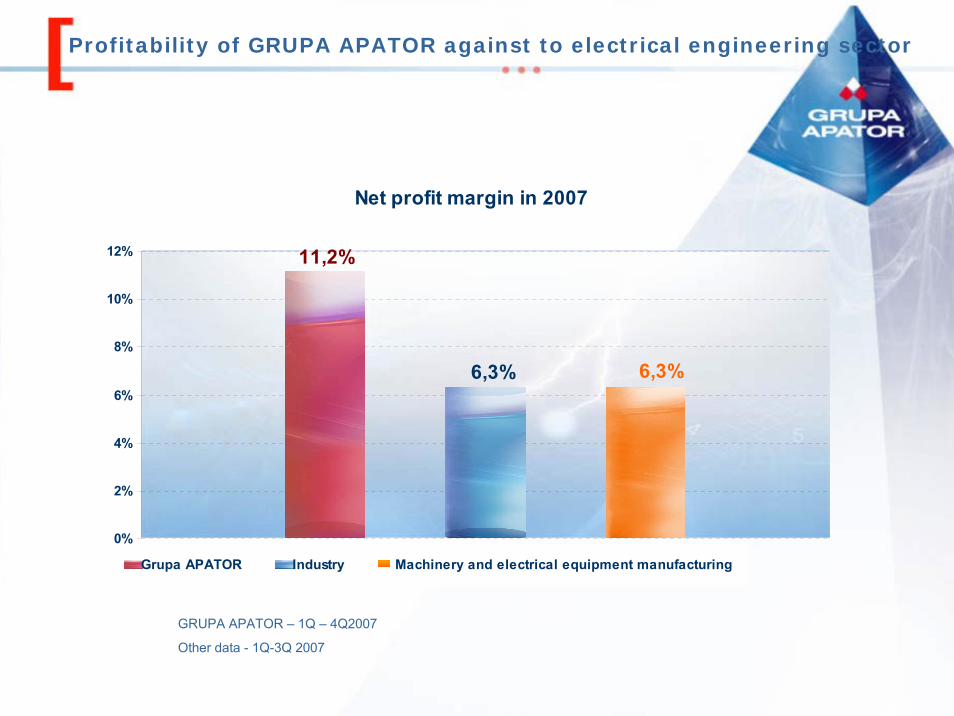
Net profit margin in 2007
11,2%
6,3% 6,3%
0%
2%
4%
6%
8%
10%
12%
Grupa APATOR Industry Machinery and electrical equipment manufacturing
Profitability of GRUPA APATOR against to electrical engineering sector
GRUPA APATOR – 1Q – 4Q2007
Other data - 1Q-3Q 2007
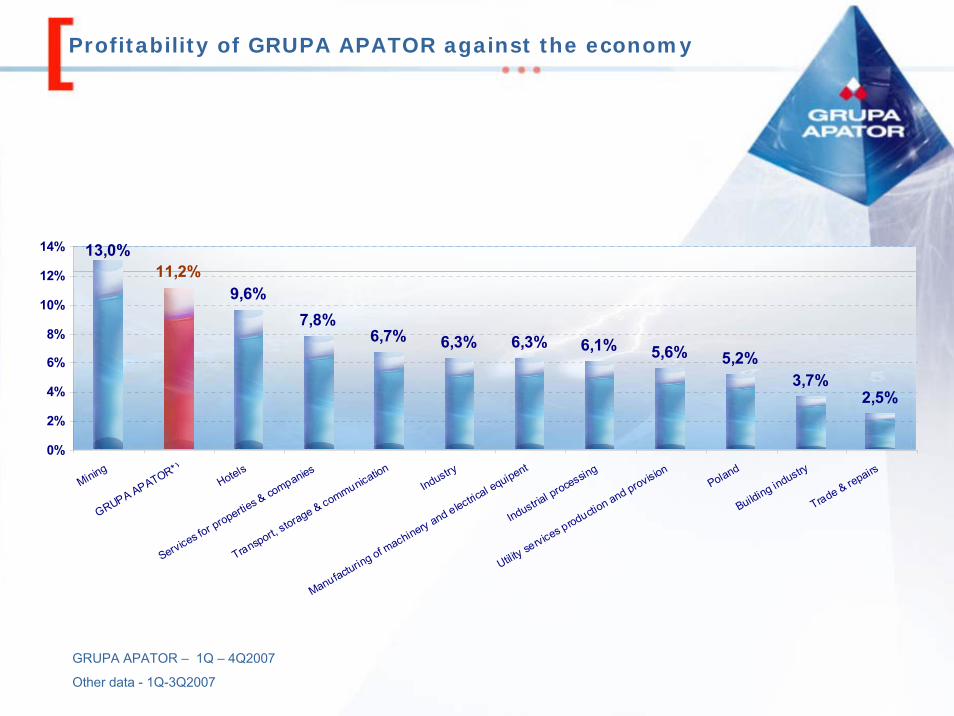
Profitability of GRUPA APATOR against the economy
13,0%
9,6%7,8%
6,7% 6,3% 6,3% 6,1% 5,6% 5,2%3,7%
2,5%
11,2%
0%
2%
4%
6%
8%
10%
12%
14%
Mining
GRUPA APATOR*)Hotels
Services for propertie
s & companies
Transport, storage & communication
Industry
Manufacturing of machinery and electrica
l equipent
Industrial processing
Utility se
rvices productio
n and provisionPoland
Building industry
Trade & repairs
GRUPA APATOR – 1Q – 4Q2007
Other data - 1Q-3Q2007
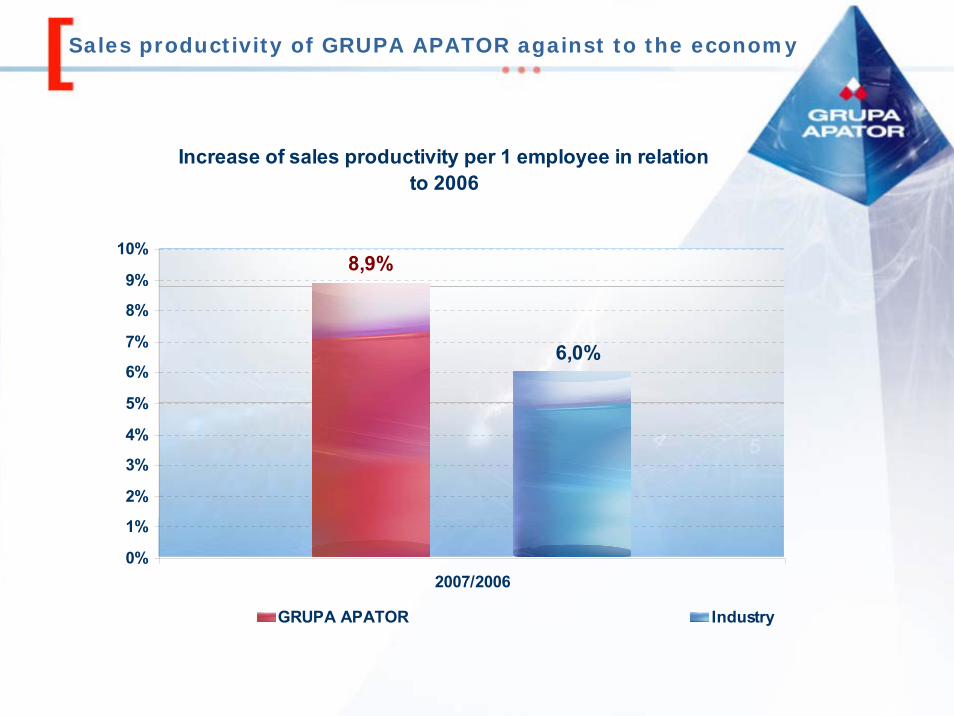
Sales productivity of GRUPA APATOR against to the economy
Increase of sales productivity per 1 employee in relation to 2006
8,9%
6,0%
0%
1%
2%
3%
4%
5%
6%
7%
8%
9%
10%
2007/2006
GRUPA APATOR Industry
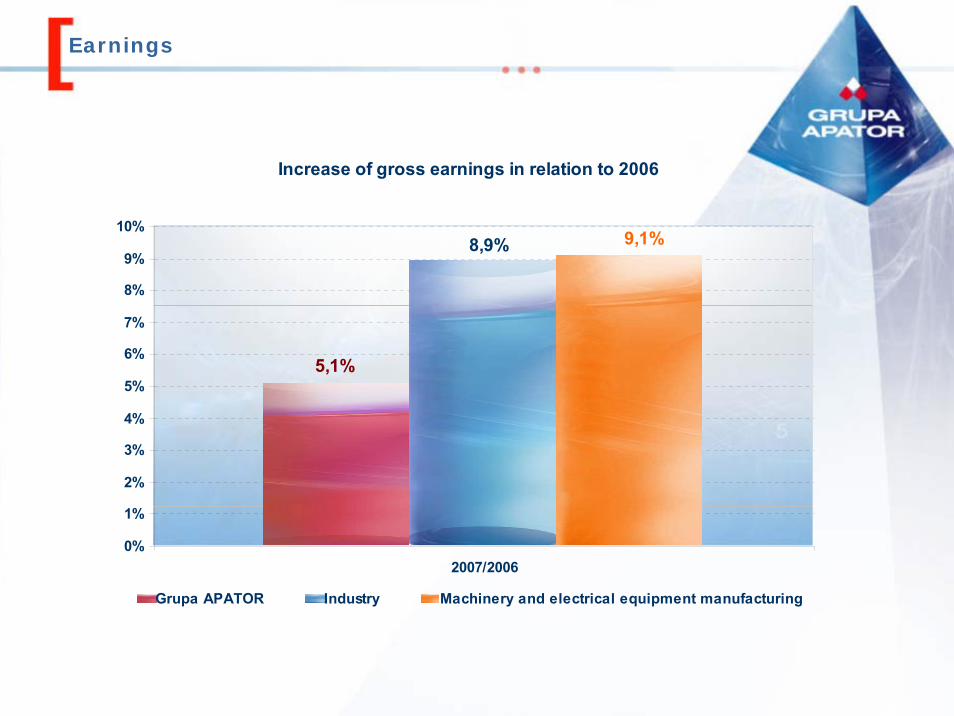
Earnings
Increase of gross earnings in relation to 2006
5,1%
8,9% 9,1%
0%
1%
2%
3%
4%
5%
6%
7%
8%
9%
10%
2007/2006
Grupa APATOR Industry Machinery and electrical equipment manufacturing
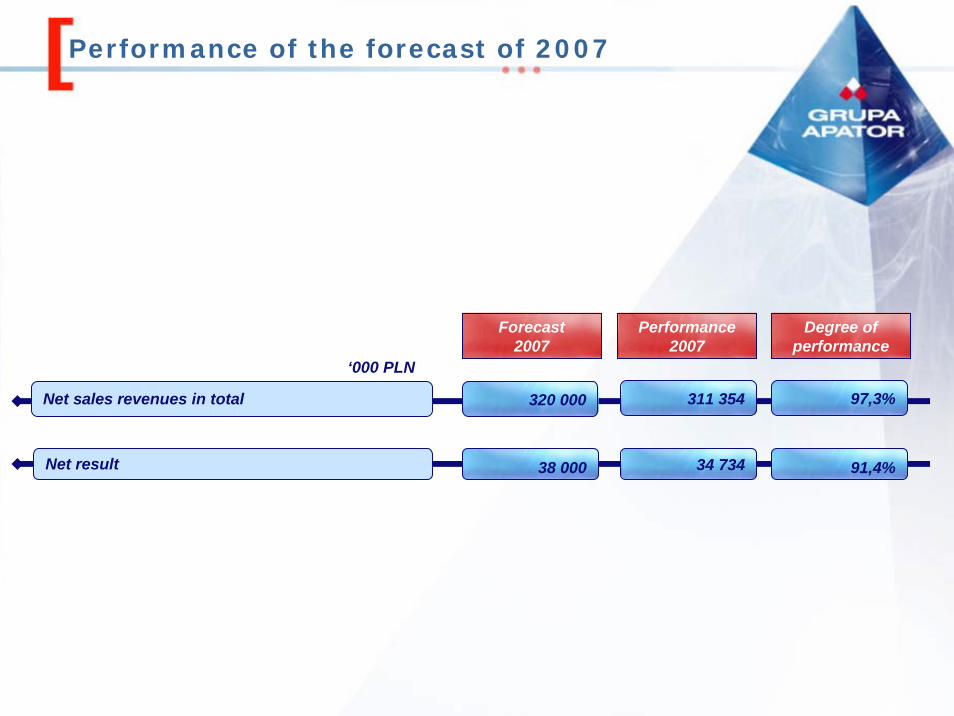
Performance of the forecast of 2007
Net sales revenues in total 320 000 311 354 97,3%
Forecast2007
Net result 38 000 34 734 91,4%
Performance2007
Degree ofperformance
‘000 PLN
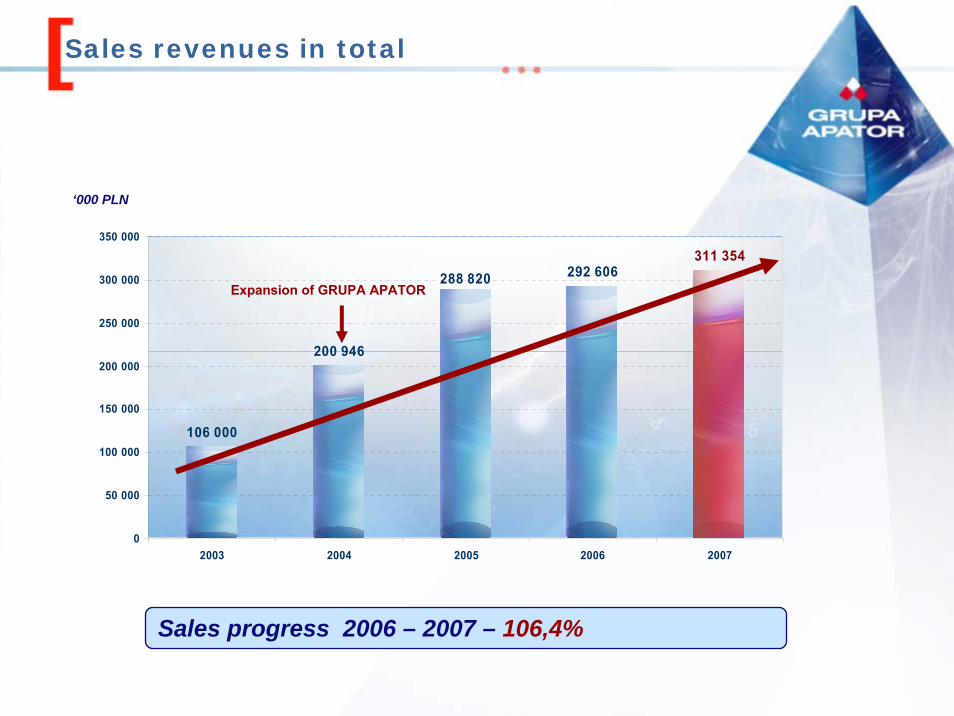
Sales revenues in total
106 000
292 606
200 946
311 354288 820
0
50 000
100 000
150 000
200 000
250 000
300 000
350 000
2003 2004 2005 2006 2007
Expansion of GRUPA APATOR
Sales progress 2006 – 2007 – 106,4%
‘000 PLN
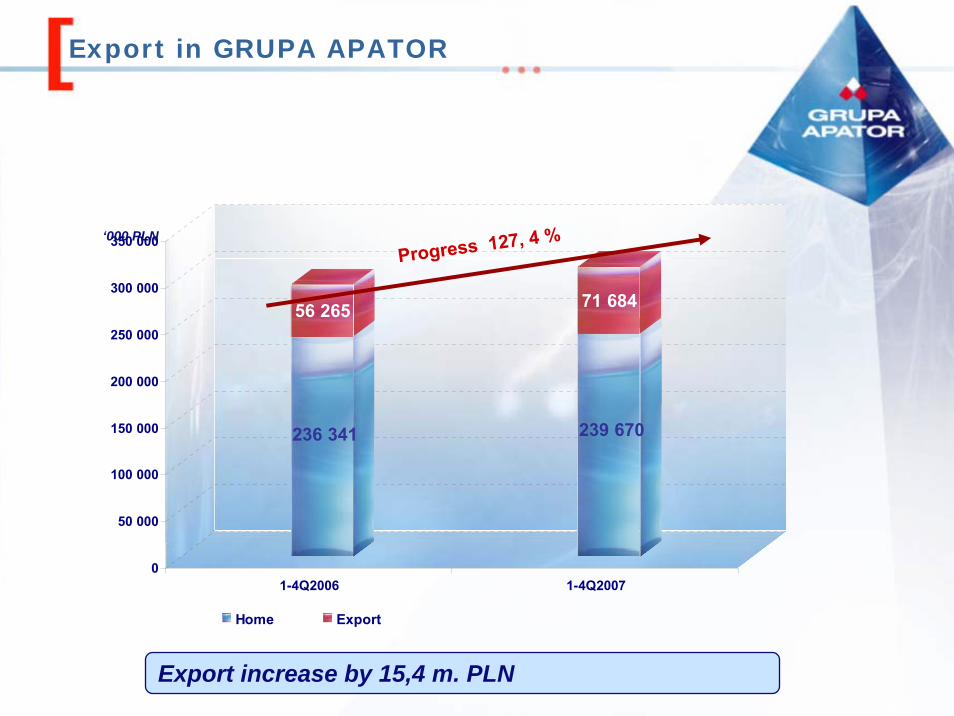
Export in GRUPA APATOR
236 341
56 265
239 670
71 684
0
50 000
100 000
150 000
200 000
250 000
300 000
350 000
1-4Q2006 1-4Q2007
Home Export
Export increase by 15,4 m. PLN
Progress 127, 4 %‘000 PLN
Export share in revenues
13 349
25 859
52 16156 265
71 684
19%
23%
13%
13%
18%
0
10 000
20 000
30 000
40 000
50 000
60 000
70 000
80 000
2003 2004 2005 2006 20075%
10%
15%
20%
25%
30%
Export Export shar in revenues
‘000 PLN
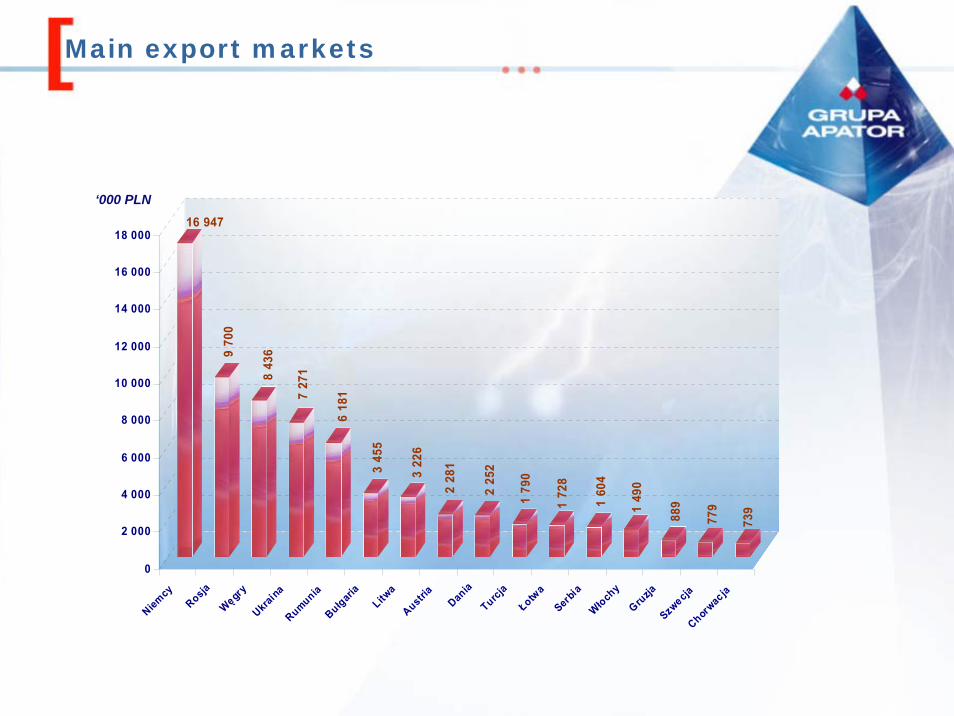
Main export markets
16 9479
700
8 43
6
7 27
1
6 18
1
3 45
5
3 22
6
2 28
1
2 25
2
1 79
0
1 72
8
1 60
4
1 49
0
889
779
739
0
2 000
4 000
6 000
8 000
10 000
12 000
14 000
16 000
18 000
Niemcy
RosjaWę
gry
Ukraina
RumuniaBułg
aria
Litwa
Austria
Dania
Turcja
Łotw
aSer
biaWł
ochy
Gruzja
Szwecja
Chorwac
ja
‘000 PLN
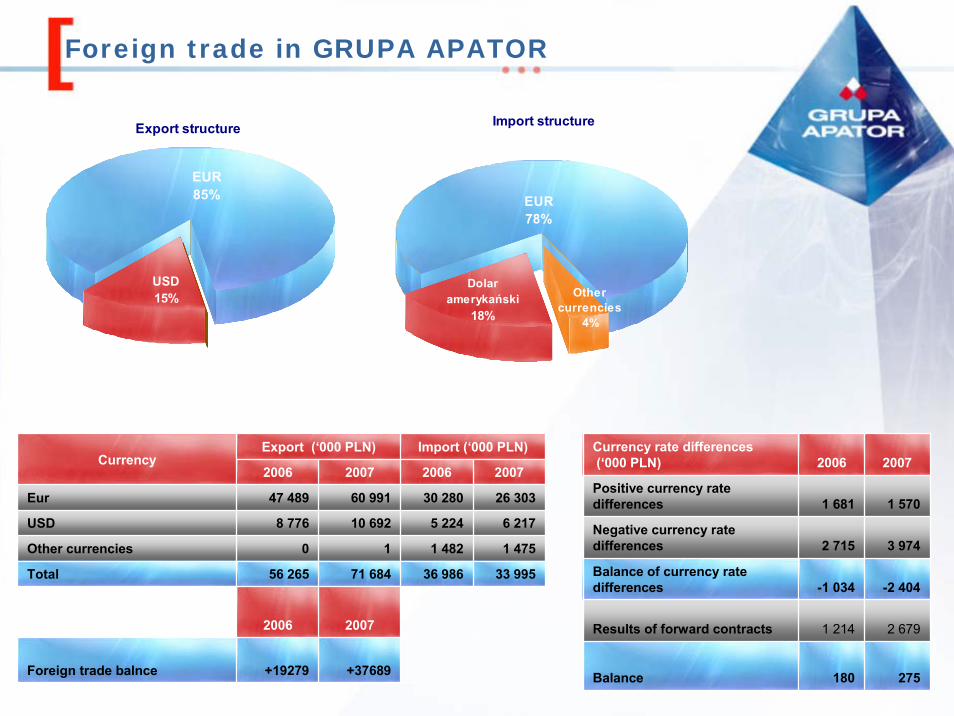
Foreign trade in GRUPA APATOR
Import structure
EUR78%
Dolar amerykański
18%
Other currencies
4%
Export structure
EUR85%
USD15%
Export (‘000 PLN) Import (‘000 PLN)
2006 2007 2006 2007
Eur 47 489 60 991 30 280 26 303
USD 8 776 10 692 5 224 6 217
Other currencies 0 1 1 482 1 475
Total 56 265 71 684 36 986 33 995
2006 2007
Foreign trade balnce +19279 +37689
Currency
275180Balance
2 6791 214Results of forward contracts
-2 404-1 034Balance of currency ratedifferences
3 9742 715Negative currency ratedifferences
1 5701 681Positive currency ratedifferences
20072006Currency rate differences(‘000 PLN)
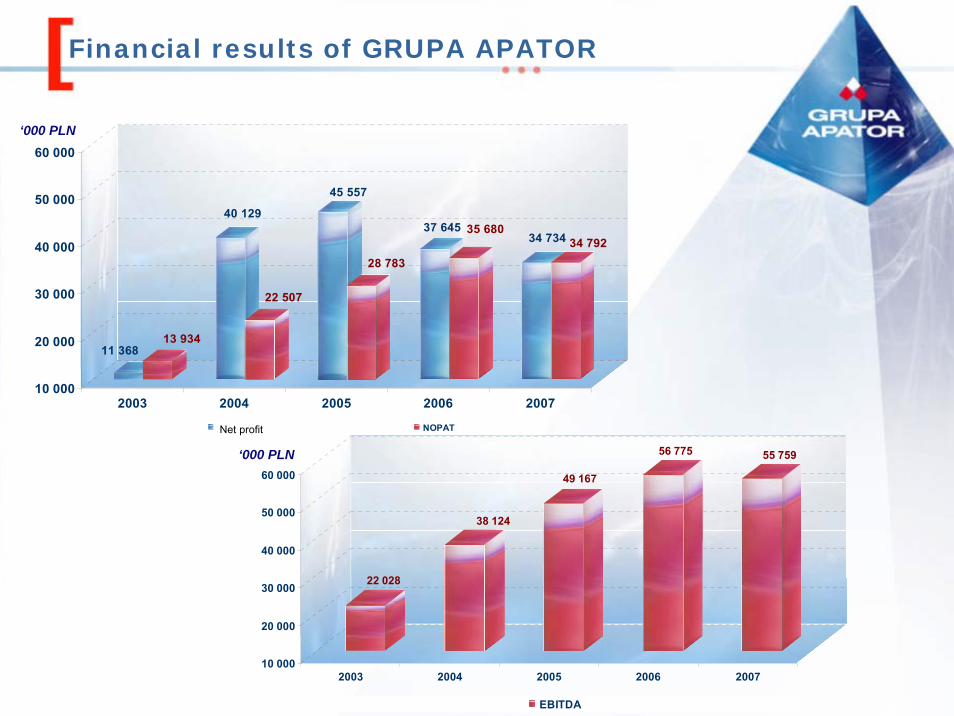
Financial results of GRUPA APATOR
11 36813 934
40 129
22 507
45 557
28 783
37 645 35 68034 734 34 792
10 000
20 000
30 000
40 000
50 000
60 000
2003 2004 2005 2006 2007
Zysk netto NOPAT
22 028
38 124
49 167
56 775 55 759
10 000
20 000
30 000
40 000
50 000
60 000
2003 2004 2005 2006 2007
EBITDA
‘000 PLN
‘000 PLN
Net profit
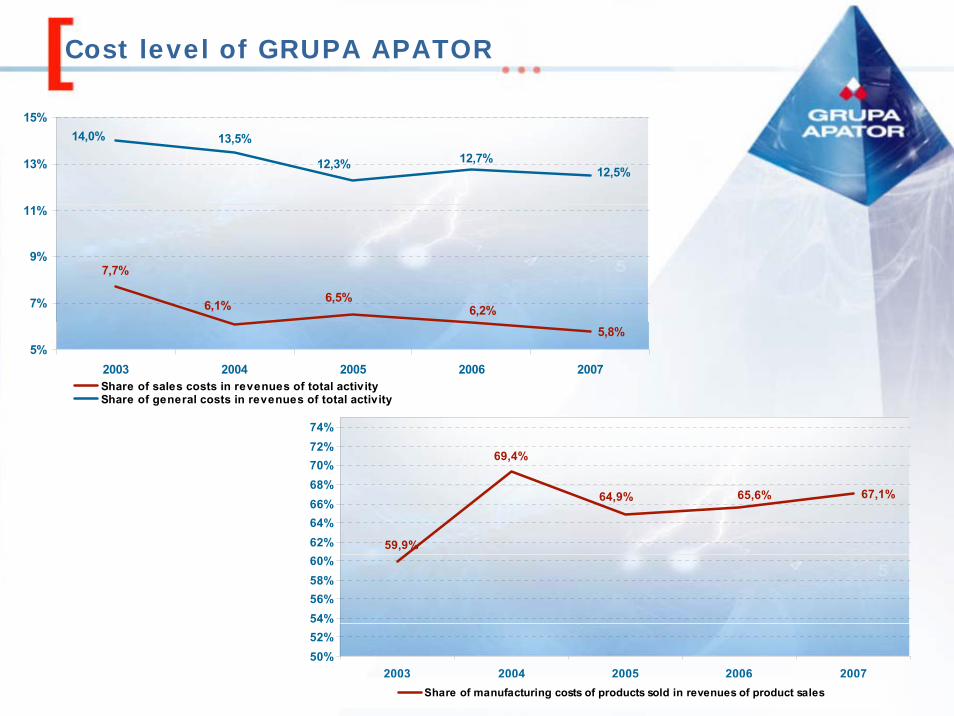
Cost level of GRUPA APATOR
5,8%
6,2%6,5%
7,7%
6,1%
12,7%12,3%
14,0% 13,5%
12,5%
5%
7%
9%
11%
13%
15%
2003 2004 2005 2006 2007Share of sales costs in revenues of total activityShare of general costs in revenues of total activity
67,1%65,6%64,9%
59,9%
69,4%
50%52%54%56%58%60%62%64%66%68%70%72%74%
2003 2004 2005 2006 2007Share of manufacturing costs of products sold in revenues of product sales
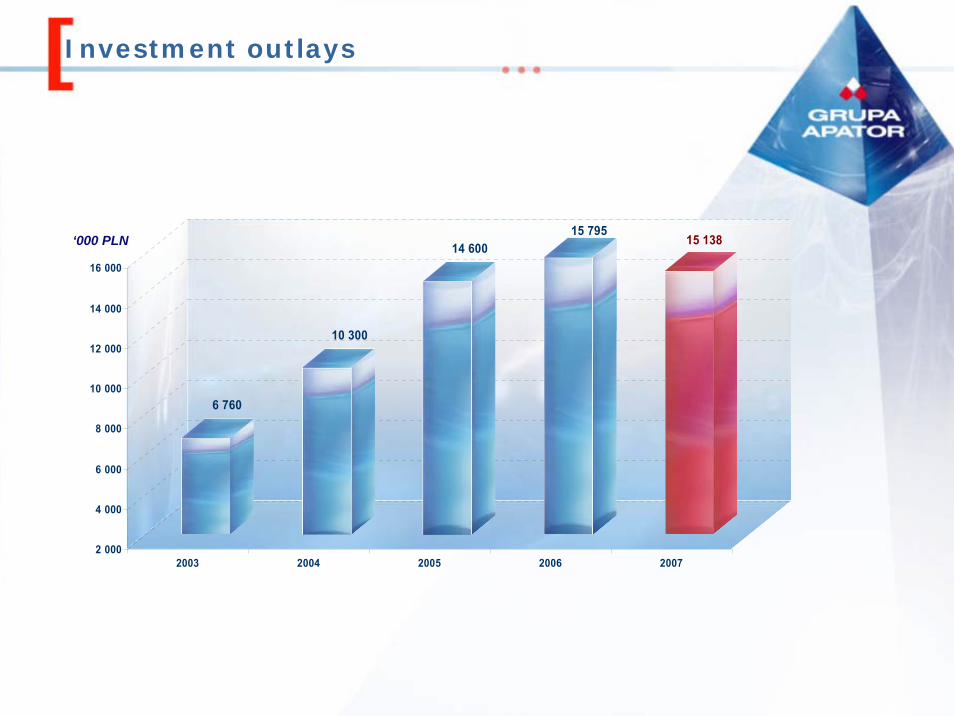
Investment outlays
6 760
10 300
14 60015 795
15 138
2 000
4 000
6 000
8 000
10 000
12 000
14 000
16 000
2003 2004 2005 2006 2007
‘000 PLN
The future ofGRUPA APATOR
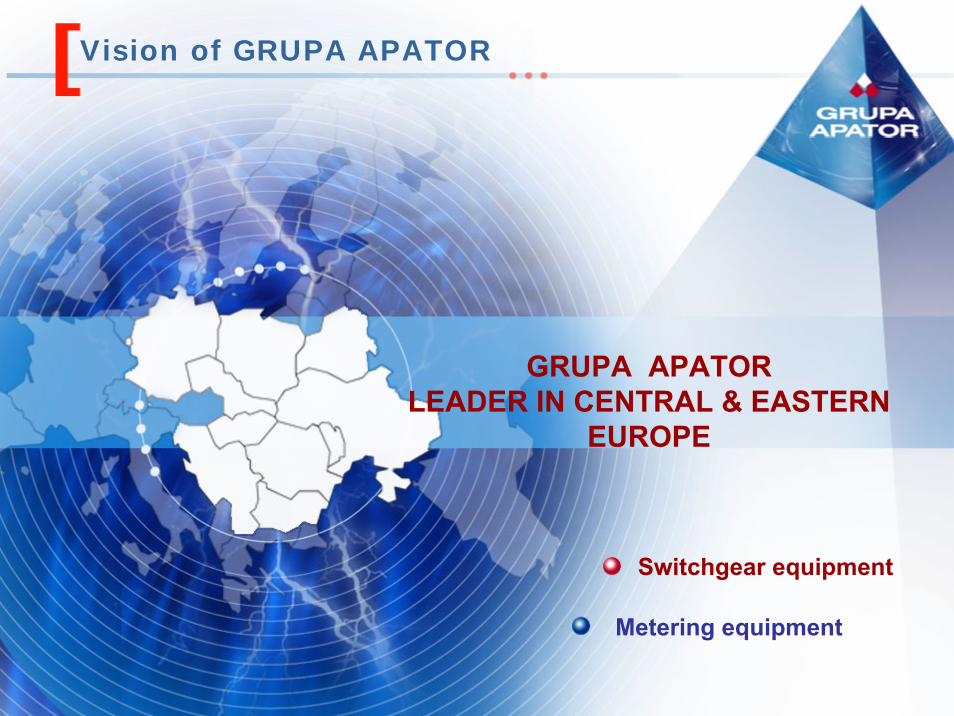
Vision of GRUPA APATOR
GRUPA APATORLEADER IN CENTRAL & EASTERN
EUROPE
Switchgear equipment
Metering equipment
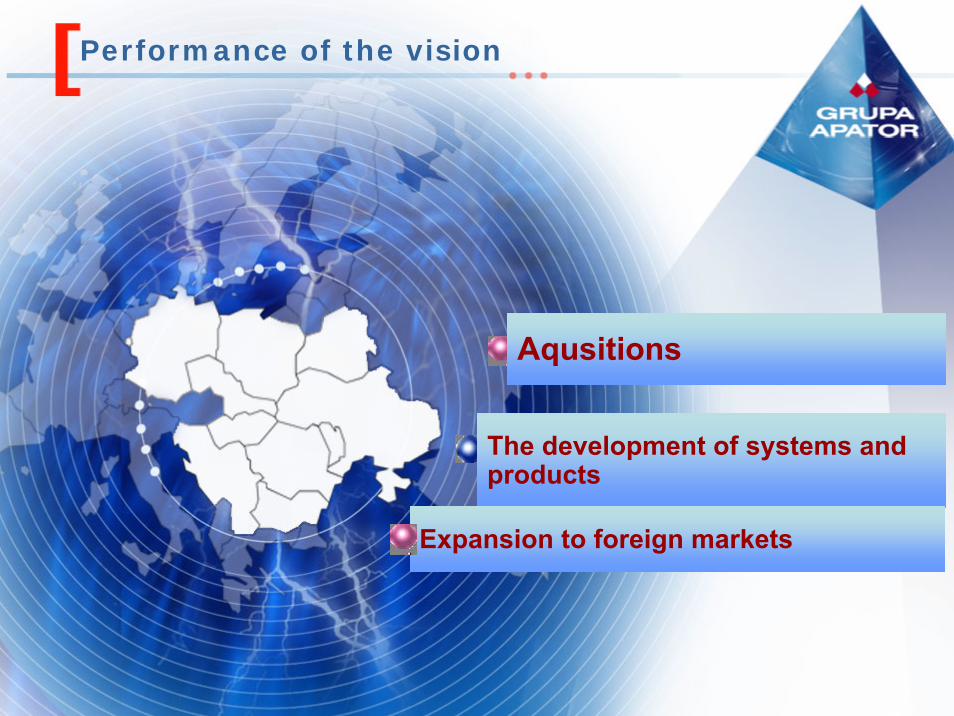
Performance of the vision
Aqusitions
The development of systems and products
Expansion to foreign markets
Furtheraquisitions
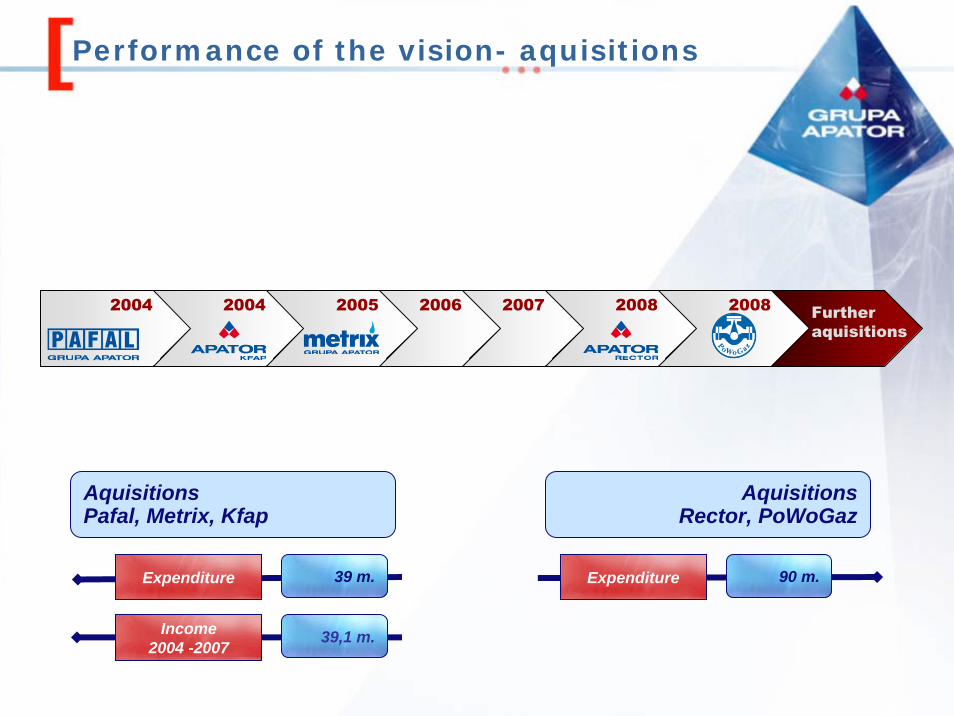
Performance of the vision- aquisitions
AquisitionsPafal, Metrix, Kfap
Expenditure
Income2004 -2007
AquisitionsRector, PoWoGaz
39 m.
39,1 m.
Expenditure 90 m.
2008200820072006200520042004
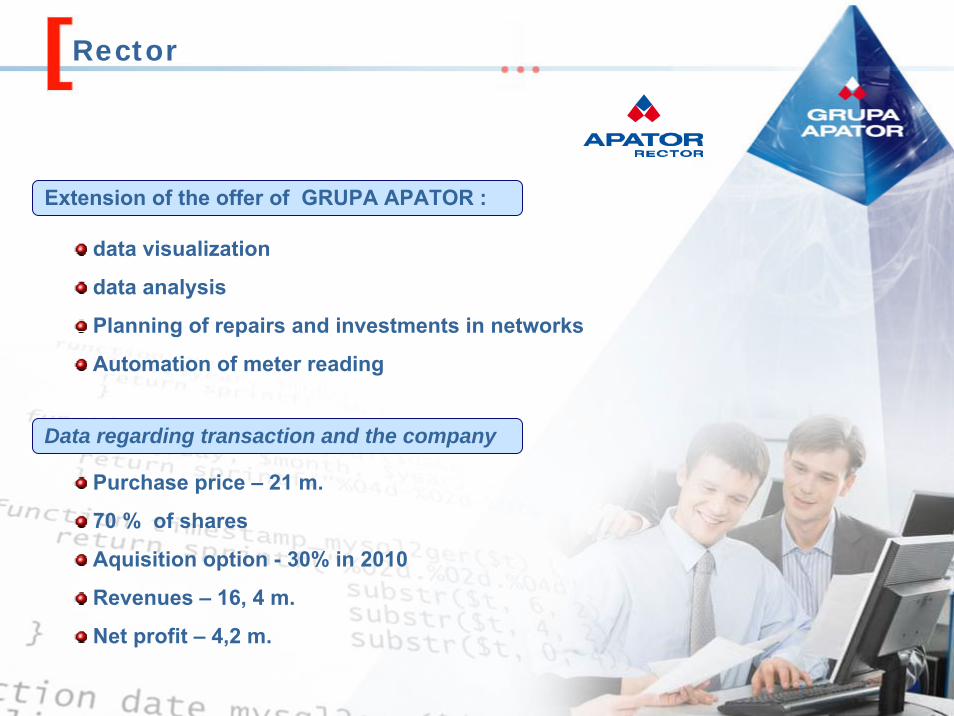
Rector
data visualization
data analysis
Planning of repairs and investments in networks
Automation of meter reading
Data regarding transaction and the company
Extension of the offer of GRUPA APATOR :
Purchase price – 21 m.
70 % of shares
Aquisition option - 30% in 2010
Revenues – 16, 4 m.
Net profit – 4,2 m.
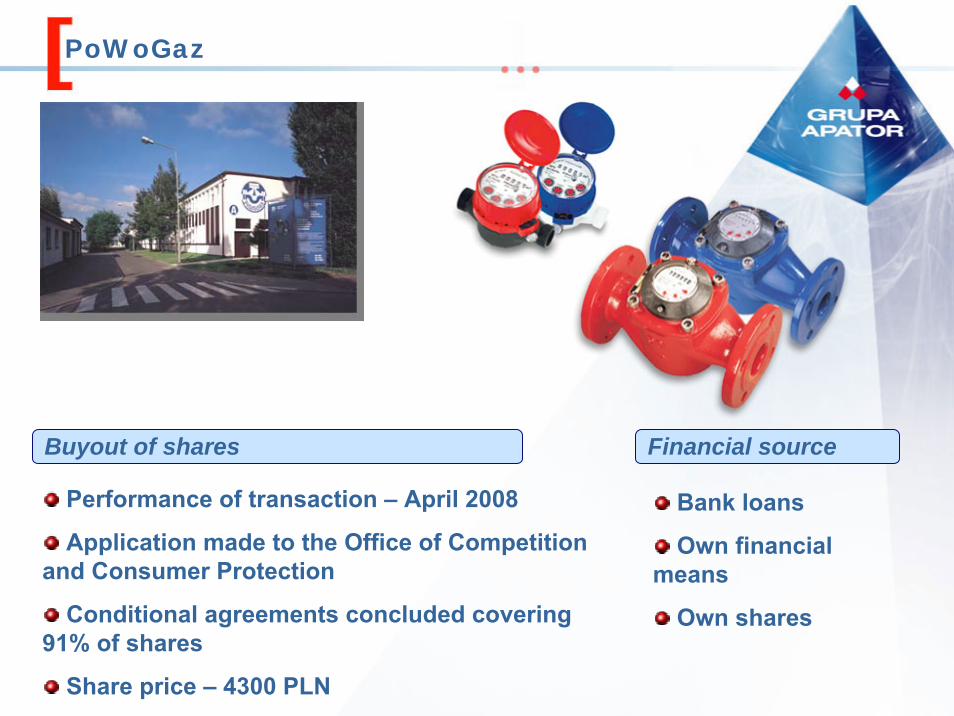
PoWoGaz
Performance of transaction – April 2008
Application made to the Office of Competitionand Consumer Protection
Conditional agreements concluded covering91% of shares
Share price – 4300 PLN
Bank loans
Own financialmeans
Own shares
Financial sourceBuyout of shares
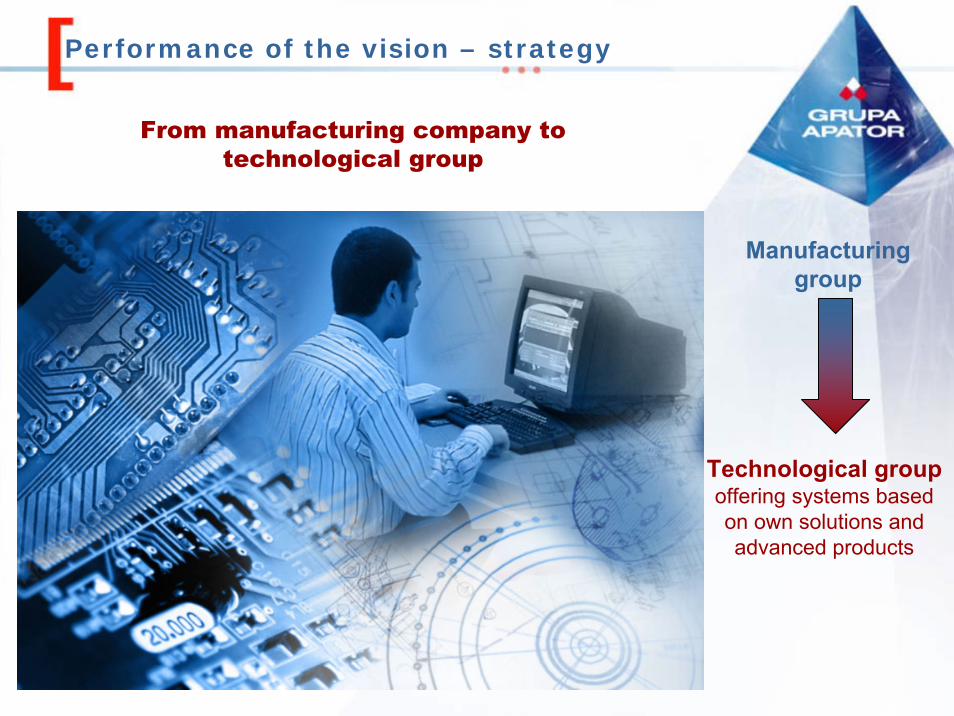
Manufacturinggroup
Technological groupoffering systems based on own solutions and advanced products
Performance of the vision – strategy
From manufacturing company to technological group
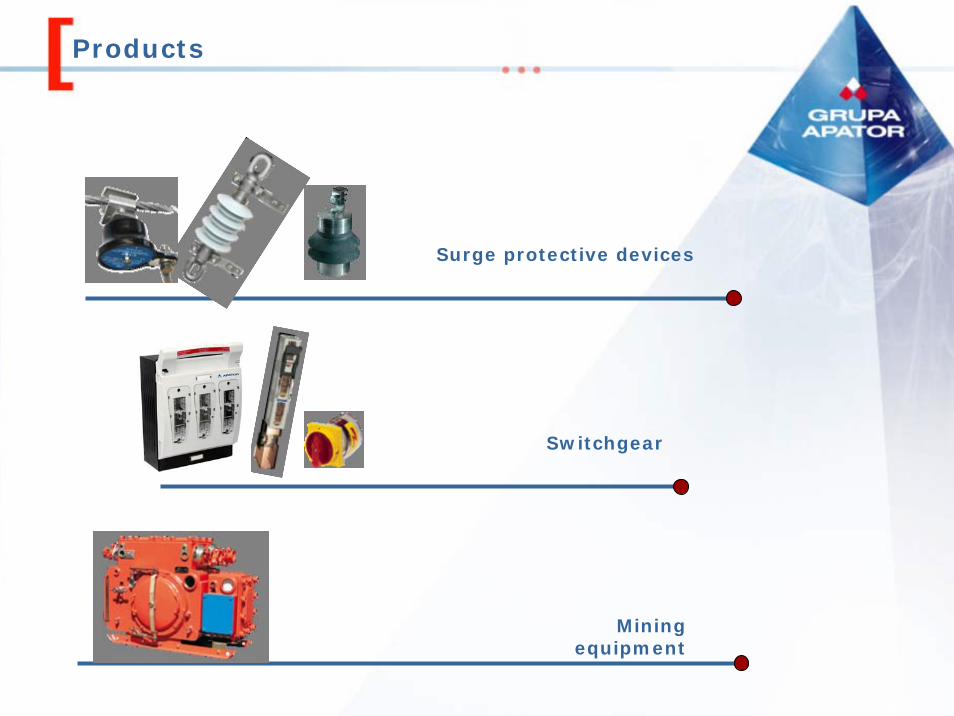
Surge protective devices
Switchgear
Miningequipment
Products
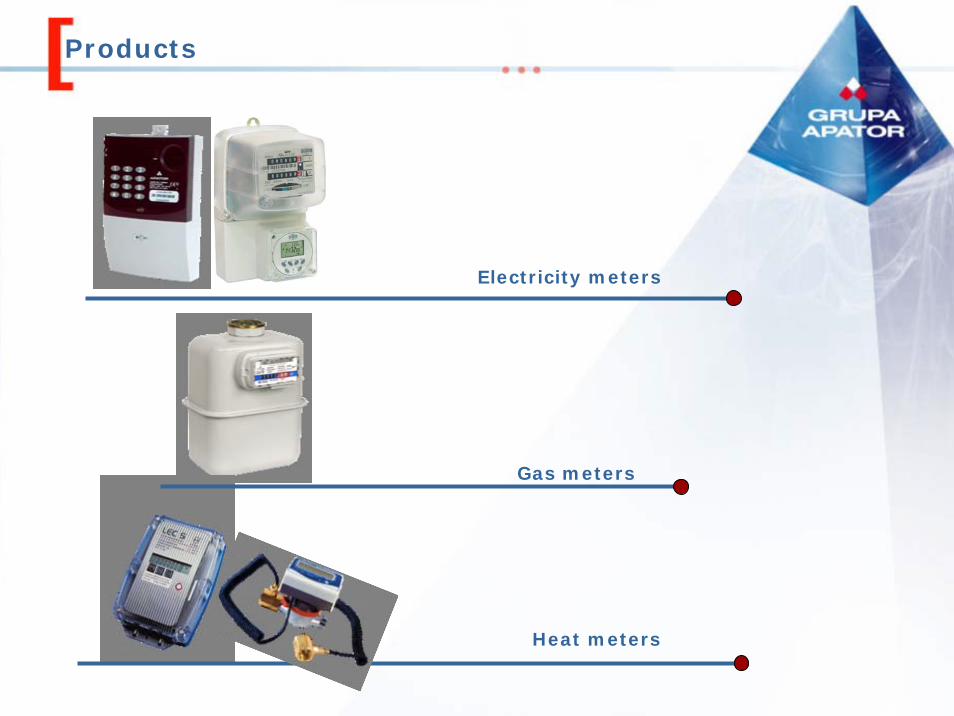
Products
Electricity meters
Gas meters
Heat meters
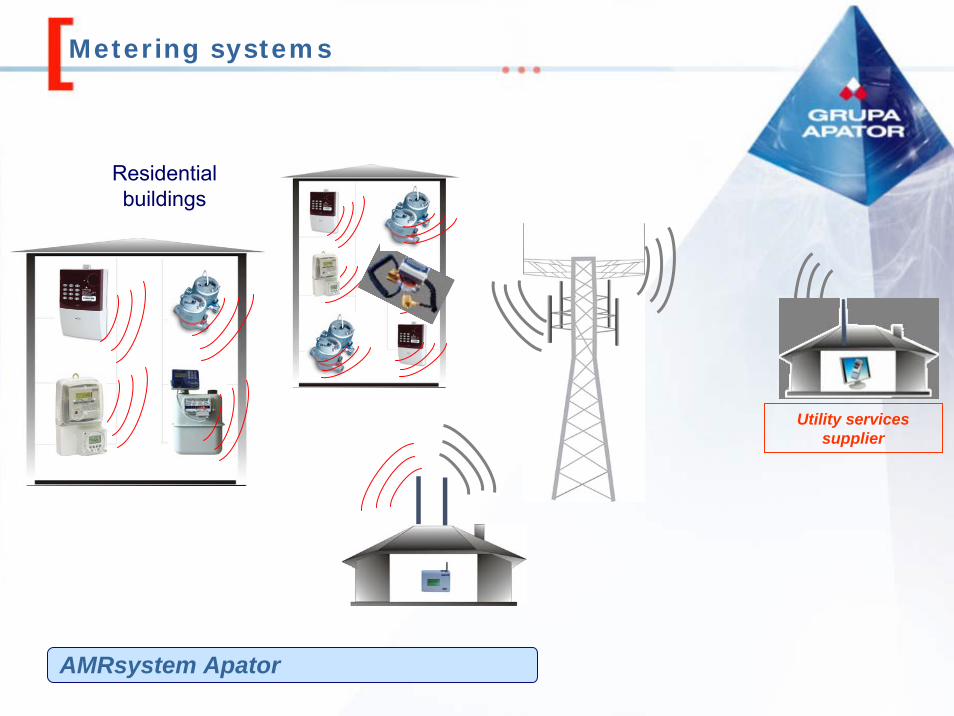
Metering systems
Utility servicessupplier
Residentialbuildings
AMRsystem Apator
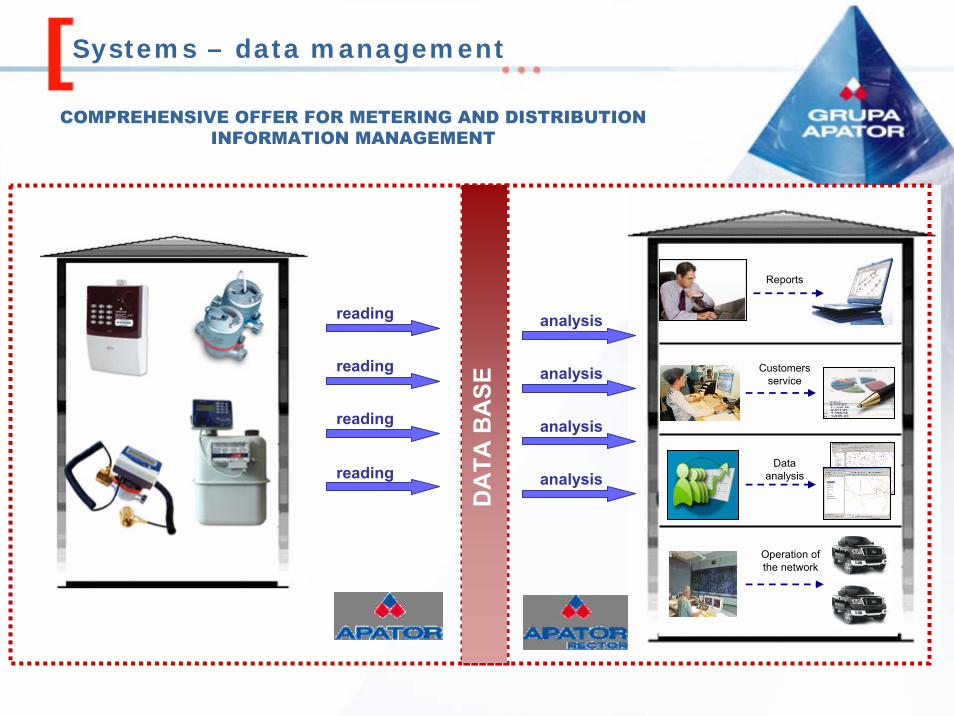
Systems – data management
COMPREHENSIVE OFFER FOR METERING AND DISTRIBUTION INFORMATION MANAGEMENT
Operation ofthe network
Customersservice
Reports
Data analysisreading
reading
reading
reading
DA
TA B
ASE
analysis
analysis
analysis
analysis
World trends
EU recommendations regarding saving of energy using appropriate metering and planning
Remote data meter reading
Italy – 30 m. meters
Scandinavia – 2 m. meters
Turkey – 2 m. meters
Bididrectional communication
Market liberalization
Information management
„Green idea”
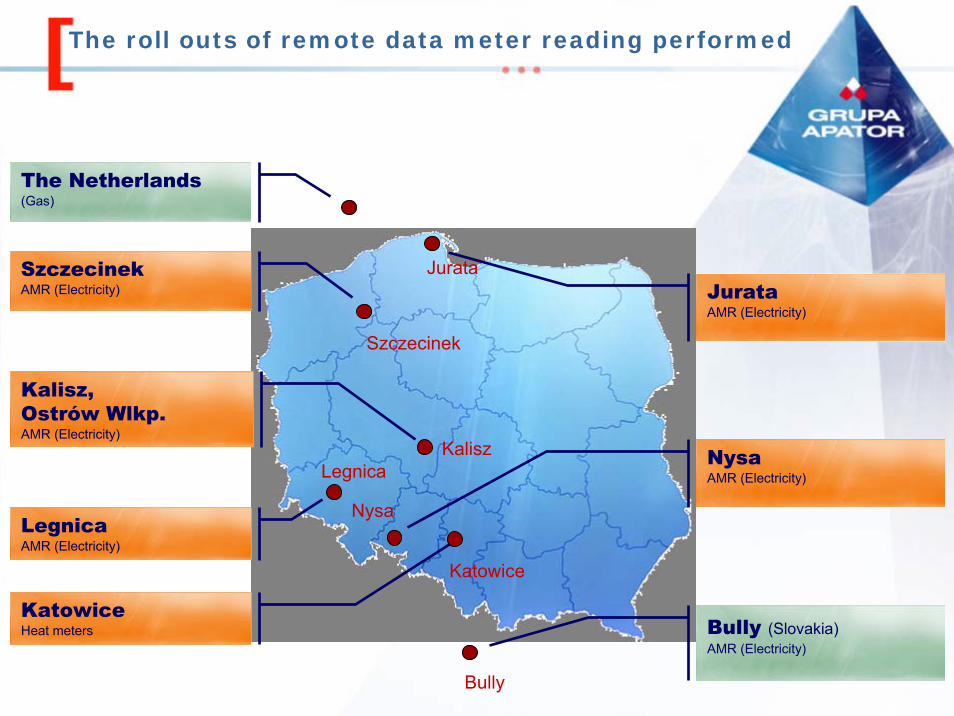
The roll outs of remote data meter reading performed
JurataAMR (Electricity)
Kalisz, Ostrów Wlkp.AMR (Electricity)
NysaAMR (Electricity)
Bully (Slovakia)AMR (Electricity)
SzczecinekAMR (Electricity)
LegnicaAMR (Electricity)
Szczecinek
Kalisz
Jurata
Nysa
Legnica
Bully
The Netherlands(Gas)
KatowiceHeat meters
Katowice
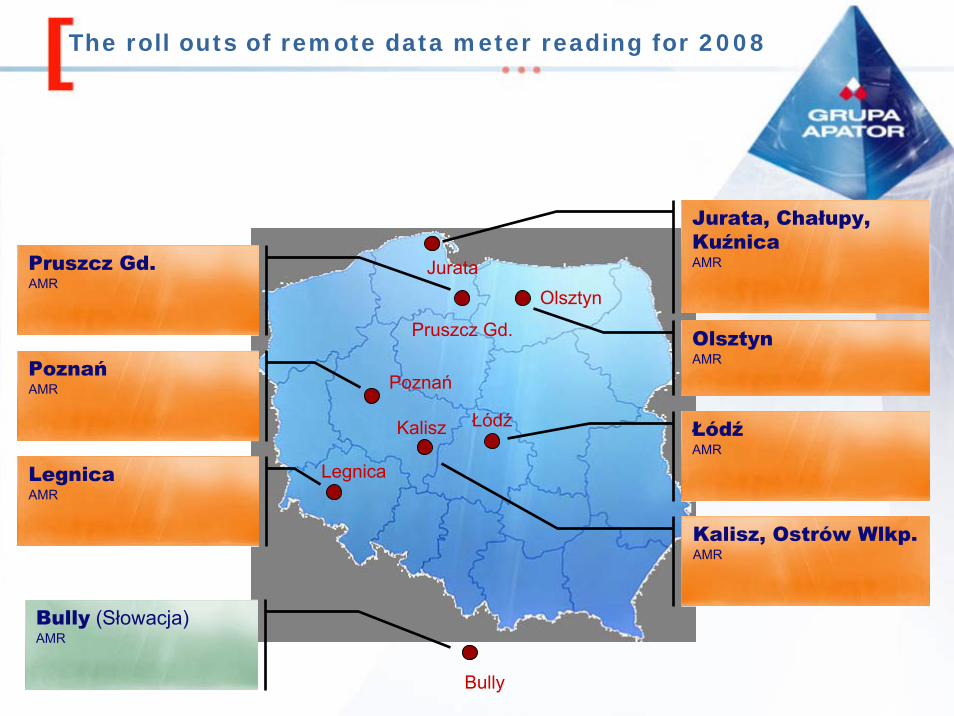
The roll outs of remote data meter reading for 2008
Poznań
Kalisz
Jurata
Legnica
Bully
Pruszcz Gd.AMR
PoznańAMR
LegnicaAMR
Jurata, Chałupy, KuźnicaAMR
OlsztynAMR
ŁódźAMR
Kalisz, Ostrów Wlkp.AMR
Bully (Słowacja)AMR
Pruszcz Gd.
Łódź
Olsztyn
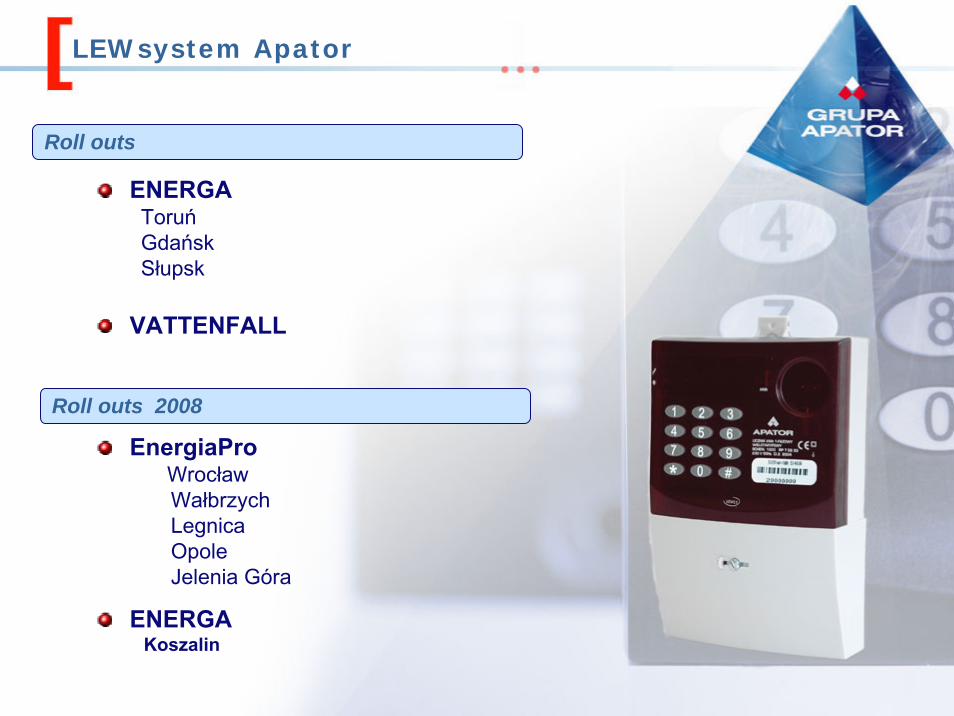
LEWsystem Apator
ENERGAToruńGdańskSłupsk
Roll outs
Roll outs 2008
VATTENFALL
ENERGAKoszalin
EnergiaProWrocławWałbrzychLegnicaOpoleJelenia Góra
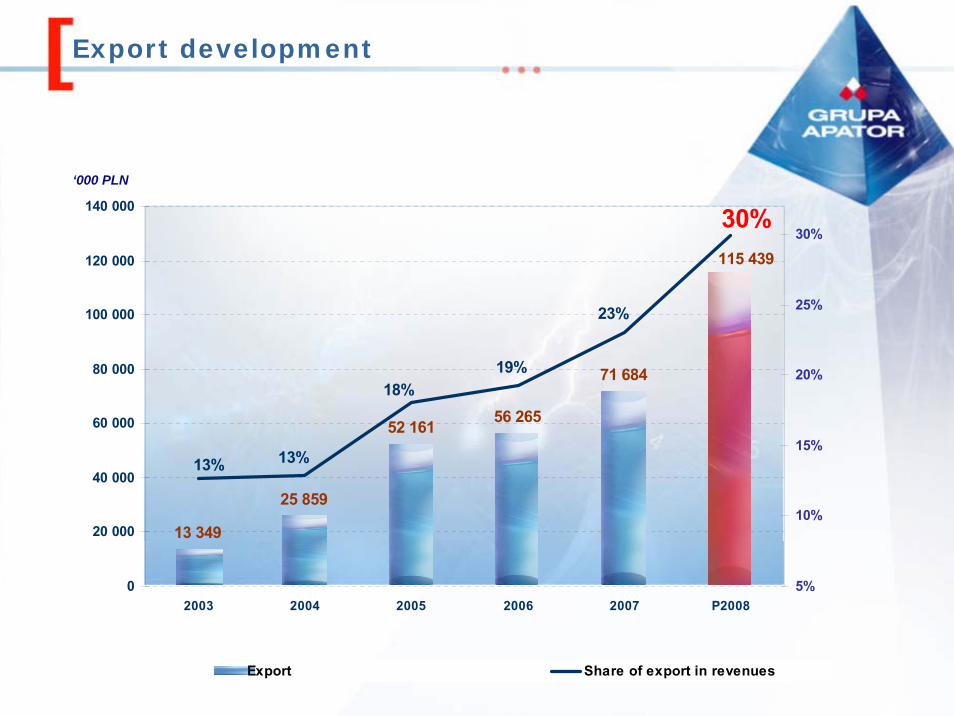
Export development
13 349
25 859
52 161 56 265
71 684
115 439
30%
19%
23%
13% 13%
18%
0
20 000
40 000
60 000
80 000
100 000
120 000
140 000
2003 2004 2005 2006 2007 P20085%
10%
15%
20%
25%
30%
Export Share of export in revenues
‘000 PLN
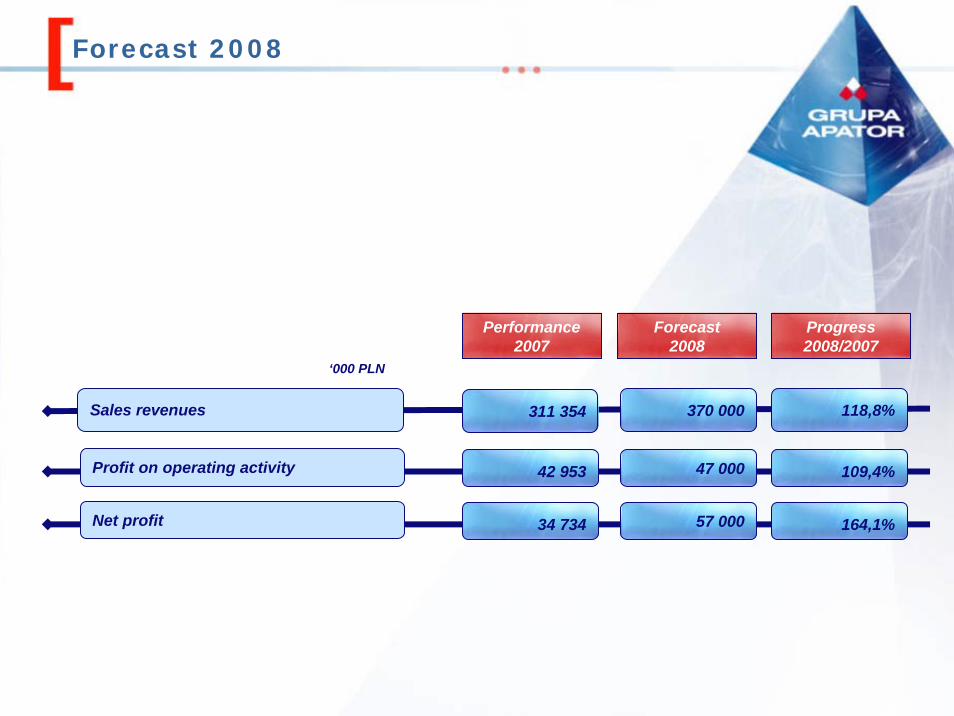
Forecast 2008
Sales revenues 311 354 370 000 118,8%
Performance2007
Net profit 34 734 57 000 164,1%
Forecast2008
Progress2008/2007
Profit on operating activity 42 953 47 000 109,4%
‘000 PLN
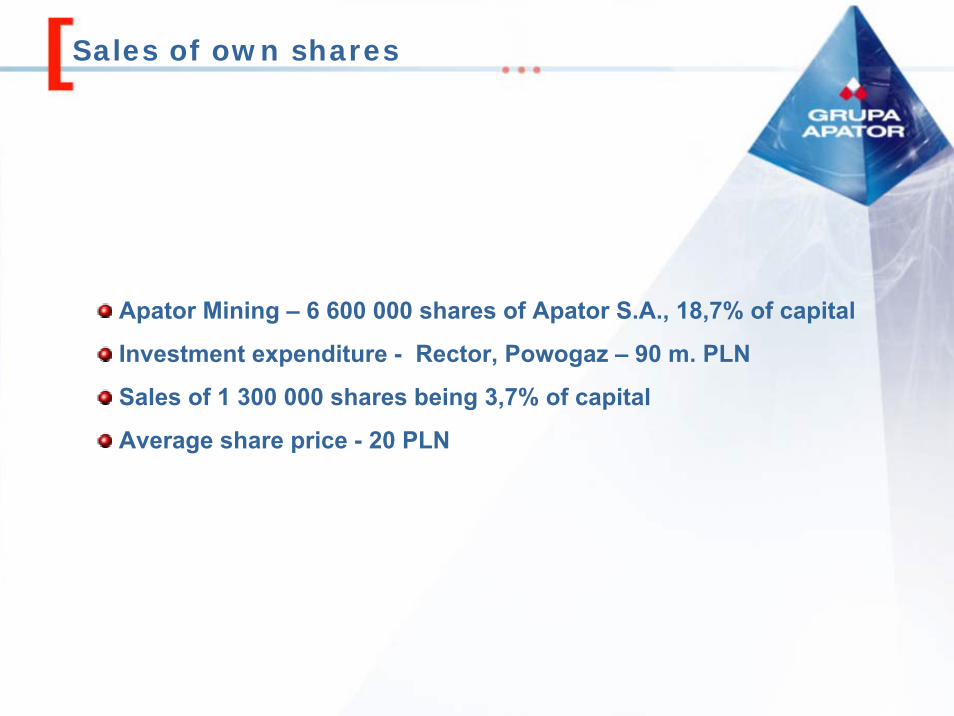
Sales of own shares
Apator Mining – 6 600 000 shares of Apator S.A., 18,7% of capital
Investment expenditure - Rector, Powogaz – 90 m. PLN
Sales of 1 300 000 shares being 3,7% of capital
Average share price - 20 PLN
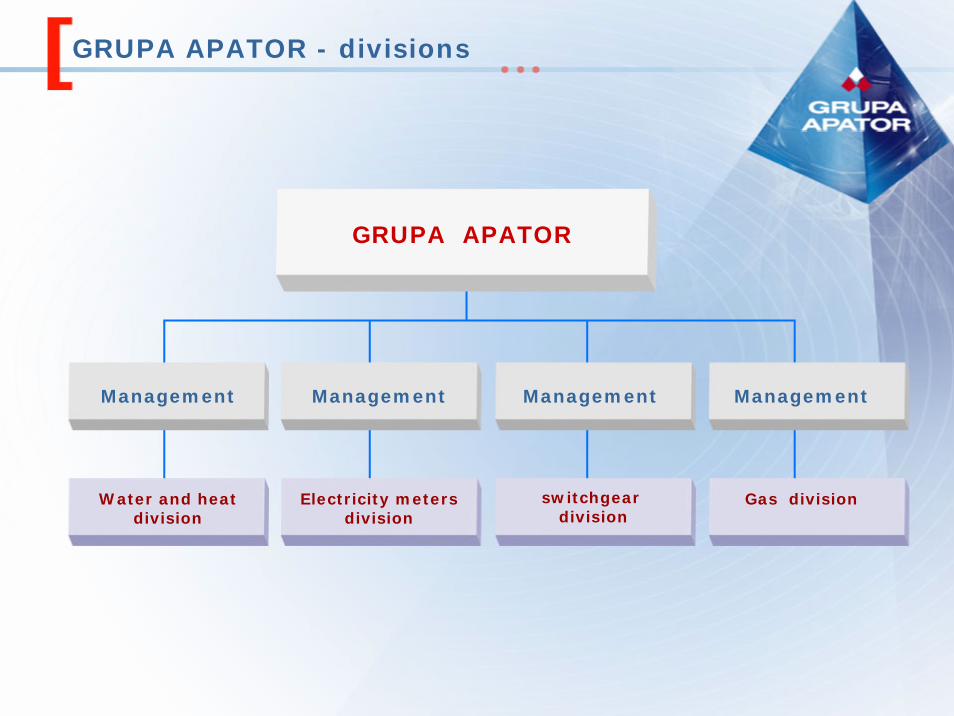
GRUPA APATOR
Management Management Management Management
Water and heatdivision
Electricity metersdivision
switchgeardivision
Gas division
GRUPA APATOR - divisions
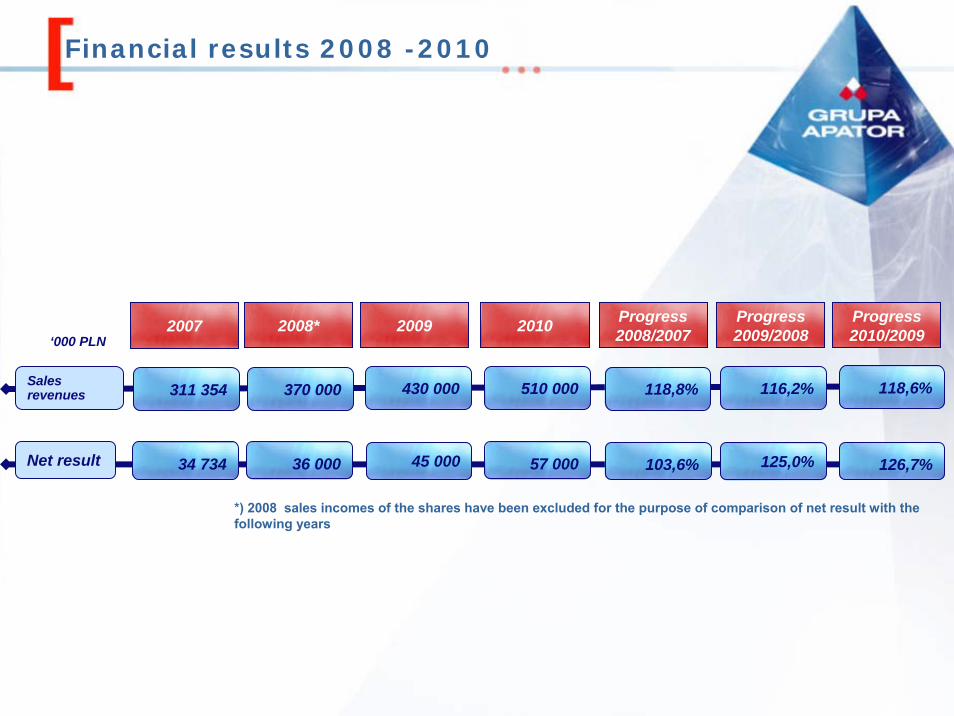
Financial results 2008 -2010
*) 2008 sales incomes of the shares have been excluded for the purpose of comparison of net result with thefollowing years
Salesrevenues 118,8% 116,2% 118,6%
Progress2008/2007
Net result 103,6% 125,0% 126,7%
Progress2009/2008
Progress2010/20092008* 2009 2010
370 000 430 000 510 000
36 000 45 000 57 000
2007
311 354
34 734
‘000 PLN
Investors
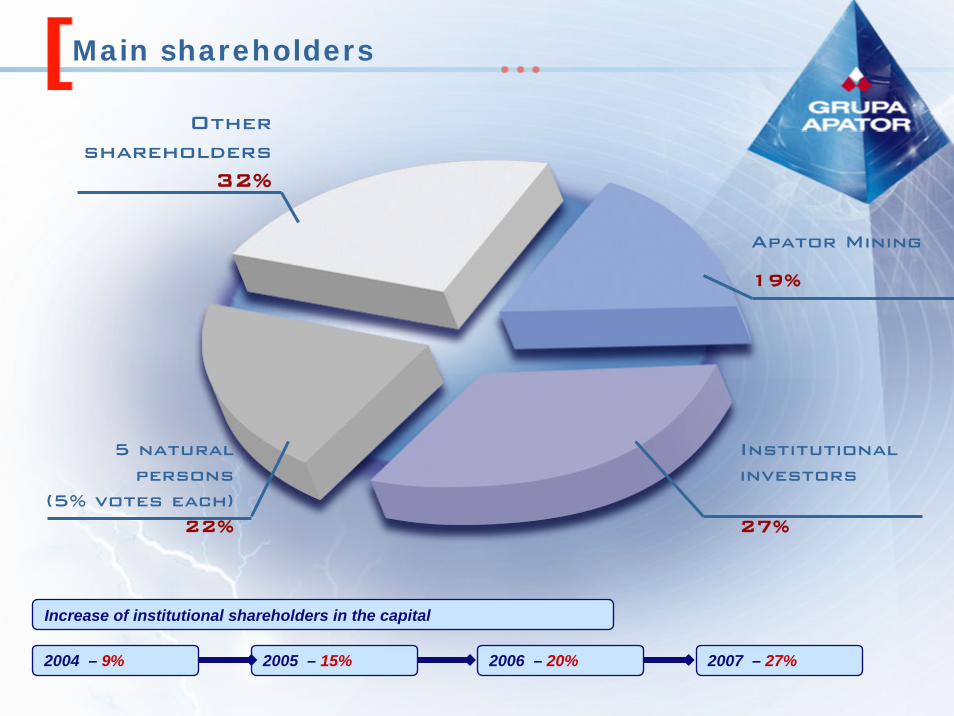
Main shareholders
Othershareholders
32%
Apator Mining
19%
Institutionalinvestors
27%
5 naturalpersons
(5% votes each)22%
2004 – 9% 2005 – 15% 2006 – 20% 2007 – 27%
Increase of institutional shareholders in the capital
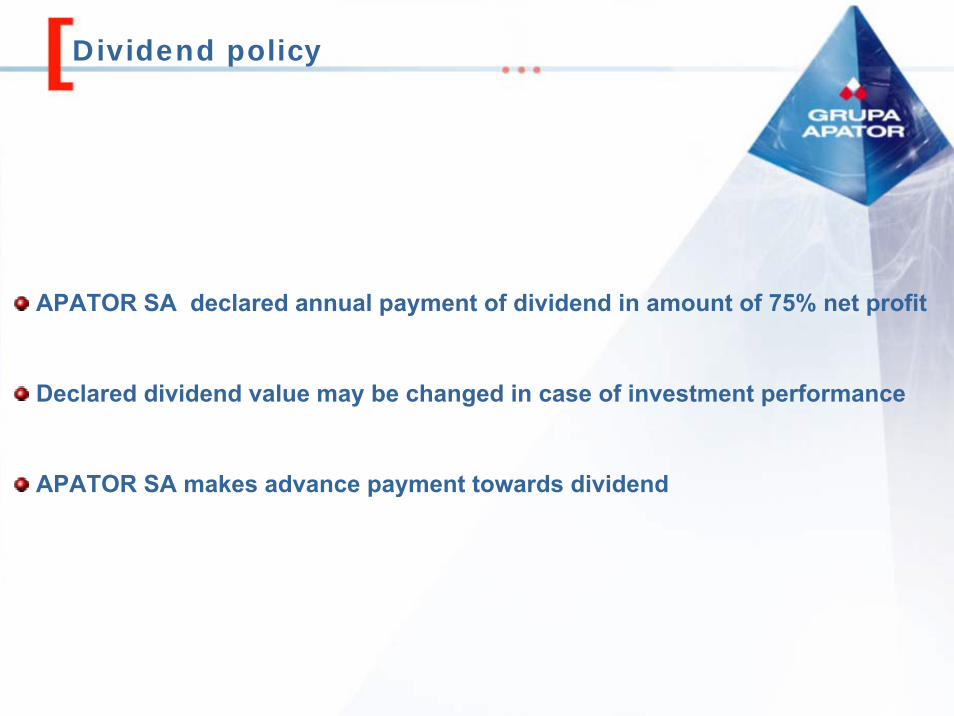
Dividend policy
APATOR SA declared annual payment of dividend in amount of 75% net profit
Declared dividend value may be changed in case of investment performance
APATOR SA makes advance payment towards dividend
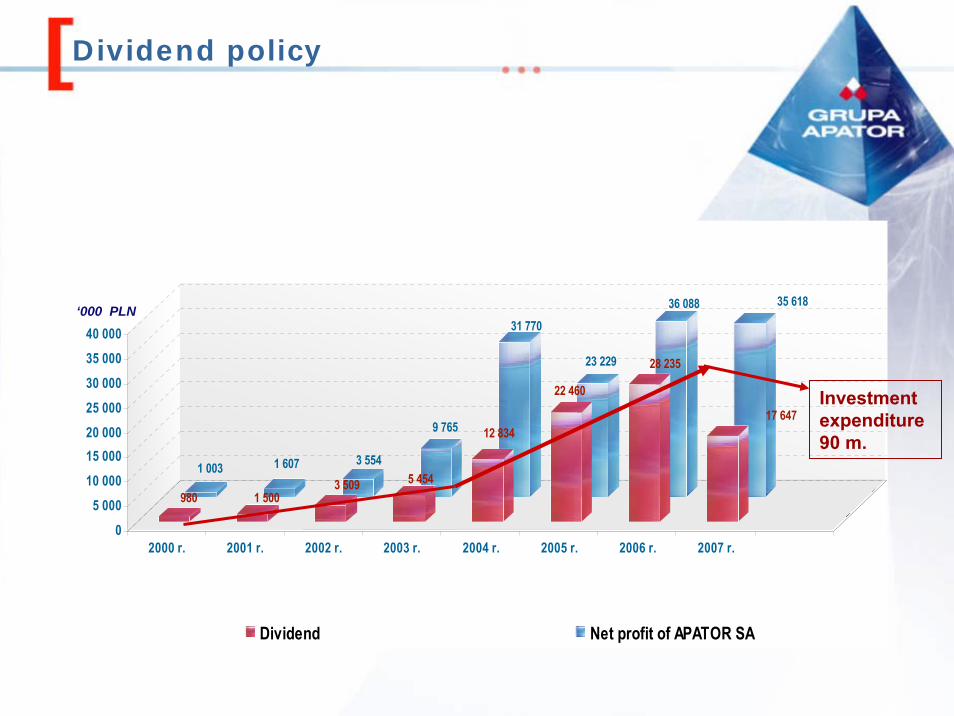
Dividend policy
1 003 1 607 3 554
9 765
31 770
23 229
36 088 35 618
980 1 5003 509 5 454
12 834
22 460
28 235
17 647
0
5 000
10 000
15 00020 000
25 000
30 000
35 000
40 000
2000 r. 2001 r. 2002 r. 2003 r. 2004 r. 2005 r. 2006 r. 2007 r.
Dividend Net profit of APATOR SA
Investmentexpenditure90 m.
‘000 PLN
Thank you for your attention
Recommended