Philips reports third-quarter comparable sales growth of 3% to EUR5.6 billion; operational results improve by 33% to EUR 634 million
• Comparable sales in growth geographies up 10%• EBITA increased to EUR 562 million, or 10.0% of sales, compared to 6.3% in Q3 2012• EBITA excluding restructuring and other charges increased to EUR 634 million, or 11.3% of
sales• Net income increased to EUR 281 million, compared to EUR 105 million in Q3 2012• Free cash flow amounted to EUR 117 million• New EUR 1.5 billion share buy-back program starts on October 21
Frans van Houten, CEO:
“This was another solid quarter for Philips, especially in light of the challenging global economic environment. I am pleasedwith the 33% increase in our operational results, clearly reflecting the continuing benefits of our Accelerate! program. AtHealthcare, EBITA improved while sales were flat and order intake declined by 2%. Consumer Lifestyle continued itsstrong sales performance with a comparable sales growth of 9%, driven by our focus on locally relevant products. AtLighting, LED-based sales grew 33% over the previous year, leading to an overall growth of 3%.
We continued to make good progress on the Accelerate! journey. Our overhead cost reduction program has resulted inEUR 856 million in total gross savings to date, including EUR 183 million realized in Q3 2013. Our End2End programs aredelivering strong results. The leaning-out of the supply chain has led to a reduction of inventory. Our Design for Excellence(DfX) program is building a strong funnel of opportunities to lower cost of goods sold in the coming years. End2End alsoenables us to deliver more locally relevant innovations faster to our customers. We see strong positive engagement fromour employees, making us more agile and entrepreneurial.
Our strategic focus on value-accretive innovations and new business models is resulting in encouraging successes acrossour markets. As the leader in the growing image-guided interventions and therapy market, Philips was the first company toinstall an advanced hybrid operating room in a leading medical institute in Moscow, which will serve as an example forother hospitals in Russia. Building on our leadership in digital innovation, we recently unveiled a range of higher-valueconnected consumer products, such as a smart air purifier, baby monitor and a digital grooming guide. As the global leaderin energy-efficient lighting, we have been selected to transform Dubai Municipality’s buildings with intelligent LEDsolutions. Our lighting solutions are saving 50% in electricity usage and will advance Dubai’s mission to become the mostsustainable city in the world.
We remain committed to reaching our financial targets this year. However, ongoing headwinds in the global economy areexpected to continue to affect sales growth in the coming quarters.
Q3 2013 Quarterly report

Q3 financials: Operational results improve significantly across all sectors.
Healthcare currency-comparable equipment order intake declined by 2% year-on-year, with lower order intake at PatientCare & Clinical Informatics, while Imaging Systems recorded a slight increase. Comparable sales were flat year-on-year.Growth at Customer Services, Home Healthcare Solutions and Patient Care & Clinical Informatics was offset by a declineat Imaging Systems. In growth geographies, comparable sales increased by 3%, with strong growth in China, Central &Eastern Europe and Latin America. EBITA margin excluding restructuring and acquisition-related charges increased by 2.0percentage points year-on-year to 14.6%.
Consumer Lifestyle comparable sales increased by 9%, with all businesses, i.e. Health & Wellness, Domestic Appliancesand Personal Care, recording good growth. In the growth geographies, comparable sales registered a strong double-digitincrease. EBITA margin excluding restructuring and acquisition-related charges increased to 11.1%, a year-on-yearimprovement of 3.0 percentage points.
Lighting comparable sales increased by 3%, led by Lumileds, Automotive and Light Sources & Electronics. Comparablesales at Professional Lighting Solutions and Consumer Luminaires declined in the quarter. LED-based sales grew by 33%and now represent 30% of total Lighting sales. In the growth geographies, comparable sales showed a double-digitincrease. EBITA margin excluding restructuring and acquisition-related charges was 10.2%, a year-on-year improvementof 3.9 percentage points.
The new EUR 1.5 billion share buy-back program starts on October 21.
Please refer to page 21 of this press release for more information about forward-looking statements, third-party market share data, use of non-GAAP information and use of fair-value measurements.
Q3 2013 Quarterly report 3
Philips GroupNet incomein millions of euros unless otherwise stated
Q3 Q3
2012 2013
Sales 5,821 5,618
EBITA 366 562 as a % of sales 6.3 10.0
EBIT 254 464 as a % of sales 4.4 8.3
Financial income (expenses) (116) (92)
Income taxes (37) (108)
Results investments in associates (6) 6
Net income from continuing operations 95 270
Discontinued operations 10 11
Net income 105 281
Net income attributable to shareholders percommon share (in euros) - diluted 0.11 0.31
Sales by sectorin millions of euros unless otherwise stated
Q3 Q3 % change
2012 2013 nominal comparable
Healthcare 2,443 2,258 (8) 0
Consumer Lifestyle 1,051 1,091 4 9
Lighting 2,139 2,084 (3) 3
Innovation, Group &Services 188 185 (2) (7)Philips Group 5,821 5,618 (3) 3
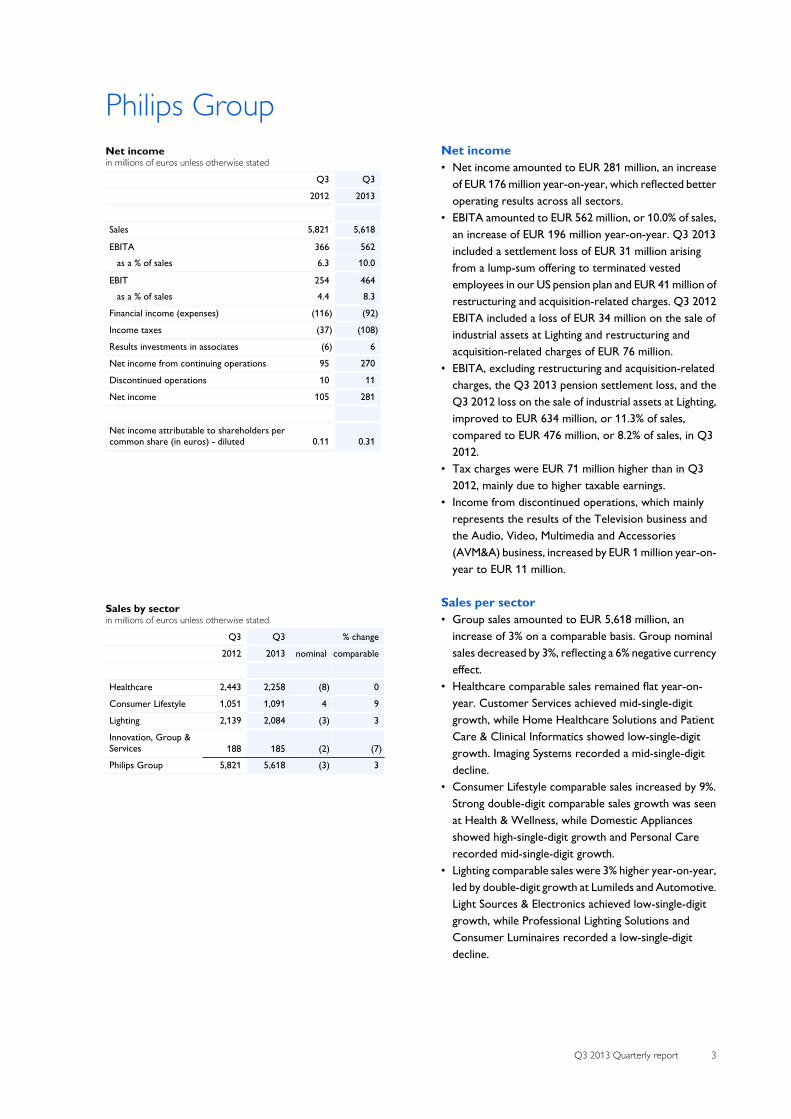
Net income• Net income amounted to EUR 281 million, an increase
of EUR 176 million year-on-year, which reflected betteroperating results across all sectors.
• EBITA amounted to EUR 562 million, or 10.0% of sales,an increase of EUR 196 million year-on-year. Q3 2013included a settlement loss of EUR 31 million arisingfrom a lump-sum offering to terminated vestedemployees in our US pension plan and EUR 41 million ofrestructuring and acquisition-related charges. Q3 2012EBITA included a loss of EUR 34 million on the sale ofindustrial assets at Lighting and restructuring andacquisition-related charges of EUR 76 million.
• EBITA, excluding restructuring and acquisition-relatedcharges, the Q3 2013 pension settlement loss, and theQ3 2012 loss on the sale of industrial assets at Lighting,improved to EUR 634 million, or 11.3% of sales,compared to EUR 476 million, or 8.2% of sales, in Q32012.
• Tax charges were EUR 71 million higher than in Q32012, mainly due to higher taxable earnings.
• Income from discontinued operations, which mainlyrepresents the results of the Television business andthe Audio, Video, Multimedia and Accessories(AVM&A) business, increased by EUR 1 million year-on-year to EUR 11 million.
Sales per sector• Group sales amounted to EUR 5,618 million, an
increase of 3% on a comparable basis. Group nominalsales decreased by 3%, reflecting a 6% negative currencyeffect.
• Healthcare comparable sales remained flat year-on-year. Customer Services achieved mid-single-digitgrowth, while Home Healthcare Solutions and PatientCare & Clinical Informatics showed low-single-digitgrowth. Imaging Systems recorded a mid-single-digitdecline.
• Consumer Lifestyle comparable sales increased by 9%.Strong double-digit comparable sales growth was seenat Health & Wellness, while Domestic Appliancesshowed high-single-digit growth and Personal Carerecorded mid-single-digit growth.
• Lighting comparable sales were 3% higher year-on-year,led by double-digit growth at Lumileds and Automotive.Light Sources & Electronics achieved low-single-digitgrowth, while Professional Lighting Solutions andConsumer Luminaires recorded a low-single-digitdecline.
4 Q3 2013 Quarterly report
Sales per geographic clusterin millions of euros unless otherwise stated
Q3 Q3 % change
2012 2013 nominal comparable
Western Europe 1,402 1,382 (1) (1)
North America 1,852 1,710 (8) (2)
Other mature geographies 524 434 (17) (1)
Total mature geographies 3,778 3,526 (7) (1)
Growth geographies 2,043 2,092 2 10 Philips Group 5,821 5,618 (3) 3
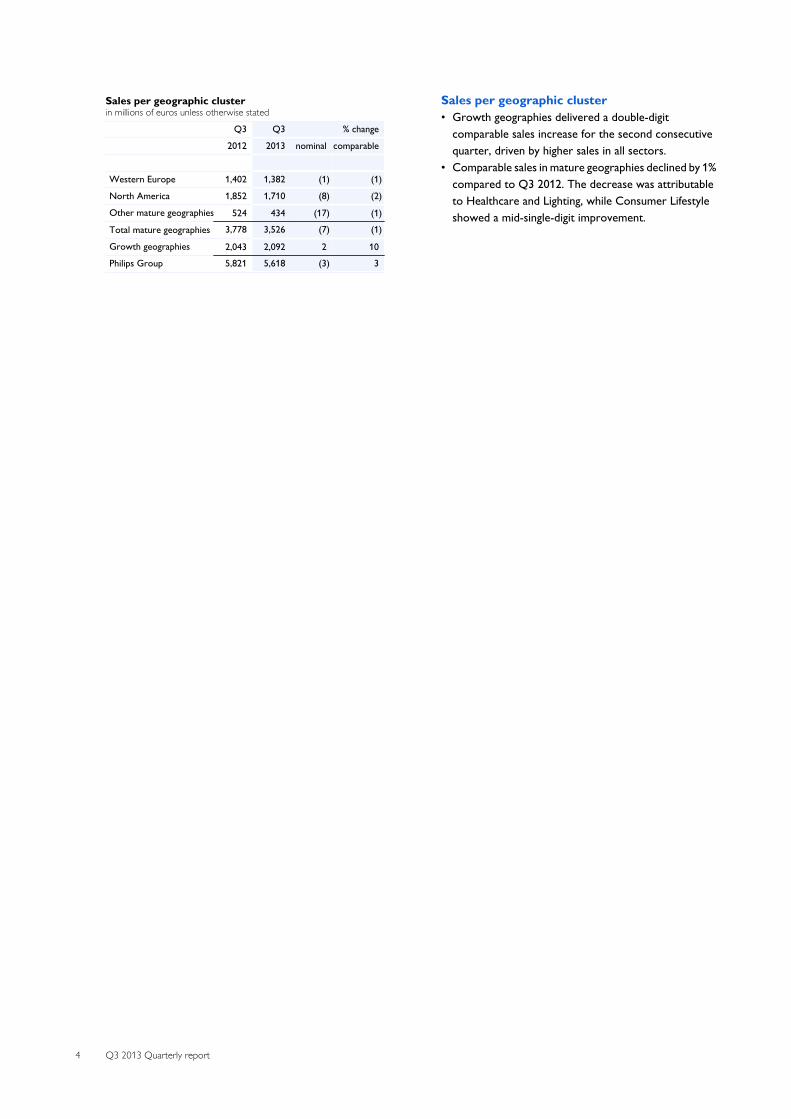
Sales per geographic cluster• Growth geographies delivered a double-digit
comparable sales increase for the second consecutivequarter, driven by higher sales in all sectors.
• Comparable sales in mature geographies declined by 1%compared to Q3 2012. The decrease was attributableto Healthcare and Lighting, while Consumer Lifestyleshowed a mid-single-digit improvement.
Q3 2013 Quarterly report 5
EBITAin millions of euros
Q3 Q3
2012 2013
Healthcare 305 329
Consumer Lifestyle 78 116
Lighting 32 177
Innovation, Group & Services (49) (60)Philips Group 366 562
EBITAas a % of sales
Q3 Q3
2012 2013
Healthcare 12.5 14.6
Consumer Lifestyle 7.4 10.6
Lighting 1.5 8.5
Innovation, Group & Services (26.1) (32.4)Philips Group 6.3 10.0
Restructuring and acquisition-related chargesin millions of euros
Q3 Q3
2012 2013
Healthcare (3) (1)
Consumer Lifestyle (7) (5)
Lighting (68) (36)
Innovation, Group & Services 2 1 Philips Group (76) (41)
EBITin millions of euros unless otherwise stated
Q3 Q3
2012 2013
Healthcare 255 283
Consumer Lifestyle 63 102
Lighting (14) 140
Innovation, Group & Services (50) (61)
Philips Group 254 464 as a % of sales 4.4 8.3
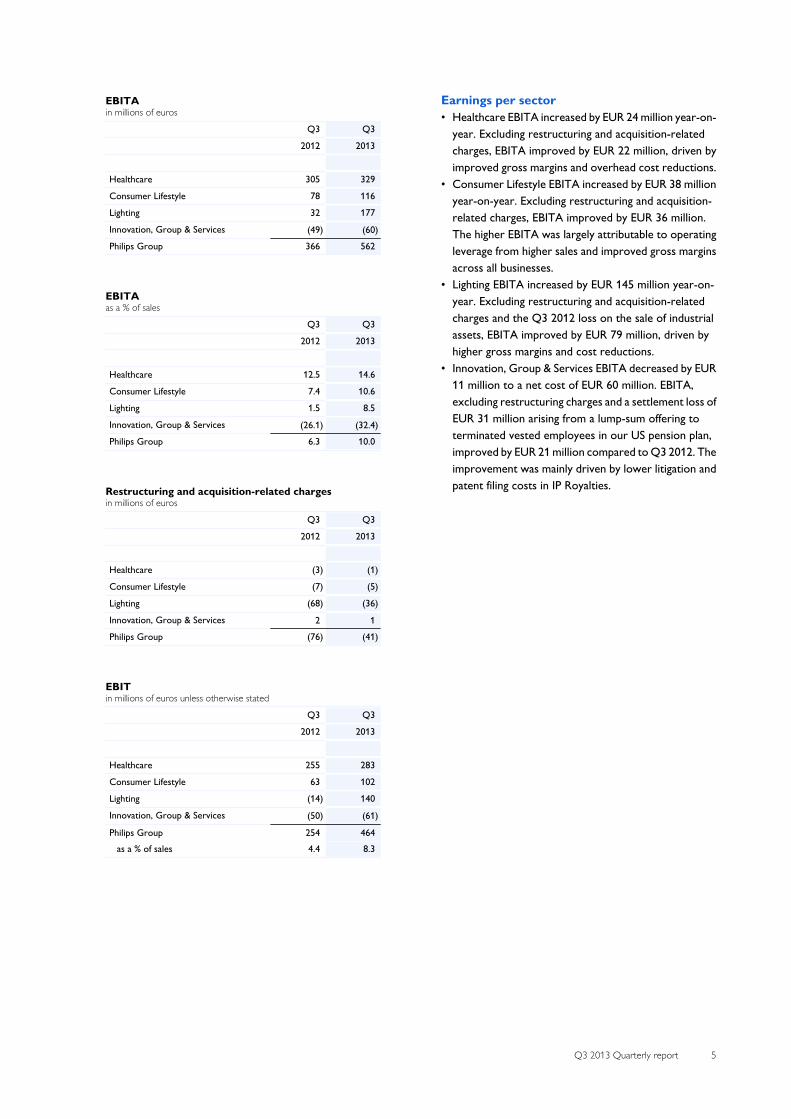
Earnings per sector• Healthcare EBITA increased by EUR 24 million year-on-
year. Excluding restructuring and acquisition-relatedcharges, EBITA improved by EUR 22 million, driven byimproved gross margins and overhead cost reductions.
• Consumer Lifestyle EBITA increased by EUR 38 millionyear-on-year. Excluding restructuring and acquisition-related charges, EBITA improved by EUR 36 million.The higher EBITA was largely attributable to operatingleverage from higher sales and improved gross marginsacross all businesses.
• Lighting EBITA increased by EUR 145 million year-on-year. Excluding restructuring and acquisition-relatedcharges and the Q3 2012 loss on the sale of industrialassets, EBITA improved by EUR 79 million, driven byhigher gross margins and cost reductions.
• Innovation, Group & Services EBITA decreased by EUR11 million to a net cost of EUR 60 million. EBITA,excluding restructuring charges and a settlement loss ofEUR 31 million arising from a lump-sum offering toterminated vested employees in our US pension plan,improved by EUR 21 million compared to Q3 2012. Theimprovement was mainly driven by lower litigation andpatent filing costs in IP Royalties.

6 Q3 2013 Quarterly report
Financial income and expensesin millions of euros
Q3 Q3
2012 2013
Net interest expenses (85) (61)
Value adjustment to option in the UKpension plan (12) (12)
Other (19) (19)(116) (92)
Cash balancein millions of euros
Q3 Q3
2012 2013
Beginning cash balance 3,134 2,307
Free cash flow 410 117
Net cash flow from operating activities 648 337 Net capital expenditures (238) (220)
Acquisitions of businesses (18) (5)
Other cash flow from investing activities (18) (6)
Treasury shares transactions (135) (18)
Dividend paid 1 (41)
Changes in debt/other (142) (237)
Net cash flow discontinued operations − (83)Ending balance 3,232 2,034
Cash flows from operating activitiesin millions of euros
750
500
250
0
648
Q3 2012
124
Q2 2013
337
Q3 2013
Financial income and expenses• Financial income and expenses amounted to a net
expense of EUR 92 million, an improvement of EUR 24million compared with Q3 2012. This was mainlyattributable to lower interest expenses on debt.
Cash balance• The Group cash balance decreased during Q3 2013 to
EUR 2,034 million. A free cash inflow of EUR 117million was more than offset by a EUR 237 millionoutflow, mainly related to debt redemption, and a EUR83 million outflow related to discontinued operations.
• In Q3 2012, the cash balance increased to EUR 3,232million, mainly from a free cash inflow of EUR 410million, partly offset by an outflow of EUR 142 million,mainly related to debt redemption, and the use of EUR135 million in treasury shares transactions, primarily forour share buy-back program.
Cash flows from operating activities• Operating activities resulted in a cash inflow of EUR 337
million, compared to an inflow of EUR 648 million in Q32012. The Q3 2013 figure includes a net increase inworking capital of EUR 357 million, compared to a netdecrease in working capital of EUR 139 million in Q32012. The remaining difference compared to Q3 2012 ismainly attributable to higher earnings.
Q3 2013 Quarterly report 7
Gross capital expenditures1)
in millions of euros
200
150
100
50
0
144
Q3 2012
145
Q2 2013
137
Q3 20131) Capital expenditures on property, plant and equipment only
Inventoriesas a % of sales1)
20
15
10
5
0
16.9
Q3 2012
15.7
Q2 2013
16.5
Q3 20131) sales is calculated over the preceding 12 months
Net debt and group equityin billions of euros
■-group equity--■-net debt15
10
5
0
12.1
1.5
11 : 89
Q3 2012
10.8
2.1
16 : 84
Q2 2013
11.0
2.0
16 : 84
Q3 2013
ratio:
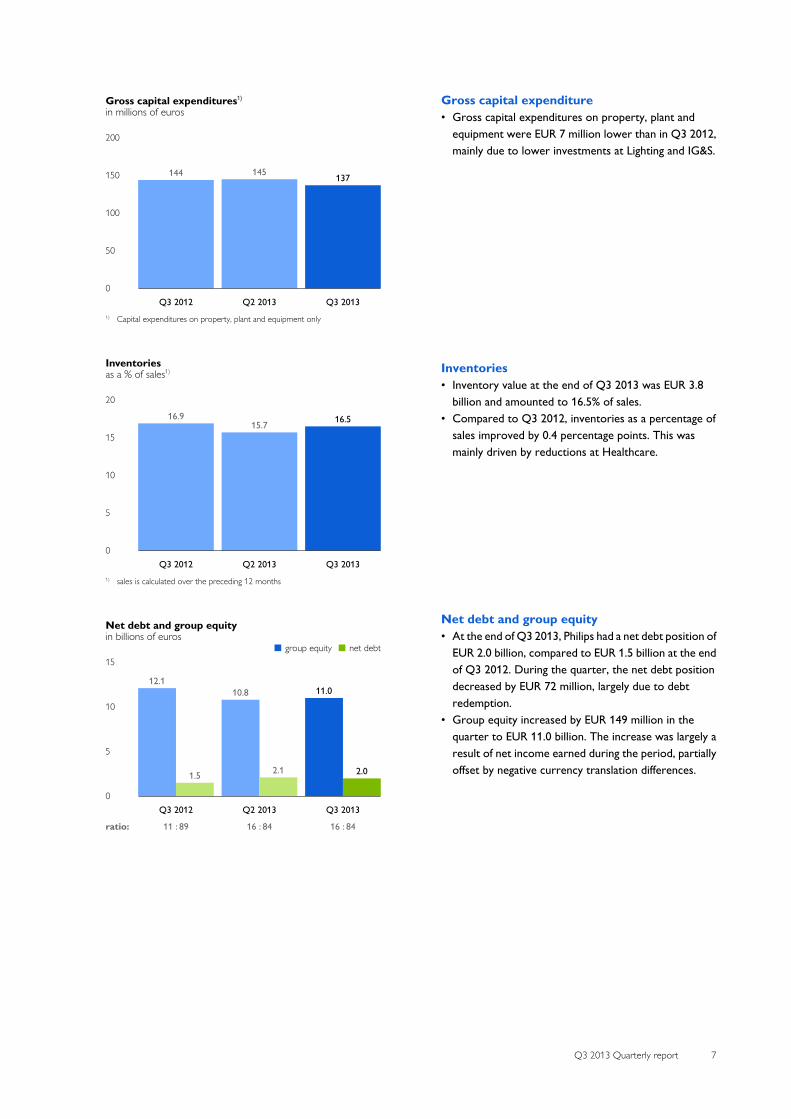
Gross capital expenditure• Gross capital expenditures on property, plant and
equipment were EUR 7 million lower than in Q3 2012,mainly due to lower investments at Lighting and IG&S.
Inventories• Inventory value at the end of Q3 2013 was EUR 3.8
billion and amounted to 16.5% of sales.• Compared to Q3 2012, inventories as a percentage of
sales improved by 0.4 percentage points. This wasmainly driven by reductions at Healthcare.
Net debt and group equity• At the end of Q3 2013, Philips had a net debt position of
EUR 2.0 billion, compared to EUR 1.5 billion at the endof Q3 2012. During the quarter, the net debt positiondecreased by EUR 72 million, largely due to debtredemption.
• Group equity increased by EUR 149 million in thequarter to EUR 11.0 billion. The increase was largely aresult of net income earned during the period, partiallyoffset by negative currency translation differences.
8 Q3 2013 Quarterly report
Number of employeesin FTEs
120,000
115,000
110,000
119,226
Q3 20121)
115,281
Q2 20131)
114,326
Q3 20131)
1) Number of employees excludes discontinued operations. Discontinuedoperations, comprising the Audio, Video, Multimedia and Accessories business,had 1,940 employees at end of Q3 2013 (Q3 2012: 2,058; Q2 2013: 1,958).
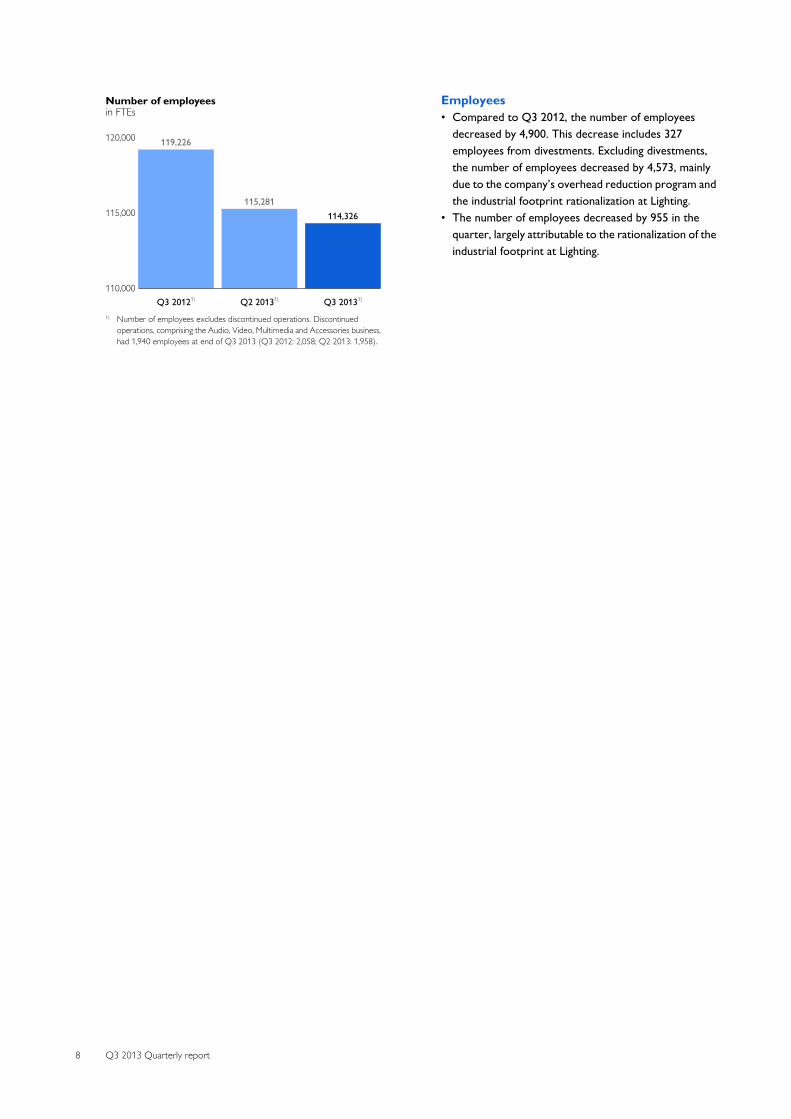
Employees• Compared to Q3 2012, the number of employees
decreased by 4,900. This decrease includes 327employees from divestments. Excluding divestments,the number of employees decreased by 4,573, mainlydue to the company’s overhead reduction program andthe industrial footprint rationalization at Lighting.
• The number of employees decreased by 955 in thequarter, largely attributable to the rationalization of theindustrial footprint at Lighting.
Q3 2013 Quarterly report 9
HealthcareKey datain millions of euros unless otherwise stated
Q3 Q3
2012 2013
Sales 2,443 2,258
Sales growth
% nominal 18 (8)% comparable 7 0
EBITA 305 329 as a % of sales 12.5 14.6
EBIT 255 283 as a % of sales 10.4 12.5
Net operating capital (NOC) 8,261 7,525
Number of employees (FTEs) 38,228 37,569
Salesin millions of euros
3,000
2,250
1,500
750
0
2,443
Q3 2012
2,918
Q4 2012
2,127
Q1 2013
2,362
Q2 2013
2,258
Q3 2013
EBITA
■-EBITA in millions of euros----EBITA as a % of sales500
400
300
200
100
0
12.5305
Q3 2012
14.1411
Q4 2012
10.4222
Q1 2013
17.8420
Q2 2013
14.6329
Q3 2013
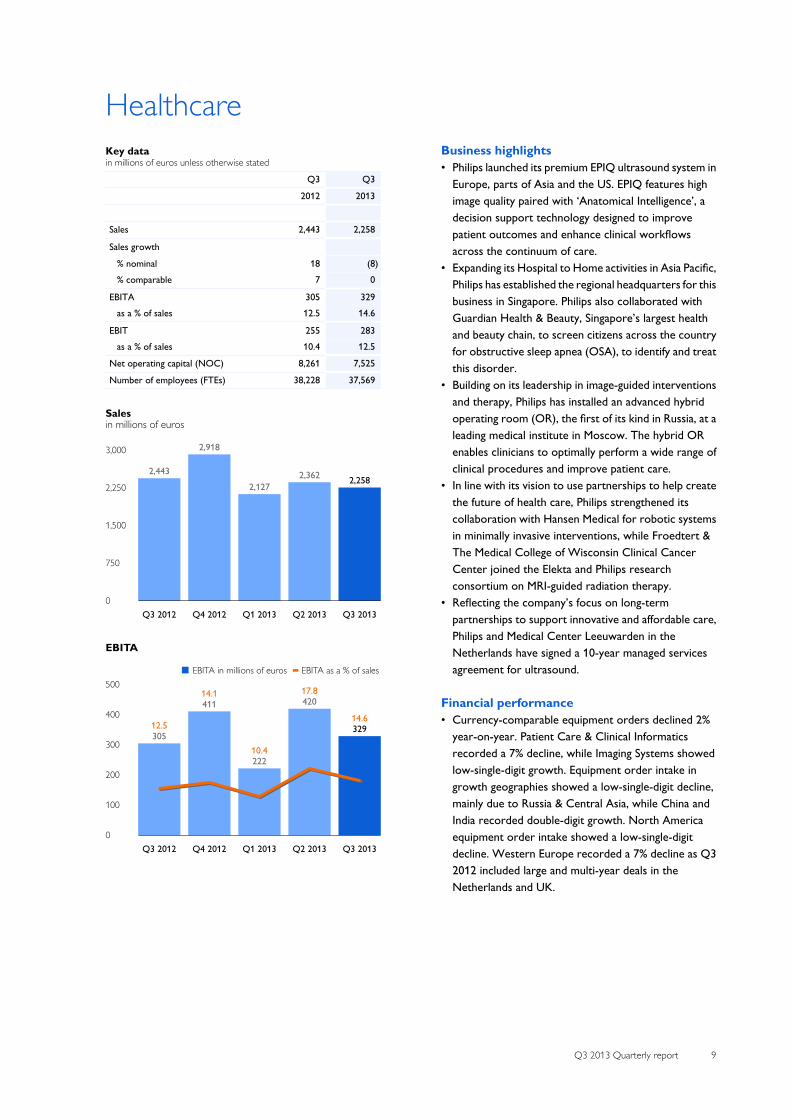
Business highlights• Philips launched its premium EPIQ ultrasound system in
Europe, parts of Asia and the US. EPIQ features highimage quality paired with ‘Anatomical Intelligence’, adecision support technology designed to improvepatient outcomes and enhance clinical workflowsacross the continuum of care.
• Expanding its Hospital to Home activities in Asia Pacific,Philips has established the regional headquarters for thisbusiness in Singapore. Philips also collaborated withGuardian Health & Beauty, Singapore’s largest healthand beauty chain, to screen citizens across the countryfor obstructive sleep apnea (OSA), to identify and treatthis disorder.
• Building on its leadership in image-guided interventionsand therapy, Philips has installed an advanced hybridoperating room (OR), the first of its kind in Russia, at aleading medical institute in Moscow. The hybrid ORenables clinicians to optimally perform a wide range ofclinical procedures and improve patient care.
• In line with its vision to use partnerships to help createthe future of health care, Philips strengthened itscollaboration with Hansen Medical for robotic systemsin minimally invasive interventions, while Froedtert &The Medical College of Wisconsin Clinical CancerCenter joined the Elekta and Philips researchconsortium on MRI-guided radiation therapy.
• Reflecting the company’s focus on long-termpartnerships to support innovative and affordable care,Philips and Medical Center Leeuwarden in theNetherlands have signed a 10-year managed servicesagreement for ultrasound.
Financial performance• Currency-comparable equipment orders declined 2%
year-on-year. Patient Care & Clinical Informaticsrecorded a 7% decline, while Imaging Systems showedlow-single-digit growth. Equipment order intake ingrowth geographies showed a low-single-digit decline,mainly due to Russia & Central Asia, while China andIndia recorded double-digit growth. North Americaequipment order intake showed a low-single-digitdecline. Western Europe recorded a 7% decline as Q32012 included large and multi-year deals in theNetherlands and UK.
10 Q3 2013 Quarterly report
• Healthcare comparable sales remained flat year-on-year. Customer Services achieved mid-single-digitgrowth, while Home Healthcare Solutions and PatientCare & Clinical Informatics showed low-single-digitgrowth. Imaging Systems recorded a mid-single-digitdecline.
• From a regional perspective, comparable sales ingrowth geographies increased by 3% year-on-year, withstrong growth in China, Central & Eastern Europe andLatin America, partly offset by declines in Russia,Central Asia, Middle East and Turkey. Western Europeremained in line with Q3 2012, while North Americadeclined by 2% and other mature geographies recordedlow-single-digit growth.
• EBITA was EUR 329 million, or 14.6% of sales,compared to EUR 305 million, or 12.5% of sales, in Q32012.
• Excluding restructuring and acquisition-related charges,EBITA amounted to EUR 330 million, or 14.6% of sales,compared to EUR 308 million, or 12.6% of sales, in Q32012. The 2.0 percentage points increase was due toimproved gross margins and overhead cost reductions.
• Net operating capital, excluding a negative currencytranslation effect of EUR 547 million, decreased by EUR189 million to EUR 7.5 billion. This decrease was largelydriven by lower fixed assets. Inventories as apercentage of sales improved by 1.2 percentage pointsyear-on-year, driven by reductions in all businesses.
• Compared to Q3 2012, the number of employeesdecreased by 659, mainly as a result of reductions inNorth America and Europe.
Miscellaneous• Restructuring and acquisition-related charges in Q4
2013 are expected to total approximately EUR 5million.

Q3 2013 Quarterly report 11
Consumer Lifestyle**Excluding the Audio, Video, Multimedia and Accessories business
Key datain millions of euros unless otherwise stated
Q3 Q3
2012 2013
Sales 1,051 1,091
Sales growth
% nominal 18 4 % comparable 10 9
EBITA 78 116 as a % of sales 7.4 10.6
EBIT 63 102 as a % of sales 6.0 9.3
Net operating capital (NOC) 1,443 1,164
Number of employees (FTEs) 17,125 16,326
Salesin millions of euros
1,500
1,000
500
0
1,051
Q3 2012
1,385
Q4 2012
1,003
Q1 2013
1,083
Q2 2013
1,091
Q3 2013
EBITA
■-EBITA in millions of euros----EBITA as a % of sales200
100
0
7.478
Q3 2012
9.2127
Q4 2012
9.898
Q1 2013
7.682
Q2 2013
10.6116
Q3 2013
Business highlights• Building its leadership in digital innovation, Philips
unveiled a range of consumer connected propositionsat this year’s IFA in Berlin. Highlights included a smartair purifier, baby monitor and a digital grooming guide.
• The extended Philips AVENT Natural infant feedingrange was showcased at the Kind + Jugend fair inGermany. The Natural baby bottle is proven to be moreeasily accepted by babies, thanks to its unique teatdesign, and has enabled Philips AVENT to achieve the#1 market position in baby bottles in North America.
• Further strengthening our global leadership, the latestintroductions in Oral Healthcare, including the PhilipsSonicare PowerUp and Sonicare Flexcare Platinum,have been well received by consumers and are drivingstrong growth in North America and China.
• Continuing the geographical expansion and localizationof proven product innovations, Philips introduced theAirfryer in Japan and the SoupMaker in Latin America.Additionally, following major success in Russia, theMultiCooker is being launched in several Europeanmarkets, with initial market response exceedingexpectations.
• Innovative, precision tools are driving Philips’ marketshare and brand preference in male grooming.Following the successful launch of the Click & Stylerange, Q3 2013 saw further portfolio expansion withthe introduction of the world’s first laser-guided beardtrimmer.
Financial performance• Consumer Lifestyle comparable sales increased by 9%.
Strong double-digit comparable sales growth was seenat Health & Wellness, while Domestic Appliancesshowed high-single-digit growth and Personal Carerecorded mid-single-digit growth.
• From a regional perspective, Consumer Lifestyleachieved a strong double-digit comparable salesincrease in growth geographies and mid-single-digitgrowth in mature geographies. North America showedhigh-single-digit growth, while Western Europeremained in line with Q3 2012.
• EBITA amounted to EUR 116 million, or 10.6% of sales,an increase of EUR 38 million and 3.2 percentage pointscompared to Q3 2012.
12 Q3 2013 Quarterly report
• Excluding restructuring and acquisition-related charges,EBITA was EUR 121 million, or 11.1% of sales,compared to EUR 85 million, or 8.1% of sales, in Q32012. The improvement of 3.0 percentage points waslargely attributable to operating leverage from highersales and improved gross margins across all businesses.
• EBITA included EUR 7 million of net costs formerlyreported in discontinued businesses (Q3 2012 includedEUR 9 million related to the Audio, Video, Multimediaand Accessories business and EUR 7 million related tothe Television business).
• Net operating capital, excluding a negative currencytranslation effect of EUR 79 million, decreased by EUR200 million year-on-year. The decrease was largelydriven by lower working capital.
• The number of employees decreased by 799 year-on-year, as a result of the seasonal outflow of temporaryindustrial personnel, mainly in the Domestic Appliancesbusiness in the Asian region.
Miscellaneous• Restructuring and acquisition-related charges in Q4
2013 are expected to total approximately EUR 5million.
Q3 2013 Quarterly report 13
LightingKey datain millions of euros unless otherwise stated
Q3 Q3
2012 2013
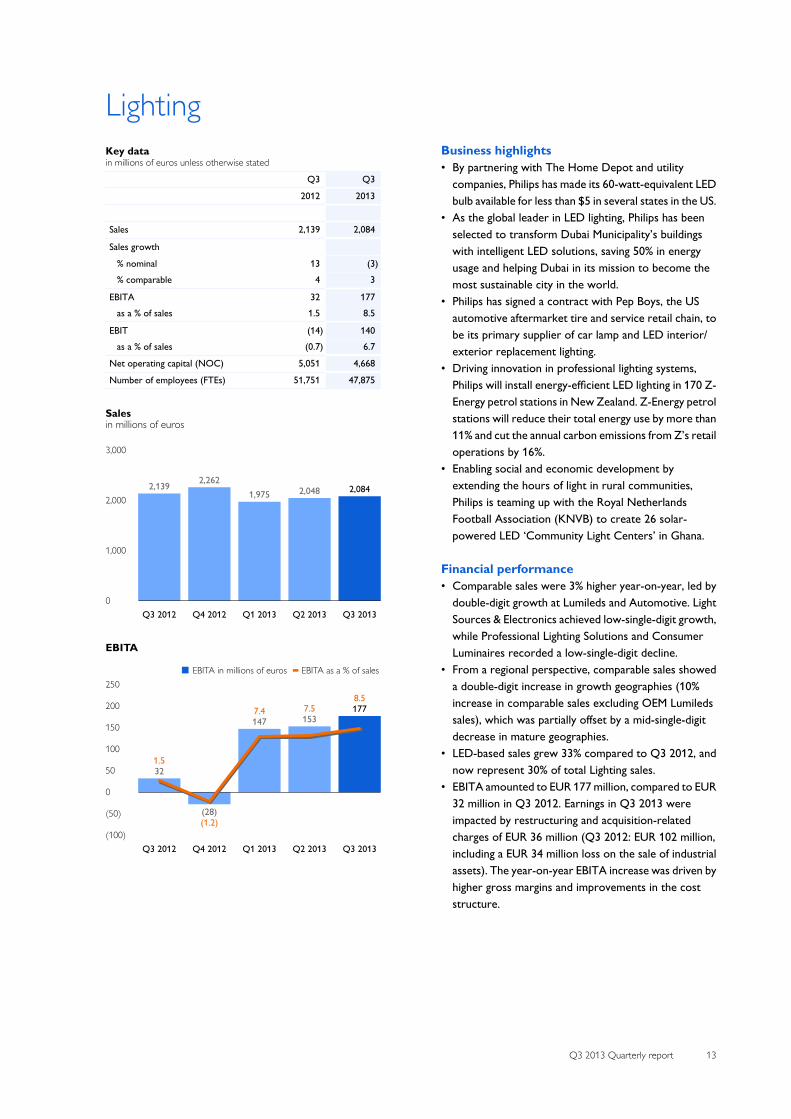
Sales 2,139 2,084
Sales growth
% nominal 13 (3)% comparable 4 3
EBITA 32 177 as a % of sales 1.5 8.5
EBIT (14) 140 as a % of sales (0.7) 6.7
Net operating capital (NOC) 5,051 4,668
Number of employees (FTEs) 51,751 47,875
Salesin millions of euros
3,000
2,000
1,000
0
2,139
Q3 2012
2,262
Q4 2012
1,975
Q1 2013
2,048
Q2 2013
2,084
Q3 2013
EBITA
■-EBITA in millions of euros----EBITA as a % of sales250
200
150
100
50
0
(50)
(100)
1.532
Q3 2012
(1.2)(28)
Q4 2012
7.4147
Q1 2013
7.5153
Q2 2013
8.5177
Q3 2013
Business highlights• By partnering with The Home Depot and utility
companies, Philips has made its 60-watt-equivalent LEDbulb available for less than $5 in several states in the US.
• As the global leader in LED lighting, Philips has beenselected to transform Dubai Municipality’s buildingswith intelligent LED solutions, saving 50% in energyusage and helping Dubai in its mission to become themost sustainable city in the world.
• Philips has signed a contract with Pep Boys, the USautomotive aftermarket tire and service retail chain, tobe its primary supplier of car lamp and LED interior/exterior replacement lighting.
• Driving innovation in professional lighting systems,Philips will install energy-efficient LED lighting in 170 Z-Energy petrol stations in New Zealand. Z-Energy petrolstations will reduce their total energy use by more than11% and cut the annual carbon emissions from Z’s retailoperations by 16%.
• Enabling social and economic development byextending the hours of light in rural communities,Philips is teaming up with the Royal NetherlandsFootball Association (KNVB) to create 26 solar-powered LED ‘Community Light Centers’ in Ghana.
Financial performance• Comparable sales were 3% higher year-on-year, led by
double-digit growth at Lumileds and Automotive. LightSources & Electronics achieved low-single-digit growth,while Professional Lighting Solutions and ConsumerLuminaires recorded a low-single-digit decline.
• From a regional perspective, comparable sales showeda double-digit increase in growth geographies (10%increase in comparable sales excluding OEM Lumiledssales), which was partially offset by a mid-single-digitdecrease in mature geographies.
• LED-based sales grew 33% compared to Q3 2012, andnow represent 30% of total Lighting sales.
• EBITA amounted to EUR 177 million, compared to EUR32 million in Q3 2012. Earnings in Q3 2013 wereimpacted by restructuring and acquisition-relatedcharges of EUR 36 million (Q3 2012: EUR 102 million,including a EUR 34 million loss on the sale of industrialassets). The year-on-year EBITA increase was driven byhigher gross margins and improvements in the coststructure.

14 Q3 2013 Quarterly report
• EBITA, excluding restructuring and acquisition-relatedcharges and other losses, was EUR 213 million, or10.2% of sales (Q3 2012: EUR 134 million, or 6.3% ofsales). Light Sources & Electronics, Professional LightingSolutions and Lumileds were the main contributors tothe operational improvement.
• Net operating capital, excluding a negative currencytranslation effect of EUR 227 million, decreased by EUR156 million year-on-year. The decrease was largelydriven by provisions and lower fixed assets.
• Inventories as a percentage of sales improved by 0.2percentage points year-on-year.
• Compared to Q3 2012, the number of employeesdecreased by 3,876, mainly due to the rationalization ofthe industrial footprint.
Miscellaneous• Restructuring and acquisition-related charges in Q4
2013 are expected to total approximately EUR 20million.

Q3 2013 Quarterly report 15
Innovation, Group & ServicesKey datain millions of euros unless otherwise stated
Q3 Q3
2012 2013
Sales 188 185
Sales growth
% nominal 19 (2)% comparable 16 (7)
EBITA of:
Group Innovation (33) (28)
IP Royalties 63 82
Group and Regional Costs (38) (33)
Accelerate! investments (33) (34)
Pensions 1 (32)Service Units and Other (9) (15)
EBITA (49) (60)
EBIT (50) (61)
Net operating capital (NOC) (3,707) (3,108)
Number of employees (FTEs) 12,122 12,556
Salesin millions of euros
200
150
100
50
0
188
Q3 2012
194
Q4 2012
153
Q1 2013
161
Q2 2013
185
Q3 2013
EBITAin millions of euros
100
0
(100)
(200)
(300)
(400)
(500)
(600)
(49)
Q3 2012(560)
Q4 2012
(65)
Q1 2013
(52)
Q2 2013
(60)
Q3 2013
Business highlights• Philips improved its brand ranking by one position to
become the 40th most valuable brand in the top-100global brands by Interbrand. The brand value of Philipsincreased by 8% to close to USD 10 billion.
• Philips received 510(k) clearance from the US Food andDrug Administration to bring to the US market its firstDigital Pathology product for a digital manual read ofHER2 status for patients with invasive breast cancer.Assessment of HER2 is a standard test to evaluatetreatment options.
• Philips was recognized as a leader in the CarbonDisclosure Project for the third consecutive year onboth performance and disclosure.
• Philips received a total of eight Successful DesignAwards China 2013. Five of the winners were for Philipshealth care solutions, with the highest honor of the‘Diamond Award’ going to the Philips AmbientExperience Electro Physiology Lab.
• Underscoring its innovation in lighting technology,Philips has collaborated with Audi, Merck KGaA,Automotive Lighting and the University of Cologne in aresearch consortium to create the world’s first large-area, 3D organic light-emitting diodes (OLEDs); theseOLEDs have now been applied in the rear lighting of avehicle for the first time.
Financial performance• Sales decreased marginally from EUR 188 million in Q3
2012 to EUR 185 million in Q3 2013. • EBITA amounted to a net cost of EUR 60 million,
including a EUR 31 million settlement loss arising from alump-sum offering to terminated vested employees inour US pension plan. Net restructuring charges in Q32013 amounted to a release of EUR 1 million (Q3 2012:a net release of EUR 2 million).
• EBITA, excluding restructuring charges and the EUR 31million pension settlement loss, improved by EUR 21million compared to Q3 2012, mainly due to lowerlitigation and patent filing costs in IP Royalties.
• EBITA of Service Units and Other included EUR 19million of net costs formerly reported in discontinuedbusinesses (Q3 2012 included EUR 9 million related tothe Audio, Video, Multimedia and Accessories businessand EUR 3 million related to the Television business).

16 Q3 2013 Quarterly report
• Compared to Q3 2012, the number of employeesincreased by 434, primarily due to the centralization ofHuman Resource and Research activities, partly offsetby restructuring activities in the Service Units.
• Net operating capital, excluding a currency translationeffect of EUR 101 million, increased by EUR 498 millionyear-on-year, mainly due to an increase in the value ofcurrency hedges.
Miscellaneous• Restructuring charges in Q4 2013 are expected to total
approximately EUR 5 million.
Q3 2013 Quarterly report 17
Additional information on Audio, Video,Multimedia and Accessories businessAVM&A results reconciliationin millions of euros unless otherwise stated
Q3 Q3
2012 2013
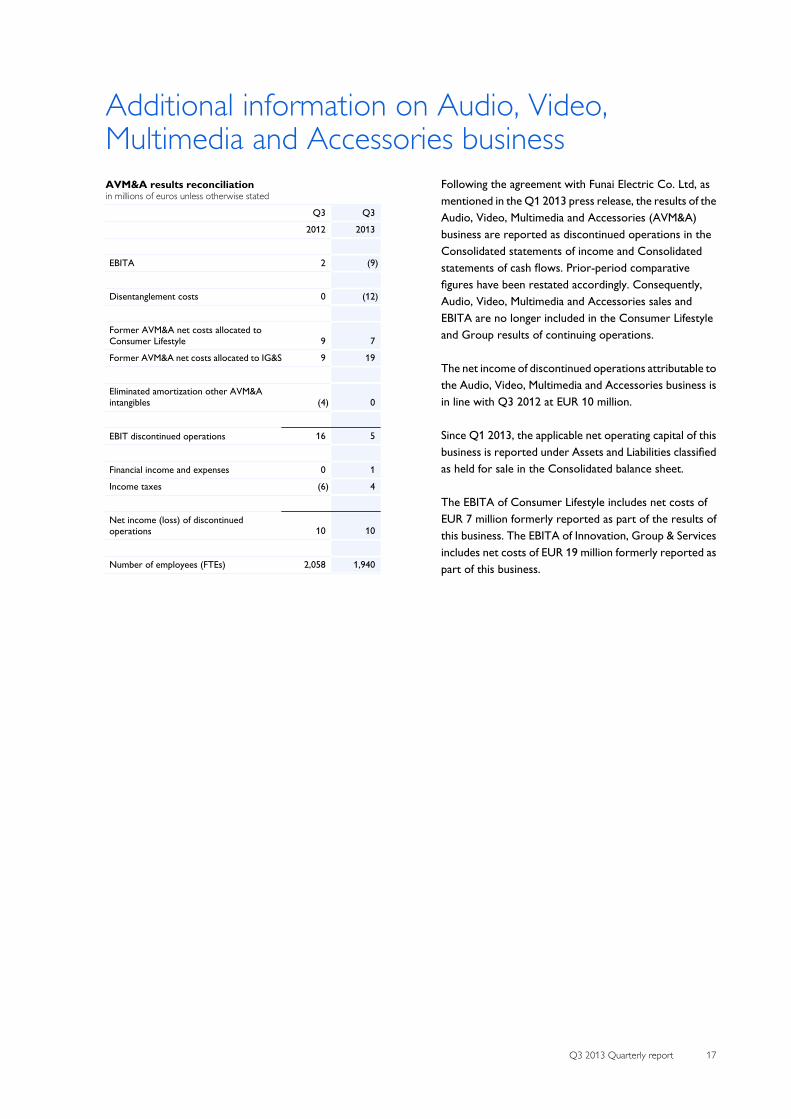
EBITA 2 (9)
Disentanglement costs 0 (12)
Former AVM&A net costs allocated toConsumer Lifestyle 9 7
Former AVM&A net costs allocated to IG&S 9 19
Eliminated amortization other AVM&Aintangibles (4) 0
EBIT discontinued operations 16 5
Financial income and expenses 0 1
Income taxes (6) 4
Net income (loss) of discontinuedoperations 10 10
Number of employees (FTEs) 2,058 1,940
Following the agreement with Funai Electric Co. Ltd, asmentioned in the Q1 2013 press release, the results of theAudio, Video, Multimedia and Accessories (AVM&A)business are reported as discontinued operations in theConsolidated statements of income and Consolidatedstatements of cash flows. Prior-period comparativefigures have been restated accordingly. Consequently,Audio, Video, Multimedia and Accessories sales andEBITA are no longer included in the Consumer Lifestyleand Group results of continuing operations.
The net income of discontinued operations attributable tothe Audio, Video, Multimedia and Accessories business isin line with Q3 2012 at EUR 10 million.
Since Q1 2013, the applicable net operating capital of thisbusiness is reported under Assets and Liabilities classifiedas held for sale in the Consolidated balance sheet.
The EBITA of Consumer Lifestyle includes net costs ofEUR 7 million formerly reported as part of the results ofthis business. The EBITA of Innovation, Group & Servicesincludes net costs of EUR 19 million formerly reported aspart of this business.

18 Q3 2013 Quarterly report
Other informationShare repurchase program
Philips will start a share repurchase program of up to EUR1.5 billion to be executed during the next 2-3 years. Themaximum number of shares that will be repurchasedunder this program depends on the development in theshare price during the course of the program. All sharesrepurchased under this program will be cancelled,resulting in a reduction of Philips’ outstanding sharecapital.
Philips will start this repurchase program as of October 21and will enter into subsequent discretionary managementagreements with one or more banks to repurchase Philipsshares within the limits of relevant laws and regulations (inparticular EC Regulation 2273/2003) and Philips’ articlesof association. All transactions under this program will bepublished on Philips’ website (www.philips.com/investor)on a weekly basis.

Q3 2013 Quarterly report 19
Philips quarterly statisticsall amounts in millions of euros unless otherwise stated
2012 2013
1st quarter 2nd quarter 3rd quarter 4th quarter 1st quarter 2nd quarter 3rd quarter 4th quarter
Sales 5,307 5,570 5,821 6,759 5,258 5,654 5,618 comparable sales growth % 5 6 7 5 1 3 3
Gross margin 2,008 2,139 2,253 2,591 2,101 2,347 2,357 as a % of sales 37.8 38.4 38.7 38.3 40.0 41.5 42.0
Selling expenses (1,196) (1,314) (1,298) (1,526) (1,190) (1,245) (1,214) as a % of sales (22.5) (23.6) (22.3) (22.6) (22.6) (22.0) (21.6)
G&A expenses (199) (151) (222) (273) (200) (230) (253) as a % of sales (3.7) (2.7) (3.8) (4.0) (3.8) (4.1) (4.5)
R&D expenses (450) (440) (447) (494) (424) (416) (437) as a % of sales (8.5) (7.9) (7.7) (7.3) (8.1) (7.4) (7.8)
EBIT 341 229 254 (176) 305 509 464 as a % of sales 6.4 4.1 4.4 (2.6) 5.8 9.0 8.3
EBITA 451 339 366 (50) 402 603 562 as a % of sales 8.5 6.1 6.3 (0.7) 7.6 10.7 10.0
Net income (loss) 183 102 105 (420) 162 317 281
Net income (loss) attributable toshareholders 182 102 104 (423) 161 317 282
Net income (loss) - shareholders percommon share in euros - diluted 0.20 0.11 0.11 (0.46) 0.17 0.35 0.31
20 Q3 2013 Quarterly report
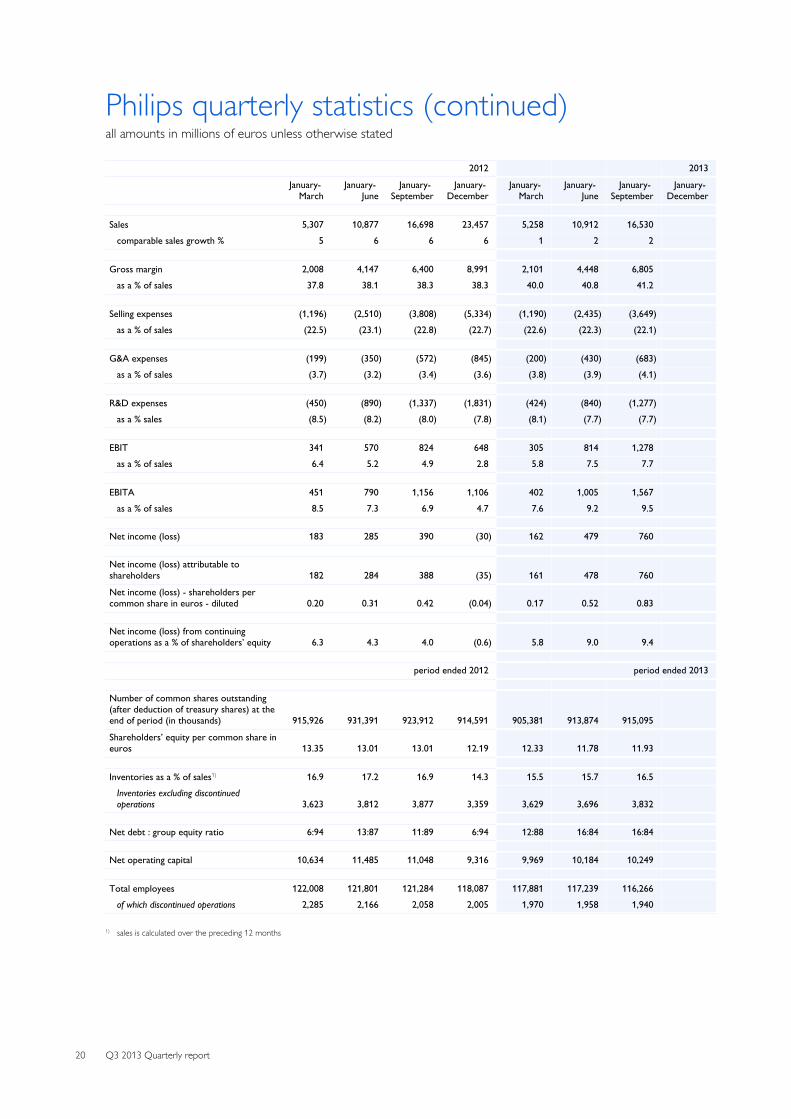
Philips quarterly statistics (continued)all amounts in millions of euros unless otherwise stated
2012 2013
January- March
January- June
January- September
January- December
January- March
January- June
January- September
January- December
Sales 5,307 10,877 16,698 23,457 5,258 10,912 16,530 comparable sales growth % 5 6 6 6 1 2 2
Gross margin 2,008 4,147 6,400 8,991 2,101 4,448 6,805 as a % of sales 37.8 38.1 38.3 38.3 40.0 40.8 41.2
Selling expenses (1,196) (2,510) (3,808) (5,334) (1,190) (2,435) (3,649) as a % of sales (22.5) (23.1) (22.8) (22.7) (22.6) (22.3) (22.1)
G&A expenses (199) (350) (572) (845) (200) (430) (683) as a % of sales (3.7) (3.2) (3.4) (3.6) (3.8) (3.9) (4.1)
R&D expenses (450) (890) (1,337) (1,831) (424) (840) (1,277) as a % sales (8.5) (8.2) (8.0) (7.8) (8.1) (7.7) (7.7)
EBIT 341 570 824 648 305 814 1,278 as a % of sales 6.4 5.2 4.9 2.8 5.8 7.5 7.7
EBITA 451 790 1,156 1,106 402 1,005 1,567 as a % of sales 8.5 7.3 6.9 4.7 7.6 9.2 9.5
Net income (loss) 183 285 390 (30) 162 479 760
Net income (loss) attributable toshareholders 182 284 388 (35) 161 478 760
Net income (loss) - shareholders percommon share in euros - diluted 0.20 0.31 0.42 (0.04) 0.17 0.52 0.83
Net income (loss) from continuingoperations as a % of shareholders’ equity 6.3 4.3 4.0 (0.6) 5.8 9.0 9.4
period ended 2012 period ended 2013
Number of common shares outstanding(after deduction of treasury shares) at theend of period (in thousands) 915,926 931,391 923,912 914,591 905,381 913,874 915,095
Shareholders’ equity per common share ineuros 13.35 13.01 13.01 12.19 12.33 11.78 11.93
Inventories as a % of sales1) 16.9 17.2 16.9 14.3 15.5 15.7 16.5 Inventories excluding discontinuedoperations 3,623 3,812 3,877 3,359 3,629 3,696 3,832
Net debt : group equity ratio 6:94 13:87 11:89 6:94 12:88 16:84 16:84
Net operating capital 10,634 11,485 11,048 9,316 9,969 10,184 10,249
Total employees 122,008 121,801 121,284 118,087 117,881 117,239 116,266 of which discontinued operations 2,285 2,166 2,058 2,005 1,970 1,958 1,940
1) sales is calculated over the preceding 12 months
Q3 2013 Quarterly report 21
Forward-looking statementsForward-looking statements This document and the related oral presentation,including responses to questions following thepresentation, contain certain forward-looking statementswith respect to the financial condition, results ofoperations and business of Philips and certain of the plansand objectives of Philips with respect to these items.Examples of forward-looking statements includestatements made about our strategy, estimates of salesgrowth, future EBITA and future developments in ourorganic business. By their nature, these statementsinvolve risk and uncertainty because they relate to futureevents and circumstances and there are many factors thatcould cause actual results and developments to differmaterially from those expressed or implied by thesestatements.
These factors include but are not limited to domestic andglobal economic and business conditions, developmentswithin the euro zone, the successful implementation ofour strategy and our ability to realize the benefits of thisstrategy, our ability to develop and market new products,changes in legislation, legal claims, changes in exchangeand interest rates, changes in tax rates, pension costs andactuarial assumptions, raw materials and employee costs,our ability to identify and complete successful acquisitionsand to integrate those acquisitions into our business, ourability to successfully exit certain businesses orrestructure our operations, the rate of technologicalchanges, political, economic and other developments incountries where Philips operates, industry consolidationand competition. As a result, Philips’ actual future resultsmay differ materially from the plans, goals andexpectations set forth in such forward-lookingstatements. For a discussion of factors that could causefuture results to differ from such forward-lookingstatements, see the Risk management chapter included inour Annual Report 2012.
Third-party market share data Statements regarding market share, including thoseregarding Philips’ competitive position, contained in thisdocument are based on outside sources such as researchinstitutes, industry and dealer panels in combination withmanagement estimates. Where information is not yetavailable to Philips, those statements may also be based onestimates and projections prepared by outside sources ormanagement. Rankings are based on sales unlessotherwise stated.
Use of non-GAAP information In presenting and discussing the Philips Group financialposition, operating results and cash flows, managementuses certain non-GAAP financial measures. These non-GAAP financial measures should not be viewed inisolation as alternatives to the equivalent IFRS measuresand should be used in conjunction with the most directlycomparable IFRS measures. A reconciliation of these non-GAAP measures to the most directly comparable IFRSmeasures is contained in this document. Furtherinformation on non-GAAP measures can be found in ourAnnual Report 2012.
Use of fair-value measurements In presenting the Philips Group financial position, fairvalues are used for the measurement of various items inaccordance with the applicable accounting standards.These fair values are based on market prices, whereavailable, and are obtained from sources that are deemedto be reliable. Readers are cautioned that these values aresubject to changes over time and are only valid at thebalance sheet date. When quoted prices or observablemarket data are not readily available, fair values areestimated using appropriate valuation models andunobservable inputs. Such fair value estimates requiremanagement to make significant assumptions with respectto future developments, which are inherently uncertainand may therefore deviate from actual developments.Critical assumptions used are disclosed in our AnnualReport 2012. Independent valuations may have beenobtained to support management’s determination of fairvalues.
All amounts are in millions of euros unless otherwisestated. All reported data is unaudited. Financial reportingis in accordance with the accounting policies as stated inthe Annual Report 2012, unless otherwise stated.
Prior-period financials have been restated for thetreatment of Audio, Video, Multimedia and Accessories asdiscontinued operations, the adoption of IAS 19R, whichmainly relates to pension reporting, and adjustments tothe quarterly figures of 2012, which have already beenincluded in the Annual Report 2012 (for an explanationrefer to Annual Report 2012 section 12.10 “SignificantAccounting Policies”). An overview of the revised 2012figures per quarter is available on the Philips website, inthe Investor Relations section.

22 Q3 2013 Quarterly report
Condensed consolidated statements of incomein millions of euros unless otherwise stated
3rd quarter January to September
2012 2013 2012 2013
Sales 5,821 5,618 16,698 16,530
Cost of sales (3,568) (3,261) (10,298) (9,725)
Gross margin 2,253 2,357 6,400 6,805
Selling expenses (1,298) (1,214) (3,808) (3,649)
General and administrative expenses (222) (253) (572) (683)
Research and development expenses (447) (437) (1,337) (1,277)
Other business income 9 20 241 102
Other business expenses (41) (9) (100) (20)
Income from operations 254 464 824 1,278
Financial income 13 15 62 51
Financial expenses (129) (107) (352) (304)
Income before taxes 138 372 534 1,025
Income tax expense (37) (108) (158) (298)
Income after taxes 101 264 376 727
Results relating to investments in associates (6) 6 (18) 21
Net income from continuing operations 95 270 358 748
Discontinued operations - net of income tax 10 11 32 12
Net income 105 281 390 760
Attribution of net income for the period
Net income attributable to shareholders 104 282 388 760
Net income attributable to non-controlling interests 1 (1) 2 −
Earnings per common share attributable to shareholders
Weighted average number of common shares outstanding (after deduction of treasury shares) during the period (in thousands):
- basic 929,2611) 914,431 925,1121) 910,145
- diluted 936,1761) 922,209 929,4851) 917,701
Net income attributable to shareholders per common share in euros:
- basic 0.11 0.31 0.42 0.84
- diluted 0.11 0.31 0.42 0.83
1) Adjusted to make 2012 comparable for the elective share dividend premium (273 thousand) issued in June 2013

Q3 2013 Quarterly report 23
Condensed consolidated balance sheetsin millions of euros unless otherwise stated
September 30, December 31, September 29,
2012 2012 2013
Non-current assets:
Property, plant and equipment 2,992 2,959 2,813
Goodwill 7,117 6,948 6,654
Intangible assets excluding goodwill 3,902 3,731 3,400
Non-current receivables 154 176 163
Investments in associates 195 177 165
Other non-current financial assets 557 549 596
Deferred tax assets 1,837 1,919 1,826 Other non-current assets 80 94 67
Total non-current assets 16,834 16,553 15,684
Current assets:
Inventories - net 4,071 3,495 3,832
Other current financial assets − − 10
Other current assets 412 337 425
Derivative financial assets 129 137 138
Income tax receivable 133 97 136
Receivables 4,522 4,585 4,580
Assets classified as held for sale 56 43 486 Cash and cash equivalents 3,232 3,834 2,034
Total current assets 12,555 12,528 11,641
Total assets 29,389 29,081 27,325
Shareholders’ equity 12,016 11,151 10,913 Non-controlling interests 36 34 38
Group equity 12,052 11,185 10,951
Non-current liabilities:
Long-term debt 3,837 3,725 3,374
Long-term provisions 1,969 2,119 2,011
Deferred tax liabilities 144 92 104 Other non-current liabilities 1,955 2,005 1,754
Total non-current liabilities 7,905 7,941 7,243
Current liabilities:
Short-term debt 859 809 692
Derivative financial liabilities 674 517 413
Income tax payable 142 200 119
Accounts and notes payable 2,997 2,839 3,076
Accrued liabilities 2,986 3,171 2,895
Short-term provisions 640 837 613
Liabilities directly associated with assets held for sale 33 27 245 Other current liabilities 1,101 1,555 1,078
Total current liabilities 9,432 9,955 9,131
Total liabilities and group equity 29,389 29,081 27,325

24 Q3 2013 Quarterly report
Condensed consolidated statements of cash flowsin millions of euros
3rd quarter January to September
2012 2013 2012 2013
Cash flows from operating activities:
Net income 105 281 390 760
Loss from discontinued operations (10) (11) (32) (12)
Adjustments to reconcile net income to net cash provided by operating activities:
Fixed assets depreciation, amortization, and impairments 346 330 1,016 946
Impairment of goodwill and other non-current financial assets 9 3 12 6
Net gain (loss) on sale of assets 33 (9) (159) (49)
(Income) loss from investments in associates 3 (7) 9 (22)
Dividends received from investments in associates − − 7 6
(Increase) decrease in working capital: 139 (357) (234) (1,247)
Increase in receivables and other current assets (206) (428) (109) (421)
Increase in inventories (157) (265) (443) (662)
Increase (decrease) in accounts payable, accrued and other liabilities 502 336 318 (164)
(Increase) decrease in non-current receivables, other assets and other liabilities (62) 60 (191) (79)
Increase (decrease) in provisions 51 (76) 107 (243)Other items 34 123 101 167
Net cash provided by operating activities 648 337 1,026 233
Cash flows from investing activities:
Purchase of intangible assets (11) (9) (25) (17)
Proceeds from sale of intangible assets − − 160 −
Expenditures on development assets (86) (88) (250) (268)
Capital expenditures on property, plant and equipment (144) (137) (449) (406)
Proceeds from disposals of property, plant and equipment 3 14 412 22
Cash to derivatives and securities (9) (11) (54) (93)
Purchase of other non-current financial assets (9) (1) (163) (5)
Proceeds from other non-current financial assets − 6 − 15
Purchase of businesses, net of cash acquired (22) 1 (253) (5)Proceeds from sale of interests in businesses, net of cash disposed of 4 (6) 13 85
Net cash used for investing activities (274) (231) (609) (672)
Cash flows from financing activities:
Proceeds from issuance of (payments on) short-term debt (20) (76) 168 (203)
Principal payments on long-term debt (106) (126) (589) (167)
Proceeds from issuance of long-term debt 28 14 1,201 48
Treasury shares transactions (135) (18) (577) (505)Dividends paid 1 (41) (255) (272)
Net cash used for financing activities (232) (247) (52) (1,099)
Net cash provided by (used for) continuing operations 142 (141) 365 (1,538)
Cash flows from discontinued operations:
Net cash used for operating activities (70) (44) (273) (176)Net cash provided by (used for) investing activities 70 (39) 73 (50)
Net cash used for discontinued operations − (83) (200) (226)
Net cash provided by (used for) continuing and discontinued operations 142 (224) 165 (1,764)

Q3 2013 Quarterly report 25
3rd quarter January to September
Effect of change in exchange rates on cash and cash equivalents (44) (49) (80) (36)
Cash and cash equivalents at the beginning of the period 3,134 2,307 3,147 3,834
Cash and cash equivalents at the end of the period 3,232 2,034 3,232 2,034
Net cash paid during the period for
Pensions (149) (157) (490) (489)
Interest (102) (83) (210) (202)Income taxes (92) (139) (275) (378)
For a number of reasons, principally the effects of translation differences, certain items in the statements of cash flows do not correspond to the differences between the balance sheetamounts for the respective items.
26 Q3 2013 Quarterly report
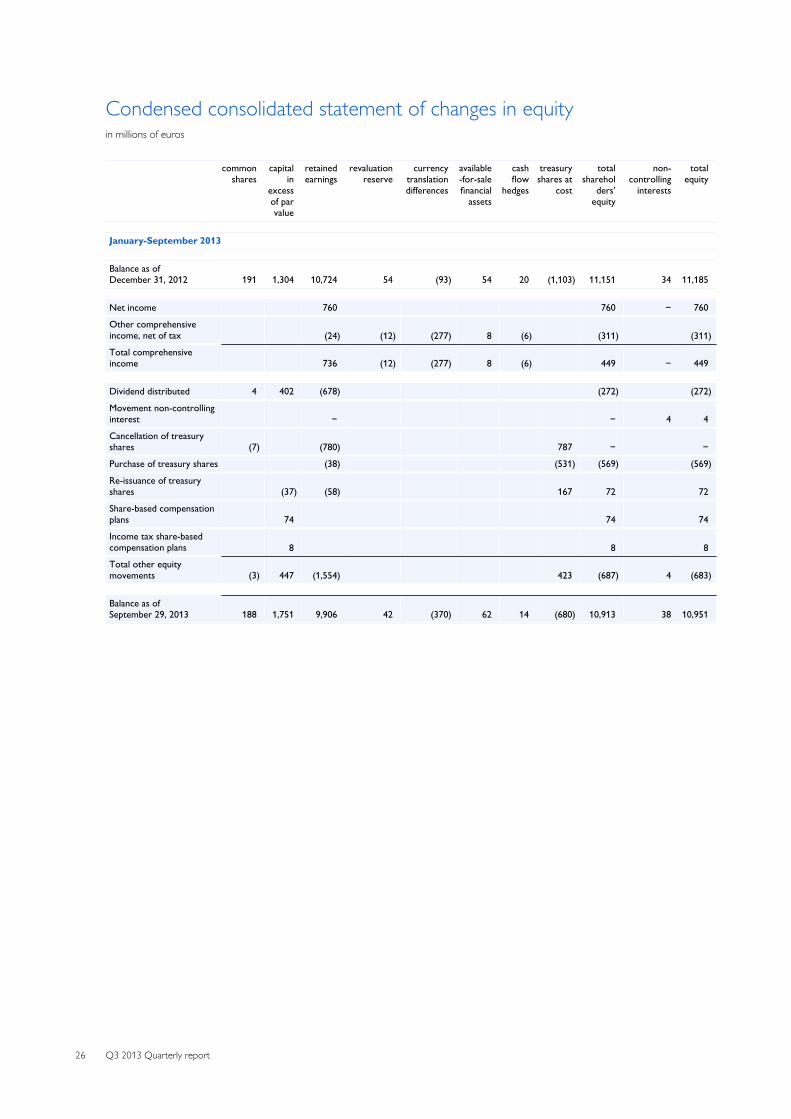
Condensed consolidated statement of changes in equityin millions of euros
commonshares
capitalin
excessof parvalue
retainedearnings
revaluationreserve
currencytranslationdifferences
available-for-salefinancial
assets
cashflow
hedges
treasuryshares at
cost
totalsharehol
ders’equity
non-controlling
interests
totalequity
January-September 2013
Balance as ofDecember 31, 2012 191 1,304 10,724 54 (93) 54 20 (1,103) 11,151 34 11,185
Net income 760 760 − 760
Other comprehensiveincome, net of tax (24) (12) (277) 8 (6) (311) (311)Total comprehensiveincome 736 (12) (277) 8 (6) 449 − 449
Dividend distributed 4 402 (678) (272) (272)
Movement non-controllinginterest − − 4 4
Cancellation of treasuryshares (7) (780) 787 − −
Purchase of treasury shares (38) (531) (569) (569)
Re-issuance of treasuryshares (37) (58) 167 72 72
Share-based compensationplans 74 74 74
Income tax share-basedcompensation plans 8 8 8 Total other equitymovements (3) 447 (1,554) 423 (687) 4 (683)
Balance as ofSeptember 29, 2013 188 1,751 9,906 42 (370) 62 14 (680) 10,913 38 10,951
Q3 2013 Quarterly report 27
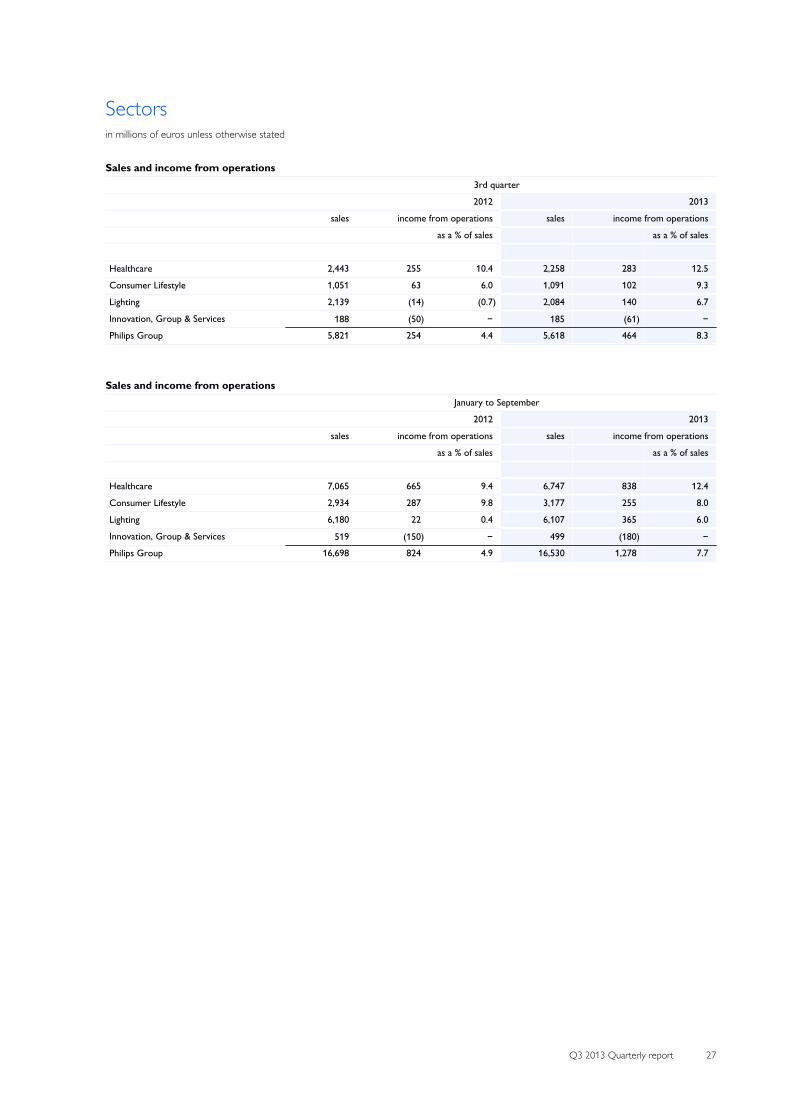
Sectorsin millions of euros unless otherwise stated
Sales and income from operations3rd quarter
2012 2013
sales income from operations sales income from operations
as a % of sales as a % of sales
Healthcare 2,443 255 10.4 2,258 283 12.5
Consumer Lifestyle 1,051 63 6.0 1,091 102 9.3
Lighting 2,139 (14) (0.7) 2,084 140 6.7
Innovation, Group & Services 188 (50) − 185 (61) − Philips Group 5,821 254 4.4 5,618 464 8.3
Sales and income from operationsJanuary to September
2012 2013
sales income from operations sales income from operations
as a % of sales as a % of sales
Healthcare 7,065 665 9.4 6,747 838 12.4
Consumer Lifestyle 2,934 287 9.8 3,177 255 8.0
Lighting 6,180 22 0.4 6,107 365 6.0
Innovation, Group & Services 519 (150) − 499 (180) − Philips Group 16,698 824 4.9 16,530 1,278 7.7

28 Q3 2013 Quarterly report
Sectors and main countriesin millions of euros
Sales total assets and total liabilitiessales total assets total liabilities excluding debt
January to September September 30, September 29, September 30, September 29,
2012 2013 2012 2013 2012 2013
Healthcare 7,065 6,747 11,617 10,783 3,269 3,172
Consumer Lifestyle 2,934 3,177 3,506 3,007 2,063 1,843
Lighting 6,180 6,107 7,316 7,150 2,243 2,461
Innovation, Group & Services 519 499 6,894 5,899 5,033 4,587 29,333 26,839 12,608 12,063
Assets and liabilities classified as held forsale 56 486 33 245 Philips Group 16,698 16,530 29,389 27,325 12,641 12,308
Sales and tangible and intangible assetssales tangible and intangible assets1)
January to September September 30, September 29,
2012 2013 2012 2013
Netherlands 436 463 892 867
United States 4,974 4,699 8,280 7,572
China 1,847 2,045 1,122 1,093
Germany 914 926 261 282
Japan 842 761 621 439
France 663 633 89 82
India 520 493 156 126
Other countries 6,502 6,510 2,590 2,406 Philips Group 16,698 16,530 14,011 12,867
1) Includes property, plant and equipment, goodwill, and intangible assets excluding goodwill

Q3 2013 Quarterly report 29
Pension costsin millions of euros
Specification of pension costs3rd quarter
2012 2013
Netherlands other total Netherlands other total
Defined-benefit plans
Pensions
Current service cost 44 21 65 48 23 71
Past service cost (incl. curtailments) − − − − − −
Settlements − − − − 31 31
Interest expense − 19 19 − 17 17
Interest income (1) − (1) (1) − (1)
Total 43 40 83 47 71 118 of which discontinued operations − − − − − −
Retiree Medical
Interest expense − 3 3 − 2 2
Total − 3 3 − 2 2
Defined-contribution plans
Cost 3 34 37 3 34 37 of which discontinued operations − 1 1 − 1 1
Specification of pension costsJanuary to September
2012 2013
Netherlands other total Netherlands other total
Defined-benefit plans
Pensions
Current service cost 131 65 196 144 64 208
Past service cost (incl. curtailments) − − − − (78) (78)
Settlements − − − − 31 31
Interest expense − 57 57 − 49 49
Interest income (3) − (3) (3) − (3)
Total 128 122 250 141 66 207 of which discontinued operations 1 1 2 1 − 1
Retiree Medical
Current service cost − 1 1 − 1 1
Past service cost (incl. curtailments) − (25) (25) − − −
Interest expense − 9 9 − 8 8
Total − (15) (15) − 9 9
Defined-contribution plans
Cost 8 101 109 7 105 112 of which discontinued operations 1 3 4 − 2 2

30 Q3 2013 Quarterly report
Reconciliation of non-GAAP performance measuresin millions of euros unless otherwise stated
Certain non-GAAP financial measures are presented when discussing the Philips Group’s performance. In the following tables, areconciliation to the most directly comparable IFRS performance measure is made.
Sales growth compositionin %
3rd quarter January to September
comparablegrowth
currencyeffects
consolidationchanges
nominalgrowth
comparablegrowth
currencyeffects
consolidationchanges
nominalgrowth
2013 versus 2012
Healthcare 0.0 (7.1) (0.5) (7.6) (0.5) (3.8) (0.2) (4.5)
Consumer Lifestyle 9.3 (5.5) 0.0 3.8 10.8 (2.5) 0.0 8.3
Lighting 3.0 (5.8) 0.2 (2.6) 1.5 (2.7) 0.0 (1.2)
Innovation, Group &Services (6.9) (1.3) 6.6 (1.6) (8.3) (0.5) 4.9 (3.9)Philips Group 2.5 (6.1) 0.1 (3.5) 2.0 (3.1) 0.1 (1.0)
EBITA (or Adjusted income from operations) to Income from operations (or EBIT)3rd quarter January to September
Income fromoperations (or
EBIT)Amortization of
intangibles1)
EBITA (or Adjustedincome from
operations)
Income fromoperations (or
EBIT)Amortization of
intangibles1)
EBITA (or Adjustedincome from
operations)
2013
Healthcare 283 (46) 329 838 (133) 971
Consumer Lifestyle 102 (14) 116 255 (41) 296
Lighting 140 (37) 177 365 (112) 477
Innovation, Group &Services (61) (1) (60) (180) (3) (177)
Philips Group 464 (98) 562 1,278 (289) 1,567
2012
Healthcare 255 (50) 305 665 (150) 815
Consumer Lifestyle 63 (15) 78 287 (42) 329
Lighting (14) (46) 32 22 (134) 156
Innovation, Group &Services (50) (1) (49) (150) (6) (144)Philips Group 254 (112) 366 824 (332) 1,156
1) Excluding amortization of software and product development
Q3 2013 Quarterly report 31
Reconciliation of non-GAAP performance measures (continued)in millions of euros
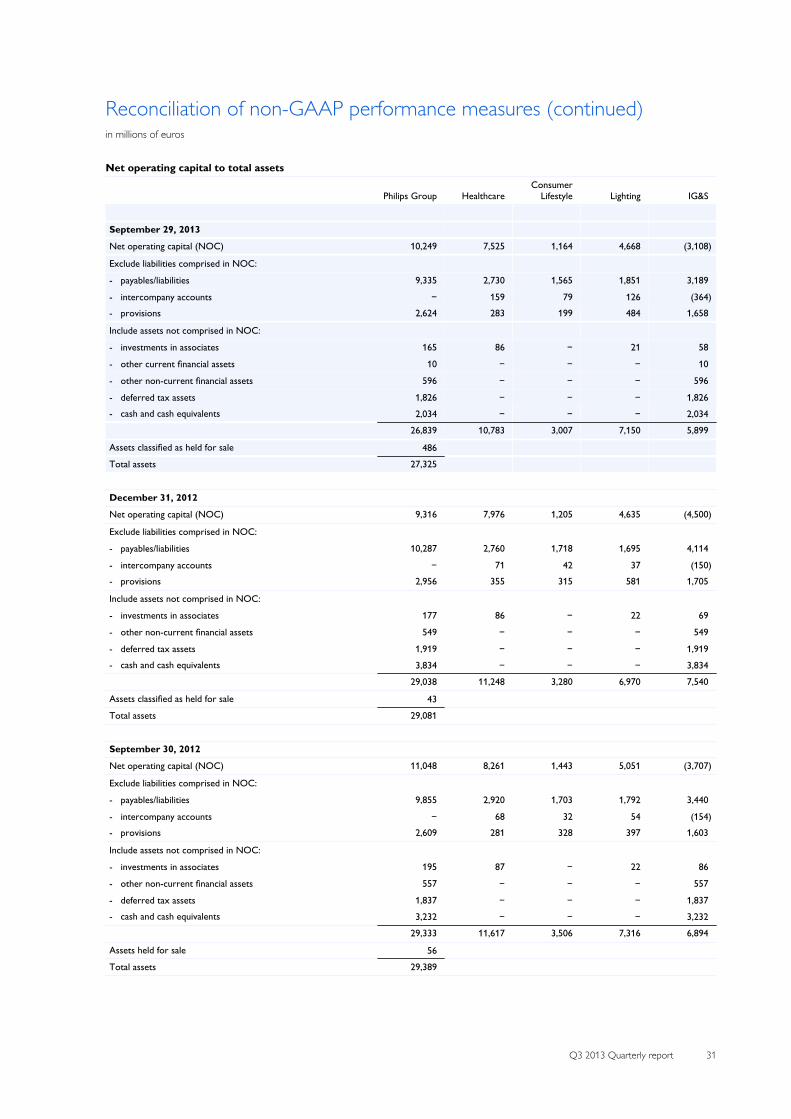
Net operating capital to total assets
Philips Group Healthcare Consumer
Lifestyle Lighting IG&S
September 29, 2013
Net operating capital (NOC) 10,249 7,525 1,164 4,668 (3,108)
Exclude liabilities comprised in NOC:
- payables/liabilities 9,335 2,730 1,565 1,851 3,189
- intercompany accounts − 159 79 126 (364)- provisions 2,624 283 199 484 1,658
Include assets not comprised in NOC:
- investments in associates 165 86 − 21 58
- other current financial assets 10 − − − 10
- other non-current financial assets 596 − − − 596
- deferred tax assets 1,826 − − − 1,826 - cash and cash equivalents 2,034 − − − 2,034
26,839 10,783 3,007 7,150 5,899
Assets classified as held for sale 486
Total assets 27,325
December 31, 2012
Net operating capital (NOC) 9,316 7,976 1,205 4,635 (4,500)
Exclude liabilities comprised in NOC:
- payables/liabilities 10,287 2,760 1,718 1,695 4,114
- intercompany accounts − 71 42 37 (150)- provisions 2,956 355 315 581 1,705
Include assets not comprised in NOC:
- investments in associates 177 86 − 22 69
- other non-current financial assets 549 − − − 549
- deferred tax assets 1,919 − − − 1,919 - cash and cash equivalents 3,834 − − − 3,834
29,038 11,248 3,280 6,970 7,540
Assets classified as held for sale 43
Total assets 29,081
September 30, 2012
Net operating capital (NOC) 11,048 8,261 1,443 5,051 (3,707)
Exclude liabilities comprised in NOC:
- payables/liabilities 9,855 2,920 1,703 1,792 3,440
- intercompany accounts − 68 32 54 (154)- provisions 2,609 281 328 397 1,603
Include assets not comprised in NOC:
- investments in associates 195 87 − 22 86
- other non-current financial assets 557 − − − 557
- deferred tax assets 1,837 − − − 1,837 - cash and cash equivalents 3,232 − − − 3,232
29,333 11,617 3,506 7,316 6,894
Assets held for sale 56
Total assets 29,389

32 Q3 2013 Quarterly report
Reconciliation of non-GAAP performance measures (continued)in millions of euros
Composition of net debt to group equitySeptember 30, December 31, September 29,
2012 2012 2013
Long-term debt 3,837 3,725 3,374
Short-term debt 859 809 692
Total debt 4,696 4,534 4,066
Cash and cash equivalents 3,232 3,834 2,034
Net debt (cash) (total debt less cash and cash equivalents) 1,464 700 2,032
Shareholders’ equity 12,016 11,151 10,913
Non-controlling interests 36 34 38
Group equity 12,052 11,185 10,951
Net debt and group equity 13,516 11,885 12,983
Net debt divided by net debt and group equity (in %) 11 6 16
Group equity divided by net debt and group equity (in %) 89 94 84
Composition of cash flows3rd quarter January to September
2012 2013 2012 2013
Cash flows provided by operating activities 648 337 1,026 233
Cash flows used for investing activities (274) (231) (609) (672)
Cash flows before financing activities 374 106 417 (439)
Cash flows provided by operating activities 648 337 1,026 233
Net capital expenditures: (238) (220) (152) (669)
Purchase of intangible assets (11) (9) (25) (17)
Proceeds from sale of intangible assets − − 160 −
Expenditures on development assets (86) (88) (250) (268)
Capital expenditures on property, plant and equipment (144) (137) (449) (406)Proceeds from sale of property, plant and equipment 3 14 412 22
Free cash flows 410 117 874 (436)

© 2013 Koninklijke Philips N.V.All rights reserved.
http://www.philips.com/investorrelations
Recommended