www.saratogaresources.com
Presentation to IPAA OGIS Conference New York City - April 7th, 2014
1
This presentation includes certain estimates and other forward-looking statements within the meaning of Section 21E of the Securities Exchange Act of 1934, as amended, including statements with respect to anticipated operating and financial performance, growth opportunities, growth rates, potential acquisition opportunities, and other statements of expectation. Words such as “expects,” “anticipates,” “intends,” “plans,” “believes,” “assumes,” “seeks,” “estimates,” “should,” and variations of these words and similar expressions, are intended to identify these forward-looking statements. While we believe these statements are accurate, forward-looking statements are inherently uncertain and we cannot assure you that these expectations will occur and our actual results may be significantly different. These statements by the Company and its management are based on estimates, projections, beliefs and assumptions of management and are not guarantees of future performance. Important factors that could cause actual results to differ from those in the forward-looking statements include the factors described in the “Risk Factors” section of our annual report on Form 10-K for the year ended December 31, 2012 and other reports filed by the Company with the SEC. The Company disclaims any obligation to update or revise any forward-looking statement based on the occurrence of future events, the receipt of new information, or otherwise. This presentation includes certain non-GAAP financial measures that are different from financial measures calculated in accordance with GAAP and may be different from similar measures used by other companies.
Corporate Office
Houston Office Three Riverway, Suite 1810
Houston, Texas 77056 Phone: 713-458-1560
Fax: 713-458-1561
Transfer Agent Securities Transfer Corporation
Legal Counsel
Slattery, Marino & Roberts
Independent Auditors
MaloneBailey LLP
Website www.saratogaresources.com
Stock Ticker NYSE MKT: SARA
Safe Harbor Statement
2
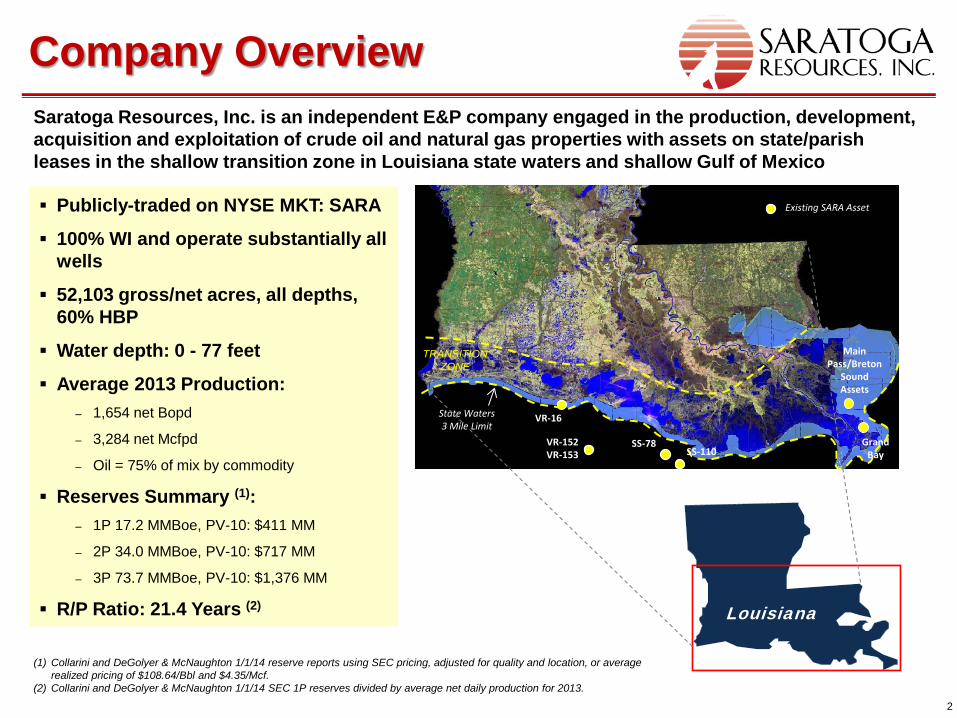
Publicly-traded on NYSE MKT: SARA
100% WI and operate substantially all wells
52,103 gross/net acres, all depths, 60% HBP
Water depth: 0 - 77 feet
Average 2013 Production: ‒ 1,654 net Bopd
‒ 3,284 net Mcfpd
‒ Oil = 75% of mix by commodity
Reserves Summary (1): ‒ 1P 17.2 MMBoe, PV-10: $411 MM
‒ 2P 34.0 MMBoe, PV-10: $717 MM
‒ 3P 73.7 MMBoe, PV-10: $1,376 MM
R/P Ratio: 21.4 Years (2)
Company Overview Saratoga Resources, Inc. is an independent E&P company engaged in the production, development, acquisition and exploitation of crude oil and natural gas properties with assets on state/parish leases in the shallow transition zone in Louisiana state waters and shallow Gulf of Mexico
(1) Collarini and DeGolyer & McNaughton 1/1/14 reserve reports using SEC pricing, adjusted for quality and location, or average realized pricing of $108.64/Bbl and $4.35/Mcf.
(2) Collarini and DeGolyer & McNaughton 1/1/14 SEC 1P reserves divided by average net daily production for 2013.
VR-16
Grand Bay
Main Pass/Breton
Sound Assets
State Waters 3 Mile Limit
TRANSITION ZONE
Louisiana
VR-152 VR-153
SS-78 SS-110
Existing SARA Asset

3
>50,000 Net Acres Held to All Depths, 60% HBP. 100% WI in Substantially All Wells. Multiple Recompletion/Workover Opportunities. Large Inventory of PUD Wells with Multiple Objectives. EURs = 200->600 MBOE per Well. Low Decline Rates. Oil-Weighted Production with LLS/HLS Premium Crude
Pricing. Substantial Upside in Drilling Inventory. Projects with <12 Month Payouts. Trading Below NAV/Share of Proved Reserves. Management has “Skin” in the Game with 34.7% of Common
Stock.
Why Invest in SARA?
4
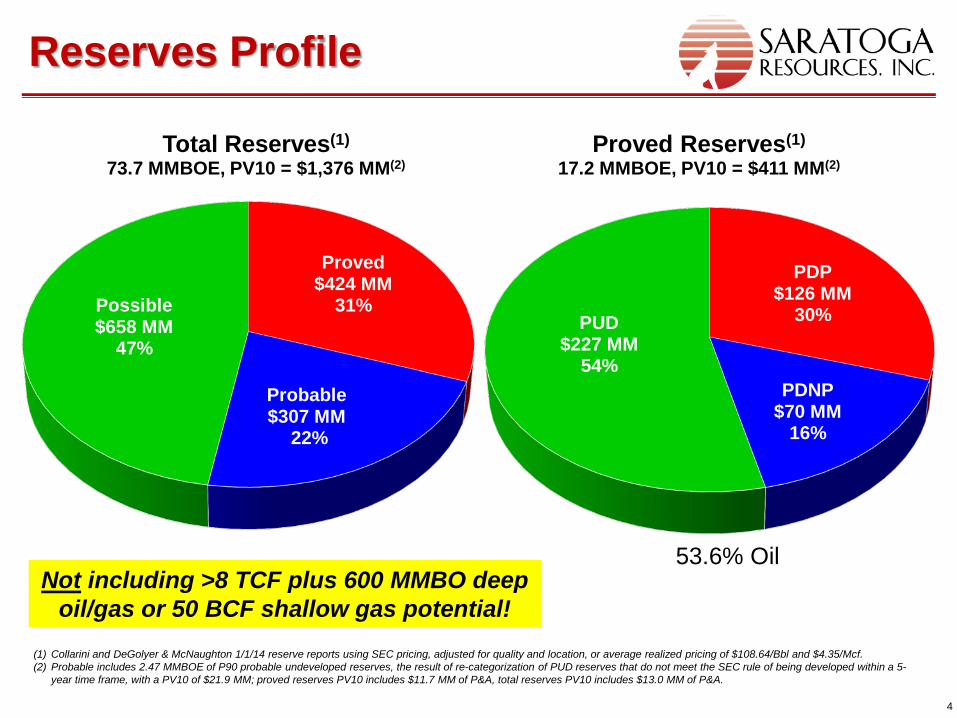
(1) Collarini and DeGolyer & McNaughton 1/1/14 reserve reports using SEC pricing, adjusted for quality and location, or average realized pricing of $108.64/Bbl and $4.35/Mcf. (2) Probable includes 2.47 MMBOE of P90 probable undeveloped reserves, the result of re-categorization of PUD reserves that do not meet the SEC rule of being developed within a 5-
year time frame, with a PV10 of $21.9 MM; proved reserves PV10 includes $11.7 MM of P&A, total reserves PV10 includes $13.0 MM of P&A.
Reserves Profile
Not including >8 TCF plus 600 MMBO deep oil/gas or 50 BCF shallow gas potential!
53.6% Oil
PDP $126 MM
30%
PDNP $70 MM
16%
PUD $227 MM
54%
Proved Reserves(1)
17.2 MMBOE, PV10 = $411 MM(2)
Proved $424 MM
31%
Probable
$307 MM 22%
Possible $658 MM
47%
Total Reserves(1)
73.7 MMBOE, PV10 = $1,376 MM(2)
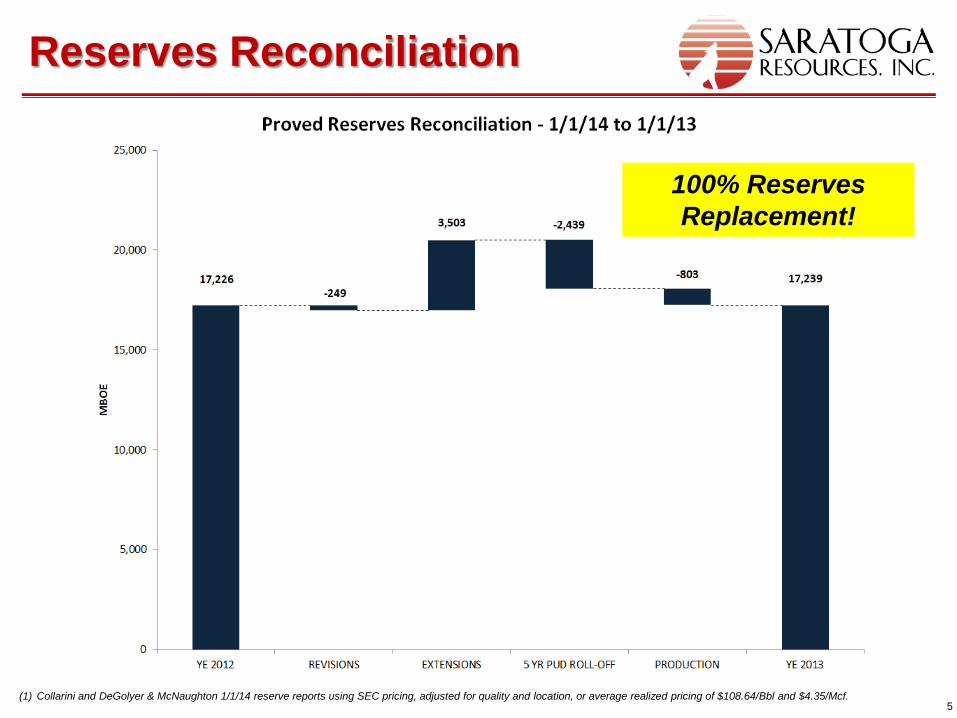
5 (1) Collarini and DeGolyer & McNaughton 1/1/14 reserve reports using SEC pricing, adjusted for quality and location, or average realized pricing of $108.64/Bbl and $4.35/Mcf.
Reserves Reconciliation
100% Reserves Replacement!
6
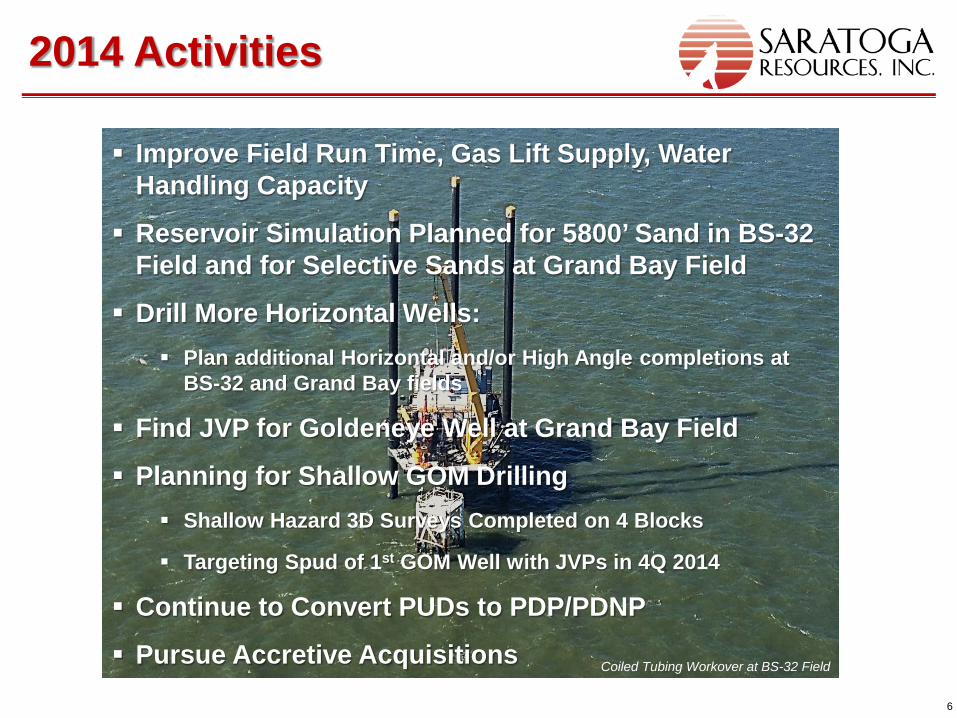
Improve Field Run Time, Gas Lift Supply, Water Handling Capacity
Reservoir Simulation Planned for 5800’ Sand in BS-32 Field and for Selective Sands at Grand Bay Field
Drill More Horizontal Wells: Plan additional Horizontal and/or High Angle completions at
BS-32 and Grand Bay fields
Find JVP for Goldeneye Well at Grand Bay Field
Planning for Shallow GOM Drilling Shallow Hazard 3D Surveys Completed on 4 Blocks
Targeting Spud of 1st GOM Well with JVPs in 4Q 2014
Continue to Convert PUDs to PDP/PDNP
Pursue Accretive Acquisitions
2014 Activities
Coiled Tubing Workover at BS-32 Field
7
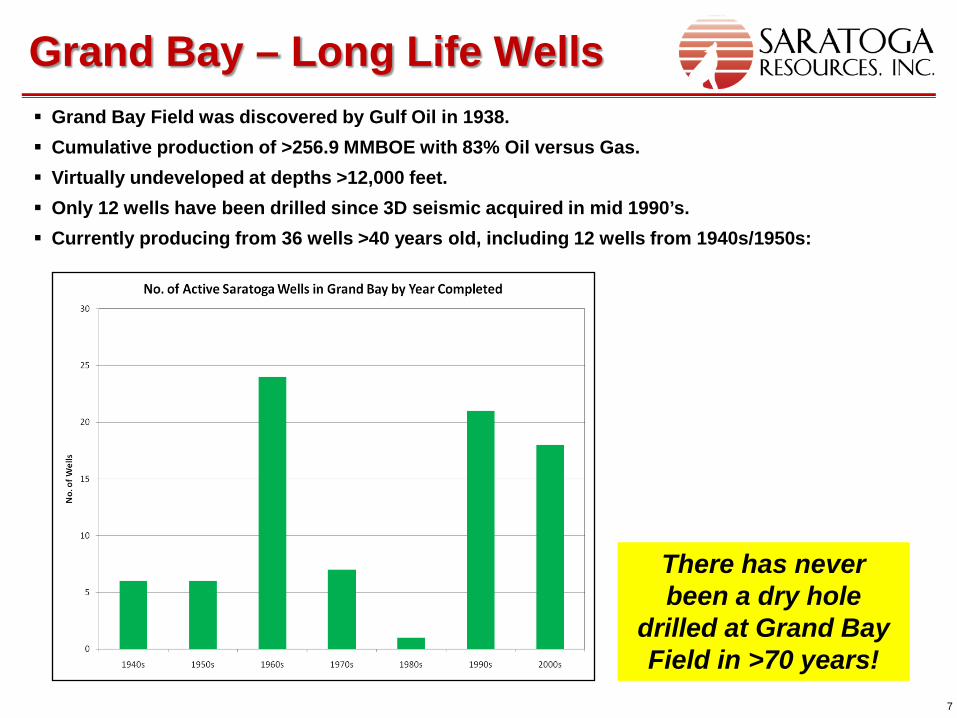
Grand Bay – Long Life Wells Grand Bay Field was discovered by Gulf Oil in 1938. Cumulative production of >256.9 MMBOE with 83% Oil versus Gas. Virtually undeveloped at depths >12,000 feet. Only 12 wells have been drilled since 3D seismic acquired in mid 1990’s. Currently producing from 36 wells >40 years old, including 12 wells from 1940s/1950s:
There has never been a dry hole
drilled at Grand Bay Field in >70 years!
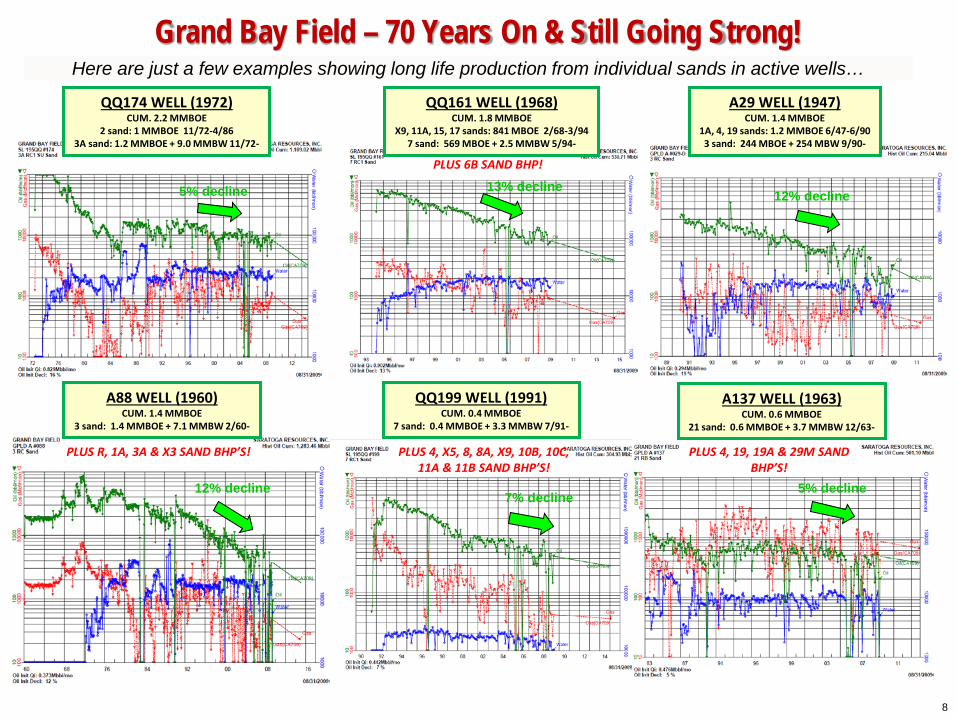
QQ174 WELL (1972) CUM. 2.2 MMBOE
2 sand: 1 MMBOE 11/72-4/86 3A sand: 1.2 MMBOE + 9.0 MMBW 11/72-
QQ161 WELL (1968) CUM. 1.8 MMBOE
X9, 11A, 15, 17 sands: 841 MBOE 2/68-3/94 7 sand: 569 MBOE + 2.5 MMBW 5/94-
PLUS 6B SAND BHP!
A29 WELL (1947) CUM. 1.4 MMBOE
1A, 4, 19 sands: 1.2 MMBOE 6/47-6/90 3 sand: 244 MBOE + 254 MBW 9/90-
A88 WELL (1960) CUM. 1.4 MMBOE
3 sand: 1.4 MMBOE + 7.1 MMBW 2/60-
PLUS R, 1A, 3A & X3 SAND BHP’S!
QQ199 WELL (1991) CUM. 0.4 MMBOE
7 sand: 0.4 MMBOE + 3.3 MMBW 7/91-
PLUS 4, X5, 8, 8A, X9, 10B, 10C, 11A & 11B SAND BHP’S!
A137 WELL (1963) CUM. 0.6 MMBOE
21 sand: 0.6 MMBOE + 3.7 MMBW 12/63-
PLUS 4, 19, 19A & 29M SAND BHP’S!
Grand Bay Field – 70 Years On & Still Going Strong! Here are just a few examples showing long life production from individual sands in active wells…
8
5% decline 7% decline
12% decline
5% decline 13% decline 12% decline
9
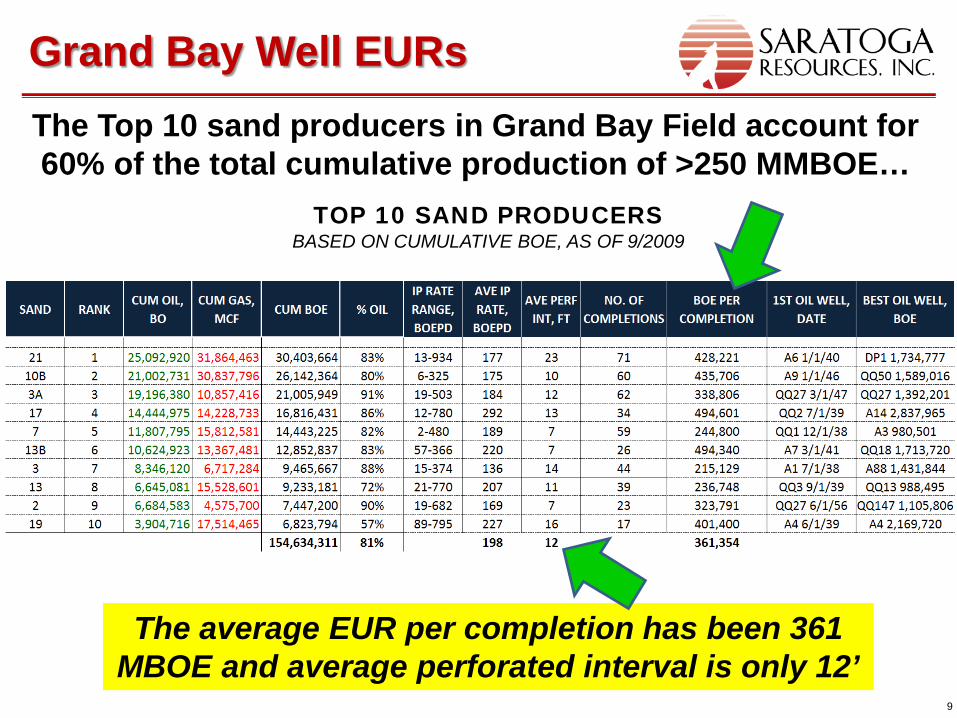
Grand Bay Well EURs
TOP 10 SAND PRODUCERS BASED ON CUMULATIVE BOE, AS OF 9/2009
The Top 10 sand producers in Grand Bay Field account for 60% of the total cumulative production of >250 MMBOE…
The average EUR per completion has been 361 MBOE and average perforated interval is only 12’
10
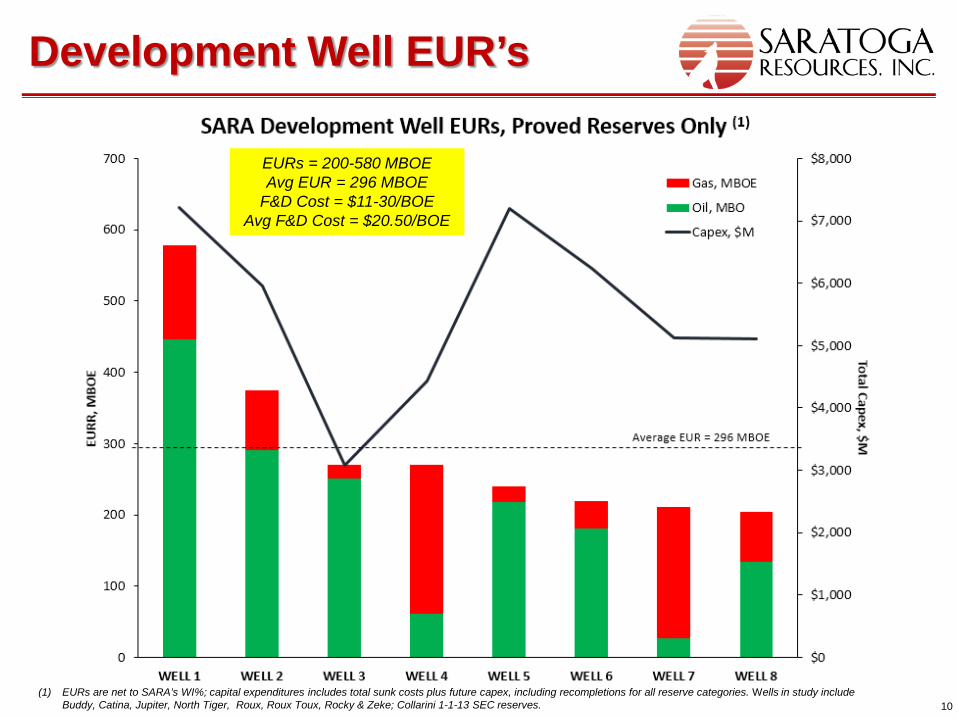
Development Well EUR’s
EURs = 200-580 MBOE Avg EUR = 296 MBOE
F&D Cost = $11-30/BOE Avg F&D Cost = $20.50/BOE
(1) EURs are net to SARA’s WI%; capital expenditures includes total sunk costs plus future capex, including recompletions for all reserve categories. Wells in study include Buddy, Catina, Jupiter, North Tiger, Roux, Roux Toux, Rocky & Zeke; Collarini 1-1-13 SEC reserves.
11
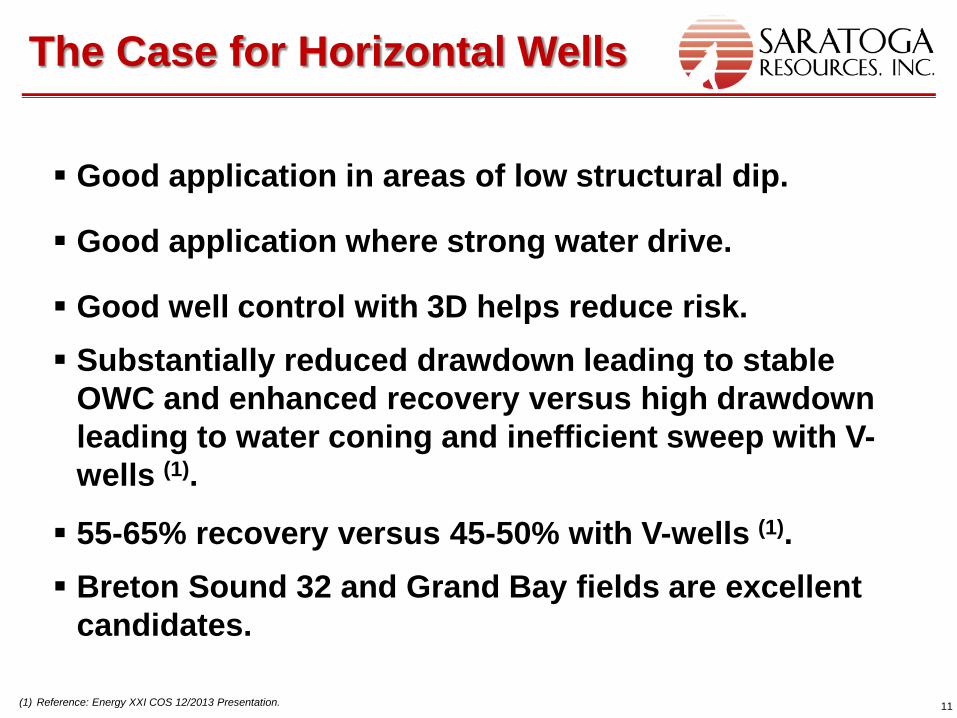
Good application in areas of low structural dip.
Good application where strong water drive.
Good well control with 3D helps reduce risk. Substantially reduced drawdown leading to stable
OWC and enhanced recovery versus high drawdown leading to water coning and inefficient sweep with V-wells (1).
55-65% recovery versus 45-50% with V-wells (1). Breton Sound 32 and Grand Bay fields are excellent
candidates.
The Case for Horizontal Wells
(1) Reference: Energy XXI COS 12/2013 Presentation.
12
Saratoga’s “Coning” Model
13
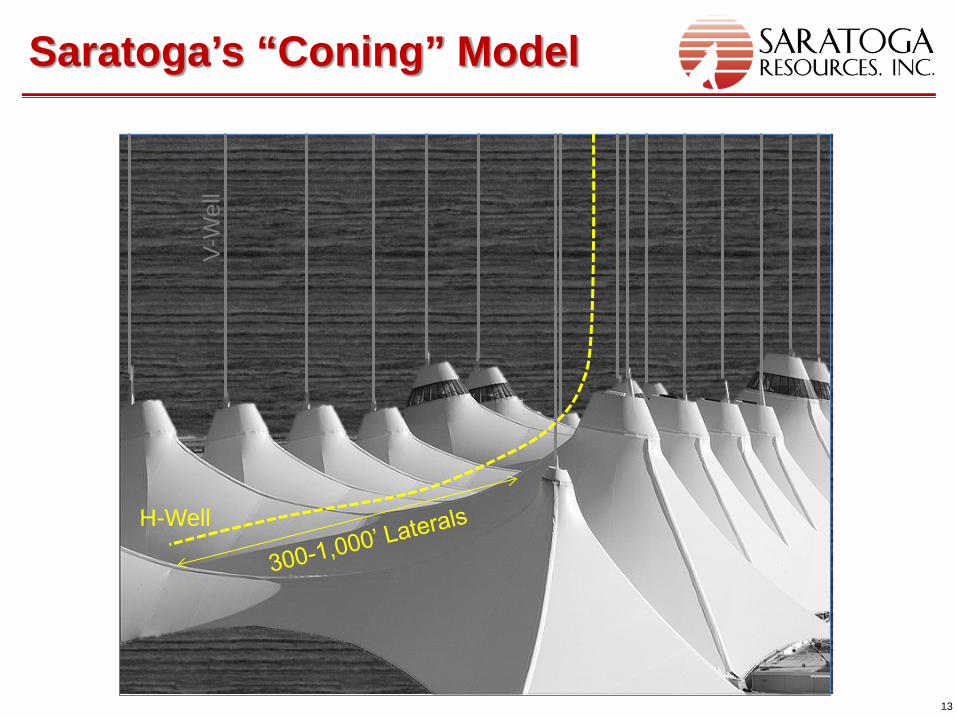
Saratoga’s “Coning” Model
H-Well
V-W
ell
14
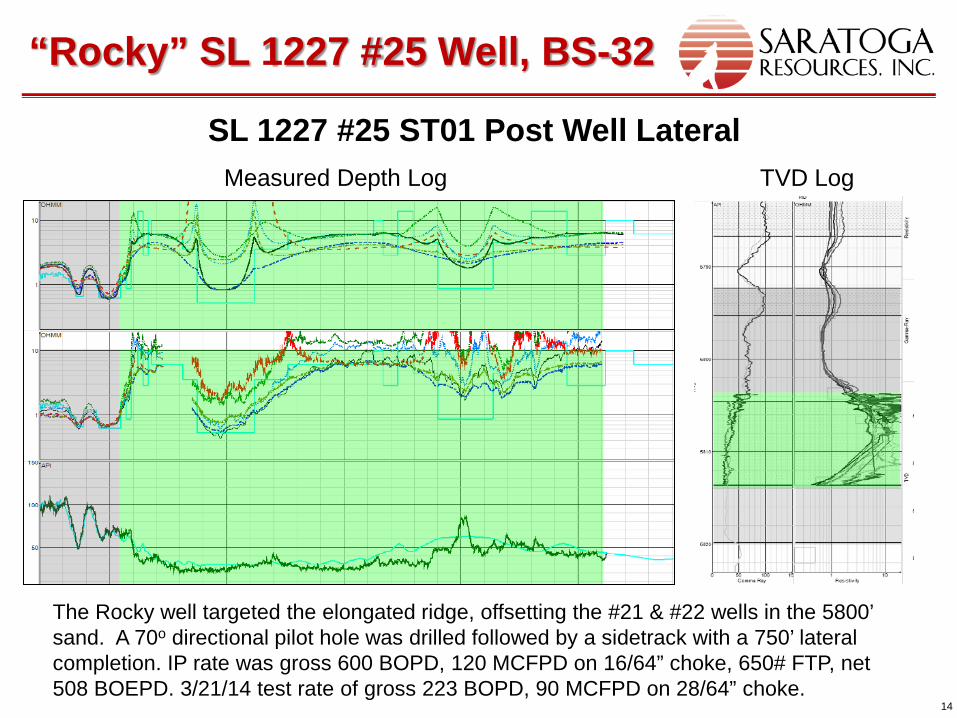
“Rocky” SL 1227 #25 Well, BS-32
SL 1227 #25 ST01 Post Well Lateral Measured Depth Log TVD Log
The Rocky well targeted the elongated ridge, offsetting the #21 & #22 wells in the 5800’ sand. A 70o directional pilot hole was drilled followed by a sidetrack with a 750’ lateral completion. IP rate was gross 600 BOPD, 120 MCFPD on 16/64” choke, 650# FTP, net 508 BOEPD. 3/21/14 test rate of gross 223 BOPD, 90 MCFPD on 28/64” choke.
15
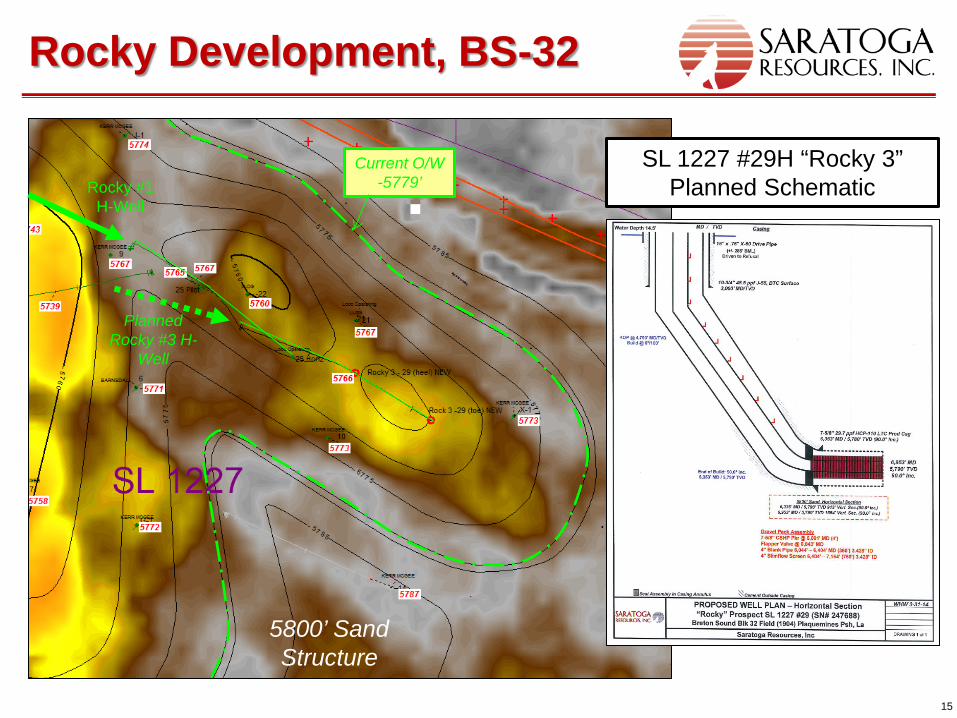
Rocky Development, BS-32
5800’ Sand Structure
Rocky #1 H-Well
Current O/W -5779’
Planned Rocky #3 H-
Well
SL 1227 #29H “Rocky 3” Planned Schematic
16
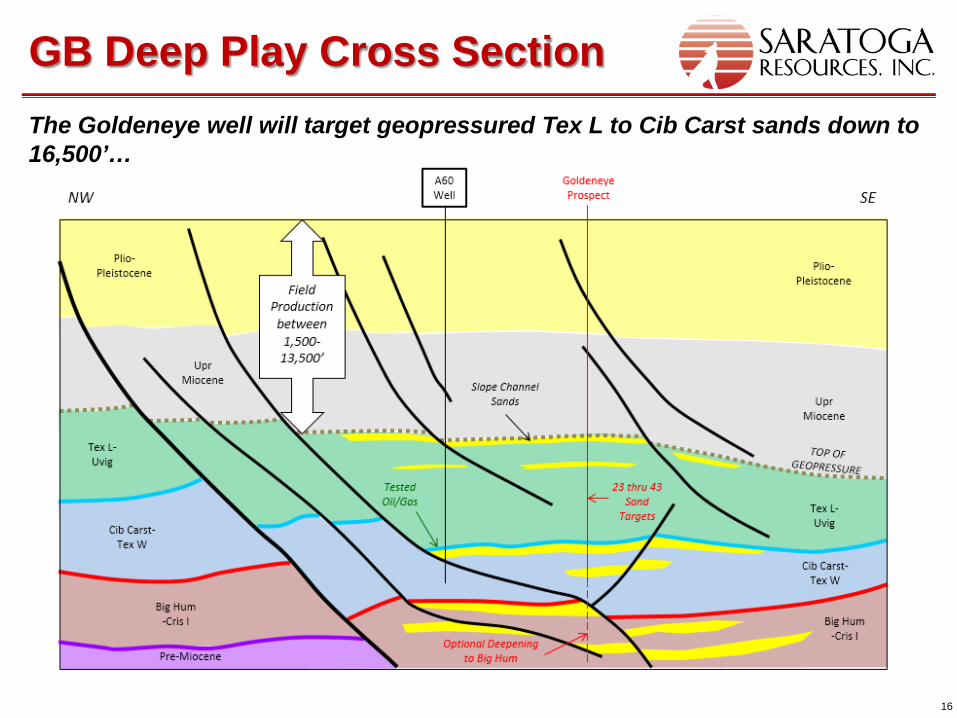
GB Deep Play Cross Section
The Goldeneye well will target geopressured Tex L to Cib Carst sands down to 16,500’…
17
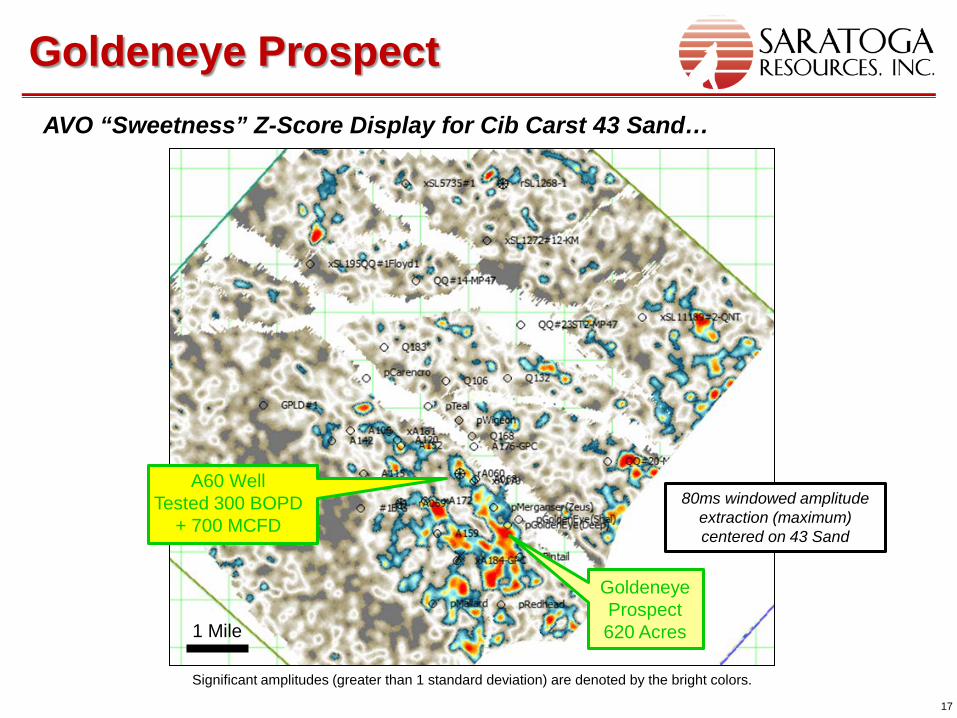
Goldeneye Prospect
80ms windowed amplitude extraction (maximum) centered on 43 Sand
AVO “Sweetness” Z-Score Display for Cib Carst 43 Sand…
Significant amplitudes (greater than 1 standard deviation) are denoted by the bright colors.
Goldeneye Prospect 620 Acres 1 Mile
A60 Well Tested 300 BOPD
+ 700 MCFD
18
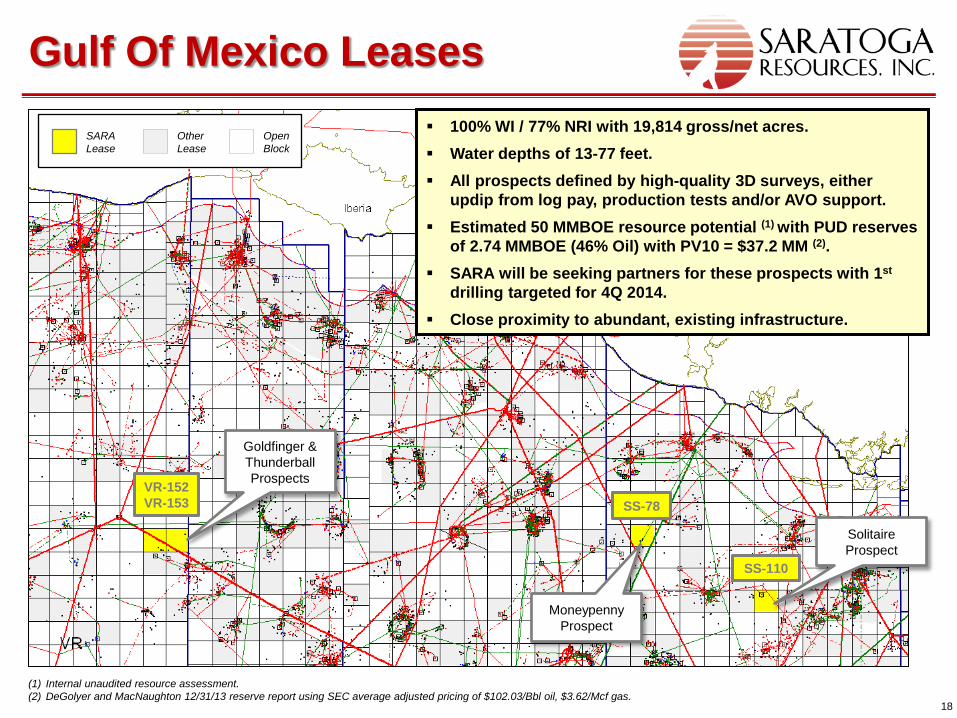
Gulf Of Mexico Leases SARA Lease
Other Lease
Open Block
Goldfinger & Thunderball Prospects
Solitaire Prospect
Moneypenny Prospect
VR-152 VR-153 SS-78
SS-110
Louisiana 100% WI / 77% NRI with 19,814 gross/net acres. Water depths of 13-77 feet. All prospects defined by high-quality 3D surveys, either
updip from log pay, production tests and/or AVO support. Estimated 50 MMBOE resource potential (1) with PUD reserves
of 2.74 MMBOE (46% Oil) with PV10 = $37.2 MM (2).
SARA will be seeking partners for these prospects with 1st drilling targeted for 4Q 2014.
Close proximity to abundant, existing infrastructure.
(1) Internal unaudited resource assessment. (2) DeGolyer and MacNaughton 12/31/13 reserve report using SEC average adjusted pricing of $102.03/Bbl oil, $3.62/Mcf gas.
19
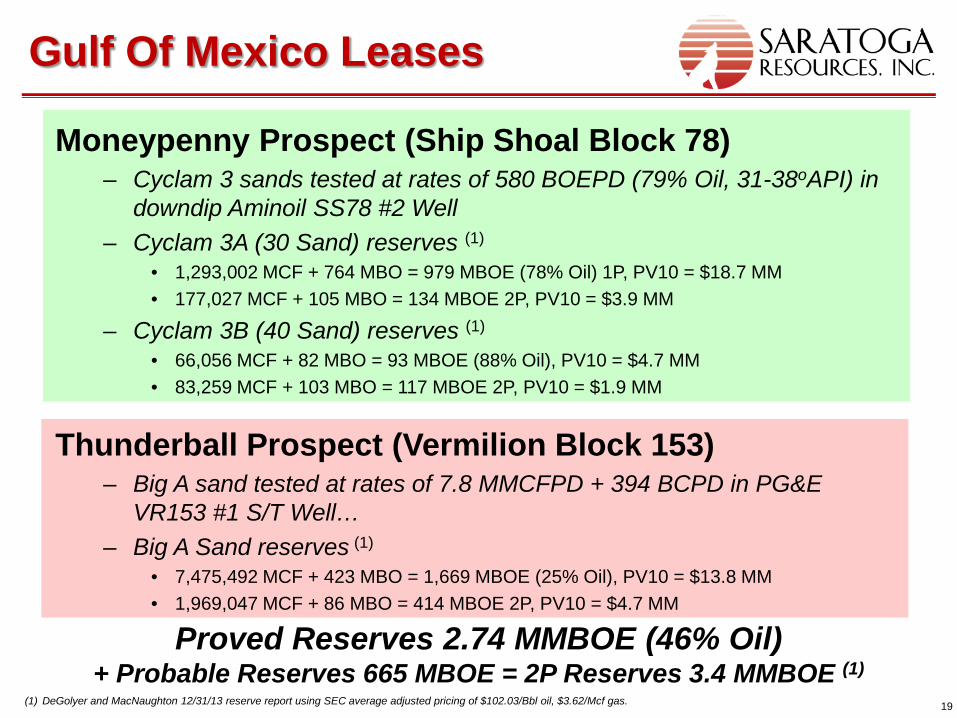
Gulf Of Mexico Leases
(1) DeGolyer and MacNaughton 12/31/13 reserve report using SEC average adjusted pricing of $102.03/Bbl oil, $3.62/Mcf gas.
Moneypenny Prospect (Ship Shoal Block 78) – Cyclam 3 sands tested at rates of 580 BOEPD (79% Oil, 31-38oAPI) in
downdip Aminoil SS78 #2 Well – Cyclam 3A (30 Sand) reserves (1)
• 1,293,002 MCF + 764 MBO = 979 MBOE (78% Oil) 1P, PV10 = $18.7 MM • 177,027 MCF + 105 MBO = 134 MBOE 2P, PV10 = $3.9 MM
– Cyclam 3B (40 Sand) reserves (1)
• 66,056 MCF + 82 MBO = 93 MBOE (88% Oil), PV10 = $4.7 MM • 83,259 MCF + 103 MBO = 117 MBOE 2P, PV10 = $1.9 MM
Thunderball Prospect (Vermilion Block 153) – Big A sand tested at rates of 7.8 MMCFPD + 394 BCPD in PG&E
VR153 #1 S/T Well… – Big A Sand reserves (1)
• 7,475,492 MCF + 423 MBO = 1,669 MBOE (25% Oil), PV10 = $13.8 MM • 1,969,047 MCF + 86 MBO = 414 MBOE 2P, PV10 = $4.7 MM
Proved Reserves 2.74 MMBOE (46% Oil) + Probable Reserves 665 MBOE = 2P Reserves 3.4 MMBOE (1)
20
A120 Updip PUD A191 Twin PUD A192 PUD DP10 Twin PUD Mallard QQ63 Updip QQ151 Updip QQ166 Offset PUD QQ196 Offset PUD QQ204 Offset PUD QQ207 Offset PUD QQ215 PUD QQ216 PUD Bad Boy
BLT Café O Lay Cheez Whiz Chipolata Et-Too-Fay Krispy Kreme Lucky Dog
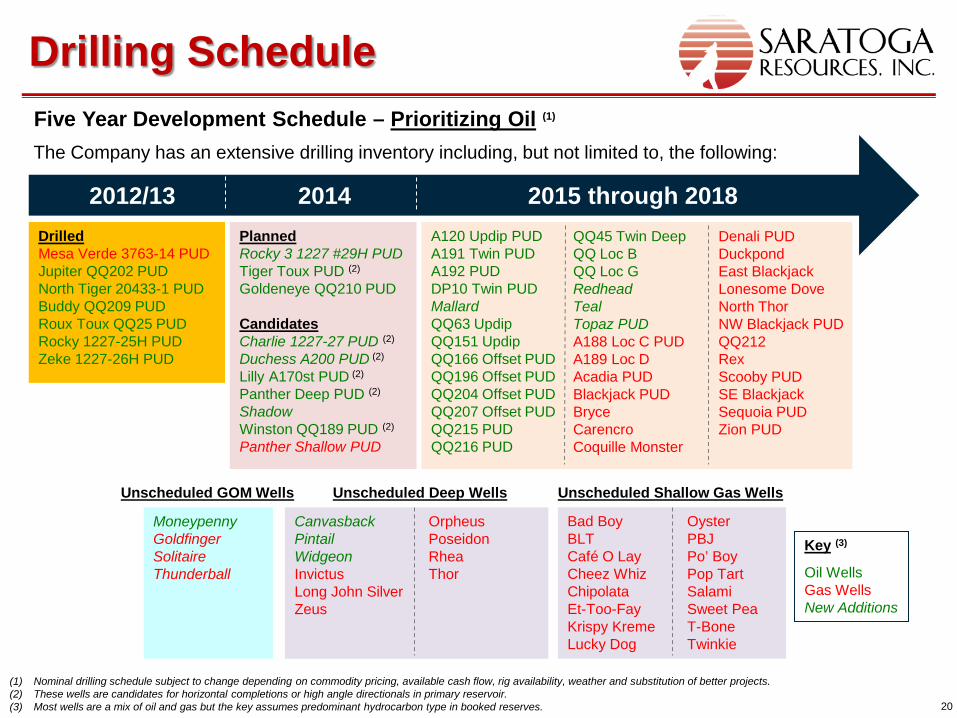
Five Year Development Schedule – Prioritizing Oil (1)
The Company has an extensive drilling inventory including, but not limited to, the following:
Drilling Schedule
2012/13 2014 2015 through 2018 Drilled Mesa Verde 3763-14 PUD Jupiter QQ202 PUD North Tiger 20433-1 PUD Buddy QQ209 PUD Roux Toux QQ25 PUD Rocky 1227-25H PUD Zeke 1227-26H PUD
Oyster PBJ Po’ Boy Pop Tart Salami Sweet Pea T-Bone Twinkie
Denali PUD Duckpond East Blackjack Lonesome Dove North Thor NW Blackjack PUD QQ212 Rex Scooby PUD SE Blackjack Sequoia PUD Zion PUD
Unscheduled Shallow Gas Wells Unscheduled Deep Wells
(1) Nominal drilling schedule subject to change depending on commodity pricing, available cash flow, rig availability, weather and substitution of better projects. (2) These wells are candidates for horizontal completions or high angle directionals in primary reservoir. (3) Most wells are a mix of oil and gas but the key assumes predominant hydrocarbon type in booked reserves.
QQ45 Twin Deep QQ Loc B QQ Loc G Redhead Teal Topaz PUD A188 Loc C PUD A189 Loc D Acadia PUD Blackjack PUD Bryce Carencro Coquille Monster
Key (3)
Oil Wells Gas Wells New Additions
Planned Rocky 3 1227 #29H PUD Tiger Toux PUD (2)
Goldeneye QQ210 PUD Candidates Charlie 1227-27 PUD (2) Duchess A200 PUD (2) Lilly A170st PUD (2) Panther Deep PUD (2)
Shadow Winston QQ189 PUD (2)
Panther Shallow PUD
Canvasback Pintail Widgeon Invictus Long John Silver Zeus
Orpheus Poseidon Rhea Thor
Moneypenny Goldfinger Solitaire Thunderball
Unscheduled GOM Wells
Financial Overview
22
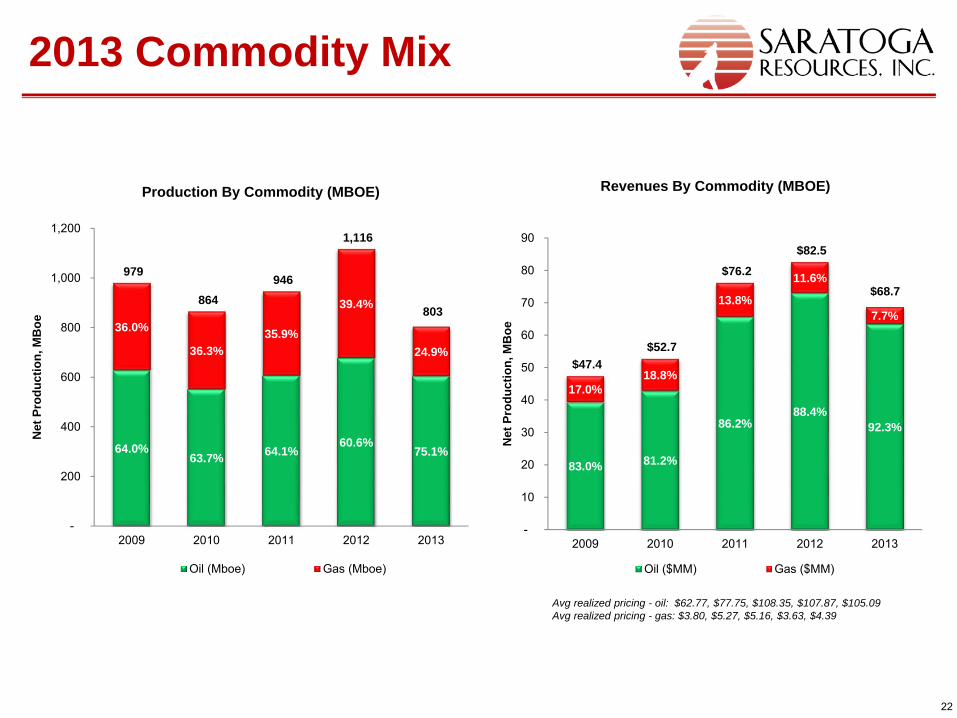
2013 Commodity Mix
64.0%63.7% 64.1%
60.6%75.1%
36.0%
36.3%35.9%
39.4%
24.9%
979
864 946
1,116
803
-
200
400
600
800
1,000
1,200
2009 2010 2011 2012 2013
Net
Pro
duct
ion,
MB
oe
Production By Commodity (MBOE)
Oil (Mboe) Gas (Mboe)
83.0% 81.2%
86.2%88.4%
92.3%
17.0%18.8%
13.8%
11.6%
7.7%
$47.4 $52.7
$76.2 $82.5
$68.7
-
10
20
30
40
50
60
70
80
90
2009 2010 2011 2012 2013
Net
Pro
duct
ion,
MB
oe
Revenues By Commodity (MBOE)
Oil ($MM) Gas ($MM)
Avg realized pricing - oil: $62.77, $77.75, $108.35, $107.87, $105.09Avg realized pricing - gas: $3.80, $5.27, $5.16, $3.63, $4.39
23
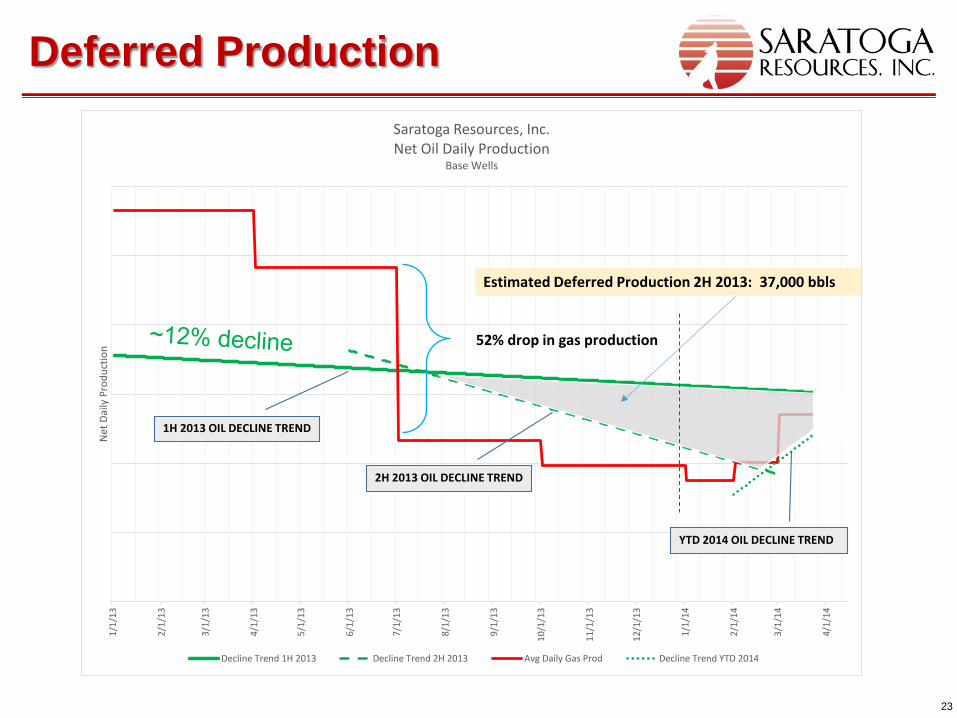
Deferred Production
1/1/
13
2/1/
13
3/1/
13
4/1/
13
5/1/
13
6/1/
13
7/1/
13
8/1/
13
9/1/
13
10/1
/13
11/1
/13
12/1
/13
1/1/
14
2/1/
14
3/1/
14
4/1/
14
Net
Dai
ly P
rodu
ctio
n
Saratoga Resources, Inc.Net Oil Daily Production
Base Wells
Decline Trend 1H 2013 Decline Trend 2H 2013 Avg Daily Gas Prod Decline Trend YTD 2014
Estimated Deferred Production 2H 2013: 37,000 bbls
1H 2013 OIL DECLINE TREND
2H 2013 OIL DECLINE TREND
52% drop in gas production
YTD 2014 OIL DECLINE TREND
24
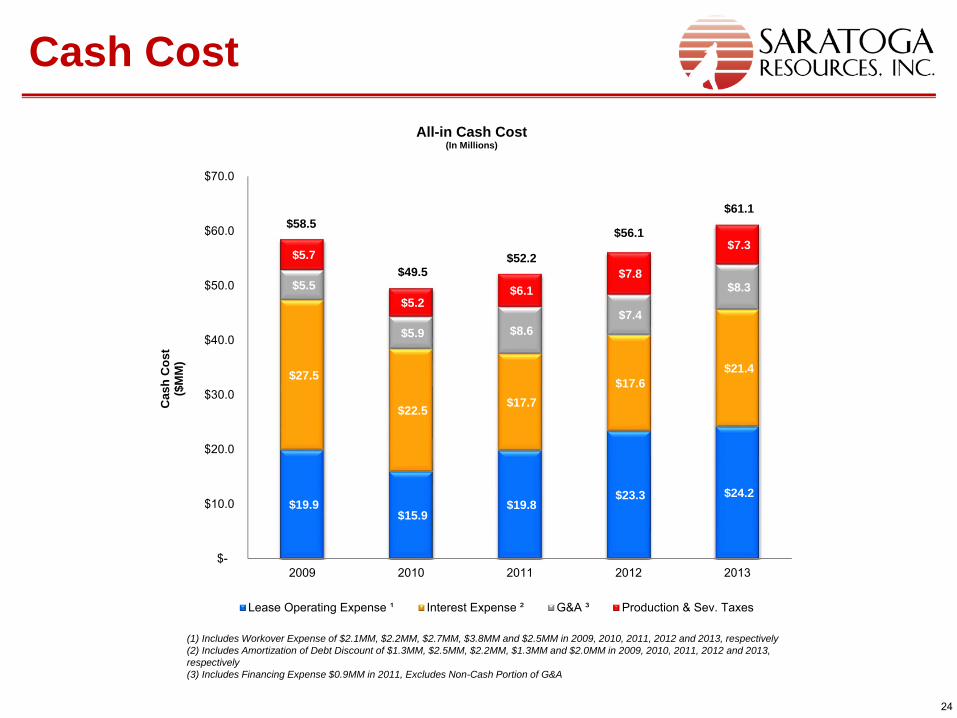
Cash Cost
$19.9 $15.9
$19.8 $23.3 $24.2
$27.5
$22.5 $17.7 $17.6
$21.4
$5.5
$5.9 $8.6 $7.4
$8.3
$5.7
$5.2 $6.1
$7.8
$7.3
$58.5
$49.5 $52.2
$56.1
$61.1
$-
$10.0
$20.0
$30.0
$40.0
$50.0
$60.0
$70.0
2009 2010 2011 2012 2013
Cas
h C
ost
($M
M)
All-in Cash Cost(In Millions)
Lease Operating Expense ¹ Interest Expense ² G&A ³ Production & Sev. Taxes
(1) Includes Workover Expense of $2.1MM, $2.2MM, $2.7MM, $3.8MM and $2.5MM in 2009, 2010, 2011, 2012 and 2013, respectively (2) Includes Amortization of Debt Discount of $1.3MM, $2.5MM, $2.2MM, $1.3MM and $2.0MM in 2009, 2010, 2011, 2012 and 2013, respectively (3) Includes Financing Expense $0.9MM in 2011, Excludes Non-Cash Portion of G&A
25
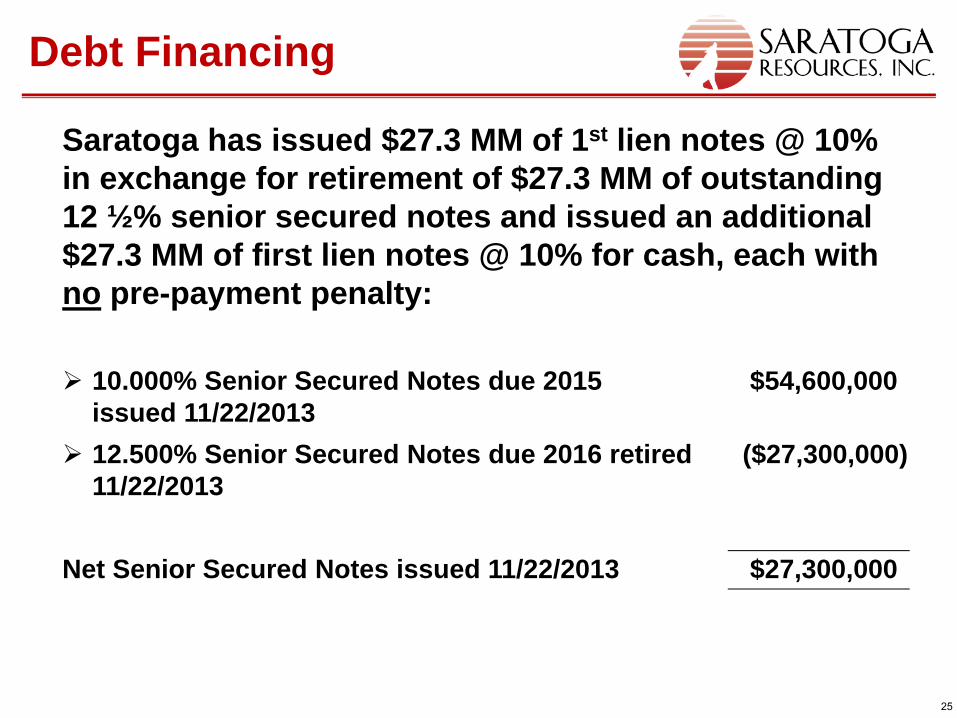
Debt Financing
10.000% Senior Secured Notes due 2015 issued 11/22/2013
$54,600,000
12.500% Senior Secured Notes due 2016 retired 11/22/2013
($27,300,000)
Net Senior Secured Notes issued 11/22/2013 $27,300,000
Saratoga has issued $27.3 MM of 1st lien notes @ 10% in exchange for retirement of $27.3 MM of outstanding 12 ½% senior secured notes and issued an additional $27.3 MM of first lien notes @ 10% for cash, each with no pre-payment penalty:
26
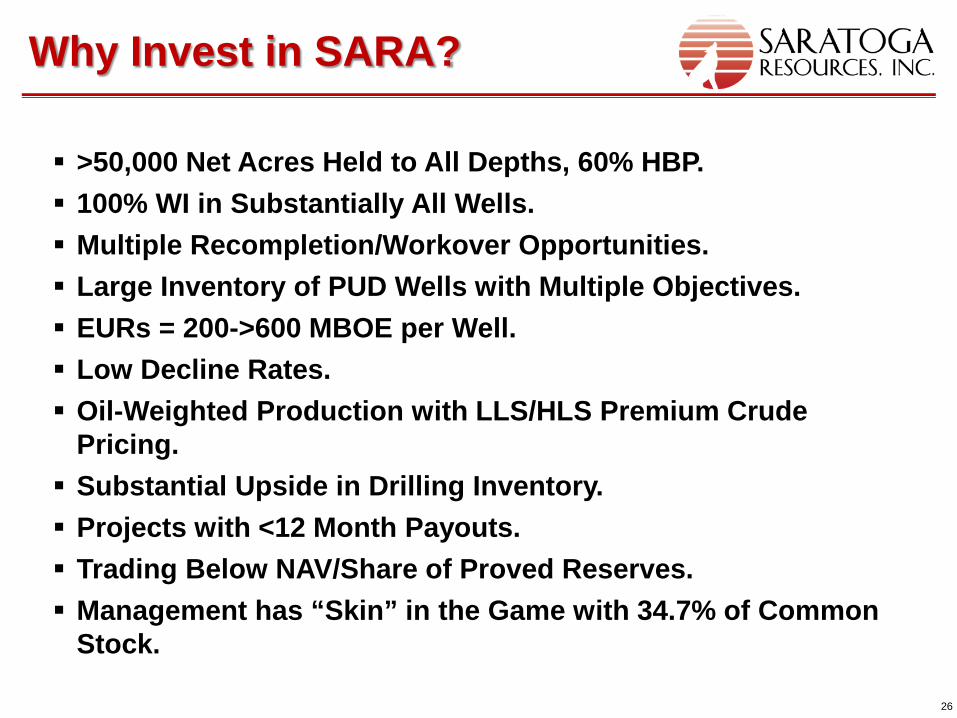
>50,000 Net Acres Held to All Depths, 60% HBP. 100% WI in Substantially All Wells. Multiple Recompletion/Workover Opportunities. Large Inventory of PUD Wells with Multiple Objectives. EURs = 200->600 MBOE per Well. Low Decline Rates. Oil-Weighted Production with LLS/HLS Premium Crude
Pricing. Substantial Upside in Drilling Inventory. Projects with <12 Month Payouts. Trading Below NAV/Share of Proved Reserves. Management has “Skin” in the Game with 34.7% of Common
Stock.
Why Invest in SARA?
Website: www.saratogaresources.com 27
Thank You for your Attention!
Recommended