Investor Update September 2015

This presentation contains certain forward-looking statements within the meaning of Section 27A of the Securities Act of 1933, as amended, and
Section 21E of the Securities Exchange Act of 1934, as amended, which are intended to be covered by the safe harbors created thereby. Words
and phrases such as “is anticipated,” “is estimated,” “is expected,” “is planned,” “is scheduled,” “is targeted,” “believes,” “intends,” “objectives,”
“projects,” “strategies” and similar expressions are used to identify such forward-looking statements. However, the absence of these words does not
mean that a statement is not forward-looking. Forward-looking statements relating to Phillips 66’s operations (including joint venture operations) are
based on management’s expectations, estimates and projections about the company, its interests and the energy industry in general on the date
this presentation was prepared. These statements are not guarantees of future performance and involve certain risks, uncertainties and
assumptions that are difficult to predict. Therefore, actual outcomes and results may differ materially from what is expressed or forecast in such
forward-looking statements. Factors that could cause actual results or events to differ materially from those described in the forward-looking
statements include fluctuations in NGL, crude oil and natural gas prices, and petrochemical and refining margins; unexpected changes in costs for
constructing, modifying or operating our facilities; unexpected difficulties in manufacturing, refining or transporting our products; lack of, or
disruptions in, adequate and reliable transportation for our NGL, crude oil, natural gas and refined products; potential liability from litigation or for
remedial actions, including removal and reclamation obligations, under environmental regulations; limited access to capital or significantly higher
cost of capital related to illiquidity or uncertainty in the domestic or international financial markets; and other economic, business, competitive and/or
regulatory factors affecting Phillips 66’s businesses generally as set forth in our filings with the Securities and Exchange Commission. Phillips 66 is
under no obligation (and expressly disclaims any such obligation) to update or alter its forward-looking statements, whether as a result of new
information, future events or otherwise.
This presentation includes non-GAAP financial measures. You can find the reconciliations to comparable GAAP financial measures at the end of
the presentation materials or in the “Investors” section of our website.
CAUTIONARY STATEMENT Cautionary Statement
1

Strategy
2
Operating
Excellence
Growth
Returns
Distributions
High-Performing
Organization
Committed to safety, reliability and environmental stewardship while
protecting shareholder value
Reshaping our portfolio by capturing growth opportunities in Midstream
and Chemicals
Enhancing returns by maximizing earnings from existing assets and
investing capital efficiently
Committed to dividend growth, share repurchases and financial strength
Building capability, pursuing excellence and doing the right thing

Operating Excellence
3
Industry Average
Total Recordable Rates (Incidents per 200,000 Hours Worked)
’12 ’13 ’14
1H
’15
Refining Environmental Metrics
Refining Capacity Utilization (%)
Operating Costs and SG&A ($B)
Phillips 66 CPChem DCP
See appendix for footnotes.
5.7 5.7 5.8 2.7
0.3
0.2
2012 2013 2014 1H 2015
Growth
430 317 300
154
2012 2013 2014 1H 2015
93% 93% 94% 87%
3% 3% 4% 9%
2012 2013 2014 1H 2015
Planned Maintenance & Turnarounds

Global Energy Landscape
4
85
87
89
91
93
95
97
2010 2011 2012 2013 2014 2015E
Global Oil Supply Global Oil DemandSource: International Energy Agency
Global Oil Supply and Demand (MMBD)
Abundant supply
Demand exceeding expectations
Energy efficiency increasing

U.S. Energy Landscape
5
0
3
6
9
12
15
2010 2012 2014 2016 2018
Crude & Condensate NGLSource: EIA Annual Energy Outlook 2015
U.S. Liquids Production (MMBD)
Production remains resilient
Pace of infrastructure investment
contingent on production growth
Stronger fuels demand
U.S. Downstream Advantage
6
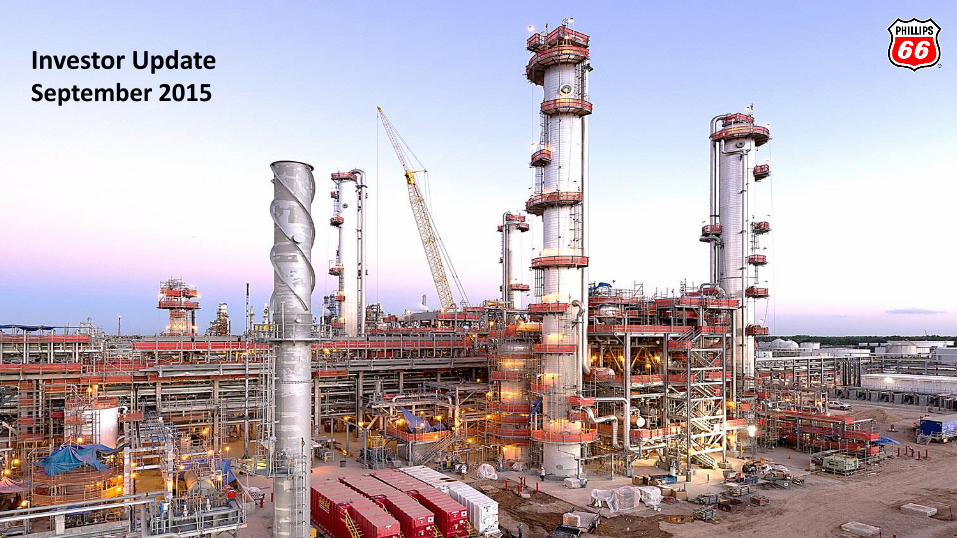
0
5
10
15
20
Ethane CrackerMargin, cpp
Natural Gas,$/MMBtu
Brent - WTI,$/bbl
Current
Historical
U.S. Advantage
Refiners and chemical
manufacturers remain advantaged
Low feedstock costs
Low energy costs
Scale and complexity
MLP structure supports midstream
investment
See appendix for footnotes.
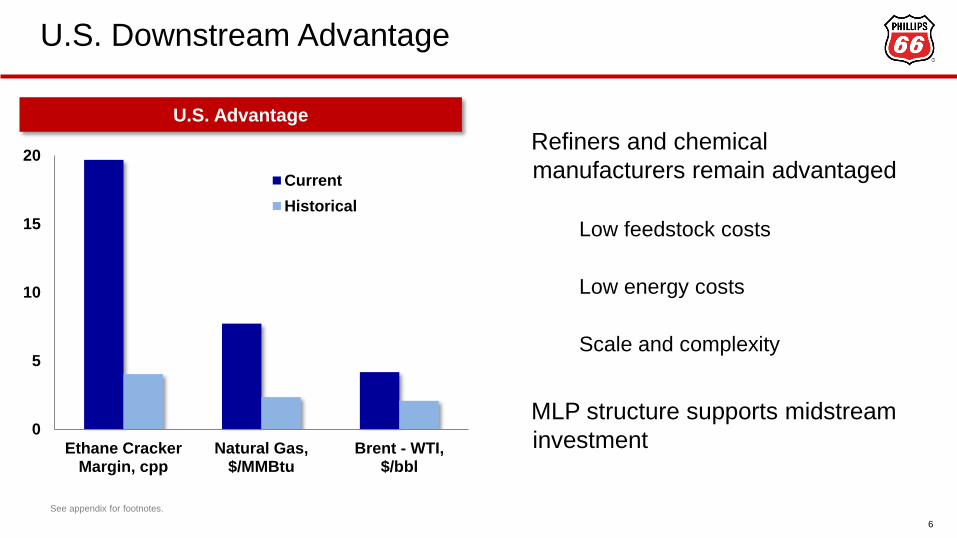
Value of Integration
7
EV/EBITDA Multiples
Creating value across downstream
Accelerating growth
Leveraging existing portfolio
Allocating capital efficiently
Expanding multiple
See appendix for footnotes.
5.4x 6.7x 7.1x 14.5x
RefiningPeers
PSX ChemicalsPeers
MidstreamPeers

Midcontinent Integrated Growth
8
Midstream
$280 MM EBITDA growth
Palermo rail terminal/Sacagawea pipeline (PSXP)
Dakota Access/ETCO crude pipelines
Refining, Marketing & Specialties
$430 MM EBITDA growth
Ponca City
Yield improvement project
Tight oil processing flexibility
100% lease crude purchases
Wood River
Dilbit capacity increase
ULSD expansion
FCC modernization
Billings
Vacuum tower project
Marketing & Specialties
Grow branded fuels volumes
Enhance Phillips 66 brand
Marketing JVs and Alliances See appendix for footnotes.

Western Gulf Creating a World-Class Energy Complex
9
Midstream
$750 MM EBITDA growth
Sweeny Fractionator One
Freeport LPG export terminal
Cross-channel connector (PSXP)
Eagle Ford crude pipeline
Sweeny Fractionator Two
Refining, Marketing & Specialties
$70 MM EBITDA growth
Sweeny
FCC yield improvement
Marketing & Specialties
Grow unbranded fuels volumes
Focus on high-quality branded assets
Increase high-margin exports
See appendix for footnotes.

Eastern Gulf Refining Logistics and Midstream Growth
10
Midstream
$200 MM EBITDA growth
Beaumont terminal expansion: +7 MMBbls
Bayou Bridge pipeline
Alliance clean products dock
Refining, Marketing & Specialties
$150 MM EBITDA growth
Lake Charles
FCC yield improvement
Increase feedstock advantage
Alliance
Increase light crude runs
Marketing & Specialties
Grow unbranded fuels volumes
Leverage brand value through licensing
Increase high-margin exports
Grow performance lubricants and export sales See appendix for footnotes.

West Coast Enhancing Returns
Midstream
$60 MM EBITDA growth
Completed Ferndale rail rack 4Q 2014 (PSXP)
Los Angeles waterborne crude tank
Santa Maria rail rack
Refining, Marketing & Specialties
$60 MM EBITDA growth
San Francisco
Hydrocracker debottleneck
Yield improvements
Los Angeles
FCC energy reduction
Marketing & Specialties
Grow branded and unbranded fuels volumes
Enhance 76 brand
Increase high-margin exports
Grow export lubricant sales
11
See appendix for footnotes.

Atlantic Basin Enhancing Returns
Midstream
$50 MM EBITDA growth
Completed Bayway rail rack 3Q 2014 (PSXP)
Bayway LPG loading facility
Refining, Marketing & Specialties
$200 MM EBITDA growth
Bayway
FCC reactor modernization
Yield improvements
Marketing & Specialties
Grow JET and COOP brands in Europe
Increase unbranded volumes in the U.K. and U.S.
Expand brand licensing in the U.S.
12 See appendix for footnotes.

Midstream
13
DCP EBITDA excluded.
See appendix for additional footnotes.
0.3
1.1 0.7
0.9
0.4
1.2
2.3
PSXP 2Q2015 Run-
Rate EBITDA
PSXOperating
Assets
ProjectsUnder
Construction
Planned 2018E
EBITDA
in
PSXP
EBITDA
Remaining
at PSX
2015 2016 2017 2018
Sweeny Midstream Hub
Phase 1
Sweeny Midstream Hub Expansion
Eagle Ford Crude Pipeline
Beaumont Terminal Expansion
Bayou Bridge Pipeline
Bakken Expansion (PSXP)
EBITDA ($B)
More than $20 B backlog of projects

PSXP Value to PSX
0
5
10
15
2013 2014 1H2015
2018E
Cumulative DropdownProceeds
CumulativeDistributions
Cumulative Cash from PSXP ($B)
0
5
10
15
2013 2014 2015E 2018E
PSX Equity Value of PSXP
Distributions ($B)
Fee-based assets
Growth opportunities
Organic
Drop downs
Selective acquisitions
Funds Midstream growth
See appendix for footnotes.
14

$550 MM 2015 growth capital
$500 MM EBITDA growth by 2018
Placing current projects into service in 2015 Keathley Canyon
National Helium Plant expansion
Zia II Plant and Gathering
Lucerne 2 Plant and Gathering
Sand Hills Laterals
DJ Basin Grand Parkway
Increasing fee-based earnings
DCP Midstream
15
See appendix for footnotes.
New plant
G&P plant
Proposed Pipeline

Chemicals
16
Self-funded capital program
$6.5 – 7 B growth spending
36% U.S. O&P capacity growth
0
100
200
300
400
500
600
700
800
900
0 15 30 45 60 75
M.E.
Ethane
N.A. Ethane
N.A. LPG
M.E. LPG/Naphtha
W. Europe
Naphtha
N.A. Naphtha
W.
Europe
LPG
Asia
Naphtha Asia LPG
Cumulative Capacity MM Tons
June 2015 YTD Average Ethylene Production Cost Curve
($/ton)
Petrochemical demand driven
by global GDP growth
Cost-advantaged feedstocks
High capacity utilization
supports strong margins
Rest of World
China Coal
CPChem
Asia Import
price
~$1,200/ton
Source: Wood MacKenzie
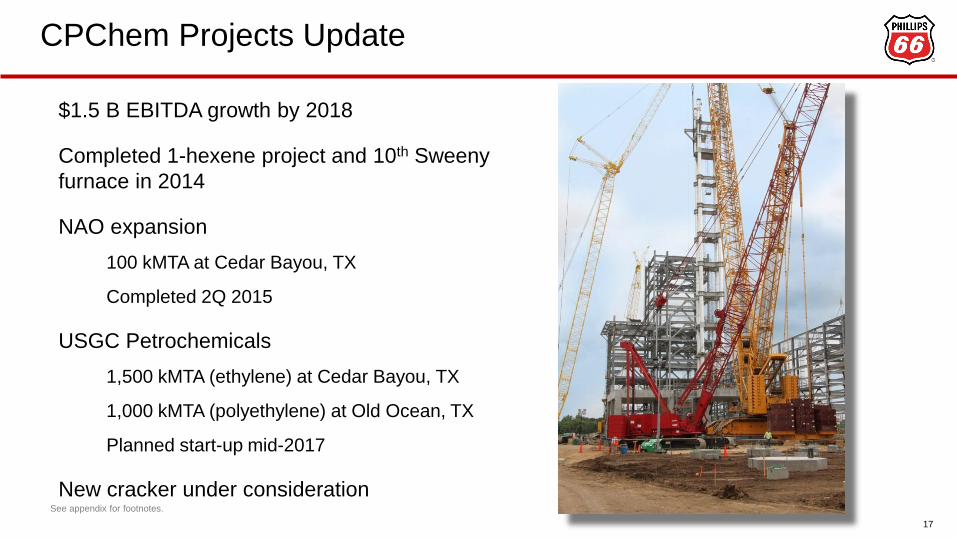
CPChem Projects Update
17
$1.5 B EBITDA growth by 2018
Completed 1-hexene project and 10th Sweeny
furnace in 2014
NAO expansion
100 kMTA at Cedar Bayou, TX
Completed 2Q 2015
USGC Petrochemicals
1,500 kMTA (ethylene) at Cedar Bayou, TX
1,000 kMTA (polyethylene) at Old Ocean, TX
Planned start-up mid-2017
New cracker under consideration
See appendix for footnotes.
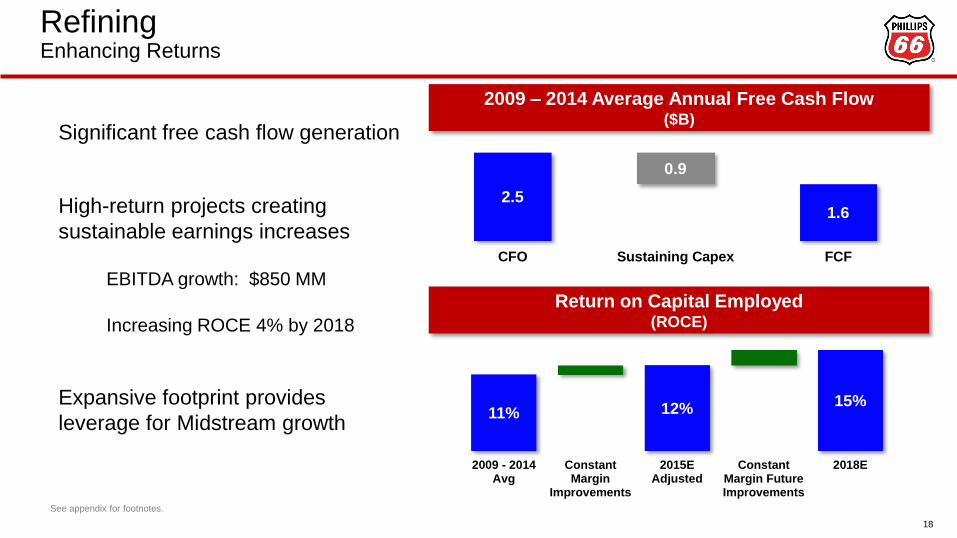
Refining Enhancing Returns
18
11% 12% 15%
2009 - 2014Avg
ConstantMargin
Improvements
2015EAdjusted
ConstantMargin FutureImprovements
2018E
Return on Capital Employed (ROCE)
Significant free cash flow generation
High-return projects creating
sustainable earnings increases
EBITDA growth: $850 MM
Increasing ROCE 4% by 2018
Expansive footprint provides
leverage for Midstream growth
2.5 1.6
0.9
CFO Sustaining Capex FCF
2009 – 2014 Average Annual Free Cash Flow ($B)
See appendix for footnotes.
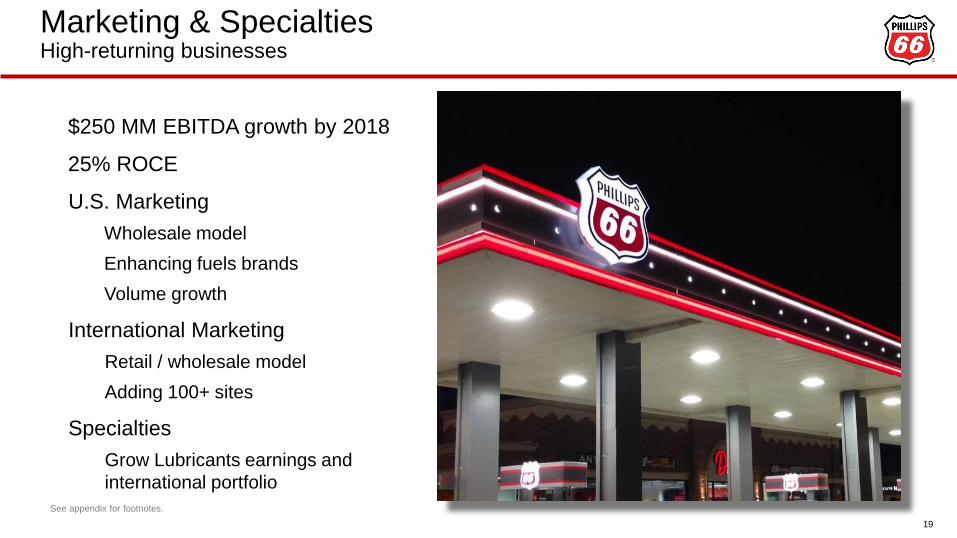
Marketing & Specialties High-returning businesses
19
$250 MM EBITDA growth by 2018
25% ROCE
U.S. Marketing
Wholesale model
Enhancing fuels brands
Volume growth
International Marketing
Retail / wholesale model
Adding 100+ sites
Specialties
Grow Lubricants earnings and
international portfolio
See appendix for footnotes.

3.7
2.7
6.6 1.0 1.5
2.4
CFO SustainingCapex
FCF PSX Growth Est. PSXPContributions
2018EAvailable
Cash Flow
Phillips 66 Available Cash Flow
20
Annual Available Cash Flow ($B)
Diversified cash generation
Funding transformational growth
Growing distributions
Financial flexibility
Strong free cash flow yield
2009 – 2014 Average See appendix for footnotes.
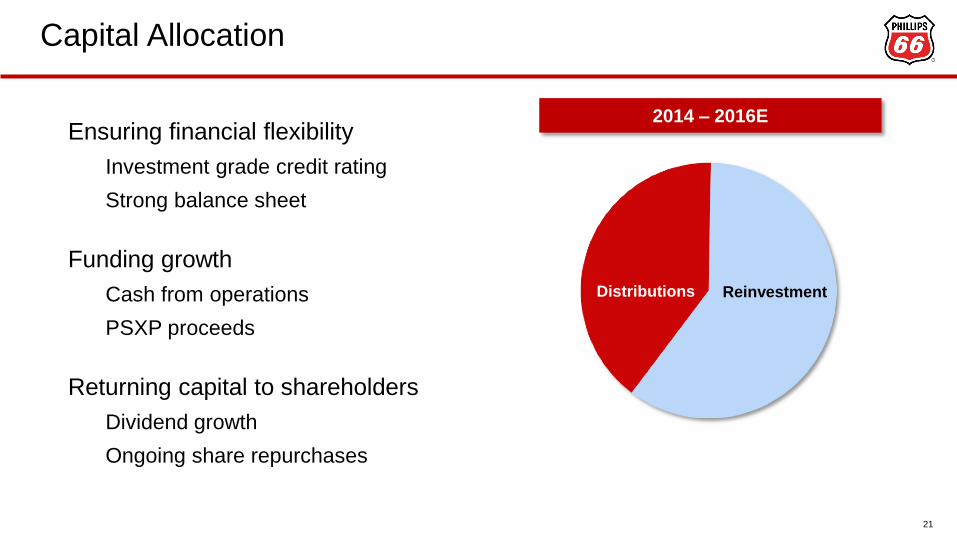
Capital Allocation
21
Ensuring financial flexibility
Investment grade credit rating
Strong balance sheet
Funding growth
Cash from operations
PSXP proceeds
Returning capital to shareholders
Dividend growth
Ongoing share repurchases
Distributions Reinvestment
2014 – 2016E

Capital Budget
22
$2 - 3 B Growth capital
Legacy, scalable Midstream assets
Fee-based assets suitable for PSXP
dropdown
Quick payout Refining projects
$1 B Sustaining capital
Maintaining safe, reliable assets
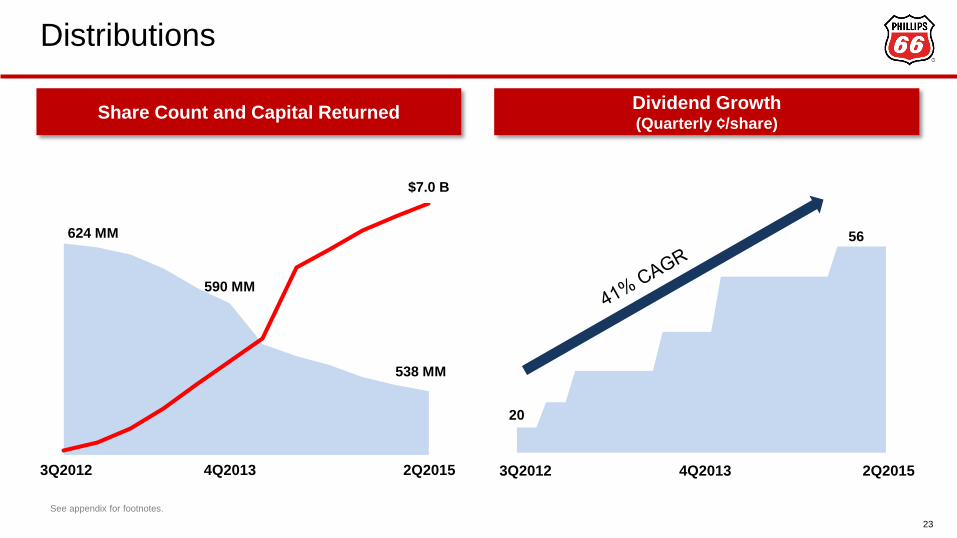
Dividend Growth (Quarterly ¢/share)
Distributions
624 MM
590 MM
538 MM
$7.0 B
20
56
Share Count and Capital Returned
3Q2012 4Q2013 2Q2015
23
3Q2012 4Q2013 2Q2015
See appendix for footnotes.
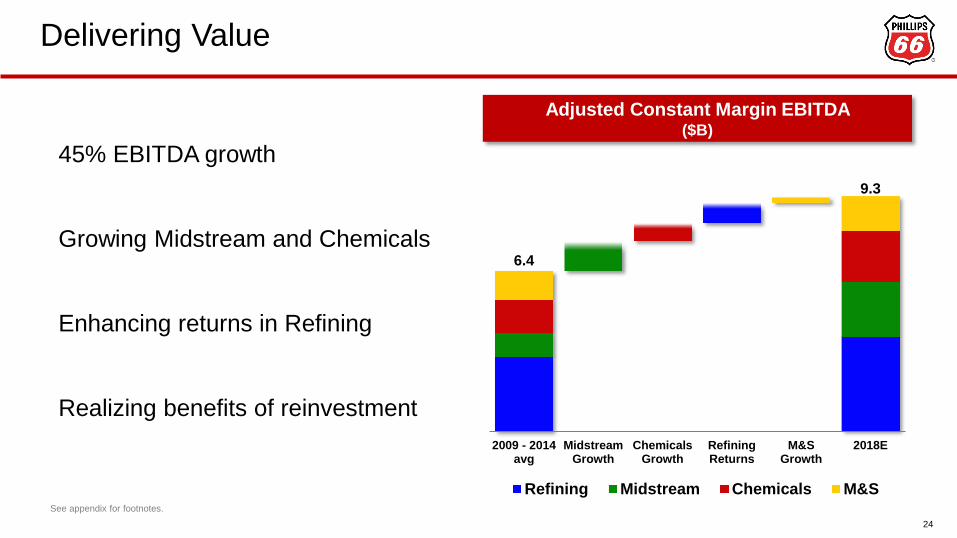
6.4
9.3
2009 - 2014avg
MidstreamGrowth
ChemicalsGrowth
RefiningReturns
M&SGrowth
2018E
Refining Midstream Chemicals M&S
Delivering Value
24
Adjusted Constant Margin EBITDA ($B)
45% EBITDA growth
Growing Midstream and Chemicals
Enhancing returns in Refining
Realizing benefits of reinvestment
See appendix for footnotes.

Compelling Investment
25
Shareholder returns
Unique portfolio
EBITDA growth
Disciplined capital allocation
Multiple expansion
-20%
20%
60%
100%
140%
180%
May-12 Nov-12 May-13 Nov-13 May-14 Nov-14 May-15
PSX +158%
S&P 100 +44%

Institutional Investors Contact Kevin Mitchell
Vice President, Investor Relations
C.W. Mallon
Manager, Investor Relations
832-765-2297
Investor Update September 2015
NYSE: PSXP
www.phillips66partners.com

Cautionary Statement
28
This presentation contains forward-looking statements as defined under the federal securities laws, including projections, plans and
objectives. Although Phillips 66 Partners believes that expectations reflected in such forward-looking statements are reasonable, no
assurance can be given that such expectations will prove to be correct. In addition, these statements are subject to certain risks,
uncertainties and other assumptions that are difficult to predict and may be beyond Phillips 66 Partners’ control. If one or more of these
risks or uncertainties materialize, or if underlying assumptions prove incorrect, actual results may vary materially from what Phillips 66
Partners anticipated, estimated, projected or expected. The key risk factors that may have a direct bearing on the forward-looking
statements in the presentation are the accuracy of our assumptions used to estimate the benefits to be realized from Phillips 66
Partners’ acquisition of interests in certain joint ventures that own or control midstream pipeline assets (the “acquisition”), our ability to
successfully integrate the assets into our operations, the decisions made by Explorer Pipeline Company, DCP Sand Hills Pipeline, LLC,
and DCP Southern Hills Pipeline, LLC regarding distributions these entities make to us as an equity owner, and other factors as
described in the filings that Phillips 66 Partners makes with the Securities and Exchange Commission. In light of these risks,
uncertainties and assumptions, the events described in the forward-looking statements might not occur or might occur to a different
extent or at a different time than as described. All forward-looking statements in this presentation are made as of the date hereof and
Phillips 66 Partners undertakes no obligation to publicly update or revise any forward-looking statements, whether as a result of new
information, future events or otherwise. This presentation is not, and under no circumstance is to be construed to be, a prospectus,
offering memorandum, or advertisement and is not an offer to sell securities. The SEC and state securities regulators have not
reviewed or determined if this presentation is truthful or complete.
Non-GAAP Financial Measure Disclosure
Today’s presentation includes certain non-GAAP financial measures as defined under Regulation G of the Securities Exchange Act of
1934, as amended. A reconciliation of those measures to the most directly comparable GAAP measures is available in the appendix to
this presentation.

Phillips 66 Partners Ownership Structure
29
Phillips 66 Partners GP LLC
(PSXP General Partner)
General Partner Units
IDRs
Operating Subsidiaries
PSXP Public
Unitholders
(NYSE: PSX)
(NYSE: PSXP)
100% ownership
interest
29% limited partner
interest
Joint Ventures
2% general
partner interest
69% limited partner
interest

Phillips 66 Partners
30
Strong alignment with Phillips 66
Highly integrated assets
Stable and predictable cash flows
Significant growth potential
Financial flexibility
Pecan Grove Marine Dock
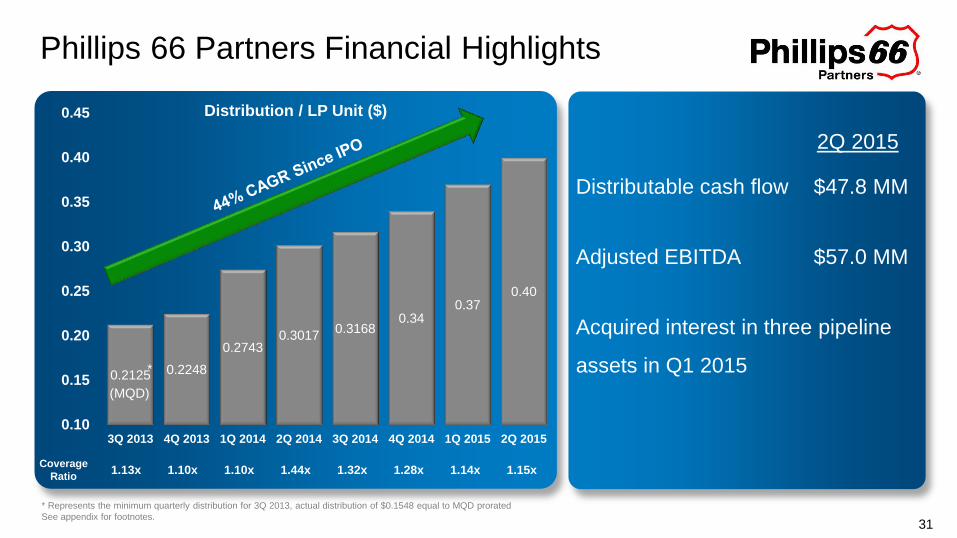
Phillips 66 Partners Financial Highlights
31
Distributable cash flow
Adjusted EBITDA
Acquired interest in three pipeline
assets in Q1 2015
$47.8 MM
$57.0 MM
0.2125 0.2248
0.2743 0.3017
0.3168 0.34
0.37 0.40
0.10
0.15
0.20
0.25
0.30
0.35
0.40
0.45
3Q 2013 4Q 2013 1Q 2014 2Q 2014 3Q 2014 4Q 2014 1Q 2015 2Q 2015
*
(MQD)
Coverage
Ratio 1.13x 1.10x 1.10x 1.44x 1.32x 1.28x 1.14x 1.15x
Distribution / LP Unit ($)
* Represents the minimum quarterly distribution for 3Q 2013, actual distribution of $0.1548 equal to MQD prorated
See appendix for footnotes.
2Q 2015

Q1 2015 Acquisition
32
Drop down assets 33.3% interest in Sand Hills NGL pipeline
33.3% interest in Southern Hills NGL pipeline
19.5% interest in Explorer refined products pipeline
$1.1 B acquisition Asset-level 2015E EBITDA of $115 million
Implied 9.5x purchase multiple on assets’ 2015E EBITDA
Assets supported by long-term, fee-based
agreements, primarily under take-or-pay terms
Additional organic growth opportunities through
identified expansion projects

33
$275 MM In Announced Organic Growth
Cross-Channel
Connector Pipeline
Eagle Ford Crude
Gathering System
Bakken Joint Ventures
• Capital cost: $22 MM
• Increases access to export docks for shippers in Houston Ship Channel
• Expected completion in 4Q 2015
• Capital cost: $50 MM
• Connects Eagle Ford crude oil production to third-party pipelines
• Initial operations commenced January 2015; expected completion in 3Q 2015
• Capital cost: $160 MM (PSXP share)
• 100 MBD Palermo crude oil rail-loading facility, 76-mile Sacagawea Pipeline and central delivery facility for gathering systems
• Provides increased logistics options for shippers in the Bakken region
• Expected terminal completion in 4Q 2015; pipeline completion in 2016
Sand Hills Pipeline • Capital cost: ~ $45 MM (PSXP share)
• Adding lateral connections and increasing pumping capacity beyond 200 MBD
See appendix for footnotes.

34
Highly Integrated Assets
Palermo Rail Terminal expected to be operational Q4 2015.

35
Fee-based, Long-term contracts provide stability
Asset Initial Term (years) Maximum Term with Options (years)
Clifton Ridge to Lake Charles 10 20
Sweeny to Pasadena 10 20
Hartford Connector 23 * 23
Gold Line 10 15
Sand Hills 15 15
Southern Hills 15 15
Explorer Various Various
Clifton Ridge terminal 5 20
Clifton Ridge / Pecan grove docks 5 20
Pasadena terminal 5 20
Pasadena and Hartford truck racks 5 20
Gold Line terminals 5 15
Medford Spheres 10 20
Bayway Rail Rack 10 20
Ferndale Rail Rack 10 20
* Includes PSX JV Wood River Refinery to Hartford and Hartford to Explorer pipelines. The term of the Hartford Connector throughput and deficiency agreement began in January 2008
Pip
elin
es
Te
rmin
als
/ S
tora
ge

Adjusted EBITDA and DCF
36
34.3 33.4 37.2
41.9
47.8
Q2 2014 Q3 2014 Q4 2014 Q1 2015 Q2 2015
Distributable Cash Flow ($MM)
37.6 35.9
43.7
49.0
57.0
Q2 2014 Q3 2014 Q4 2014 Q1 2015 Q2 2015
Adjusted EBITDA ($MM)

Balanced Debt Maturity Profile
37
2020 2025 2045
5-year notes
2.646% coupon
10-year notes
3.605% coupon
30-year notes
4.68% coupon
$1.1 B debt issuance February 2015
5-Year $300 MM notes
10-Year $500 MM notes
30-Year $300 MM notes
Average cost of 3.64%
BBB (stable) / Baa3 (stable)
$3
00
MM
$5
00
MM
$3
00
MM

Financial Flexibility
38
Investment grade credit rating
Target 3.5x debt / EBITDA
30% distribution CAGR through 2018
Target 1.1x annual coverage ratio
Support Phillips 66 Midstream growth

Closed 1st
acquisition -
$700 MM
Closed 2nd
acquisition -
$340 MM
-30%
-10%
10%
30%
50%
70%
90%
110%
130%
150%
170%
190%
210%
230%
250%
Jul-13 Sep-13 Nov-13 Jan-14 Mar-14 May-14 Jul-14 Sep-14 Nov-14 Jan-15 Mar-15 May-15 Jul-15
39
Total Return Since IPO
PSXP 172%
Alerian MLP Index -10%
IPO
Closed 3rd
acquisition -
$1.1 B
Source: Bloomberg

Institutional Investors Contact
Kevin Mitchell - Investor Relations
[email protected] 832-765-2297
C.W. Mallon - Investor Relations
[email protected] 832-765-2297

Appendix

Segment Strategy
42
Refining:
Enhance Returns Midstream: Growth Chemicals: Growth
Marketing and
Specialties:
Selective Growth
Execute Sweeny hub
Grow integrated
Transportation system
PSXP as a funding vehicle
Expand DCP G&P
Pursue organic and M&A
opportunities
Grow CPChem organically
Advance olefins and
polyolefins projects
Capitalize on domestic
feedstock advantage
Leverage proprietary
technology
Optimize crude slate
Expand export capability
Increase yields
Maintain cost discipline
Enhance portfolio
Expand European retail
marketing
Grow lubricants
Ensure domestic refinery
pull-through

Free Cash Flow 2013 – 1H 2015 Average
43
0.9 1.3
0.7 0.3
CFO & Drop Proceeds Sustaining Capex Available Cash Flow
1.2 1.0
0.2
CFO Sustaining Capex FCF
Midstream ($B) Chemicals ($B)
CFO excludes working capital.
Average from 2013 – 1H 2015
DCP Midstream, CPChem and WRB free cash flow calculated at the enterprise level
2.7 1.8
0.9
CFO Sustaining Capex FCF
1.0 0.9
0.1
CFO Sustaining Capex FCF
Refining ($B) Marketing & Specialties ($B)
PSXP Drop
Proceeds

25%
21%
16%
5%
M&S
Chemicals Refining
Midstream
-10%
0%
10%
20%
30%
40%
Average Capital Employed ($B)
Corporate
-7%
1H 2015 Adjusted ROCE
44
P66 Total
13%
0 2 4 6 8 10 12 14 16 18 20 22 24 26 28 30 32
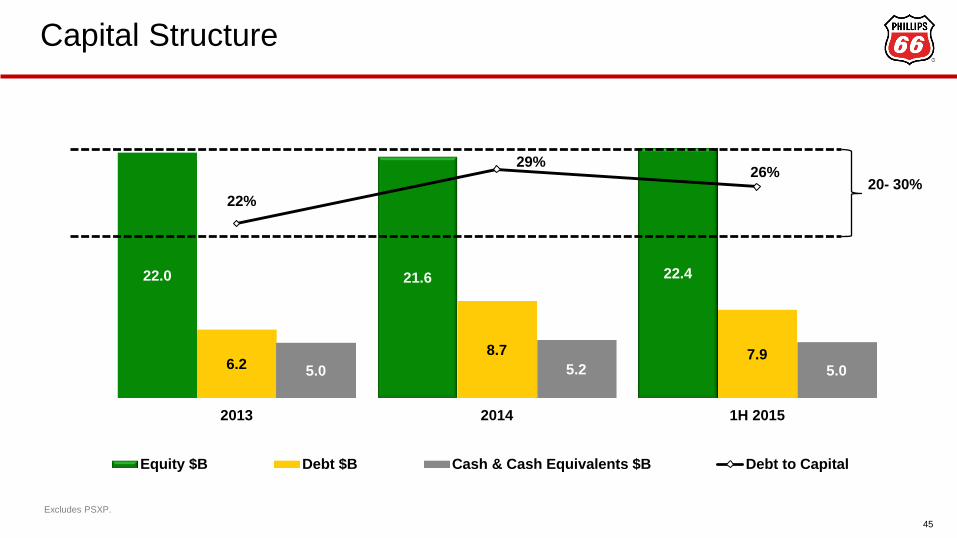
22.0 21.6 22.4
6.2 8.7 7.9
5.0 5.2 5.0
22%
29% 26%
2013 2014 1H 2015
Equity $B Debt $B Cash & Cash Equivalents $B Debt to Capital
Capital Structure
45
20- 30%
Excludes PSXP.
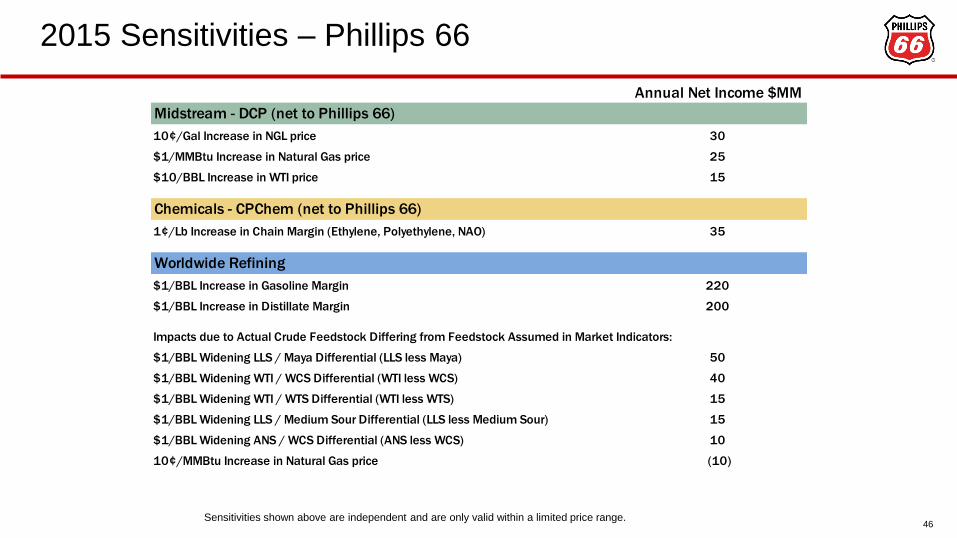
2015 Sensitivities – Phillips 66
46 Sensitivities shown above are independent and are only valid within a limited price range.
Annual Net Income $MM
Midstream - DCP (net to Phillips 66)
10¢/Gal Increase in NGL price 30
$1/MMBtu Increase in Natural Gas price 25
$10/BBL Increase in WTI price 15
Chemicals - CPChem (net to Phillips 66)
1¢/Lb Increase in Chain Margin (Ethylene, Polyethylene, NAO) 35
Worldwide Refining
$1/BBL Increase in Gasoline Margin 220
$1/BBL Increase in Distillate Margin 200
$1/BBL Widening LLS / Maya Differential (LLS less Maya) 50
$1/BBL Widening WTI / WCS Differential (WTI less WCS) 40
$1/BBL Widening WTI / WTS Differential (WTI less WTS) 15
$1/BBL Widening LLS / Medium Sour Differential (LLS less Medium Sour) 15
$1/BBL Widening ANS / WCS Differential (ANS less WCS) 10
10¢/MMBtu Increase in Natural Gas price (10)
Impacts due to Actual Crude Feedstock Differing from Feedstock Assumed in Market Indicators:

Phillips 66 Capital Program
47
Sustaining Growth Total
Capital Expenditures and Investments
Consolidated
Midstream(1)
Transportation 148 1,084 1,232
NGL 19 1,912 1,931
167 2,996 3,163
Chemicals - - -
Refining(2) 813 299 1,112
Marketing and Specialties 78 92 170
Corporate(2) 155 - 155
1,213 3,387 4,600
Selected Equity Affiliates
DCP 125 275 400
CPChem 187 1,266 1,453
WRB 150 53 203
462 1,594 2,056
Capital Program(3)
Midstream
Transportation 148 1,084 1,232
DCP 125 275 400
NGL 19 1,912 1,931
292 3,271 3,563
Chemicals 187 1,266 1,453
Refining 963 352 1,315
Marketing and Specialties 78 92 170
Corporate 155 - 155
1,675 4,981 6,656
(1) Includes 100% of Phillips 66 Partners
Millions of Dollars
2015 Budget
(2) Includes non-cash capitalized leases of $11 million in Refining and $21 million in Corporate and Other
(3) Includes Phillips 66's share of capital spending by DCP, CPChem and WRB, which are expected to be self-
funded.

Footnotes
48
Slide 4
Injury statistics do not include major projects.
Industry Averages are from: Phillips 66 – American Fuel & Petrochemical Manufacturers (AFPM) refining
data, CPChem – American Chemistry Council (ACC), DCP – Gas Processors Association (GPA).
Growth component of operating costs is estimated based on forecasted growth spending.
Slide 7
Current based on last 4 quarters: 3Q 2014 – 2Q 2015 average
History based on 2000 – 2013 average
Ethane Cracker Margin: Advantage is N.A. ethane margin (Spot) less N.E. Asia naphtha margin (Spot)
(source: I.H.S.)
Natural Gas: Advantage calculated as average of ICE NBP gas and Japan natural gas LNG import price
less Henry Hub (source: Morningstar)
Brent – WTI: Brent Dated less WTI at Cushing (source: Morningstar)

Footnotes
49
Slide 8
Average of company EV (daily EV 1/1/2015 – 8/31/2015) and 2016 consensus EBITDA as of 8/31/2015.
Refining Peers is average of: DK, HFC, MPC, PBF, TSO, VLO, WNR
Chemicals Peers is average of: CE, DOW, EMN, HUN, LYB, WLK
Midstream Peers is average of: EPD, ETE, OKE, TRGP
Source: Bloomberg
Slides 9 – 13
EBITDA growth is 2018 estimated run-rate EBITDA of projects completed second-half 2014 or later.
Slide 14
PSX Operating assets EBITDA includes Refining Logistics. Refining Logistics represents terminaling,
storage and other logistics assets currently embedded in the Refining segment. Amount represents an
estimate of the EBITDA potential of these assets if they were transferred to Midstream and market-based
fees for their use were charged to the Refining segment.
Projects under construction and planned EBITDA growth is 2018 estimated run-rate EBITDA of projects
completed second-half 2014 or later. PSXP EBITDA includes EBITDA attributable to Phillips 66
noncontrolling interests.

Footnotes
50
Slide 15
PSXP is a consolidated subsidiary of PSX. Accordingly, quarterly cash distributions paid from PSXP to
PSX, and consideration paid by PSXP to PSX in a dropdown transaction, both eliminate in consolidation
and do not impact PSX’s consolidated cash balance, except to the extent PSXP funds consideration for a
dropdown transaction with public debt and equity offerings.
PSXP equity value based on LP distributions multiple of 20x and GP distributions multiple of 30x.
Slide 16
Amounts presented are on a DCP Midstream 100% basis, and include DPM (100%). EBITDA growth is
2018 estimated run-rate EBITDA of projects completed since 2014 based on normalized price and volume
assumptions.
Slide 18
EBITDA growth is 2018 estimated run-rate EBITDA of the following projects: 1-hexene, 10th Sweeny
furnace, NAO expansion project and USGC petrochemical project. $1.5 B estimated incremental EBITDA
based on 2012 industry margins.

Footnotes
51
Slide 19
EBITDA growth is 2018 estimated run-rate EBITDA of projects completed second-half 2014 or later.
CFO excludes working capital. WRB free cash flow calculated at the enterprise level.
2015E ROCE includes project and operational improvements since 2014 on a constant margin basis.
Future improvements include estimated run-rate improvement of projects completed by 2018.
Slide 20
EBITDA growth is 2018 estimated run-rate EBITDA of projects completed second-half 2014 or later.
ROCE is 1H 2015 annualized.
Slide 21
CFO excludes working capital. Available Cash Flow growth is 2018 estimated run-rate Free Cash Flow of
projects completed primarily second-half 2014 or later. Assumes joint ventures distribute 100% of growth
EBITDA.
PSXP contributions to PSX include distributions and PSXP funding for organic growth capital and drop-
downs. See footnotes to slide 15 for an explanation of the impact of PSXP drop proceeds on Phillips 66’s
consolidated cash balance.

Footnotes
52
Slide 24
Capital returned includes the 2014 PSPI share exchange and excludes dividend payments.
Slide 25
Corporate not included in bars on chart, but included in totals.
Midstream EBITDA excludes EBITDA attributable to Phillips 66 noncontrolling interests.
EBITDA growth is 2018 estimated run-rate EBITDA of projects completed primarily second-half 2014 or
later.
Slide 26
Chart reflects total shareholder return May 1, 2012 to August 31, 2015. Dividends assumed to be
reinvested in stock on payment date.

Non-GAAP Reconciliations
53
Forecasted Available Cash Flow
Forecasted available cash flow estimates were primarily derived on a forecasted EBITDA basis, with
adjustments for estimated interest and tax payments and sustaining capital expenditures. Accordingly, all the
elements required for forecasted cash from operations are not available. Generally, the timing of working
capital impacts would be the primary difference between forecasted available cash flow and forecasted cash
from operations.
Forecasted EBITDA estimates were primarily derived on an EBITDA-only basis (revenue and cost projections).
Accordingly, all the elements required for forecasted net income, including income taxes, interest expense, and
depreciation and amortization, are not available. Together, these items generally result in a significant uplift in
EBITDA over net income. Run rate EBITDA reflects annualized forecasted EBITDA estimates of assets
immediately upon completion/acquisition.
Forecasted EBITDA

Non-GAAP Reconciliations
54
Millions of Dollars
Average 2009-2014
Refining Free Cash Flow
Numerator
Cash From Operations GAAP 2,615$
Less: Change in Non-Cash Working Cap. 152
Cash From Operations (excluding WC) 2,463
Less: P66 Equity affiliate cash from ops 584
Add: Equity look through cash from ops 573
Adjusted FCF (excl WC) 2,452$
Total Capex GAAP 1,038$
Less: Growth Capex 287
Sustaining Capex 751
Less: P66 Equity affiliate sustaining capex -
Add: Equity look through sustaining capex 134
Adjusted Sustaining Capex 885$
Free Cash Flow 1,567$
Non-GAAP Reconciliations
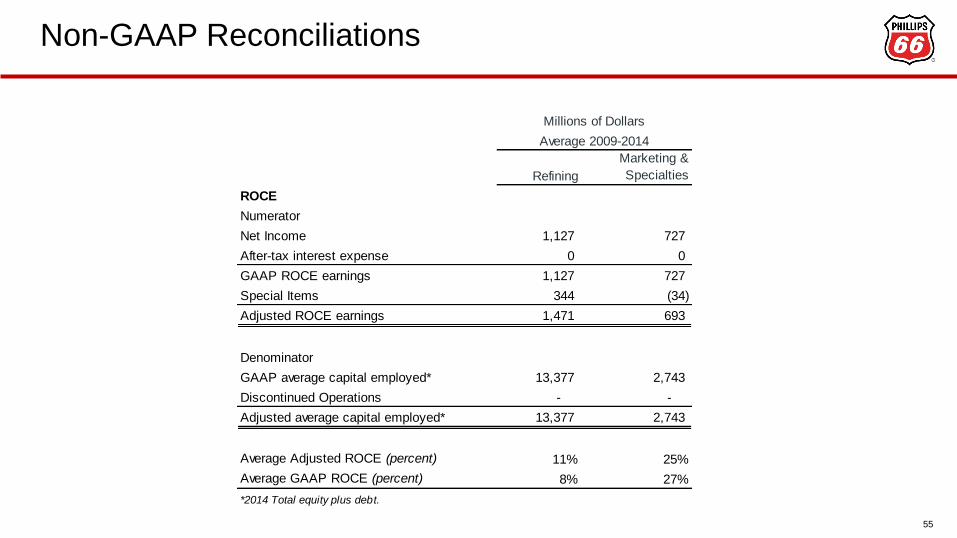
55
Refining
Marketing &
Specialties
ROCE
Numerator
Net Income 1,127 727
After-tax interest expense 0 0
GAAP ROCE earnings 1,127 727
Special Items 344 (34)
Adjusted ROCE earnings 1,471 693
Denominator
GAAP average capital employed* 13,377 2,743
Discontinued Operations - -
Adjusted average capital employed* 13,377 2,743
Average Adjusted ROCE (percent) 11% 25%
Average GAAP ROCE (percent) 8% 27%
*2014 Total equity plus debt.
Average 2009-2014
Millions of Dollars

Non-GAAP Reconciliations
56
Millions of Dollars
Average 2009-2014
Phillips 66 Free Cash Flow
Numerator
Cash From Operations GAAP 3,650$
Less: Change in Non-Cash Working Cap. (128)
Cash From Operations (excluding WC) 3,737$
Total Capex GAAP 3,773$
Less: Growth Capex 2,788
Sustaining Capex 985$
Free Cash Flow* 2,752$
* Not adjusted for equity affiliates.

Non-GAAP Reconciliations
57
Midstream Chemicals Refining
Marketing &
Specialties Corporate Phillips 66
Adjusted EBITDA by Segment Reconciliation
Net income attributable to Phillips 66 657$ 729 1,127 727 (292) 3,100
Less:
Income from discontinued operations - - - - 151
Plus:
Net income attributable to noncontrolling interests 12 - - - 12
Provision for income taxes 241 292 687 409 (176) 1,452
Net interest expense - - (1) (19) 126 106
Depreciation and amortization 86 - 668 128 34 916
EBITDA 996$ 1,021 2,481 1,245 (308) 5,434
Adjustments (pretax):
EBITDA attributable to Phillips 66 noncontrolling interests (17) - - - - (17)
Proportional share of selected equity affiliates income taxes 3 76 2 - - 81
Proportional share of selected equity affiliates net interest 108 20 (119) - - 9
Proportional share of selected equity affiliates depreciation and amortization166 215 208 - - 589
Gain on asset dispositions (308) - (16) (78) - (401)
Gain on share issuance by equity affiliate (23) - - - - (23)
Impairments 100 22 456 12 4 594
Cancelled projects - - 25 - - 25
Severence accruals - - 9 - - 9
Exit of a business line - - - 9 - 9
Pending Claims and settlements (6) - 16 (11) - (1)
Premium on early debt retirement - 24 - - - 24
Repositioning Costs - - - - 14 14
Hurricane-related costs - - 9 - - 9
Tax law impacts - - (4) (1) - (5)
Lower-of-cost-or-market inventory adjustments - 1 7 - - 8
Adjusted EBITDA* 1,021$ 1,377 3,074 1,176 (289) 6,359
* Proportional share of selected equity affiliates is net of noncontrolling interests.
Millions of Dollars
Average 2009 - 2014

Non-GAAP Reconciliations
58
Midstream Chemicals Refining
Marketing &
Specialties
FCF Yield
Numerator
Cash From Operations GAAP 750$ 597 2,557 1,177
Less: Change in Non-Cash Working Cap. 12 - (330) 168
Cash From Operations (excluding WC) 738 597 2,887 1,009
Less: P66 Equity affiliate cash from ops 200 597 749 -
Add: Equity look through cash from ops 372 1,170 564 -
Adjusted FCF (excl WC) 910$ 1,170 2,702 1,009
Total Capex GAAP 869 - 415 176
Less: Growth Capex 728 - (343) 120
Sustaining Capex 142 - 758 56
Less: P66 Equity affiliate sustaining capex - - - -
Add: Equity look through sustaining capex 133 200 109 -
Adjusted Sustaining Capex 275$ 200 867 56
Free Cash Flow 635$ 970 1,835 952
Millions of Dollars
Average 2013-1H 2015

Non-GAAP Reconciliations
59
Phillips 66 Midstream Chemicals Refining
Marketing &
Specialties Corporate
ROCE
Numerator
Net Income 2,022$ 16 498 1,142 618 (252)
After-tax interest expense 107 - - - - 107
GAAP ROCE earnings 2,129 16 498 1,142 618 (145)
Special Items (162) 126 0 (43) (242) (4)
Adjusted ROCE earnings 1,967$ 142 498 1,099 377 (149)
Denominator
GAAP average capital employed* 31,454$ 5,691 4,803 13,498 2,956 4,506
Discontinued Operations - - - - - -
Adjusted average capital employed* 31,454$ 5,691 4,803 13,498 2,956 4,506
*Total equity plus debt.
Annualized Adjusted ROCE (percent) 13% 5% 21% 16% 25% -7%
Annualized GAAP ROCE (percent) 14% 1% 21% 17% 42% -6%
*Total equity plus debt.
Millions of Dollars
1H 2015

Non-GAAP Reconciliations
60
Adjusted
Phillips 66
Phillips 66
Partners
Phillips 66
Consolidated
Total Debt 6,155 - 6,155
Total Equity 21,983 409 22,392
Debt-to-capital ratio 22% 22%
Total Debt 8,666 18 8,684
Total Equity 21,622 415 22,037
Debt-to-capital ratio 29% 28%
Total Debt 7,865 1,100 8,965
Total Equity 22,421 802 23,223
Debt-to-capital ratio 26% 28%
1H 2015
Millions of Dollars
2013
2014

Non-GAAP Reconciliations
61
Adjusted EBITDA forecasts were derived on an EBITDA-only basis. Accordingly, elements of net income including tax
and depreciation information are not available. Together, these items generally result in a significant uplift in EBITDA
over net income.
2018E Adjusted EBITDA/ EBITDA project backlog post 2018
Millions
of Dollars
Year ending February 29 2016
Reconciliation of PSXP Estimated EBITDA to Estimated Net Income*
Estimated net income 82$
Plus:
Depreciation 20
Interest expense 4
Income taxes 9
Estimated EBITDA 115$
*Amounts reflect the sum of EBITDA and net income forecasts within each joint venture, multiplied
by PSXP's expected ownership interest.
PSXP Run Rate EBITDA
PSXP 2014 and 2018 run rate EBITDA estimates were derived on an EBITDA-only basis. Accordingly, elements of net
income including tax and depreciation information are not available. Together, these items generally result in a
significant uplift in EBITDA over net income. Run rate EBITDA reflects annualized EBITDA projections of assets
immediately upon acquisition.

Adjusted EBITDA and Distributable Cash Flow
Reconciliation to Net Income
62
$ MM
2Q 2015 1Q 2015 4Q 2014 3Q 2014 2Q 2014
Net Income $ 42.0 $ 35.4 $ 36.3 $ 30.0 $ 30.9
Plus:
Depreciation 5.3 5.1 4.5 4.2 3.9
Net interest expense 9.5 5.8 2.1 1.4 1.3
Amortization of deferred rentals 0.1 0.1 0.1 0.1 0.1
Provision for (benefit from) income taxes (0.1) 0.2 0.2 0.1 0.2
EBITDA 56.8 46.6 43.2 35.8 36.4
Distributions in excess of equity earnings 0.2 0.7 - - -
Expenses indemnified or prefunded by Phillips 66 - 0.3 0.1 0.7 -
Transaction costs associated with acquisitions - 1.4 1.0 0.2 -
EBITDA attributable to predecessors - - (0.6) (0.8) 1.2
Adjusted EBITDA 57.0 49.0 43.7 35.9 37.6
Plus:
Adjustments related to minimum volume commitments 2.2 1.1 (2.4) 1.4 (0.7)
Phillip 66 prefunded maintenance capital expenditures - - 0.1 - 1.1
Less:
Net interest 9.5 6.5 1.4 1.7 0.1
Income taxes paid 0.4 - - - 0.2
Maintenance capital expenditures 1.5 1.7 2.8 2.2 3.4
Distributable Cash Flow 47.8 41.9 37.2 33.4 34.3
Recommended