N O V E M B E R 2 0 0 7
D I S T R E S S E D D E B T T R A D I N G
ST
RI
CT
LY
P
RI
VA
TE
A
ND
C
ON
FI
DE
NT
IA
L
John Abate
Managing Director and Head of Distressed Trading & Loan Trading
John Abate has 19 years of distressed portfolio management experience. John began his career as a
High Yield analyst with PPM America and moved to Citibank in 1994 to become Head of Distressed
Research on the Loan Trading Desk. In 1996, John became Head of Distressed Trading at Citibank.
John moved to Lehman Brothers Distressed Trading business in 1998, before joining JPMorgan in
2000 as Head of Distressed Loan Trading. In 2005 John became Head of all Distressed Trading and
Distressed Loan Trading at JPMorgan, his current position. John is a CFA Charterholder and holds
an MBA from the University of Florida; and a BA from James Madison University. John is married
to Kimberly Toor Abate and has 3 children, Drew (11), Abby (9), and AJ (7)
DI
ST
RE
SS
ED
D
EB
T
TR
AD
IN
G
Agenda
Page
Qualifications
Structured Investment Vehicles (SIVs)
Case Study: Collins & Aikman
Case Study: Refco
Recent Trends in Distressed Solutions
Current State of the Leveraged Credit Markets
Leveraged Credit Market Dynamics
Distressed Debt Trading
What is Distressed Debt 2
8
11
15
22
25
27
38
47
DI
ST
RE
SS
ED
D
EB
T
TR
AD
IN
G
What is distressed debt?
Distressed debt is typically, but loosely defined as follows:
Loans trading below 80% of face amount
Bonds trading at a spread greater than 1,000 bps over applicable treasuries
However, distressed paper often doesn’t fit into the typical definition
At a premium (e.g. Dow Corning)
At far tighter spreads (e.g. Federal Mogul TL)
New issues greater than L+1000 bps (loan to own)
As such, distressed investments have historically been identified by both
The situation the Obligor/Debtor faces and/or
The buyers of the paper:— Distressed funds, Special Situations Funds, Credit Opportunity Hedge funds, etc
WH
AT
I
S
DI
ST
RE
SS
ED
D
EB
T
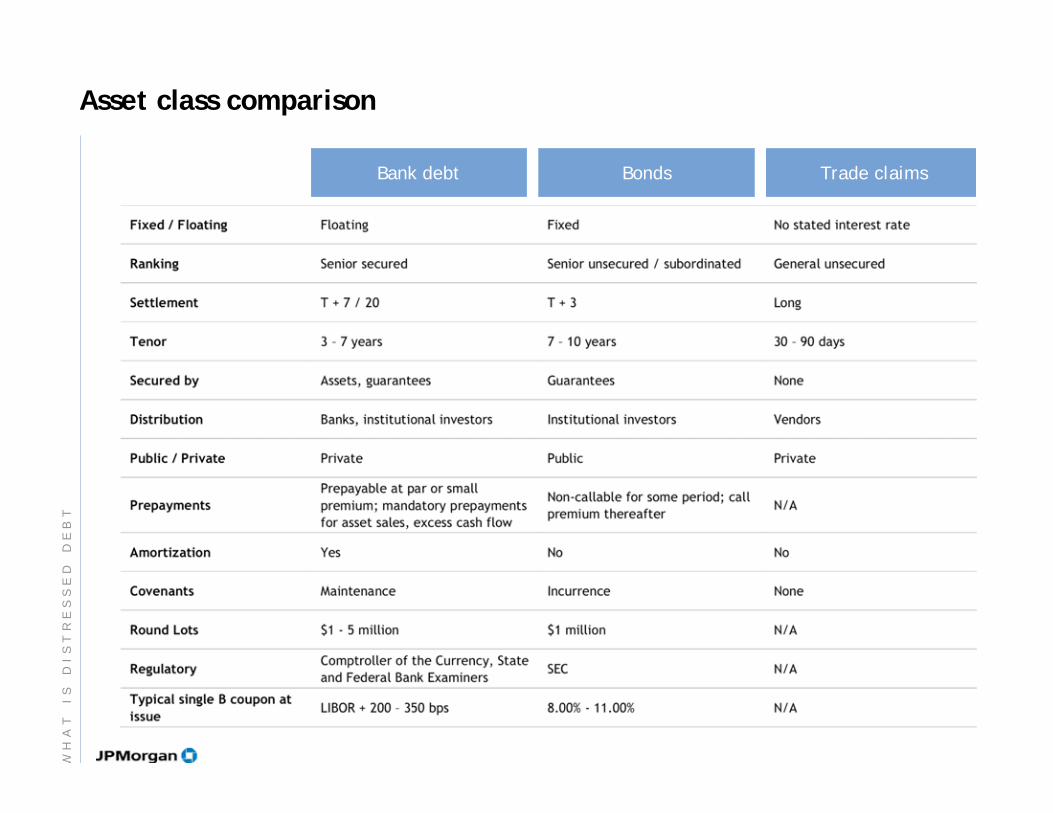
Asset class comparison
Bank debt Bonds Trade claims
WH
AT
I
S
DI
ST
RE
SS
ED
D
EB
T
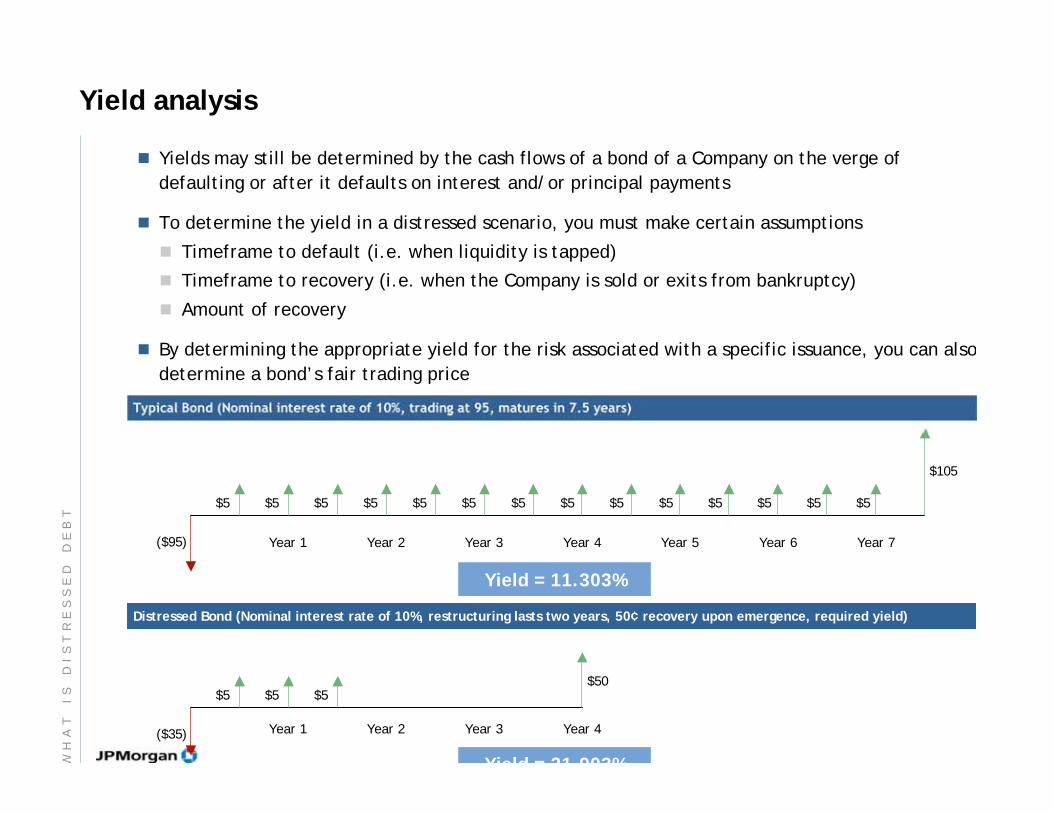
Yield analysis
Yields may still be determined by the cash flows of a bond of a Company on the verge of
defaulting or after it defaults on interest and/or principal payments
To determine the yield in a distressed scenario, you must make certain assumptions
Timeframe to default (i.e. when liquidity is tapped)
Timeframe to recovery (i.e. when the Company is sold or exits from bankruptcy)
Amount of recovery
By determining the appropriate yield for the risk associated with a specific issuance, you can also
determine a bond’s fair trading price
($95)
$5 $5 $5 $5 $5 $5 $5 $5 $5 $5 $5 $5 $5 $5
$105
Yield = 11.303%
($35)
$5 $5 $5$50
Typical Bond (Nominal interest rate of 10%, trading at 95, matures in 7.5 years)
Year 1 Year 2 Year 3 Year 4 Year 5 Year 6 Year 7
Year 1 Year 2 Year 3 Year 4
Distressed Bond (Nominal interest rate of 10%, restructuring lasts two years, 50¢ recovery upon emergence, required yield)
Yield = 21 903%WH
AT
I
S
DI
ST
RE
SS
ED
D
EB
T
0
10
20
30
40
50
60
70
80
90
100
AAA AA A BBB BB B CCC CC C D
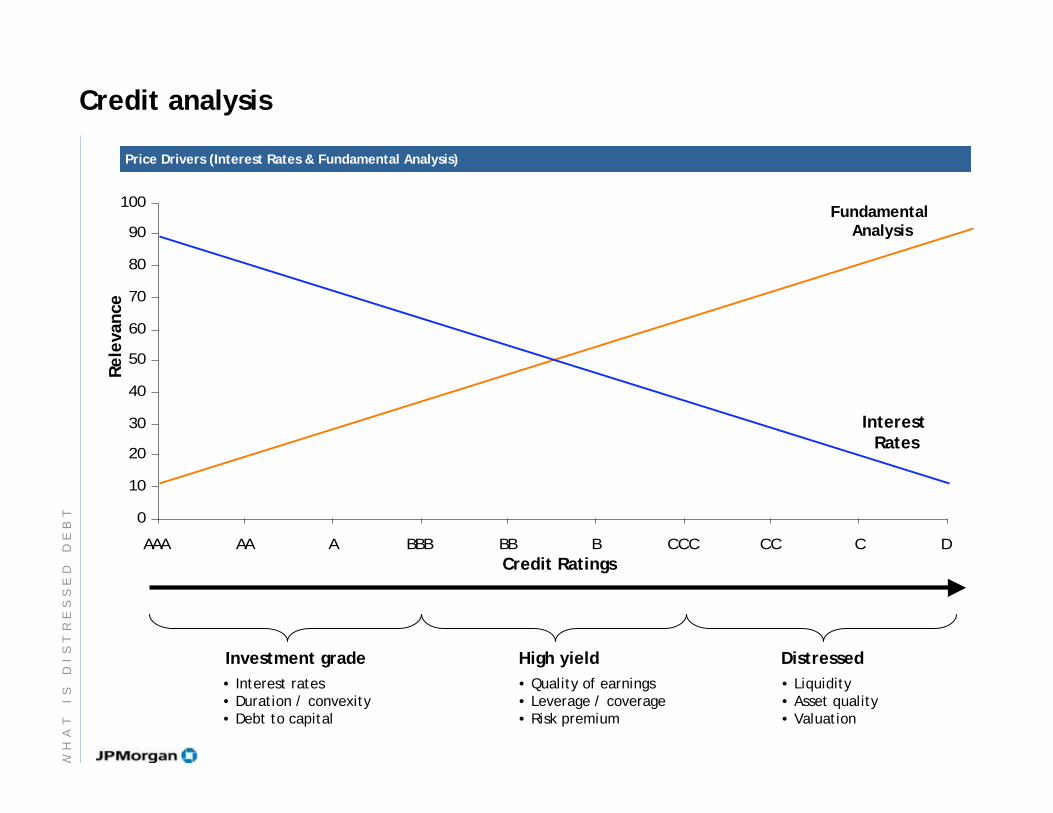
Interest Rates
Rele
vance
Credit Ratings
• Interest rates• Duration / convexity • Debt to capital
• Quality of earnings• Leverage / coverage• Risk premium
• Liquidity• Asset quality• Valuation
Investment grade High yield Distressed
Price Drivers (Interest Rates & Fundamental Analysis)
Credit analysis
Fundamental Analysis
WH
AT
I
S
DI
ST
RE
SS
ED
D
EB
T
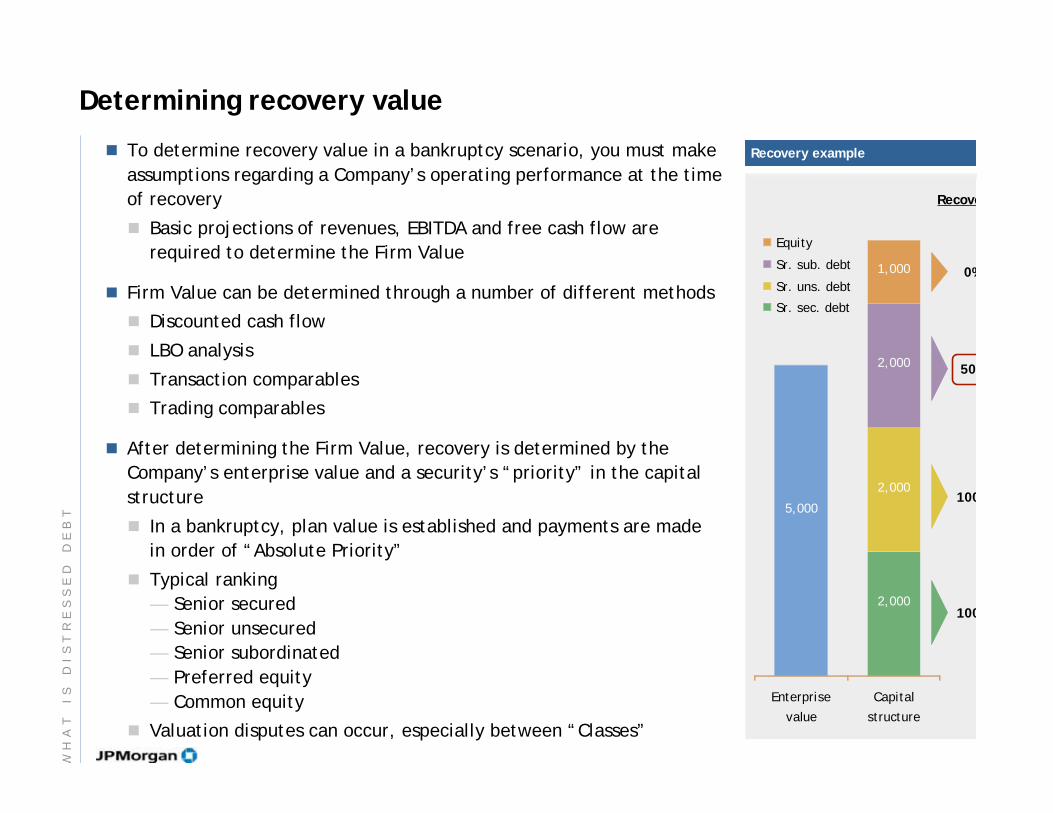
Determining recovery value
To determine recovery value in a bankruptcy scenario, you must make
assumptions regarding a Company’s operating performance at the time
of recovery
Basic projections of revenues, EBITDA and free cash flow are
required to determine the Firm Value
Firm Value can be determined through a number of different methods
Discounted cash flow
LBO analysis
Transaction comparables
Trading comparables
After determining the Firm Value, recovery is determined by the
Company’s enterprise value and a security’s “priority” in the capital
structure
In a bankruptcy, plan value is established and payments are made
in order of “Absolute Priority”
Typical ranking
— Senior secured
— Senior unsecured
— Senior subordinated
— Preferred equity
— Common equity
Valuation disputes can occur, especially between “Classes”
5,000
2,000
2,000
2,000
1,000
Enterprise
value
Capital
structure
Equity
Sr. sub. debt
Sr. uns. debt
Sr. sec. debt
Recove
100
100
50
0%
Recovery example
WH
AT
I
S
DI
ST
RE
SS
ED
D
EB
T
Agenda
Page
Qualifications
Structured Investment Vehicles (SIVs)
Case Study: Collins & Aikman
Case Study: Refco
Recent Trends in Distressed Solutions
Current State of the Leveraged Credit Markets
Leveraged Credit Market Dynamics
Distressed Debt Trading
What is Distressed Debt 2
8
11
15
22
25
27
38
47
DI
ST
RE
SS
ED
D
EB
T
TR
AD
IN
G
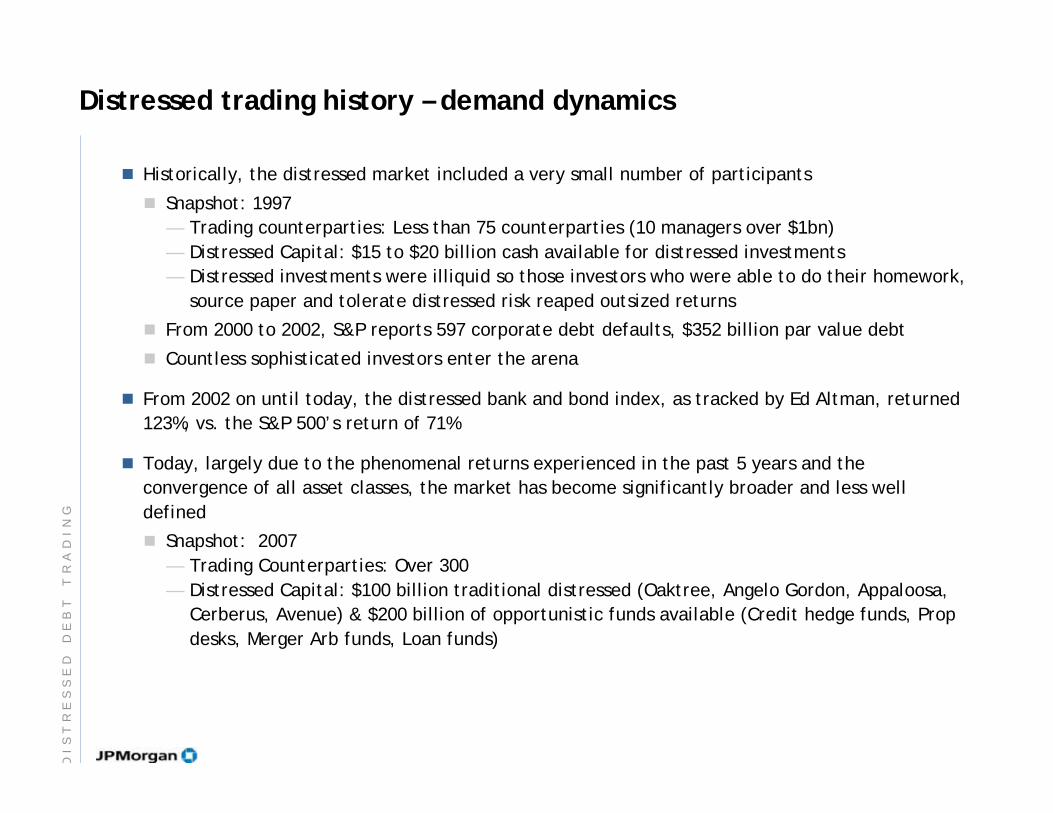
Distressed trading history – demand dynamics
Historically, the distressed market included a very small number of participants
Snapshot: 1997
— Trading counterparties: Less than 75 counterparties (10 managers over $1bn)
— Distressed Capital: $15 to $20 billion cash available for distressed investments
— Distressed investments were illiquid so those investors who were able to do their homework,
source paper and tolerate distressed risk reaped outsized returns
From 2000 to 2002, S&P reports 597 corporate debt defaults, $352 billion par value debt
Countless sophisticated investors enter the arena
From 2002 on until today, the distressed bank and bond index, as tracked by Ed Altman, returned
123%, vs. the S&P 500’s return of 71%
Today, largely due to the phenomenal returns experienced in the past 5 years and the
convergence of all asset classes, the market has become significantly broader and less well
defined
Snapshot: 2007
— Trading Counterparties: Over 300
— Distressed Capital: $100 billion traditional distressed (Oaktree, Angelo Gordon, Appaloosa,
Cerberus, Avenue) & $200 billion of opportunistic funds available (Credit hedge funds, Prop
desks, Merger Arb funds, Loan funds)
DI
ST
RE
SS
ED
D
EB
T
TR
AD
IN
G
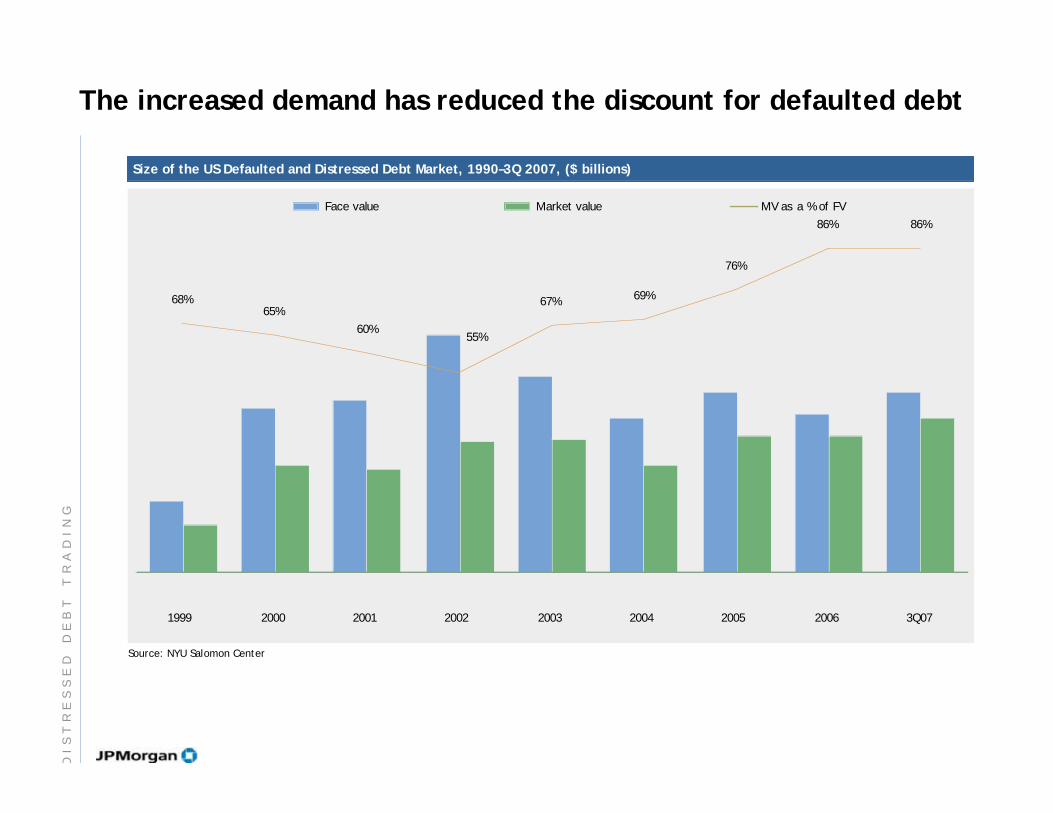
Source: NYU Salomon Center
Size of the US Defaulted and Distressed Debt Market, 1990–3Q 2007, ($ billions)
The increased demand has reduced the discount for defaulted debt
68%65%
60%
67%69%
76%
86% 86%
55%
1999 2000 2001 2002 2003 2004 2005 2006 3Q07
Face value Market value MV as a % of FV
DI
ST
RE
SS
ED
D
EB
T
TR
AD
IN
G
Agenda
Page
Qualifications
Structured Investment Vehicles (SIVs)
Case Study: Collins & Aikman
Case Study: Refco
Recent Trends in Distressed Solutions
Current State of the Leveraged Credit Markets
Leveraged Credit Market Dynamics
Distressed Debt Trading
What is Distressed Debt 2
8
11
15
22
25
27
38
47
DI
ST
RE
SS
ED
D
EB
T
TR
AD
IN
G
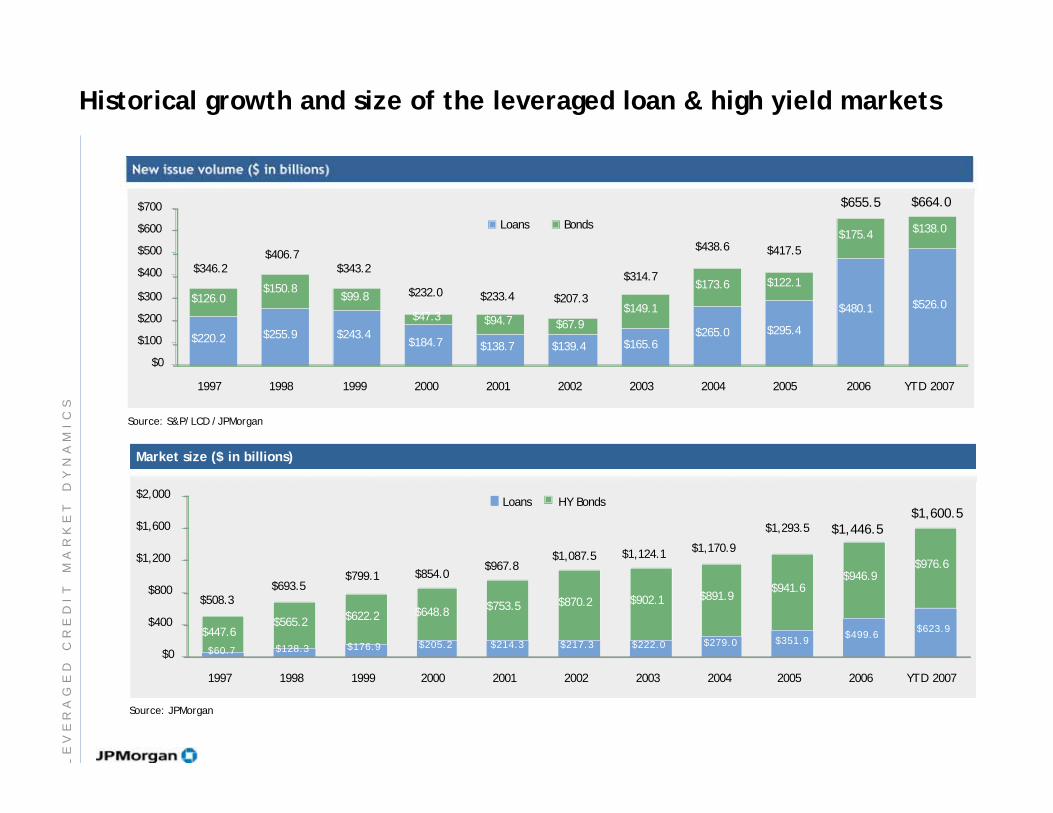
Historical growth and size of the leveraged loan & high yield markets
New issue volume ($ in billions)
Source: S&P/LCD /JPMorgan
$220.2 $255.9 $243.4$184.7 $138.7 $139.4 $165.6
$265.0 $295.4
$480.1 $526.0$126.0
$150.8$99.8
$47.3 $94.7 $67.9
$149.1
$173.6 $122.1
$175.4$138.0
$417.5
$346.2
$406.7
$343.2
$232.0 $233.4 $207.3
$314.7
$438.6
$0
$100
$200
$300
$400
$500
$600
$700
1997 1998 1999 2000 2001 2002 2003 2004 2005 2006 YTD 2007
Loans Bonds
$655.5 $664.0
$60.7 $128.3 $176.9 $205.2 $214.3 $217.3 $222.0 $279.0 $351.9$499.6
$623.9$447.6$565.2
$622.2 $648.8$753.5 $870.2 $902.1 $891.9
$941.6$946.9
$976.6
$1,293.5
$1,124.1$1,087.5$967.8
$1,170.9
$854.0$799.1$693.5
$508.3
$0
$400
$800
$1,200
$1,600
$2,000
1997 1998 1999 2000 2001 2002 2003 2004 2005 2006 YTD 2007
Loans HY Bonds
Market size ($ in billions)
Source: JPMorgan
$1,446.5$1,600.5
LE
VE
RA
GE
D
CR
ED
IT
M
AR
KE
T
DY
NA
MI
CS
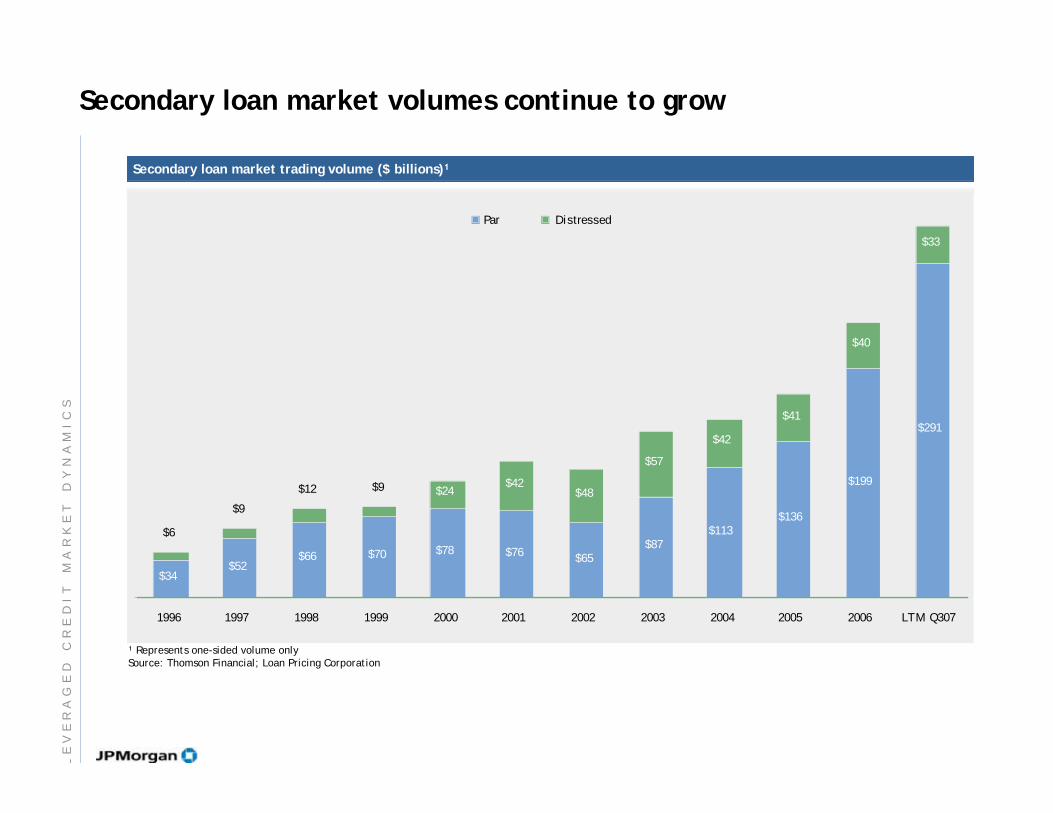
$34$52
$66 $70 $78 $76$65
$87$113
$136
$199
$291
$24$42
$48
$57
$42
$41
$40
$33
$9$12
$9
$6
1996 1997 1998 1999 2000 2001 2002 2003 2004 2005 2006 LTM Q307
Par Distressed
Secondary loan market trading volume ($ billions)
Represents one-sided volume onlySource: Thomson Financial; Loan Pricing Corporation
Secondary loan market volumes continue to grow
LE
VE
RA
GE
D
CR
ED
IT
M
AR
KE
T
DY
NA
MI
CS
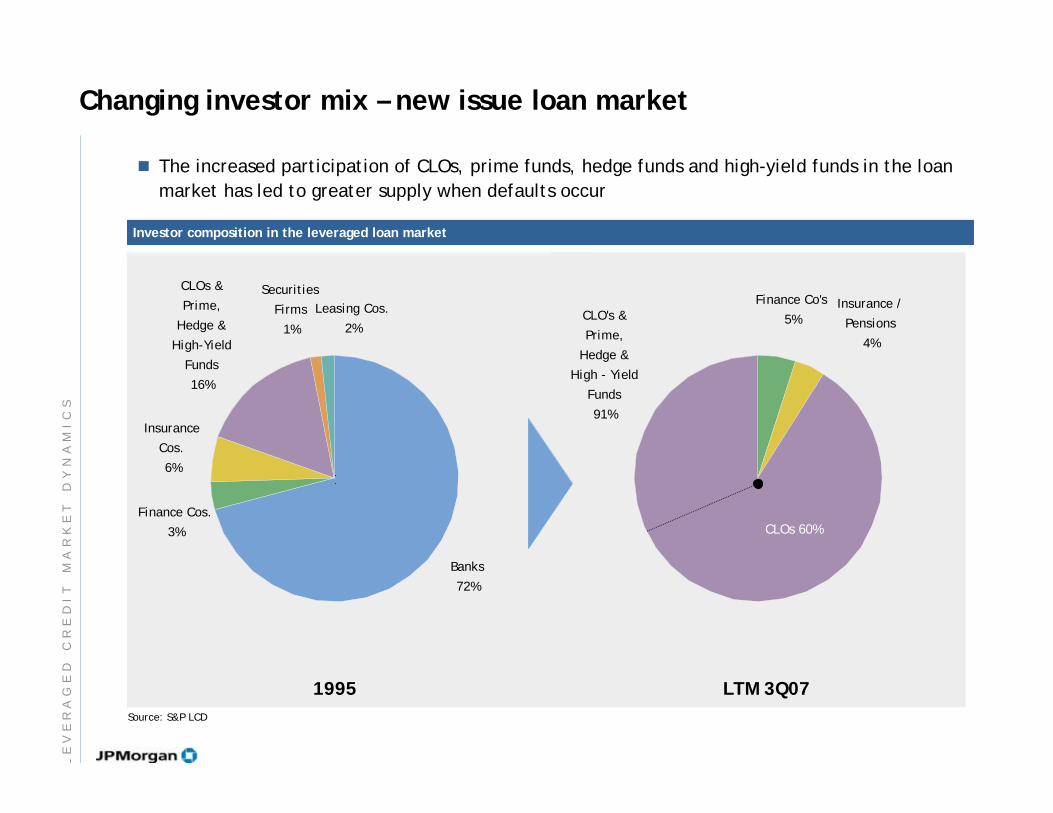
Insurance
Cos.
6%
Banks
72%
CLOs &
Prime,
Hedge &
High-Yield
Funds
16%
Securities
Firms
1%
Leasing Cos.
2%
Finance Cos.
3%
Source: S&P LCD
Investor composition in the leveraged loan market
1995
Changing investor mix – new issue loan market
The increased participation of CLOs, prime funds, hedge funds and high-yield funds in the loan
market has led to greater supply when defaults occur
Finance Co's
5%CLO's &
Prime,
Hedge &
High - Yield
Funds
91%
Insurance /
Pensions
4%
LTM 3Q07
CLOs 60%
LE
VE
RA
GE
D
CR
ED
IT
M
AR
KE
T
DY
NA
MI
CS
Agenda
Page
Qualifications
Structured Investment Vehicles (SIVs)
Case Study: Collins & Aikman
Case Study: Refco
Recent Trends in Distressed Solutions
Current State of the Leveraged Credit Markets
Leveraged Credit Market Dynamics
Distressed Debt Trading
What is Distressed Debt 2
8
11
15
22
25
27
38
47
DI
ST
RE
SS
ED
D
EB
T
TR
AD
IN
G

CU
RR
EN
T
ST
AT
E
OF
T
HE
L
EV
ER
AG
ED
C
RE
DI
T
MA
RK
ET
S
Confluence of recent events has distressed investors excited
Unprecedented new issue volumes over past 2 years, especially lower-rated new issuance
Supply and demand imbalance
Demand for leveraged loans diminished in the absence of CLO originations
Hung Bridge Loans
Cancellation of Warehouse Lines / TRS Programs
Opportunistic distressed funds expected to fill the void
Consumer led recession
Declining home prices and tightening lending standards
Deteriorating consumer sentiment
Stock market volatility
Structured Credit in the headlines
Overhang from subprime, ABCP, SIVs and structured credit continues to weigh on investorsentiment and risk appetites
Troubled industries in the headlines
Homebuilding, Mortgage Originators & Insurance Providers
CU
RR
EN
T
ST
AT
E
OF
T
HE
L
EV
ER
AG
ED
C
RE
DI
T
MA
RK
ET
S
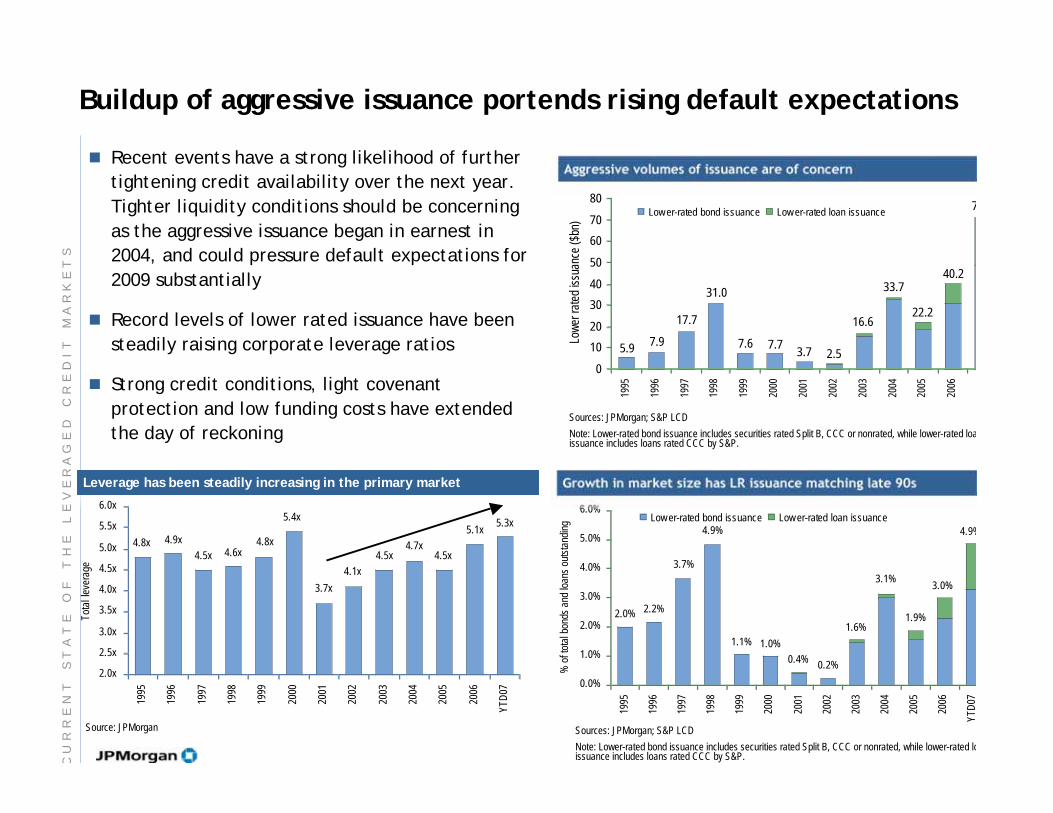
Buildup of aggressive issuance portends rising default expectations
Aggressive volumes of issuance are of concernRecent events have a strong likelihood of further
tightening credit availability over the next year.
Tighter liquidity conditions should be concerning
as the aggressive issuance began in earnest in
2004, and could pressure default expectations for
2009 substantially
Record levels of lower rated issuance have been
steadily raising corporate leverage ratios
Strong credit conditions, light covenant
protection and low funding costs have extended
the day of reckoning
4.9%
3.0%
1.9%
3.1%
1.6%
0.2%0.4%
1.0%1.1%
4.9%
3.7%
2.2%2.0%
0.0%
1.0%
2.0%
3.0%
4.0%
5.0%
6.0%
1995
1996
1997
1998
1999
2000
2001
2002
2003
2004
2005
2006
YT
D07
% o
f tot
al b
onds
and
loan
s ou
tsta
ndin
g Low er-rated bond issuance Low er-rated loan issuance
Growth in market size has LR issuance matching late 90s
Sources: JPMorgan; S&P LCD
Note: Lower-rated bond issuance includes securities rated Split B, CCC or nonrated, while lower-rated loissuance includes loans rated CCC by S&P.
Leverage has been steadily increasing in the primary market
Source: JPMorgan
5.3x5.1x
4.5x4.7x
4.5x
4.1x
3.7x
5.4x
4.8x4.6x4.5x
4.9x4.8x
2.0x
2.5x
3.0x
3.5x
4.0x
4.5x
5.0x
5.5x
6.0x
1995
1996
1997
1998
1999
2000
2001
2002
2003
2004
2005
2006
YT
D07
Tot
al l
ever
age
Sources: JPMorgan; S&P LCD
Note: Lower-rated bond issuance includes securities rated Split B, CCC or nonrated, while lower-rated loaissuance includes loans rated CCC by S&P.
7
40.2
22.2
33.7
16.6
2.53.77.77.6
31.0
17.7
7.95.9
0
10
20
30
40
50
60
70
80
1995
1996
1997
1998
1999
2000
2001
2002
2003
2004
2005
2006
Low
er ra
ted
issu
ance
($bn
)
Low er-rated bond issuance Low er-rated loan issuance
CU
RR
EN
T
ST
AT
E
OF
T
HE
L
EV
ER
AG
ED
C
RE
DI
T
MA
RK
ET
S
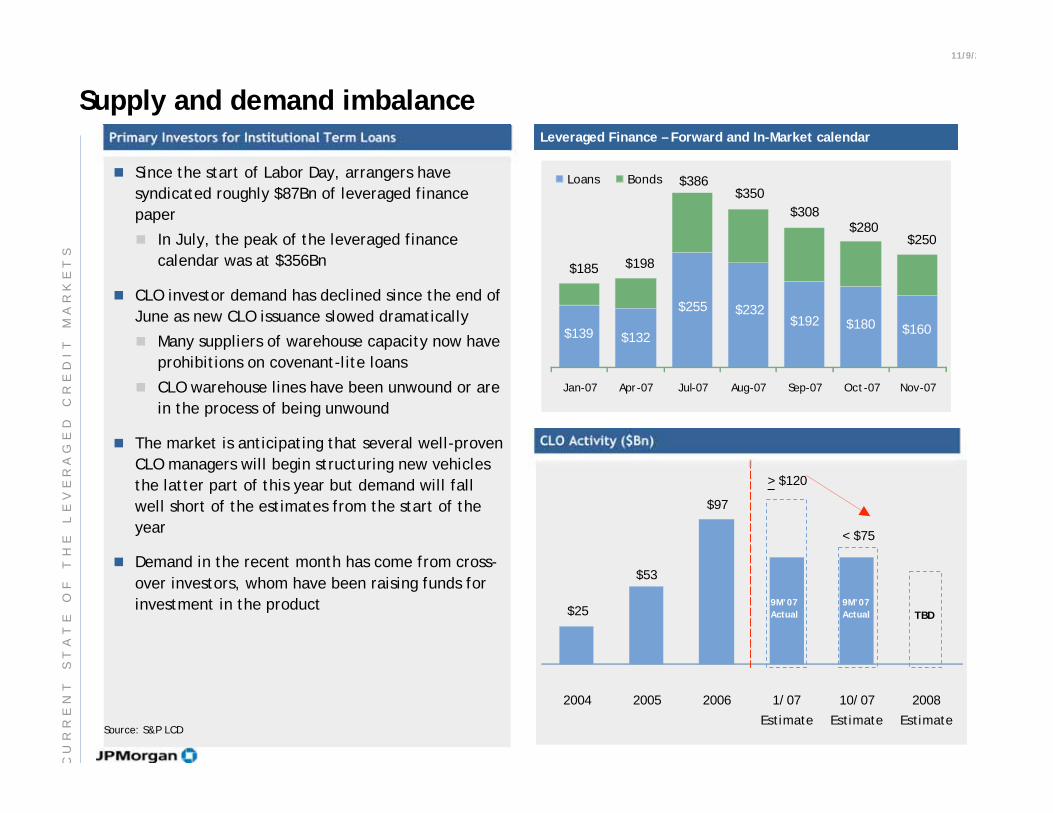
$97
$53
$25
< $75
> $120
2004 2005 2006 1/07
Estimate
10/07
Estimate
2008
Estimate
Supply and demand imbalance
CLO Activity ($Bn)
Primary Investors for Institutional Term Loans
Since the start of Labor Day, arrangers have
syndicated roughly $87Bn of leveraged finance
paper
In July, the peak of the leveraged finance
calendar was at $356Bn
CLO investor demand has declined since the end of
June as new CLO issuance slowed dramatically
Many suppliers of warehouse capacity now have
prohibitions on covenant-lite loans
CLO warehouse lines have been unwound or are
in the process of being unwound
The market is anticipating that several well-proven
CLO managers will begin structuring new vehicles
the latter part of this year but demand will fall
well short of the estimates from the start of the
year
Demand in the recent month has come from cross-
over investors, whom have been raising funds for
investment in the product
Source: S&P LCD
9M’07
Actual
9M’07
Actual TBD
11/9/2
Leveraged Finance – Forward and In-Market calendar
$180 $160$192
$232$255
$139 $132
$185 $198
$386$350
$308$280
$250
Jan-07 Apr-07 Jul-07 Aug-07 Sep-07 Oct-07 Nov-07
Loans Bonds
CU
RR
EN
T
ST
AT
E
OF
T
HE
L
EV
ER
AG
ED
C
RE
DI
T
MA
RK
ET
S
7.50%
8.00%
8.50%
9.00%
9.50%
May Jun Jul Aug Sep Oct
2
30
3
40
4
50
Average yields and spreads have stabilized since June/July’sleakage
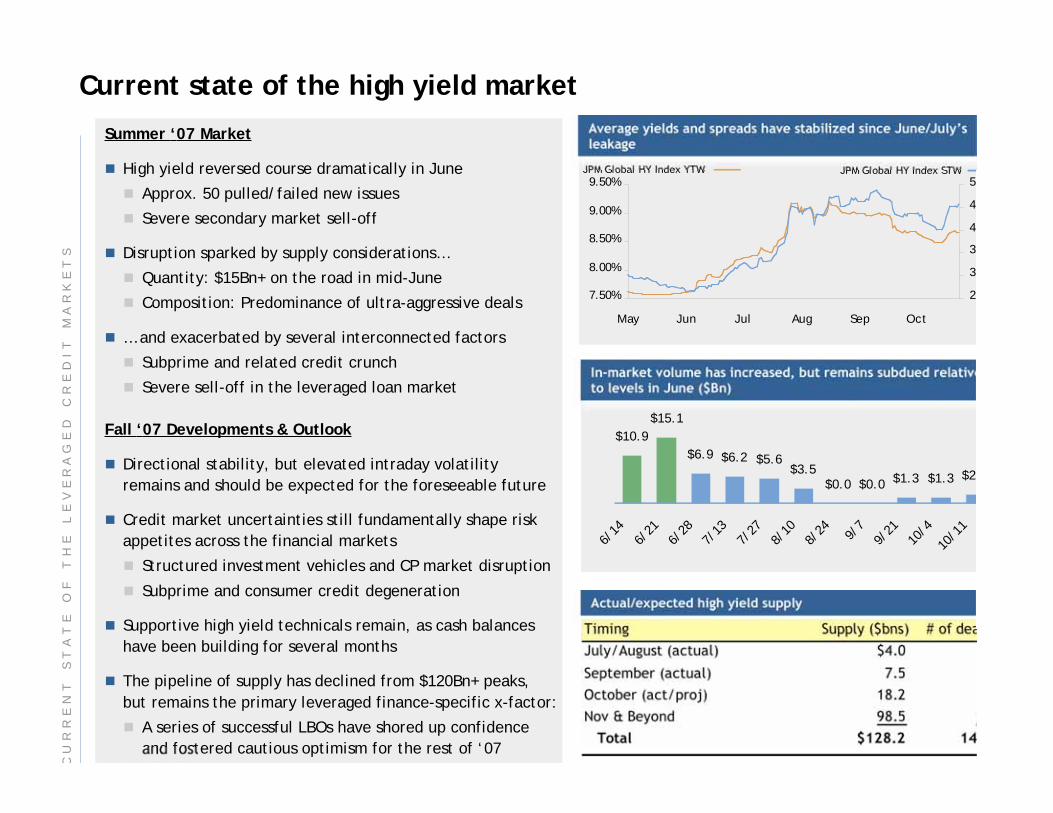
Current state of the high yield market
Summer ‘07 Market
High yield reversed course dramatically in June
Approx. 50 pulled/failed new issues
Severe secondary market sell-off
Disruption sparked by supply considerations…
Quantity: $15Bn+ on the road in mid-June
Composition: Predominance of ultra-aggressive deals
… and exacerbated by several interconnected factors
Subprime and related credit crunch
Severe sell-off in the leveraged loan market
Fall ‘07 Developments & Outlook
Directional stability, but elevated intraday volatility
remains and should be expected for the foreseeable future
Credit market uncertainties still fundamentally shape risk
appetites across the financial markets
Structured investment vehicles and CP market disruption
Subprime and consumer credit degeneration
Supportive high yield technicals remain, as cash balances
have been building for several months
The pipeline of supply has declined from $120Bn+ peaks,
but remains the primary leveraged finance-specific x-factor:
A series of successful LBOs have shored up confidence
and fostered cautious optimism for the rest of ‘07
$10.9
$15.1
$6.9 $6.2 $5.6$3.5
$0.0 $0.0$1.3 $1.3 $2
6/14
6/21
6/28
7/13
7/27
8/10
8/24 9/7
9/21
10/4
10/1
1
In-market volume has increased, but remains subdued relativeto levels in June ($Bn)
JPM Global HY Index YTW JPM Global HY Index STW
Actual/expected high yield supply
CU
RR
EN
T
ST
AT
E
OF
T
HE
L
EV
ER
AG
ED
C
RE
DI
T
MA
RK
ET
S
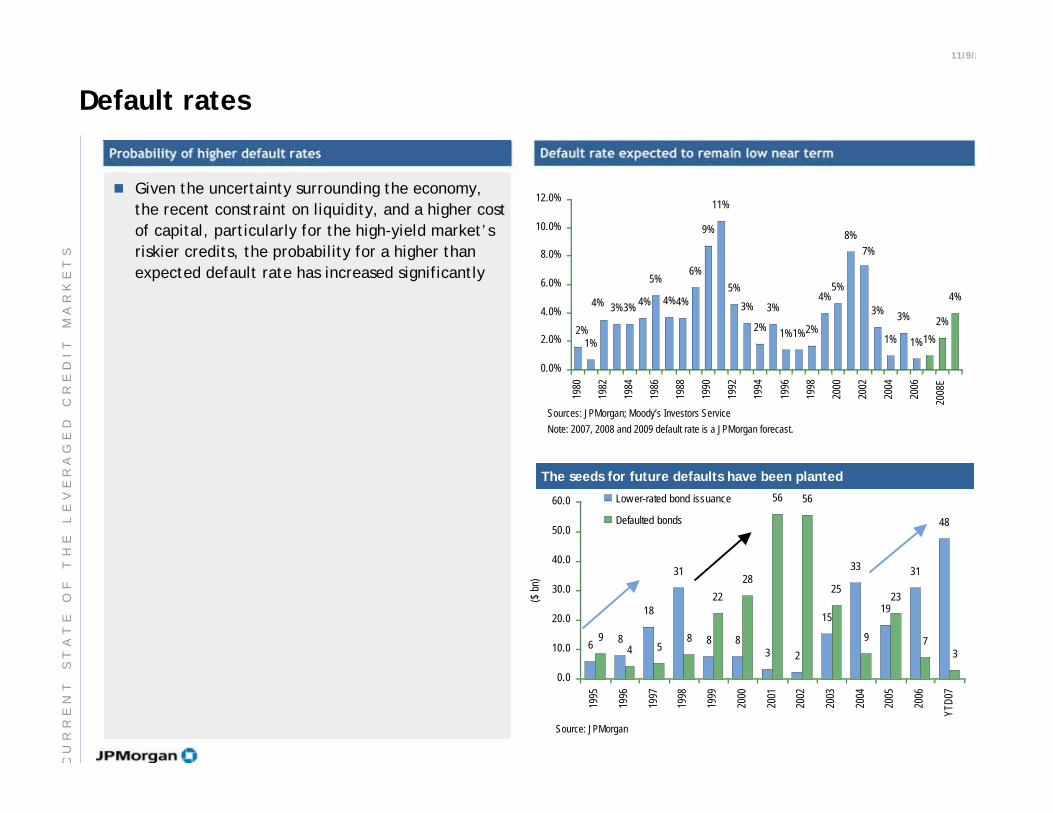
Default rates
Probability of higher default rates
Given the uncertainty surrounding the economy,
the recent constraint on liquidity, and a higher cost
of capital, particularly for the high-yield market’s
riskier credits, the probability for a higher than
expected default rate has increased significantly
11/9/2
Default rate expected to remain low near term
1%
3%3%
5%
4%4%
6%
9%
11%
5%
3%
2%
3%
1%1%2%
4%5%
8%
3%
1%
3%
1%1%
2%
4%
7%
4%4%
2%
0.0%
2.0%
4.0%
6.0%
8.0%
10.0%
12.0%
1980
1982
1984
1986
1988
1990
1992
1994
1996
1998
2000
2002
2004
2006
2008E
Sources: JPMorgan; Moody’s Investors Service
Note: 2007, 2008 and 2009 default rate is a JPMorgan forecast.
The seeds for future defaults have been planted
Source: JPMorgan
68
18
31
8 83 2
15
33
19
31
48
94 5
8
22
28
56 56
25
9
23
73
0.0
10.0
20.0
30.0
40.0
50.0
60.0
1995
1996
1997
1998
1999
2000
2001
2002
2003
2004
2005
2006
YTD
07
($ b
n)
Low er-rated bond issuance
Defaulted bonds
CU
RR
EN
T
ST
AT
E
OF
T
HE
L
EV
ER
AG
ED
C
RE
DI
T
MA
RK
ET
S
Agenda
Page
Qualifications
Structured Investment Vehicles (SIVs)
Case Study: Collins & Aikman
Case Study: Refco
Recent Trends in Distressed Solutions
Current State of the Leveraged Credit Markets
Leveraged Credit Market Dynamics
Distressed Debt Trading
What is Distressed Debt 2
8
11
15
22
25
27
38
47
DI
ST
RE
SS
ED
D
EB
T
TR
AD
IN
G
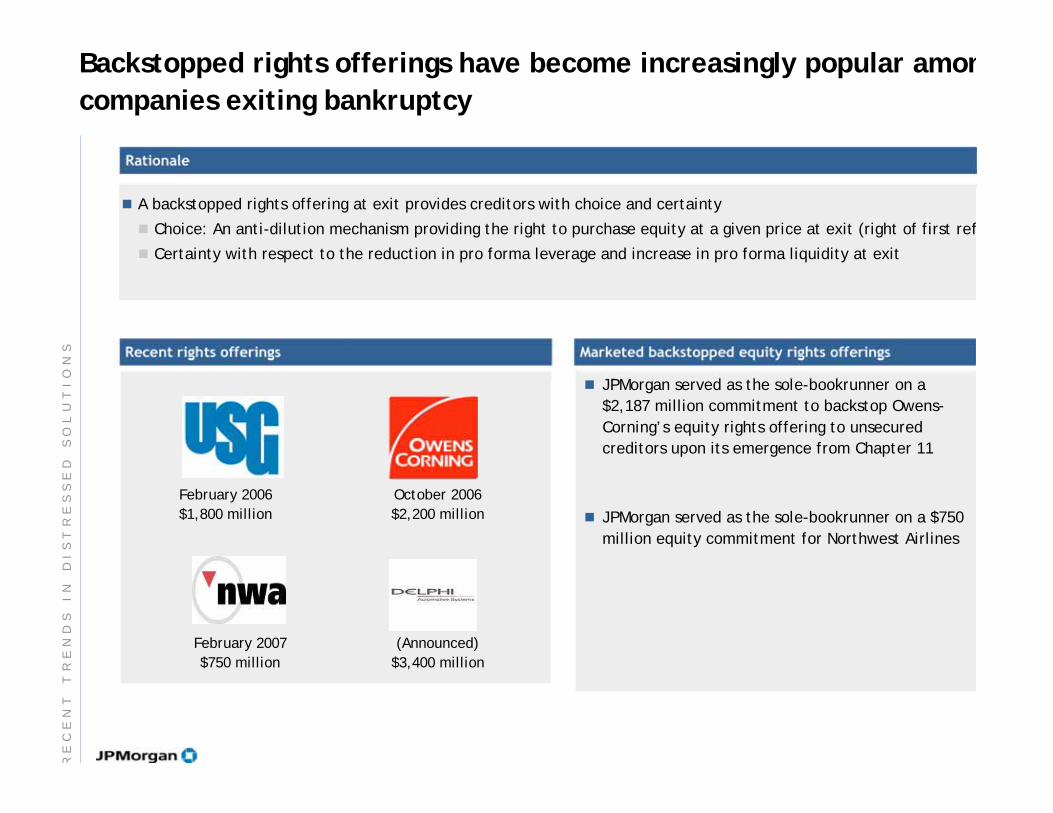
Backstopped rights offerings have become increasingly popular amon
companies exiting bankruptcy
A backstopped rights offering at exit provides creditors with choice and certainty
Choice: An anti-dilution mechanism providing the right to purchase equity at a given price at exit (right of first ref
Certainty with respect to the reduction in pro forma leverage and increase in pro forma liquidity at exit
Rationale
Marketed backstopped equity rights offerings
JPMorgan served as the sole-bookrunner on a
$2,187 million commitment to backstop Owens-
Corning’s equity rights offering to unsecured
creditors upon its emergence from Chapter 11
JPMorgan served as the sole-bookrunner on a $750
million equity commitment for Northwest Airlines
Recent rights offerings
February 2006
$1,800 million
October 2006
$2,200 million
February 2007
$750 million
(Announced)
$3,400 million
RE
CE
NT
T
RE
ND
S
IN
D
IS
TR
ES
SE
D
SO
LU
TI
ON
S
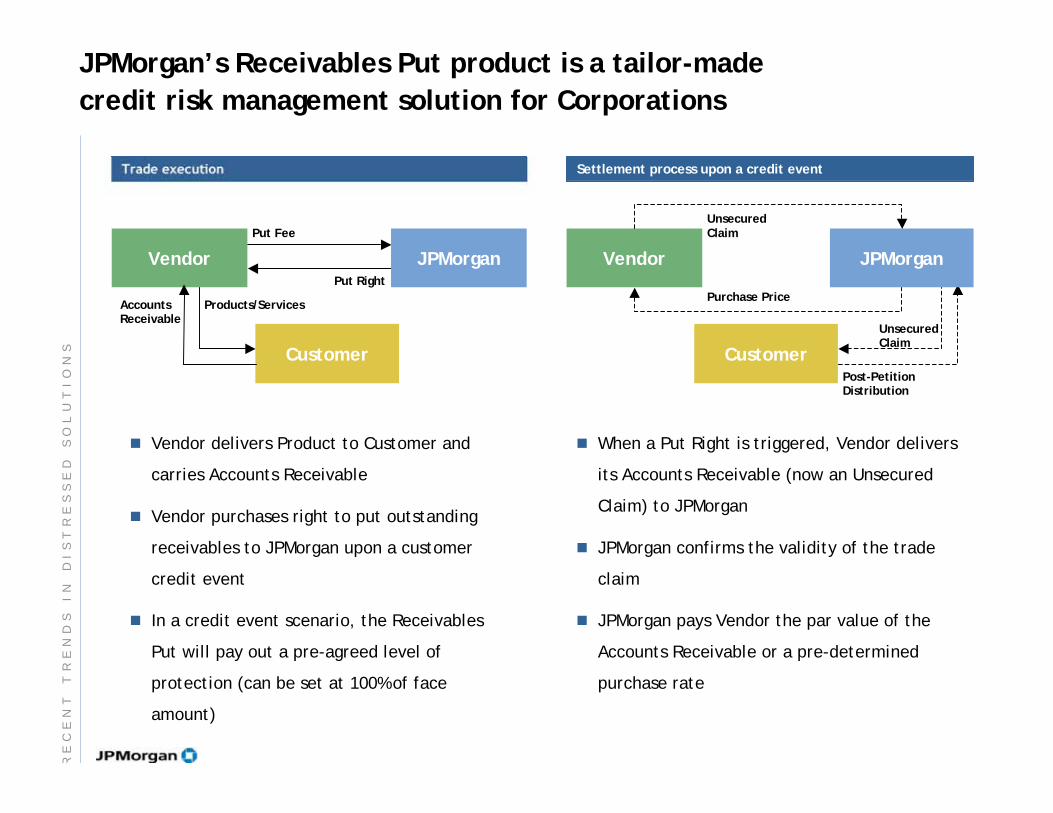
Trade execution Settlement process upon a credit event
JPMorgan’s Receivables Put product is a tailor-made
credit risk management solution for Corporations
Vendor delivers Product to Customer and
carries Accounts Receivable
Vendor purchases right to put outstanding
receivables to JPMorgan upon a customer
credit event
In a credit event scenario, the Receivables
Put will pay out a pre-agreed level of
protection (can be set at 100% of face
amount)
When a Put Right is triggered, Vendor delivers
its Accounts Receivable (now an Unsecured
Claim) to JPMorgan
JPMorgan confirms the validity of the trade
claim
JPMorgan pays Vendor the par value of the
Accounts Receivable or a pre-determined
purchase rate
Customer
AccountsReceivable
Put Right
Put Fee
Vendor JPMorgan
Products/Services
UnsecuredClaim
Post-PetitionDistribution
Purchase Price
Vendor JPMorgan
Customer
UnsecuredClaim
RE
CE
NT
T
RE
ND
S
IN
D
IS
TR
ES
SE
D
SO
LU
TI
ON
S
Agenda
Page
Qualifications
Structured Investment Vehicles (SIVs)
Case Study: Collins & Aikman
Case Study: Refco
Recent Trends in Distressed Solutions
Current State of the Leveraged Credit Markets
Leveraged Credit Market Dynamics
Distressed Debt Trading
What is Distressed Debt 2
8
11
15
22
25
27
38
47
DI
ST
RE
SS
ED
D
EB
T
TR
AD
IN
G
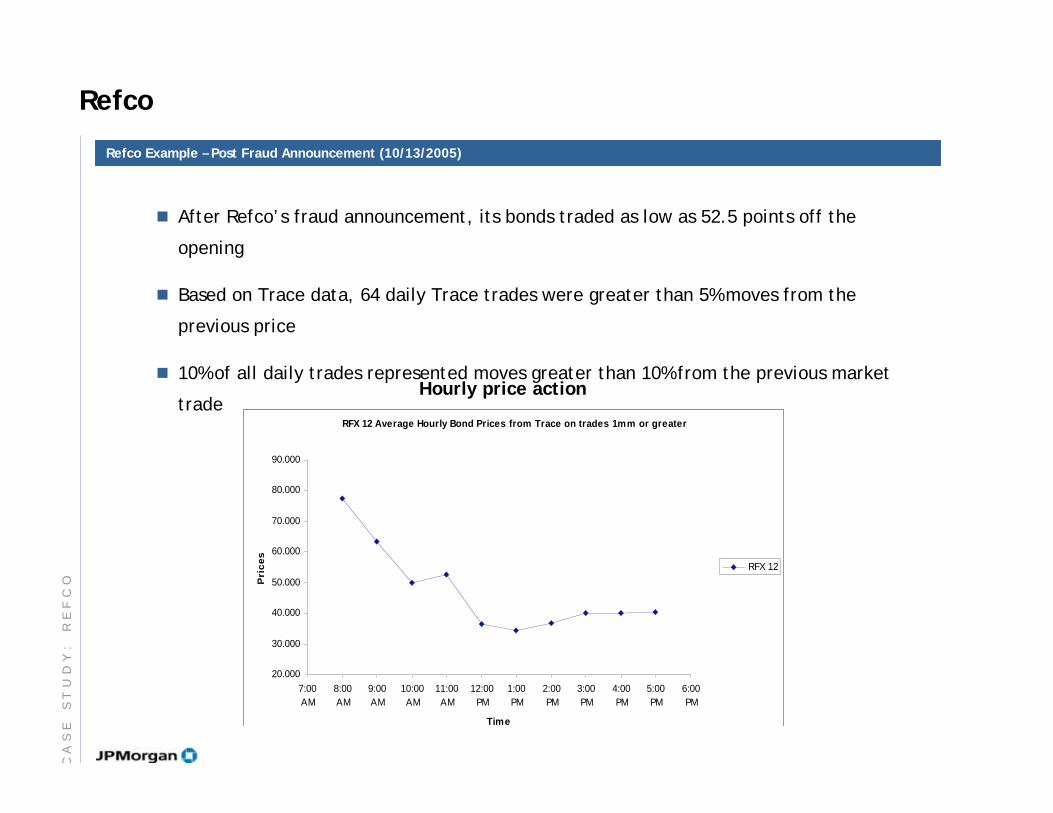
After Refco’s fraud announcement, its bonds traded as low as 52.5 points off the
opening
Based on Trace data, 64 daily Trace trades were greater than 5% moves from the
previous price
10% of all daily trades represented moves greater than 10% from the previous market
trade
Refco Example – Post Fraud Announcement (10/13/2005)
RFX 12 Average Hourly Bond Prices from Trace on trades 1mm or greater
20.000
30.000
40.000
50.000
60.000
70.000
80.000
90.000
7:00
AM
8:00
AM
9:00
AM
10:00
AM
11:00
AM
12:00
PM
1:00
PM
2:00
PM
3:00
PM
4:00
PM
5:00
PM
6:00
PM
Time
Pri
ce
s
RFX 12
Hourly price action
Refco
CA
SE
S
TU
DY
:
RE
FC
O
Agenda
Page
Qualifications
Structured Investment Vehicles (SIVs)
Case Study: Collins & Aikman
Case Study: Refco
Recent Trends in Distressed Solutions
Current State of the Leveraged Credit Markets
Leveraged Credit Market Dynamics
Distressed Debt Trading
What is Distressed Debt 2
8
11
15
22
25
27
38
47
DI
ST
RE
SS
ED
D
EB
T
TR
AD
IN
G
Executive Summary
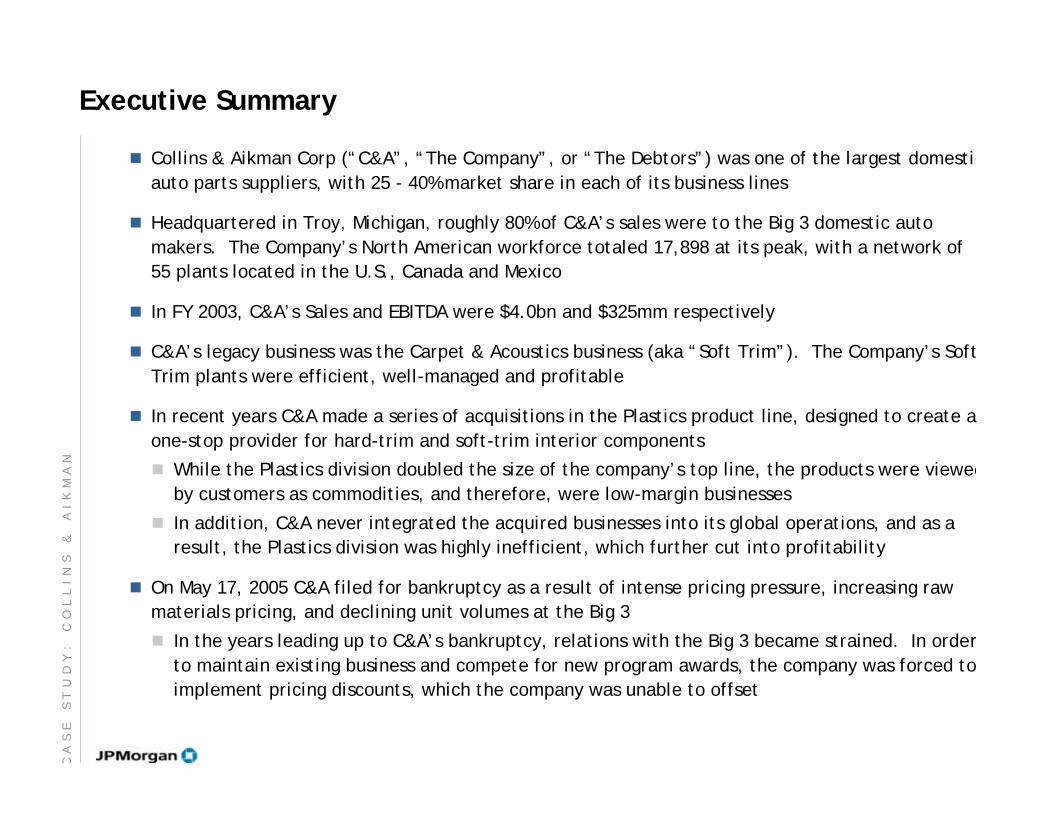
Collins & Aikman Corp (“C&A”, “The Company”, or “The Debtors”) was one of the largest domestic
auto parts suppliers, with 25 - 40% market share in each of its business lines
Headquartered in Troy, Michigan, roughly 80% of C&A’s sales were to the Big 3 domestic auto
makers. The Company’s North American workforce totaled 17,898 at its peak, with a network of
55 plants located in the U.S., Canada and Mexico
In FY 2003, C&A’s Sales and EBITDA were $4.0bn and $325mm respectively
C&A’s legacy business was the Carpet & Acoustics business (aka “Soft Trim”). The Company’s Soft
Trim plants were efficient, well-managed and profitable
In recent years C&A made a series of acquisitions in the Plastics product line, designed to create a
one-stop provider for hard-trim and soft-trim interior components
While the Plastics division doubled the size of the company’s top line, the products were viewed
by customers as commodities, and therefore, were low-margin businesses
In addition, C&A never integrated the acquired businesses into its global operations, and as a
result, the Plastics division was highly inefficient, which further cut into profitability
On May 17, 2005 C&A filed for bankruptcy as a result of intense pricing pressure, increasing raw
materials pricing, and declining unit volumes at the Big 3
In the years leading up to C&A’s bankruptcy, relations with the Big 3 became strained. In order
to maintain existing business and compete for new program awards, the company was forced to
implement pricing discounts, which the company was unable to offset
CA
SE
S
TU
DY
:
CO
LL
IN
S
&
AI
KM
AN

C&A’s Products
Plastics Division
Instrument Panels
Cockpits
Air vents
Cockpit module assemblies
Door, Interior and Exterior
Trim
Hard door panel substrates
Speaker grilles
Carpet & Acoustics Division (“Soft Trim”)
Floor Carpet Alternative Flooring Luggage Trim
Other Products
Fabrics Convertible Syst
Automotive seat and door fabrics
Headliners
Specialty fabrics, including casket l
paint roller covers and furniture ve
Soft-top convertible roof systems
Molded Floor Systems
Automotive Accessory Floormats
Luggage Compartment Trim
Interior Dash Insulators
Package Tray
CA
SE
S
TU
DY
:
CO
LL
IN
S
&
AI
KM
AN
Failed Restructuring Attempts
While in bankruptcy, the Company’s restructuring advisors made several attempts to restructure
the business as a going concern
The turnaround plan centered around the advisors’ beliefs that the Plastics division could return to
profitability by eliminating its high fixed cost structure and becoming a low-cost operator, while
Soft Trim maintained its leading competitive position and EBITDA margins
Despite several attempts, in October 2006, C&A’s stakeholders agreed that fixing the problems in
Plastics was impossible given the timeframe and funding requirements
On October 26, 2006, C&A reported to the bankruptcy court that it was unable to reach an
agreement to enable a Plan of Reorganization. As a result, the Debtors began liquidating the
business by actively marketing the individual segments to potential purchasers
Ultimately C&A’s Soft Trim business was sold to IAC North America, LLC (“IAC”), a company run by
Wilbur Ross, which is now comprised of the former Soft Trim assets of both Lear and C&A
C&A’s pre-petition lenders were given the right to purchase up to 25% of the equity of IAC
After a failed attempt to sell the Plastics business to Cadence Innovation, most of the Plastics
plants and other C&A assets were shut down in July 2007. Some plants and remaining assets
were sold piecemeal or are in process of being sold for de minimus value
CA
SE
S
TU
DY
:
CO
LL
IN
S
&
AI
KM
AN
30
40
50
60
70
80
90
100
12/31/04 4/7/05 7/13/05 10/18/05 1/24/06 5/1/06 8/6/06 11/12/06 2/17/07 5/25/07 8/31/07
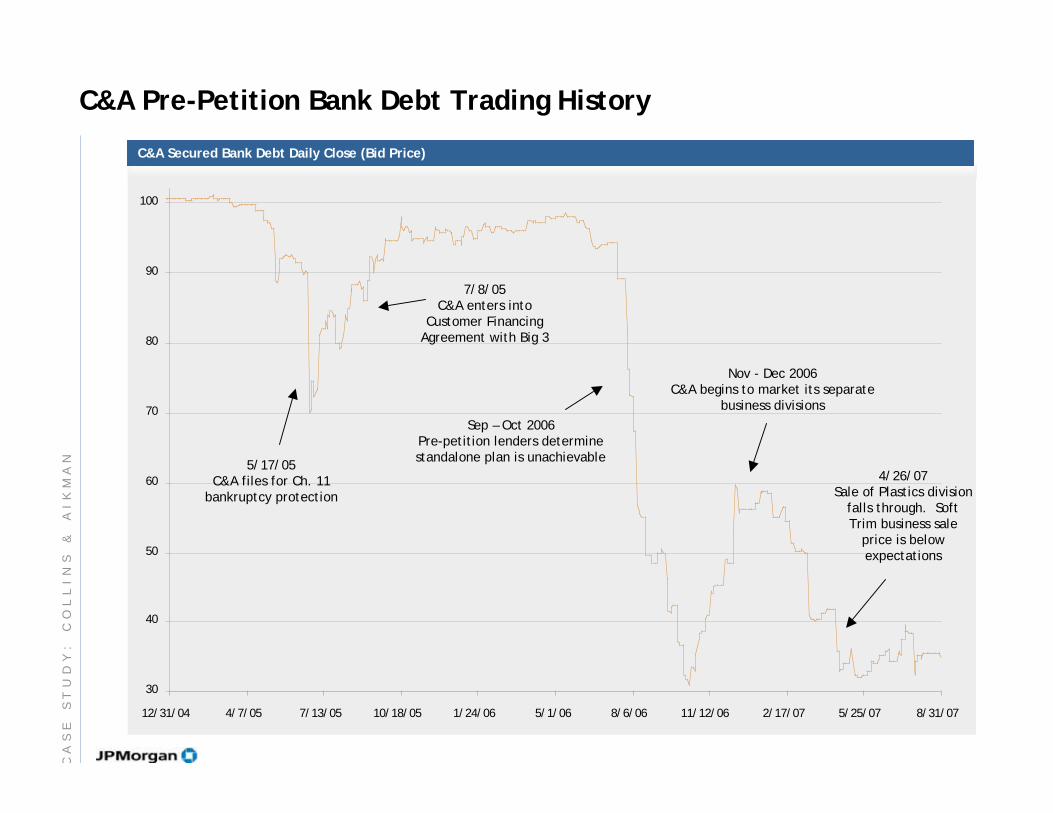
C&A Secured Bank Debt Daily Close (Bid Price)
C&A Pre-Petition Bank Debt Trading History
5/17/05C&A files for Ch. 11
bankruptcy protection
Sep – Oct 2006Pre-petition lenders determinestandalone plan is unachievable
Nov - Dec 2006C&A begins to market its separate
business divisions
4/26/07Sale of Plastics division
falls through. SoftTrim business sale
price is belowexpectations
7/8/05C&A enters into
Customer FinancingAgreement with Big 3
CA
SE
S
TU
DY
:
CO
LL
IN
S
&
AI
KM
AN
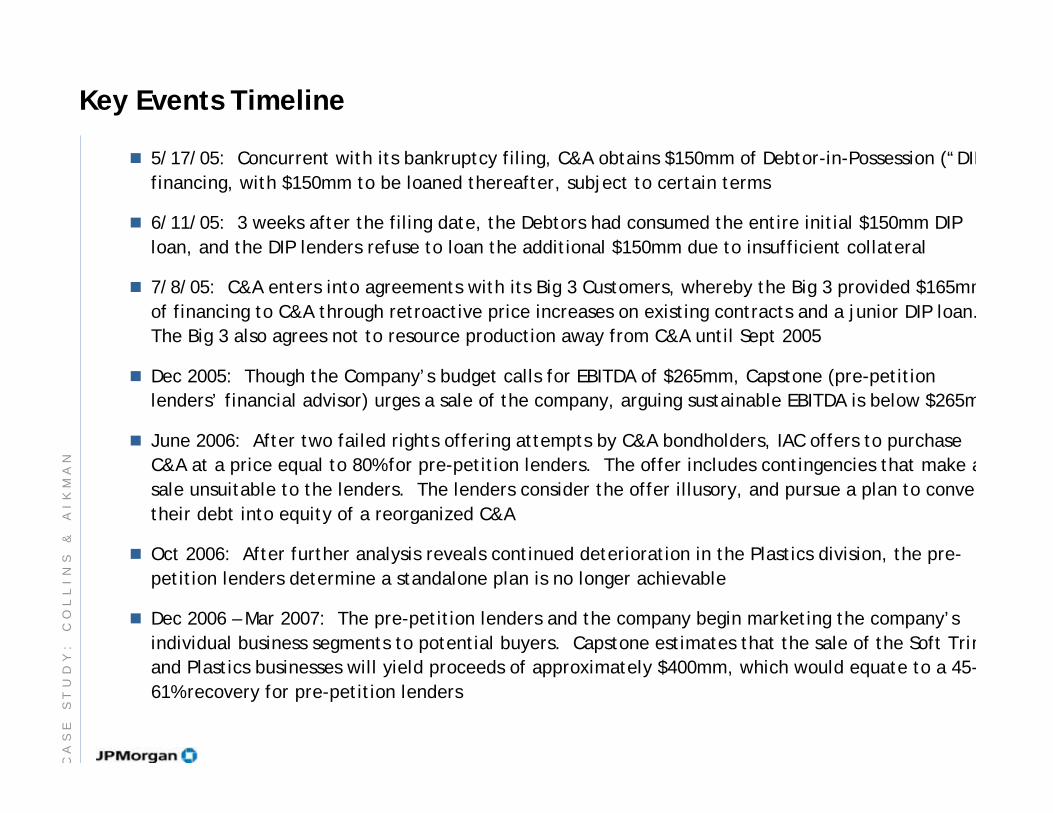
Key Events Timeline
5/17/05: Concurrent with its bankruptcy filing, C&A obtains $150mm of Debtor-in-Possession (“DIP
financing, with $150mm to be loaned thereafter, subject to certain terms
6/11/05: 3 weeks after the filing date, the Debtors had consumed the entire initial $150mm DIP
loan, and the DIP lenders refuse to loan the additional $150mm due to insufficient collateral
7/8/05: C&A enters into agreements with its Big 3 Customers, whereby the Big 3 provided $165mm
of financing to C&A through retroactive price increases on existing contracts and a junior DIP loan.
The Big 3 also agrees not to resource production away from C&A until Sept 2005
Dec 2005: Though the Company’s budget calls for EBITDA of $265mm, Capstone (pre-petition
lenders’ financial advisor) urges a sale of the company, arguing sustainable EBITDA is below $265m
June 2006: After two failed rights offering attempts by C&A bondholders, IAC offers to purchase
C&A at a price equal to 80% for pre-petition lenders. The offer includes contingencies that make a
sale unsuitable to the lenders. The lenders consider the offer illusory, and pursue a plan to conve
their debt into equity of a reorganized C&A
Oct 2006: After further analysis reveals continued deterioration in the Plastics division, the pre-
petition lenders determine a standalone plan is no longer achievable
Dec 2006 – Mar 2007: The pre-petition lenders and the company begin marketing the company’s
individual business segments to potential buyers. Capstone estimates that the sale of the Soft Trim
and Plastics businesses will yield proceeds of approximately $400mm, which would equate to a 45-
61% recovery for pre-petition lenders
CA
SE
S
TU
DY
:
CO
LL
IN
S
&
AI
KM
AN
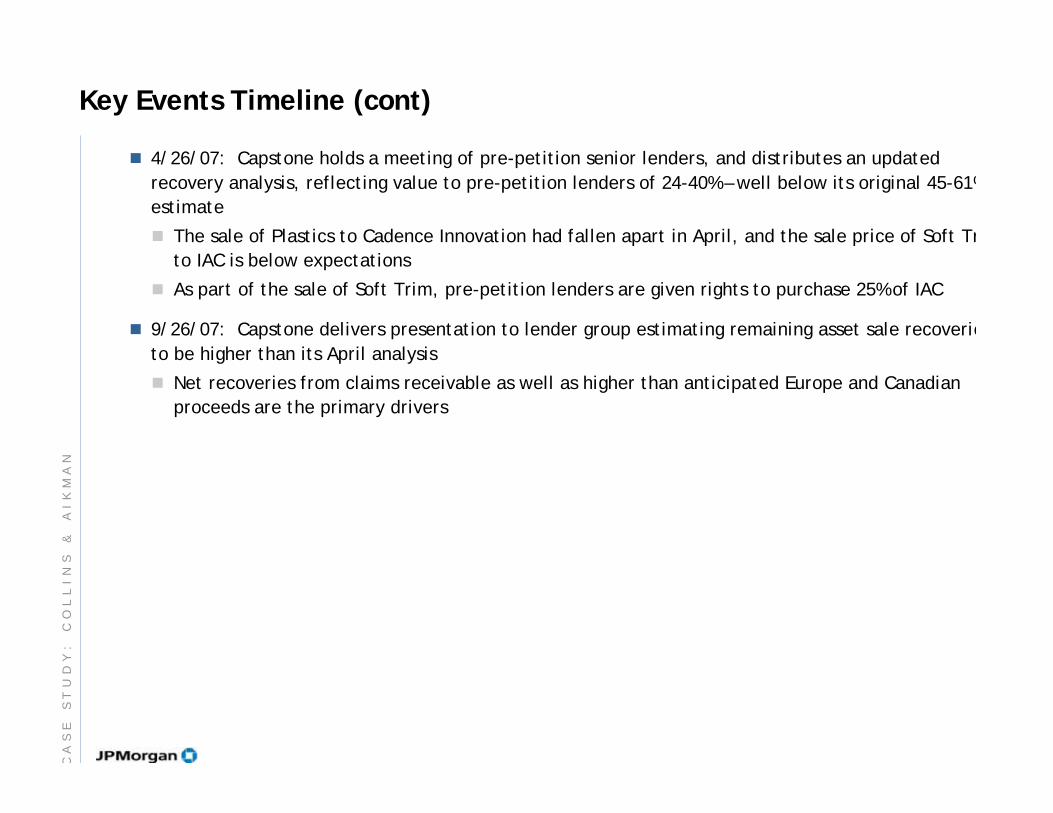
Key Events Timeline (cont)
4/26/07: Capstone holds a meeting of pre-petition senior lenders, and distributes an updated
recovery analysis, reflecting value to pre-petition lenders of 24-40% – well below its original 45-61%
estimate
The sale of Plastics to Cadence Innovation had fallen apart in April, and the sale price of Soft Tr
to IAC is below expectations
As part of the sale of Soft Trim, pre-petition lenders are given rights to purchase 25% of IAC
9/26/07: Capstone delivers presentation to lender group estimating remaining asset sale recoverie
to be higher than its April analysis
Net recoveries from claims receivable as well as higher than anticipated Europe and Canadian
proceeds are the primary drivers
CA
SE
S
TU
DY
:
CO
LL
IN
S
&
AI
KM
AN
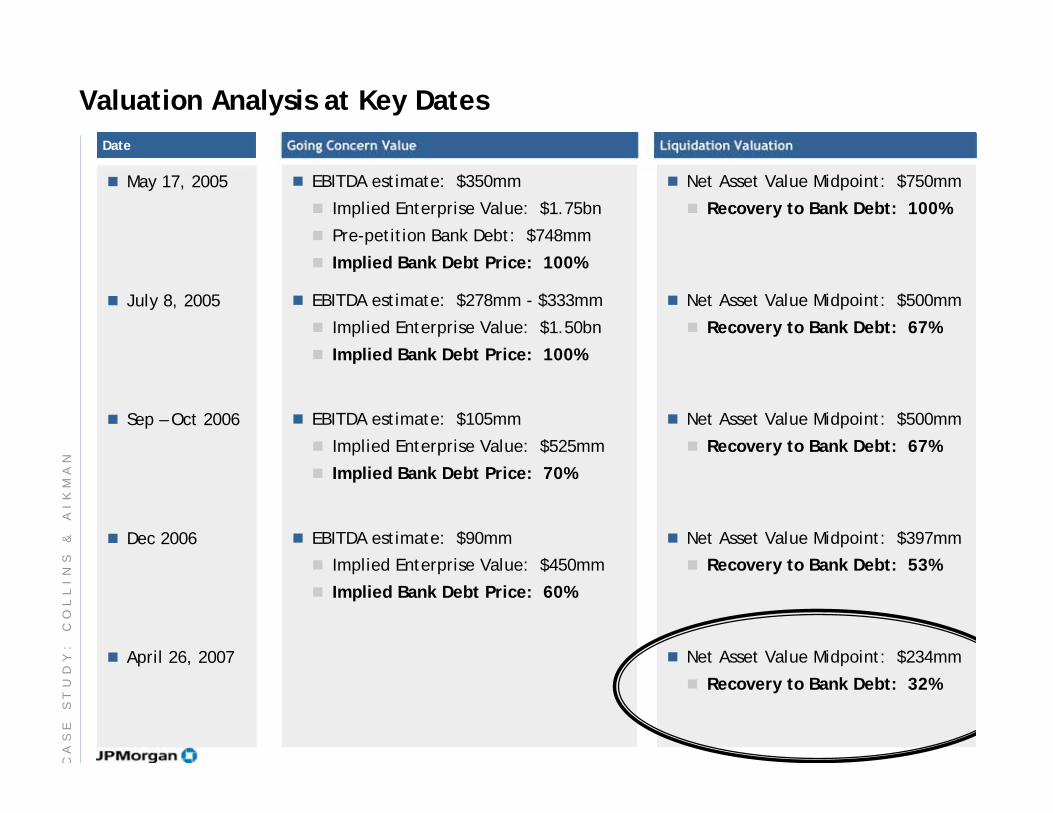
Valuation Analysis at Key Dates
Going Concern Value Liquidation Valuation
May 17, 2005
July 8, 2005
Sep – Oct 2006
Dec 2006
April 26, 2007
Date
EBITDA estimate: $350mm
Implied Enterprise Value: $1.75bn
Pre-petition Bank Debt: $748mm
Implied Bank Debt Price: 100%
EBITDA estimate: $278mm - $333mm
Implied Enterprise Value: $1.50bn
Implied Bank Debt Price: 100%
EBITDA estimate: $105mm
Implied Enterprise Value: $525mm
Implied Bank Debt Price: 70%
EBITDA estimate: $90mm
Implied Enterprise Value: $450mm
Implied Bank Debt Price: 60%
Net Asset Value Midpoint: $750mm
Recovery to Bank Debt: 100%
Net Asset Value Midpoint: $500mm
Recovery to Bank Debt: 67%
Net Asset Value Midpoint: $500mm
Recovery to Bank Debt: 67%
Net Asset Value Midpoint: $397mm
Recovery to Bank Debt: 53%
Net Asset Value Midpoint: $234mm
Recovery to Bank Debt: 32%
CA
SE
S
TU
DY
:
CO
LL
IN
S
&
AI
KM
AN
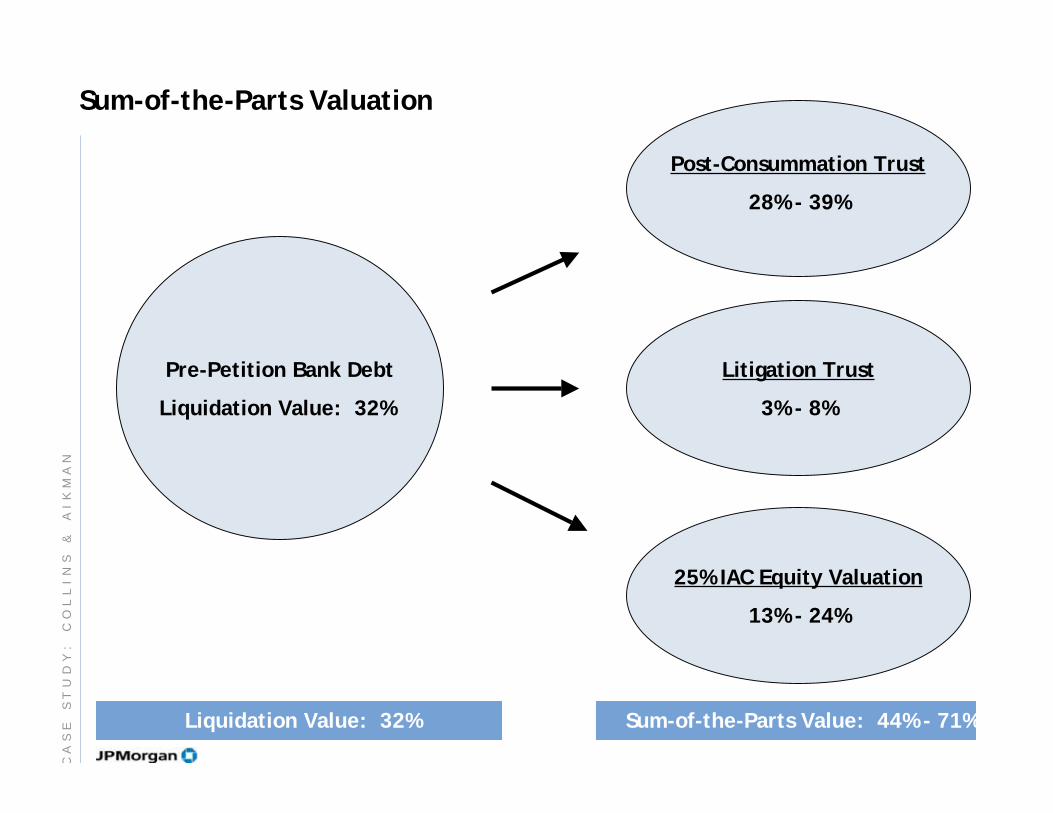
Sum-of-the-Parts Valuation
Pre-Petition Bank Debt
Liquidation Value: 32%
Post-Consummation Trust
28% - 39%
Litigation Trust
3% - 8%
25% IAC Equity Valuation
13% - 24%
Sum-of-the-Parts Value: 44% - 71%Liquidation Value: 32%
CA
SE
S
TU
DY
:
CO
LL
IN
S
&
AI
KM
AN
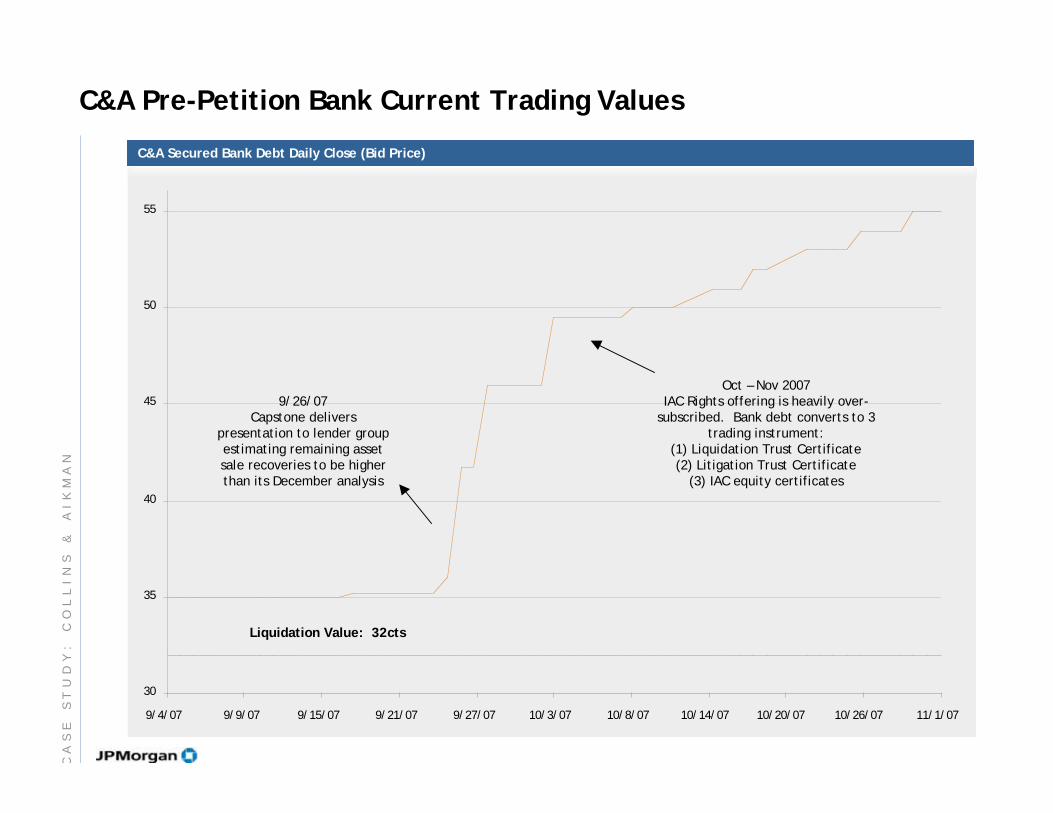
30
35
40
45
50
55
9/4/07 9/9/07 9/15/07 9/21/07 9/27/07 10/3/07 10/8/07 10/14/07 10/20/07 10/26/07 11/1/07
C&A Secured Bank Debt Daily Close (Bid Price)
C&A Pre-Petition Bank Current Trading Values
9/26/07Capstone delivers
presentation to lender groupestimating remaining assetsale recoveries to be higherthan its December analysis
Liquidation Value: 32cts
Oct – Nov 2007IAC Rights offering is heavily over-
subscribed. Bank debt converts to 3trading instrument:
(1) Liquidation Trust Certificate(2) Litigation Trust Certificate
(3) IAC equity certificates
CA
SE
S
TU
DY
:
CO
LL
IN
S
&
AI
KM
AN
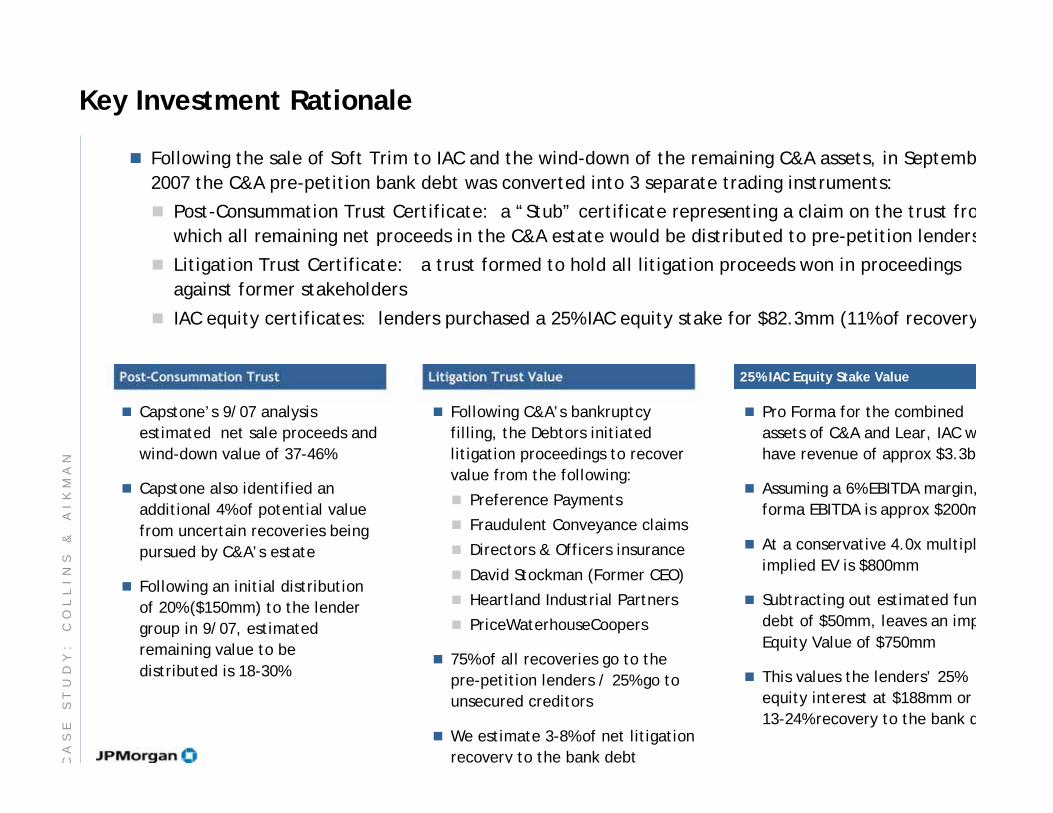
Key Investment Rationale
Following the sale of Soft Trim to IAC and the wind-down of the remaining C&A assets, in Septemb
2007 the C&A pre-petition bank debt was converted into 3 separate trading instruments:
Post-Consummation Trust Certificate: a “Stub” certificate representing a claim on the trust fro
which all remaining net proceeds in the C&A estate would be distributed to pre-petition lenders
Litigation Trust Certificate: a trust formed to hold all litigation proceeds won in proceedings
against former stakeholders
IAC equity certificates: lenders purchased a 25% IAC equity stake for $82.3mm (11% of recovery
Capstone’s 9/07 analysis
estimated net sale proceeds and
wind-down value of 37-46%
Capstone also identified an
additional 4% of potential value
from uncertain recoveries being
pursued by C&A’s estate
Following an initial distribution
of 20% ($150mm) to the lender
group in 9/07, estimated
remaining value to be
distributed is 18-30%
Following C&A’s bankruptcy
filling, the Debtors initiated
litigation proceedings to recover
value from the following:
Preference Payments
Fraudulent Conveyance claims
Directors & Officers insurance
David Stockman (Former CEO)
Heartland Industrial Partners
PriceWaterhouseCoopers
75% of all recoveries go to the
pre-petition lenders / 25% go to
unsecured creditors
We estimate 3-8% of net litigation
recovery to the bank debt
Pro Forma for the combined
assets of C&A and Lear, IAC w
have revenue of approx $3.3b
Assuming a 6% EBITDA margin,
forma EBITDA is approx $200m
At a conservative 4.0x multipl
implied EV is $800mm
Subtracting out estimated fun
debt of $50mm, leaves an imp
Equity Value of $750mm
This values the lenders’ 25%
equity interest at $188mm or
13-24% recovery to the bank d
Post-Consummation Trust Litigation Trust Value 25% IAC Equity Stake Value
CA
SE
S
TU
DY
:
CO
LL
IN
S
&
AI
KM
AN
Agenda
Page
Qualifications
Structured Investment Vehicles (SIVs)
Case Study: Collins & Aikman
Case Study: Refco
Recent Trends in Distressed Solutions
Current State of the Leveraged Credit Markets
Leveraged Credit Market Dynamics
Distressed Debt Trading
What is Distressed Debt 2
8
11
15
22
25
27
38
47
DI
ST
RE
SS
ED
D
EB
T
TR
AD
IN
G
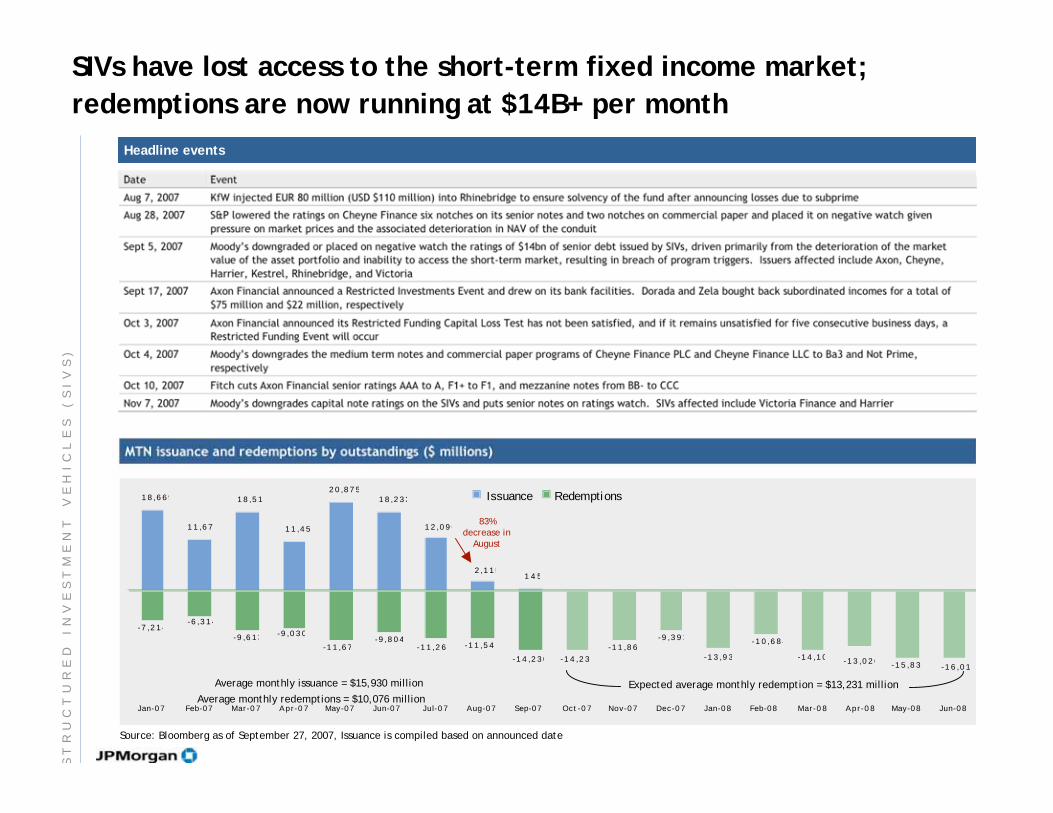
1452,115
12,096
18,23320,875
11,45
18,51
11,67
18,669
-16,01-15,83-13,026-14,10
-10,684
-13,93
-9,391-11,86
-14,23-14,230
-11,54-11,26-9,804
-11,67
-9,030-9,613
-6,314-7,214
Jan-07 Feb-07 Mar-07 Apr-07 May-07 Jun-07 Jul-07 Aug-07 Sep-07 Oct-07 Nov-07 Dec-07 Jan-08 Feb-08 Mar-08 Apr-08 May-08 Jun-08
Issuance Redemptions
MTN issuance and redemptions by outstandings ($ millions)
83%decrease in
August
SIVs have lost access to the short-term fixed income market;
redemptions are now running at $14B+ per month
Average monthly issuance = $15,930 million
Average monthly redemptions = $10,076 million
Source: Bloomberg as of September 27, 2007, Issuance is compiled based on announced date
Expected average monthly redemption = $13,231 million
Headline events
ST
RU
CT
UR
ED
I
NV
ES
TM
EN
T
VE
HI
CL
ES
(
SI
VS
)
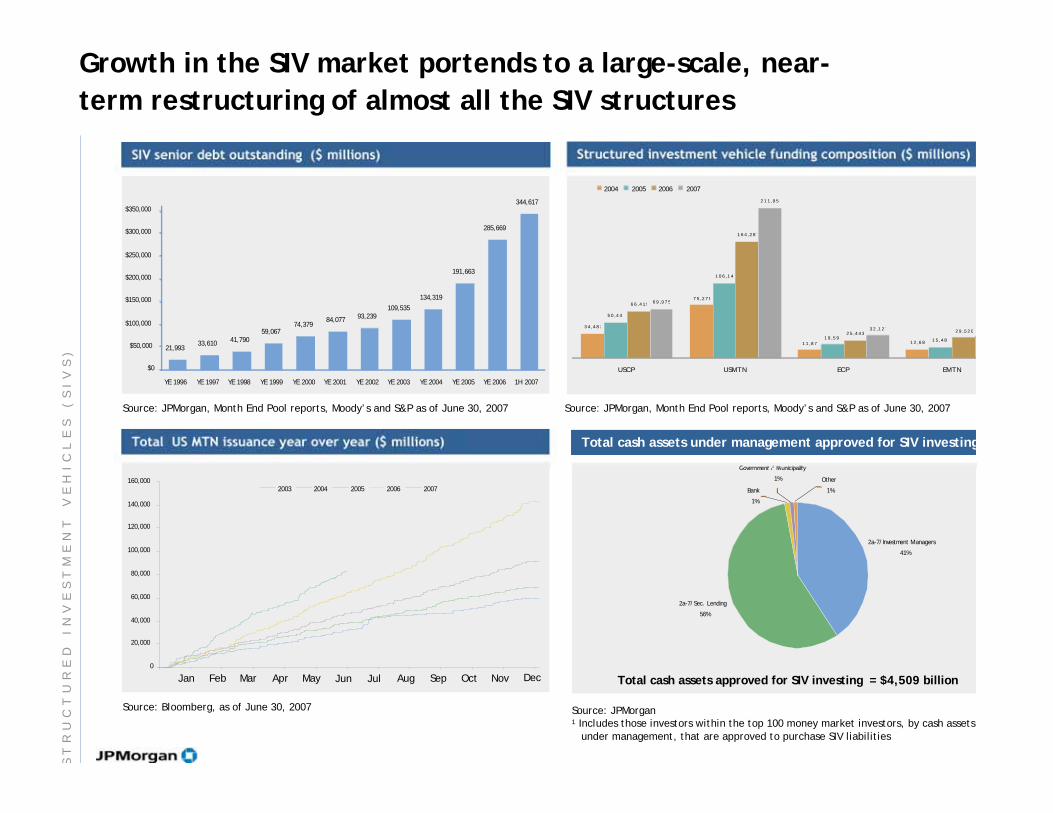
34,487
75,275
11,87 12,685
50,441
106,14
19,59615,486
66,419
164,287
25,44329,520
69,975
211,95
32,127
USCP USMTN ECP EMTN
2004 2005 2006 2007
Growth in the SIV market portends to a large-scale, near-
term restructuring of almost all the SIV structures
0
20,000
40,000
60,000
80,000
100,000
120,000
140,000
160,000
2003 2004 2005 2006 2007
SIV senior debt outstanding ($ millions)
Source: JPMorgan1 Includes those investors within the top 100 money market investors, by cash assets
under management, that are approved to purchase SIV liabilities
Total US MTN issuance year over year ($ millions)
Source: Bloomberg, as of June 30, 2007
Structured investment vehicle funding composition ($ millions)
Jan Feb AprMar May Jun AugJul Sep Oct DecNov
2a-7/Investment Managers
41%
2a-7/Sec. Lending
56%
Bank
1%
Government / Municipality
1% Other
1%
Total cash assets under management approved for SIV investing
Total cash assets approved for SIV investing = $4,509 billion
21,99333,610
41,79059,067
74,37984,077
93,239109,535
191,663
285,669
134,319
344,617
$0
$50,000
$100,000
$150,000
$200,000
$250,000
$300,000
$350,000
YE 1996 YE 1997 YE 1998 YE 1999 YE 2000 YE 2001 YE 2002 YE 2003 YE 2004 YE 2005 YE 2006 1H 2007
Source: JPMorgan, Month End Pool reports, Moody’s and S&P as of June 30, 2007 Source: JPMorgan, Month End Pool reports, Moody’s and S&P as of June 30, 2007
ST
RU
CT
UR
ED
I
NV
ES
TM
EN
T
VE
HI
CL
ES
(
SI
VS
)
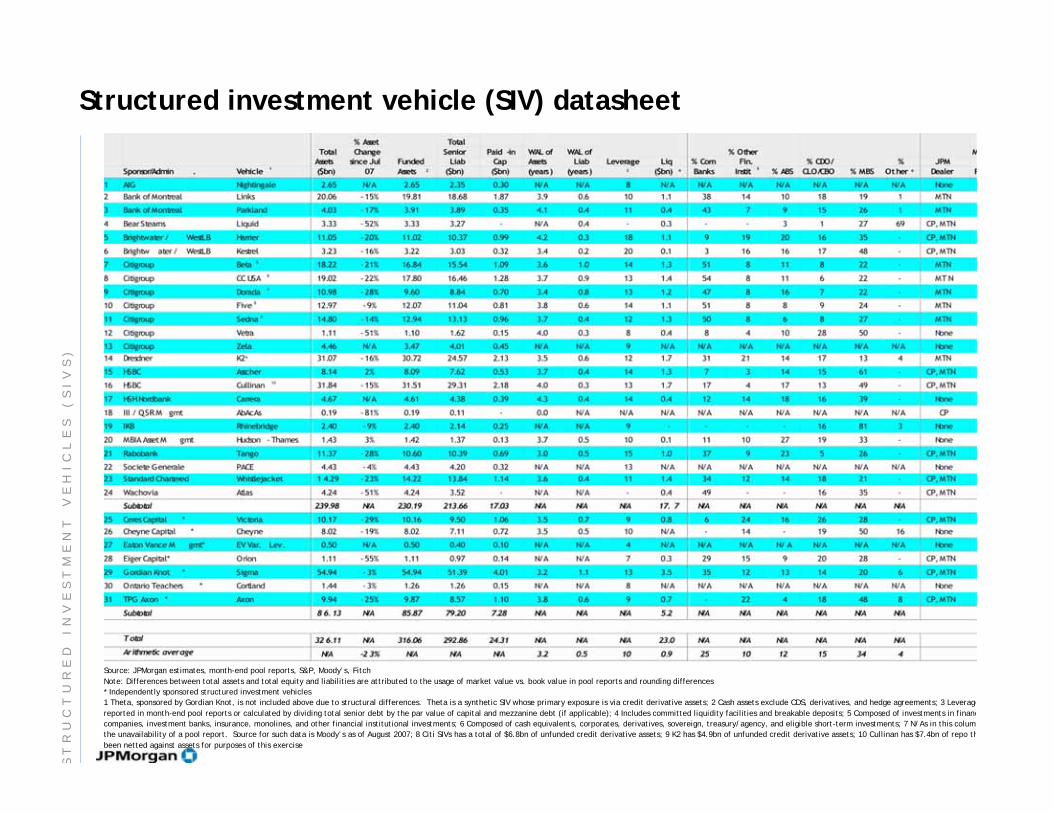
Structured investment vehicle (SIV) datasheet
Source: JPMorgan estimates, month-end pool reports, S&P, Moody’s, Fitch
Note: Differences between total assets and total equity and liabilities are attributed to the usage of market value vs. book value in pool reports and rounding differences
* Independently sponsored structured investment vehicles
1 Theta, sponsored by Gordian Knot, is not included above due to structural differences. Theta is a synthetic SIV whose primary exposure is via credit derivative assets; 2 Cash assets exclude CDS, derivatives, and hedge agreements; 3 Leverage
reported in month-end pool reports or calculated by dividing total senior debt by the par value of capital and mezzanine debt (if applicable); 4 Includes committed liquidity facilities and breakable deposits; 5 Composed of investments in financ
companies, investment banks, insurance, monolines, and other financial institutional investments; 6 Composed of cash equivalents, corporates, derivatives, sovereign, treasury/agency, and eligible short-term investments; 7 N/As in this colum
the unavailability of a pool report. Source for such data is Moody’s as of August 2007; 8 Citi SIVs has a total of $6.8bn of unfunded credit derivative assets; 9 K2 has $4.9bn of unfunded credit derivative assets; 10 Cullinan has $7.4bn of repo th
been netted against assets for purposes of this exercise
ST
RU
CT
UR
ED
I
NV
ES
TM
EN
T
VE
HI
CL
ES
(
SI
VS
)
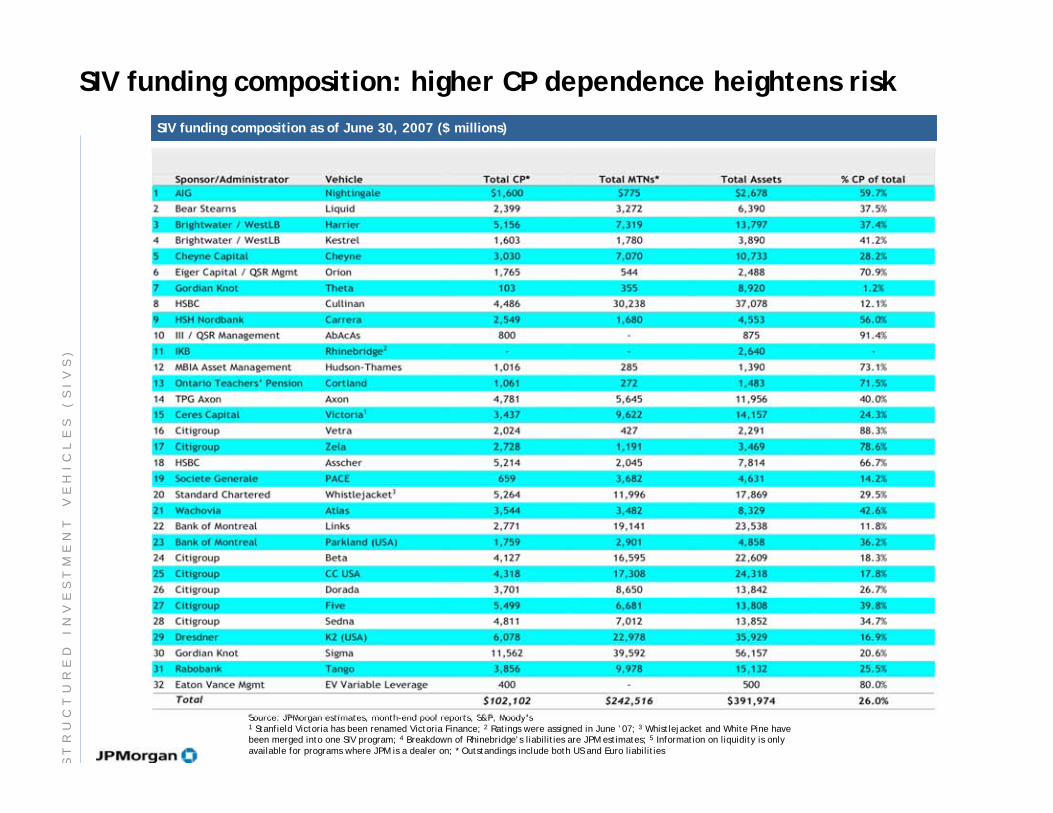
SIV funding composition: higher CP dependence heightens risk
Source: JPMorgan estimates, month-end pool reports, S&P, Moody’s1 Stanfield Victoria has been renamed Victoria Finance; 2 Ratings were assigned in June ’07; 3 Whistlejacket and White Pine havebeen merged into one SIV program; 4 Breakdown of Rhinebridge’s liabilities are JPM estimates; 5 Information on liquidity is onlyavailable for programs where JPM is a dealer on; * Outstandings include both US and Euro liabilities
SIV funding composition as of June 30, 2007 ($ millions)
ST
RU
CT
UR
ED
I
NV
ES
TM
EN
T
VE
HI
CL
ES
(
SI
VS
)
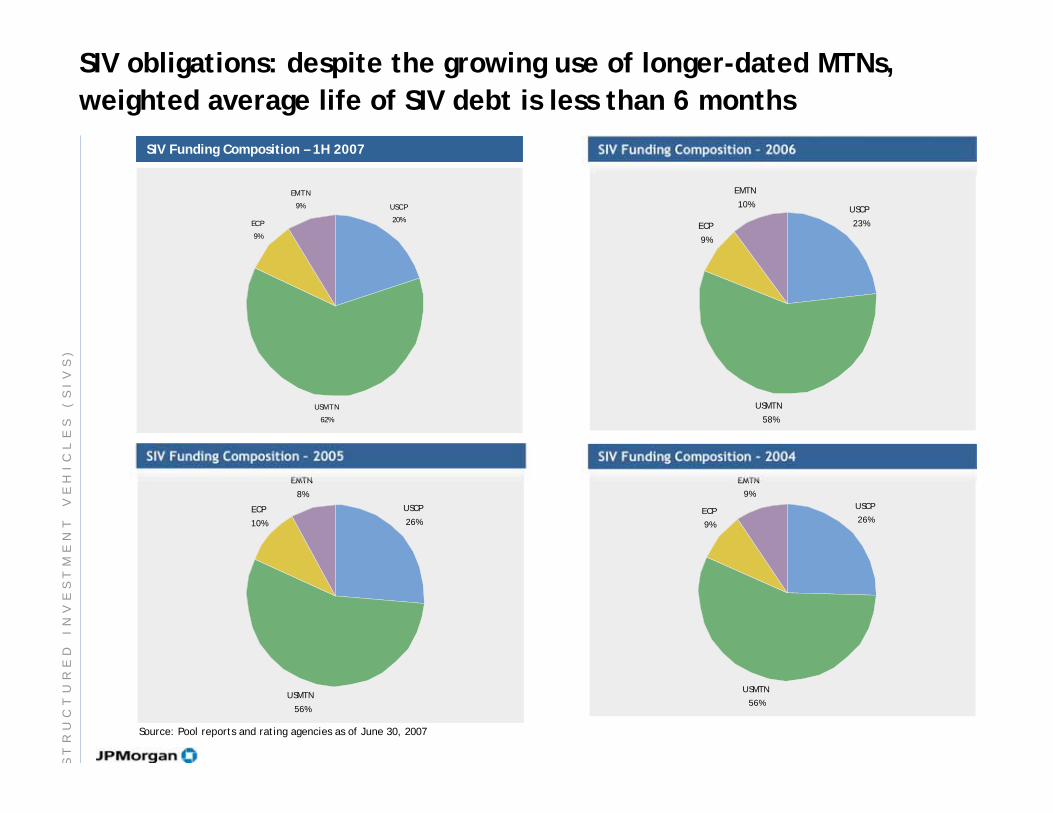
SIV obligations: despite the growing use of longer-dated MTNs,
weighted average life of SIV debt is less than 6 months
USCP
26%
ECP
9%
EMTN
9%
USMTN
56%
SIV Funding Composition - 2004
USCP
23%ECP
9%
EMTN
10%
USMTN
58%
SIV Funding Composition – 2006
USCP
26%
ECP
10%
EMTN
8%
USMTN
56%
SIV Funding Composition – 2005
Source: Pool reports and rating agencies as of June 30, 2007
SIV Funding Composition – 1H 2007
USCP
20%
USMTN
62%
ECP
9%
EMTN
9%
ST
RU
CT
UR
ED
I
NV
ES
TM
EN
T
VE
HI
CL
ES
(
SI
VS
)
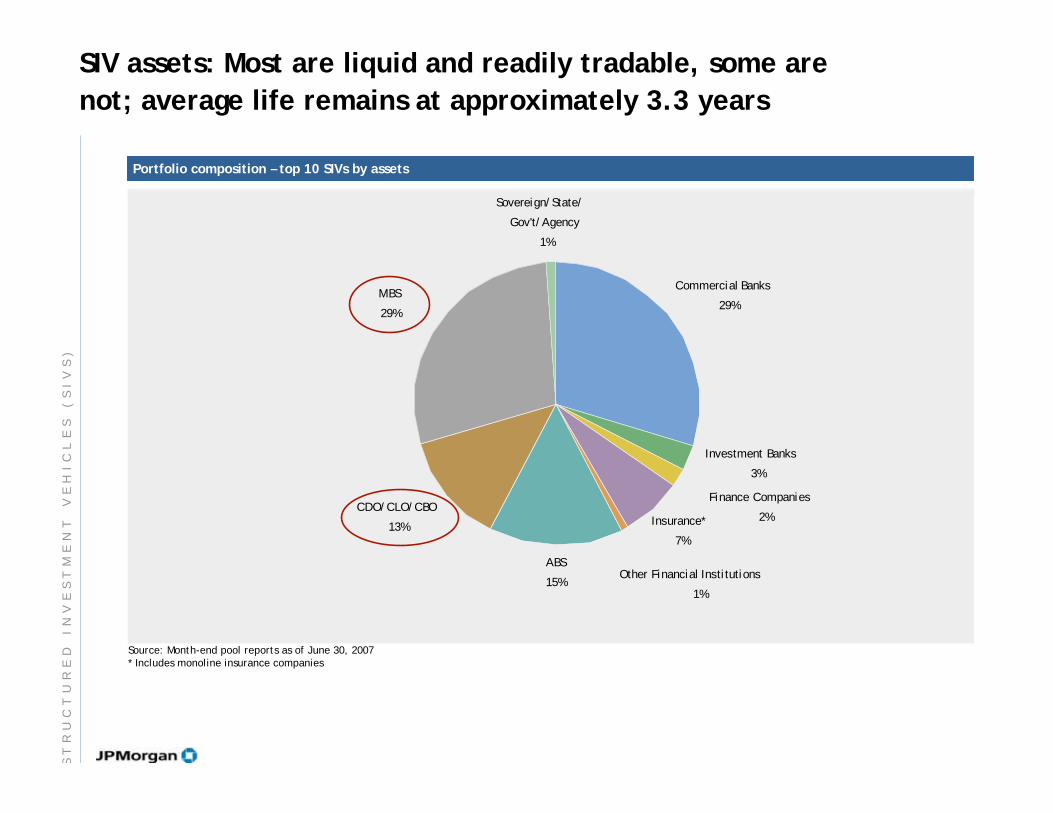
Commercial Banks
29%
ABS
15%
CDO/CLO/CBO
13%
MBS
29%
Finance Companies
2%Insurance*
7%
Other Financial Institutions
1%
Investment Banks
3%
Sovereign/State/
Gov't/Agency
1%
Portfolio composition – top 10 SIVs by assets
Source: Month-end pool reports as of June 30, 2007* Includes monoline insurance companies
SIV assets: Most are liquid and readily tradable, some are
not; average life remains at approximately 3.3 years
ST
RU
CT
UR
ED
I
NV
ES
TM
EN
T
VE
HI
CL
ES
(
SI
VS
)
Consortium-led solution for SIV funding crisis
October 2007: Bank consortium led by Citibank, Bank of America and JPMorgan
Chase announces the creation of a “super conduit” (called MLEC) to purchase
troubled assets in exchange for new short term debt.
Size of fund: $80 - $100 billion
Duration of fund: 12 – 18 months
Timing of implementation: Originally expected by year end, though that remains
in question given lack of substantive information since MLEC announcement.
Fund will pay market prices for SIV assets in an effort to prevent “dumping” of
assets
Biggest questions: what assets will the MLEC buy and what will “market” price be?
Any market price lower than book will crystallize losses and could trigger
covenants and/or rating agency downgrades
MLEC will not solve the SIV crisis nor will it fix the SIV model
MLEC, if implemented by year end, may minimize asset “fire sales”
Most observers, including many SIV managers, see SIV model as broken
Will MLEC favor bank sponsored vehicles over non-bank sponsored vehicles ?
If MLEC duration is a year or less, SIVs’ survival remains dependent on the
recovery of US MBS and CDO squared markets
Objections to the MLEC structure as a “bailout” highlights the commercial and
political sensitivities of the proposed fund.
ST
RU
CT
UR
ED
I
NV
ES
TM
EN
T
VE
HI
CL
ES
(
SI
VS
)
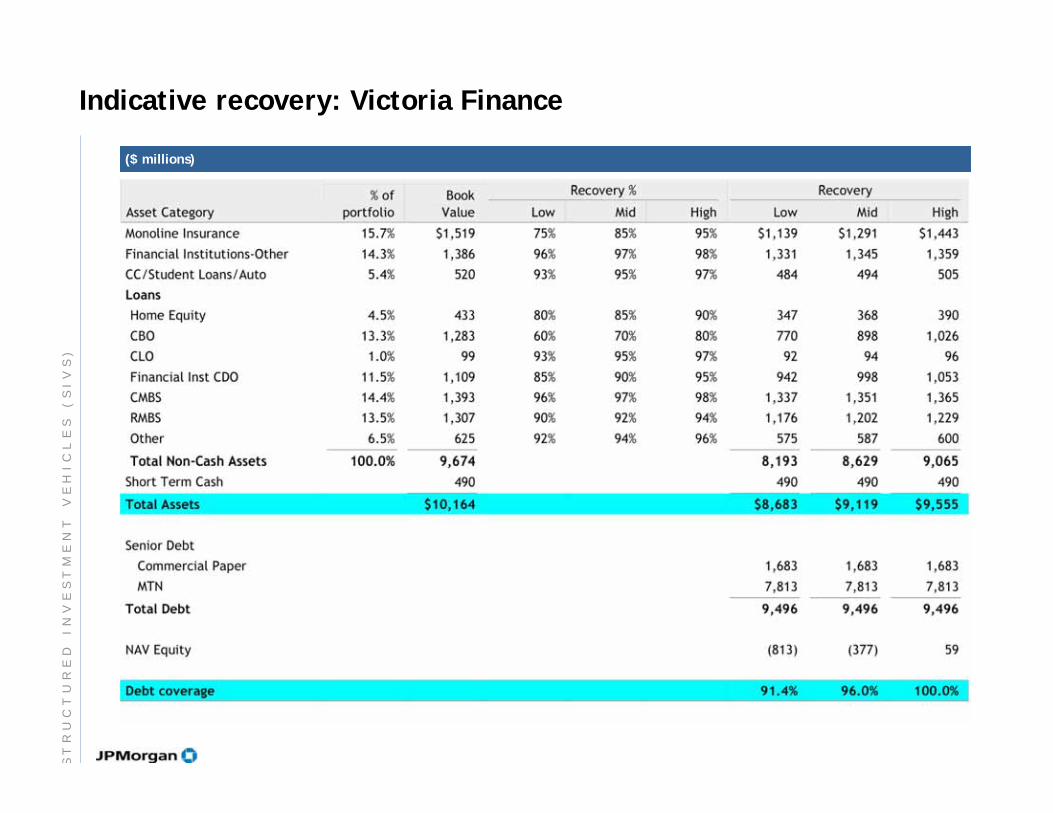
Indicative recovery: Victoria Finance
($ millions)
ST
RU
CT
UR
ED
I
NV
ES
TM
EN
T
VE
HI
CL
ES
(
SI
VS
)
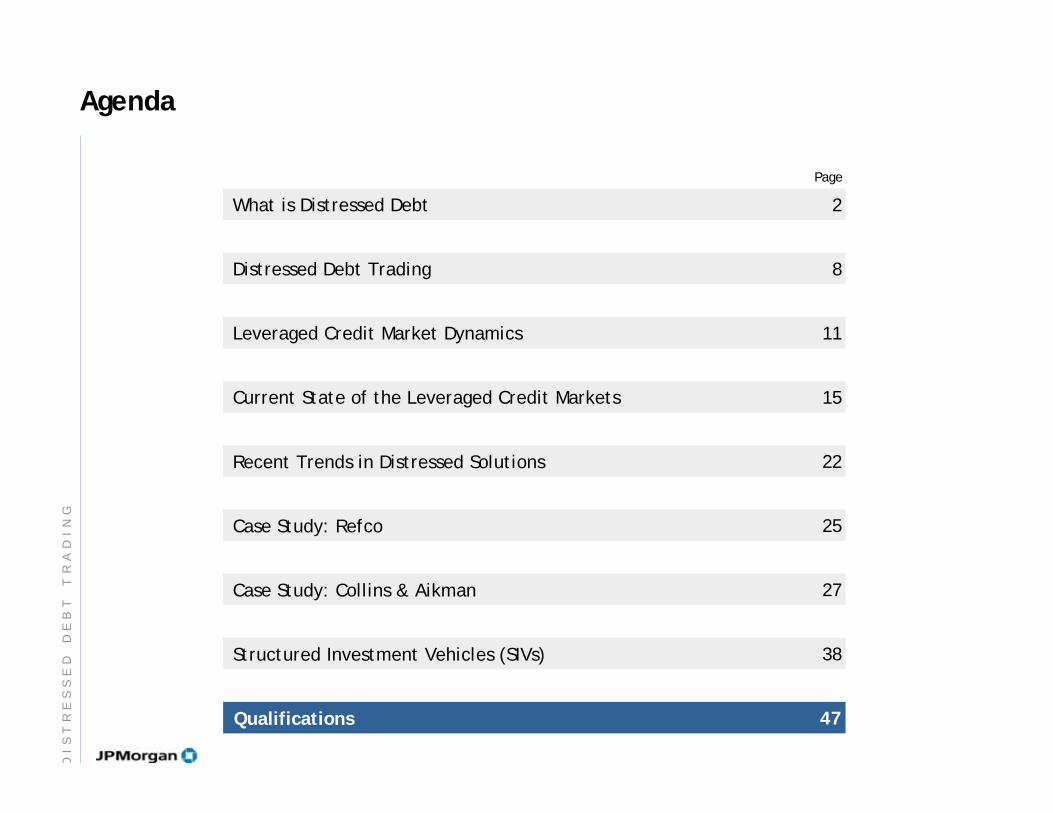
Agenda
Page
Qualifications
Structured Investment Vehicles (SIVs)
Case Study: Collins & Aikman
Case Study: Refco
Recent Trends in Distressed Solutions
Current State of the Leveraged Credit Markets
Leveraged Credit Market Dynamics
Distressed Debt Trading
What is Distressed Debt 2
8
11
15
22
25
27
38
47
DI
ST
RE
SS
ED
D
EB
T
TR
AD
IN
G
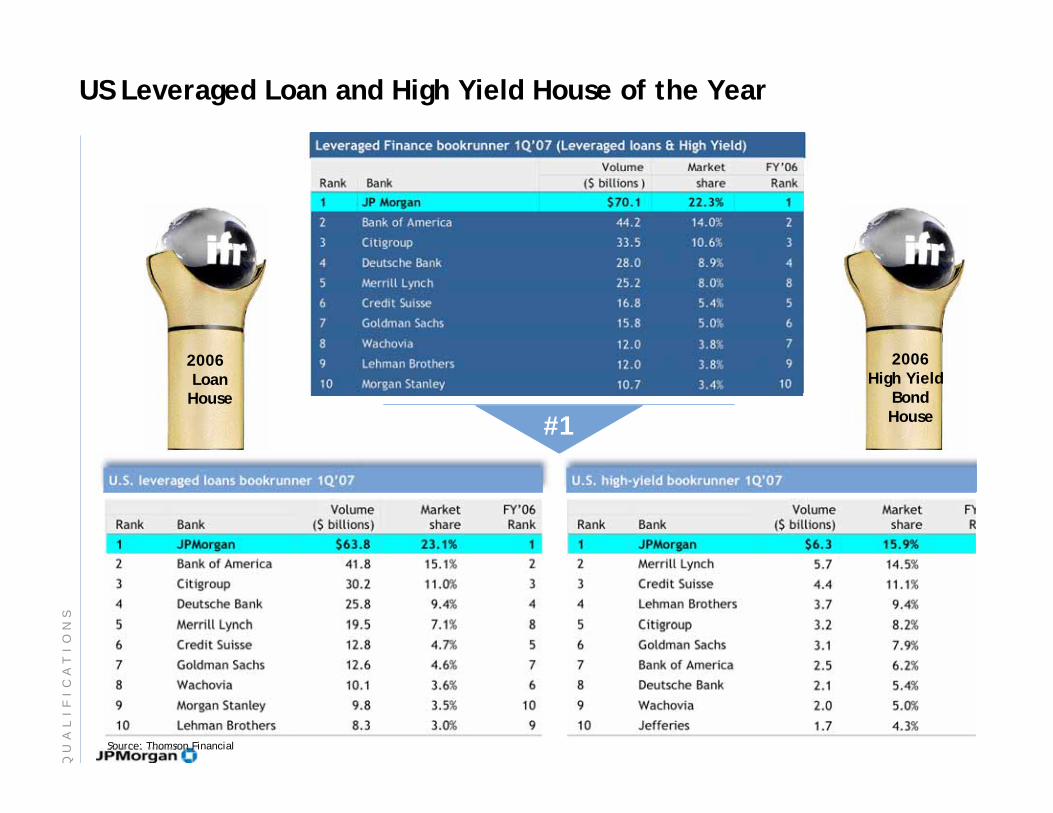
US Leveraged Loan and High Yield House of the Year
Leveraged Finance bookrunner 1Q’07 (Leveraged loans & High Yield)
Source: Thomson Financial
#1
U.S. leveraged loans bookrunner 1Q’07 U.S. high-yield bookrunner 1Q’07
2006LoanHouse
2006High Yield
BondHouse
QU
AL
IF
IC
AT
IO
NS
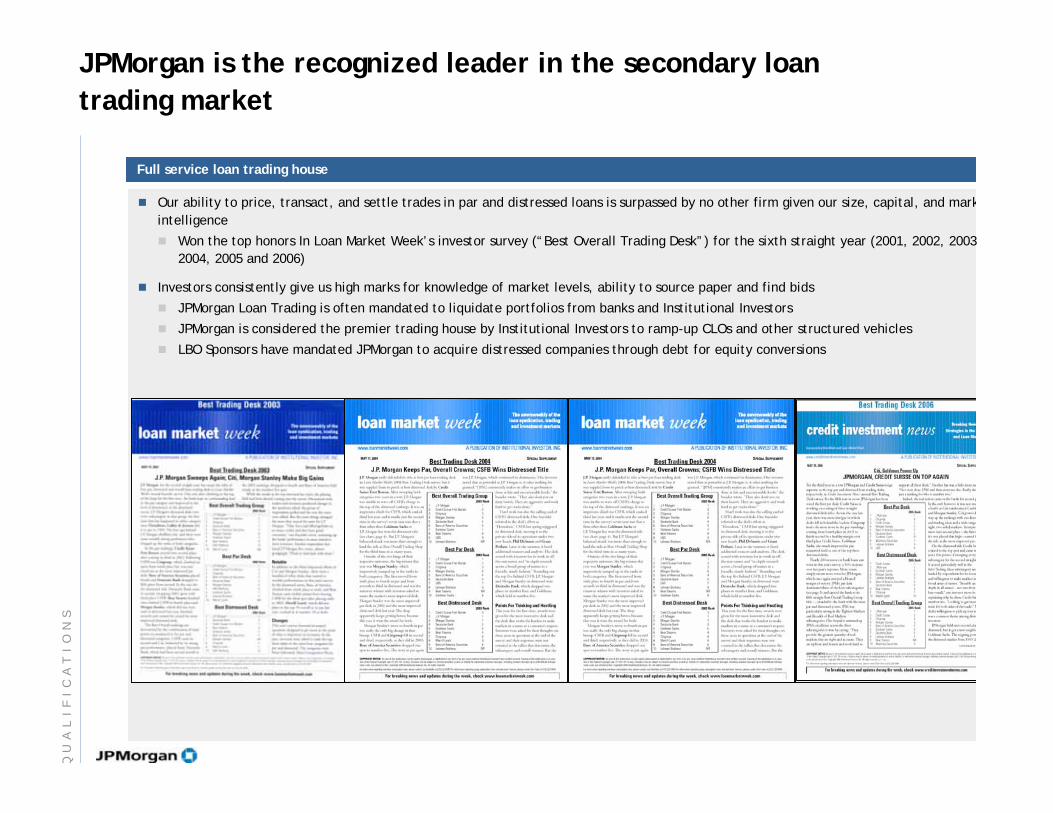
Full service loan trading house
Our ability to price, transact, and settle trades in par and distressed loans is surpassed by no other firm given our size, capital, and mark
intelligence
Won the top honors In Loan Market Week’s investor survey (“Best Overall Trading Desk”) for the sixth straight year (2001, 2002, 2003
2004, 2005 and 2006)
Investors consistently give us high marks for knowledge of market levels, ability to source paper and find bids
JPMorgan Loan Trading is often mandated to liquidate portfolios from banks and Institutional Investors
JPMorgan is considered the premier trading house by Institutional Investors to ramp-up CLOs and other structured vehicles
LBO Sponsors have mandated JPMorgan to acquire distressed companies through debt for equity conversions
JPMorgan is the recognized leader in the secondary loan
trading market
QU
AL
IF
IC
AT
IO
NS
Recommended