MANAGING AN AIRLINE REPUTATION IN TROUBLED GLOBAL SKIES
André Serpa Soares TAP Portugal October 16, 2012
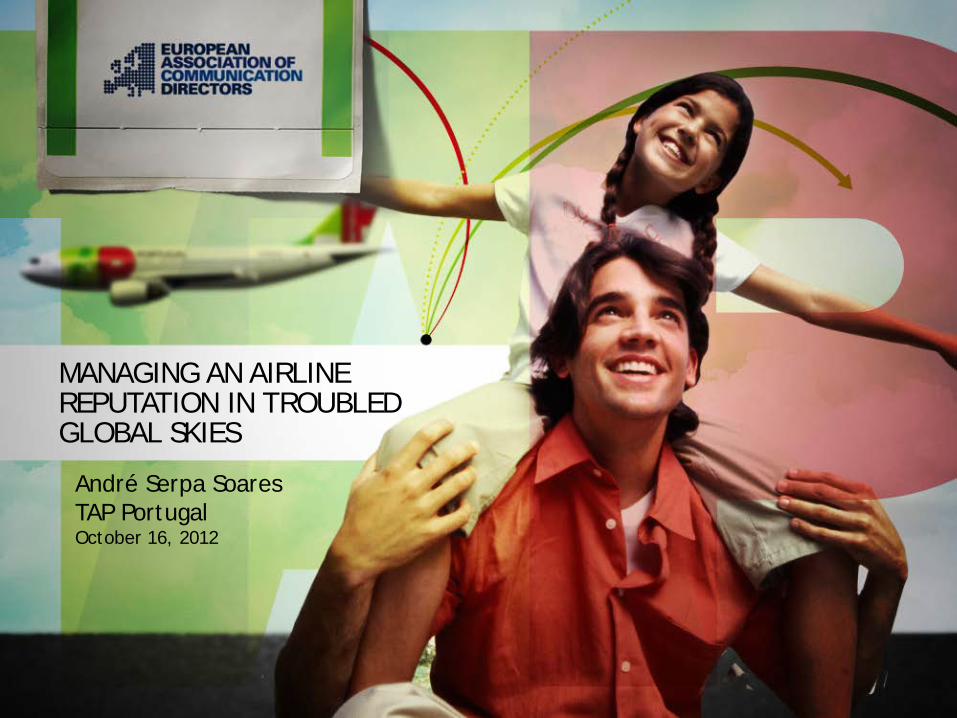
38-75: TAP doubled its network Note: destinations in black were operated in 2000 2000 - 2011
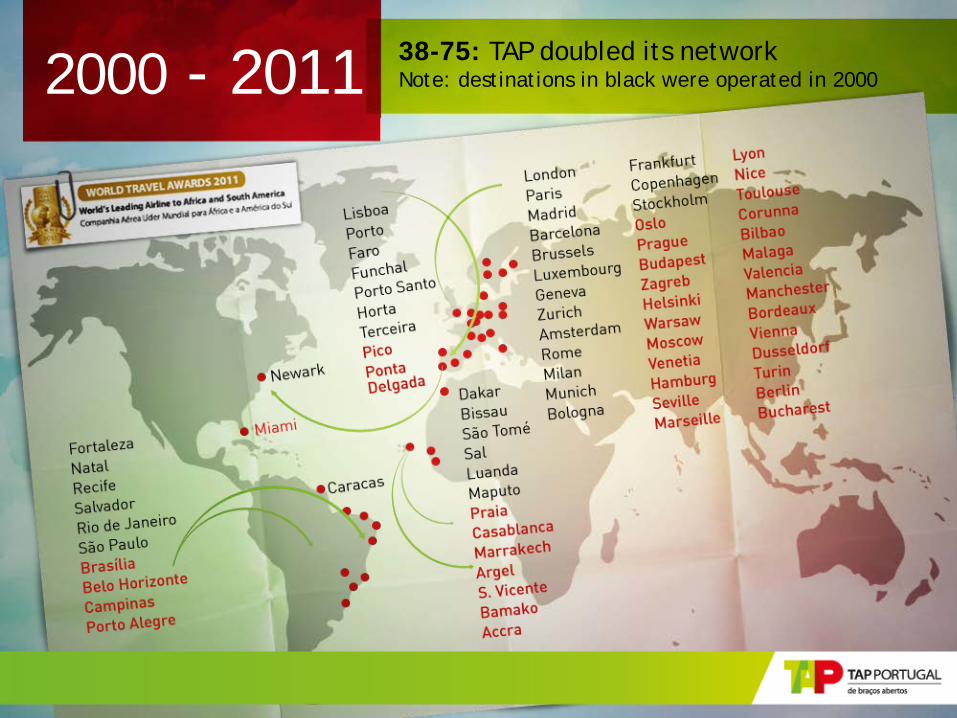
Long haul 5 new destinations in Americas – Miami, Porto Alegre, Brasília, Belo Horizonte, Campinas 7 new destinations in Africa – Casablanca, Algiers, Marrakech, S. Vicente, Praia, Accra, Bamako
2000 - 2011
2000 2011
MPM
NYC
MIA
CCS
FOR
REC NAT
BSB SSA
BHZ RIO
SAO
POA
GRU
FNC
LIS
RAK
CMN ALG
OPO
LAD
TMS
ACC
OXB BKO
SID
DKR
RAI VXE
NYC
CCS
FOR
REC NAT
SSA
RIO GRU
FNC
LIS OPO
LAD
TMS
OXB
SID DKR
JNB MPM
12 new destinations in Africa And Americas
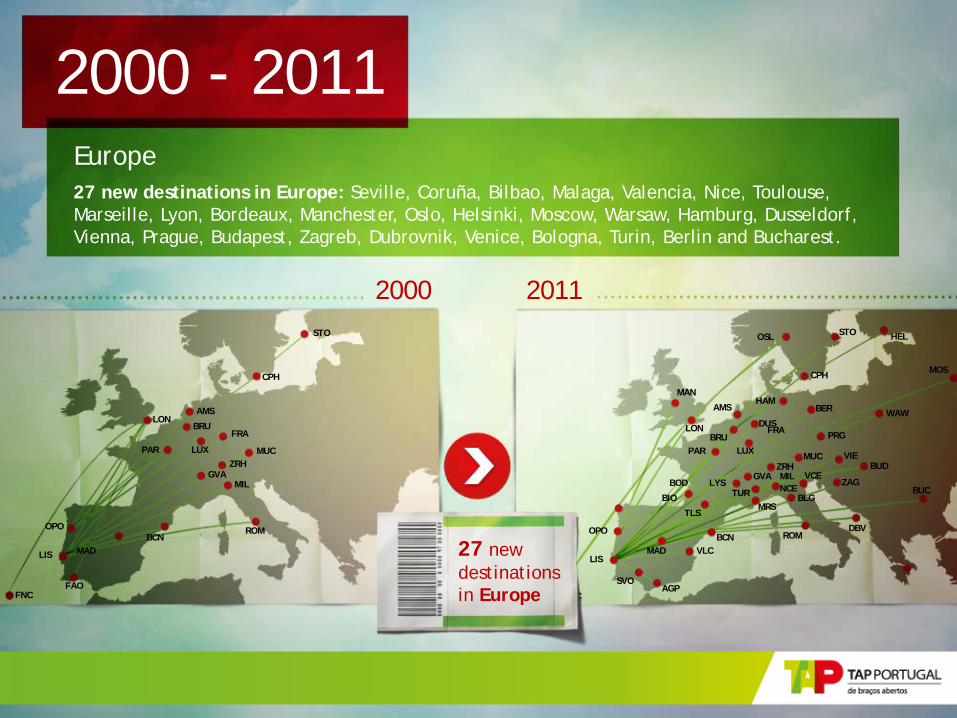
Europe 27 new destinations in Europe: Seville, Coruña, Bilbao, Malaga, Valencia, Nice, Toulouse, Marseille, Lyon, Bordeaux, Manchester, Oslo, Helsinki, Moscow, Warsaw, Hamburg, Dusseldorf, Vienna, Prague, Budapest, Zagreb, Dubrovnik, Venice, Bologna, Turin, Berlin and Bucharest.
2000 - 2011
2000 2011
OPO
LIS
SVO AGP
VLC MAD
TLS
BIO
BOD
BCN
MAN
LON
PAR BRU
AMS
DUS FRA
LUX
HAM BER
CPH
OSL STO HEL
MOS
WAW
PRG
MUC VIE BUD
BUC
DBV
ZAG VCE
ZRH GVA
LYS
MRS TUR NCE
MIL
BLG
ROM
FNC
OPO
LIS MAD BCN
LON
PAR
BRU
AMS
FRA
LUX
CPH
STO
MUC ZRH
GVA MIL
ROM
FNC FAO
27 new destinations in Europe
América Africa Europa
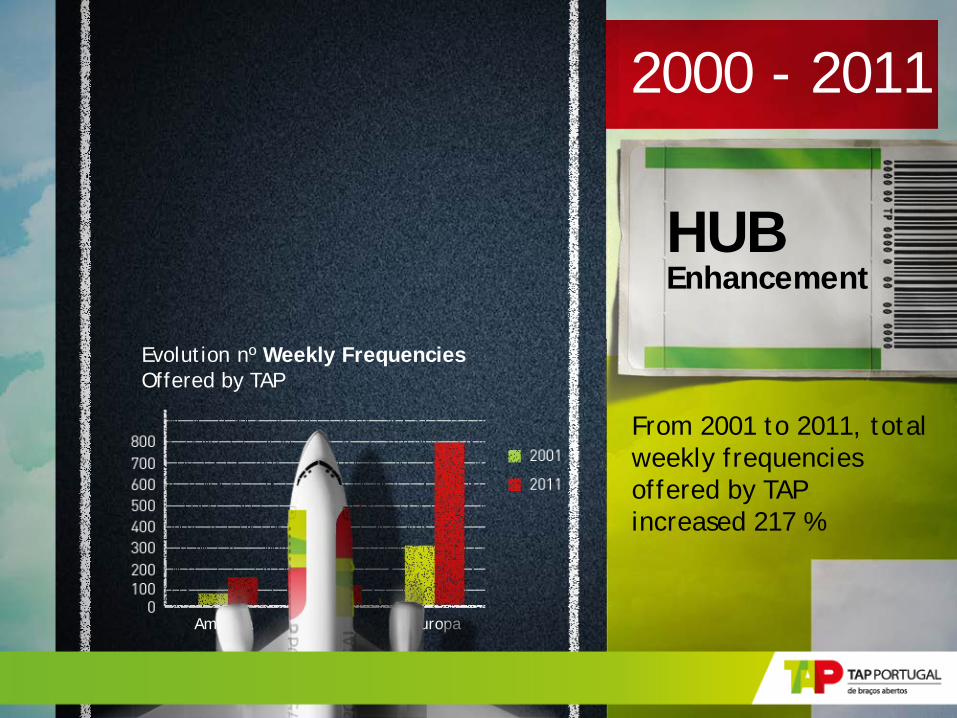
Evolution nº Weekly Frequencies Offered by TAP
HUB Enhancement
From 2001 to 2011, total weekly frequencies offered by TAP increased 217 %
2000 - 2011
150%
100%
50%
0%
-50%
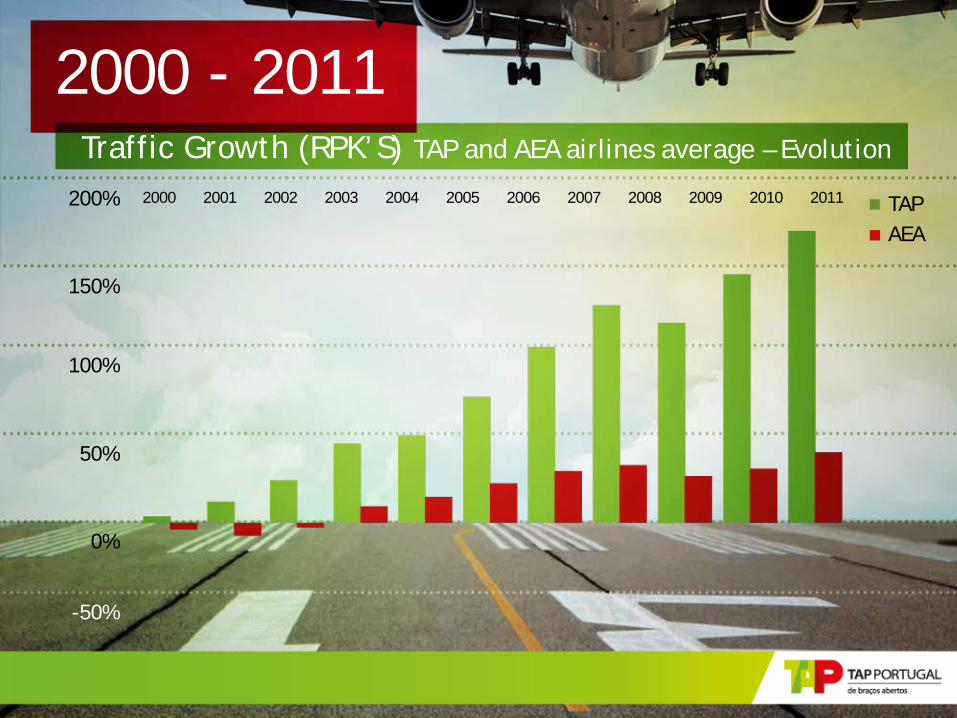
200% 2000 2001 2002 2003 2004 2005 2006 2007 2008 2009 2010 2011 TAP AEA
2000 - 2011 Traffic Growth (RPK’S) TAP and AEA airlines average – Evolution
2000
20
01
2002
20
03
2004
20
05
2006
20
07
2008
20
09
2010
20
11
-30%
0%
30%
60%
90%
120%
150% Europe Brazil
2000
20
01
2002
20
03
2004
20
05
2006
20
07
2008
20
09
2010
20
11
-50%
0%
50%
100%
200%
300%
400%
150%
250%
350%
Africa
-20%
0%
20%
40%
60%
80%
100%
2000
20
01
2002
20
03
2004
20
05
2006
20
07
2008
20
09
2010
20
11
TAP AEA
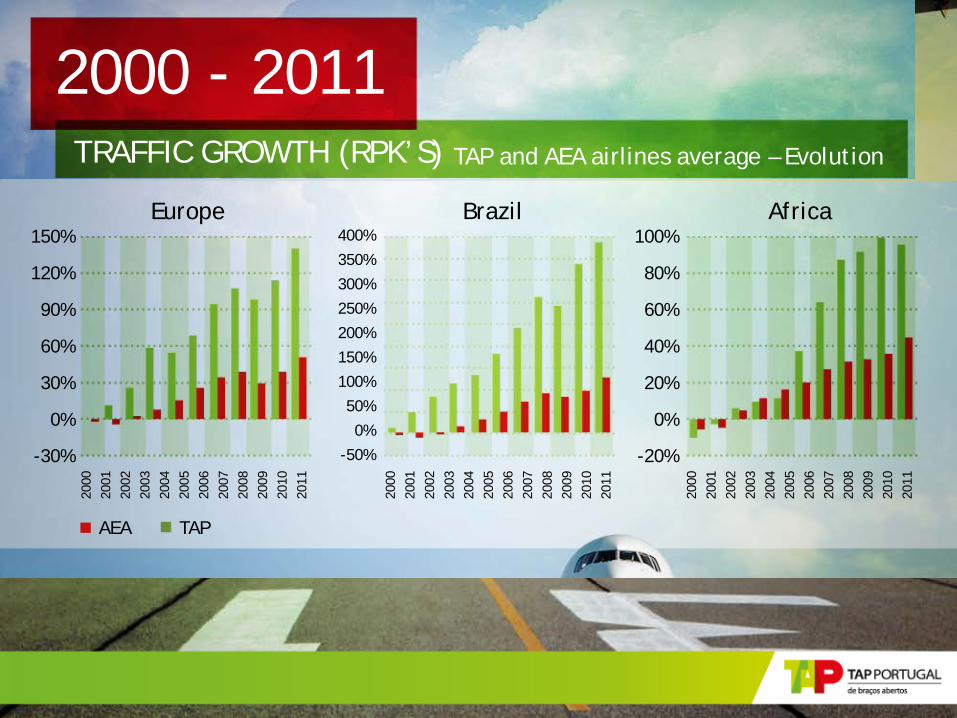
TAP and AEA airlines average – Evolution TRAFFIC GROWTH (RPK’S)
2000 - 2011
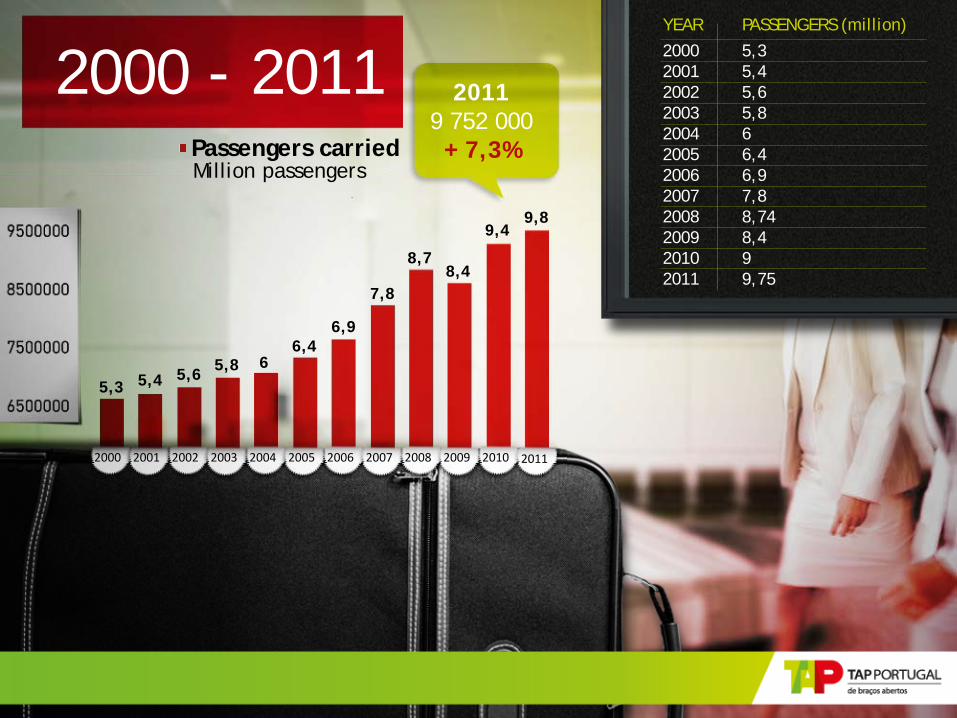
2000 2001 2002 2003 2004 2005 2006 2007 2008 2009 2010 2011
5,3 5,4 5,6 5,8 6 6,4
6,9
7,8
8,7 8,4
9,4 9,8
2011 9 752 000 + 7,3%
YEAR
2000 2001 2002 2003 2004 2005 2006 2007 2008 2009 2010 2011
PASSENGERS (million)
5,3 5,4 5,6 5,8 6 6,4 6,9 7,8 8,74 8,4 9 9,75
2000 - 2011 Passengers carried Million passengers
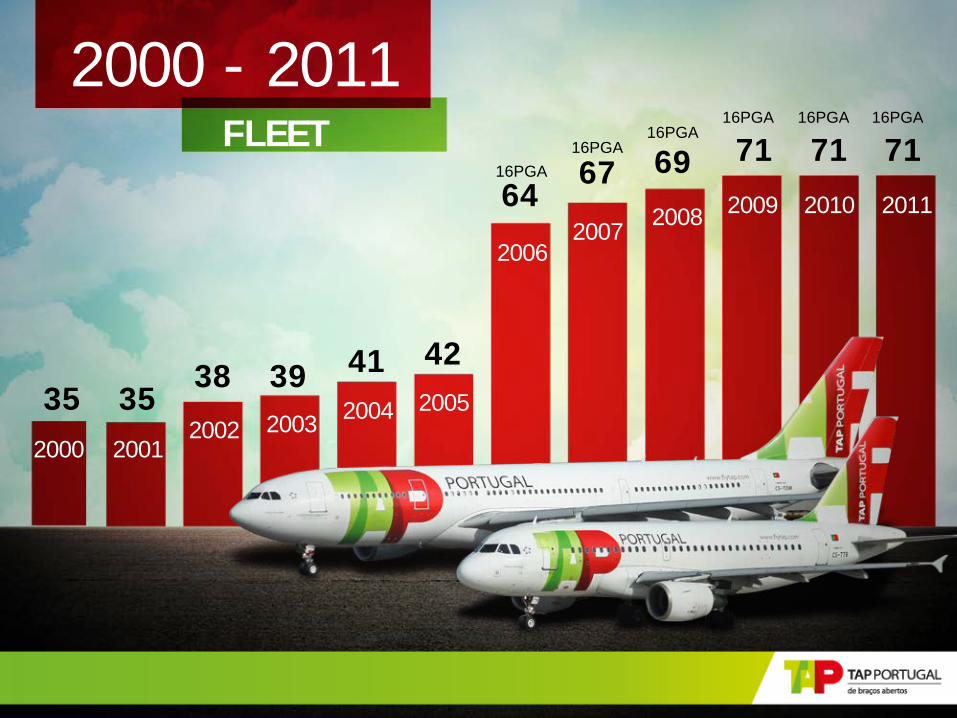
FLEET
2000 - 2011
2001 2002 2003 2004 2005
2006 2007
2008 2009 2010 2011
2000
35 35 38 39 41 42
64 67 69 71 71 71
16PGA 16PGA
16PGA 16PGA 16PGA 16PGA
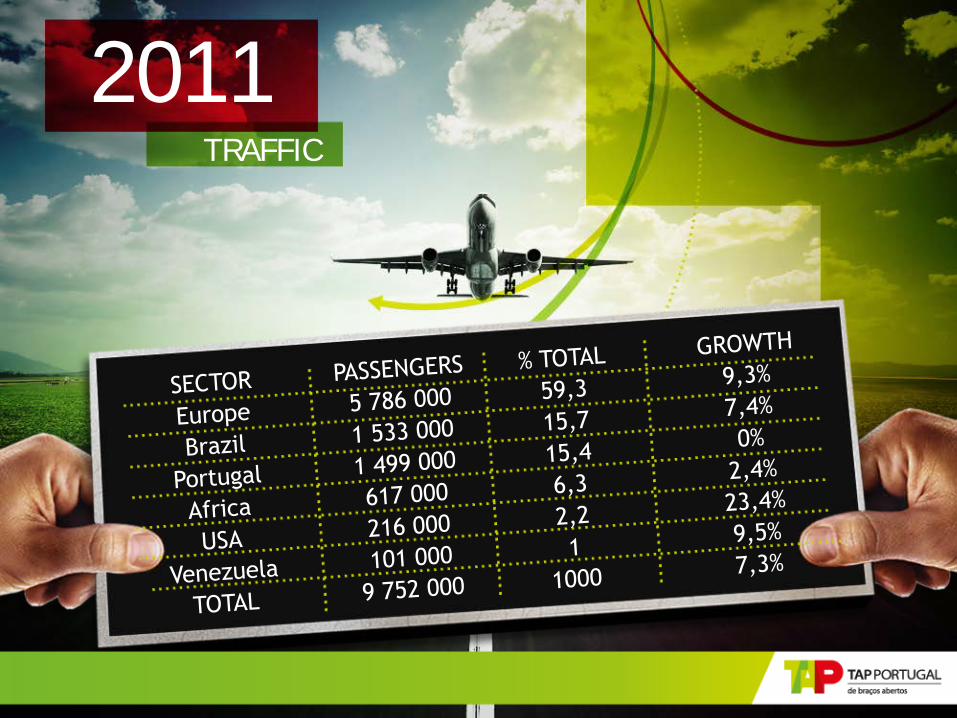
2011 TRAFFIC
Portugal
Europe
Africa
USA
Brazil
Venezuela
Total TAP
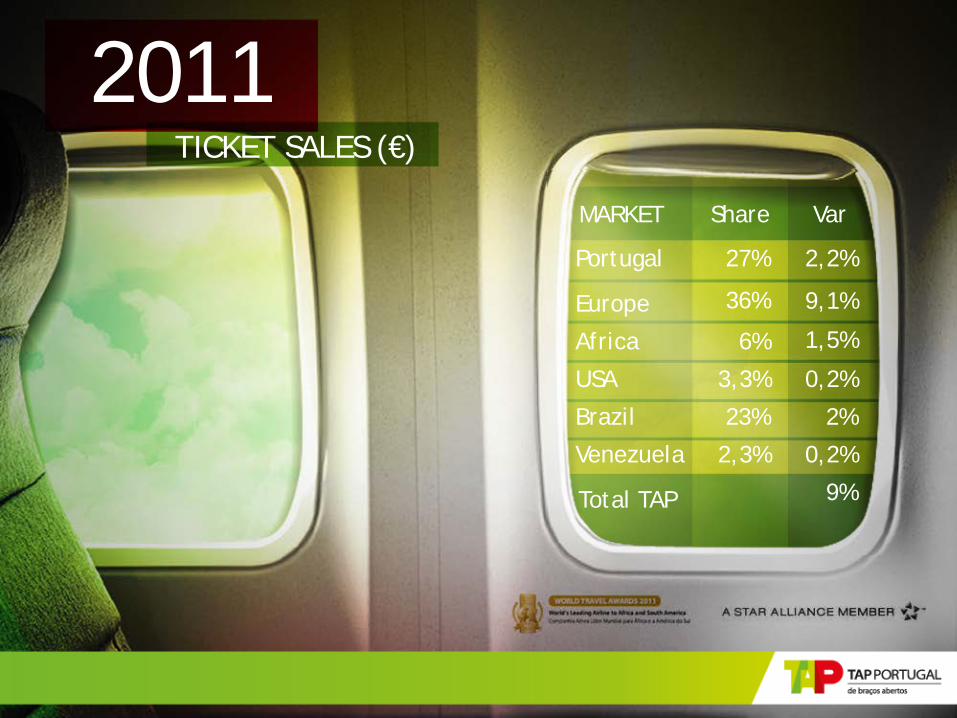
27%
36%
6%
3,3%
23%
2,2%
9,1%
1,5%
0,2%
2%
0,2% 2,3%
9%
MARKET Share Var
2011 TICKET SALES (€)
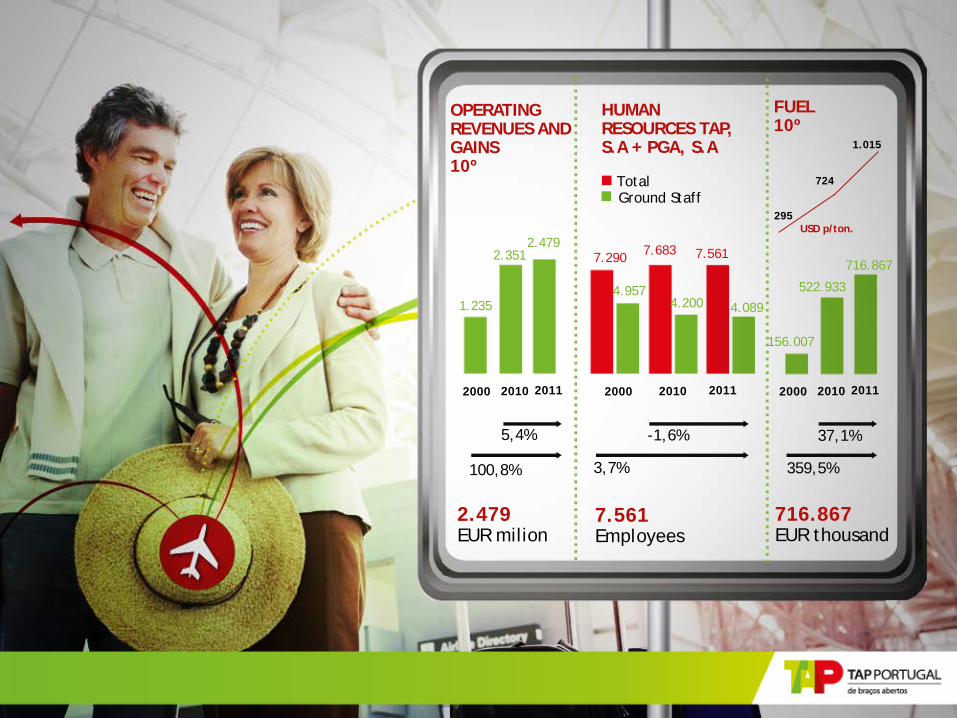
OPERATING REVENUES AND GAINS 10º
HUMAN RESOURCES TAP, S.A + PGA, S.A
FUEL 10º
2.479 EUR milion
7.561 Employees
716.867 EUR thousand
100,8%
5,4% -1,6%
3,7%
37,1%
359,5%
1.235
2.351 2.479
156.007
Total Ground Staff
7.290
4.957
7.683 7.561
4.200 4.089
2000 2010 2011 2000 2010 2011 2000 2010 2011
522.933
716.867
1.015
724
295 USD p/ton.
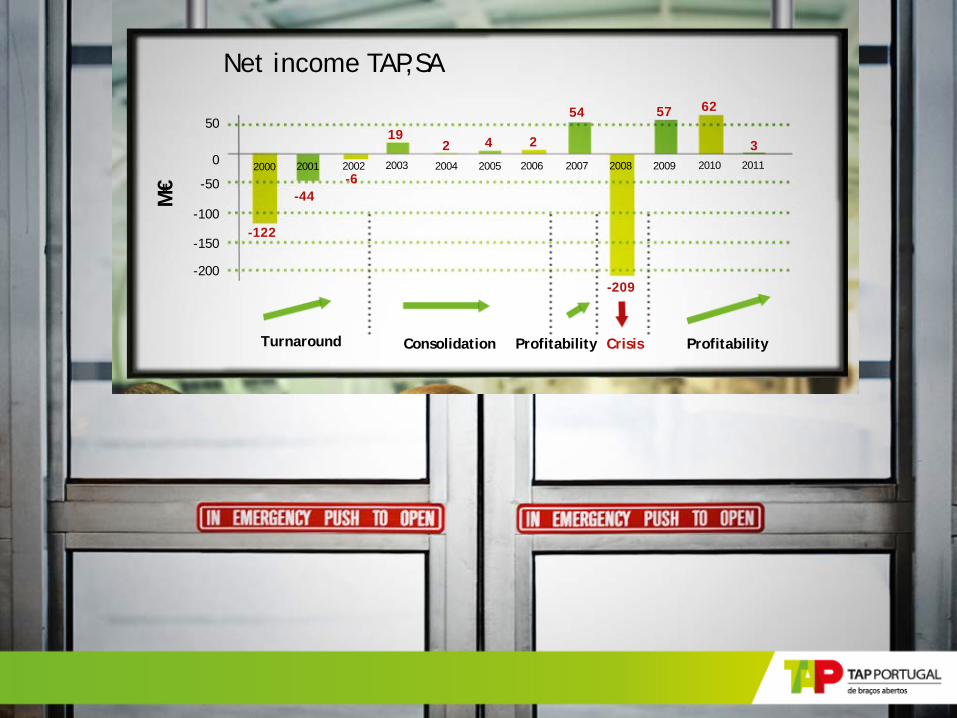
Net income TAP,SA
-44 -6
19 2 4 2
54
-209
57 62
3
-200
-150
-100
-50
0
50
2000 2001 2002 2003 2004 2005 2006 2007 2008 2009 2010 2011 M
€
-122
Profitability Crisis Profitability Consolidation Turnaround
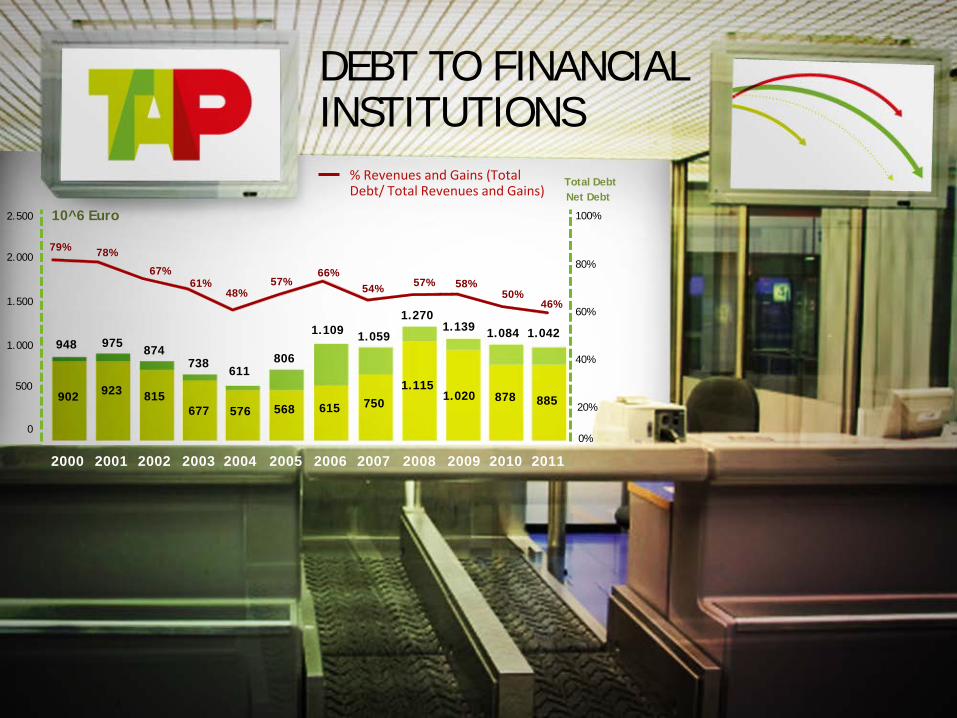
DEBT TO FINANCIAL INSTITUTIONS
% Revenues and Gains (Total Debt/ Total Revenues and Gains)
Total Debt Net Debt
2000 2001 2002 2003 2004 2005 2006 2007 2008 2009 2010
902 923 815 677 576 568 615 750
1.115 1.020 878 885
948 975 874 738
611 806
1.109 1.059
1.270 1.139 1.084 1.042
79% 78%
67% 61%
48% 57%
66% 54% 57% 58%
50% 46%
10^6 Euro
2011
0
500
1.000
1.500
2.000
2.500
0%
20%
40%
60%
80%
100%
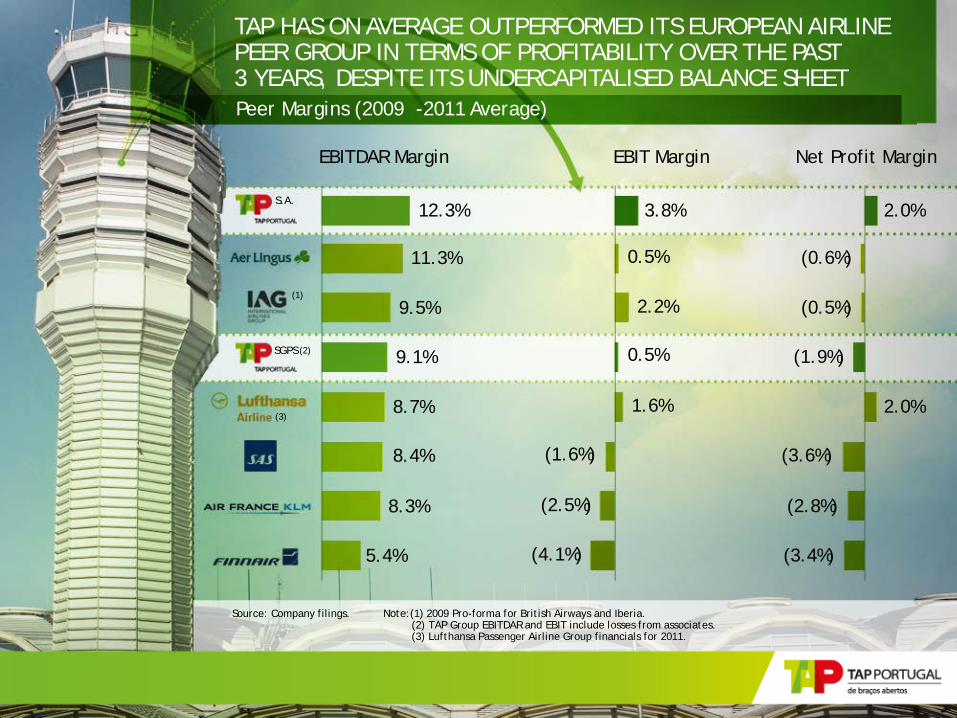
Net Profit Margin
2.0%
(0.6%)
(0.5%)
(1.9%)
2.0%
(3.6%)
(2.8%)
(3.4%)
EBIT Margin
3.8%
0.5%
2.2%
0.5%
1.6%
(1.6%)
(2.5%)
(4.1%)
EBITDAR Margin
8.3%
5.4%
12.3%
11.3%
9.5%
9.1%
8.7%
8.4%
TAP HAS ON AVERAGE OUTPERFORMED ITS EUROPEAN AIRLINE PEER GROUP IN TERMS OF PROFITABILITY OVER THE PAST 3 YEARS, DESPITE ITS UNDERCAPITALISED BALANCE SHEET Peer Margins (2009 -2011 Average)
Note:(1) 2009 Pro-forma for British Airways and Iberia. (2) TAP Group EBITDAR and EBIT include losses from associates. (3) Lufthansa Passenger Airline Group financials for 2011.
Source: Company filings.
S.A.
(1)
SGPS (2)
(3)

TAP AND PORTUGAL
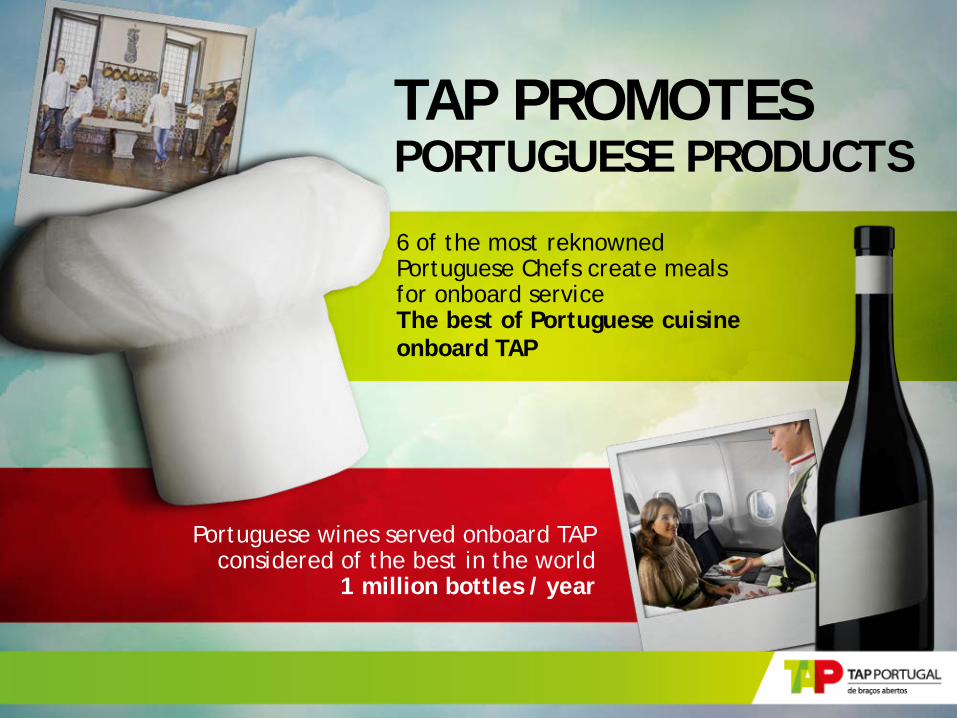
TAP PROMOTES PORTUGUESE PRODUCTS
Portuguese wines served onboard TAP considered of the best in the world
1 million bottles / year
6 of the most reknowned Portuguese Chefs create meals for onboard service The best of Portuguese cuisine onboard TAP
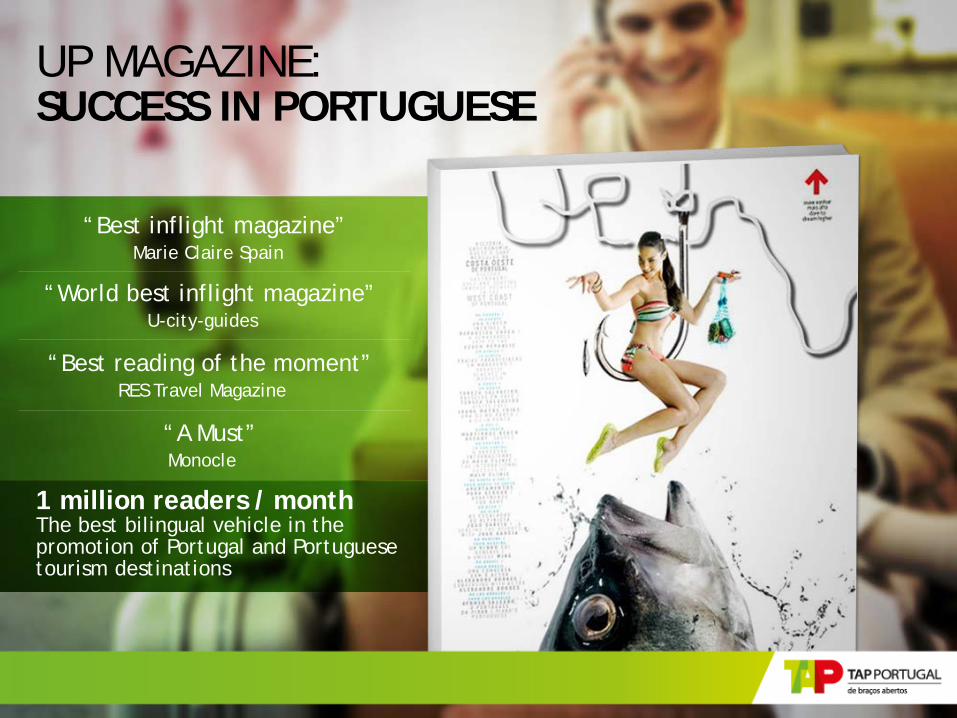
UP MAGAZINE: SUCCESS IN PORTUGUESE
“Best inflight magazine” Marie Claire Spain
“World best inflight magazine” U-city-guides
“Best reading of the moment” RES Travel Magazine
“A Must” Monocle
1 million readers / month The best bilingual vehicle in the promotion of Portugal and Portuguese tourism destinations
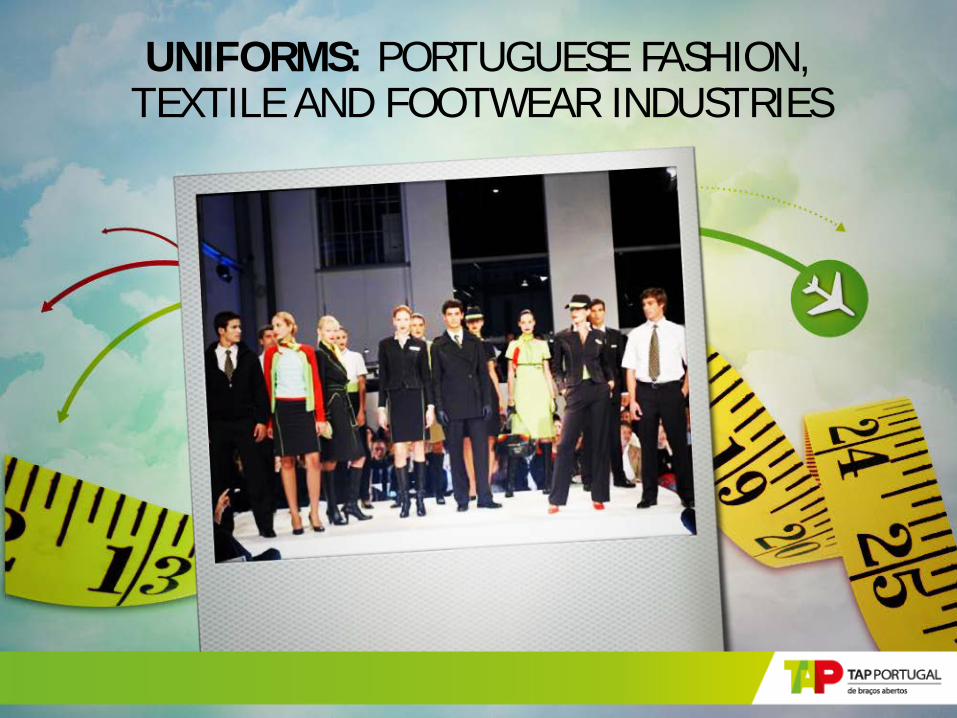
UNIFORMS: PORTUGUESE FASHION, TEXTILE AND FOOTWEAR INDUSTRIES
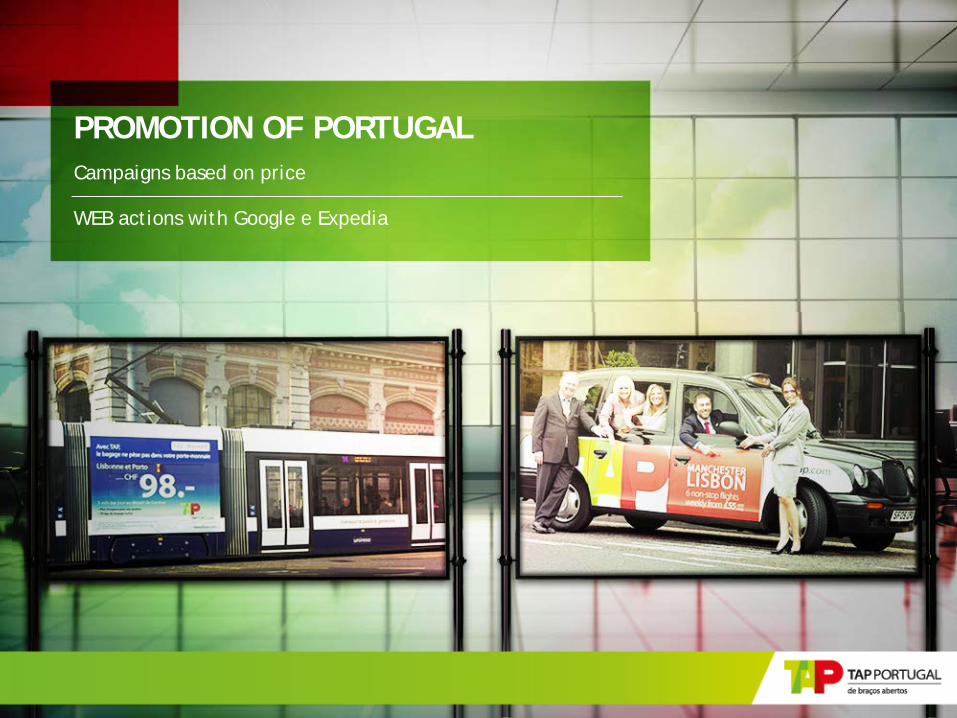
PROMOTION OF PORTUGAL Campaigns based on price
WEB actions with Google e Expedia
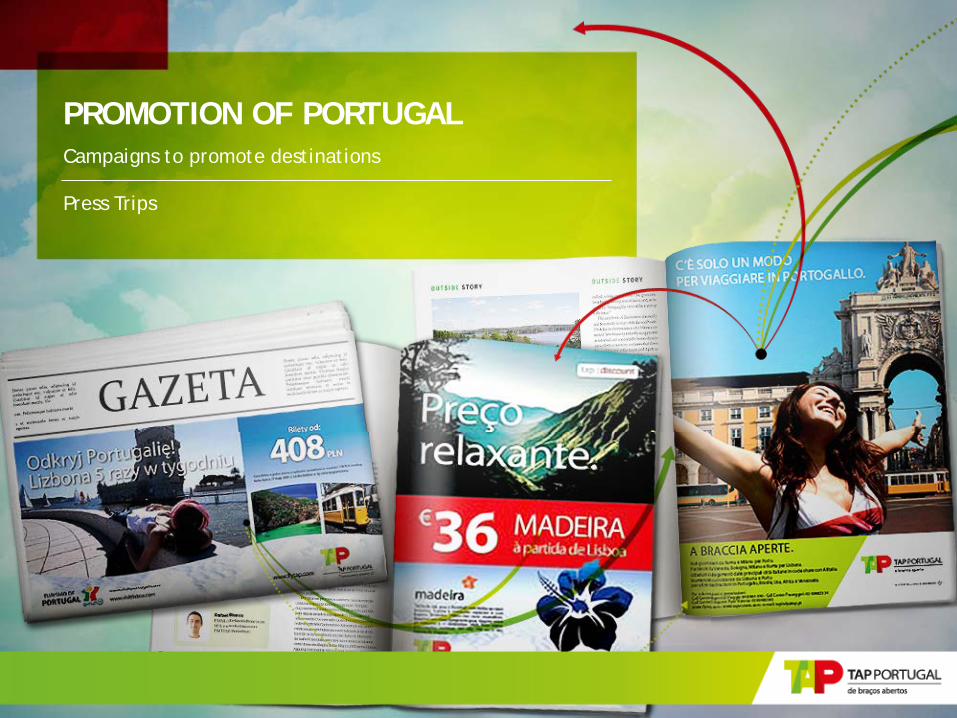
PROMOTION OF PORTUGAL Campaigns to promote destinations Press Trips
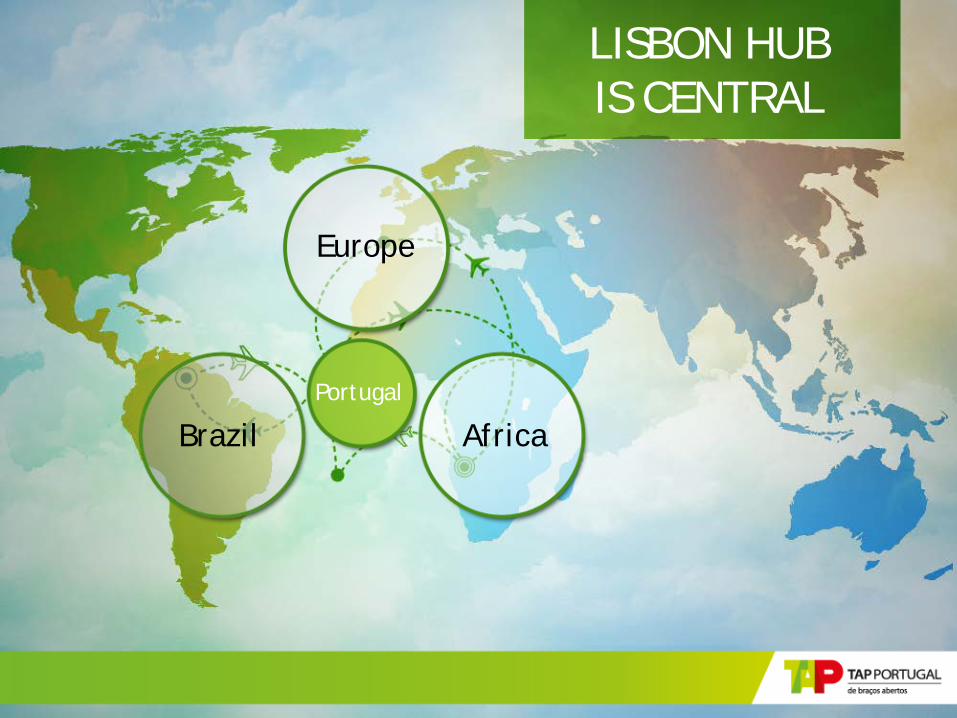
Europe
Brazil Africa Portugal
LISBON HUB IS CENTRAL

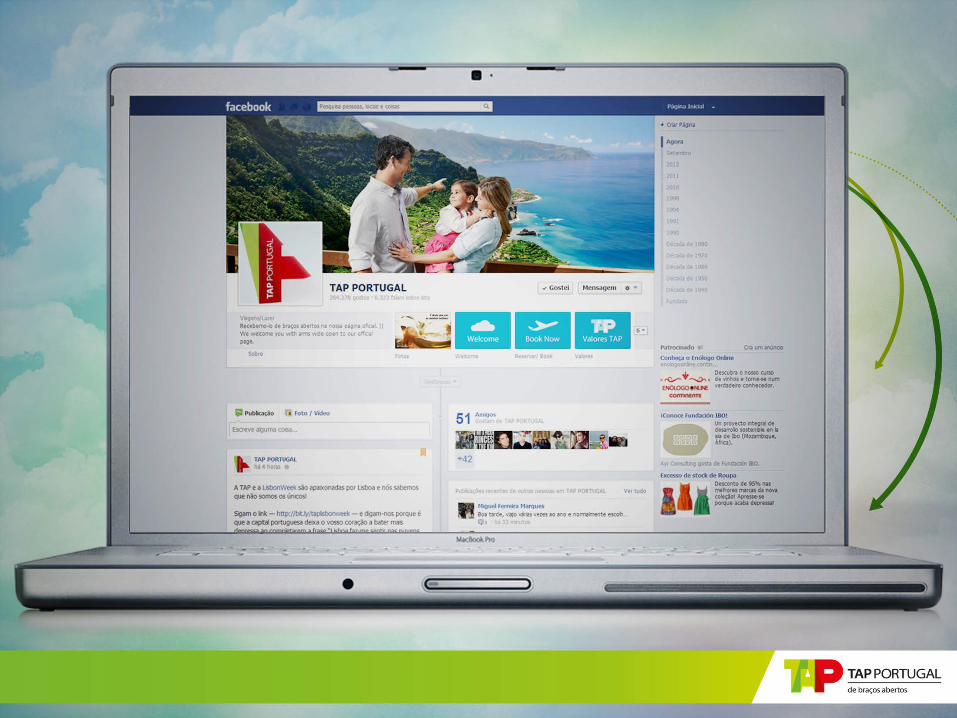
O CLIENTE MOSTRA O CAMINHO

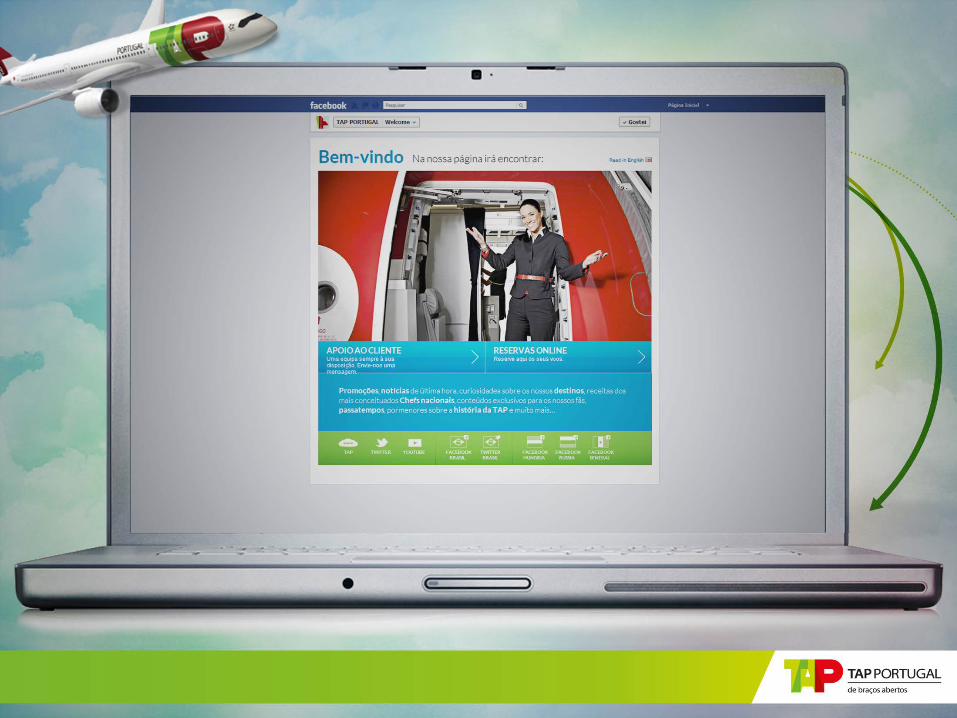
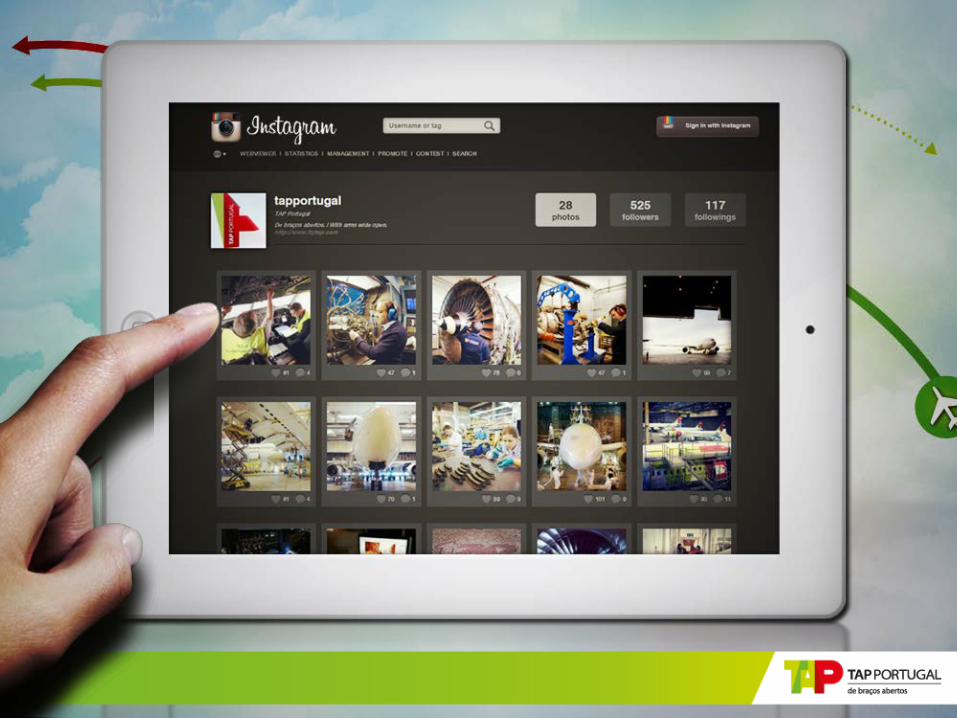
SOCIAL MEDIA IS CHANGING BUSINESS
2009: TAP FLASHMOB AT LISBON AIRPORT
Over 2 million views on YouTube
Many new fans to TAP’s Facebook page
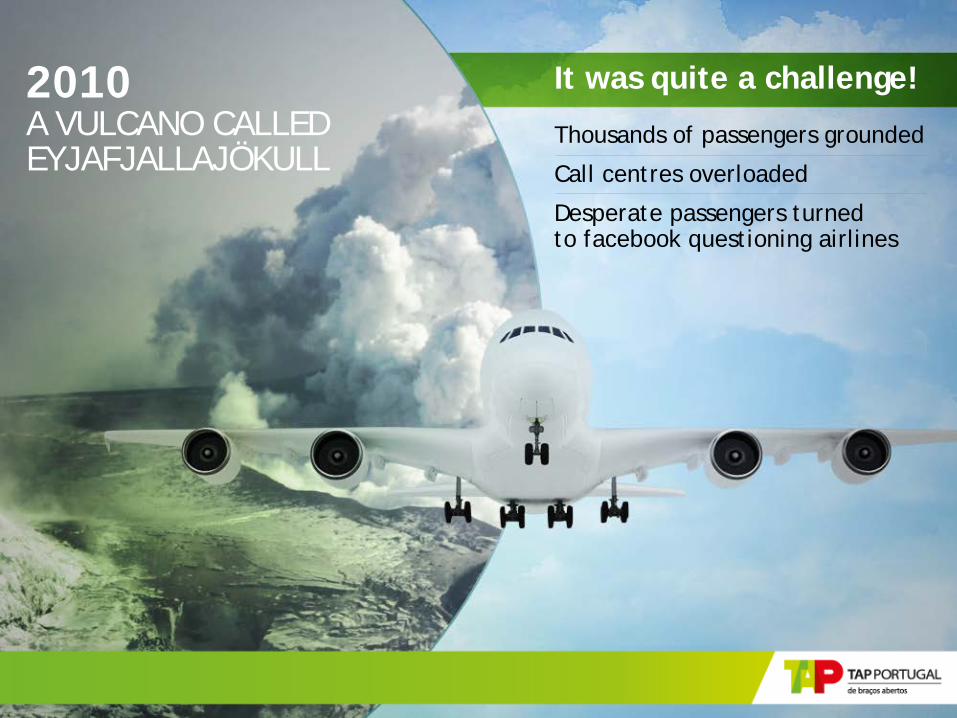
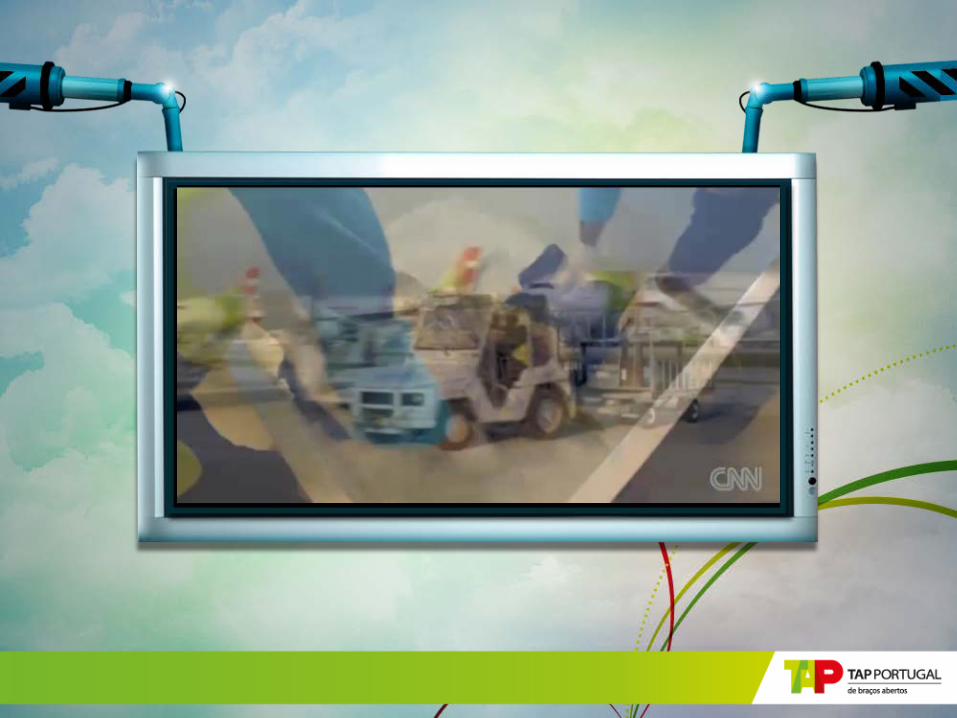
2010 A VULCANO CALLED EYJAFJALLAJÖKULL
It was quite a challenge!
Thousands of passengers grounded
Call centres overloaded
Desperate passengers turned to facebook questioning airlines
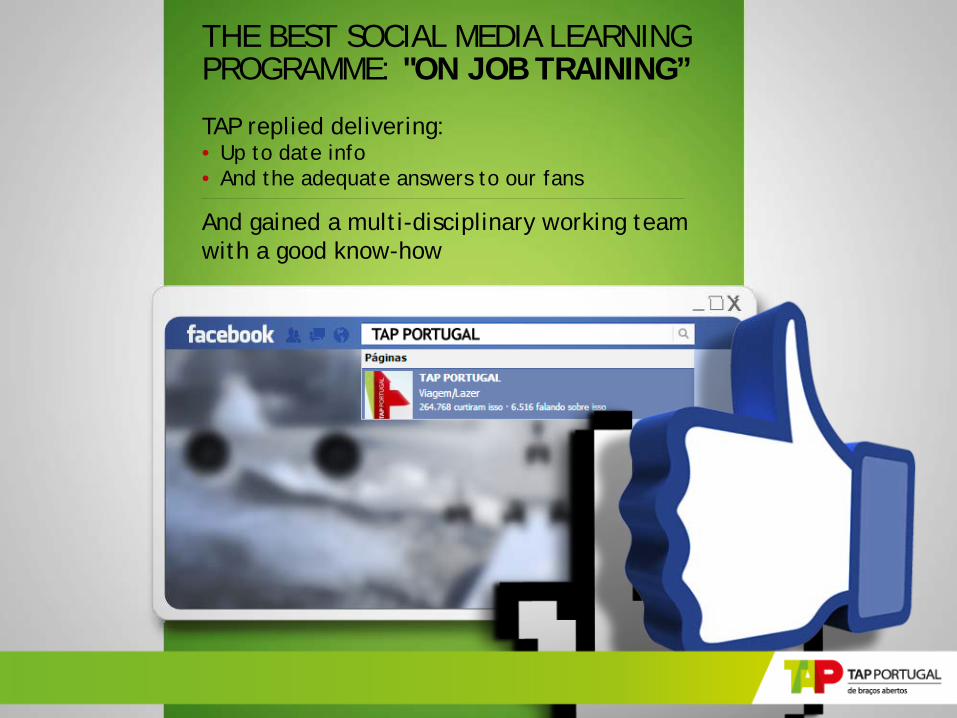
THE BEST SOCIAL MEDIA LEARNING PROGRAMME: "ON JOB TRAINING”
TAP replied delivering: • Up to date info • And the adequate answers to our fans
And gained a multi-disciplinary working team with a good know-how

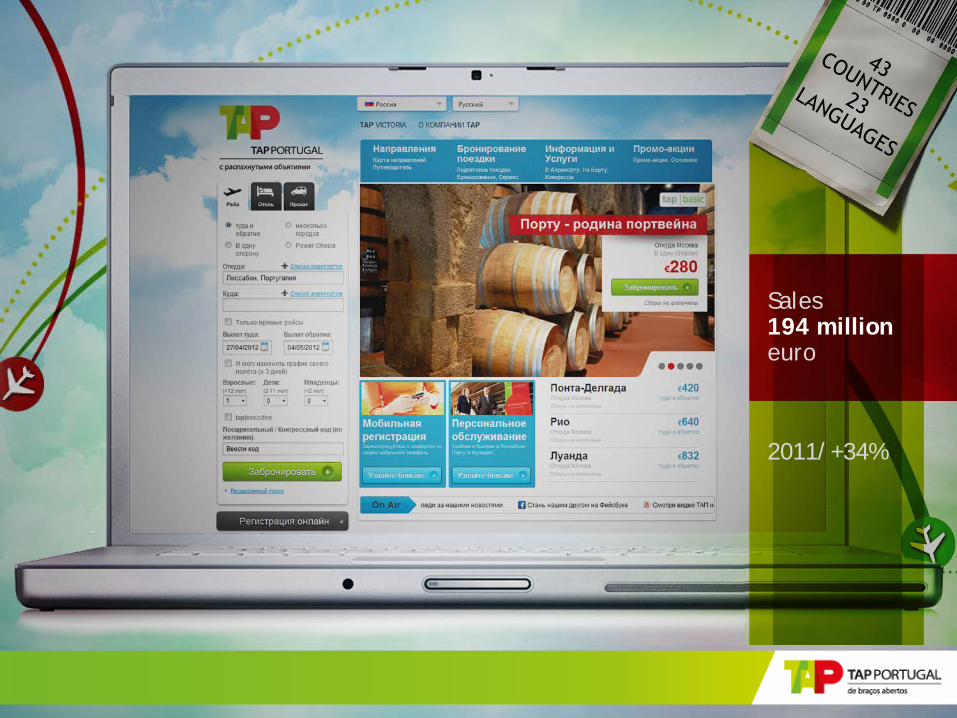
Sales 194 million euro
2011/+34%
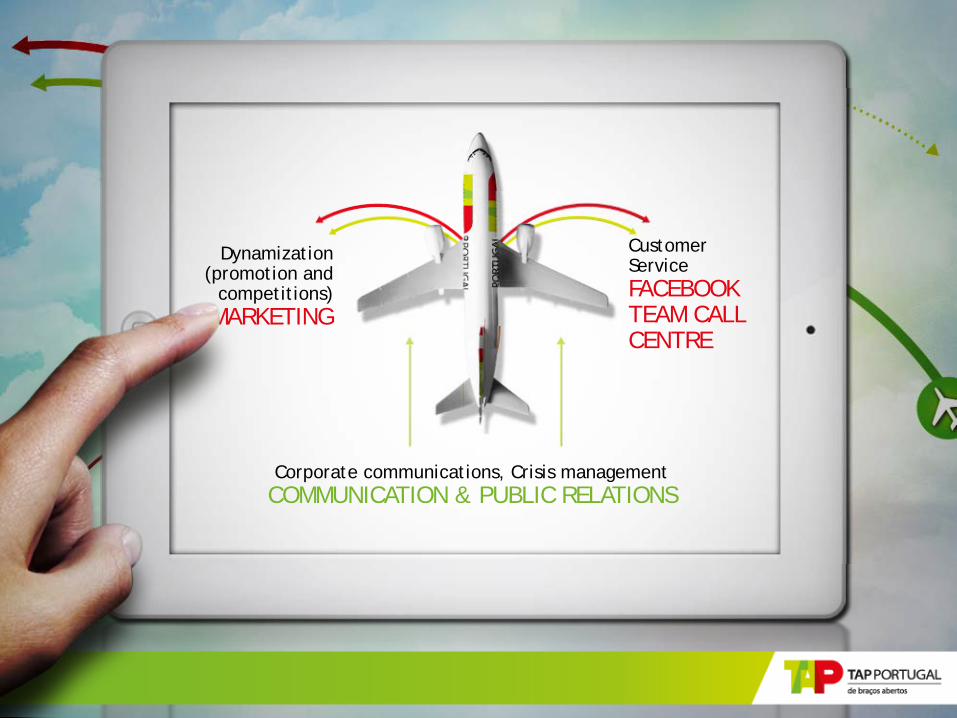
Corporate communications, Crisis management COMMUNICATION & PUBLIC RELATIONS
Customer Service FACEBOOK TEAM CALL CENTRE
Dynamization (promotion and
competitions) MARKETING
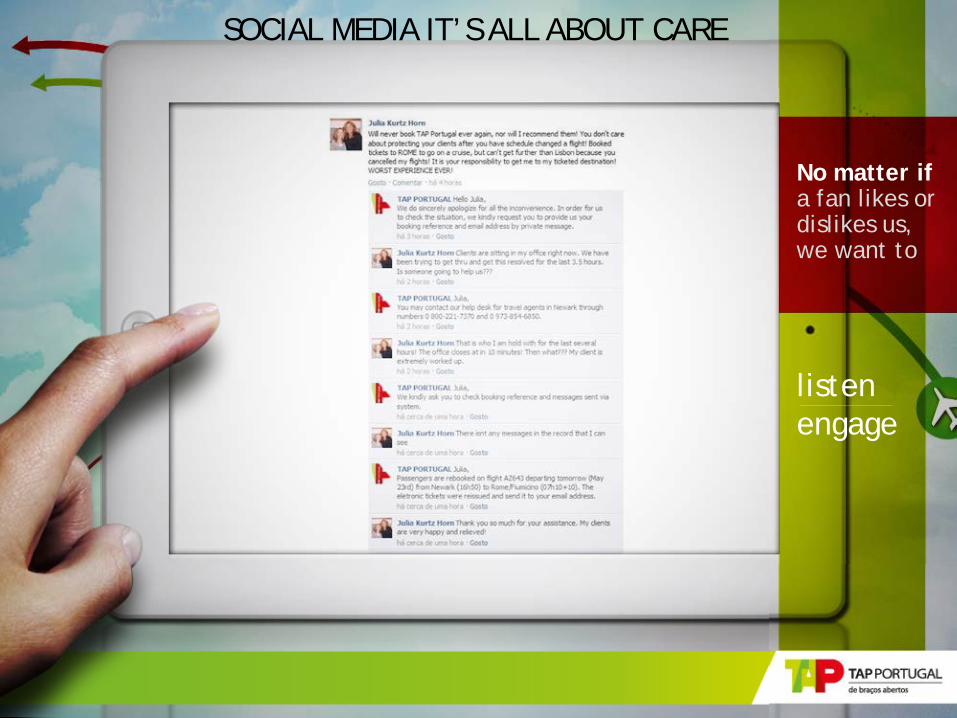
SOCIAL MEDIA IT’S ALL ABOUT CARE
Customer Service FACEBOOK TEAM CALL CENTRE
Corporate communications, Crisis management COMMUNICATION & PUBLIC RELATIONS
Dynamization (promotion and
competitions) MARKETING
listen engage
No matter if a fan likes or dislikes us, we want to
Gestão de crise e comunicação institucional COMUNICAÇÃO E RELAÇÕES PÚBLICAS
Serviço ao Cliente FACEBOOK TEAM CALL CENTRE
Dinamização (promoções e passatempos)
MARKETING
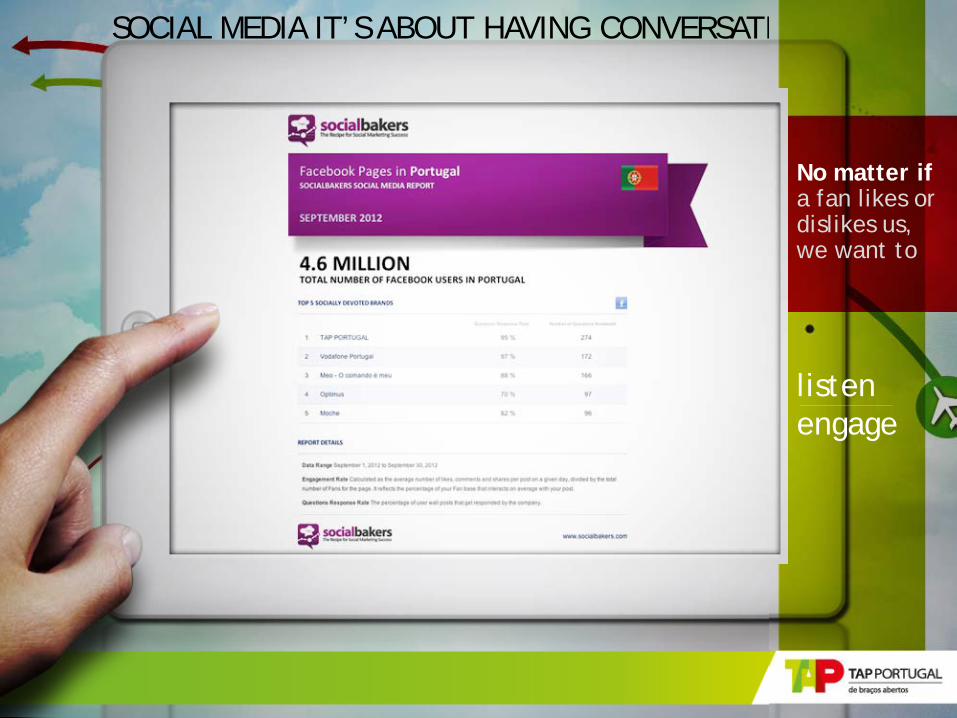
SOCIAL MEDIA IT’S ABOUT HAVING CONVERSATIONS
listen engage
No matter if a fan likes or dislikes us, we want to

MANAGING AN AIRLINE REPUTATION IN TROUBLED GLOBAL SKIES
André Serpa Soares TAP Portugal October 16, 2012 [email protected]
Recommended