DEER CENSUS AT HOMESTEAD NATIONAL MONUMENT OF AMERICA USING DRIVE METHOD
Prepared by:
Jesse Bolli
Natural Resources Manager
Homestead NM of America
Beatrice, Nebraska
March 2004
For:
Heartland Network and Prairie Cluster Prototype Long-term Ecological
Inventory and Monitoring Program
National Park Service
6424 W. Farm Rd. 182
Republic, MO 65738

ii
Table of Contents
List of Figures .......................................................................................................................................iii
List of Tables ........................................................................................................................................iii
List of Appendices ................................................................................................................................iii
Summary ............................................................................................................................................... iv
Acknowledgments .................................................................................................................................. v
Introduction ............................................................................................................................................ 1
Study Area ............................................................................................................................................. 2
Materials and Methods ........................................................................................................................... 3
Results .................................................................................................................................................... 4
Discussion .............................................................................................................................................. 5
Conclusion ............................................................................................................................................. 6
Literature Cited ...................................................................................................................................... 7
iii
List of Figures
Figure 1. Location of Homestead NM of America, Gage County, Nebraska. ....................................... 8
Figure 2. Stationary deer observation and driver points at Homestead NM of America. ...................... 9
Figure 3. Reaction of deer over time based on temperature at Homestead NM of America. .............. 10
Figure 4. Select pictures representing deer census methods at Homestead NM of America. .............. 11
List of Tables
Table 1. Number and descriptive statistics of deer observed during the first census. ......................... 11
Table 2. Number and descriptive statistics of deer observed during the second census. ..................... 13
Table 3. Number and descriptive statistics of deer observed during the third census. ........................ 14
Table 4. Number and descriptive statistics of deer observed during the fourth census. ...................... 15
Table 5. Overall numbers and descriptive statistics of deer observed during the censuss. .................. 16
List of Appendices
Appendix 1. Sample data sheet ............................................................................................................ 17

iv
Executive Summary
Natural resource managers, staff and volunteers at Homestead National Monument (NM) of
America, a 195 acres (.305 mile2) NPS unit in southeastern Nebraska conducted 11 deer censuses
between May 2003 and February 2004 to establish baseline deer population numbers. Average
number of deer observed across censuses was 19.6 individuals per census for a deer density of 76
individuals/mile2. Deer numbers ranged from 36 individuals/mile2 in the late summer to 140
individuals/mile2 in the late fall. Outcomes of the current and future censuses are an increased
understanding of deer numbers within the Monument and a great opportunity for volunteers to assist
in natural resource monitoring and management.

v
Acknowledgments
The author and Homestead National Monument of America would like to thank the Heartland
Network Inventory and Monitoring program for funding this project, Mike Williams and Dan Licht,
Meg Plona, and David Peitz for technical guidance and reviewing the report, and the Volunteer
Senior Ranger Corp for providing the people to carry out the census. Special thanks to Jerry Davison
for organizing the volunteers and being our official photographer.

1
Introduction
Homestead NM of America is a monument to the Homestead Act of 1862. In March 1936, Congress
established the Homestead National Monument of America under the stewardship act of the NPS to
“retain for posterity a proper memorial emblematical of the hardships and the pioneer life through
which the early settlers passed in the settlement, cultivation and civilization of the Great West.”
(United States Department of the Interior, National Park Service, Midwest Regional Office. 1999).
In 1998 Congress passed the National Parks Omnibus Management Act in response to concerns
about the condition of natural resources within the national parks. The act requires each park to
gather baseline inventory data on pertinent natural resources, data that will provide a pivotal step
toward establishing an effective monitoring program furthering the ability to effectively manage and
protect park resources. The National Park Service (NPS) responded with the Natural Resource
Challenge program, including the establishment of biome-based inventory and monitoring networks.
The Heartland Network, as part of the NPS Inventory and Monitoring (I&M) program, has
undertaken inventories of vascular plants and vertebrates within fifteen parks in eight Midwestern
states.
Prior to this census, the population status of the white-tailed deer was previously unknown at the
park. Numerous reports have been documented regarding white-tailed deer populations and
vehicle/deer incidents, chronic wasting disease, and vegetation overbrowsing. Adequate baseline
information regarding population status will enable managers to conduct appropriate methods of
control to ensure that deer numbers will have a minimal impact on park resources and the number of
deer-vehicle collisions. The surveys will also increase the data base when dealing with management
issues in the future.
Local citizens had expressed concern that the park had an overabundance of deer-an overabundance
that was blamed for numerous vehicle/deer collisions. In 2001, four incidents were reported, in 2002
four incidents were noted and in 2003 no vehicle/deer collisions were noted on the mile long stretch
of highway bordering the park (Law Enforcement Case Incident Reports, Park File). With highways
bordering the park on three sides, the concern over deer-vehicle collisions is ever present.
Chronic wasting disease in the near future may also be a major concern as it has already been
document in western Nebraska. If the deer at the park would happen to become infected with
chronic wasting disease, data about historic populations would be invaluable.
Additionally, research elsewhere has shown that high deer populations contribute to over-browsing
of vegetation, which can lead to plant mortality, decreased plant reproduction, and may tend to favor
less preferred species. This shift in species assemblages can reduce plant diversity on a local level
and cause changes in the functioning of the prairie community.
Stemming from the Natural Resource Challenge and a concern regarding the status of deer
populations at the park, a census was deemed necessary to determine population status. During 2003
and 2004, a deer census was conducted at the park to ) estimate number of white-tailed deer by
season, 2) estimate age class (adult or fawn) and sex structure, and 3) gather data pertaining to habitat
(weather, vegetation type, etc.)

2
Study Area
Homestead NM of America is located in southeastern Nebraska (Gage County) just west of the City
of Beatrice (Figure 1). The property consists of 78.9 ha (195 ac) including; 40.5 ha (100 ac) of
restored tallgrass prairie, 24.3 ha (60 ac) of hardwood forest, and 1.2 ha (3 ac) of administrative areas
(roads, structures, and trails). The park is dissected by Cub Creek throughout the west end of the
property.
The park commemorates the Homestead Act of 1862 and its effects upon the settlement of the West
as well as advancements in agricultural technology. Homestead's purpose is to interpret the history
of the country resulting in and from the Homestead Act. Included is the function of preserving
literature, agricultural implements, and a museum to interpret settlement, cultivation, and
development of the West. Homestead’s purpose is to commemorate the peoples whose lives were
altered by the Homestead Act.
The Monument is a "T" shape with a small parcel containing the original 160 acres homestead of
Daniel Freeman and the Freeman School site. An estimated 35,000-40,000 people visit Homestead
annually. Visitation is primarily during the summer months with dramatic increases during special
programs; 27% of the visitors are from the local community; 4% have international origins; 66% of
visitors identify the Monument as a day trip destination.
The park lies within the glaciated Drift Hill Region of Southeast Nebraska. Underlying formations,
bedded limestone and shale, indicate that this area was once at the bottom of the ocean. The gently
rolling topography of the Monument has an extreme relief of 21.3 m (70 ft). The average elevation
of this area is approximately 384.1 m (1,260 ft) above sea level with the highest point on the
Monument rising to 402.3 m (1,320 ft).
Today, the vegetation of the Monument is roughly two-thirds reconstructed prairie and one-third
woodland, the same general ratio of native prairie/woodland found by the original surveyors of the
area. The Freeman School grounds (approximately 2.5 acres total size) contain a 0.75-acre remnant
of untilled native prairie. The south and southeast upland slopes within the Monument contain the
best examples of tallgrass prairie.
Dominant grasses include big bluestem (Andropogon gerardii), little bluestem (Schizachyrium
scoparium), and Indiangrass (Sorghastum nutans). Common forbs include goldenrods (Solidago
spp.), sunflowers (Helianthus spp.), and leadplant (Amorpha canescens). The woodland and riparian
vegetation consists primarily of bur oak (Quercus macrocarpa), ash (Fraxinus pennsylvaniicus),
silver maple (Acer saccharinum), hackberry (Celtis occidentalis), boxelder (Acer negundo), red elm
(Ulmus rurbum), and cottonwood (Populus deltoides).
Environmental concerns at the Monument stem mainly from agricultural land use which surrounds
Homestead. Corn, wheat, and grain sorghum are the major crops. Nearby industrial development
including two anhydrous ammonia fertilizer plants which operate north of the Freeman school along
with state highway 4 which dissects the Monument are some of the other concerns. On the northeast,
a 27-home residential subdivision borders the Monument.

3
Materials and Methods
Deer were counted three times per season (with the exception of November when only 2 counts were
conducted) for a total 11 counts (late May, early September, mid to late November 2003, and late
February 2004). Deer census methods (counts) followed Wilson et al. (1996). At Homestead, deer
were driven to the western border of the park where stationary observers were located (Figure 2) to
count the deer as they left the Monument. The drivers are responsible for counting all the deer that
go back toward the east.
Approximately 17 drivers were spaced at 50 meter intervals along the eastern border (Figure 2).
Spacing varied depending on visibility (i.e. the amount of undergrowth that could conceal deer).
Eight observers were spaced around the boundary. Drivers “pushed” the deer from the east to the
west counting all deer that passed between them and the driver to their right.
Observers were hidden on the boundary (figure 2) to count and categorize (sex and age) deer as they
entered or exited the park. Deer that backtracked through the line of drivers were counted (each
driver recorded deer passing to their right). The original habitat that deer were driven from was also
noted. Observer and driver positions are marked with flagging which is placed in predetermined
positions which are located with a handheld GPS.
Total counts were calculated using the following formula:
Total count = (number of deer moving ahead plus number of deer escaping between
drivers) minus number of deer entering the census area.
While the census was in progress, traffic on State Highway 4 was regulated via signage placed just
outside of the park’s boundaries on State Highway 4 and County Road Southwest 89. Additional
traffic flow was monitored and regulated by park staff (with emergency vehicles).
After each count was completed, participants gathered for a debriefing to discuss the deer seen and
determine any errors in census omission/commission.

4
Results
Number of deer (buck, doe, or fawn) varied each day of each census period (Tables 1-5). The
average number of deer seen for the 11 counts is 19.6. The density equals 76 deer per square mile, or
1 deer per 8 acres. The sex ratio could only be figured for November because of the growth stage of
antlers resulting with a ratio of 1 buck for every 8 doe. The doe to fawn ratio was 5.9 doe to 1 fawn
for May, September and November. This ratio is much higher than would be expected for this area,
and is likely due to the fall counts not accurately differentiating between adult does, yearlings does,
and large fawns. February was excluded because the sex of all deer observed was unknown. Total
numbers of deer increased as the reproductive and winter season progressed (Figure 3).
The number of deer per square mile ranged from 36 in late summer to 140 in late fall. The density of
deer correlated with the amount of forage the surrounding area. The late summer count was when
the monument was surrounded by mature crops while during late fall and winter counts the
monument was surrounded by bare fields.
5
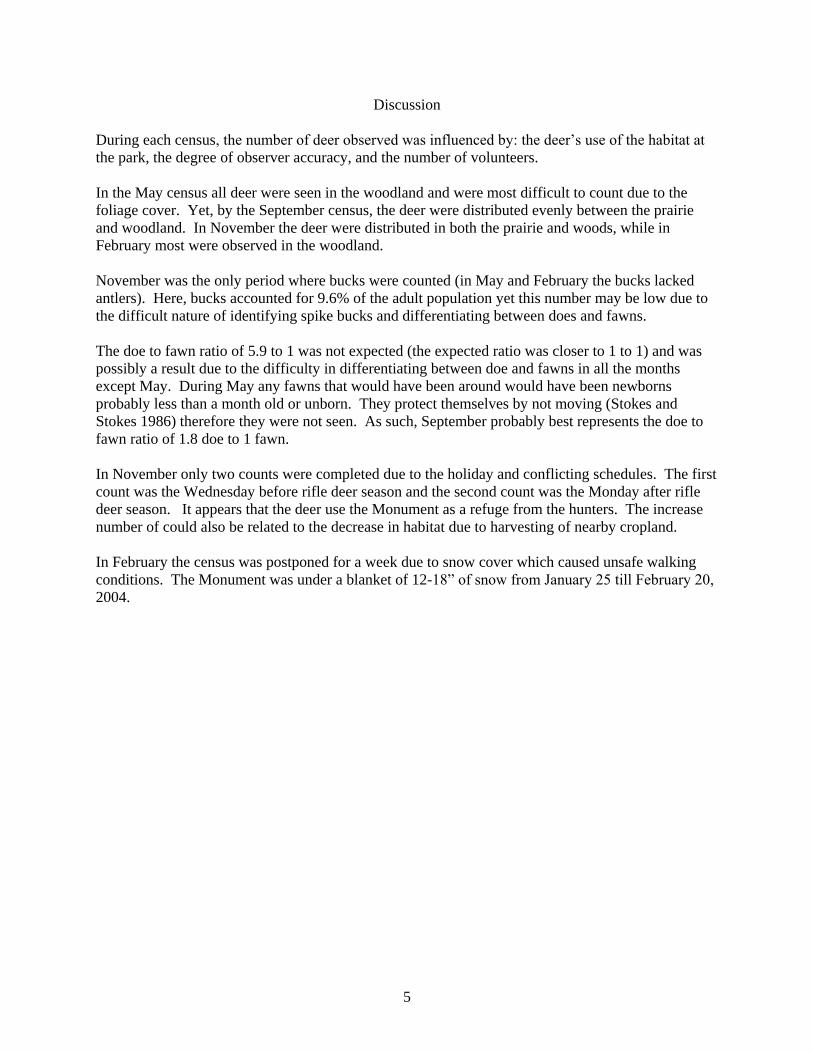
Discussion
During each census, the number of deer observed was influenced by: the deer’s use of the habitat at
the park, the degree of observer accuracy, and the number of volunteers.
In the May census all deer were seen in the woodland and were most difficult to count due to the
foliage cover. Yet, by the September census, the deer were distributed evenly between the prairie
and woodland. In November the deer were distributed in both the prairie and woods, while in
February most were observed in the woodland.
November was the only period where bucks were counted (in May and February the bucks lacked
antlers). Here, bucks accounted for 9.6% of the adult population yet this number may be low due to
the difficult nature of identifying spike bucks and differentiating between does and fawns.
The doe to fawn ratio of 5.9 to 1 was not expected (the expected ratio was closer to 1 to 1) and was
possibly a result due to the difficulty in differentiating between doe and fawns in all the months
except May. During May any fawns that would have been around would have been newborns
probably less than a month old or unborn. They protect themselves by not moving (Stokes and
Stokes 1986) therefore they were not seen. As such, September probably best represents the doe to
fawn ratio of 1.8 doe to 1 fawn.
In November only two counts were completed due to the holiday and conflicting schedules. The first
count was the Wednesday before rifle deer season and the second count was the Monday after rifle
deer season. It appears that the deer use the Monument as a refuge from the hunters. The increase
number of could also be related to the decrease in habitat due to harvesting of nearby cropland.
In February the census was postponed for a week due to snow cover which caused unsafe walking
conditions. The Monument was under a blanket of 12-18” of snow from January 25 till February 20,
2004.

6
Conclusion
Based on this census, the baseline data on deer population status and age/sex structure will better
enable land managers to conduct appropriate methods of control to ensure that deer numbers will
have a minimal impact on park resources and the number of deer-vehicle collisions. The deer
censuses will also allow the Monument to document numbers so future trends can be identified and if
needed corrective management actions taken.
The following management is recommended:
1) The deer density of 76 per square mile is more than likely higher than would have been
encountered before Euro American settlement. However due to the monuments small size and
the range of the white-tailed deer no control is recommended.
2) To determine if the deer are having a negative impact on the monuments vegetation more studies
are needed.
3) To reduce vehicle/deer collisions it is recommended that the ditches remain mowed at a
minimum of 12 feet from the road edge which will limit vegetation near the road.
4) Conduct future deer counts to better determine the number of deer that use the park on a regular
basis.
5) In the spring and summer months more volunteers are needed because of the increased
vegetation.

7
Literature Cited
Stokes, D. W. and L. Q. Stokes. 1986. Stokes nature guides: A guide to animal tracking and
behavior. Little, Brown and Company. Boston. 418pp.
United States Department of the Interior, National Park Service, Midwest Regional Office. 1999.
Final general management plan for Homestead National Monument of America. Midwest
Regional Office, Omaha, Nebraska. 70 pp.
Wilson, D.E., F.R. Cole, J. D. Nichols, R. Rudran, and M.S. Foster.1996. Measuring and
monitoring biological diversity: standard methods for mammals. Smithsonian Institution
Press, Washington. 409pp.

8
Figure 1. Location of Homestead NM of America, Gage County, Nebraska.

9
Figure 2. Stationary deer observation and driver points at Homestead NM of America.

10
0
20
40
60
80
100
1 3 5 7 9 11
Time
Tem
p
Deer
HighTemp
LowTemp
MornTemp
Figure 3. Reaction of deer over time based on temperature at Homestead NM of America.
11
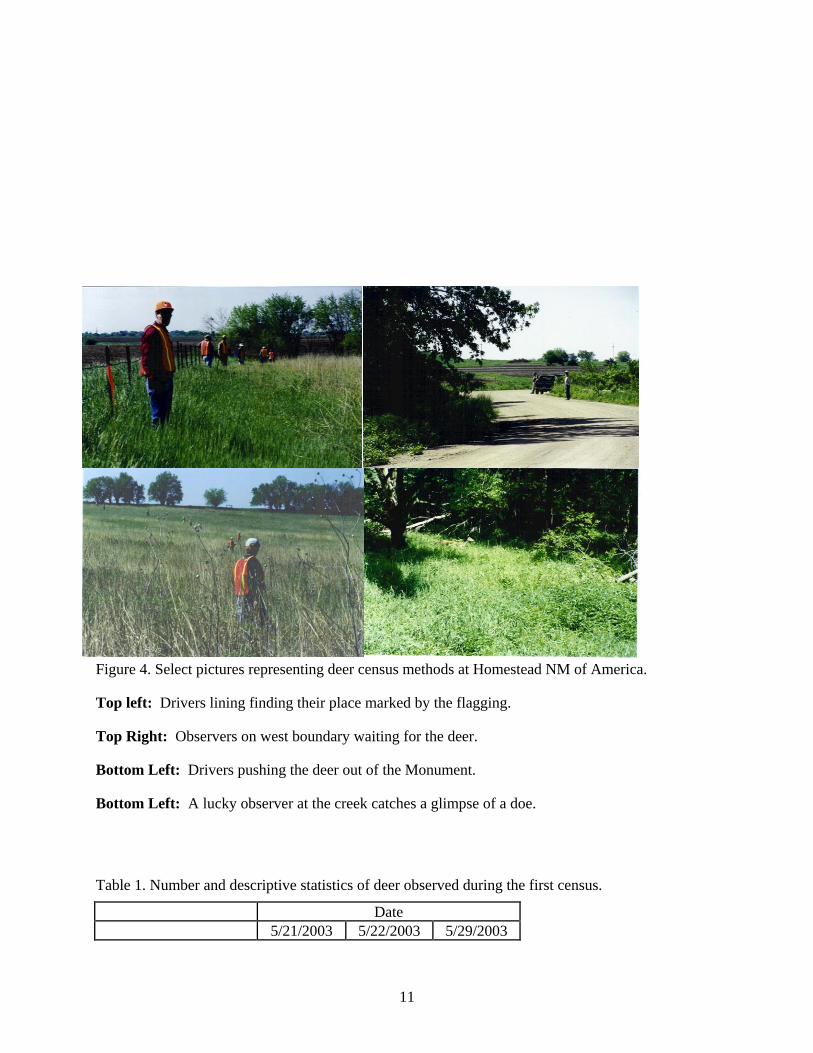
Figure 4. Select pictures representing deer census methods at Homestead NM of America.
Top left: Drivers lining finding their place marked by the flagging.
Top Right: Observers on west boundary waiting for the deer.
Bottom Left: Drivers pushing the deer out of the Monument.
Bottom Left: A lucky observer at the creek catches a glimpse of a doe.
Table 1. Number and descriptive statistics of deer observed during the first census.
Date
5/21/2003 5/22/2003 5/29/2003

12
# of Volunteers 20 16 18
Deer
Buck 0 0 2
Doe 11 9 5
Fawn 3 2 1
Unknown 2 0 0
Total 16 11 8
Census Statistics
Average # 11.7
SD 4.0
Range 8-16
Weather
High 70 75 87
Low 40 45 52
0830 Temp 49 56 62
Comments Clear Clear Hazy
13
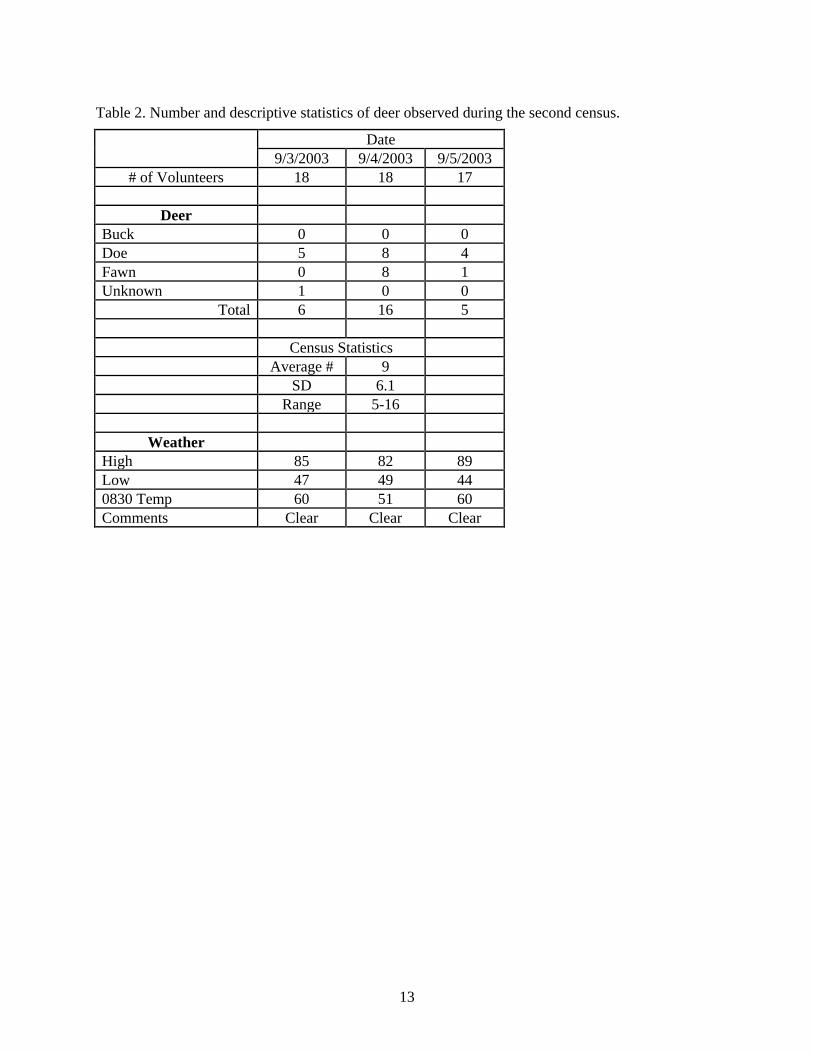
Table 2. Number and descriptive statistics of deer observed during the second census.
Date
9/3/2003 9/4/2003 9/5/2003
# of Volunteers 18 18 17
Deer
Buck 0 0 0
Doe 5 8 4
Fawn 0 8 1
Unknown 1 0 0
Total 6 16 5
Census Statistics
Average # 9
SD 6.1
Range 5-16
Weather
High 85 82 89
Low 47 49 44
0830 Temp 60 51 60
Comments Clear Clear Clear

14
Table 3. Number and descriptive statistics of deer observed during the third census.
Date
11/12/2003 11/24/2003
# of Volunteers 17 10
Deer
Buck 5 2
Doe 23 43
Fawn 1 1
Unknown 0 0
Total 29 46
Weather
High 44 28
Low 32 10
0830 Temp 40 14
Comments
Clear
Windy 20+ Frigid/Calm
Census Statistics
Average # 35
SD -
Range 29-41

15
Table 4. Number and descriptive statistics of deer observed during the fourth census.
Date
2/23/2004 2/25/2004 2/27/2004
# of Volunteers 19 16 14
Deer
Buck 0
Doe
Fawn
Unknown 54 12 18
Total 54 12 18
Weather
High 40 40 54
Low 25 29 20
0830 Temp 31 30 38
Comments - Gray/Calm Clear windy
Census Statistics
Average
# 28
SD 22.7
Range 12-54

16
Table 5. Overall numbers and descriptive statistics of deer observed during the censuses.
Date Total Deer
5/21/2003 16
5/22/2003 11
5/29/2003 8
9/3/2003 6
9/4/2003 16
9/5/2003 5
11/12/2003 29
11/24/2003 41
2/23/2004 54
2/25/2004 12
2/27/2004 18
Average 19.6
Average - max and min 17.4
Standard Deviation 15.56
Range 5-54
Mode 16
Average Density of
Deer/Acre 0.11875
Deer per acre 1 Deer per 8 acres
Average Density of Deer /
Mile2 76

17
#
#
## # #
#
#
#
d
d
d
d
d
d
d
d
d
d
d
d
d
d
d
d"!4
Pioneer Acres
dd
Cub Creek HOME Boundary
View1
Appendix 1. Sample data sheet
Homestead National Monument of America Deer Survey
Name:__________________ Date:_______________
Task: Driver or Observer (Circle one)
Location:_______________
Count Deer to your right (north)
Buck Exiting (B+)_______________Buck Entering (B-) ____________
Doe Exiting (D+)_______________Doe Entering (D-)_______________
Fawn Exiting (F+)_______________Fawn Entering (F-)_____________
Unknown Exiting (U+)__________Unknown Entering (U-)__________
Recommended