Macromol. Symp. 2009, 277, 69–80 DOI: 10.1002/masy.200950309 69
1 G
A
Co
E-2 La
M
Sc
D
Cop
Preparation and Characterization of Poly(Lactic Acid)-
g-Maleic Anhydrideþ Starch Blends
Victor H. Orozco,*1,2 Witold Brostow,2 Wunpen Chonkaew,2 Betty L. Lopez1
Summary: Poly(lactic acid) (PLA) and starch copolymers are obtained by reactive
blending - varying the starch compositions from 0 to 60%. PLA is functionalized with
maleic anhydride (MA), obtaining PLA-g-MA copolymers using dicumyl peroxide as an
initiator of grafting in order to improve the compatibility and interfacial adhesion
between the constituents. PLAþ starch blends without a compatibilizer do not have
sufficient interfacial adhesion. Decomposition temperature of PLA is not affected by
grafting. Glass transition temperatures and dynamic mechanical properties are
affected since MA has a plasticizing effect. Along with an increasing starch content
friction decreases while wear loss volume in pin-on-disk tribometry has a minimum
at nominal 15% wt. starch but increases at higher starch concentrations. The residual
depth in scratching and sliding wear testing has a maximum at 15% starch; there is a
minimum of storage modulus E0 determined in dynamic mechanical testing at the
same concentration. Microhardness results also reflect the plasticization by MA.
Keywords: blends; brittleness; dynamical mechanical analysis; grafting; polylactic acid;
starch; tribological properties
Introduction
Poly(lactic acid) (PLA) exhibits high bio-
degradability; however, it is expensive –
what limits its uses in disposable items. In
order to maintain the PLA biodegradability
and reduce the cost, some composites have
been made incorporating dry starch into
PLA matrix.[1–4] Due to the characteristics
of starch, it can be used as filler producing
an increase of the material rigidity and also
an increase in intrinsic brittleness of the
PLA, limiting the range of starch content.[5]
The brittleness can be reduced by weak-
ening the filler-filler interactions and at the
same time reducing the glass transition
temperature Tg. One uses for this purpose
rupo Ciencia de los Materiales, Universidad de
ntioquia, Calle 62 52 59 Medellın, Antioquia,
lombia
mail: [email protected]
boratory of Advanced Polymers & Optimized
aterials (LAPOM), Department of Materials
ience and Engineering, University of North Texas,
enton, TX 76203-5310, USA
yright � 2009 WILEY-VCH Verlag GmbH & Co. KGaA
plasticizers such as water,[6] polyethylene
glycol,[2] polypropylene glycol, ethyl and
propyl citrates, glycerol[7] and sorbitol
obtaining a thermoplastic starch (TPS) with
ductility higher that neat starch. We note a
discussion by Kopczynska and Ehren-
stein[8] how important are interactions at
interfaces for properties of multiphase
materials.
TPS offers better material processability
and better dispersion than neat PLA. The
main disadvantages of TPS are its moisture
sensitivity, limited temperature stability,
plasticizer loss and starch recrystallization
with time leading to embrittlement;[9,10]
consequently the plasticizers provide
desired results only at low concentrations.
For instance the elongation at break is 5%
higher for PLAþ starch blends when poly-
ols are used as plasticizers, this for any
starch source.[5]
As already stated, mechanical properties
such as tensile strength and elongation at
break of composites depend on interfacial
adhesion between the solid particulate
, Weinheim

Macromol. Symp. 2009, 277, 69–8070
(filler) and the polymer matrix.[8] Thus, if
matrixþ filler interactions are not favored
by thermodynamics, a chemical modifica-
tion of the starch surface is called for. One
way to compatibilize the starch is by
grafting polymeric chains on the starch
surface using a suitable catalyst,[11,12] which
makes it miscible with the PLA matrix.
Due to their high reactivity and avail-
ability, difunctional molecules such as
diisocyanates have been used as chemical
connectors between starch and polymeric
matrices in order to obtain a graft copoly-
mer that can serve as a compatibilizer.
Starch/graft/polycaprolactone (PCL) in
small amounts has been used to compati-
bilize starchþPLA blends. There was
improvement in the tensile strength; how-
ever, degradation products are harmful -
what limits the use of PCL in agriculture
and medicine. Anhydrides with unsatu-
rated bonds have also been used in polymer
compatibilization.[4,13] Composites contain-
ing 50% starch were also prepared, but only
10–20% of starch grafted to PLA[1] showed
a significant tensile strength improvement.
Although grafting improves properties
of starch-containing composites,[14] the
grafting process generally requires elabo-
rate experimental set-ups, expensive cata-
lysts, relatively long reaction times, works
in a limited temperature range[13] and needs
a large quantity of solvent. It is necessary to
purify the final products – a disadvantage
for industrial production. Hence a more
interesting compatibilization method con-
sists in modifying the polymer matrix by
grafting a polar group that can react with
the starch.[3] Maleic anhydride (MA) has
been grafted on polyolefin matrices;[15] the
procedure is not complicated, performed
using a free-radical initiator such as an
organic peroxide. Organic peroxides have
been used in a variety of applications[16–24]
and these procedures can be used on a large
scale.
In this work we have functionalized
polylactic acid (PLA) with maleic anhy-
dride (MA) (PLA-g-MA) using dicumyl
peroxide as an initiator of the grafting
process in order to improve compatibility
Copyright � 2009 WILEY-VCH Verlag GmbH & Co. KGaA
and interfacial adhesion between the PLA
and starch. Different amounts of starch
have been used in the reactive blending. A
variety of properties have been determined –
including tribological ones which are
important for the final application.[25]
Experimental Part
Materials
The PLA injection grade was supplied by
Jamplast Inc., Ellisville, USA; the dycumyl
peroxide, maleic anhydride and potato
starch were purchased from Sigma Aldrich;
chloroform and methanol were purchased
from Merck, reagent grade.
Blend Preparation
The blends were prepared in a Brabender
Type 6 mixer at 160 8C with the blade speed
of 80 rpm. First, the PLA was molten inside
the blender, second the dycumyl peroxide
initiator was added and reacted for 5 min-
utes, then the grafting reaction with the
maleic anhydride continued for another
5 minutes. At the end, the blending reaction
with starch lasted 5 minutes. The polymer
blends were chopped into small pieces and
were heated up to 150 8C and kept there for
30 minutes after which the samples were
compression moulded.
The MA compatibilized blends con-
tained in turn 15, 25, 35, 50 and 60 wt. %
starch. The following symbols are used in
obvious notation: 15S/85(PLA-g-MA), 25S/
75(PLA-g-MA), 35S/65(PLA-g-MA), 50S/
50(PLA-g-MA), 60S/40(PLA-g-MA); 35S/
65(PLA) represents a non-compatibilized
blend used as a reference sample.
PLA is a clear and semi-transparent
polymer. The blends are white even with a
minimum amount of starch. Their macro-
scopic appearance is homogenous, suggest-
ing that there is no phase separation.
Fourier Transform Infrared Analysis
A portion of blend was dissolved in 50 ml
CHCl3 under reflux and the solution was
filtered. The CHCl3 soluble fraction of the
filtrate was precipitated with methanol and
, Weinheim www.ms-journal.de
Macromol. Symp. 2009, 277, 69–80 71
the resulting product was extracted with
50 mL methanol in a Soxhlet for 24 hours,
after which the polymeric material was
dried at 60 8C. The FTIR spectra were
recorded with a Perkin-Elmer Spectrum
One spectrometer; powdered samples were
evaluated with KBr pellet technique in
transmission.
Scanning Electron Microscopy
A Scanning Electron Microscope (SEM)
JEOL JSM-5800 at 25 keV was used to
study the interfacial adhesion and the
dispersion of starch in the PLA matrix.
The specimens were broken in liquid
nitrogen and the fracture surface sputtered
with Au. The tracks generated by the pin-
on-disc test were also measured by SEM.
Thermogravimetric Analysis
Thermo gravimetric analysis (TGA) was
carried out with a TA Instruments Q500.
Each sample was run from 25 to 700 8C at
the heating rate of 10 8C/min under a
nitrogen atmosphere. Then the tempera-
ture was increased to 800 8C using the same
rate in air atmosphere. The TGA technique
has been well explained by Menard[26] and
also by Lucas and her colleagues.[27]
Modulated Differential Scanning
Calorimetry
Modulated differential scanning calorime-
try (MDSC), TA Instruments Q100 was
used to determine glass transitions Tg,
melting points Tm, crystallization tempera-
tures Tc and melting enthalpies. The
thermal history was erased during the first
run at a high heating rate up to 190 8Cfollowed by a fast cooling to �50 8C. Then
the heating rate was modulated �1 8C/min
minute with a ramp 2 8C/min to 200 8C.
DSC is also explained by Menard[26] and by
Lucas and her coworkers.[27]
Dynamical Mechanical Analysis (DMA)
The storage modulus E0, loss modulus E00
and mechanical damping tangent (tan d)
were measured using Perkin Elmer DMA-7
machine. Physical significance of these
parameters is explained by Menard[26,28]
Copyright � 2009 WILEY-VCH Verlag GmbH & Co. KGaA
and by Lucas and her colleagues.[27] Speci-
mens of rectangular shape (length: 1.8 cm,
width: 0.6 cm, thickness: 0.2 cm) were
analyzed in the 3-point bending mode at
1.0 Hz in dry nitrogen (20 mL/min) from 20 8Cto 120 8C using the heating rate of 5 8C/min.
Pin-on-disk Tribology
Pin-on-disc tests were made in an Implant
Science ISC-200PC tribometer at a con-
stant load against a stainless steel indenter
at 21 8C; the wear track radius R¼ 5.0 mm;
pin end spherical radius r¼ 0.3 mm, normal
load 2.0 N, linear speed 98 mm/s, and
distance 500 m.
ImageJ1 public domain software devel-
oped by Wayne Rasband was used to
measure the tracks width. Volume loss
was calculated as.[29]
V ¼ 2pR r2 sin �1 d
2r� d
4
� �ð4r2 � d2Þ1=2
� �
(1)
Here d is the wear track width (an
average of 20 determinations).
Scratch Testing
The tests were carried out using a CSEM
Micro-Scratch Tester (MST) using a pro-
cedure described before.[30–32] Sliding wear
was determined by performing 15 scratch
runs along the same groove[33,34] at the
constant normal load 5.0 N, scratch length
5.0 mm, scratch velocity 5.26 mm/min at
room temperature. Moreover, progressive
increasing load scratch tests were made
from the initial load of 0.03 up to 30.0 N; the
loading rate was 10.0 N/minute, the scratch
velocity 1.67 mm/minute and the scratch
length again 5.0 mm. A 200 mm diameter
conical diamond indenter was used in all
tests. The results include the instantaneous
penetration depth Rp and the healing or
residual depth Rh. The results reported are
averages from several locations on a given
sample. The viscoelastic recovery w was
calculated[30,31] as
f ¼ 1 � Rh=Rp (2)
, Weinheim www.ms-journal.de
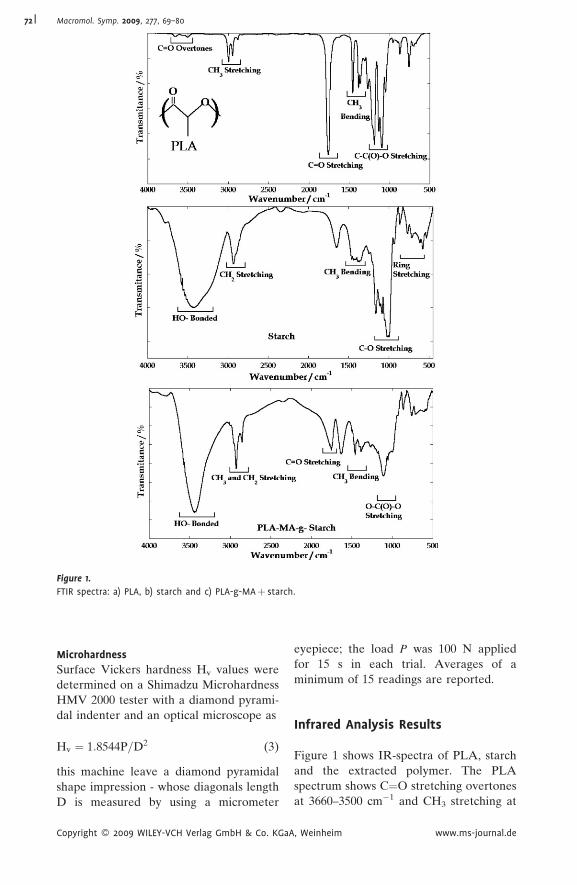
Figure 1.
FTIR spectra: a) PLA, b) starch and c) PLA-g-MAþ starch.
Macromol. Symp. 2009, 277, 69–8072
Microhardness
Surface Vickers hardness Hv values were
determined on a Shimadzu Microhardness
HMV 2000 tester with a diamond pyrami-
dal indenter and an optical microscope as
Hv ¼ 1:8544P=D2 (3)
this machine leave a diamond pyramidal
shape impression - whose diagonals length
D is measured by using a micrometer
Copyright � 2009 WILEY-VCH Verlag GmbH & Co. KGaA
eyepiece; the load P was 100 N applied
for 15 s in each trial. Averages of a
minimum of 15 readings are reported.
Infrared Analysis Results
Figure 1 shows IR-spectra of PLA, starch
and the extracted polymer. The PLA
spectrum shows C¼O stretching overtones
at 3660–3500 cm�1 and CH3 stretching at
, Weinheim www.ms-journal.de

Macromol. Symp. 2009, 277, 69–80 73
3000–2940 cm�1. The C¼O cm�1 stretching
at 1761 cm�1 and the O–C¼O stretching at
1190–1090 cm�1 are characteristics of ester
bonds. The starch spectrum shows distinc-
tive peaks and bands for carbohydrates: a
broad band in the range of 3760–3010 cm�1
indicates hydrogen bonded hydroxyl
groups, CH2 stretching at 2932 cm�1,
O–C stretching in the range of 1180–
960 cm�1, and anhydroglucose ring stretch-
ing vibrations in the range 861–575 cm�1.
Since maleic anhydride homopolymer and
unreacted starch were removed during
extraction of the blends, the spectrum of
extracted polymer corresponds only to the
starch/PLA-g-MA copolymer. This spec-
trum shows a combination of PLA and
starch peaks. Since the amount of maleic
anhydride (1% with respect to PLA)
present in the blends is small, the C¼O
stretching of maleic acid or anhydride peak
is very weak and might be overlapping with
the carbonyl band of PLA. Possibly the
extent of grafting is too low and IR
spectroscopy is not a technique sensitive
enough to identify these changes.
Morphological Analysis
SEM micrographs of 35S/65(PLA) and 35S/
65(PLA-g-MA) blends are shown in
Figure 2. Figure 2a for non-compatibilized
blend shows two phases, the PLA matrix
and starch grains. There are also holes and
cavities at the interface between both
phases. The holes are formed during the
fracture procedure in the sample prepara-
tion. The track smoothness indicates that
Figure 2.
SEM micrographs: a) PLAþ starch blends without malei
65(PLA-g-MA)).
Copyright � 2009 WILEY-VCH Verlag GmbH & Co. KGaA
starch grains are easily removed. The
cavities and holes prove very poor inter-
facial adhesion due to the hydrophobic
character of PLA while starch is highly
hydrophilic. This is the reason for thermo-
dynamic incompatibility that cannot be
overcome by simple blending.[3]
The compatibilized blend (Figure 2b)
shows a different morphology. Now starch
grains are still covered by strongly adhesive
PLA. The fracture surface exhibits high
roughness while the cracks go randomly
through the matrix avoiding starch grains.
The interphase between the PLA and
starch is stable and does not show stress
fracture.
Figure 3 shows compatibilized blends
with the lowest 15S/85(PLA-g-MA) –
Figure 3a – and the highest 60S/40(PLA-
g-MA) starch content– Figure 3b –, respec-
tively. Figure 3a shows still two phases but
does not show cavities, only occasionally a
crevice around a starch granule. Holes
where starch particles were removed such
as in Figure 2a are not observed. Instead,
the starch phase is broken along with the
matrix-starch interphase. There is a com-
patibilization. Even in blends with the
highest starch content the starch grains
are completely covered by PLA.
All compatibilized blends show better
interaction between PLA and starch. Che-
mical interactions might result from a
transesterification reaction among starch
hydroxyl groups, grafted acid hydroxyl
groups or anhydride groups on PLA.
Physical interaction is possible through
hydrogen bonds.
c anhydride (35S/65(PLA)); b) PLA-g-MAþ Starch (35S/
, Weinheim www.ms-journal.de

Figure 3.
SEM micrographs PLA-g-MAþ starch blends: a) 15S/85(PLA-g-MA), b) 60S/40(PLA-g-MA).
Macromol. Symp. 2009, 277, 69–8074
The blending conditions allow homo-
polymerization of maleic anhydride via a
side reaction producing low-molecular
weight polymers that can act as plasticizers
and decrease the interfacial energy bet-
ween the two phases and improve the
wetting of the starch with molten matrix
material. Given these results, we expect
better properties in compatibilized blends.
Thermogravimetric Analysis
Table 1 summarizes the results for all
blends; Figure 4 presents a typical TGA
diagram. Three weight-loss processes can
be observed: the first is due to loss of water
and is about the same for all blends; then
decomposition of starch, finally thermal
decomposition of PLA. For all samples
during pyrolysis in an inert gas atmosphere
char formation is observed. Changing to an
oxygen atmosphere and increasing the
temperature up to 800 8C results in a
complete oxidization of the residue
with CO2 as the final product.
We see that Table 1 shows that the
maximum temperature for starch and PLA
Table 1.Thermal Transitions of PLAþ starch blends.
Sample Td1/8C Td2/8C
Starch 312 –PLA-g-MA – 36915S/85(PLA-g-MA) 307 36725S/75(PLA-g-MA) 323 37035S/75(PLA-g-MA) 308 36950S/50(PLA-g-MA) 309 36960S/40(PLA-g-MA) 312 36835S/65PLA 316 371
Copyright � 2009 WILEY-VCH Verlag GmbH & Co. KGaA
decomposition in all blends (compatibilized
or otherwise) does not change significantly.
Thus, the blend thermal stability is little
affected by PLA modification and reactive
blending.
The char formation increases along with
the starch content increase. Thus, surface
interactions between starch and the matrix
protect the blend to some extend from
thermal degradation below 700 8C.
Modulated Differential ScanningCalorimetry Results
Physical significance of glass transitions has
been discussed before.[26–28,35,36] All blends
show the same thermal transitions. Figure 5
shows a typical reversible and non-rever-
sible calorimetric process of the MDSC run
for the sample 35S/65(PLA-g-MA). Four
reversible thermal events are observed: the
glass transition Tg of the PLA matrix, a
broad and weak exothermic peak as a
crystal phase transition of the PLA and two
endothermic peaks for melting of two
distinct PLA crystalline phases. Irreversible
thermal events also present four transitions:
PLA/% starch/% char/%
0 96.0 4.0100.0 0 086.7 11.5 1.977.9 19.1 3.068.8 26.3 4.936.7 56.2 6.148.8 43.6 7.768.7 26.7 4.6
, Weinheim www.ms-journal.de

Figure 4.
A typical TGA diagram; the sample is 60S/40(PLA-g-MA).
Figure 5.
A typical MDSC run for a PLAþ starch sample: 35S/65(PLA-g-MA).
Table 2.Thermal Transitions of PLAþ starch blends.
Sample Tg/8C Tc/8C) Hm/(J/g)� Tm/8C)
PLA 58 108 1.71 147–153PLA-g-MA 57 107 1.66 146–15315S/85(PLA-g-MA) 56 101 13.02 14425S/75(PLA-g-MA) 58 109 5.49 146–15435S/65(PLA-g-MA) 58 104 3.62 14550S/50(PLA-g-MA) 58 107 1.12 14660S/40(PLA-g-MA) 58 100 1.10 145–15435S/65PLA 58 110 0.90 148–1523
�Relative to PLA content.
Macromol. Symp. 2009, 277, 69–80 75
an endothermic peak associated with stress
relaxation because the macromolecules are
frozen in the glassy state in a non-favour-
able conformation; a sharp exothermic
peak above Tg which is attributed to cold
crystallization of PLA; finally, in two
endothermic peaks due to transesterifica-
tion reaction.[37]
Table 2 summarizes the MDSC thermal
transition for all blends. Figure 6 shows
both Tg and enthalpy of melting Hm as a
function of the starch content. For blends
with starch content greater than 15%, Tg
increases and then nearly reaches a steady
value at 58 8C. The increase can be
explained by starch hindering movements
of PLA chains.
The sample 15S/85(PLA-g-MA) shows
the lowest Tg and the highest Hm. Appar-
Copyright � 2009 WILEY-VCH Verlag GmbH & Co. KGaA
ently the low starch content increases the
probability of homopolymerization of MA -
leading to a low molar mass plasticizer that
lowers Tg and facilitates crystallization of
PLA; see Jacobsen and Fritz.[2] However,
the degree of crystallinity is unaffected
since Hm remains constant.
, Weinheim www.ms-journal.de

Figure 6.
Glass transition temperatures and enthalpies of melting vs. starch content.
Macromol. Symp. 2009, 277, 69–8076
Dynamic Mechanical AnalysisResults
Figure 7 presents a DMA thermogram for
35S/65(PLA-g-MA). Figure 7a shows sto-
rage modulus E0 and loss modulus E00 vs.
temperature diagrams. Two transitions are
observed. The first one at �60 8C is the glass
transition of PLA matrix. The second one
at �110 8C reflects cold crystallization of
the PLA.
Figure 7.
a) DMA thermogram for 35S/65(PLA-g-MA) with storage a
vs. starch content at 30 8C
Copyright � 2009 WILEY-VCH Verlag GmbH & Co. KGaA
Table 3 summarizes Tg results obtained
from peaks of E00(T). The values are similar
to those obtained by MDSC. The fact that
different techniques do not provide
identical Tg values has been discussed
before.[26–28,35,36]
Figure 7b shows the storage modulus E0
vs. starch content. As in MDSC results, the
storage modulus increases with starch
content because the stiffness of the blends
increases.[5] The lowest value of E0 is found
nd loss modulus vs. temperature; b) storage modulus
, Weinheim www.ms-journal.de

Table 3.Thermal Transitions of PLAþ starch composites fromE00 peaks of DMA.
Sample Tg/8C
PLA 62PLA-g-MA 5915S/85(PLA-g-MA) 6125S/75(PLA-g-MA) 6135S/75(PLA-g-MA) 6250S/50(PLA-g-MA) 6360S/40(PLA-g-MA) 6135S/65PLA 65
Macromol. Symp. 2009, 277, 69–80 77
for 15S/85(PLA-g-MA); this is again the
plasticizer effect already discussed in Sec-
tion 6 above.
Tribology Results
Service performance of polymeric compo-
nents depends naturally on their tribologi-
cal properties – as reviewed in.[31] We begin
with results of wear and dynamic friction
obtained using a pin-on-disk tribometer.
Figure 8 shows friction variations vs.
starch content. A decrease of the dynamic
friction is seen as the starch content
increases - indicating self-lubricating by
starch. Starch particles have a uniform
Figure 8.
Friction variations vs. starch content of the blends.
Copyright � 2009 WILEY-VCH Verlag GmbH & Co. KGaA
size - seen above in SEM micrographs
(Figure 3b). Since there are no friction
studies on starch that we know of, it would
be interesting in the future to study starch
containing blends with different matrices.
Figure 9 presents 50S/50(PLA-g-MA)
micrographs: (a) the wear track and (b) a
zoom of the wear track. We see a good
dispersion of starch particles in the track.
The particles peel off the PLA surface –
confirming our explanation above that they
diminish the friction.
Figure 10 presents the wear volume
calculated from[29] Eq. (1) and wear factor
vs. starch content. Wear factor is the
volume loss per distance at a given load
(mm3/Nm). Although the friction decreases
with starch content, the volume loss
increases. The maximum volume loss value
is for the sample with 60% starch content.
15S/85(PLA-g-MA) exhibits the lowest
volume loss because the plasticization
effect of the maleic anhydride homopoly-
mer.
We now discuss results of sliding wear
determination by multiple scratch
tests along the same groove.[2,33,38–40]
Figure 11a presents results for a blend with
25% of starch content. Samples with starch
, Weinheim www.ms-journal.de

Figure 9.
50S/50(PLA-g-MA) micrographs: (a) the wear track and (b) a zoom of the wear track.
Figure 10.
Wear volume and wear factor variation vs. starch content of the blends at 22 8C.
Figure 11.
Blends scratching behaviour: a) starch content 25 wt. %; b) starch content 60%.
Macromol. Symp. 2009, 277, 69–8078
concentration between 25 and 60% have
the same trend but are not included for
brevity. Figure 11b for the blend with
highest starch content, 60S/40(PLA-g-
Copyright � 2009 WILEY-VCH Verlag GmbH & Co. KGaA
MA), shows relatively small Rh variations
until seventh scratch and larger changes
afterwards. We recall that for polystyrene
there is no strain hardening[39,40] – a fact
, Weinheim www.ms-journal.de

Figure 12.
a) tan d vs. starch content; b) healing depth Rh and the viscoelastic recovery w vs. starch content.
Figure 13.
Microhardness for PLAþ starch samples vs. compo-
sition.
Macromol. Symp. 2009, 277, 69–80 79
which contributed to formulating a defini-
tion of brittleness.[34] In the materials now
investigated we do not see strain hardening
either.
Figure 12a shows healing depths Rp and
the viscoelastic recovery w calculated from
Eq. (2) obtained after 15 scratches vs. starch
content in the blends. We see two maxima,
namely at 15S/85(PLA-g-MA) and 50S/
50(PLA-g-MA) for both Rp and w. Thus,
these samples have lower scratch resistance
than the other ones but high viscoelastic
recovery.
We have demonstrated[41] the existence
of a relationship between the penetration
depth Rp and tan d, thus between a
tribological and a dynamic mechanical
property. Since tan d¼E00/E0, low tan d
values reflect solid-like behaviour while
high tan d indicates liquid-like beha-
viour.[41] Figure 12b shows tan d vs. starch
content. Going from the left that is from the
polymer without starch, we see first an
increase of tan d. This is the plasticizing
effect of MA already pointed out before.
The consecutive minima and maxima in
Figure 12b are also reflective of maxima
and minima in Figure 12a. Because of
plasticization, 15S/85(PLA-g-MA) has the
deepest Rp but the highest healing
depth Rh; a softer material can be pene-
trated more but also recovers more. The
softness is also the reason why the volume
loss in Figure 10 is the lowest.
Copyright � 2009 WILEY-VCH Verlag GmbH & Co. KGaA
Microhardness
A softer material is expected to have a
deeper scratch groove. Nanoindentation
studies show that inside of a scratch groove
the nanoindentation is shallower than out-
side, an effect of densification.[42] The total
cross-section area of the scratch groove has
been related to the Vickers hardness.[43]
For these reasons we have now performed
microhardness determinations. The results
are shown in Figure 13 as a function of the
starch content.
, Weinheim www.ms-journal.de

Macromol. Symp. 2009, 277, 69–8080
Let us compare the present results with
those above, in Figure 10 and 11 in
particular. Figure 13 confirms our earlier
explanation in terms of plasticizing effect,
resulting in softness, deeper grooves in
scratching, more viscoelastic recovery and
higher tan d.
Acknowledgements: Partial financial support forthis work was provided by the Robert A. WelchFoundation, Houston (Grant # B-1203) and alsoby the Hispanic and Global Studies InitiativesFund (HGSIF) of the University of North Texas.We are also grateful to COLCIENCIAS and theUniversidad de Antioquia, Colombia, forthe financial support. The authors thank to theColciencias Program ‘‘Apoyo a la comunidad
cientıfica nacional a traves de doctorados nacio-
nales 2005’’.
[1] L. Chen, X. Qiu, Z. Xie, Z. Hong, J. Sun, X. Chen, X.
Jing, Carbohydr. Polym. 2006, 65, 75.
[2] S. Jacobsen, H. G. Fritz, Polym. Eng. Sci. 1996, 36,
2799.
[3] S. Kalambur, S. S. H. Rizvi, J. Plast. Film Sheeting.
200622, 39.
[4] J. F. Zhang, X. Sun, Biomacromolecules. 2004, 5,
1446.
[5] T. Ke, S. X. Sun, P. Seib, J. Appl. Polym. Sci. 2003, 89,
3639.
[6] T. Ke, X. Sun, J. Appl. Polym. Sci. 2001, 81, 3069.
[7] M. A. Huneault, H. Li, Polymer. 2007, 48, 270.
[8] A. Kopczynska, G. W. Ehrenstein, J. Mater. Ed. 2007,
29, 325.
[9] O. Martin, L. Averous, Polymer. 2001, 42, 6209.
[10] N. Wang, J. Yu, P. R. Chang, X. Ma, Carbohydr.
Polym. 2008, 71, 109.
[11] R. Mani, J. Tang, M. Bhattacharya, Macromol. Rapid
Commun. 1998, 19, 283.
[12] D. Rutot-Houze, P. Degee, R. Gouttebaron, M.
Hecq, R. Narayan, P. Dubois, Polymer Internat.
2004, 53, 656.
[13] V. D. Miladinov, M. A. Hanna, Ind. Crops Prod.
2000, 11, 51.
[14] F. Xie, L. Yu, H. Liu, L. Chen, Starch - Starke. 2006,
58, 131.
[15] F. J. Rodriguez-Gonzalez, B. A. Ramsay, B. D. Favis,
Polymer. 2003, 44, 1517.
[16] L. Bazyliak, M. Bratychak, W. Brostow, Mater. Res.
Innovat. 1999, 3, 132.
[17] L. Bazyliak, M. Bratychak, W. Brostow, Mater. Res.
Innovat. 2000, 3, 218.
[18] M. Bratychak, L. Bazyliak, W. Brostow, O. Hevus, R.
Fleiczuk, Dopovidy Nacion. Akad. Nauk Ukrany 2000,
59, 185.
Copyright � 2009 WILEY-VCH Verlag GmbH & Co. KGaA
[19] M. Bratychak, M. Bratychak, W. Brostow, O.
Shyshchak, Mater. Res. Innovat. 2002, 6, 24.
[20] M. Bratychak, W. Brostow, Polym. Eng. Sci. 1999,
39, 1541.
[21] M. Bratychak, W. Brostow, V. Castano, V. Donchak,
H. Gargai, Mater. Res. Innovat. 2002, 6, 153.
[22] M. Bratychak, W. Brostow, V. Donchak, Mater.
Res. Innovat. 2002, 5, 250.
[23] M. Bratychak, W. Brostow, O. Grynyshyn, O.
Shyshchak, Mater. Res. Innovat. 2003, 7, 167.
[24] O. Zaichenko, M. Bratychak, W. Brostow, N.
Mitina, O. Bednarska, Rep. Natl. Acad. Sci. Ukraine
2003, 62, 134.
[25] S. Karan, S. P. S. Gupta, Mater. Sci. Eng., A. 2005,
398, 198.
[26] W. Brostow, Chapter 8 in: Performance of Plastics,
Hanser/Gardner Publications, Munich-Cincinnati
2000, p. 682.
[27] E. F. Lucas, B. G. Soares, E. Ed. C. Monteiro,
Caracterizacao de Polımeros, e-Papers, Rio de Janeiro,
2001, p. 366.
[28] K. P. Menard, ‘‘Dynamic mechanical analysis’’, CRC
Press, Boca Raton, FL 2008.
[29] M. D. Bermudez, F. J. Carrion-Vilches, G. Martınez-
Nicolas, J. Appl. Polym. Sci. 1999, 74, 831.
[30] W. Brostow, B. Bujard, P. Cassidy, H. Hagg, P.
Montemartini, Mater. Res. Innovat. 2002, 6, 7.
[31] W. Brostow, J.-L. Deborde, M. Jaklewicz, P.
Olszynski, J. Mater. Ed. 2003, 25, 119.
[32] W. Brostow, M. Jaklewicz, J. Mater. Res. 2004, 19,
1038.
[33] W. Brostow, G. Darmarla, J. Howe, D. Pietkiewicz,
e-Polymers. 2004, 025.
[34] W. Brostow, H. E. Hagg Lobland, M. Narkis,
J. Mater. Res. 2006, 21, 2422.
[35] W. Brostow, R. Chiu, I. M. Kalogeras, A. Vassilikou-
Dova, Mater. Lett. 2008, 62, 3152.
[36] W. Brostow, S. Deshpande, D. Pietkiewicz, S. R.
Wisner, preprint 2008, University of North Texas,
Denton.
[37] V. H. Orozco, A. F. Vargas, B. L. Lopez, Macromol.
Symp. 2007, 258, 45.
[38] M. D. Bermudez, W. Brostow, F. J. Carrion-Vilches,
J. J. Cervantes, G. Damarla, J. M. Perez, e-Polymers.
2005, 003.
[39] M. D. Bermudez, W. Brostow, F. J. Carrion-Vilches,
J. J. Cervantes, D. Pietkiewicz, Polymer. 2005, 46,
347.
[40] M. D. Bermudez, W. Brostow, F. J. Carrion-Vilches,
J. J. Cervantes, D. Pietkiewicz, e-Polymers 2005, 001.
[41] W. Brostow, W. Chonkaew, K. P. Menard, Mater.
Res. Innovat. 2006, 10, 389.
[42] B. D. Beake, G. A. Bell, W. Brostow, W. Chonkaew,
Polym. Int. 2007, 56, 773.
[43] W. Brostow, W. Chonkaew, L. Rapoport, Y. Soifer,
A. Verdyan, J. Mater. Res. 2007, 22, 2483.
, Weinheim www.ms-journal.de
Recommended